Employment and social development canada [ESDC]
Service Canada
Client Experience Survey 2017
POR # 092-16
CONTRACT AWARD DATE: 2017-01-06
CONTRACT #g9292-178217/001/cy
MARCH 30, 2018
Ce rapport est aussi disponible en français sur demande.
© 2018 Ipsos. All rights reserved. Contains Ipsos' Confidential and Proprietary information and may not be disclosed or reproduced without the prior written consent of Ipsos.
Political Neutrality Statement
I hereby certify as Senior Officer of Ipsos that the deliverables fully comply with the Government of Canada political neutrality requirements outlined in the Communications Policy of the Government of Canada and Procedures for Planning and Contracting Public Opinion Research. Specifically, the deliverables do not include information on electoral voting intentions, political party preferences, standings with the electorate or ratings of the performance of a political party or its leaders.

President
Ipsos Public Affairs
Additional information
Supplier Name: Ipsos Limited Partnership
PWGSC Contract Number: G9292-178217/001/CY
Contract Award Date: January 6, 2017
Contract value: $249,774.07 (including HST)
Department contact (e-mail): nc-por-rop-gd@hrsdc-rhdcc.gc.ca
Executive Summary
CX Survey- Service Canada Results At a Glance
A total of 4,001 interviews were conducted (approximately 600 per program).
The methodology used was by telephone survey.
The fieldwork was done between September 25 and December 10, 2017.
Overall Service Experience
Text description of graphs
Satisfaction by Program
Text description of graphs
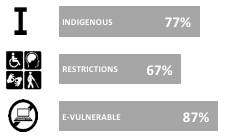
Areas for Attention: Groups
- Clients of CPP-D
- Clients with restrictions to accessing service
- Indigenous clients
Self-service and Assisted Service by Stage of Client Journey
Text description of graphs
Satisfaction Among Selected Vulnerable Groups
Text description of graphs
Areas for Attention: All Clients
Text description of graphs
Research Background and Objectives
As part of Service Canada’s Service Transformation Plan, the Citizen Service Branch (CSB) within Employment and Social Development Canada (ESDC) required data on its service experience from the client’s perspective to support effective management of its service delivery.
The 2017 Client Experience Survey establishes a baseline of service delivery performance for the purpose of tracking change in the end-to-end client experience over time. This approach examines the overall service design as experienced by clients to assess how well it works for them as they access programs through Service Canada’s service delivery system.
The Client Experience Measurement Project was conducted in two phases. The first phase involved conducting focus groups and interviews with clients regarding their client journeys, and the results were used to assess the comprehensiveness of the Client Experience Survey Measurement Model. The model was developed by Service Canada as a framework to gathering client experience data from Service Canada clients in a consistent way. A short summary of the results of the qualitative phase are found in Appendix A.
Specific research objectives for the second, quantitative phase include:
- Providing a baseline measurement of the multi-channel client experience;
- Providing broad diagnostic insights regarding the opportunities for improvement;
- Identifying challenges encountered by vulnerable groups in using the service delivery processes to access services; and
- Providing baseline results measures of the proportion of clients choosing self-service, low and high-touch assistance.
Methodology
- A telephone survey was conducted with a sample of 4,001 Service Canada clients across the six major programs, with around 600 respondents interviewed about their experience with each program. Programs covered included:
- Employment Insurance (EI)
- Canada Pension Plan (CPP)
- Canada Pension Plan Disability Benefit (CPP-D)
- Old Age Security (OAS)
- Guaranteed Income Supplement (GIS) and
- Social Insurance Number (SIN).
- Oversamples were conducted with two of the vulnerable client groups: those living in remote areas and official language minority community members (OLMC) . (See the Appendix B for the specifications of vulnerable client groups.) This was done to provide a minimum of 200 completed questionnaires with each group.
- The interviews were conducted from September 25 to December 10, 2017.
- The sample was randomly selected from among clients who had received a service outcome during April, May or June 2017. This period extended from January to July for some programs to ensure sufficient sample size.
- Data based on the total population has a margin of error of +/-2.5% at the 95% confidence interval, while data based on sub-groups have a larger margin of error. For example, the margin of error for data for each program is between +/-4% to +/-5%.
- The data have been weighted in proportion to age/gender/region proportions within each region, and by program volume.
Key Findings – Overall Performance
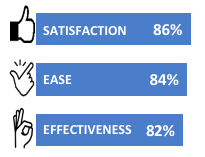
Overall satisfaction was high for most clients accessing a program delivered by Service Canada
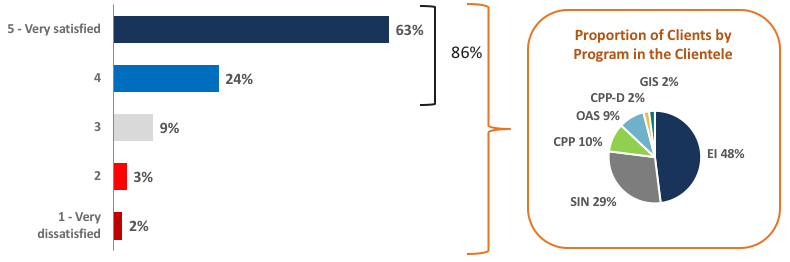
- Overall, more than eight in ten clients were satisfied with the service they received from Service Canada, of which more than six in ten provided a rating of five out of five.
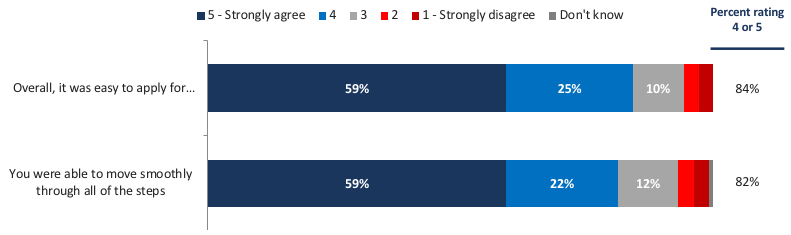
- Overall ease and smooth movement through the steps (effectiveness) were also high.
- These findings reflect the composition of Service Canada clients who had recently completed a client journey, as reflected in the program databases. Almost half of these clients were clients of the EI program. Almost one third had received a Social Insurance Number. The remainder were CPP, OAS, GIS and CPP-D clients.
Service Canada clients rate the service most highly on helpfulness of staff, confidence in security of information, and receiving service in official language of choice
- Clients consistently rated the service by staff very highly; 9 in 10 found staff helpful in both the in-person and phone channels.
- Other consistently high-performing measures across all programs were clients’ levels of confidence that their personal information was protected, and being provided service or documents in their choice of English or French in an office.
Service attributes with lower ratings were ease of following up and of resolving problems, and confidence in timely processing
- Four in five reported completing the client journey without an issue or problem. However, among though who did experience an issue or problem, there were low client ratings across all programs regarding easily resolving these problems.
- Confidence in timely processing and ease of follow-up were consistently lower rated attributes across programs.
Key Findings – Service Channel Performance
Satisfaction was high with all channels; the higher the touch, the higher the service channel rating
- Consistent with other government studies, satisfaction is highest for the in-person channel (89%). The specialized call centre satisfaction was slightly lower, while remaining high (82%). Satisfaction with the online channel is somewhat lower still (79%), which is not entirely surprising as it does not involve human contact (a “lower touch” channel).
- Most clients of the in-person channel found it was easy to get to, and that staff were helpful and answered the clients’ questions completely.
- Similarly, most clients of the specialized call centres also found that staff were helpful and answered the clients’ questions completely.
- Clients of the online channel reported that they got what they needed at the stage of informing themselves about the program, even though fewer could see how the information applied to their specific situation.
- Among the portion of the EI, CPP and OAS clients who reported using the My Service Canada Account, most got what they needed. While slightly fewer reported that it was easy to use, this was still four in five users.
Channel Service Standards
- Most clients found the current travel distance to be reasonable, reporting that they found a travel distance reasonable up to 24 km. The rating dropped substantially at more than 50 km.
- The vast majority of in-person clients reported receiving service and documents in the official language of their choice.
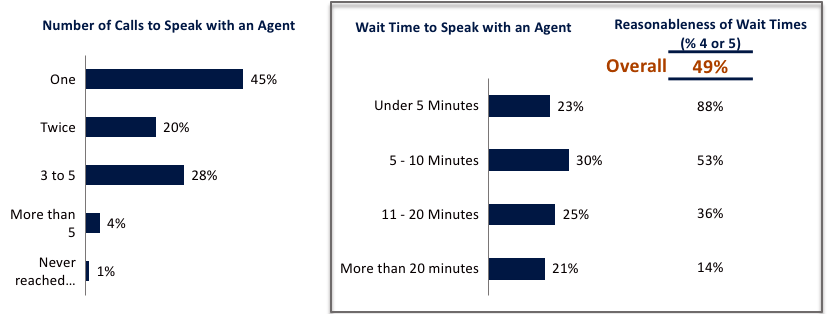
- Just under half of the callers to the specialized call centres found the current wait time to be reasonable; two thirds were able to get through after one or two attempts. Callers were more likely to find the wait time reasonable if it were under five minutes.
Key Findings: Programs
Some attributes were consistently high or low across all programs
- Across all programs, being provided service or documents in the official language of choice in an office, helpfulness of in-person staff, and confidence that personal information was protected were the highest rated areas. Problem/issue resolution among those who experienced a problem is the lowest rated area for each program. (Note that service delivery in language of choice was measured for the in-person channel only through this survey.)
Clients found the delivery of SIN to be easiest and most efficient
- Delivery of the Social Insurance Number is the service with the easiest and most efficient service experience. Clients found the process clear and could move through the steps effectively. However, about 15% did not find aspects of preparing to apply easy.
CPP and OAS perform particularly well on most attributes
- Among the pension programs delivered largely to seniors, the Canada Pension Plan - Retirement Benefits and Survivor Benefits (CPP), Old Age Security (OAS), and Guaranteed Income Supplement (GIS), the first two perform well on most attributes. Notably, the OAS clients who were auto-enrolled were more likely than those who submitted an application to be very satisfied.
- Among both CPP and OAS clients, the overall process was found to be easy. Lower scores related to finding and understanding information about the program.
GIS clients needs were met slightly less often than other pension programs for seniors
- The delivery of GIS meets clients’ needs at a slightly lower rate that other pension delivery to seniors. While over 4 in 5 found the overall process easy and could get help when they needed it, clients were less likely to say it was easy to find and understand information on the program, and to be confident they had what they needed to complete the application.
EI meets the needs of most clients, but at a slightly lower rate than higher-performing programs
- Similar to GIS, most Employment Insurance (EI) clients rate the service attributes highly, but at a slightly lower rate than SIN, CPP and OAS. Over 1 in 5 found the overall process of applying for the program to be easy, however only 66% were confident that their application would be processed in a reasonable amount of time.
CPP-D clients encounter the most difficulty across the service experience
- Clients of Canada Pension Plan - Disability Benefit (CPP-D) rated the service delivery process poorly across most service dimensions. Although the rate at which applicants are granted benefits is much lower for CPP-D than for other programs, and this may have some impact on clients’ assessment of the service delivery, much appears to be associated with the service delivery itself rather than the service outcome.
- For example, many clients who have not been granted a benefit do rate the service delivery highly, while aspects of the service delivery, such as encountering a problem, are related to satisfaction.
- Further, there is variation in the scoring of service attributes showing that respondents are assessing the service attributes specifically. Some attributes are rated highly by CPP-D clients, including confidence in the protection of personal information.
- The attributes that have the lowest ratings are related to ease of understanding, ease of putting together information required for the application, and problem resolution.
Key Findings: Vulnerable Client Groups
Most of the vulnerable client groups that Service Canada serves rate the service experience highly
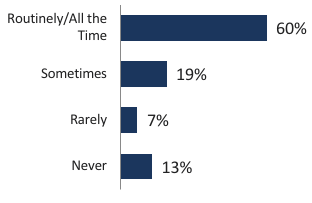
- Most clients in vulnerable groups appear to be well-served through the current service design. This includes clients with lower education and clients who are e-vulnerable (rarely or never use online services).
- Remote clients do not appear to have a lower satisfaction rate, keeping in mind the smaller sample size (n=204) for this group, which increases the margin of error.
Indigenous clients and those with restrictions affecting access have a poorer service experience
- The two client groups who do experience lower satisfaction scores and rate some service attributes less highly are:
- Indigenous clients
- appear to be less likely to find it easy to quickly gather and to understand information about the program/application
- Clients who feel they have restrictions that make it more difficult to access service
- appear to be less likely to find the service experience easy, timely or effective
Generally, vulnerable groups are more likely to use the in-person channel
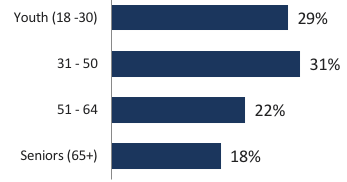
- The vulnerable groups who are more likely to use the in-person channel to apply for programs are official language minority community members, clients with high school education or less, the e-vulnerable, youth and Indigenous clients.
- Seniors (aged 60 and over) use the in-person channel at about the same rate as clients overall; just over half used the in-person channel to apply.
Key Findings: The Omni-Channel Experience Across The Client Journey
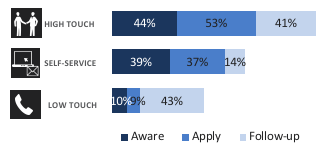
Self-service and Assisted Service
- Currently, 75% of Service Canada’s clients use assisted service* during the client journey when accessing the programs it delivers.
- With the existing service design, Service Canada provides service to the nearly two thirds of its clients through its in-person network of offices.
- At the same time, one-quarter of the clientele self-served* throughout the client experience without assistance. They did so through either or both the web and mail channels.
Satisfaction with the level of service declined with the number of times the client contacted Service Canada.
- Clients who contacted Service Canada only one or two times had the highest satisfaction, declining with the greater number of occasions they were in contact, particularly among those who had contact five or more times.
Over time, if the service design for various programs changes, the overall channel use pattern may also shift.
*Note:
Self-service: used web channel and/or mail only
Low-touch assisted service: used phone but not in-person
High-touch assisted service: used in-person
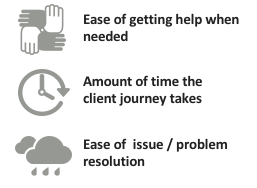
Key Findings: Potential For Change
The service attributes for which impact is highest and scores are lowest relative to other attributes for the overall clientele are:
- Ease of problem resolution
- Ease of getting assistance when needed
- The amount of time it takes to go through the client journey (up to initial decision)
- However, improvement in any one area alone may have a negligible impact on the overall satisfaction figure, as satisfaction is already high.
- The challenge will be to maintain the current high level of satisfaction, and to make improvements to the overall client journey experience for the smaller groups of clients who encounter more challenges across the client journey:
- Clients of CPP-D
- Clients who have restrictions that make it difficult to access service
- Indigenous clients
Background & Objectives
Research Background and Objectives
In line with the Treasury Board Policy on Service which outlines the key principles to achieve better and more efficient design and delivery of Government of Canada services, Service Canada’s Citizen Service Branch (CSB) within Employment and Social Development Canada (ESDC) required data on its service experience from the client’s perspective to assist in effectively managing service delivery.
As part of its activities to meet these requirements, CSB is conducting a baseline survey of the client experience delivered by Service Canada. The data collected through the 2017 survey and through subsequent annual waves, are intended to provide results measures in support of performance reporting and form a key Client Feedback activity under the Service Transformation Plan.
The survey assesses the extent to which the service design works for clients as they go through the process of accessing programs through Service Canada’s service delivery system.
The Client Experience Measurement Project was conducted in two phases. First, a qualitative phase was conducted to assess the comprehensiveness of the Client Experience Survey Measurement Model. A short summary of the results of the qualitative phase are found in Appendix A.
The research objectives for the second, quantitative phase were to:
- Provide a baseline measurement of the multi-channel client experience;
- Provide broad diagnostic insights regarding the opportunities for improvement;
- Identify challenges encountered by vulnerable groups in using the service delivery processes to access services; and
- Providing baseline results measures of the proportion of clients choosing self-service, low and high-touch assistance.
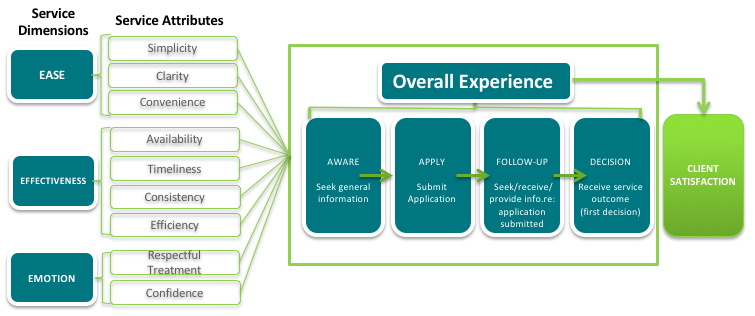
Service Canada CX Survey Model
Service Canada Client Experience (CX) Survey Measurement Model
- Service Canada developed the survey model below as a consistent framework for assessing the service experience of its clients.
- Ipsos conducted focus groups and interviews with clients to assess whether the model comprehensively reflected the aspects of service delivery that clients report are important to them (see Appendix A).
- The methodology and questionnaire for the Client Experience Survey implemented the model below, after an early version was piloted in 2016 with the Employment Insurance Program.
Text description of graphs
Note: The Model was drawn from a combination of existing models to suit Service Canada context, and validated through consultation with internal stakeholders. The existing models include: The Common Measurements Tool (CMT), owned and licensed by the Institute for Citizen-Centred Service (ICCS), the client survey model used by the Government of Quebec, and Forrester’s approach to client experience measurement.
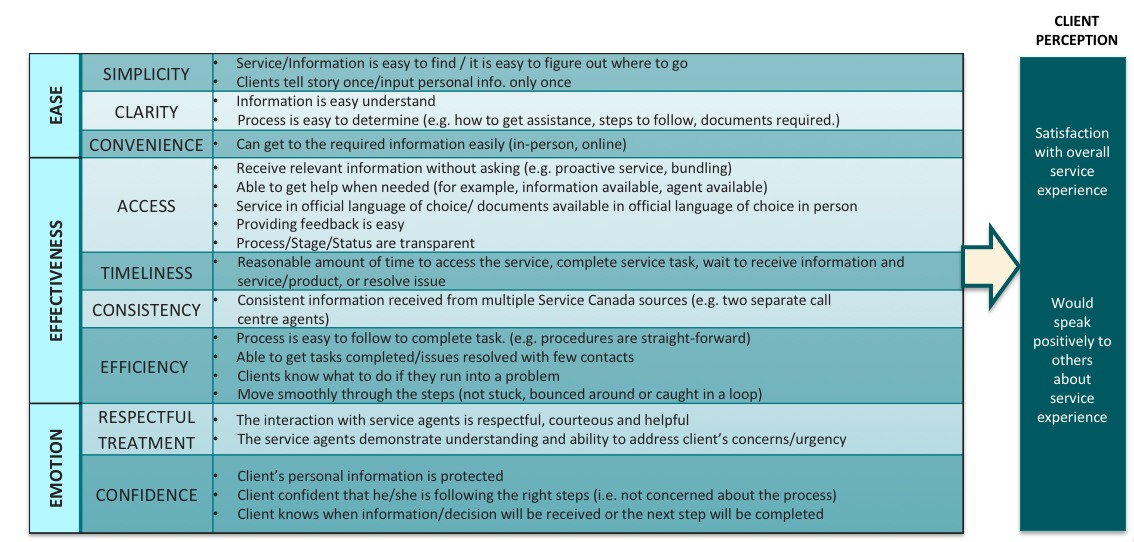
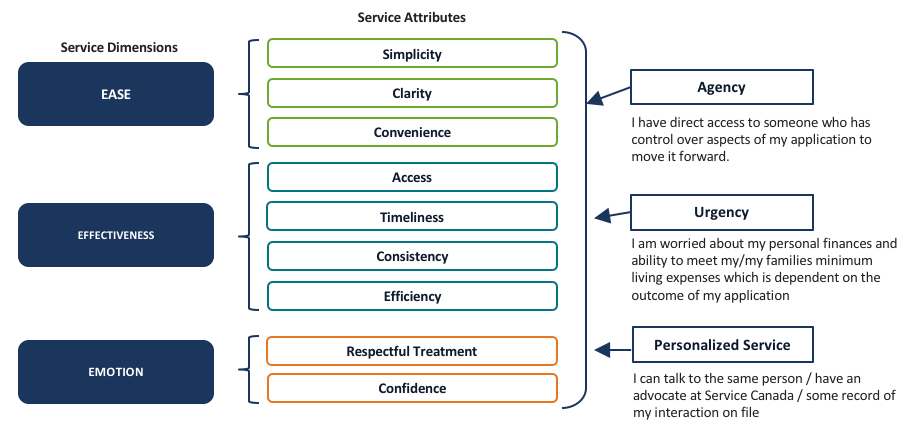
Service Canada CX Survey Measurement Model: Service Attributes
- Service dimensions and attributes were measured in the client experience survey, to the extent that the questionnaire length permitted.
Text description of graphs
Research Approach
Overview
- A telephone survey was conducted with a sample of 4,001 Service Canada clients across the six major programs, with around 600 respondents interviewed about their experience with each program. The interviews were conducted from September 25 to December 10, 2017.
- In order to examine the overall service experience, including how clients used the various channels to complete the steps of their client journeys, the clientele was defined as clients who had recently completed a client journey, up to initial decision.
- The sample of clients who had received a service outcome during April, May or June 2017 was randomly selected from program administrative databases . This period extended from January to July for some programs to ensure sufficient sample size.
- The sample was stratified by program. Weighting adjustments were made to bring the sample into proportion with the universe by age, gender and region within each program, and to bring the over-sampled groups back to their proportion among clients.
- Data based on the total population has a margin of error of +/-2.5% at the 95% confidence interval, while data based on sub-groups have a larger margin of error. For example, the margin of error for data for each program is between +/-4% to +/-5%.
- The data have been weighted in proportion to age/gender/region proportions within each region, and by program volume.
Data Collection
The questionnaire was developed based on the Service Canada Client Experience Measurement Model, with consideration given to maintaining measures from previous ESDC surveys for comparison purposes. The questionnaire was pretested on September 25, modified and re-tested on October 6, 2017. A further monitoring session was held on October 11. Additional modifications were made during the survey period in order to streamline the questionnaire.
Experienced, trained interviewers were specifically briefed on the requirements of this study. A minimum of 10% of each interviewers’ calls were monitored by a team leader.
Respondents were interviewed in their choice of English or French. For those who could not respond in either language, a proxy respondent (who had assisted them in contacting Service Canada) could respond on their behalf. In addition, interviews were conducted with respondents who could not speak either official language using an on-demand translation service.
Oversamples were conducted with two of the vulnerable client groups: those living in remote areas and OLMC. (See Appendix A for the definitions of vulnerable client groups.) This was done to provide a minimum of 200 completed interviews with each group.
Calibration of The Data
A multi-tiered approach has been used to weight the data from the sample for the Client Experience survey into proportion with the universe of ESDC clients. Steps in the weighting comprised:
- Adjust to the universe proportions of age/gender within region for each program.
- Weight over-sampled populations back into proportion to their presence in the universe.
- Weight the number respondents in each program in proportion to the total number of clients.
- Weight the number respondents by each region in proportion to the total number of clients.
- Adjust to the universe proportions of age/gender within region for each program.
OAS and GIS were only weighted by gender within region as the age distribution of program clients does not necessitate a more detailed weighting scheme.
As the number of CPP and CPP-D clients (and survey respondents) living in Quebec (CPP-RTR and CPP-D) are so few, these respondents have not been weighted by age/gender.
The universe proportions used to develop the targets are based on data extracts provided by the client.
Additional details on the methodology are provided in Appendix B. A description of the sampling strategy, weighting and limitations are provided under separate cover, together with the survey questionnaire and the focus group discussion guide.
Detailed Findings
Overall Performance
Summary: Overall Performance
Overall, Service Canada’s clientele was satisfied with the service experience
- In this baseline year, the large majority of Service Canada’s clientele was satisfied with the service experience. Further, most clients found the service experience to be easy and effective.
- The results of these summary measures reflect the composition of the clientele in May of 2017; a month that does not have atypical volumes among its major programs. Almost half the clientele consisted of EI clients, and almost a third were SIN clients. (Note that clients of Passport Services were assessed by a separate survey conducted by IRCC.)
Common areas for potential improvement for the clientele as a whole include ease of getting help and resolving issues, as well as timeliness of the client journey
- In order to summarize what potential changes could result in an increase in overall satisfaction, the service attributes that most strongly drive satisfaction for Service Canada clients were determined and compared to Service Canada’s performance against these attributes.
- The resulting analysis found that common areas for potential improvement include the ease of getting help when needed, the ease of resolving issues or problems, and the timeliness of the overall client journey.
The greatest impact of change would be experienced by the smaller groups of clients whose service experience is more challenging than that of the overall clientele.
- Further analysis by program, client group, and channel use in subsequent chapters reveals both substantial challenges for some clients, and challenges with the current service design. While individual attributes do not carry a substantial impact on satisfaction alone, improvements to many attributes for specific client groups may improve the service experience for them.
Satisfaction, Ease and Effectiveness
Satisfaction With The Overall Service Experience
- In this baseline year, the large majority of Service Canada’s clientele was satisfied with the service experience, with nearly two thirds very satisfied.
- This finding reflects the composition of the clientele, half of which were EI clients, and nearly a third of which were SIN clients.
Text description of graphs
Note: The clientele consisted of those who had recently experienced a client journey, calculated from volumes in the program administrative databases in May, 2017. Passport clients were surveyed separately by Immigration, Refugees and Citizenship Canada.
Overall service experience section: Q38a. How satisfied were you with the service you received from Service Canada related to your [insert abbrev] application? please use a 5-point scale, where 1 means very dissatisfied, and 5 means very satisfied.
Base: All respondents (n=4001). Totals may not add to 100 due to rounding.
Overall Ease and Effectiveness
Further, the large majority found the service experience to be easy and effective.
Text description of graphs
Overall service experience section: Q36b. Thinking about the service you received, how much do you agree or disagree with the following statements… Overall it was easy for you to apply for [insert abbrev]?
Base: All respondents excluding those who were automatically enrolled in OAS and SIN applicants (n=3043)
Q36b. Thinking about the service you received, how much do you agree or disagree with the following statements… You were able to move smoothly through all of the steps related to your [insert abbrev] claim/ application? Base: All respondents excluding those who were automatically enrolled in OAS (n=3639)
Priority Matrix
Drivers of Satisfaction
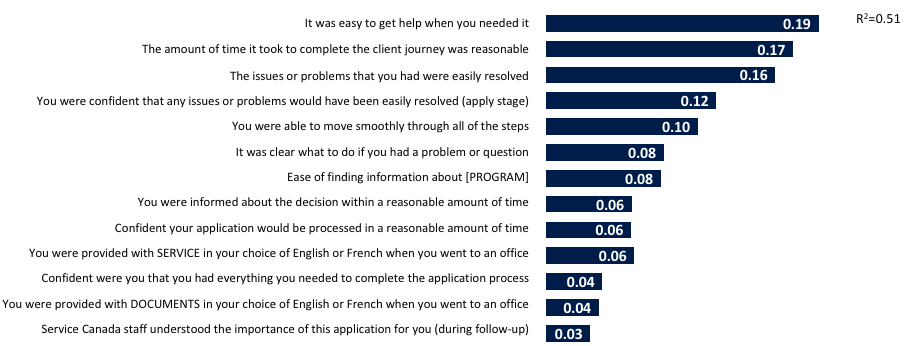
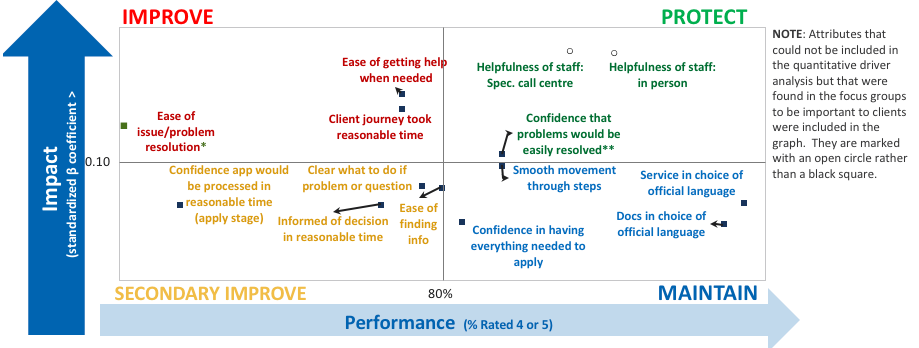
- The primary drivers of satisfaction* in Service Canada are: ease of getting help when needed, followed by the amount of time it took from start to finish, and ease of problem/issue resolution. Other prominent drivers include confidence that issues would be easily resolved and being able to smoothly move through all of the steps. (Note that attributes, such as helpfulness of staff, were not included in the quantitative driver analysis due to the split base used to accommodate assessments of each channel individually. See Appendix B).
Text description of graphs
*Numbers shown are standardized regression coefficients (Beta weights), which range from 0 to 1, reflecting the impact of attributes on variation in overall satisfaction.
Priority Matrix- Overview
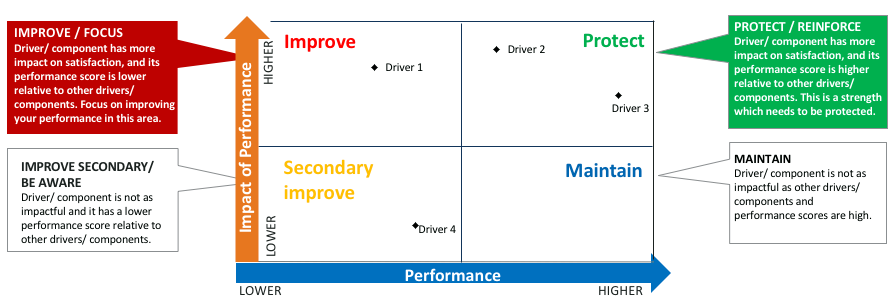
READER’S NOTE: This slide is intended to assist the reader in interpreting data shown in a priority matrix. A priority matrix has been used to identify priority improvement areas with respect to staff interacting with clients.
A priority matrix allows for decision makers to identify priorities for improvement by comparing how well clients feel you have performed in an area with how much impact that area has on clients’ overall satisfaction. It helps to answer the question ‘what can we do to improve satisfaction’. Each driver or component will fall into one of the quadrants explained below, depending on its impact on overall satisfaction and its performance score (provided by survey respondents).
Text description of graphs
Priority Matrix - Impact vs. Performance
- The greatest opportunities to improve the service experience for the Service Canada clientele as a whole are addressing the ease of problem resolution and getting assistance when needed, as well as the amount of time it takes to go through the client journey. However, given the small coefficient of each attribute individually, improvement in any one area alone will have a negligible impact on the overall satisfaction figure. The challenge will be to maintain the current high level of satisfaction, and to make improvements for the smaller groups of clients who have a poorer service experience, as will be discussed in subsequent chapters.
Text description of graphs
*Among those who encountered a problem. Note that the coordinate for this driver (47% performance and regression coefficient of 0.16) lies outside the scale range of the priority
**Among those who did not encounter a problem
Meetings Client Needs: Service Canada
Summary: Meeting Clients Needs – Service Canada
Most aspects of the service delivery were rated highly by the large majority of clients
- Among all service attributes, those that rated most highly (by 87% or more) among the Service Canada clientele overall include:
- helpfulness of staff in both the in-person and phone channels
- ease of getting to an office; reasonable distance to travel
- confidence that personal information is protected
- received service in official language of choice in an office (not measured in other channels)
Aspects with the lowest service ratings were rated highly by 77% of the clients they applied to or fewer
- These service attributes include:
- Able to get through to a phone agent in a reasonable amount of time (among those who called a specialized call centre)
- The issues or problems that you had were easily resolved (among those who had an issue/problem)
- Ease of understanding the information about the program and figuring out whether they would be eligible
- Confidence that the application would be processed within a reasonable amount of time
- Ease of going through the process of following up; staff understood importance (among those who followed up)
- Ease of getting help when needed; explaining the situation only once
- Reasonable amount of time to complete the client journey
Following up is generally associated with increased confidence in receiving benefits in a reasonable amount of time, with the exception of small minority among who become very concerned after following up.
Note: where attributes were similar, only one is shown on the priority matrix for simplicity
Client Journey
Aware Stage: Ease, Effectiveness and Emotion
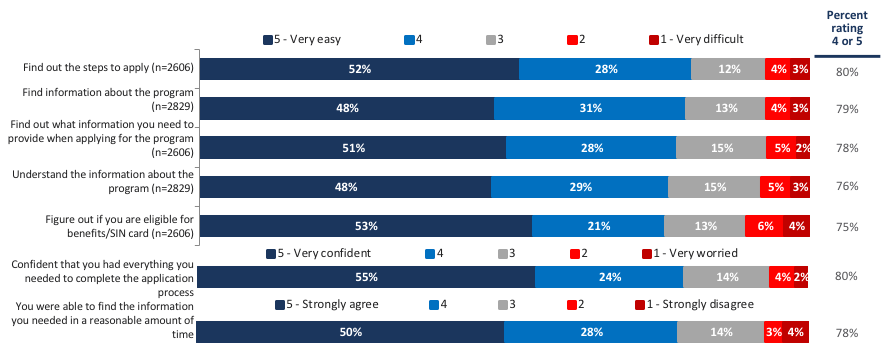
- In the first stage of the client journey, where clients informed themselves about the program and how to apply, they most often encountered challenges with: understanding the information about the program and figuring out whether they would be eligible
- Most were confident they had everything they needed to apply.
Text description of graphs
Q6. How easy or difficult was it to get information about the following when you were getting information about [insert abbrev] before you applied? Base sizes vary, as indicated.
Q7. How much do you agree or disagree that you were able to find the information you needed (online, in person or by phone) within a reasonable amount of time?
Base: All respondents excluding OAS (n=2606)
Q8. After you finished gathering information about [insert abbrev], how confident were you that you had everything you needed to complete the application process?
Base: All respondents excluding OAS (n=2606)
Apply Stage: Ease, Effectiveness And Emotion
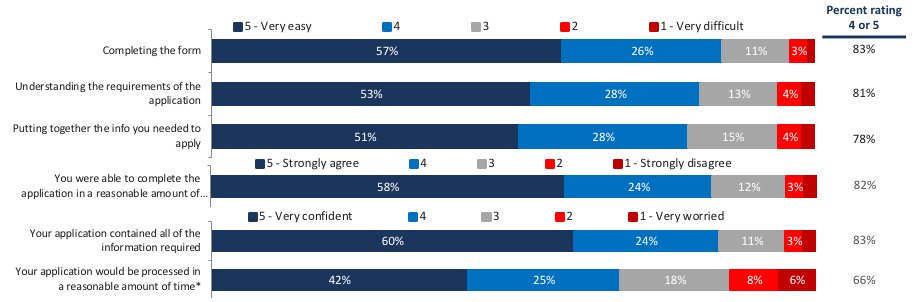
- Most clients were able to complete the application process easily, however some were concerned about whether their applications would be processed in time.
Text description of graphs
Q13. How would you rate the following when you were applying for [insert abbrev]? Base: Completed an application (n=3405)
Q12. How much do you agree or disagree that you were able to complete the application in a reasonable amount of time? (Please use a scale of 1 to 5 where 5 means you agree strongly and 1 means you disagree strongly.) Base: Completed an application (n=3405)
Q14c. After you submitted your application for [INSERT ABBREV], how confident were you about each of the following? Please use a scale of a 5-point scale, (where 5 means you were very confident about it and 1 means you were very worried it might not be the case). How confident or worried were you that… [INSERT ITEM]?
Base: Completed an application (n=3405) *Base: (n=2879) excludes those who applied in-person
Follow-up Stage: Ease, Effectiveness And Emotion
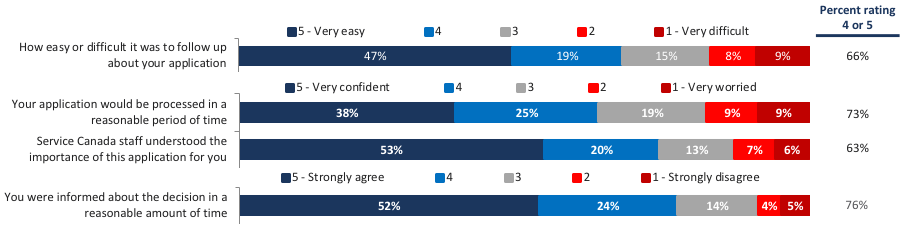
- About half (50%) of the clients reported contacting Service Canada to follow up on an application before receiving a decision, between submitting an application and receiving a decision, particularly EI, CPP-D and GIS clients (Appendix C).
- These clients largely followed up to check the status (28% of all clients), or provide missing information (13% of all clients) (Appendix C).
- Following up was reported to be difficult for a substantial proportion (17%).
- Confidence is somewhat greater after following up than before (63% after follow-up compared to 56% when only looking at those who followed-up). At the same time, the proportion of those who followed up and were worried or very worried after doing so was 18%.
Text description of graphs
Q20a. Using a 5-point scale where 5 is very easy and 1 is very difficult, how easy or difficult was it to follow up with Service Canada about your application? (n=1296)
Q20b. After you contacted Service Canada to follow-up on your application for [INSERT ABBREV], how confident were you about each of the following? Please use a scale of 1 to 5, (where 5 means you were very confident about it and 1 means you were very worried that it might not be the case.) How confident or worried were you that… [INSERT ITEM]? Base: Contacted Service Canada pre-decision (n=1296)
Q21a. How much do you agree or disagree that you were informed about the decision within a reasonable amount of time? Please use a 5-point scale (where 5 means you agree strongly and 1 means you disagree strongly). Base: Completed an application (n=3405)
End-to-end Client Experience: Effectiveness
- Regarding the end-to-end client journey, most clients were able to move smoothly through the steps, however certain aspects of the delivery received somewhat lower ratings:
- The ease of getting help when needed, explaining the situation only once, and the client journey taking a reasonable amount of time were rated positively by just over three quarters of the clientele.
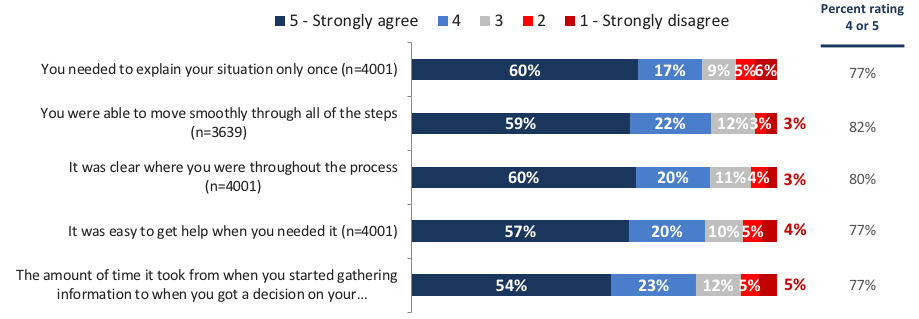
Text description of graphs
Note: End-to-end refers to the client journey up to at least the initial decision.
Q36b. Thinking about the service you received, how much do you agree or disagree with the following statements? Base: All respondents (n=4001)
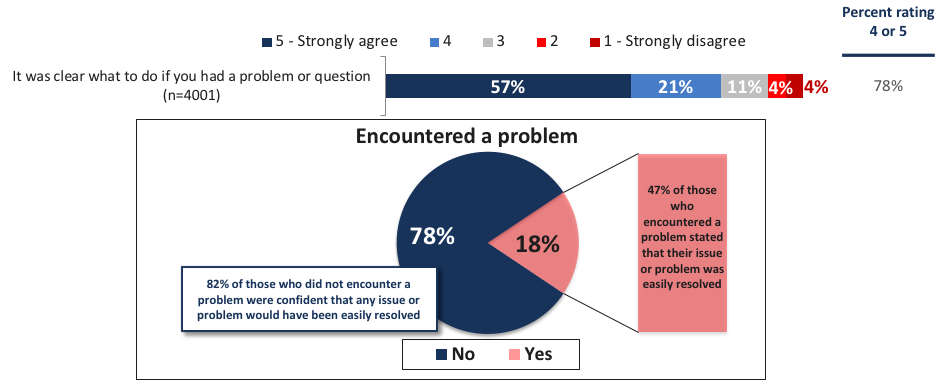
End-to-end Client Experience: Effectiveness Of Problem/Issue Resolution
- The majority of clients did not encounter a problem during their service experience (81%), and most of those were confident that any issues or problems they encountered would have been easily resolved(82%).
- However, among the 18% of clients who did encounter an issue or problem, less than half found that it was easily resolved. Further, almost a third disagreed or strongly disagreed that it was easily resolved.
Text description of graphs
Q36b. Thinking about the service you received, how much do you agree or disagree with the following statements Base: All respondents (n=4001)
n=3211 for those who encountered no problem Q36b You were confident that any issues or problems would have been easily resolved?
n=780 for those who encountered a problem Q36b The issues or problems that you had were easily resolved?
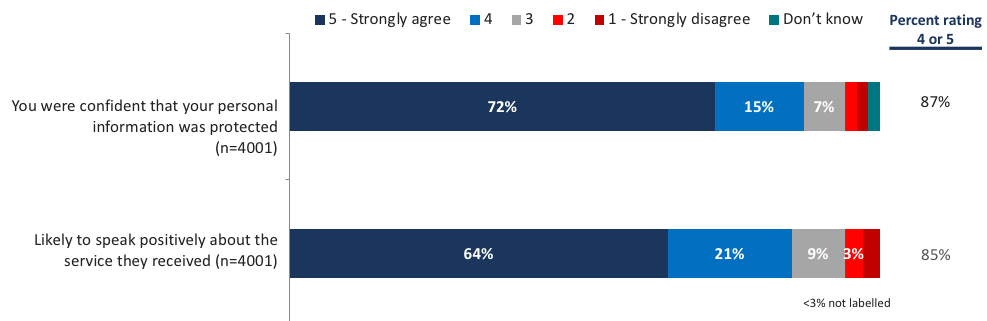
End-to-end Client Journey: Emotion
- The vast majority of clients felt confident that their personal information was protected.
- Similarly, most clients stated that they were likely to speak positively of their service they received.
Text description of graphs
Q36b. Thinking about the service you received, how much do you agree or disagree with the following statements.
Q38b. If someone were to ask you, would you speak positively about the service you received?
Base: All respondents (n=4001)
Service Channels
Service Channel Assessments
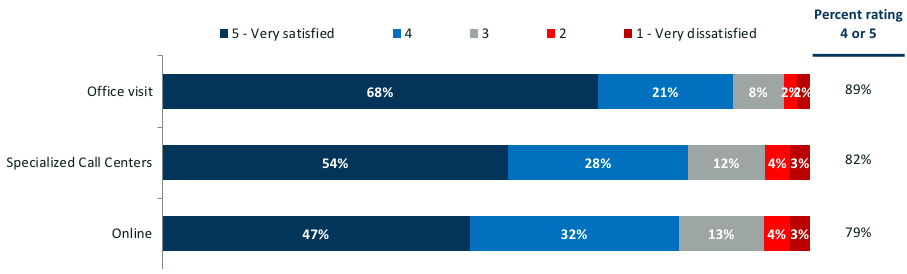
Satisfaction was high with all channels; the higher the touch, the higher the service channel rating
- Consistent with other government studies, satisfaction is highest for the in-person channel (89%). The specialized call centre satisfaction was slightly lower, while remaining high (82%). Satisfaction with the online channel is somewhat lower still (79%), which is not entirely surprising as it does not involve human contact (a “lower touch” channel).
- Most clients of the in-person channel found it was easy to get to, and that staff were helpful and answered the clients’ questions completely.
- Similarly, most clients of the specialized call centres also found that staff were helpful and answered the clients’ questions completely.
- Clients of the online channel reported that they got what they needed at the stage of informing themselves about the program, even though fewer could see how the information applied to their specific situation.
- Among the portion of the EI, CPP and OAS clients who reported using the My Service Canada Account, most got what they needed. While slightly fewer reported that it was easy to use, this was still four in five users.
Satisfaction by Service Channel
- The vast majority were satisfied with the level of service from each primary service channel. At nearly nine in ten (89%), satisfaction is highest for in-person of which more then two-thirds provide rating of 5 (68%). Closer to eight in ten were satisfied with their experience at the specialized call centres or online. Few were dissatisfied with any channel.
Text description of graphs
Q27. How satisfied were you with the overall quality of service you received during your phone call(s) to [insert abbrev] Specialized Call Centres? (n=511)
Q32. How satisfied or dissatisfied were you with the overall quality of service you received at a government office about [insert abbrev]? (n=1342)
Q33b. How satisfied or dissatisfied were you with your overall experience with the service you received when you visited the government’s [insert abbrev] website? (n=1089)
In-person Channel
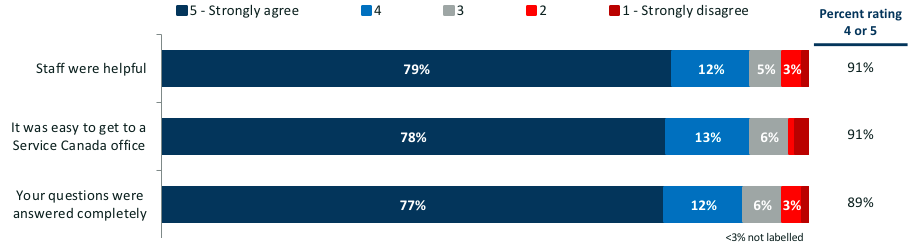
- At nine in ten, the vast majority rated each aspect of in-person service positively.
Text description of graphs
Q31. How much do you agree or disagree with the following statements about your experience at a Service Canada office to obtain information or service related to [INSERT ABBREV]?
Base: Respondents selected for Service Canada office channel (n=1342)
Specialized Call Centres
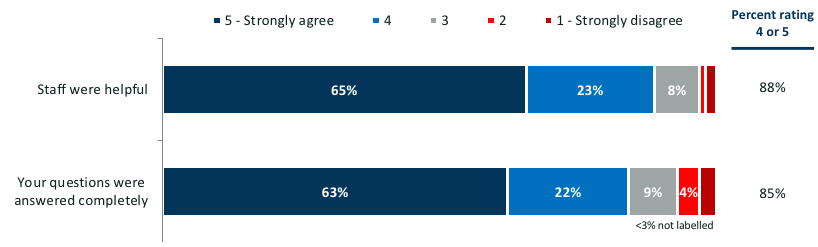
- At nearly eight in ten, the vast majority felt staff at specialized call centres were helpful (88%), while slightly fewer had their questions answered completely (85%).
Text description of graphs
Q26. Please tell me how much you agree or disagree with the following statements about calling an [INSERT ABBREV] Call Centre
Base: Respondents selected for Specialized Call Centres channel (n=511)
Online Channel
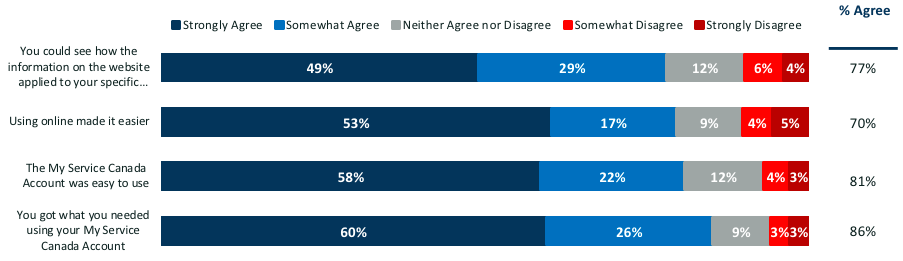
- Three quarters (77%) agreed that the information provided on the website applied to their specific situation. Most (86%) said they got what they needed from the website before applying.
- Many (70%) reported that being able to complete steps online made the process easier.
- Among EI, CPP and OAS clients who reported using the My Service Canada Account (n=444), 80% felt it was easy to use, while another 86% said they got what they needed.
Text description of graphs
Q33a. You mentioned that you visited the government’s website to get information or service related to [INSERT ABBREV]. Please tell me how much you agree or disagree with the following statements about the government website related to [INSERT ABBREV]. Base: Respondents who used online services (n=1089)
Q4. Did you get what you wanted from the website when you were getting information before you applied? (n=1854)
Q36b. Being able to complete steps online made the process easier for you (n=3043)
RQ34B. Please tell me how much you agree or disagree with the following statements about your use of the My Service Canada Account related to [PROGRAM ABBREVIATION].
Base: Respondents who reported using a My Service Canada Account (n=444)
Meeting Client Needs:Service Standards For Service Channels
Service Channel Standard Setting
The following information was gathered to assist Service Canada in setting and assessing its service standards in the in-person service channel and specialized call centres.
In-person Channel Service Standards
- Clients in reported finding the travel distance to a Service Canada Centre reasonable up to 24 km. The rating dropped substantially at more than 50 km.
- Most clients found the current travel distance to be reasonable.
- The vast majority of in-person clients reported receiving service and documents in the official language of their choice.
Phone Channel Service Standards
- Users of the specialized call centres were much more likely to find the wait time to be reasonable if it were under five minutes.
- Just over half the callers found a wait time of 5 to 10 minutes to be reasonable, while anything longer than 10 minutes was seen as unreasonable by a majority of clients.
- Just under half of the callers to the specialized call centres found the current wait time to be reasonable; two thirds were able to get through after one or two attempts.
In-person Channel: Reasonable Travel Distance
For the purposes of setting and assessing service standards, clients who used the in-person channel were asked how far they travelled and whether they felt this was reasonable.
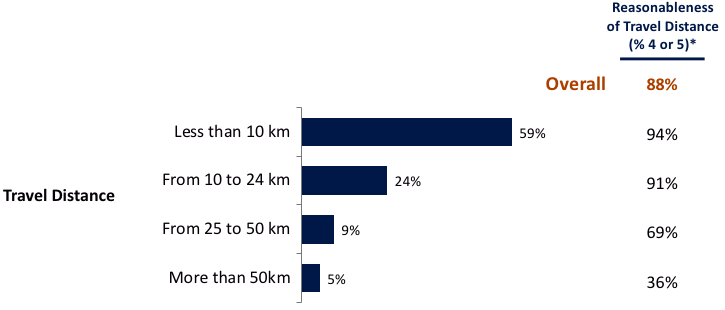
- Most clients found the distance they travelled to be reasonable, with the exception of the 5% of clients who travelled more than 50 km.
- The assessment of whether the distance is reasonable may begin to drop before 50km, but after 25 km.
Text description of graphs
Q29. How far did you travel to visit a Service Canada office?
Q30. How much do you agree or disagree that this was a reasonable distance to travel to access service? (Please use a scale of 1 to 5 where 5 means you agree strongly and 1 means you disagree strongly.)
Base: Respondents selected for office channel (n=1342)
In-person Channel: Performance On Language of Service
More than 90% of clients who visited an in-person office report being provided service and documents in their official language of choice.
- This is particularly the case for official language minority community members (OLMC), that is clients residing outside Quebec and comfortable only in French, or residing in Quebec and being comfortable only in English. No less than 97% of this subgroup say they have received service and documents in the official language of their choice from in-person offices.
- Clients who are comfortable in the majority language in their regions are also nearly unanimous in their agreement (93%), although slightly less so compared to OLMC.
| Base = |
Total |
OLMC |
Other |
| 2124 |
125 |
1999 |
| You were provided with DOCUMENTS in your choice of English or French when you went to an office |
93% |
97% |
93% |
| You were provided with SERVICE in your choice of English or French when you went to an office |
94% |
97% |
94% |
Note that the sample size for OLMC is relatively small and carries a larger margin of error.
Q36b. Thinking about the service you received, how much do you agree or disagree with the following statements
Base: Visited a government office (n=2124)
Specialized Call Centres: Setting Access Standards
- More than half the callers to a specialized call centre (65%) reported having to call only one or two times on average to get through.
- The proportion who considered their average wait time to be reasonable dropped considerably when it went beyond five minutes.
- Overall, 49% of clients considered the wait time to a specialized call centre to be reasonable.
Text description of graphs
Q23. On average, how many times did you call before you spoke with a service agent?
Base: Respondents who used a specialized call centre (n=518)
Q24. How long did you have to wait, on average, to speak to an agent?
Q25. How much do you agree or disagree that this was a reasonable amount of time to wait to speak to an agent?
Base: Respondents selected for Specialized Call Centres channel (n=489)
Meeting Client Needs: By Program
Meeting Clients Needs: Programs
Some attributes were consistently high or low across all programs
- Across all programs, being provided service or documents in the official language of choice in an office, helpfulness of in-person staff, and confidence that personal information was protected were the highest rated areas. Problem/issue resolution among those who experienced a problem is the lowest rated area for each program. (Note that service delivery in language of choice was measured for the in-person channel only through this survey.)
Clients found the delivery of SIN to be easiest and most efficient
- Delivery of the Social Insurance Number is the service with the easiest and most efficient service experience. Clients found the process clear and could move through the steps effectively. However, about 15% did not find aspects of preparing to apply easy.
CPP and OAS perform particularly well on most attributes
- Among the pension programs delivered largely to seniors, the Canada Pension Plan - Retirement Benefits and Survivor Benefits (CPP), Old Age Security (OAS), and Guaranteed Income Supplement (GIS), the first two perform well on most attributes. Notably, the OAS clients who were auto-enrolled were more likely than those who submitted an application to be very satisfied.
- Among both CPP and OAS clients, the overall process was found to be easy. Lower scores related to finding and understanding information about the program.
GIS clients needs were met slightly less often than other pension programs for seniors
- The delivery of GIS meets clients’ needs at a slightly lower rate that other pension delivery to seniors. While over 4 in 5 found the overall process easy and could get help when they needed it, client were less likely it easy to find and understand information on the program, and to be confident they had what they needed to complete the application.
Meeting Clients Needs: Programs
EI meets the needs of most clients, but at a slightly lower rate than higher-performing programs
- Similar to GIS, most Employment Insurance (EI) clients rate the service attributes highly, but at a slightly lower rate than SIN, CPP and OAS. Over 1 in 5 found the overall process of applying for the program to be easy, however only 66% were confident that their application would be processed in a reasonable amount of time.
CPP-D clients encounter the most difficulty across the service experience
- Clients of Canada Pension Plan - Disability Benefit (CPP-D) rated the service delivery process poorly across most service dimensions. Although the rate at which applicants are granted benefits is much lower for CPP-D than for other programs, and this may have some impact on clients’ assessment of the service delivery, much appears to be associated with the service delivery itself rather than the service outcome.
- For example, many clients who have not been granted a benefit do rate the service delivery highly, while aspects of the service delivery, such as encountering a problem, are related to satisfaction.
- Further, there is variation in the scoring of service attributes showing that respondents are assessing the service attributes specifically. Some attributes are rated highly by CPP-D clients, including confidence in the protection of personal information.
- The attributes that have the lowest ratings are related to ease of understanding, ease of putting together information required for the application, and problem resolution.
Satisfaction By Program
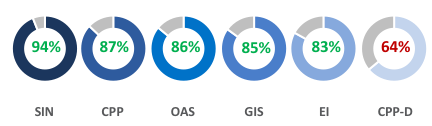
Satisfaction is particularly high for issuing Social Insurance Numbers, and particularly low for CPP-Disability.
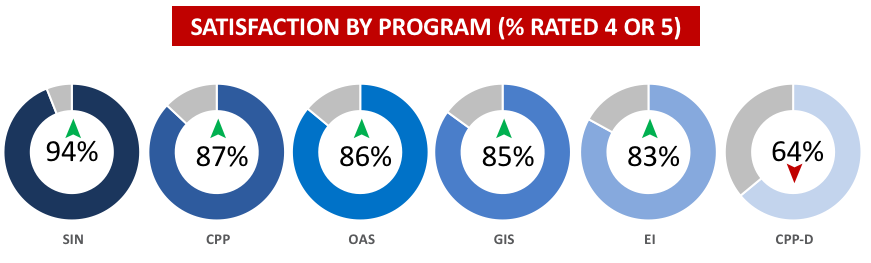
Text description of graphs
Q38a. How satisfied were you with the service you received from Service Canada related to your [insert abbrev] application? please use a 5-point scale, where 1 means very dissatisfied, and 5 means very satisfied.
Base: All respondents (n=~600n per program)
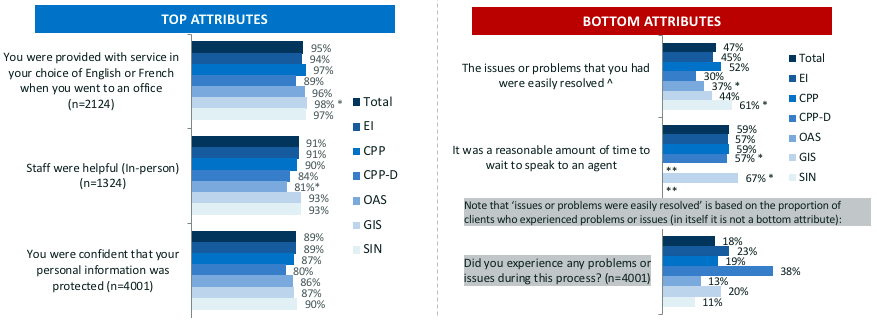
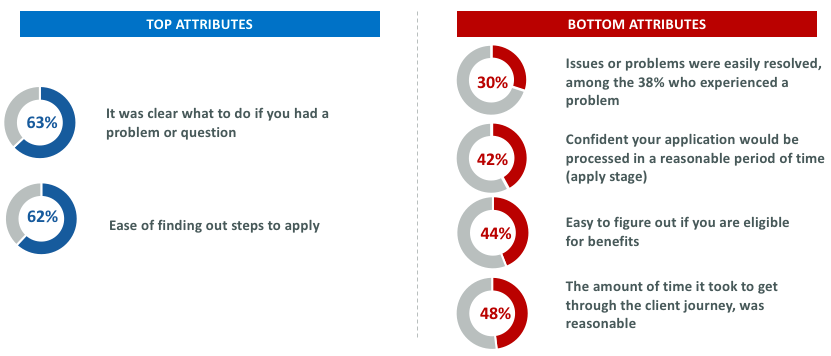
Client Experience- Highs And Lows
- Certain service attributes scored very highly across all programs, including the helpfulness of in-person staff. (Helpfulness of phone staff was rated highly, but not as consistently highly across programs. See appendix C). Also very high was being provided service and documents in the client’s choice of English or French (measured for the in-person channel only), and confidence that personal information was protected.
- Problem/issue resolution was rated consistently poorly among those who experienced a problem, as was the amount of time to speak to a phone agent (specialized call centres).
Text description of graphs
Staff were also helpful by phone but this does not apply to all programs. * Small sample size on program level (n<100). ** Sample size on program level too small to report
Q36b. The issues or problems that you had were easily resolved. Q25. How much do you agree or disagree that this was a reasonable amount of time to wait to speak to an agent? (n=489) Base: All respondents excludes DK and N/A (Q36b n=2124, Q31 n=1324 and Q36b n=4001 for top attributes and Q36b n=780 and Q25 n=489 for bottom attributes).
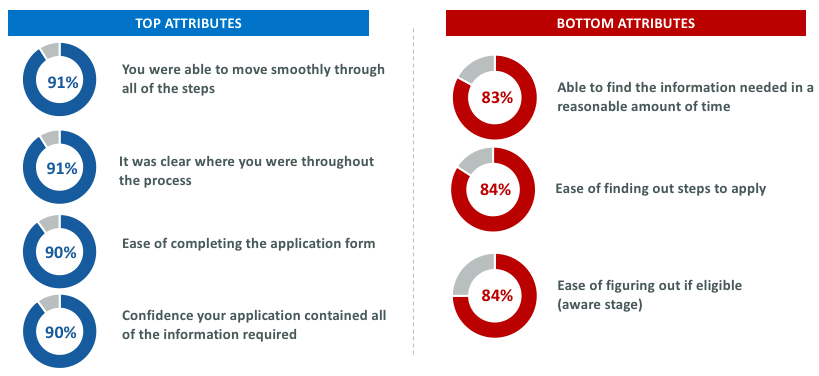
SIN Client Experience
- SIN rated higher than other programs across most service attributes. It’s highest rated attributes were about the process being smooth and clear, ease of the application and confidence that the application submitted was complete. The lower performing attributes are still rated highly, and are about the process of preparing to apply. (Excludes attributes rated consistently high/low across programs.)
Text description of graphs
Base: SIN-clients, n=604. Within this, sample size varies by question. Excludes attributes with small sample sizes.
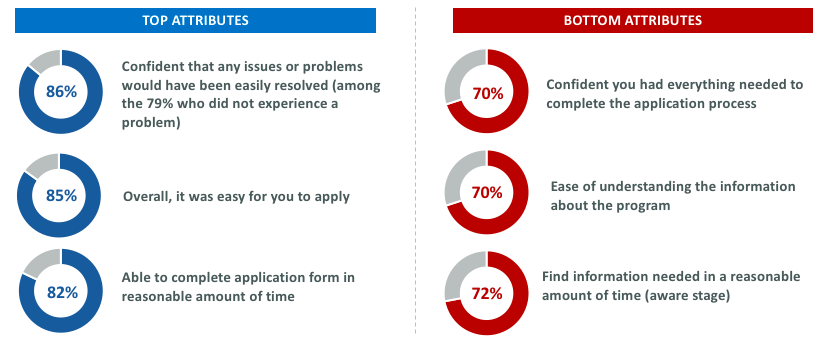
CPP Client Experience
- CPP (retirement and survivor benefit) is among the higher rated programs. Its highest rated attributes are about overall ease and smooth movement, whereas its lower rated attributes are about confidence in timely processing and ability to find and understand information about the program. (Excludes attributes consistently high/ low across all programs.)
Text description of graphs
Base: CPP-clients, n=652. Within this, sample size varies by question. Excludes attributes with small sample sizes.
OAS Client Experience
- OAS is rated highly for ease of applying and confidence that issues would be resolved. The program rated more poorly on ease of understanding and finding information about the program. Few OAS clients explained their situation more than once, which is not surprising given that 52% were auto-enrolled.
- Those who were auto-enrolled were more likely to be very satisfied (72% vs. 60%) but no more likely to be satisfied overall (88% vs. 85%). There were no notable differences between those who were and were not auto-enrolled across individual service attributes. (Excludes attributes consistently high/ low across all programs.)
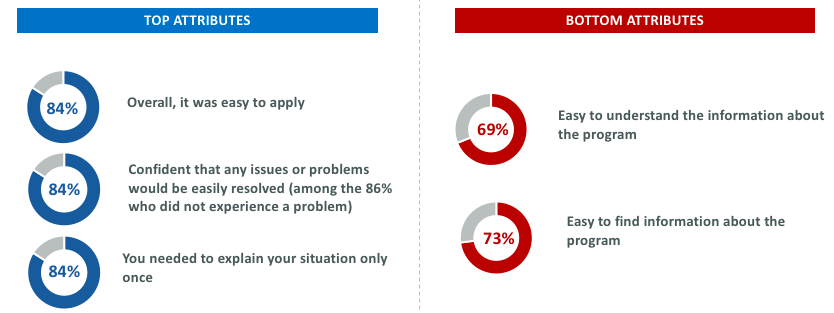
Text description of graphs
Base: OAS-clients, n=672. Within this, sample size varies by question. Excludes attributes with small sample sizes.
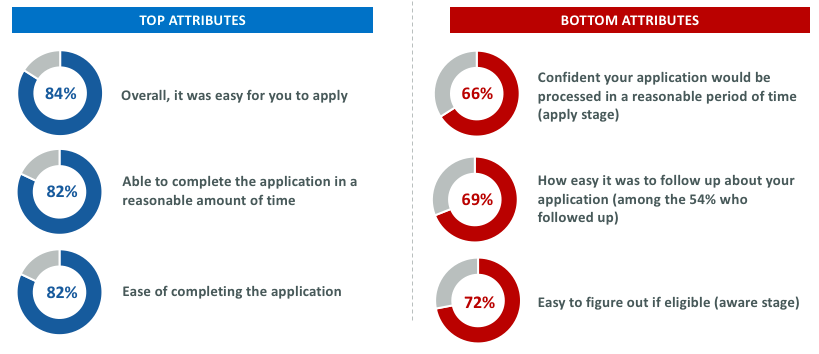
GIS Client Experience
- GIS generally rated slightly lower than the high-performing programs of SIN, CPP and OAS on most attributes. GIS clients rated overall ease of applying and confidence that issues would be resolved most highly.
- The lowest ratings, which were around 70%, were in ease of finding and understanding information about the program, and in confidence in having collected everything needed to complete the application.
- (Excludes statements consistently high/ low across all programs.)
Text description of graphs
Base: GIS-clients, n=712. Within this, sample size varies by question. Excludes attributes with small sample sizes.
EI Client Experience
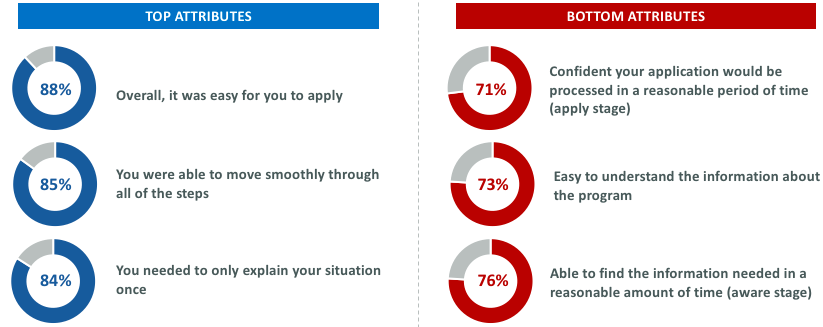
- Across many service attributes, EI rates slightly lower than high-performing programs such as SIN, CPP and OAS. Most often, around three quarters of EI clients rated the attributes highly. The attributes that receive the highest ratings among EI clients were the ease of the overall application process, and within that, completing the application.
- EI performs more poorly on confidence in timely processing and ease of following up.
- (Excludes attributes that are consistently rated high/low across all programs.)
Text description of graphs
Base: EI-clients, n=703. Within this, sample size varies by question. Excludes attributes with small sample sizes.
CPP-D Client Experience
- CPP-D service delivery was rated substantially lower than other services on all measures. The service attributes that were rated most poorly were about issue resolution, confidence in the process and understanding the information on eligibility.
- Top service attributes concerned the clarity of steps, however they were rated highly by less than two thirds of CPP-D clients.
- (Excludes the consistently highest-rated attributes.)
Text description of graphs
Note: 53% of CPP-D clients were not granted benefits for the first time they applied. This had a negative effect on the ratings provided across all attributes.
Base: CPP-D-clients, n=658. Within this, sample size varies by question. Excludes attributes with small sample sizes.
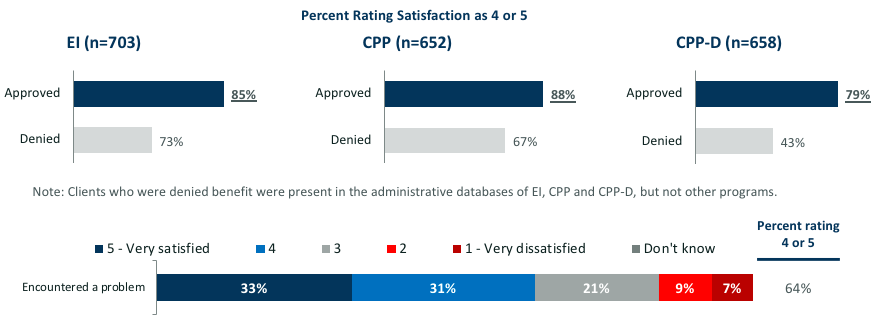
Impact of Decision on Satisfaction
- It is not necessarily the case that clients who received a negative decision rated the service delivery poorly. Many clients who were denied benefits still rated the service their received highly. Further, lower satisfaction is also associated with encountering a problem.
Text description of graphs
Q38a. How satisfied were you with the service you received from Service Canada related to your [insert abbrev] application? please use a 5-point scale, where 1 means very dissatisfied, and 5 means very satisfied.
Base: Those who were denied benefit.
Meeting Client Needs: Vulnerable Client Groups
Vulnerable Client Groups: Overview
Most of the vulnerable client groups that Service Canada serves rate the service experience highly
- Most clients in vulnerable groups appear to be well-served through the current service design. This includes clients with lower education and clients who are e-vulnerable (rarely or never use online services).
- Remote clients do not appear to have a lower satisfaction rate, keeping in mind the smaller sample size (n=204) for this group, which increases the margin of error.
Indigenous clients and those with restrictions affecting access have a poorer service experience
- The two client groups who do experience lower satisfaction scores and rate some service attributes less highly are:
- Indigenous clients
- appear to be less likely to find it easy to quickly gather and to understand information about the program/application
- Clients who feel they have restrictions that make it more difficult to access service
- appear to be less likely to find the service experience easy, timely or effective
Generally, vulnerable groups are more likely to use the in-person channel
- The vulnerable groups who are more likely to use the in-person channel to apply for programs are official language minority community members, clients with high school education or less, the e-vulnerable, youth and Indigenous clients.
- Seniors (aged 60 and over) use the in-person channel at about the same rate as clients overall; just over half used the in-person channel to apply.
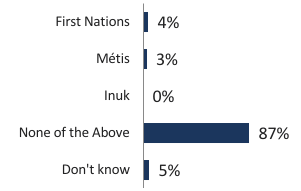
Proportion of Clients In Vulnerable Groups
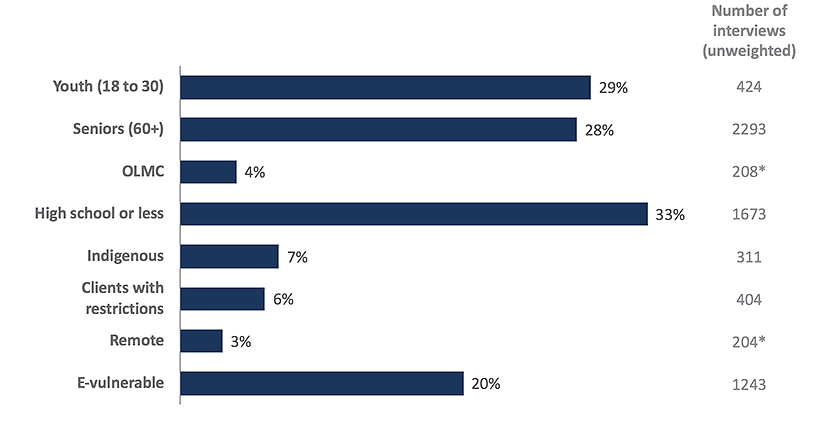
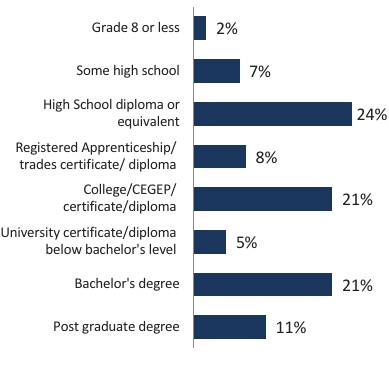
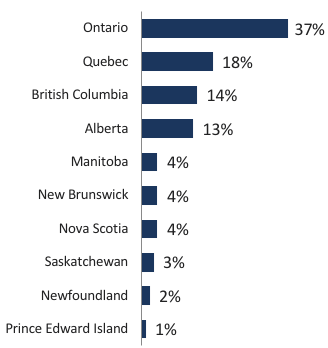
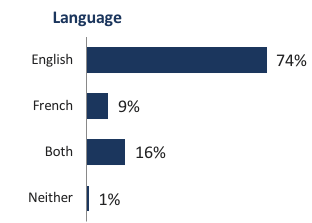
Text description of graphs
Note: Percentages are based on weighted data.
* Oversampled groups.
Indigenous Clients (n=311) (Percent rating satisfaction as 4 or 5)
Indigenous clients in the survey have a lower level of overall satisfaction, and had more difficulty than other clients with the early stages of accessing a program.
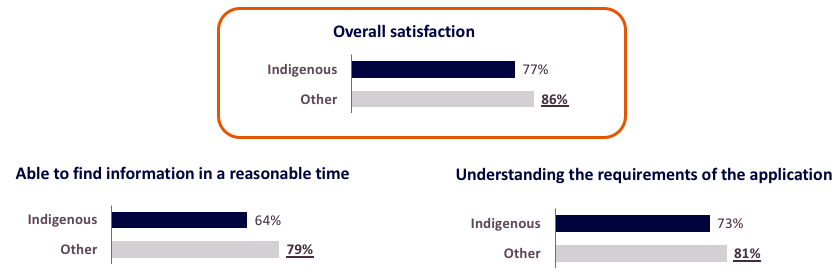
Text description of graphs
Note: The data for Indigenous clients are based on a sample size of 311 respondents, which carries a larger margin of error (+/- 5.6%) compared to overall results. Respondents from this group were also more likely to be drawn from the EI and SIN clientele (they could be identified in the administrative databases for these programs) and are overrepresented in remote areas, which were oversampled.
Note: Bold/ underlined figures are significantly higher at the 95% confidence interval.
Thinking about the service you received, how much do you agree or disagree with the following statements? How easy or difficult was it to … Base: All respondents (n=varies by statement)
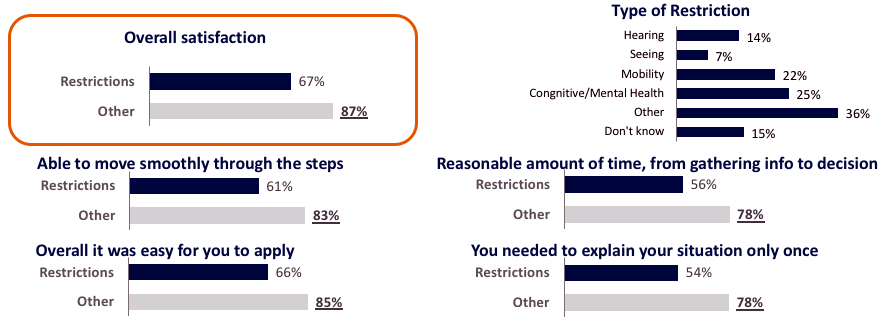
Clients With Restrictions That Affect Accessing Services (n=404) (Percent rating satisfaction as 4 or 5)
Clients reporting that they have restrictions that make it more difficult to access service experienced substantially more difficulty than other clients with ease, timeliness and effectiveness.
Text description of graphs
Note: Q45. Do you feel that you have any restrictions that make it more difficult to access services? Given that this question is specific to service delivery barriers, rather than the standard definition of disability, the group is distributed across the programs, and represents a minority of the CPP-D respondents.
Note: Bold/ underlined figures are significantly higher at the 95% confidence interval. Thinking about the service you received, how much do you agree or disagree with the following statements? How easy or difficult was it to … Base: All respondents (n=varies by statement)
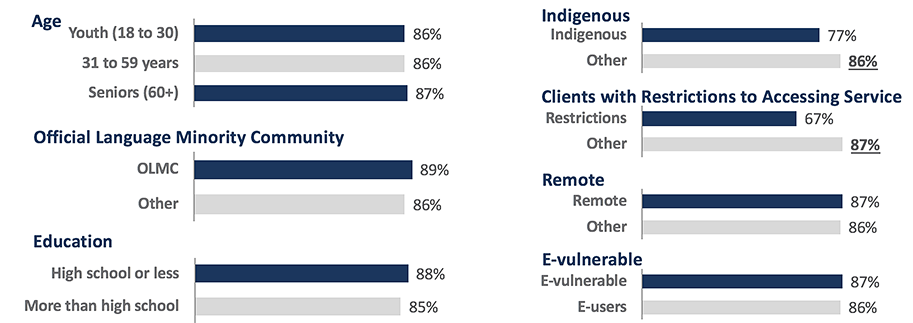
Satisfaction Among Vulnerable Client Groups
Percent rating satisfaction as 4 or 5
- Among vulnerable client groups, overall satisfaction with service was lower among Indigenous clients or those with a restriction that affects their ability to access service. Other clients who might be considered at risk of access barriers appear to be well served through the current service design.
Text description of graphs
Note on clients not comfortable in English or French: while the survey was administered in multiple languages using a translation service, only 46 respondents identified that they were clients who are not comfortable in either English or French. This sample size is too small to conduct an analysis of results for this group.
Note: Bold/ underlined figures are significantly higher at the 95% confidence interval.
Q38a. How satisfied were you with the service you received from Service Canada related to your [insert abbrev] application? Please use a 5-point scale, where 1 means very dissatisfied, and 5 means very satisfied. See Appendix B for definitions of vulnerable groups.
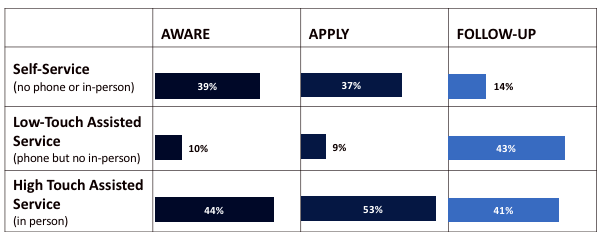
Channels Used By Stage In The Client Journey Among Vulnerable Clients
Generally, vulnerable groups are more likely to use the in-person channel
- The vulnerable groups who are more likely to use the in-person channel to apply for programs are official language minority community members, clients with high school education or less, the e-vulnerable, youth and Indigenous clients.
- Seniors (aged 60 and over) use the in-person channel at about the same rate as clients overall; just over half used the in-person channel to apply.
|
Total |
AGE |
OLMC |
EDUCATION |
INDIGENOUS |
RESTRICTIONS |
REMOTE |
E-VULNERABLE |
| 18-30 |
31-59 |
60+ |
Yes |
No |
≤HS |
>HS |
Yes |
No |
Yes |
No |
Yes |
No |
Yes |
No |
|
A |
B |
C |
D |
E |
F |
G |
H |
J |
K |
L |
M |
N |
P |
Q |
R |
| AWARE |
| Self-service |
39% |
38% |
42% |
34% |
28% |
39% |
33% |
42% |
25% |
40% |
33% |
39% |
29% |
39% |
26% |
42% |
| Low-touch |
10% |
8% |
9% |
15% |
3% |
10% |
11% |
10% |
15% |
10% |
13% |
10% |
11% |
10% |
13% |
9% |
| High touch |
44% |
48% |
42% |
46% |
61% |
44% |
48% |
43% |
56% |
43% |
49% |
44% |
49% |
44% |
54% |
42% |
| APPLY |
| Self-service |
37% |
31% |
40% |
37% |
23% |
37% |
34% |
38% |
26% |
39% |
32% |
37% |
41% |
36% |
26% |
39% |
| Low-touch |
9% |
6% |
11% |
11% |
6% |
9% |
8% |
10% |
12% |
9% |
16% |
9% |
9% |
9% |
10% |
9% |
| High touch |
53% |
62% |
48% |
51% |
70% |
53% |
56% |
52% |
60% |
51% |
53% |
53% |
49% |
53% |
63% |
51% |
| FOLLOW-UP |
| Self-service |
14% |
11% |
15% |
15% |
11% |
14% |
11% |
14% |
8% |
14% |
4% |
15% |
5% |
14% |
12% |
14% |
| Low-touch |
43% |
49% |
42% D |
33% |
48% |
42% |
42% |
43% |
27% |
45% |
38% |
43% |
36% |
43% |
39% |
43% |
| High touch |
41% |
38% |
41% |
44% |
34% |
41% |
44% |
39% |
62% |
37% |
56% |
39% |
52% |
40% |
46% |
40% |
The Omni-Channel Experience
The Omni-Channel Experience Across The Client Journey
Self-service and Assisted Service
- Currently, most of Service Canada’s clients use assisted service (phone and/or in-person) during the client journey when accessing the programs it delivers.
- With the existing service design, Service Canada provides service to the majority of its clients through its in-person network of offices. Nearly two thirds of the clients visited a Service Canada Centre at one point during their client journey.
- At the same time, one-quarter of the clientele self-served throughout the client experience without assistance. They did so through either or both the web and mail channels.
- Over time, if the service design for various programs changes, the channel use pattern may also shift.
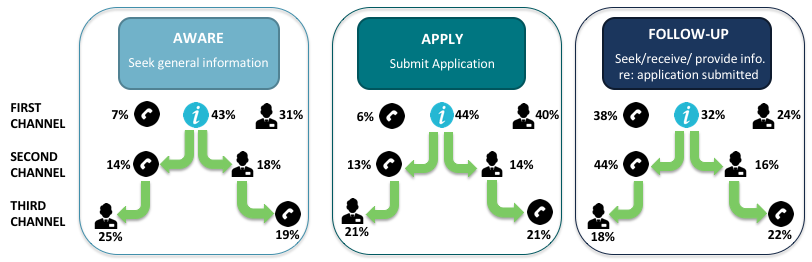
Multiple Channel Use
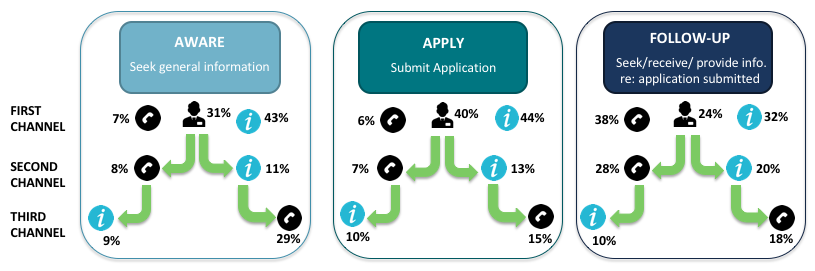
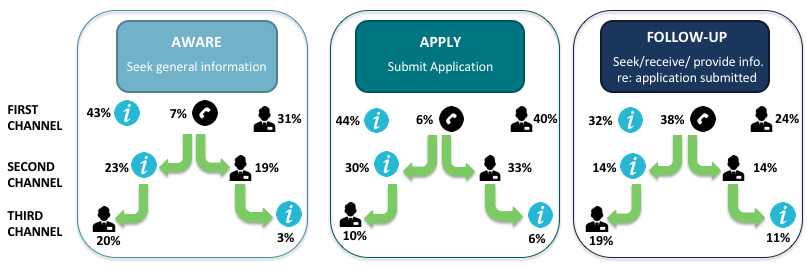
- Clients most often used only one channel during each stage (about half the time), though multiple channel use was higher at the apply and follow-up stages than at the aware stage. Up to one in five used three or more channels; this was at the stage of applying for the benefit/number.
- Clients most often used the web channel first at most stages of the client journey, followed closely by using the in-person channel first. The exception is the follow-up stage, for which clients used the phone channel most often, though almost as many went to the web channel first.
- Clients who found the aware or apply stages of the process easy or who were confident in the timeliness of the process were more often found among those who used fewer channels. Clients who used three or more channels were more likely to be those who experienced difficulty or had concerns.
- Satisfaction with the level of service declined with the number of times the client contacted Service Canada. Clients who contacted Service Canada only one or two times had the highest satisfaction, declining with the greater number of occasions they were in contact, particularly among those who had contact five or more times.
Omni-Channel Experience Across The Client Journey
By Program:
- SIN clients use the in-person channel to complete the client journey, per the service design. At the same time, GIS, CPP-D and CPP clients also use the in-person channel at high rates, while OAS and EI clients are more likely to self-serve during the aware and apply stages, and use the phone for assistance during the follow up stage.
- SIN and OAS clients were more likely to have only contacted Service Canada once, while CPP, GIS and EI clients all have similar levels of contact.
- CPP-D clients by far have the highest number of contacts (particularly among those with between five and ten contacts, which is twice the average).
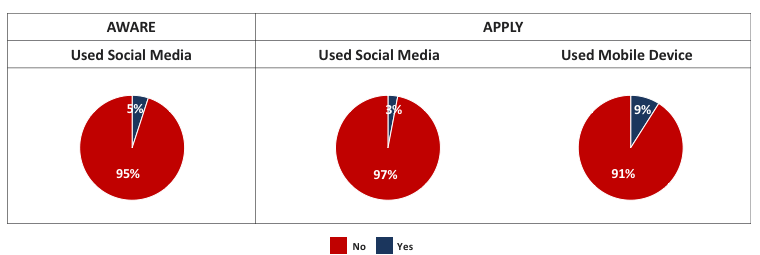
Social Media and Mobile Use:
- Currently, very few clients consult social media for information regarding programs or how to apply.
- Only one in ten used a mobile device for the application process.
Omni-Channel Experience By Stage In The Client Journey
- A quarter of the clientele self-served across the client journey
- Clients are using the specialized call centres for follow-up
- Nearly two-thirds of clients used the in-person channel at some point in the client journey
Text description of graphs
Proportion who completed the client journey using only self-service (without assistance by phone or in-person): 25%
Proportion who used high-touch service (in-person) at some point in the client journey: 63%
Omni-Channel: Online Channel Usage In-Depth
- Clients most often used the web channel first at each stage of the client journey, though almost as many began in the in-person channel.
- A large majority of clients (70%) agreed that “being able to complete steps online made the process easier” for them.
- Most (86%) who used the web channel at the aware stage reported that they were able to get what they wanted from the web before applying.
Text description of graphs
Questions 1a, 2, 3, 9bx, 10x, 11x, 18, 19a, 19b
Q36b. Being able to complete steps online made the process easier for you. (n=3043)
Q4. Did you get what you wanted from the website when you were getting information before you applied? (n=1854)
Omni-Channel: In-person Channel Usage In-Depth
- In-person was the second most used channel as a first point of contact (behind online), particularly for the apply stage where it was nearly equal with the web channel.
- Clients who began in-person were less likely to have utilized a second channel compared to those who began online.
Text description of graphs
Questions 1a, 2, 3, 9bx, 10x, 11x, 18, 19a, 19b
Omni-Channel: Telephone Channel Usage In-Depth
- Phone is the least used channel for the first point of contact with the except of the follow-up stage where it is the most common first channel. Clients are generally more likely to go in-person or online after beginning over the phone at the apply and aware stage, but use only the phone if they begin with this channel at the follow-up stage.
Text description of graphs
Questions 1a, 2, 3, 9bx, 10x, 11x, 18, 19a, 19b
Channel Usage by Stage in the Client Journey
- About half the clients used only one channel to complete each stage of the client journey.
- Multiple channel use was higher at the apply and follow-up stages.
- One in five used three or more channels to apply.
- Clients who used fewer channels were generally more likely to be those who found the process easy and who were confident in the timeliness of the process.
|
AWARE |
APPLY |
FOLLOW-UP |
| Key differences by # of channels used by stage |
The fewer channels used the more likely clients were to find the process easy, to be confident in the information needed or the timeliness of the process* |
Those who used only 1 channel were more confident in the timeliness of the process and more likely to feel it was easy to understand the application, to collect the necessary information or complete the form than those who used 3+ channels* |
There are no differences in service experience by the number of channels used* |
| % using only one channel |
53% |
44% |
49% |
| % using 2 or more channels |
31% |
43% |
48% |
| % using 3 or more channels |
11% |
22% |
18% |
*See appendix E
Qs 1a, 2, 3, 9bx, 10x, 11x, 18, 19a, 19b
Use of Mobile and Social Media
- Fewer than one in ten (5%) used social media during the aware stage, while very few did so during the apply stage (3%).
- One in ten (9%) used a mobile device during the apply stage.
Text description of graphs
Q1a. Which of the following did you use to find out about [INSERT PROGRAM] or [INSERT ABBREV] before you applied? Did you… Base: Completed an application (n=3639)
Q9bx. Thinking back to when you actually applied for [IF ≠SIN INSERT [INSERT ABBREV] benefits], [IF SIN INSERT: an SIN number], which of the following channels did you use when completing your application? Did you… Base: Completed an application (n=3405)
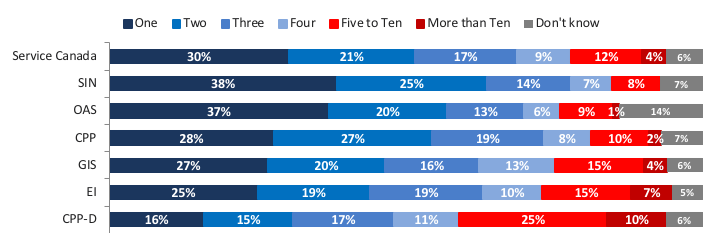
Number of Times Contacted Service Canada
Text description of graphs
Q38c. Thinking back over your experience during the process of learning about, and applying for [insert abbrev], how many times did you contact service Canada, including online, phone, in-person and mail contacts?
Base: All respondents (n=4001)
Number of Contacts by Level of Satisfaction
- Satisfaction with the level of service declines by the number of times the client contacted Service Canada. Clients who contacted Service Canada only one or two times have the highest satisfaction, followed by those who contacted the organization three or four times, declining further the more occasions they were in contact.
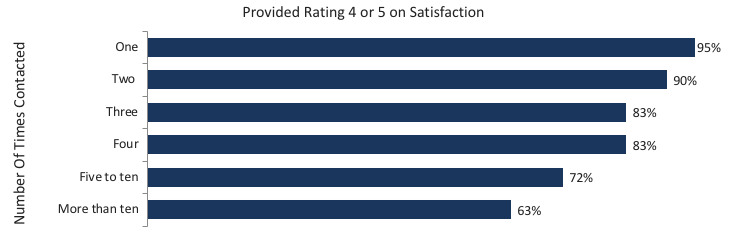
Text description of graphs
Q38c. Thinking back over your experience during the process of learning about, and applying for [INSERT ABBREV], how many times did you contact Service Canada, including online, phone, in-person and mail contacts? (CLARIFY WITH LIST AS REQUIRED). [INSERT IF EI: (Please consider your most recent experience if you have applied for EI more than once.)]
Contact Following a Decision
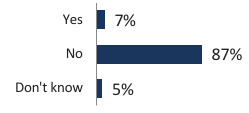
- Two in ten surveyed (18%) reported that they contacted Service Canada after they were notified of the decision. Note that the survey was conducted at least three months after the decision was received.
- When looking at data by program, we note that CPP-D clients (39%) are the most likely to have reported contacting Service Canada after they were notified of a decision.
- Clients of CPP (12%) and SIN (9%) were the least likely to report contacting Service Canada after they were notified of a decision.
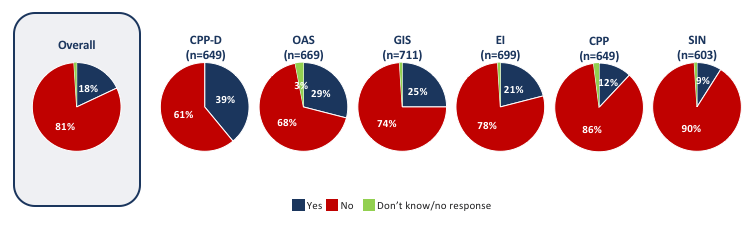
Text description of graphs
Q21b. Did you contact Service Canada after you were notified of the decision?
Base: All respondents (n=3986)
Contact Following A Decision
- The most common reasons reported for contacting Service Canada after a decision were that clients wanted information on a payment they expected or to better understand the decision. Other common reasons include understanding next steps, to ask for a change in the decision or to discuss their employment status.
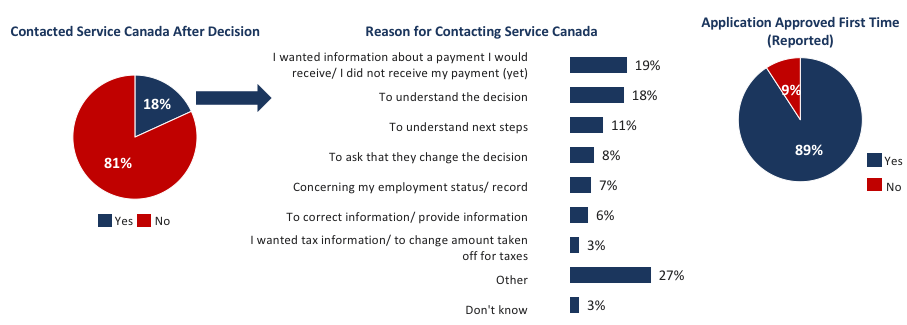
Text description of graphs
Q21b. Did you contact Service Canada after you were notified of the decision? Base: All respondents (n=3986)
Q22a. What was the reason that you contacted Service Canada after you were notified of the decision? Base: All respondents (n=905)
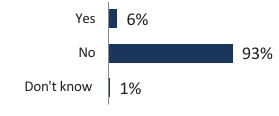
Q22b. The first time you were notified of a decision, was your application approved? Base: All respondents (n=3986)
Appendix A: Qualitative Research Findings
- The target audience of the qualitative research mirrors the client universe for the 2017 Client Experience Survey; clients of EI, CPP, CPP-, OAS/GIS and SIN. In order to examine service delivery dimensions along the client journey, Ipsos recruited clients who were at various stages of service delivery process. Most had reached the stage of having submitted an application, and a third had received a decision.
- Two recruitment mechanisms were used:
- An Ipsos electronic sign-up tool placed on Client Access Work Stations (CAWS) at all Service Canada Centres, which effectively recruited EI clients but reached fewer clients of the other programs.
- Identification of clients from the Ipsos Canadian Household Panel who had submitted an application for a foundational program within the previous twelve months.
| FIELDWORK DATES |
March 8th to April 7th 2017 |
| AUDIENCE |
Clients of EI, CPP, CPP-D, OAS/GIS and SIN |
| LENGTH |
30-45 minutes |
| METHODOLOGY |
Individual Interviews + 2 Online Discussions |
| RECRUITMENT |
CAWS at Service Canada Centres and Ipsos Canadian Household Panel |
Qualitative findings highlighted in this report result are directional in nature and not representative. Experiences and perspectives presented are those reported by participants.
Key Findings
CX Survey Measurement Model Validation
- Overall the CX model fits with the service experiences of participants. Both those who were satisfied and dissatisfied with their experiences pointed to multiple aspects of these dimensions and attributes within the current model.
- We suggest expanding the statements around convenience, access, timeliness, consistency and respectful treatment to incorporate further detail related to satisfaction of experience based on the ability to effect change (agency), the perceived urgency of their situation and the level of personalized service (specific to their situation/case).
- The drivers of satisfaction differ among client types, based on individual circumstances, comfort level with computers and personal preferences. The use of segmentation during the analysis of data from the CX survey may allow for a better understanding of what service aspects target audience members prioritize.
Relative Importance of Attributes
- Higher value was placed on timeliness when the request was perceived as urgent by the client, while efficiency and respectful treatment were also key attributes that influenced the overall satisfaction with Service Canada.
- Information security was less of a concern than other attributes as most participants implicitly trusted the Government of Canada as a whole. Their confidence in this is tied to the federal government as a whole rather than Service Canada specifically. Actions of other departments might adversely affect this confidence.
Potential Improvements
- While discussing client journey experiences, a number of participants had suggestions to positively impact their client experience, these included; including transaction details on My Service Canada account, push notifications for information requests, an online chat feature and consideration of transportation barriers when choosing office locations.
- At the end of the discussion, interviewees were asked to prioritize some suggested improvements, improvements to the telephone service (callback feature) as well as online communication options (online chat or email) were popular suggestions.
- Some participants were concerned with data security with online communications, suggesting the type of questions and answers might be limited through online chat or email to avoid breaches of privacy.
Client Experience Survey Measurement Model
Overall the CX Survey Measurement Model effectively addresses the client needs that drive satisfaction. √
Note: Before using the measurement model to implement the Client Experience Survey, Service Canada made slight adjustments to it to better incorporate the concepts of agency, urgency and personalized service identified below. The questionnaire length determined the extent to which each details of each attribute could be incorporated into the survey.
Text description of graphs
Appendix B: Additional Details On Methodology
Call Dispositions
- Up to seven calls were placed in an effort to reach a selected respondent. Overall, a very high completion rate of 19% was attained compared to the industry average. The final call outcomes are as follows.
| Call Outcome |
Count of Disposition |
| Call backs |
3111 |
| Completed Interviews |
4001 |
| Disqualified |
2308 |
| Language Barriers |
850 |
| No Answers |
13691 |
| Not In Service (Out of Scope) |
3804 |
| Over quota |
15 |
| Refusals |
9559 |
| Terminations |
415 |
| TOTAL IN SCOPE |
33950 |
| TOTAL RESPONDING |
6309 |
| OVERALL RESPONSE RATE |
19% |
Note: See Detailed methodology report for an analysis of the degree of potential bias among non-responders.
Drivers of Satisfaction – Background on Analysis
- All key attributes included in the questionnaire were considered for inclusion in the key driver analysis. However, attributes measured within individual channel assessments, such as helpfulness of staff, could not be included in the regression analyses due to differing bases. The base was split in order to include assessments of each channel individually within limited questionnaire space.
- Two regression runs were conducted, one among those who followed up and one among all clients which excluded statements from that latter phase. The results of both runs presented the same set of key drivers and for the purposes of simplicity has only been shown for the run which included the greater number of measures.
- Please note: The step-wise regression utilized for this analysis naturally removes variables that do not have a statistically significant impact to arrive at the final set of key variables for the driver analysis outlined on slide 31).
Aware
q6_3 Find information about [PROGRAM ABBREVIATION]
q8 Confident were you that you had everything you needed to complete the application process
q7 You were able to find the information you needed (online, in person or by phone) within a reasonable amount of time
q6_4 Find out the steps to apply
Apply
q14c_2 Your application would be processed in a reasonable amount of time
q13_1
Understanding the requirements of the application
q12
You were able to complete the application in a reasonable amount of time?
Follow-Up
q20a How easy or difficult was it to follow up with Service Canada about your application?
q20b_1 Service Canada staff understood the importance of this application for you
q20b_2 Your application would be processed in a reasonable amount of time
q21a You were informed about the decision within a reasonable amount of time
Overall
q36b_1 You were able to move smoothly through all of the steps related to your [PROGRAM ABBREVEATION]
q36b_3It was clear what to do if you had a problem or question
q36b_6The issues or problems that you had were easily resolved
q36b_9 It was easy to get help when you needed it
q36b_13 The amount of time it took, from when you started to when you got a decision on your application, was reasonable
q36b_7 You were confident that any issues or problems would have been easily resolved
q36b_11 You were provided with DOCUMENTS in your choice of English or French when you went to an office
q36b_12 You were provided with SERVICE in your choice of English or French when you went to an office
Definitions For Vulnerable Client Groups
| Variable: |
Source |
| Youth (18 to 30) |
Age from program data. |
| Seniors (60+) |
Age from program data. |
| OLMC |
Respondents living outside Quebec who are comfortable only in French, or living in Quebec and comfortable only in English (Q42). |
| High school or less |
Q41. What is the highest level of formal education that you have completed? |
| Indigenous |
Q44. Do you identify as an Indigenous person, that is, First Nations (North American Indian), Metis or Inuk (Inuit)? |
| Clients with restrictions |
Q45. Do you feel that you have any restrictions that make it more difficult to access services? |
| Remote |
Variable from program data, based on postal codes, aligned with Points of Service Access Strategy. |
| E-vulnerable |
Respondents who report that they ‘rarely’ or ‘never’ use online services such as online banking, shopping and bill payments (Q40). |
Appendix C: Detailed Findings By Program
| % Rating 4 or 5 |
Total |
GENDER |
AGE |
REGION |
| Male |
Female |
Youth
18 to 30 |
31-50 |
51-64 |
Senior |
West and North |
Ontario |
Quebec |
Atlantic |
| Base: |
n=4001
A |
n=1994B |
n=2007
C |
n=424
D |
n=739
E |
n=1117
F |
n=1712
G |
n=1115
H |
n=1375
I |
n=1133
K |
n=378
L |
Service Canada
Base: |
86%
n=604 |
85%
n=301 |
87%
n=303 |
86%
n=272 |
85%
n=224 |
87%
n=72* |
87%
n=36* |
82%
n=237 |
87%
n=219 |
90%
n=108 |
90%
n=40* |
SIN
Base: |
94%
n=652 |
92%
n=294 |
95%
n=358 |
95%
n=0 |
93%n
=10** |
93%
n=376 |
86%
n=262 |
93%
n=227 |
93%
n=376 |
97%
n=6** |
93%
n=43* |
CPP
Base: |
87%
n=672 |
88%
n=381 |
87%
n=291 |
-
n=0 |
87%
n=0 |
88%
n=0 |
87%
n=672 |
85%
n=142 |
88%
n=168 |
83%
n=301 |
90%
n=61 |
OAS
Base: |
86%
n=712 |
82%
n=343 |
90%B
n=369 |
-
n=0 |
-
n=0 |
-
n=0 |
86%
n=712 |
84%
n=77* |
88%
n=147 |
89%
n=417 |
*80%
n=71* |
GIS
Base: |
85%
n=703 |
86%
n=363 |
84%
n=340 |
-
n=129 |
-
n=307 |
-
n=232 |
85%
n=29** |
74%
n=154 |
86%
n=180 |
90%
n=294 |
89%
n=75* |
EI
Base: |
83%
n=658 |
82%
n=312 |
83%
n=346 |
77%
n=22** |
82%
n=198 |
88%D
n=437 |
91%
n=1** |
75%
n=278 |
82%
n=285 |
88%
n=7** |
92%
n=88* |
| CPPd |
64% |
68% |
60% |
54% |
59% |
67% |
100% |
61% |
67% |
29% |
67% |
Q38a. How satisfied were you with the service you received from Service Canada related to your [insert abbrev] application? Please use a 5-point scale, where 1 means very dissatisfied, and 5 means very satisfied.
*small sample size **very small sample size
Service Received: Ease Attributes By Program Percent Rating Agreement as 4 or 5
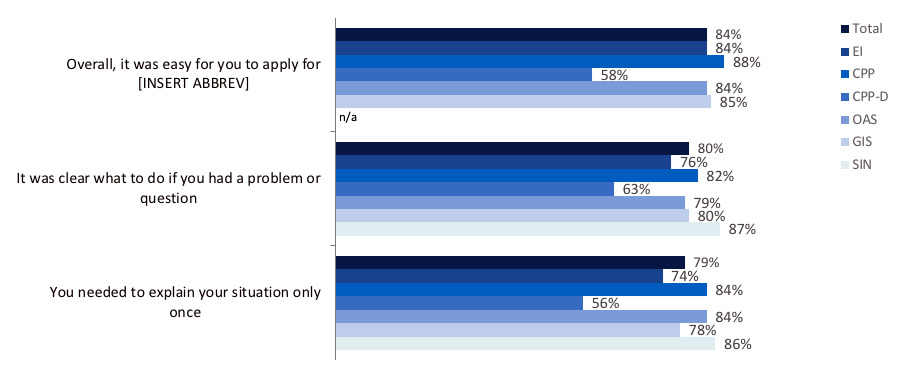
Text description of graphs
Q36b. Thinking about the service you received, how much do you agree or disagree with the following statements?
Base: All respondents, excludes DK and N/A (n=3043, 4001 and 4001)
Service Received: Effectiveness Attributes By Program Percent Rating Agreement as 4 or 5
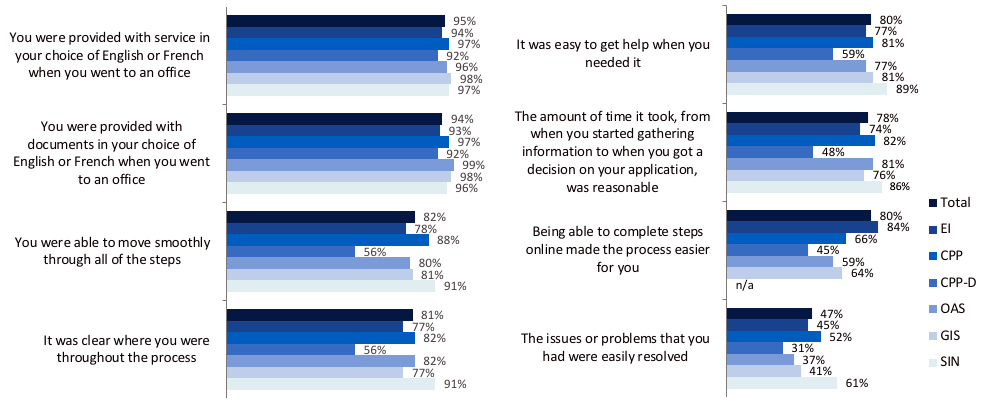
Text description of graphs
Q36b. Thinking about the service you received, how much do you agree or disagree with the following statements?
Base: All respondents excludes DK and N/A (n= dependent on statement and between 2124 and 4001).
Service Received: Emotion Attributes By Program Percent Rating Agreement as 4 or 5
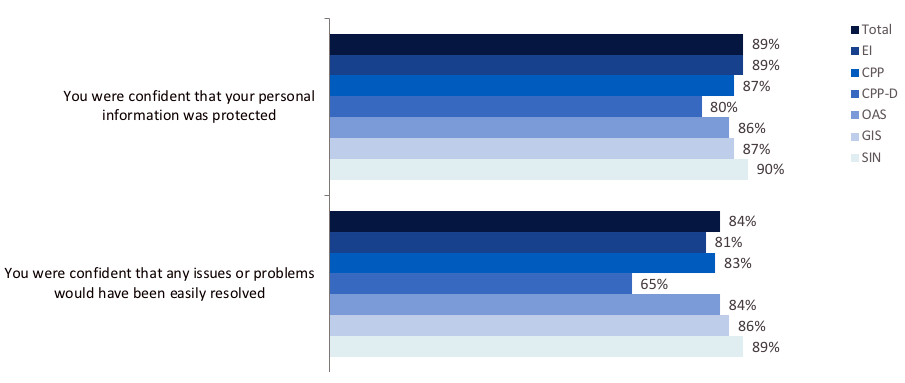
Text description of graphs
Q36b. Thinking about the service you received, how much do you agree or disagree with the following statements?
Base: All respondents excludes DK and N/A (base n= 4001 and 3221 for the 2 statements; n varies by program).
Aware Stage: Service Attributes Percent Rating 4 or 5
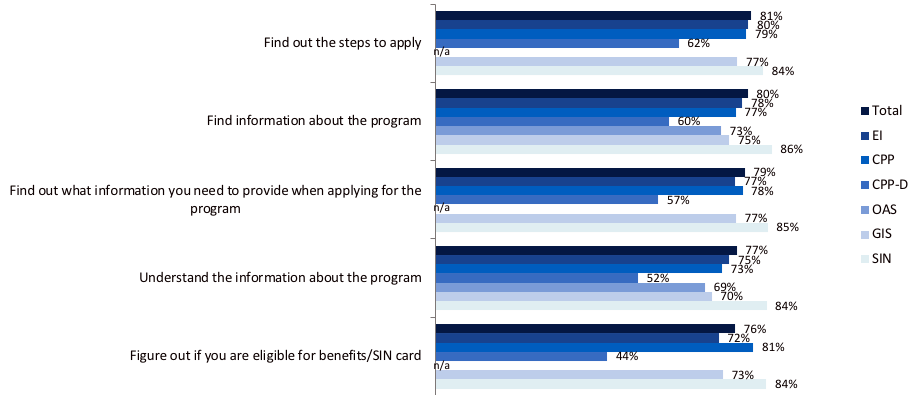
Text description of graphs
Q6. How easy or difficult was it to get information about the following when you were getting information about [insert abbrev] before you applied?
Base: All respondents excludes DK and N/A (n=varies by program by statement).
Aware Stage: Finding Information And Confidence Percent Rating 4 or 5
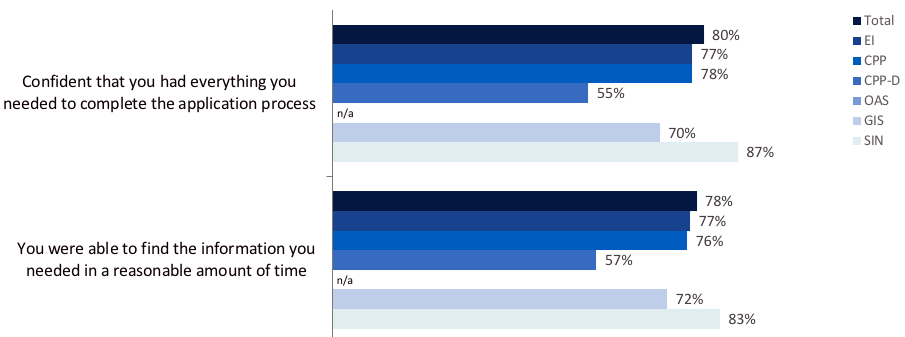
Text description of graphs
Q7. How much do you agree or disagree that you were able to find the information you needed (online, in person or by phone) within a reasonable amount of time?
Base: All respondents excludes DK and N/A excluding OAS (n=varies by program).
Q8. After you finished gathering information about [insert abbrev], how confident were you that you had everything you needed to complete the application process?
Base: All respondents excludes DK and N/A excluding OAS (n=varies by program).
Apply Stage: Service Attributes Percent Rating 4 or 5
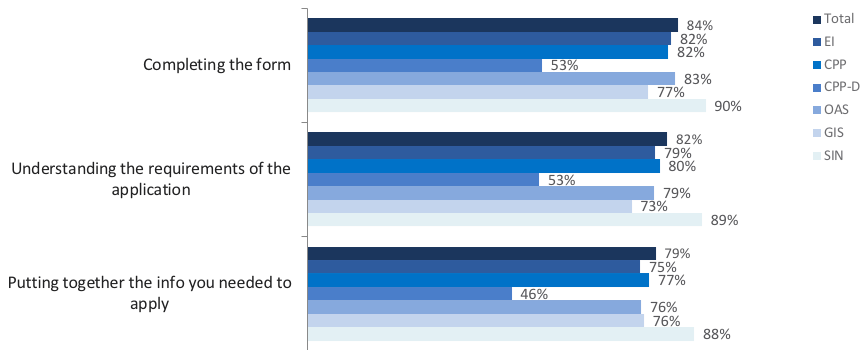
Text description of graphs
Q13. How would you rate the following when you were applying for [insert abbrev]?
Base: Completed an application (n=3405).
Apply Stage: Finding Information And Confidence Percent Rating 4 or 5
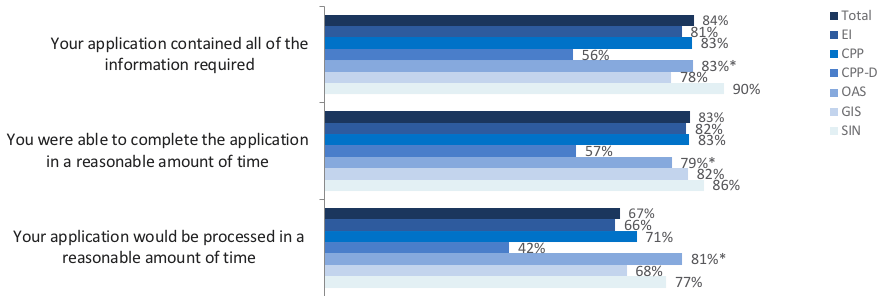
Text description of graphs
Q14c. After you submitted your application for [INSERT ABBREV], how confident were you about each of the following? Please use a scale of a 5-point scale, (where 5 means you were very confident about it and 1 means you were very worried it might not be the case). How confident or worried were you that… [INSERT ITEM]?
Q12. How much do you agree or disagree that you were able to complete the application in a reasonable amount of time? (Please use a scale of 1 to 5 where 5 means you agree strongly and 1 means you disagree strongly.) Base: Completed an application (n=varies by program).
Base: Completed an application (n=varies by program). ^Base: excluding those who used in-person channel (n=varies by program). * Small sample size (n<100)
Follow-up Stage: Reasons
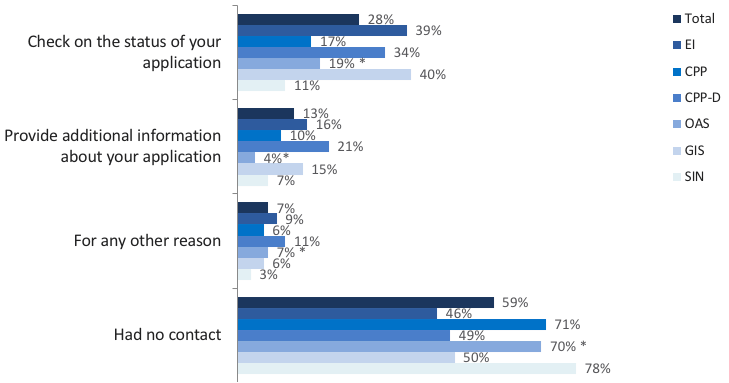
Text description of graphs
Q17. Before you received a decision, did you contact Service Canada to…
Base: Completed an application. (n=3405)
* Small sample size (n<100)
Follow-up Stage: Ease And Confidence Attributes Percent Rating 4 or 5
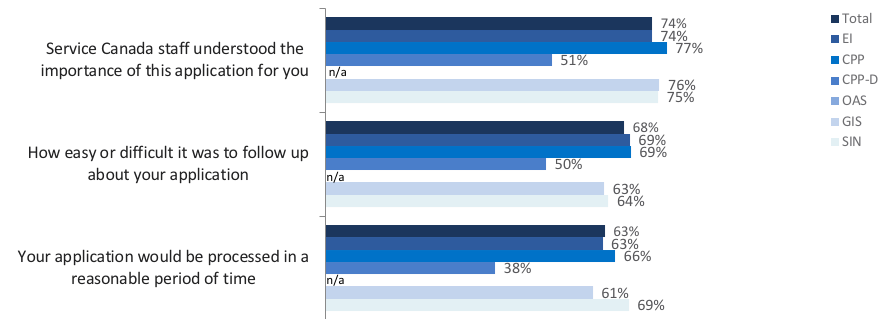
Text description of graphs
Q20a. Using a 5-point scale where 5 is very easy and 1 is very difficult, how easy or difficult was it to follow up with Service Canada about your application?
Q20b. After you contacted Service Canada to follow-up on your application for [INSERT ABBREV], how confident were you about each of the following?
Q14. Your application would be processed in a reasonable amount of time. Please use a scale of 1 to 5, (where 5 means you were very confident about it and 1 means you were very worried that it might not be the case.) How confident or worried were you that… [INSERT ITEM]? Base: Contacted Service Canada pre-decision (n=1296).
Note: Excludes attributes with very small sample sizes on program level (OAS).
Follow-up Stage: Timeliness Percent Rating 4 or 5
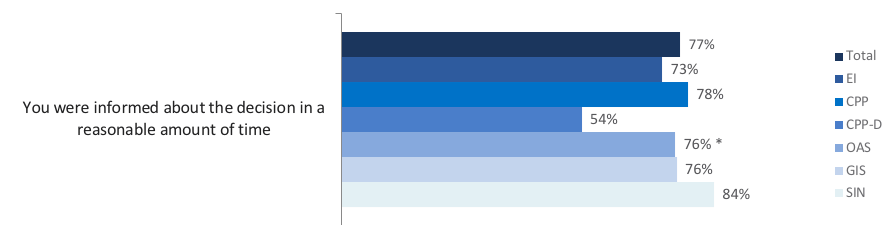
Text description of graphs
Q21a. How much do you agree or disagree that you were informed about the decision within a reasonable amount of time? Please use a 5-point scale (where 5 means you agree strongly and 1 means you disagree strongly). Base: Completed an application (n=3405); n varies by program.
* Small sample size (n<100)
Channel Service Attributes For SC Office Percent Rating 4 or 5
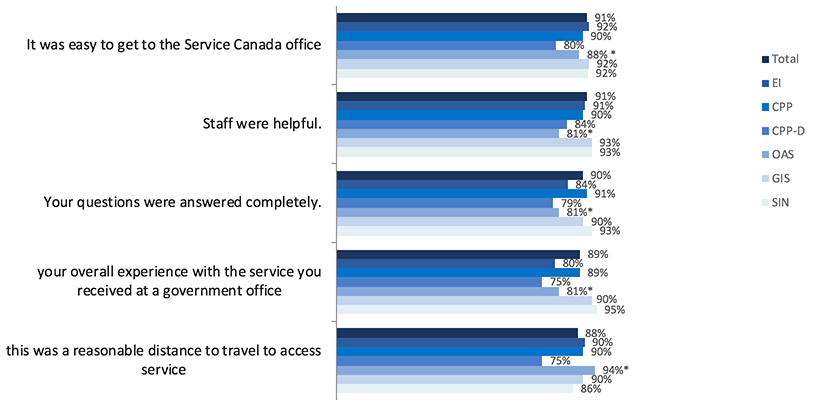
Text description of graphs
Q31 How much do you agree or disagree with the following statements about your experience at a Service Canada office It was easy to get to the Service Canada office. Staff were helpful. Your questions were answered completely. Your overall experience with the service you received at a government office. This was a reasonable distance to travel to access service? (n=varies by program)
* Small sample size (n<100)
Channel Service Attributes For Call Centre, MSCA And Online Percent Rating 4 or 5
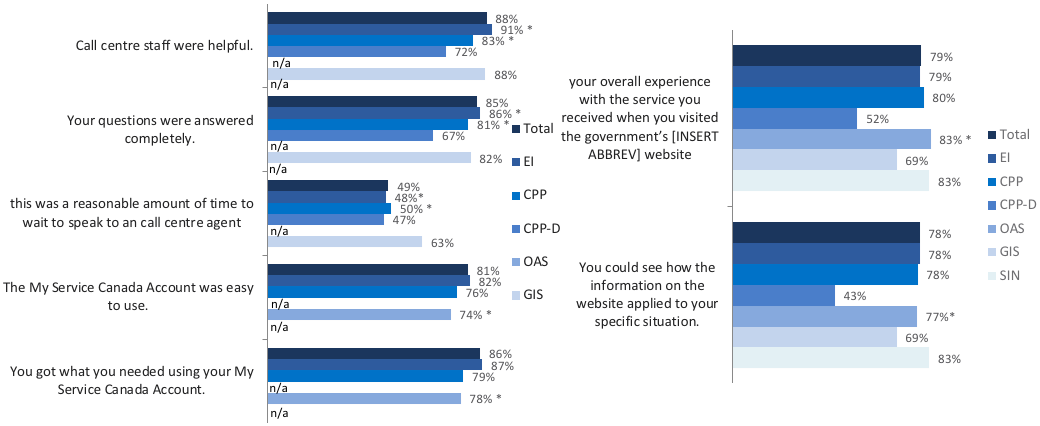
Text description of graphs
Q26: Staff were helpful and Your questions were answered completely. (base= 511) Q25: this was a reasonable amount of time to wait to speak to an agent. (base= 498)
Q34: The My Service Canada Account was easy to use and You got what you needed using your My Service Canada Account. (base= 444)
Q33b: your overall experience with the service you received when you visited the government’s [INSERT ABBREV] website. (base= 1089)
Q33a: You could see how the information on the website applied to your specific situation. (base= 1089)
* Sample size (n<100) Note: Excludes attributes with small sample sizes on program level.
Appendix D: Detailed Findings By Client Group
In-person Channel: Ratings By Vulnerable Client Groups
| % Rating 4 or 5 |
Total |
AGE |
OLMC |
EDUCATION |
INDIGENOUS |
DISABILITIES |
REMOTE |
E-VULNERABLE |
| 18-30 |
31-59 |
60+ |
Yes |
No |
<=HS |
>HS |
Yes |
No |
Yes |
No |
Yes |
No |
Yes |
No |
| Rated 4 or 5 |
89% |
91% |
86% |
90% |
91% |
89% |
91% |
88% |
77% |
89% |
77% |
89% |
89% |
81% |
88% |
91% |
| 5 – Very satisfied |
68% |
68% |
64% |
75% |
69% |
68% |
68% |
68% |
50% |
69% |
53% |
69% |
68% |
65% |
67% |
71% |
| 4 |
21% |
22% |
22% |
15% |
21% |
21% |
23% |
19% |
27% |
20% |
24% |
20% |
21% |
16% |
21% |
20% |
| 3 |
8% |
5% |
11% |
6% |
7% |
8% |
7% |
8% |
8% |
8% |
19% |
7% |
7% |
17% |
8% |
6% |
| 2 |
2% |
2% |
2% |
2% |
2% |
2% |
0 |
3% |
9% |
2% |
1% |
2% |
2% |
0 |
3% |
1% |
| 1 – Very dissatisfied |
2% |
2% |
1% |
2% |
0 |
2% |
1% |
2% |
6% |
1% |
2% |
1% |
2% |
1% |
1% |
2% |
Q32. How satisfied or dissatisfied were you with the overall experience of service you received at a government office about [insert abbrev]?
In-person Channel: Ratings By Region
| % Rating 4 or 5 |
Total |
REGION |
| West + Territories |
Ontario |
Quebec |
Atlantic |
|
A |
B |
C |
D |
E |
| Rated 4 or 5 |
89% |
88% |
89% |
91% |
87% |
| 5 – Very satisfied |
68% |
66% |
68% |
70% |
69% |
| 4 |
21% |
22% |
20% |
21% |
17% |
| 3 |
8% |
6% |
9% |
6% |
8% |
| 2 |
2% |
3% |
1% |
1% |
2% |
| 1 – Very dissatisfied |
2% |
2% |
1% |
1% |
2% |
Q32. How satisfied or dissatisfied were you with the overall experience of service you received at a government office about [insert abbrev]?
Specialized Call Centres: Ratings By Vulnerable Client Groups
| % Rating 4 or 5 |
Total |
AGE |
OLMC |
EDUCATION |
INDIGENOUS |
DISABILITIES |
REMOTE |
E-VULNERABLE |
| 18-30* |
31-59 |
60+ |
Yes* |
No |
<=HS |
>HS |
Yes* |
No |
Yes* |
No |
Yes |
No |
Yes |
No |
| Rated 4 or 5 |
82% |
84% |
83% |
76% |
61% |
83% |
86% |
81% |
77% |
89% |
77% |
82% |
61% |
84% |
59% |
83% |
| 5 – Very satisfied |
54% |
54% |
55% |
52% |
32% |
55% |
60% |
52% |
61% |
53% |
34% |
56% |
55% |
38% |
52% |
61% |
| 4 |
28% |
30% |
28% |
24% |
29% |
28% |
26% |
29% |
16% |
29% |
27% |
28% |
28% |
22% |
30% |
22% |
| 3 |
12% |
11% |
10% |
16% |
38% |
11% |
11% |
10% |
9% |
12% |
6% |
12% |
12% |
16% |
12% |
9% |
| 2 |
4%
|
2% |
5% |
4% |
1% |
4% |
1% |
5% |
- |
4% |
29% |
1% |
3% |
25% |
3% |
6% |
| 1 – Very dissatisfied |
3%
|
3% |
2% |
4% |
- |
3% |
2% |
3% |
14% |
2% |
2% |
3% |
3% |
0 |
3% |
1% |
Q27. How satisfied were you with the overall quality of service you received during your phone call(s) to [insert abbrev] Specialized Call Centres?
*small sample size
Specialized Call Centres: Ratings By Region
| % Rating 4 or 5 |
Total |
REGION |
| West + Territories |
Ontario |
Quebec |
Atlantic* |
|
A |
B |
C |
D |
E |
| Rated 4 or 5 |
82%
|
77% |
82% |
91% |
79% |
| 5 – Very satisfied |
54%
|
56% |
49% |
54% |
67% |
| 4 |
28%
|
22% |
32% |
37% |
12% |
| 3 |
12% |
12% |
12% |
6% |
19% |
| 2 |
4% |
9% |
2% |
0 |
0 |
| 1 – Very dissatisfied |
3% |
1% |
5% |
2% |
2% |
Q27. How satisfied were you with the overall quality of service you received during your phone call(s) to [insert abbrev] Specialized Call Centres?
*small sample size
Online Channel: Ratings By Vulnerable Customer Groups
| % Rating 4 or 5 |
Total |
AGE |
OLMC |
EDUCATION |
INDIGENOUS |
DISABILITIES |
REMOTE |
E-VULNERABLE |
| 18-30* |
31-59 |
60+ |
Yes* |
No |
<=HS |
>HS |
Yes* |
No |
Yes* |
No |
Yes |
No |
Yes |
No |
| Rated 4 or 5 |
79% |
73% |
83%B |
76% |
76% |
79% |
77% |
80% |
75% |
79% |
63% |
80%L |
79% |
76% |
81% |
74% |
| 5 – Very satisfied |
47% |
43% |
49% |
46% |
56% |
47% |
50% |
46% |
61% |
45% |
30% |
48% |
47% |
51% |
48% |
44% |
| 4 |
32% |
30% |
34% |
30% |
20% |
32% |
27% |
34% |
14% |
33%J |
33% |
32% |
32% |
26% |
32% |
30% |
| 3 |
13% |
16% |
11% |
15% |
10% |
13% |
13% |
13% |
10% |
13% |
23% |
12% |
13% |
9% |
12% |
15% |
| 2 |
4% |
6% |
3% |
5% |
6% |
4% |
5% |
4% |
8% |
4% |
3% |
5% |
4% |
13% |
4% |
8% |
| 1 – Very dissatisfied |
3% |
5% |
2% |
4% |
8% |
3% |
4% |
3% |
7% |
3% |
10% |
3% |
3% |
- |
3% |
3% |
Q33b. How satisfied or dissatisfied were you with your overall experience with the service you received when you visited the government’s [insert abbrev] website?
*small sample size
Appendix E: Detailed Channel Usage
Channels In Each Stage Of The Journey By Program
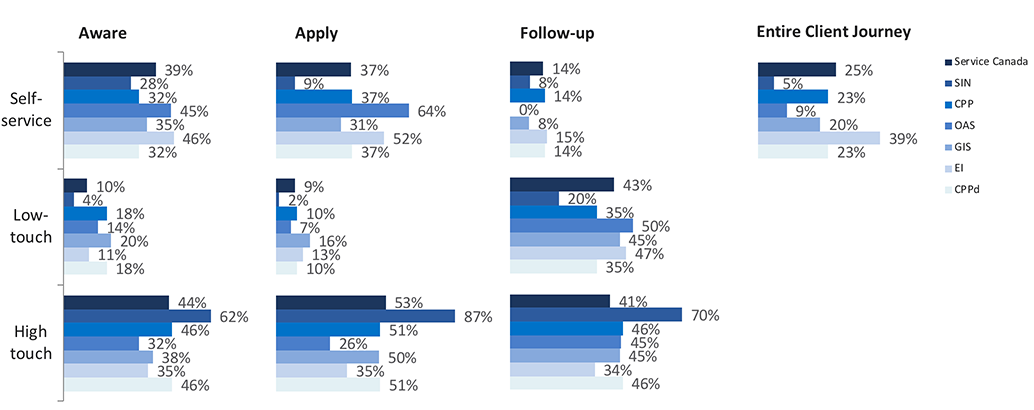
Text description of graphs
Qs 1a, 2, 3, 9bx, 10x, 11x, 18, 19a, 19b
Aware Stage: Channel Use By Program
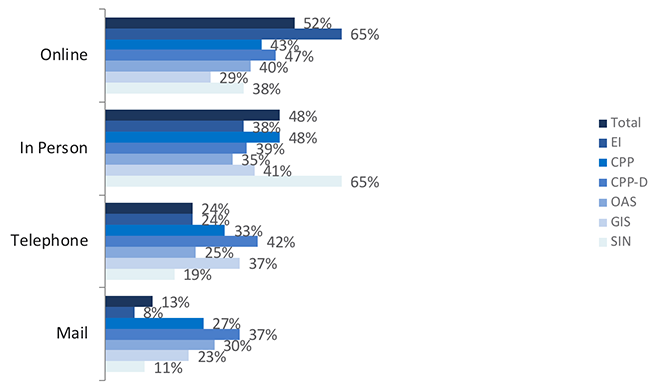
Text description of graphs
Q1a. Which of the following did you use to find out about [insert program] or [insert abbrev] before you applied? did you… Base: All respondents (n=3639)
Q1bx. Did you call... Base: Telephoned (n=1003)
Apply Stage Channel Detail
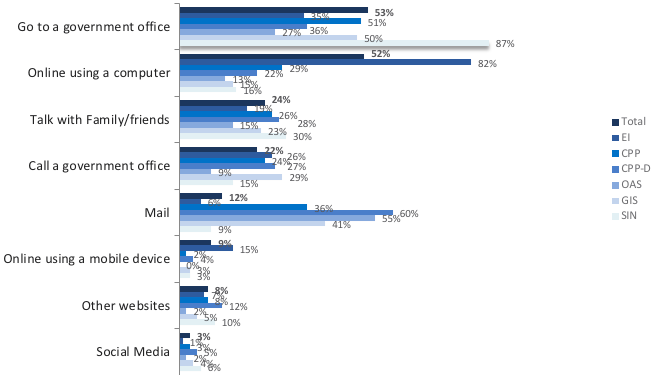
Text description of graphs
Q9bx. Thinking back to when you actually applied for benefits/an sin number], which of the following channels did you use when completing your application? did you…
Base: All respondents (n=3405) 9cx. Did you call… Base: Telephoned (n=788)
Follow-up Stage: Channel Use By Program
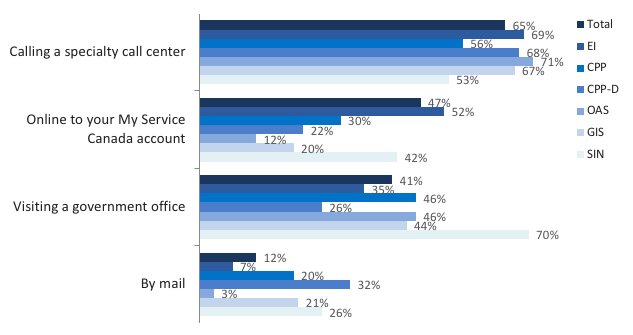
Text description of graphs
Q18. How did you contact the government before you were notified of a decision on your [insert abbrev] application? was it…
Base: Contacted service Canada (n=1296)
Aware Stage: Order Of Channel Use

Text description of graphs
Q1a. Which of the following did you use to find out about [INSERT PROGRAM] or [INSERT ABBREV] before you applied? Did you…
Q2. Thinking about the government information sources you used, which one did you use first?
Q3. Thinking about the government information sources you used, which one did you use second?
Base: All respondents (n=3639)
Apply Stage: Order Of Channel Use
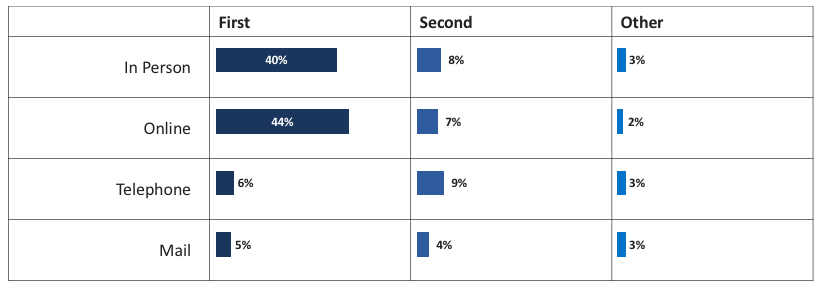
Text description of graphs
Q9bx. Thinking back to when you actually applied for benefits/an sin number], which of the following channels did you use when completing your application?
Q10x. Thinking about the government sources you used, which one did you use first?
Q11x. Thinking about the government sources you used, which one did you use second?
Base: Completed an application (n=3405)
Follow-up Stage: Order Of Channel Usage
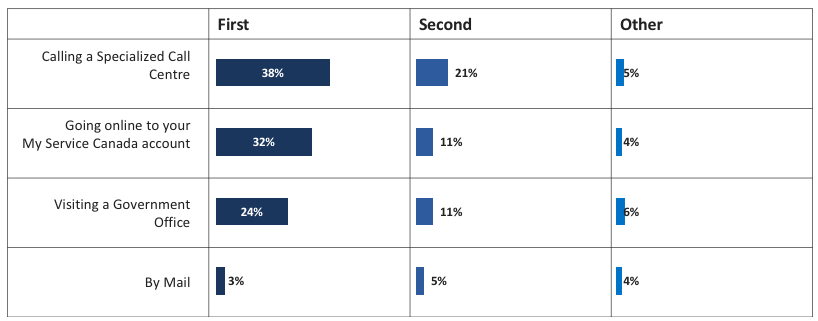
Text description of graphs
Q18. How did you contact the government before you were notified of a decision on your [INSERT ABBREV] application? Was it…
Q19a. Which method of contact did you use first?
Q19b. Which method of contact did you use second?
Base: Contacted Service Canada post-decision (n=1296)
Impact Of Number Of Channels On Impressions – Aware
| % Percent rating 4 or 5 |
TOTAL |
AWARE |
| 1 channel only |
2 or more channels |
3 or more channels |
|
A |
B |
C |
D |
| Find out the steps to apply |
80% |
84% |
74% |
65% |
| How confident were you that you had everything you needed to complete the application process |
80% |
82% |
77% |
74% |
| Find information about the program |
79% |
82% |
75% |
71% |
| Find out what information you need to provide when applying for the program |
78% |
81% |
74% |
70% |
| You were able to find the information you needed (online, in person or by phone) within a reasonable amount of time |
78% |
81% |
72% |
64% |
| Understand the information about the program |
76% |
80% |
71% |
68% |
| Figure out if you are eligible for benefits/SIN card |
75% |
77% |
70% |
66% |
Q6. How easy or difficult was it to get information about the following when you were getting information about [insert abbrev] before you applied?
Q7. How much do you agree or disagree that you were able to find the information you needed (online, in person or by phone) within a reasonable amount of time?
Q8. After you finished gathering information about [insert abbrev], how confident were you that you had everything you needed to complete the application process?
Base: All respondents (n=varies by statement)
Impact Of Number Of Channels On Impressions – Apply
| % Percent rating 4 or 5 |
TOTAL |
APPLY
|
| 1 channel only |
2 or more channels |
3 or more channels |
|
A |
B |
C |
D |
| Completing the form |
83% |
84% |
82% |
77% |
| Your application contained all of the information required |
83% |
85% |
81% |
78% |
| You were able to complete the application in a reasonable amount of time |
82% |
86% |
77% |
75% |
| Understanding the requirements of the application |
81% |
83% |
80% |
76% |
| Putting together the information you needed to apply for… |
78% |
81% |
77% |
71% |
| Your application would be processed in a reasonable period of time |
66% |
70% |
63% |
64% |
Q12. How much do you agree or disagree that you were able to complete the application in a reasonable amount of time? (Please use a scale of 1 to 5 where 5 means you agree strongly and 1 means you disagree strongly.)
Q13. On a scale of 1 to 5 where 5 is very easy through to 1 being very difficult, how would you rate the following when you were applying for [insert abbrev]?
Q14c. After you submitted your application for [INSERT ABBREV], how confident were you about each of the following? Please use a scale of a 5-point scale, (where 5 means you were very confident about it and 1 means you were very worried it might not be the case).
Base: All respondents (n=varies by statement)
Impact Of Number Of Channels On Impressions – Follow-up
| % Percent rating 4 or 5 |
TOTAL |
FOLLOW-UP
|
| 1 channel only |
2 or more channels |
3 or more channels |
|
A |
B |
C |
D |
| How easy or difficult was it to follow up with Service Canada about your application |
66% |
71% |
63% |
64% |
| Service Canada staff understood the importance of this application for you |
73% |
75% |
71% |
76% |
| Your application would be processed in a reasonable amount of time |
63% |
67% |
59% |
57% |
Q20a. Using a 5-point scale where 5 is very easy and 1 is very difficult, how easy or difficult was it to follow up with Service Canada about your application?
Q20b. After you contacted Service Canada to follow-up on your application for [INSERT ABBREV], how confident were you about each of the following? Please use a scale of 1 to 5, (where 5 means you were very confident about it and 1 means you were very worried that it might not be the case.) How confident or worried were you that… [INSERT ITEM]? Base: All respondents (n=varies by statement)
About IPSOS
Ipsos ranks third in the global research industry. With a strong presence in 87 countries, Ipsos employs more than 16,000 people and has the ability to conduct research programs in more than 100 countries. Founded in France in 1975, Ipsos is controlled and managed by research professionals. They have built a solid Group around a multi-specialist positioning – Media and advertising research; Marketing research; Client and employee relationship management; Opinion & social research; Mobile, Online, Offline data collection and delivery.
Ipsos is listed on Eurolist – NYSE – Euronext. The company is part of the SBF 120 and the Mid-60 index and is eligible for the Deferred Settlement Service (SRD).
ISIN code FR0000073298, Reuters ISOS.PA, Bloomberg IPS:FP
IPSOS website
Game Changers
At Ipsos we are passionately curious about people, markets, brands and society. We deliver information and analysis that makes our complex world easier and faster to navigate and inspires our clients to make smarter decisions.
We believe that our work is important. Security, simplicity, speed and substance applies to everything we do.
Through specialisation, we offer our clients a unique depth of knowledge and expertise. Learning from different experiences gives us perspective and inspires us to boldly call things into question, to be creative.
By nurturing a culture of collaboration and curiosity, we attract the highest calibre of people who have the ability and desire to influence and shape the future.
“GAME CHANGERS” – our tagline – summarises our ambition.