2018 National Radon Awareness Survey
Report
Contract number: HT372-17240/001/CY
Original contract date: 2018-01-19
POR Registration Number: POR 081-17
Prepared for:
Health Canada
Prepared by:
Environics Research Group
Report date: March 29, 2018
PA 9797
Ce rapport est aussi disponible en français
For more information on this report:
hc.cpab.por-rop.dgcap.sc@Canada.ca
Table of Contents
Radon is the second leading cause of lung cancer after smoking and the leading cause among non-smokers. Health Canada (HC) leads an ongoing National Radon Program (NRP) with the goal of reducing the health risks associated with radon exposure.
Public opinion research was conducted in 2007 and 2013 to understand knowledge and awareness of radon, and its associated risks among Canadians. Health Canada identified the need to conduct follow-on research, to help evaluate and measure the effectiveness of the efforts of the NRP over the last five years. The purpose of this research was to obtain insights into the knowledge, awareness, attitudes and behaviours of Canadians regarding radon. More specifically, the objectives of the research were:
The survey was conducted by Environics Research Group and is based on 1,903 telephone interviews conducted from February 5 to March 7, 2018. The sampling method was designed to complete at least 1,600 interviews with the target audience of Canadians 18 years of age and over living in private households, in the 10 provinces and three territoriesFootnote 1. Respondents were screened to ensure they were household decision-makers and residents of single family dwellings with ground floor or basement living space, as these are the primary audience for radon messagingFootnote 2. The base sample of 1,602 was stratified across five designated regions to ensure meaningful data and analysis at the regional level. An additional 301 oversample interviews were conducted with respondents living in identified radon-prone areasFootnote 3.
The random-probability sample was designed as follows:
| TOTAL SAMPLE | Canada | Atlantic | Quebec | Ontario | Prairies | B.C. | Territories | Radon-prone over-sample |
|---|---|---|---|---|---|---|---|---|
| 1,900 (+/- 2.2%) |
1,600 (+/- 2.4%) |
180 (+/- 7.3%) |
295 (+/- 5.7%) |
425 (+/- 4.7%) |
325 (+/- 5.4%) |
250 (+/- 6.2%) |
125 (+/- 8.7%) |
300 (+/- 5.6%) |
Margins of sampling error shown are at the 95% confidence level
The data are statistically weighted to ensure the sample is as representative of this population as possible (region, gender and age of primary household maintainer for private owned and rented households in Canada) according to the most recently available Census information. The margin of error for a sample of 1,903 is +/- 2.2 percentage points, in 19 out of 20 samples (margin of error is greater for subgroups). A more detailed descrip-tion of the methodology is presented at the back of the report, along with a copy of the questionnaire (see Appendix).
This wave of research reveals a growing awareness of aspects of radon among Canadian householders. The proportion aware of radon is the same as in 2013, but considerably more can identify it as harmful to health without prompting, or know it is naturally occurring and comes from the ground. Self-rated knowledge of radon has increased noticeably. Although still minorities, more Canadians than in 2013 have heard something about their local radon levels, and more have had their home's radon level tested - including over one in ten in radon-prone areas - and more have considered testing. Half of those who have tested used a DIY kit, and one-third of these now say the kit was deployed for three months or longer. Strong majorities say they would test if they became concerned about radon in their home, and would remediate if the radon level was found to be high. Majorities are able to identify true from false statements about radon, except there is a continuing impression it is hard to remove from a home, which will likely always be the case unless householders are able to undertake remediation themselves or for under $1,000.
There continue to be areas identified by the survey where additional work is required to encourage Canadians to take action on radon. Householders consistently point to lack of information as a barrier to home radon testing; the next biggest barrier is not feeling it is enough of a personal risk. Radon is not spontaneously identified as a public or government concern, and there is not a lot of awareness about how radon levels can be reduced, or how long a test should be deployed for accurate detection of radon levels. However, the research also provides guidance for what messaging might be best to convince Canadians radon is an issue worthy of their attention. Householders are most likely to think making radon testing a requirement for buying or selling a home or hearing the community has high levels of radon would be effective ways to convince people to have the radon level in their home reduced.
The following summarizes the key findings from the research:
The research findings will be used to help guide the future objectives, research and outreach activities of the National Radon Program, to maximize the effectiveness of the program and encourage and enable Canadians to take actions to reduce their radon exposure.
The cost of this research was $97,709.97 (HST included).
I hereby certify as a Senior Research Associate of Environics Research Group that the deliverables fully comply with the Government of Canada political neutrality requirements outlined in the Communications Policy of the Government of Canada and Procedures for Planning and Contracting Public Opinion Research. Specifically, the deliverables do not contain any reference to electoral voting intentions, political party preferences, standings with the electorate, or ratings of the performance of a political party or its leader.
Brenda Sharpe
Senior Research Associate, Corporate and Public Affairs
Environics Research Group
brenda.sharpe@environics.ca / 613.699.6886
Supplier name: Environics Research Group
PWGSC contract number: HT372-17240/001/CY
Original contract date: 2018-01-19
For more information, contact hc.cpab.por-rop.dgcap.sc@Canada.ca
Radon is a colourless, odourless, radioactive gas formed by the natural breakdown of uranium in soil, water and rock. It escapes from the ground into the outdoor air, where it becomes diluted and is not a source of concern. However, radon that enters an enclosed space, such as a home, can accumulate and be present at high levels, to which prolonged exposure can be harmful.
Radon exposure is second only to tobacco smoke as the most important cause of lung cancer and, according to estimates by the U.S. Environmental Protection Agency (EPA), it is the leading cause of lung cancer in non-smokersFootnote 4. Recent research estimates that 16 percent of lung cancer deaths among Canadians are attributable to indoor radon exposureFootnote 5. Radon gas, resulting from the natural breakdown of uranium in soil and rock, typically moves up through the ground into a home through cracks and other openings in a building's foundation. All homes have some level of radon, the only way to know how much and to ensure it is below the Canadian Guideline of 200 becquerels per cubic meter is to measure the level in the home.
Health Canada (HC) leads an ongoing National Radon Program (NRP) with the goal of reducing the health risks associated with radon exposure. A key component of the Program is outreach activities which inform Canadians of the increased risk of developing lung cancer associated with radon exposure, and encourages them to take action to reduce those risks at home and in their workplaces.
The first phase of the NRP focused on identifying the scope of the problem and communicating the health risks from indoor exposure to radon. The second phase of the program, which began in 2011, focused on communicating solutions and developing resources for householders and key stakeholder groups with the intent of helping Canadians reduce the negative health impacts associated with indoor radon exposure.
Public opinion research was commissioned in 2007 to identify a baseline of knowledge and awareness of radon, and its associated risks among Canadians, and a follow-up survey was conducted in 2013. Health Canada identified the need to conduct further follow-on research, to help evaluate the effectiveness of the efforts of the NRP to date and to help inform and guide the program's future objectives, research and outreach activities.
As a follow-up to previous public opinion research conducted on the subject of radon, Health Canada identified the need to conduct research into Canadians' knowledge, awareness, attitudes and behaviours surrounding radon, to assess the progress made by the National Radon Strategy to date and to help guide future efforts.
Specific objectives for this research included:
The survey was conducted by Environics Research Group and is based on 1,903 telephone interviews conducted from February 5 to March 7, 2018. The sampling method was designed to complete at least 1,600 interviews with the target audience of Canadians 18 years of age and over living in private households, in the 10 provinces and three territoriesFootnote 6. Respondents were screened to ensure they were household decision-makers and residents of single family dwellings with ground floor or basement living space, as these are the primary audience for radon messagingFootnote 7. The base sample of 1,602 was stratified across five designated regions to ensure meaningful data and analysis at the regional level.
An additional 301 oversample interviews were conducted in the following radon-prone areas identified by Health Canada:
Some of the national interviews were conducted in communities identified by Health Canada as having higher levels of radon (n=120, or 7%), and these are grouped with the oversample interviews as "radon-prone" in the analysis that follows. More details about the methodology can be found in Appendix A.
For simplicity, locations outside of the identified radon-prone areas are sometimes called "not radon-prone," but this does not necessarily reflect the actual radon status of each community.
The tracking data shown in this report are from the 2007 and 2013 National Radon and Indoor Air Quality Surveys, both conducted by Environics on behalf of Health Canada. The 2007 survey employed the same screening criteria as the 2013 study; however, that survey did not interview in the three northern territories. The 2018 study population differed from both its predecessors in that renters were also included, provided they were household decision-makers and their accommodation had living space on or below ground level.
This report begins with an executive summary outlining key findings and conclusions, followed by a detailed analysis of the survey data. Provided under a separate cover is a detailed set of "banner tables" presenting the results for all questions by population segments as defined by region and demographics. These tables are referenced by the survey question in the detailed analysis.
In this report, results are expressed as percentages unless otherwise noted. Results may not add to 100% due to rounding or multiple responses. Net results cited in the text may not exactly match individual results shown in the charts due to rounding.
Questions were asked about awareness of radon, what had been seen or heard about it, and where this information was obtained. Respondents indicating any awareness of radon were then asked to rate their level of knowledge, following which specific questions probed actual knowledge about radon, about its occurrence in homes and about radon testing kit availability. Information about the current radon knowledge levels of Canadians aids in developing effective policies and communications messages around radon.
As in 2013, two-thirds of Canadians say they have heard of radon; mostly that it is a gas, comes from the ground, and is a health hazard.
Awareness of radon. Two-thirds of Canadian householders (64%) indicate they had heard of radon, the same level as in 2013. One-third have not.
Have heard of radon
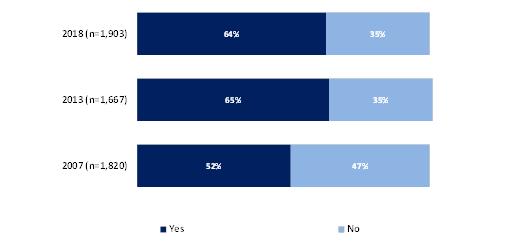
Have you ever heard of radon? (2007: Before this survey, had you ever heard of radon?) (2018 n=1,903; 2013 n=1,667; 2007 n=1,820)
| Q1 | Yes | No |
| 2018 (n=1,903) | 64% | 35% |
| 2013 (n=1,667) | 65% | 35% |
| 2007 (n=1,820) | 52% | 47% |
Have heard of radon - by region
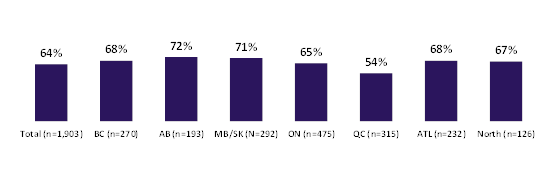
Q.1 Have you ever heard of radon? (2007: Before this survey, had you ever heard of radon?)
(2018 n=1,903; 2013 n=1,667; 2007 n=1,820)
| Q1 | 2018 |
| Total (n=1,903) | 64% |
| BC (n=270) | 68% |
| AB (n=193) | 72% |
| MB/SK (N=292) | 71% |
| ON (n=475) | 65% |
| QC (n=315) | 54% |
| ATL (n=232) | 68% |
| North (n=126) | 67% |
In this wave, awareness is similar across the country but lower in Quebec (54%) and in rural areas (55%) than elsewhere. As in previous waves, awareness is higher in radon-prone areas (80%) than elsewhere (60%). Awareness is also higher among homeowners (67%) than renters (44%).
There continues to be a gender difference, with reported awareness of radon higher among men (72%) than women (57%). The age differences also continue, with awareness increasing as age increases, from 26 percent under age 30 to 70 percent age 60 and over. As in previous waves, radon awareness increases proportionately with increased socioeconomic level and is highest among those with a university degree (75%) and those with the highest household incomes (76% with $100,000 and over). It is not noticeably among higher smokers, but is higher among those with no children under age 16, which correlates to age.
What was seen or heard about radon. Those with any awareness of radon were asked what they recall seeing or hearing about it; multiple mentions were permitted. One-quarter say it is toxic, poisonous or hazardous to health (including cancer) and an additional two in ten mention it being harmful or dangerous, making negative health effects (net 45%) the top thing known about radon. Three in ten mention it comes from the ground/rocks/seeps into basements. One-quarter (24%) mention it is a gas.
One in ten or fewer spontaneously mention any other fact about radon, such as it being detectable in buildings (10%) or found in homes that are poorly ventilated (9%).
What was heard/seen about radon (unprompted)

Q.2 What do you recall hearing or seeing about radon?
Subsample: Those who have heard of radon (2018 n=1,333; 2013 n=1,136; 2007 n=1,098)
| Q2 | 2018 (n=1,333) | 2013 (n=1,136) | 2007 (n=1,098) |
| Radon is toxic/harmful/poisonous/hazardous to health/carcinogenic | 45% | 29% | 21% |
| Comes from ground/rocks/enters basements/ | 29% | 35% | 30% |
| Radon is a gas (general) | 24% | 26% | 20% |
| Detectable/detectors exist/test building | 10% | 9% | 8% |
| Found in homes/poorly ventilated | 9% | 6% | 4% |
| Radioactive | 7% | 5% | 8% |
| Hard to detect/sense | 6% | 7% | 4% |
| Recall where heard about radon | 4% | 7% | 4% |
| Natural occurrence | 4% | 4% | 3% |
| Recognize name/heard of it | 3% | 7% | 0% |
| From electronic devices/appliances/building materials | 2% | 8% | 4% |
| Other mentions | 14% | 9% | 10% |
| Don't know | 9% | 14% | 20% |
Comments are generally similar across the country, in urban or rural areas, and in radon-prone and non-radon-prone areas. Spontaneous mentions of detectors or testing being available are somewhat higher in the North and the Atlantic region than elsewhere.
There are only a few notable gender differences. Men are more likely than women to say that radon comes from the ground (23% vs. 14%), or that it is a radioactive gas (11% vs. 3%); women are more likely than men to mention detectors or tests (13% vs. 8%). Responses are quite similar by other demographic factors. Those who later in the survey indicate they have had their home's radon level tested are more likely to mention detectors or tests (29%) than those who have not tested (8%).
Later in the survey, Canadians were asked to self-rate their level of knowledge about radon. Echoing previous waves, those who say they have a lot or some radon knowledge are more likely to provide details about radon than are those who say they have almost no knowledge. In particular, more knowledgeable householders are more likely to note radon is toxic, poisonous, harmful or carcinogenic (33% vs. 18%), enters the home through the foundation (15% vs. 7%) or that it is a radioactive gas (18% vs. 2%).
The media remains the most commonly cited source of information about radon.
Those aware of radon were asked where they saw or heard something about it. Multiple mentions were permitted. Media remains the most frequently cited source, by a considerable margin, with over half (55%) mentioning hearing about radon through TV, newspapers, magazines or radio. One in ten or fewer mention any other single source, such as friends or family (11%), work (8%) or school (7%). Eleven percent cannot recall where they heard or saw something about radon. These results are generally similar to previous waves, with a small decrease in media mentions and a moderate increase in reporting friends and family (word of mouth) sources.
Where information on radon was heard or seen
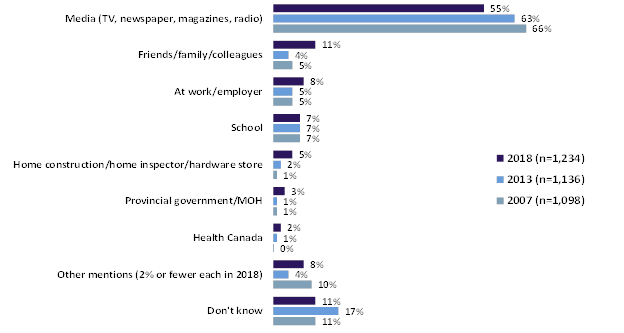
Q.3 Where did you hear or see something about radon?
Subsample: Those who heard or saw something about radon (2018 n=1,234; 2013 n=1,136; 2007 n=1,098)
| Q3 | 2018 (n=1,234) | 2013 (n=1,136) | 2007 (n=1,098) |
| Media (TV, newspaper, magazines, radio) | 55% | 63% | 66% |
| Friends/family/colleagues | 11% | 4% | 5% |
| At work/employer | 8% | 5% | 5% |
| School | 7% | 7% | 7% |
| Home construction/home inspector/hardware store | 5% | 2% | 1% |
| Provincial government/MOH | 3% | 1% | 1% |
| Health Canada | 2% | 1% | 0% |
| Other mentions (2% or fewer each in 2018) | 8% | 4% | 10% |
| Don't know | 11% | 17% | 11% |
Sources for radon information remains generally similar by subgroup. Mentions of the media as the information source remain highest in Quebec (65%), among those age 60 and over (63%), those with high school or less education (66%) and smokers (66%). British Columbians are the most likely to mention friends and family/word of mouth (17%). There are no notable differences in mentions between owners and renters, and there continue to be no notable differences by those living in radon-prone areas vs. non-radon-prone areas.
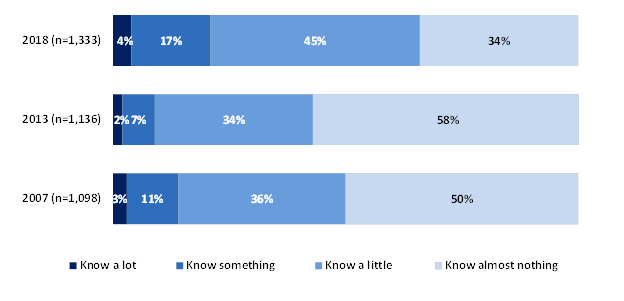
Two-thirds now say they know at least a little about radon; one-third (down from six in ten) admit they know almost nothing about it.
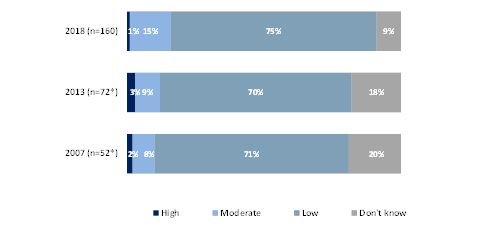
Those saying they had heard of radon were asked to self-rate their level of knowledge about it, using a four-point scaleFootnote 8. It should be noted that, as in previous waves, this question was asked immediately after an open-ended question "From what you may know or have heard, what is radon?" which can be expected to discourage respondents from over-rating their knowledge. Two in ten (up from one in ten in 2013) say they know a lot (4%) or something (17%) about radon. Close to half (45%, up from 34%) now indicate they know "a little" about it, while one-third (34%, down from six in ten) admit they know "almost nothing".
Rating of personal knowledge about radon
Q.5 Would you say you know a lot, know something, know a little, or know almost nothing at all about radon?
Subsample: Those who have heard of radon (2018 n=1,333; 2013 n=1,136; 2007 n=1,098)
NOTE: In each year, those saying "Don't know" to the previous question ("What is radon?") were not asked this question, but appear in the tabulation above as part of the proportion saying "know almost nothing."
| Q5 | Know a lot | Know something | Know a little | Know almost nothing |
| 2018 (n=1,333) | 4% | 17% | 45% | 34% |
| 2013 (n=1,136) | 2% | 7% | 34% | 58% |
| 2007 (n=1,098) | 3% | 11% | 36% | 50% |
In this wave, there continues to be little difference in reporting a lot or some knowledge of radon by whether someone resides in a radon-prone area, but those living in radon-prone areas are less likely (27%) than those living in non-radon-prone areas (37%) to say they know almost nothing. There is no difference in rated self-knowledge between homeowners and renters who are aware of radon.
Knowing at least something about radon is highest in the three northern territories (33%, compared to between 17 to 25 percent elsewhere). As in 2013, men are more likely (24%) than women (16%) to say they know at least something about radon, and this also remains highest among those with a university degree (25%) and household incomes of $100,000 or more (28%). Knowledge is higher among those who, later in the survey, indicate they have had their home tested for radon.
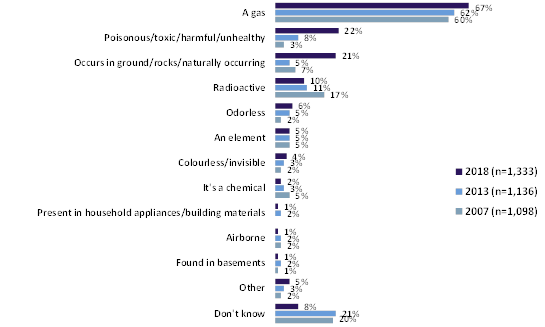
Two-thirds who have heard of radon know it is a gas; two in ten spontaneously mention it is harmful. Majorities know most true statements about radon are true and that false statements are false, but the majority also continues to believe it is hard to remove radon from a home.
What is radon? Those who were aware of radon were asked what radon is (unprompted). Multiple mentions were permitted. Two-thirds (67%, up five percentage points) correctly say it is a gas, and two in ten each now say it is unhealthy, poisonous or toxic (22%, up from 8%) or that it is naturally occurring or in the ground (21%, up from 5%). One in ten mention it is radioactive (10%, similar to 2013). Fewer indicate any other single fact about it. Fewer than one in ten (8%, down from 21%) say they don't know anything about radon.
What is radon?
Q.4 From what you may know or have heard, what is radon?
Subsample: Those who have heard of radon (2018 n=1,333; 2013 n=1,136; 2007 n=1,098)
| Q4 | 2018 (n=1,333) | 2013 (n=1,136) | 2007 (n=1,098) |
| A gas | 67% | 62% | 60% |
| Poisonous/toxic/harmful/unhealthy | 22% | 8% | 3% |
| Occurs in ground/rocks/naturally occurring | 21% | 5% | 7% |
| Radioactive | 10% | 11% | 17% |
| Odorless | 6% | 5% | 2% |
| An element | 5% | 5% | 5% |
| Colourless/invisible | 4% | 3% | 2% |
| It's a chemical | 2% | 3% | 5% |
| Present in household appliances/building materials | 1% | 2% | 0% |
| Airborne | 1% | 2% | 2% |
| Found in basements | 1% | 2% | 1% |
| Other | 5% | 3% | 2% |
| Don't know | 8% | 21% | 20% |
Being able to provide unprompted information about radon remains generally similar among residents of radon-prone areas and those living elsewhere. Mentioning it is a health concern/toxic/poisonous is higher in Quebec (37%) than elsewhere; knowing it is radioactive is somewhat higher in BC (18%) and the North (19%). There are no notable differences in specific mentions between homeowners and renters who are aware of radon, but renters are more likely than homeowners not to be able to indicate anything (19% vs. 7%).
Men are more likely than women to mention radon is a gas (71% vs, 62%), that it comes from the ground (25% vs. 16%), and that it is radioactive (14% vs, 6%), but other mentions are similar by gender. Being able to mention at least something about radon is linked to higher levels of education and income.
As in previous waves, this question confirms those who rate their radon knowledge level as "a lot" or "some" are able to give more correct information in an unprompted manner than those who say they have little or no knowledge. In this wave, however, those who say they only know a "little" are about as likely as those who know more to make several correct mentions, for example that radon is a gas, that it comes from the ground, that it is an element or colourless. They are still somewhat less likely to state it is radioactive or odourless. Those who later indicate they have had their home tested for radon are more likely than those who have not to know radon comes from the ground/is naturally occurring.
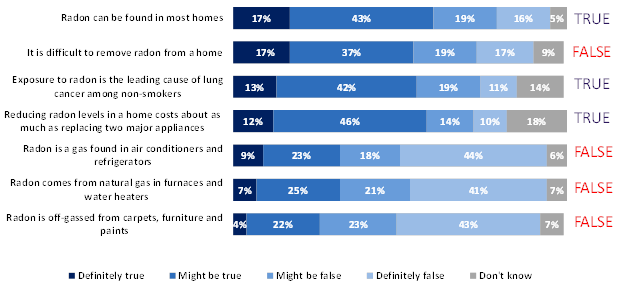
Radon knowledge. Respondents who had heard about radon were read a series of seven statements about radon and asked if they thought each of the statements is true or false, and also to indicate their certainty (i.e., definitely true/false or might be true/false); the statements were randomized to prevent order bias.
Householders are most likely to think it is true that "radon can be found in most homes" (60% at least likely true; 17% definitely). Just under six in ten each also feel it at least might be true that exposure to radon is the leading cause of lung cancer among non-smokers (55%), and that reducing radon level in a home costs about as much as replacing two major appliances (58%). However, over half also feel it at least may be true that "It is difficult to remove radon from a home" (54% net true, with 17% saying it is definitely true), indicating a further need to increase awareness about radon reduction: that it is quite easy to arrange and comparable in price to many other home maintenance projectsFootnote 9.
Minorities of one-third or fewer think three false statements about radon might be true: that it is gas found in air conditioners and refrigerators (indicating confusion with Freon/chlorofluorocarbons; that it comes from natural gas in furnaces and water heaters; or that it is off-gassed from carpets, furniture and paints (indicating confusion with volatile organic compounds/VOCs).
Radon knowledge
Q.6 Now I am going to read some statements. For each statement, please tell me if you think it is definitely true, might be true, might be false or is definitely false.
Subsample: Those who have heard of radon (n=1,333)
| Q6 | Definitely true | Might be true | Might be false | Definitely false | Don't know |
| Radon can be found in most homes | 17% | 43% | 19% | 16% | 5% |
| It is difficult to remove radon from a home | 17% | 37% | 19% | 17% | 9% |
| Exposure to radon is the leading cause of lung cancer among non-smokers | 13% | 42% | 19% | 11% | 14% |
| Reducing radon levels in a home costs about as much as replacing two major appliances | 12% | 46% | 14% | 10% | 18% |
| Radon is a gas found in air conditioners and refrigerators | 9% | 23% | 18% | 44% | 6% |
| Radon comes from natural gas in furnaces and water heaters | 7% | 25% | 21% | 41% | 7% |
| Radon is off-gassed from carpets, furniture and paints | 4% | 22% | 23% | 43% | 7% |
The following are subgroups with higher proportions saying each statement is definitely true:
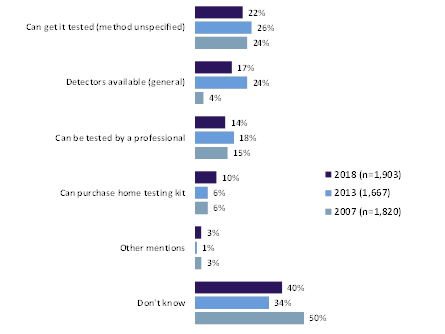
Spontaneous awareness that radon levels can be detected by some form of testing has marginally decreased; awareness of where to buy testing kits had remained stable. Not many know testing should last at least three months to be accurate; ventilation remains the most cited remediation method.
How radon can be detected. Following the radon knowledge questions, all respondents were read the following statement about radon (note this is a somewhat different statement than in previous waves):Here are some facts about radon. Radon is a radioactive gas that is colourless, odorless and tasteless. It is formed by the natural breakdown of uranium in soil, rock and water. Radon gas comes up from the ground. When radon escapes outdoors, it is not a concern. However, radon that enters an enclosed space, like a home, can accumulate and become a health hazard. All homes have some level of radon. Long term exposure to high levels of radon is the second leading cause of lung cancer after smoking, and the number one cause for non-smokers.
Householders were then asked, unprompted, if they know how people can find out if there is a high level of radon in their home. Multiple mentions were permitted.
There has been a slight decrease in the proportion mentioning some form of radon test being available. Two in ten (22%, down four points) say one can test for radon, but do not elaborate. Just under two in ten (17%, down from 24%) say generally that detectors are available. Under two in ten (14%, down from 18%) mention radon can be tested for by a professional, and one in ten (up four points) specifically mention purchasing a home testing kit. Four in ten (40%, up six points) do not know how someone can find out their home's radon level.
How to find out if there is a high level of radon in the home
Q.7 Do you know how people can find out if there is a high level of radon in their home?
(2018 n=1,903; 2013 n=1,667; 2007 n=1,820)
| Q7 | 2018 (n=1,903) | 2013 (1,667) | 2007 (n=1,820) |
| Can get it tested (method unspecified) | 22% | 26% | 24% |
| Detectors available (general) | 17% | 24% | 4% |
| Can be tested by a professional | 14% | 18% | 15% |
| Can purchase home testing kit | 10% | 6% | 6% |
| Other mentions | 3% | 1% | 3% |
| Don't know | 40% | 34% | 50% |
Not knowing about any kind of testing available for radon is similar across the country but is somewhat higher in Quebec (49%) and Ontario (41%) than elsewhere (26% to 36%), and higher among those residing in non-radon-prone communities (43% vs. 29% in identified radon-prone areas). Mentioning home testing kits is higher in radon-prone areas (18%) than elsewhere (8%).
Generally knowing that testing is available is higher among men (25% vs. 19% of women), among those over age 30 (22-26%) than younger people (4%), and among those with a university degree (26%) and household incomes of $100,000 and over (28%). Mentioning any method is higher among those who were aware of radon prior to the survey.
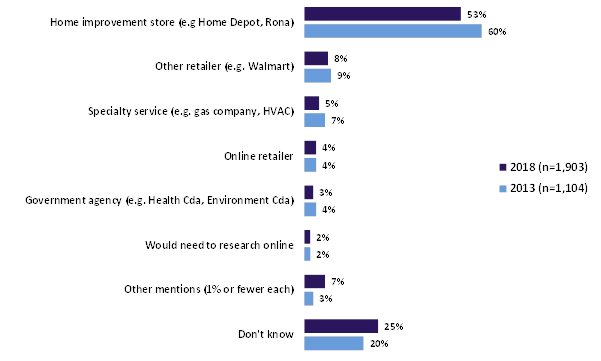
Where DIY radon testing kits can be purchased. Householders were told DIY radon testing kits are available, and then asked where they would go to purchase one. Multiple mentions were permitted. Over half (53%) mention these kits are available at home improve-ment stores, such as Home Depot or Rona. One in ten or fewer mention other sources, such as other retailers, speciality services (like gas or HVAC suppliers) or online retailers. Note that in 2013, when this question was asked of a Subsample of homeowners who knew people could test for radon, responses were generally similar.
Where DIY radon testing kits can be purchased
Q.8 Do-it-yourself radon testing kits are available for purchase. Where would you go to purchase one?
2018: Asked of all (n=1,903)
2013 Subsample: Those who mentioned radon testing as a way to find out if there is a high level of radon in a home (n=1,104)
| Q8 | 2018 (n=1,903) | 2013 (n=1,104) | ||
| Home improvement store (e.g Home Depot, Rona) | 53% | 60% | ||
| Other retailer (e.g. Walmart) | 8% | 9% | ||
| Specialty service (e.g. gas company, HVAC) | 5% | 7% | ||
| Online retailer | 4% | 4% | ||
| Government agency (e.g. Health Cda, Environment Cda) | 3% | 4% | ||
| Would need to research online | 2% | 2% | ||
| Other mentions (1% or fewer each) | 7% | 3% | ||
| Don't know | 25% | 20% | ||
That DIY radon tests can be found in home improvement stores is the dominant response across the country and across population subgroups, although somewhat lower in Quebec (43%) than elsewhere (52% to 57%). Quebecers remain the most likely to mention some other type of retailer (15%). Mentions of speciality retailers are highest in Manitoba/Saskatchewan (10%); Northerners are the most likely to mention a government agency (17%). Mentions of home improvement stores are higher in urban communities (54% vs, 39% rural). There are no important differences by radon status of the community or by whether someone rents or owns their home.
In this wave there are no notable differences in response by gender or age, but mentioning a home improvement store is higher among those with a university degree, while those in the lower socioeconomic strata are the most likely not to be able to say where DIY kits can be found. There are no important differences in this wave by self-rated radon knowledge level or by whether or not someone has tested their home for radon; those who were previously aware of radon are more likely to be able to give some response than those who were not aware.
Period of time for radon testing. A new question in 2018 asked respondents to indicate how long they think a testing kit needs to be kept in the home to accurately detect the level of radon. Just under six in ten (57%) cite some period less than three months; one in ten say three months or more, and one-third are not able to respond.
How long radon testing kits should be kept in the home
(Total sample n=1,903)
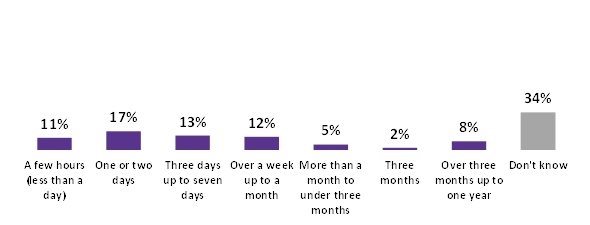
Q.9 How long do you think a testing kit needs to be kept in the home to accurately detect the level of radon?
(2018 n=1,903)
| Q9 | 2018 |
| A few hours (less than a day) | 11% |
| One or two days | 17% |
| Three days up to seven days | 13% |
| Over a week up to a month | 12% |
| More than a month to under three months | 5% |
| Three months | 2% |
| Over three months up to one year | 8% |
| Don't know | 34% |
Saying some time period less than three months is the dominant response across the country and all subgroups. Saying three months or more is still a minority, but slightly higher among, those who rate their radon knowledge as a lot or some (16%, vs. 7-9% of others), those who were previously aware of radon (10%) and those who have had their home tested for radon (24%).
Remediating radon in a home. There has been no notable change in the proportion of people able to spontaneously say how home radon levels can be reduced. Residents were asked (unprompted) what, if anything, people can do to reduce the amount of radon in a home (multiple mentions were permitted). Responses are basically unchanged from 2013. Just over four in ten offer some suggestion, with the most mentioned way continuing to be increasing ventilation or using mechanical or heat recovery/HRV ventilators or exchangers (20%). One in ten (9%) mention sealing cracks in the foundation. There has been no statistical increase in the proportion mentioning sub-slab depressurization systems (3%). Just under six in ten (55%) offer no suggestion about how radon levels can be reduced in homes.
How home radon levels can be reduced
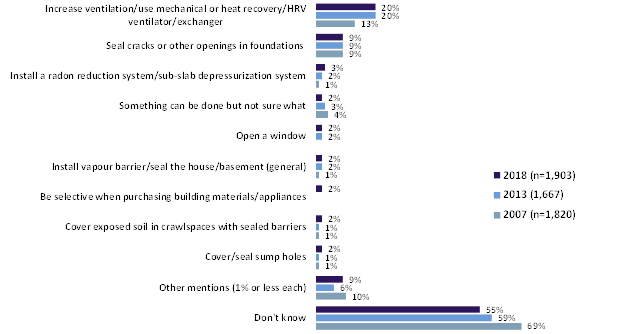
Q.10 And do you know what, if anything, people can do to reduce the amount of radon in a home?
(2018 n=1,903; 2013 n=1,667; 2007 n=1,820)
| Q10 | 2018 (n=1,903) | 2013 (n=1,667) | 2007 (n=1,820) |
| Increase ventilation/use mechanical or heat recovery/HRV ventilator/exchanger | 20% | 20% | 13% |
| Seal cracks or other openings in foundations | 9% | 9% | 9% |
| Install a radon reduction system/sub-slab depressurization system | 3% | 2% | 1% |
| Something can be done but not sure what | 2% | 3% | 4% |
| Open a window | 2% | 2% | 0 |
| Install vapour barrier/seal the house/basement (general) | 2% | 2% | 1% |
| Be selective when purchasing building materials/appliances | 2% | 0% | 0% |
| Cover exposed soil in crawlspaces with sealed barriers | 2% | 1% | 1% |
| Cover/seal sump holes | 2% | 1% | 1% |
| Other mentions (1% or less each) | 9% | 6% | 10% |
| Don't know | 55% | 59% | 69% |
While mentions are generally similar across the country and subgroups, there are a few differences. Mentions of increased ventilation are highest in Alberta (27%) and the North (31%); mentions of sub-slab depressurization are still low but marginally higher in the Atlantic (7%). Residents of Quebec are the most likely not to be able to indicate a remediation method (66% don't know).
Men are more likely than women to mention ventilation (26% vs. 14%) or sealing cracks (12% vs. 6%), and citing these two methods is also linked to higher levels of education and income, and to having previously tested for radon. Being able to name at least one radon remediation option is somewhat higher among those living in a radon-prone community and among those aware of radon.
An important objective of this survey is to identify the extent to which Canadians have had previous experience with radon testing or remediation, and to understand the extent to which messages about radon testing have been heard, especially in radon-prone areas. All respondents were asked about whether they have heard about radon levels in their community, and if they have had their home tested or ever considered testing - and, if they have not, why not. Those without experience with radon testing were then skipped to the next section, while those who have had testing done were asked more about this experience.
One in ten Canadians - two in ten living in a radon-prone area - have heard or seen something about radon levels in their community. Two in ten who have heard something say it was that local radon levels are high, or that radon exists in their community.
Community radon level. Canadians were asked if they recall ever seeing or hearing anything about radon levels in their community. Although only one in ten (9%) have, this is double the previously observed rate. Nine in ten have not heard anything.
Heard or saw something about community radon levels
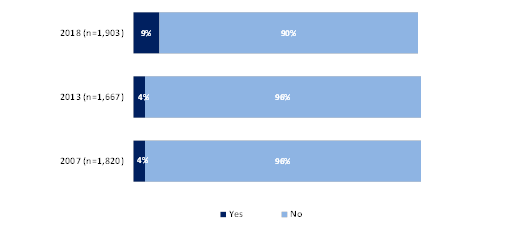
Q.11 Do you recall ever seeing or hearing anything about indoor radon levels in your community? (2007: Do you recall ever seeing or hearing anything about radon levels in your community?) (2018 n=1,903; 2013 n=1,667; 2007 n=1,820)
| Q11 | Yes | No |
| 2018 (n=1,903) | 9% | 90% |
| 2013 (n=1,667) | 4% | 96% |
| 2007 (n=1,820) | 4% | 96% |
Regionally, having heard something about community radon levels ranges from a low of 7 percent in Quebec to a high of 28 percent in the North. There is no difference between urban and rural areas. As in previous years, having heard something is higher in radon-prone areas (19%) than other areas (6%).
Having heard or seen something about community radon levels is similar by gender and age, but is somewhat higher among those with a university degree (12%). Although there is a very small base, it appears higher among people who have been diagnosed with lung cancer. It remains higher among those who were aware of radon (13% vs. 2%) and among those who claim to have a lot or some knowledge of radon (21% vs. 13% of those with little knowledge and 8% of those with almost none). As with other measures, it is higher among those who have tested their home for radon (25% vs. 8%).
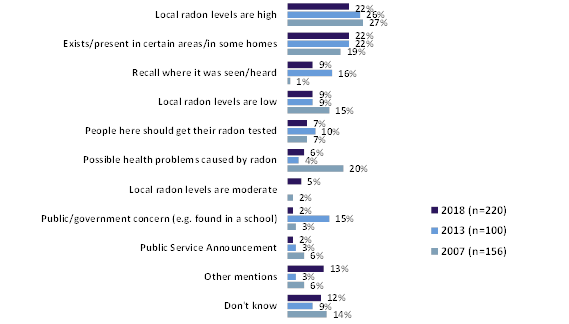
What was seen or heard about community radon level. Those who indicated they have heard or seen something about the level of radon in their community (9% of householders) were asked what they recall about this. The most frequently mentioned messages, cited by almost one quarter each, is that local radon levels are high or that radon exists in their community. Fewer in this wave mention where they heard or saw a mention of radon, or that radon is a public concern. Other mentions are generally similar to 2013.
What was heard or seen about community radon levels
Q.12 Can you tell me what it was that you recall hearing or seeing (about radon levels in your community)?
Subsample: Those who have heard or seen something about community radon levels (2018 n=220; 2013 n=100; 2007 n=156)
| Q12 | 2018 (n=220) | 2013 (n=100) | 2007 (n=156) |
| Local radon levels are high | 22% | 26% | 27% |
| Exists/present in certain areas/in some homes | 22% | 22% | 19% |
| Recall where it was seen/heard | 9% | 16% | 1% |
| Local radon levels are low | 9% | 9% | 15% |
| People here should get their radon tested | 7% | 10% | 7% |
| Possible health problems caused by radon | 6% | 4% | 20% |
| Local radon levels are moderate | 5% | 0% | 2% |
| Public/government concern (e.g. found in a school) | 2% | 15% | 3% |
| Public Service Announcement | 2% | 3% | 6% |
| Other mentions | 13% | 3% | 6% |
| Don't know | 12% | 9% | 14% |
In general, responses are similar across the country and most subgroups. Most subgroup bases are too low to allow for deeper analysis.
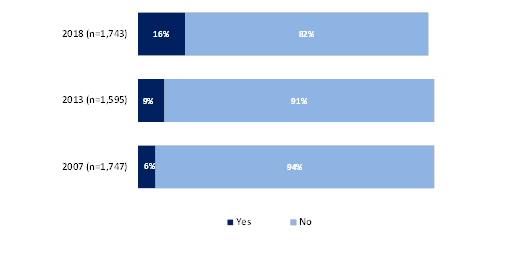
Six percent of Canadians - twelve percent in radon-prone areas - have had the radon level in their home tested. Among those who have not yet tested, more - 16 percent nationally, 29 percent in radon-prone areas - say they have considered radon testing.
All Canadian householders, including those who indicated they were not previously aware of radon, were asked if they have ever had the radon levels in their home tested. Six percent say they have, still a small minority but double the 2013 proportion. In radon-prone areas, 12 percent report having had a radon test.
Have had radon levels in home tested
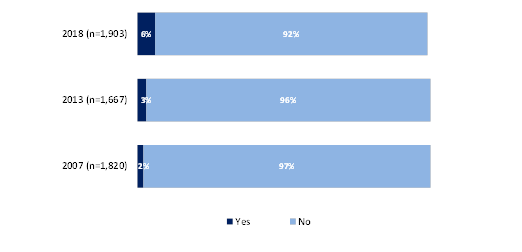
Q.13 Have you ever had the radon levels in your home tested? (2018 n=1,903; 2013 n=1,667; 2007 n=1,820)
| Q13 | Yes | No |
| 2018 (n=1,903) | 6% | 92% |
| 2013 (n=1,667) | 3% | 96% |
| 2007 (n=1,820) | 2% | 97% |
The proportion of householders indicating they have had a radon test conducted remains higher in the northern territories (20%) than elsewhere (ranging from 2% in Quebec to 12% in Alberta, where Calgary was part of the radon-prone oversample). There are no notable demographic differences, but having a radon test is linked to previously awareness of radon (9% vs 2%), and, as in 2013, to having a lot or some knowledge about radon (19% of these say they have had a radon test, compared to 9% with only a little knowledge and 3% with almost no knowledge).
Those who have not had their home's radon levels tested were asked if they have ever considered radon testing. Sixteen percent have considered it, almost double the nine percent of 2013.
Considered having home tested for radon
Q.14 Have you ever considered having the radon levels in your home tested?
Subsample: Those who have not had the radon levels in their home tested (2018 n=1,743; 2013 n=1,595; 2007 n=1,747)
| Q14 | Yes | No |
| 2018 (n=1,743) | 16% | 82% |
| 2013 (n=1,595) | 9% | 91% |
| 2007 (n=1,747) | 6% | 94% |
Having considered getting a radon test is statistically higher in radon-prone (29%) than not-radon-prone areas (13%). Considering radon testing is lowest in Quebec (7%) and highest in Alberta (29%, which this year includes radon-prone Calgary). Considering testing is higher in urban centres this year (16% vs. 9%, which again may be a reflection of having larger centres like Calgary, Halifax and Regina in the radon-prone oversample). It is notably higher among home owners (17%) than renters (9%), and among men (21% vs. 12% of women). Having thought about radon testing increases along with increases in level of education and household income. As in 2013 it is higher among those who had previously heard of radon (23% vs. 4%) and among those who say they have a lot or some knowledge of radon (37%, vs. 28% with a little knowledge and 11% with almost none). The very small number who have personally been diagnosed with lung cancer also may be more likely to consider radon testing than those who have no diagnosis in the household.
Lack of information and lack of concern remain the most frequently mentioned reasons for not having homes tested for radon level.
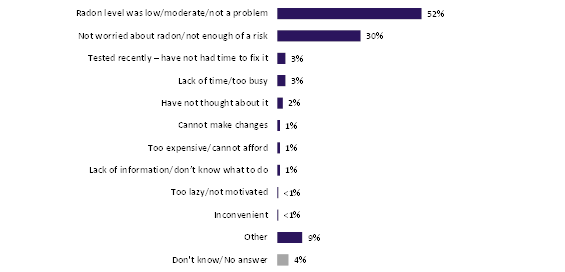
This year, all of those who have not yet had their radon levels tested were asked why they have not had this done. As in previous waves, the main reasons are lack of information and lack of concern.
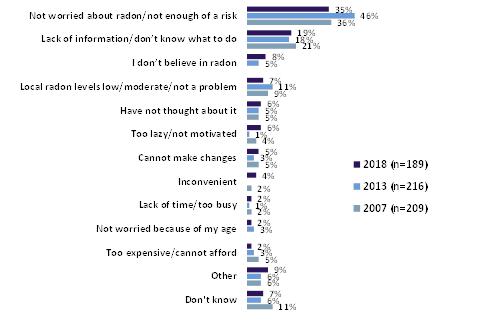
Four in ten say have not had their radon levels tested because they don't know what to do about radon testing/lack of information (42%). Note this is higher than in 2013, when the question was asked only of those who had considered testing or had heard about radon levels in their community; however, this year's result better indicates the extent to which lack of information is a barrier to the wider householder population. About one-third say they have not had radon levels tested due to lack of concern: because they are not worried about radon or that it is not enough of a risk (26%), or that their local levels are not a problem (6%); these results are both similar to 2013.
Other personal reasons include not having thought about it (17%), a lack of time (5%), being lazy/unmotivated (3%), or presumed inconvenience or expense (2%). Few (4%) do not indicate a reason for not testing.
Why home radon has not been tested
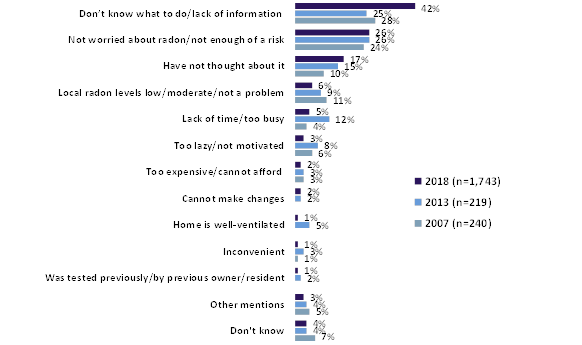
Q.15 Why have you not had the radon levels in your home tested?
Subsample: Those who have not had radon tested (2018: n=1,743)
(2013 and 2007: Those who have not had radon tested but considered having it tested or at least heard about radon levels in their community: 2013 n=219; 2007 n= 240)
| Q15 | 2018 (n=1,743) | 2013 (n=219) | 2007 (n=240) |
| Don't know what to do/lack of information | 42% | 25% | 28% |
| Not worried about radon/not enough of a risk | 26% | 26% | 24% |
| Have not thought about it | 17% | 15% | 10% |
| Local radon levels low/moderate/not a problem | 6% | 9% | 11% |
| Lack of time/too busy | 5% | 12% | 4% |
| Too lazy/not motivated | 3% | 8% | 6% |
| Too expensive/cannot afford | 2% | 3% | 3% |
| Cannot make changes | 2% | 2% | 0% |
| Home is well-ventilated | 1% | 5% | 0% |
| Inconvenient | 1% | 3% | 1% |
| Was tested previously/by previous owner/resident | 1% | 2% | 0 |
| Other mentions | 3% | 4% | 5% |
| Don't know | 4% | 4% | 7% |
Not knowing what to do about radon testing is the top response across the country; however, residents of Quebec are also the most likely (38%) to mention that radon is not enough of a risk to worry about. Not knowing what to do is mentioned more by renters (51% vs. 40% of homeowners), and by women (47% vs. 36% of men), younger residents, those with less than a university degree, and those not previously aware of radon or who say they know almost nothing about it. Not knowing what to do is also cited more by people living outside of radon-prone areas (44% vs. 32% in radon-prone locations). Other responses are generally similar whether someone lives in a radon-prone area or not, except for lack of time, which is somewhat more mentioned by radon-prone area residents (11% vs. 3%).
Two-thirds report their home radon tested occurred in the past five years. DIY testing kits remain the most-cited method of testing, now used by half. Majorities say the radon level was low and no action was required.
Those who indicated they have had the radon level in their home tested (n=160) were asked a series of questions about their experiences. As in 2013, one-third of these (n=51) reside in radon-prone areas, while the balance (n=109) live outside of the designated radon-prone areas. Note that, because base sizes remain small, detailed analysis of these results by subgroup is not presented.
If radon was tested in the past five years. People who say they have had radon testing if it was tested in the past five years. Two-thirds say it was.
If radon was tested in the past five years
(Those who have had their home radon tested - n=160)
Q.16 Have you had your home tested for radon in the past five years?
Subsample: Those who had their home radon tested (n=160)
Note: In 2013 respondents were asked to indicate the actual year so a comparison is not shown. However, in that survey two-thirds said their test was within the past six years, which is roughly comparable.
| Q16 | 2018 |
| Yes | 66% |
| No | 32% |
| Don't know | 2% |
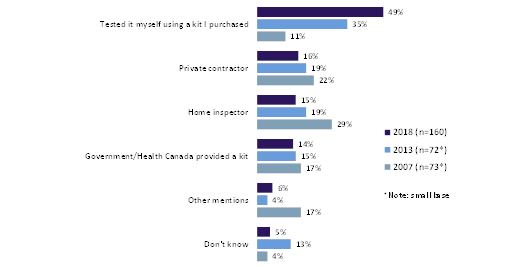
How radon was tested. Householders who said their home's radon levels have been tested were asked how this testing was done. Half (49%) say they tested it with a kit they purchased, up from one-third (35%) in 2013. Similar proportions say the test was conducted by either a private contractor (16%) or a home inspector (15%), both statistically comparable to 2013. Fourteen percent say it was tested with a kit provided by the government/Health Canada, essentially unchanged from 2013 (15%).
How radon was tested
Q.17 How did you have the radon level in your home tested (IF TESTED MORE THAN ONCE: 2018: the most recent time it was tested; 2015/2007: the first time it was tested)?
Subsample: Those who had their home radon tested (2018: n=160; 2013 n=72; 2007 n=73) NOTE: SMALL BASES 2013, 2007
| Q17 | 2018 (n=160) | 2013 (n=72*) | 2007 (n=73*) |
| Tested it myself using a kit I purchased | 49% | 35% | 11% |
| Private contractor | 16% | 19% | 22% |
| Home inspector | 15% | 19% | 29% |
| Government/Health Canada provided a kit | 14% | 15% | 17% |
| Other mentions | 6% | 4% | 17% |
| Don't know | 5% | 13% | 4% |
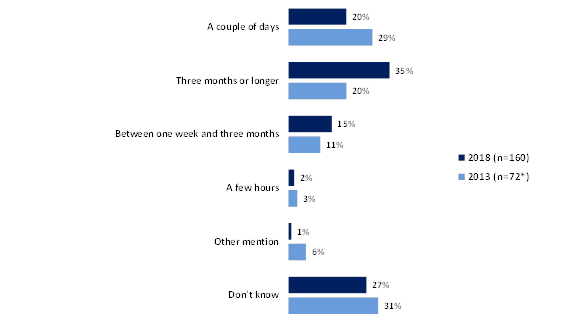
Duration of radon test. Those who have had their home's radon levels were asked the duration of the test. Over half indicate one of the usual testing periods: two in ten (20%, statistically similar to 2013) say it was a couple of days, and one-third (35%, up a notable 15 points) say it was for three months or more. Around one in seven (15%) say it was some time period between these two normal options, and a small proportion (3%) provide other responses. Around one-quarter (27%) are unable to indicate the length of the radon test. Most of the 81 householders who used a DIY kit indicate one of the two usual responses: 16 percent say they tested for a couple of days and 53 percent say the test was three months or longer.
Duration of home radon test
Q.18 For how long a time period was the radon level tested in your home?
Subsample: Those who had their home radon tested (2018: n=160; 2013 n=72) NOTE: 2013 SMALL BASE
| Q18 | 2018 (n=160) | 2013 (n=72*) |
| A couple of days | 20% | 29% |
| Three months or longer | 35% | 20% |
| Between one week and three months | 15% | 11% |
| A few hours | 2% | 3% |
| Other mention | 1% | 6% |
| Don't know | 27% | 31% |
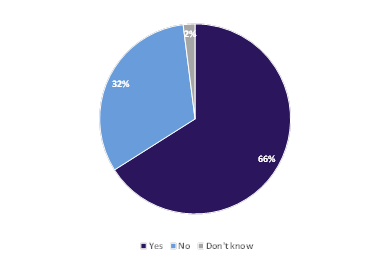
Reported radon levels. Those reporting radon testing were asked to recall if the level was high, moderate or low. Most (75%) say it was low, while one percent say it was high, and around one in seven (15%) say it was moderate. These results are statistically similar to previous waves.
Level of home radon
Q.19 Would you say the level of radon was…?
Subsample: Those who had their home radon tested (2018: n=160; 2013 n=72; 2007 n=52) NOTE: SMALL BASES 2013, 2007
NOTE: In 2007 this was asked of respondents who could not recall the level of radon in Bq/m3
| Q19 | High | Moderate | Low | Don't know |
| 2018 (n=160) | 1% | 15% | 75% | 9% |
| 2013 (n=72*) | 3% | 9% | 70% | 18% |
| 2007 (n=52*) | 2% | 8% | 71% | 20% |
If remediation action was taken. All who reported having a radon test conducted were asked they took any action. Fifteen percent say they did, three-quarters say they did not, and four percent say the testing was done recently. The small number reporting higher radon levels are not more likely to have taken action: of those reporting a high radon level (n=6), two took action, three did not, and one tested very recently. Of the 23 who say their home's radon level was moderate, 5 took action, 16 did not, and 2 could not say.
If took any action to reduce radon level
(Those who had their home radon tested - n=160)

Q.20. Did you take any action to reduce the radon level?
Subsample: Those who had their home radon tested (n=160)
| Q20 | 2018 | |
| Yes | 15% | |
| No | 76% | |
| Tested recently - not yet acted | 4% | |
| Don't know | 6% | |
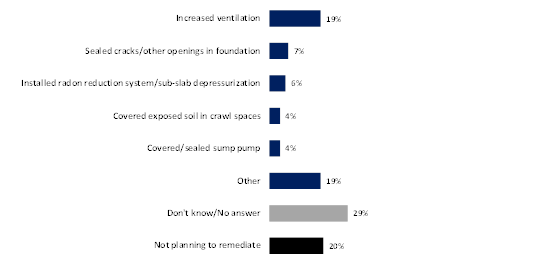
Remediation actions taken or planned. All who reported having a radon test conducted were asked what if any remedial actions have been taken or are planned; multiple mentions were permitted. Two in ten mention increased ventilation as the action of choice, fewer than one in ten mention other specific actions. Two in ten are not planning to remediate, while three in ten do not indicate any actions.
Actions taken or planned to reduce radon level to reduce radon level
(Those who had their home radon tested - n=160)
Q.22 [What will you do/What was done] to reduce the radon level in your home?
Subsample: Those who had their home radon tested (n=160)
| Q22 | 2018 |
| Increased ventilation | 19% |
| Sealed cracks/other openings in foundation | 7% |
| Installed radon reduction system/sub-slab depressurization | 6% |
| Covered exposed soil in crawl spaces | 4% |
| Covered/sealed sump pump | 4% |
| Other | 19% |
| Don't know/No answer | 29% |
| Not planning to remediate | 20% |
Why radon remediation action has not been taken. All who reported having a radon test but have not yet remediated or who do not plan remediation were asked why not. The main reason is that the levels were low or moderate and do not pose a problem, mentioned by half. Three in ten say they are not worried about radon, that it is not enough of a risk. Fewer mention other reasons for not remediating.
Reasons for not taking action to reduce radon level
(Those who had their home radon tested but have not taken action - n=128)
Q.21. Why have you not taken any action to reduce the level of radon?
Subsample: Those who had their home radon tested but have not yet taken or plan to take no action (n=128)
| Q21 | 2018 |
| Radon level was low/moderate/not a problem | 52% |
| Not worried about radon/not enough of a risk | 30% |
| Tested recently - have not had time to fix it | 3% |
| Lack of time/too busy | 3% |
| Have not thought about it | 2% |
| Cannot make changes | 1% |
| Too expensive/cannot afford | 1% |
| Lack of information/don't know what to do | 1% |
| Too lazy/not motivated | <1% |
| Inconvenient | <1% |
| Other | 9% |
| Don't know/No answer | 4% |
Use of certified radon professionals. All who have remediated their home's radon levels or who plan to do so were asked if they used, or anticipate using, a radon remediation professional. Over half (55%) say they hired, or will involve, a professional for radon remediation; around one-third say no, and one in ten are unable to say.
If certified radon professional was/will be hired
Q.23 [Did you/Will you] hire a certified radon professional to reduce the radon levels in your home?
Subsample: Those who had their home radon tested and have taken or plan to take action (n=124)
| Q23 | 2018 |
| Yes | 55% |
| No | 36% |
| Don't know | 9% |
Results of radon remediation. The small number who have undertaken radon remediation (n=24) were asked if they have had the levels retested. Eight say they have retested, 16 have not. All of those who retested say they were successful at reducing radon to an acceptable level.
Survey respondents who had not previously tested the radon level in their home were asked a series of hypothetical questions probing attitudes and expectations about radon testing and remediation. Specifically, they were asked about their willingness to test if they were to become concerned about the radon level in their home, and whether they would undertake remediation if the radon level was found to be high. Those indicating a lack of willingness to test or remediate were asked why they would not be likely to do so.
In a hypothetical situation, just under nine in ten would definitely or likely have their home tested for radon. Not being worried about radon - thinking it is not enough of a risk - remains the single most common reason given by those not willing to test. Slightly more people are willing to pay $100 to $249 to test than in 2013.
Willingness to test. If they had reason to become concerned, how willing would Canadians be to have their home's radon level tested? Just under nine in ten (86%) would be at least likely to get it tested, half definitely (52%) This reverses the decrease observed in 2013. Those residing in radon-prone areas remain somewhat more likely (63%, up from 51%) than those living elsewhere (50%, up from 44%) to say they would definitely have their home tested.
Willingness to have radon tested
Q.26 If you became concerned about radon in your home, would you definitely, likely, likely not or definitely not have the radon level tested? IF ASKED HOW THE HOME COULD BE TESTED FOR RADON: You could either buy a kit and test it yourself or hire (2018 and 2013 - a certified professional /2007 - a private inspection service) to test the radon levels for you.
Subsample: Those who have not had their home radon level tested (2018 n=1,743; 2013 n=1,595; 2007 n=1,747)
| Q26 | Definitely | Likely | Likely not | Definitely not | Depends/Don't know |
| 2018 (n=1,743) | 52% | 33% | 4% | 5% | 6% |
| 2013 (n=1,595) | 44% | 37% | 8% | 5% | 6% |
| 2007 (n=1,747) | 49% | 36% | 7% | 4% | 3% |
In this wave, likelihood of testing for radon is quite similar across the country but somewhat lower in Quebec, where concern about radon is also lower; there only 35 percent would definitely test for radon if they became concerned. Unlike 2013, there is a higher likelihood of testing among those residing in urban (54%) than rural (40%) communities, which may reflects a more urban focus in the radon-prone oversample in this wave. Likelihood of testing does not differ whether or not someone is a homeowner or renter.
Willingness to test is once again linked to higher levels of education and household income. In this wave, however, there is no notable gender difference. As in 2013, those aged 60 and over are less likely to be willing to test than their younger cohorts, but mainly because they are the most likely to be unsure. As in 2013, being definitely willing to test for radon is linked to having previous awareness of radon and to higher levels of self-assessed radon knowledge.
It should be noted that these results likely overstate the likelihood of radon testing, partly because it is hypothetical (saying one would have testing done costs nothing and requires no effort) and partly because it may be considered socially desirable to indicate a willingness to test.
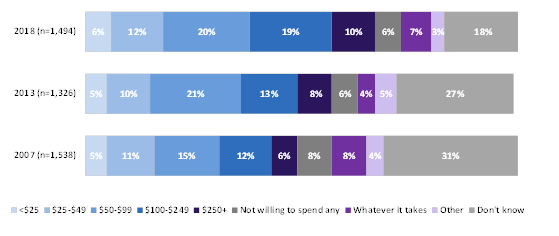
Price willing to pay for radon test. Those indicating they would definitely or likely have their home tested if concerned about radon were asked how much money they would be willing to spend for the test. Around one-third (32%) are willing to spend less than $100 to have their home tested, and 24 percent would pay between $100 and $500. Five percent say they would spend $500 or more and an additional seven percent say they would spend "whatever it takes." Six percent would not be willing to spend any money on a radon test, and a very small number indicate they would not pay much or only a minimal amount (1%). A few say either that it would depend on the level of threat (1%) or that they would require more information (1%). Around two in ten (18%) cannot say what they would be willing to pay. These results are fairly similar to 2013, with somewhat more saying they would pay from $100 to just under $250 and fewer not being able to say.
Price willing to pay for radon test
Q.28 How much money would you be willing to spend to have your home tested for radon?
Subsample: Those who have not had their home radon level tested and who would definitely/likely have it tested
(2018 n=1,494; 2013 n=1,326; 2007 n=1,538)
| Q28 | <$25 | $25-$49 | $50-$99 | $100-$249 | $250+ | Not willing to spend any | What-ever it takes | Other | Don't know |
| 2018 (n=1,494) | 6% | 12% | 20% | 19% | 10% | 6% | 7% | 3% | 18% |
| 2013 (n=1,326) | 5% | 10% | 21% | 13% | 8% | 6% | 4% | 5% | 27% |
| 2007 (n=1,538) | 5% | 11% | 15% | 12% | 6% | 8% | 8% | 4% | 31% |
In this wave those living in radon-prone areas are somewhat more willing than others to pay $50 to $99 (25% vs. 18%) but otherwise differences are not notable. Renters are more likely than homeowners to say they would pay up to $25 (16% vs. 4%) but other responses are similar for these groups. As in previous waves, those with higher levels of household income are willing to spend more on radon testing than those with the lowest incomes. Those most likely not to know what they would be willing to spend on radon testing are 60 years of age or older, have lower levels of education, and household incomes under $75,000. Those previously aware of radon are more likely than those who were not to be willing to pay $100 to under $250 (23% vs. 13%); the latter are more likely not to know (22% vs. 15%).
Reasons for not testing for radon. Those indicating they would likely not or definitely not have their home tested for radon (n=189) were asked why this is the case; multiple mentions were permitted. The primary reason is they are not worried about radon or do not consider it to be enough of a risk (35%, down from 46%), or because they do not know what to do/lack of information (19%, comparable to 18%). Other reasons are cited by one in ten or fewer each.
Why unlikely to test for radon
Q.27 Why would you not be likely to have the radon levels in your home tested?
Subsample: Those who have not had their home radon level tested and who would likely not or definitely not get their radon levels tested (2018 n=189; 2013 n=216; 2007 n=209)
| Q27 | 2018 (n=189) | 2013 (n=216) | 2007 (n=209) |
| Not worried about radon/not enough of a risk | 35% | 46% | 36% |
| Lack of information/don't know what to do | 19% | 18% | 21% |
| I don't believe in radon | 8% | 5% | 0% |
| Local radon levels low/moderate/not a problem | 7% | 11% | 9% |
| Have not thought about it | 6% | 5% | 5% |
| Too lazy/not motivated | 6% | 1% | 4% |
| Cannot make changes | 5% | 3% | 5% |
| Inconvenient | 4% | 0% | 2% |
| Lack of time/too busy | 2% | 1% | 2% |
| Not worried because of my age | 2% | 3% | 0% |
| Too expensive/cannot afford | 2% | 3% | 5% |
| Other | 9% | 6% | 6% |
| Don't know | 7% | 6% | 11% |
Reasons given by those living in a radon-prone area are not notably different than those of residents of other areas. In this wave, eight percent (comparable to five percent in 2013) say they do not believe in radon (all located in non-radon-prone areas). Due to the small subgroup sizes, further detailed analysis by subgroup is not advisable.
Close to nine in ten would likely or definitely act to reduce radon levels in their home if these were found to be high. Lack of information and lack of concern continue to be the top barriers to remediation.
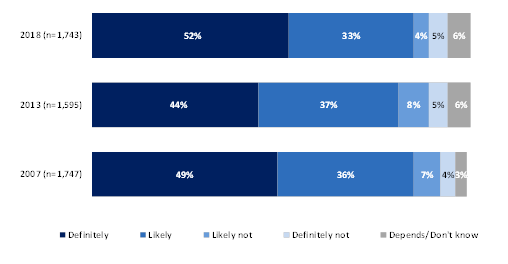
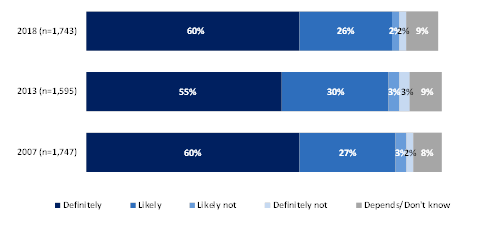
Willingness to remediate.Householders were asked about another hypothetical situation: If a radon test was done and the radon level in their home was found to be high, how likely would they be to take action to have the radon level reduced? As in 2013, close to nine in ten say they would definitely (60%, up five points) or likely (26% down 4) take action.
Willingness to have radon remediated
Q.29 If a radon test was done and the radon level in your home was found to be high, would you definitely, likely, likely not or definitely not take action to have the radon level reduced?
Subsample: Those who have not had their home radon level tested (n=1,743; 2013 n=1,595; 2007 n=1,747)
| Q29 | Definitely | Likely | Likely not | Definitely not | Depends/Don't know |
| 2018 (n=1,743) | 60% | 26% | 2% | 2% | 9% |
| 2013 (n=1,595) | 55% | 30% | 3% | 3% | 9% |
| 2007 (n=1,747) | 60% | 27% | 3% | 2% | 8% |
Being definite about taking action to reduce radon is generally similar across the country, except lower in Quebec (53%), however net likelihood is the same for Quebec as elsewhere. As in 2013, those living in radon-prone areas are not statistically more likely (65%) than others (59%) to say they would definitely take action to reduce their home's radon level.
Those age 60 and over are somewhat less likely than younger residents to say they would be at least likely to remediate, although the proportion who would definitely take action is similar by age. In this wave there is no difference in response between parents of children under 16 and others. Those most likely to definitely take action to reduce radon have university level education (65%), household incomes of $75,000 to under $100,000 (72%), were aware of radon (65%) and say they know a lot or something about it (72%). Smokers and those with a lung cancer diagnosis in the household are no different than others regarding willingness to remediate radon. As in 2013, being definitely willing to remediate is highest among those who would definitely have their home tested if radon became a concern (83%)Footnote 10.
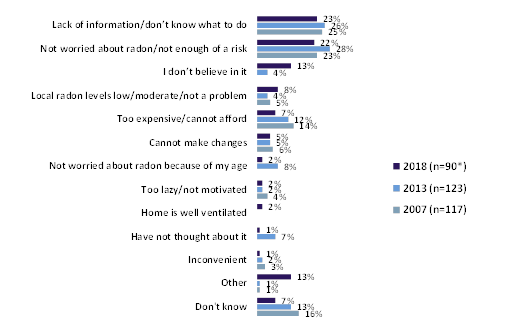
Reasons for not remediating radon. Those who would likely not or definitely not take action to reduce the radon level in their home (n=90) were asked why this is the case. The primary reasons given are they do not know what to do/lack of information (23%) or that they are not worried about radon/do not consider it to be enough of a risk (22%). In this wave, the third most cited reason is not believing in radon (13%, up 9 points), which may be a topic future communications may need to address. Fewer than one in ten mention other reasons, including local levels being low, it being too expensive, or not being able to make changes. Seven percent do not give a reason for not being willing to remediate.
The base of respondents is small and further analysis by subgroup is not recommended.
Why unwilling to remediate radon
Q.30 Why would you not be likely to act to reduce radon levels?
Subsample: Those who have not had their home radon level tested and who would likely or definitely not get high radon reduced (2018 n=90 - small base; 2013 n=123; 2007 n=117)
| Q30 | 2018 (n=90*) | 2013 (n=123) | 2007 (n=117) |
| Lack of information/don't know what to do | 23% | 26% | 25% |
| Not worried about radon/not enough of a risk | 22% | 28% | 23% |
| I don't believe in it | 13% | 4% | 0 |
| Local radon levels low/moderate/not a problem | 8% | 4% | 5% |
| Too expensive/cannot afford | 7% | 12% | 14% |
| Cannot make changes | 5% | 5% | 6% |
| Not worried about radon because of my age | 2% | 8% | 0 |
| Too lazy/not motivated | 2% | 2% | 4% |
| Home is well ventilated | 2% | 0% | 0% |
| Have not thought about it | 1% | 7% | 0 |
| Inconvenient | 1% | 2% | 3% |
| Other | 13% | 1% | 1% |
| Don't know | 7% | 13% | 16% |
The questionnaire included hypothetical questions about radon remediation costs and effects. Respondents were told the price range of a typical radon remediation and asked to indicate if it was reasonable or not. Those who did not think it was reasonable were asked what they would be willing to spend. Householders were also asked if they would be willing to purchase a home in which high radon levels had been detected and remediated.
One-third of householders think $2,000 to $3,000 is a reasonable price to pay to reduce radon levels in a home. One-quarter of those who think the typical cost is too much would pay $500 or more.
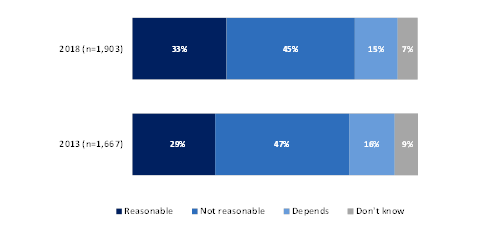
Is $2,000-$3,000 a reasonable price to reduce radon levels? All householders were told it typically costs $2,000 to $3,000 to reduce radon levels in a home. They were then asked if they think this is a reasonable amount to pay, or not. One-third (33% up four points) think it is reasonable, while close to half (45%) think it is unreasonable. Around one-quarter (22%) either do not provide an opinion or say it would depend on various factors. These results are comparable to 2013.
If $2,000-$3,000 is a reasonable price to reduce radon levels
Q.31 It typically costs two to three thousand dollars to reduce radon levels in a home. Do you think that this is a reasonable amount to pay, or not? (2018 n=1,903; 2013 n=1,667)
| Q31 | Reasonable | Not reasonable | Depends | Don't know |
| 2018 (n=1,903) | 33% | 45% | 15% | 7% |
| 2013 (n=1,667) | 29% | 47% | 16% | 9% |
Believing $2,000 to $3,000 is a reasonable price to pay to reduce radon in a home ranges from a low of 28 percent in Ontario to a high of 49 percent in the North. Results are similar by radon-proneness of community, length of home tenure, and whether someone rents or owns their home.
In this wave, that this price range is reasonable is similar by gender. Older householders are marginally less likely to think it reasonable, but not more likely to think it unreasonable, just more likely not to know. Opinion varies by socio-economic factors: saying it is reasonable is higher among those having household incomes of $75,000 or more or those with university degree. As in 2013, people who were aware of radon previously are more likely to think it is a reasonable price to pay than those who were not aware of radon, and those with higher radon knowledge are also more likely to think the price is reasonable than those who know little or nothing. There is no difference by whether someone has tested for radon or not.
Price willing to pay to remediate radon level. Those who did not think $2,000 to $3,000 was a reasonable price to pay to reduce home radon levels (n=1,245) were asked how much money they would be willing to spend for this. One-quarter (25%, down 5 points from 2013) would spend up to $500, and just over one in ten (13%, comparable to 11%) would pay from $500 to $999. One in ten (11%, up 6 points) would spent $1,000 or more. Around one in seven (15%, comparable to 13%) would not be willing to spend anything to reduce radon, while five percent would pay whatever it takes. Three in ten (30%) do not know or cannot say how much they would spend.
Price willing to pay for radon remediation
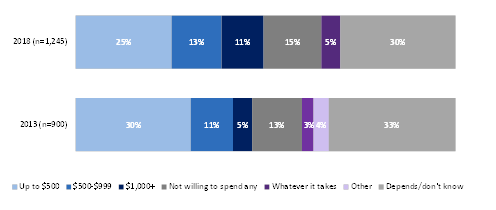
Q.32 How much money would you be willing to spend to reduce the radon level in your home?
Subsample: Those who did not say $2,000 to $3000 is reasonable (2018 n=1,245; 2013 n=900)
| Q32 | Up to $500 | $500-$999 | $1,000+ | Not willing to spend any | Whatever it takes | Other | Depends/don't know | |
| 2018 (n=1,245) | 25% | 13% | 11% | 15% | 5% | 30% | ||
| 2013 (n=900) | 30% | 11% | 5% | 13% | 3% | 4% | 33% | |
Responses of those in radon-prone areas and others are generally similar, except slightly more in radon-prone areas would be willing to spend $1,000 to under $2,000 (13% vs. 7%). Regionally, residents of the North are the most willing to spend $1,000 to under $2,000; in this wave Quebec residents are the most likely to say they would not be willing to spend anything (22%). As with the previous question, not being willing to pay anything is somewhat higher among those in the lowest socio-economic groups. Responses are fairly similar whether someone is aware of radon or not, although those who were not aware are somewhat more likely to say they wold not pay anything (19% vs. 12%). Those who know a lot or something about radon are more likely to be willing to pay $1,000 to under $2,000 (21%) than those who know a little (11%) or almost nothing (5%).
Half would be at least likely to buy a home where the owner had paid for radon remediation.
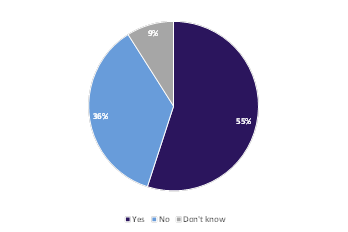
Canadian householders were asked how likely they would be to buy a home they really liked if they learned the radon levels had been high, but the owner had paid to have them reduced. In this case, half (49%, down four percentage points) would be likely to buy such a home (with 14% - up four points - being very likely), while just under four in ten (39%) would not be likely to buy it, and around one in ten (11%) say it depends or cannot say one way or the other.
Willingness to purchase a remediated radon home
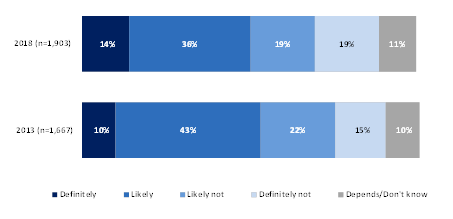
Q.33 How likely would you be to buy a home you really liked if you learned that the radon levels had been high, but the owner had paid to have the radon reduced? Would you definitely, likely, likely not or definitely not buy such a home?
(2018 n=1,903; 2013 n=1,667)
| Q33 | Definitely | Likely | Likely not | Definitely not | Depends/Don't know |
| 2018 (n=1,903) | 14% | 36% | 19% | 19% | 11% |
| 2013 (n=1,667) | 10% | 43% | 22% | 15% | 10% |
Being definitely or likely willing to purchase a remediated home is similar across the country but is somewhat higher in the North (69%) than elsewhere. In this wave, those in radon-prone areas would be more likely to buy (57%) than those not in radon-prone areas (47%), which again may be indicative of having the radon-prone oversample in this wave include some larger urban centres, such as Calgary.
As in 2013, willingness to buy a remediated home is highest among younger Canadians (62% of those under age 45) and decreases as age increases; those aged 60 and over are more likely to say they would not (48%) than would (39%) buy such a home. Also as in 2013, willingness to buy a home with reduced radon increases as level of education and household income increases. As in 2013, being at least somewhat likely to buy is higher among those who have owned their current home for five to ten years (47% under five years, 62% five to 10 years, 45% ten years or more). In this wave, likelihood to buy is higher among those with children under age 16, which is linked to age. Those who would definitely or likely remediate their own home are more likely than others to say they would buy a home with reduced radon.
The following section of the report looks at the public's awareness of the various sources of radon information available. The survey also asked about where householders would be likely to seek information on radon if they desired it.
Just under one in ten are aware of any radon programs or activities. Of those aware of such a program, the sponsor is most thought to have been the federal government. Health Canada remains the top mentioned single organization that should be responsible for radon information.
When asked if they are aware of any programs or activities to help residents learn about or deal with radon in their homes, seven percent of Canadians answer yes, which while still a small proportion is double that of 2013. The majority (93%) remain unaware of these. In this wave, awareness is notably higher in radon-prone areas (12%) than in other communities (5%).
Aware of radon programs
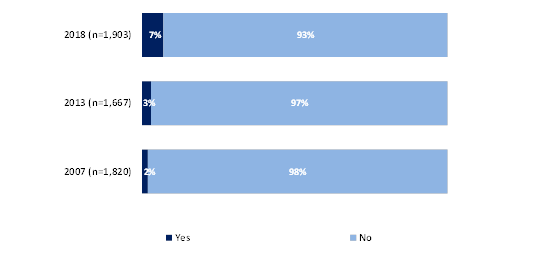
Q.34 Are you aware of any programs or activities to help residents learn about or deal with radon in their homes?
(2007: Are you aware of any programs to help residents learn about or deal with radon in their homes?)
(2018 n=1,903; 2013 n=1,667, 2007 n=1,820)
| Q34 | Yes | No |
| 2018 (n=1,903) | 7% | 93% |
| 2013 (n=1,667) | 3% | 97% |
| 2007 (n=1,820) | 2% | 98% |
Those aware are a small minority across the country and all subgroups. Awareness is higher in the North (27%) than elsewhere (5-7%). Awareness is higher in urban locations (8% vs. 3% rural) and does not differ between homeowners and tenants. There is no difference by education level in 2018, but awareness is slightly higher among those with household incomes of $75,000 and over (10%) and among men (9% vs. 5% of women). Awareness is higher among those aware of radon (9% vs. 3%) and, as in previous waves, those who report a lot or some knowledge of radon (19%, vs. 7% with less knowledge) and among those who have had their home tested for radon (23%, vs. 6% who have not tested).
Who sponsors radon programs? Those who said they are aware of activities to help residents learn about or deal with radon (n=156) were asked who sponsors or funds these programsFootnote 11. The most mentioned source is the federal government, by 28 percent (down from 47%, a statistically significant change). Under two in ten each mention NGOs (17%), municipal governments (15%), or the provincial government (15%); these are all statistically unchanged from 2013. One in ten (10%) make other diverse mentions, and one-quarter are unable to say.
Because the subgroup bases of those aware of programs or activities is small, further analysis is not advisable.
Sponsor of radon programs/activities
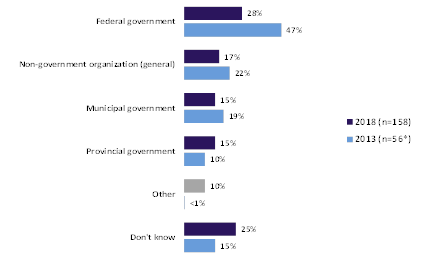
Q.35 Can you tell me who sponsors or funds these programs or activities?
Subsample: Those who have heard of radon programs/activities (2018 n=158; 2013 n=56 - small base)
| Q35 | 2018 (n=158) | 2013 (n=56*) |
| Federal government | 28% | 47% |
| Non-government organization (general) | 17% | 22% |
| Municipal government | 15% | 19% |
| Provincial government | 15% | 10% |
| Other | 10% | <1% |
| Don't know | 25% | 15% |
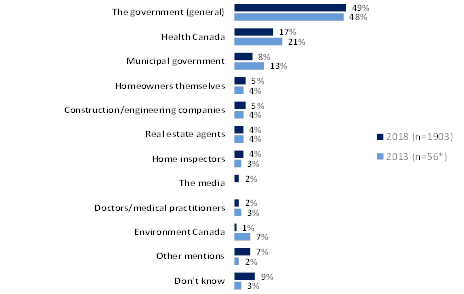
Who should be responsible for radon information? In this wave, all householders, regardless of awareness of radon programs, were asked who should be responsible for providing information to homeowners about how to deal with radon. Half think this is a government responsibility, and just under two in ten (17%) specify Health Canada; these results are comparable to 2013 when it was only asked of those who said they were aware of radon programs. Under one in ten each would assign responsi-bility to others, whether a level of government, organization or homeowners themselves.
Who should be responsible for providing information to homeowners
about how to deal with radon
Q.36 Who should be responsible for providing information to homeowners about how to deal with radon?
2018: Asked of all. 2013 Subsample: Those who have heard of radon programs/activities (n=56) NOTE: SMALL BASE
| Q36 | 2018 (n=1903) | 2013 (n=56*) |
| The government (general) | 49% | 48% |
| Health Canada | 17% | 21% |
| Municipal government | 8% | 13% |
| Homeowners themselves | 5% | 4% |
| Construction/engineering companies | 5% | 4% |
| Real estate agents | 4% | 4% |
| Home inspectors | 4% | 3% |
| The media | 2% | 0% |
| Doctors/medical practitioners | 2% | 3% |
| Environment Canada | 1% | 7% |
| Other mentions | 7% | 2% |
| Don't know | 9% | 3% |
Saying radon information provision is the responsibility of the federal government is the dominant response across the country and all subgroups. It is somewhat higher among homeowners (51%) than tenants (36%), and among those previously aware of radon (52%) than those unaware (44%). Mentioning Health Canada specifically is somewhat higher among Northern residents (26%), women (20% vs. 13% of men), those with a university degree (22%) or higher household incomes (21% with $75,000 or more), and non-smokers (18%, vs. 9% of smokers). Mentions of Health Canada are lower among those living in the oversampled radon-prone areas (10%) than others; those in radon-prone communities are somewhat more likely than others to think municipalities should be responsible (12% vs. 7%).
One in ten have taken steps to learn about radon. Google searches are the first step to learning about radon, both for those who have already looked and those who have not.
Steps taken to learn about radon. When asked if they have ever taken steps to learn about radon, 12 percent of Canadians say that they have done so, which although a low proportion is double that in 2013. Close to nine in ten have not researched radon.
Have ever taken steps to learn about radon
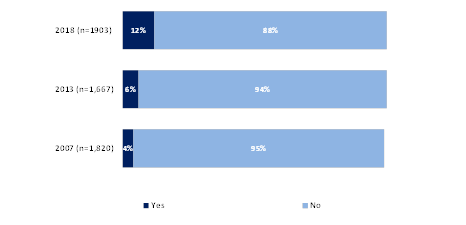
Q.37 Have you ever taken steps to learn about radon? (2018 n=1,903; 2013 n=1,667, 2007 n=1,820)
| Q37 | Yes | No |
| 2018 (n=1903) | 12% | 88% |
| 2013 (n=1,667) | 6% | 94% |
| 2007 (n=1,820) | 4% | 95% |
In 2018, having taken steps to learn about radon is generally similar across much of the country but is lower in Quebec (7%) and higher in the North (28%); those in radon-prone areas are more likely to have taken steps (18%) than those living elsewhere (10%). There is no statistical difference between homeowners and tenants in this regard.
Having taken steps to learn about radon remains higher among men (14% vs. 9% of women), and those with university degrees (16% vs. 5% with high school or less); it is also higher among those who have household incomes of $75,000 or more (16% vs. 7% with less). It remains higher among those who knew about radon previously (17% vs. 1% of others), and those who say they know a lot or something about radon (36%, compared to 18% who know a little and 5% who know almost nothing). It is also higher among those who have tested for radon (43% vs. 9% who have not) and those who think that $2,000 to $3,000 is a reasonable price for remediation (14% vs. 8% who think it is unreasonable).
Sources of radon information. It is useful for Health Canada to be aware of the information sources Canadians have actually used to seek out more information about radon, as well as potential sources that may be consulted in future by those who have not yet done researched this topic. Those who said they have taken steps to learn more about radon were asked to name the source(s) they turned to. Those who have never looked for information on radon were asked where they would be likely to look if they wanted to learn more. In both cases, multiple mentions were permitted.
A Google search remains the main starting place for those who have already looked radon information (22%, similar to 18% in 2013). Other notable mentions include the Internet in general and the media, both statistically lower than in 2013. Fewer now mention receiving information about radon at work (6%, down from 15%). Health Canada continues to be used by a small proportion (6%, down 5 points).
Subgroup bases are small and deeper analysis is not advised; however, Google is a top source across the country and all subgroups.
Actual sources of information about radon
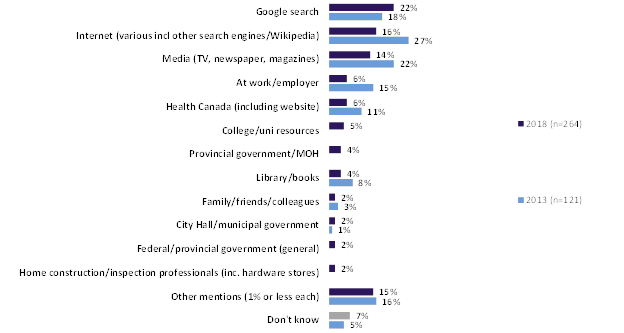
Q.38 Where did you look for information about radon?
Subsample: Those who have taken steps to learn about radon (2018 n=264; 2013 n=121)
| Q38 | 2018 (n=264) | 2013 (n=121) |
| Google search | 22% | 18% |
| Internet (various incl other search engines/Wikipedia) | 16% | 27% |
| Media (TV, newspaper, magazines) | 14% | 22% |
| At work/employer | 6% | 15% |
| Health Canada (including website) | 6% | 11% |
| College/uni resources | 5% | 0% |
| Provincial government/MOH | 4% | 0% |
| Library/books | 4% | 8% |
| Family/friends/colleagues | 2% | 3% |
| City Hall/municipal government | 2% | 1% |
| Federal/provincial government (general) | 2% | 0% |
| Home construction/inspection professionals (inc. hardware stores) | 2% | 0% |
| Other mentions (1% or less each) | 15% | 16% |
| Don't know | 7% | 5% |
Among those who have not yet searched for radon information, Google continues to be the go-to source (46%, up 5 points). There are fewer mentions of the Internet in general and Health Canada than in 2013, and seven percent now mention the provincial government/ministry of health as a place they would look for radon information.
Potential sources of information about radon
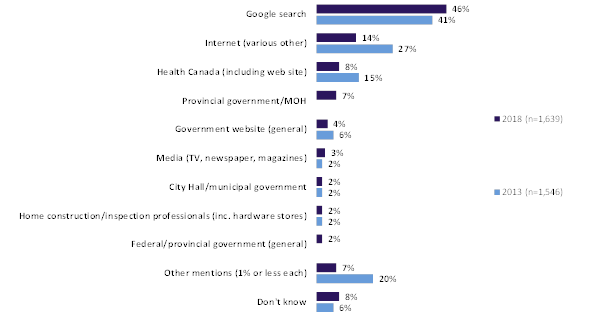
Q.39 If you wanted to get information about radon, where would you be likely to look?
Subsample: Those who have not taken steps to learn about radon (2018 n=1,639; 2013 n=1,546)
| Q39 | 2018 (n=1,639) | 2013 (n=1,546) |
| Google search | 46% | 41% |
| Internet (various other) | 14% | 27% |
| Health Canada (including web site) | 8% | 15% |
| Provincial government/MOH | 7% | 0% |
| Government website (general) | 4% | 6% |
| Media (TV, newspaper, magazines) | 3% | 2% |
| City Hall/municipal government | 2% | 2% |
| Home construction/inspection professionals (inc. hardware stores) | 2% | 2% |
| Federal/provincial government (general) | 2% | 0% |
| Other mentions (1% or less each) | 7% | 20% |
| Don't know | 8% | 6% |
Responses are generally similar across the country and population subgroups. Mentions of Google search are higher among younger Canadians (61%), those with a child under age 16 at home (56%), those with college or university education (48%), those who have owned their home for less than five years (53%) and homeowners (47%, vs. 33% of renters). Mentions of Google increase as household income increases. Quebecers are the most likely to mention seeking information from the provincial government or ministry of health (14%). There are no notable differences by level of radon knowledge or having had radon levels tested. As with other knowledge questions, being unable to indicate a potential source is higher among those in the lowest socioeconomic groups.
If now motivated to get home radon level tested. Householders who have not had their home tested for radon were asked if what they had learned during the survey has motivated them to get their home radon level tested. One-quarter say yes (26%, up 11 points from 2013) and an additional 12 percent say they are motivated to learn more. Just under half say no and the rest say maybe or are 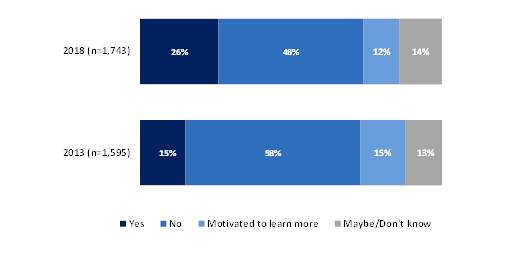 not sure.
If now motivated to get home radon level tested
Q.40 Has what you have learned about radon today motivated you to get your home radon levels tested?
Subsample: Those who have not had their home radon tested (2018 n=1,743; 2013 n=1,595)
| Q40 | Yes | No | Motivated to learn more | Maybe/Don't know |
| 2018 (n=1,743) | 26% | 48% | 12% | 14% |
| 2013 (n=1,595) | 15% | 58% | 15% | 13% |
Being motivated to get home radon levels tested following the survey is similar across the country, but somewhat higher in the Atlantic region (31%) and the North (34%). It is higher among those residing in radon-prone areas (34% vs. 24% of others), among renters (34% vs. 25% of homeowners) and those who have had lived in their current home for less than five years (32%), which may be linked to age, as it is also higher among younger Canadians (notably 53% under age 30). In this wave it is also somewhat higher among smokers (33%, vs. 25% of non-smokers).
Saying the information they learned during the survey has motivated them to test for radon is higher among those who were not previously aware of radon (30% vs. 23%), and as in 2013 is higher among those who would definitely remediate if radon levels were found to be high and those who think that $2,000 to $3,000 is a reasonable cost to reduce radon.
Requiring radon tests for home sales and being made aware of high levels in the community are considered the most effective ways to encourage remediation.
In 2018 a new question asked householders to rate how effective they felt each of seven factors would be in convincing people to have the radon level in their home reduced. Seven in ten or more think each would be at least somewhat effective, but the most effective would be if radon testing was required as part of selling or buying a home (84% effective, 57% very) or if someone heard their community had high levels of radon (85% effective, 54% very). Around half each also feel it would be very effective if people learned radon is a major cause of lung cancer, whether or not people smoke, or that a radon mitigation system will reduce levels by more than 90 percent. Under four in ten think it would be very effective to know a mitigation system can be installed in less than a day, three in ten would see a 15 percent government rebate being very effective, and one-quarter say knowing the cost is comparable to other home maintenance repairs would be a strong motivation.
Effectiveness of radon actions or messages
(Total sample - n=1,903)
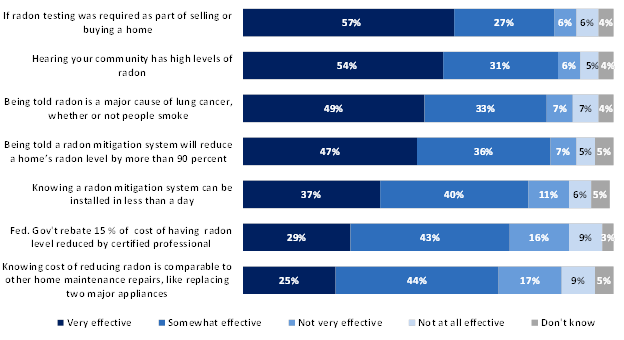
Q.41 How effective do you think each of the following would be at convincing people to have the radon level in their home reduced? (Total sample - n=1,903)
| Q41 | Very effective | Somewhat effective | Not very effective | Not at all effective | Don't know |
| If radon testing was required as part of selling or buying a home | 57% | 27% | 6% | 6% | 4% |
| Hearing your community has high levels of radon | 54% | 31% | 6% | 5% | 4% |
| Being told radon is a major cause of lung cancer, whether or not people smoke | 49% | 33% | 7% | 7% | 4% |
| Being told a radon mitigation system will reduce a home's radon level by more than 90 percent | 47% | 36% | 7% | 5% | 5% |
| Knowing a radon mitigation system can be installed in less than a day | 37% | 40% | 11% | 6% | 5% |
| Fed. Gov't rebate 15 % of cost of having radon level reduced by certified professional | 29% | 43% | 16% | 9% | 3% |
| Knowing cost of reducing radon is comparable to other home maintenance repairs, like replacing two major appliances | 25% | 44% | 17% | 9% | 5% |
Thinking these factors would be very effective is similar across the country, with two notable differences. Saying each of these factors would be very effective is lower in Quebec than elsewhere, but net effect is usually similar for Quebec and other provinces except in the case of the federal government rebate, where they are the most likely to think this would not be effective. Atlantic Canadians are the most likely to think it would be very effective to require radon testing as part of a home sale, to hear about high community radon levels, or to know radon is a major source of lung cancer.
Those living in radon-prone areas are more likely than others to think it would be very effective to know about community radon levels or to know a mitigation system can be installed quickly. Older Canadians (60+) are less likely than their younger counterparts to say any of these would be very effective at convincing people to remediate radon. Those who have already tested or who would definitely remediate are more likely than others to think each factor would be very effective.
Groups more likely to think specific aspects would be very effective include the following:
The number of households with smokers is stable from 2013.
Canadians were asked to indicate if they or someone else in their household smokes. Two in ten report the presence of a smoker, identical to 2013.
Smokers in household

Q.42 Do you, or someone else in your household, smoke? (2018 n=1,903; 2013 n=1,667; 2007 n=1,820)
| Q42 | 2018 (n=1,903) | 2013 (n=1,667) | 2007 (n=1,820) |
| Net: smoker in household | 19% | 19% | 24% |
| Self | 8% | 8% | 10% |
| Other | 6% | 7% | 8% |
| Both self and other | 5% | 4% | 6% |
| No smoker in household | 81% | 81% | 76% |
Having a smoker in the household ranges from a low of 12 percent in Alberta to highs of 22 percent in Manitoba/Saskatchewan, 23 percent in the Atlantic and 30 percent in the northern territories. It does not vary by community size or by whether the community is radon prone or not, but is higher among renters (29%, vs. 18% of homeowners). Household smoking is similar by gender, but linked to age: younger people (32% under age 30) are the most likely to report smoking. Smoking is linked to lower levels of education and household income, which in turn is linked to knowing less about radon. Incidence of household smoking is the same whether or not someone has a child under age 16 in the home.
Two percent report someone in the household has had a lung cancer diagnosis.
Canadians were asked to indicate if they or someone else in their household has ever been diagnosed with lung cancer. As in 2013, only a small percentage (2%, statistically comparable to 3%) have had such a diagnosis in their household.
Lung cancer in household
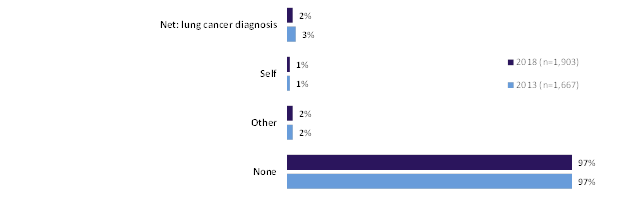
Q.43 Have you or anyone else in your household ever been diagnosed with lung cancer? (2018 n=1,903; 2013 n=1,667)
| Q43 | 2018 (n=1,903) | 2013 (n=1,667) | |
| Net: lung cancer diagnosis | 2% | 3% | |
| Self | 1% | 1% | |
| Other | 2% | 2% | |
| None | 97% | 97% | |
Having a lung cancer diagnosis in the household is statistically similar across the country, but is noted to be marginally higher in jurisdictions with higher proportions of smokers: Manitoba/Saskatchewan (4%), the Atlantic region (4%) and the North (5%). It is linked to lower education and lower household income, which are both linked to household smoking, but is not statistically higher among smokers.
The small number (n=43) who indicate someone else in their household had been diagnosed with lung cancer were asked if that other person is or was a smoker; two-thirds (67%) say yes, while two in ten say it was a former smoker who quit. These results are very comparable to 2013.
Nine in ten in the survey say they own their home.
This year, renters were included in the survey. Among those with ground floor or basement living space who responded, nine in ten say they are homeowners.
If current home is rented or owned
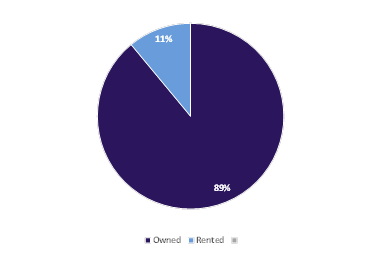
Q.C Do you own your home, or is it rented? (2018 n=1,903)
| Q.C | 2018 |
| Owned | 89% |
| Rented | 11% |
Indicating that the home is owned is the dominant response across the country, but lower in Quebec (81%) and the North (76%) than elsewhere. It does not vary by community size. Home ownership is also lower among those who have been in their current location for five or fewer years (80%). Home ownership is highest among those age 45 to 59 (93%) and Anglophones (92% vs. 81% of Francophones). Home ownership increases along with increases in education and household income.
Close to half have lived in their current home for over ten years.
As in previous waves, a plurality have lived in their current home for over 10 years, while three in ten have lived there for less than five years and one-quarter from five to ten years.
How long lived in current home
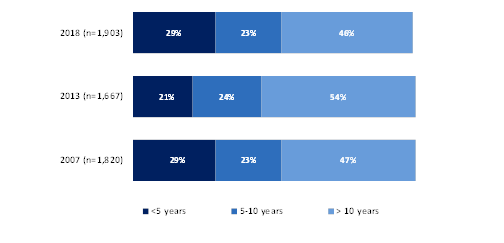
Q.45 How long have you lived in your current home (2007: in this home?)? (2018 n=1,903; 2013 n=1,667; 2007 n=1,820)
| Q45 | <5 years | 5-10 years | > 10 years |
| 2018 (n=1,903) | 29% | 23% | 46% |
| 2013 (n=1,667) | 21% | 24% | 54% |
| 2007 (n=1,820) | 29% | 23% | 47% |
Tenure in current home is generally similar across the country, but four in ten in Quebec have lived in their current home less than five years (compared to 20% to 38% elsewhere). Homeowners are more likely than renters to report living in their home for over ten years (49% vs 24%); half of renters (51%) have been in their current location for less than five years. Tenure is also linked to age, with the proportion living in their home for over 10 years increasing as age increases, and is also linked to having a child under age 16: those without a child of that age are the most likely to report living in their current home for over 10 years. Other differences are not marked.
As in previous years, there is an average of 3 people per household.
Canadian household decision-makers were asked how many people, including themselves, live in their household. Results echo previous years, with an average of 2.95.
Number of people in household
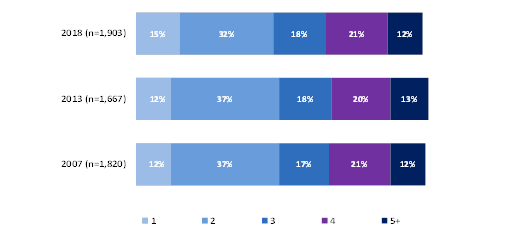
Q46. How many individuals, including yourself, currently live in your household? (2018 n=1,903; 2013 n=1,667; 2007 n=1,820)
| Q46 | 1 | 2 | 3 | 4 | 5+ |
| 2018 (n=1,903) | 15% | 32% | 18% | 21% | 12% |
| 2013 (n=1,667) | 12% | 37% | 18% | 20% | 13% |
| 2007 (n=1,820) | 12% | 37% | 17% | 21% | 12% |
Number of persons in the household is similar by region, but somewhat higher in the North. Having more people in the household is more marked among people who are parental age, and decreases as age increases. Having more household members also increases as household income increases. Because length of home tenure is linked to age, those who have been in their home for ten years or less have somewhat larger households than those who have been in their current home for over ten years. Renters have smaller households than homeowners.
Three in ten report a child under age 16 in the household, a modest decrease from 2013
Those who did not say they are the only person in their household were asked if their household includes a child under age 16. Percentaged on the total population, three in ten households include a child, a four point decrease from 2013, which likely reflects the inclusion of renters in this year's survey.
Child <16 in household
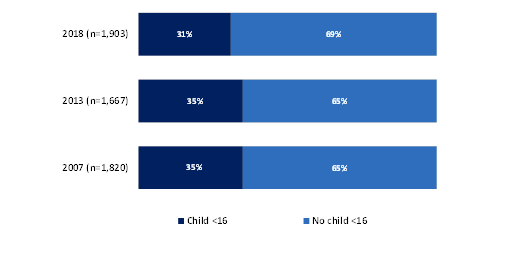
Q47. Does your household currently include any children under 16 years of age? (2018 n=1,903; 2013 n=1,667; 2007 n=1,820)
| Q47 | Child <16 | No child <16 |
| 2018 (n=1,903) | 31% | 69% |
| 2013 (n=1,667) | 35% | 65% |
| 2007 (n=1,820) | 35% | 65% |
Reporting a child in the household is generally similar by region, ranging from a low of 27 percent in Ontario to a high of 43 percent in the North. There is no difference by urban or rural communities or by radon-proneness. Reporting a child under age 16 in the home is highest among those age 30 to 44 (80%, declining to 2% of those age 60 and over) and women (34%, vs. 27% of men). As home tenure is linked to age, having a child is higher among those who have been in their current home for 10 or fewer years than those who have been in their home longer. Having a child in the home is lower among renters (21%, vs. 32% of homeowners) and is linked to higher levels of education and household income.
The proportion of householders with a university degree continues to steadily increase.
Since the radon tracking began in 2007, the proportion of householders with a university degree (bachelor's degree/post-graduate) has been steadily increasing and now stands at just over four in ten.
Level of education completed
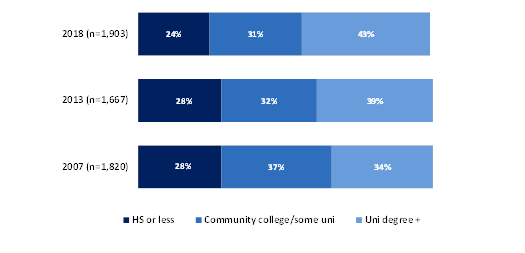
Q48. What is the highest level of education you have completed? (2018 n=1,903; 2013 n=1,667; 2007 n=1,820)
| Q48 | HS or less | Community college/some uni | Uni degree + |
| 2018 (n=1,903) | 24% | 31% | 43% |
| 2013 (n=1,667) | 28% | 32% | 39% |
| 2007 (n=1,820) | 28% | 37% | 34% |
Education levels are generally similar by region but reporting a university degree is lower in Manitoba/Saskatchewan (39%) and Quebec (39%) and higher in Alberta (52%, which includes the Calgary radon-prone oversample) and the Atlantic region (51%, which includes the Halifax radon-prone oversample). Having a degree is higher in urban (45%) than rural (26%) communities. Degrees are more common among those with higher household incomes (65% with $100,000 or more) and, linked to income, having a degree is higher among homeowners (46%) than renters (19%).
Household incomes are generally similar to 2013, with just over four in ten reporting before-tax household incomes of $75,000 or more.
Household income
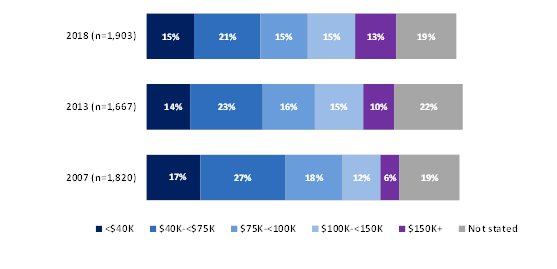
Q50. For statistical purposes only, we need information about your household income. Please tell me which of the following categories applies to your total household income for the year 2017? (2018 n=1,903; 2013 n=1,667; 2007 n=1,820)
| Q50 | <$40K | $40K-<$75K | $75K-<100K | $100K-<150K | $150K+ | Not stated |
| 2018 (n=1,903) | 15% | 21% | 15% | 15% | 13% | 19% |
| 2013 (n=1,667) | 14% | 23% | 16% | 15% | 10% | 22% |
| 2007 (n=1,820) | 17% | 27% | 18% | 12% | 6% | 19% |
One in ten in 2018 are under age 39, reflecting the inclusion of tenant households.
In 2018, the inclusion of tenants in the survey allowed a modest increase in the proportion of qualified respondents who are age 30 or less.
Age
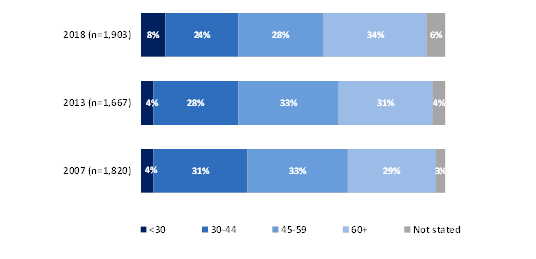
Q49. In what year were you born? (CONVERTED TO AGE) (2018 n=1,903; 2013 n=1,667; 2007 n=1,820)
| Q49 | <30 | 30-44 | 45-59 | 60+ | Not stated |
| 2018 (n=1,903) | 8% | 24% | 28% | 34% | 6% |
| 2013 (n=1,667) | 4% | 28% | 33% | 31% | 4% |
| 2007 (n=1,820) | 4% | 31% | 33% | 29% | 3% |
The following are brief, descriptive findings from the survey for specific groups of Canadian house-holders.
The survey findings are generally applicable to all regions of the country; some differences include:
An important objective of this research is to understand the knowledge, attitudes and behaviours of residents of radon-prone areas, and compare this with the responses of people in areas not currently identified as radon-prone. As in 2013, those living in radon-prone areas are somewhat more familiar with radon and its role as a health issue. However, the percentage living in radon-prone areas who have tested for radon remains quite low (12%) so it is clear education efforts need to be ongoing.
On the positive side, those living in radon-prone communities are more likely to believe radon is the leading cause of lung cancer among non-smokers, more aware of home testing kits, and more able to suggest ways radon in the home might be reduced. They are more likely to have tested or to have considered testing for radon than their counterparts in other areas, and more motivated to test after learning about radon during the survey.
Those living in radon-prone areas are among the most likely to think either hearing about the community's radon levels or that radon mitigation systems are quick to install would effectively encourage people to act on radon. They are also somewhat more likely to have heard something about their own community's radon levels. Possibly because of their focus on radon as a community issue, they are somewhat more likely than those not in radon-prone areas to think municipalities should be responsible for engaging homeowners on the subject of radon.
In addition to having less awareness and being less likely to have tested for radon, those not living in radon-prone areas have less knowledge about testing as a way to find out the radon level in one's home, and are more likely to say they have not tested because they don't know what to do.
As in 2013, there are not a lot of urban-rural differences to note in 2018. Radon awareness is lower in rural areas. In urban communities, residents are somewhat more likely to have considered testing or be willing to test if they had cause to become concerned about their home's radon level. Urban residents are also more likely to be aware of home improvement stores as a source for home radon test kits, and are slightly more aware of radon programs.
Home ownership and household composition. As in 2013 there are few differences by household composition factors such as presence of children or length of house tenure. Parents of children under 16 are less aware of radon than those without children, and are somewhat more willing to consider buying a home they really liked that had undergone radon remediated. Those with children at home are also among the most likely to use Google to learn about radon, and to think requiring a radon test for a home sale would be an effective way to get testing and remediation done.
Renters were included in this wave for the first time. There are some notable differences between renters and homeowners, some of which are likely linked to related demographic factors, such as age and household income. Homeowners, who tend to be older and have higher incomes than renters, have more awareness of radon, are more likely to have considered testing, and more likely to think the federal government should be responsible for radon communication. Renters are less likely to know what radon is, and more likely than homeowners to confuse it with other toxins (gas in air conditioners or off-gassing from carpets). They are more likely than homeowners to indicate they have not tested because they don't know what to do or want to spend less than $25 to test, but are also more likely to say they are motivated to test after what they heard about radon during the survey.
Demographic factors. As in previous waves, awareness of radon increases with age and remains highest among those aged 60 and over, the age group consistently shown to be the biggest users of traditional media. However, older Canadian homeowners are also less likely to know what they would be willing to spend to test for radon, and to be less likely to remediate if it was found to be high.
Younger householders are more willing to buy a remediated home, to use Google to learn about radon, and to be motivated to test after learning more about radon during the survey - but they are somewhat less likely to think various factors will be effective at convincing people to deal with radon in their homes.
As with previous surveys, there is higher awareness and knowledge about radon among those in the higher socio-demographic strata (education and income). Those with a bachelor or post-graduate degree are the most likely to know about radon testing, to be able to name something that would mitigate higher home radon, and to know home improvement stores carry home testing kits. They are more likely to have heard something about the radon level in their community, to have considered testing, and to be willing to test. They are more likely than those with lower levels of education to have already taken steps to learn about radon, are more likely to say they would remediate, and to think $2,000 to $3,000 is a reasonable price to pay for remediation. They are also more likely to think it would be effective to either require radon testing for a home sale, or to promote that radon is the major cause of lung cancer among non-smokers. Those with high school or less education are more likely than others to confuse radon with other household toxins, to not know where to get a home testing kit, or to not know what amount of money they would spend on testing or remediation.
A similar pattern is seen for household income, with those in households with incomes of $100,000 or more being more aware of radon, more likely to know how to tell if a home's radon is high or how to mitigate higher radon, more likely to have considered testing and more willing to spend money for testing, or to think spending $2,000 to $3,000 for remediation is reasonable. They are also more likely to consider remediation, more aware of radon programs, and more likely to have already taken steps to learn about radon. Those with household incomes of under $40,000 are among the most likely to think it is true radon is the leading cause of lung cancer among non-smokers, but are also more likely to confuse it with other household toxins, to not know where to get a home test, and to not want to spend any money on remediation.
As in previous waves, there are some notable gender differences. Men remain more likely to say they are aware of radon, and are more likely than women to know certain facts about radon (for example, that it is a gas, that it comes from the ground, and that it is radioactive) and to know it can be found in most homes and that testing is available. They are more likely than women to say you can improve ventilation or seal cracks to mitigate high radon, and more likely to have considered testing, have already taken steps to learn about it, and to be more aware of radon programs. Women are more likely to spontaneously mention there are detectors or tests for radon, to say they have not tested because they don't know what to do, and to think a federal government rebate night be an effective way to get people to take action on their home radon levels.
Smoking status. As in 2013, smokers are neither more knowledgeable nor more concerned about radon than other Canadians. They are among the most likely to turn to the media for radon information, and are more likely to think knowing the cost of radon remediation is comparable to other major household repairs would be effective to convince people to act. Learning about radon during the survey tends to make them more motivated to test than non-smokers.
This research confirms there have been gains in educating Canadians about radon, especially with regard to its potential to be harmful to health. However, many still lack key information about how to test and remediate radon in their homes, as well as lacking personal concern about radon, possibly because lung cancer is still strongly linked to smoking. Many take their cues from the media and there is a lot of clutter in the health information space. Radon is not normally a hot-button concern except when a community first learns it is radon-prone, and even then radon will quickly stop being a focus of attention as other local news issues arise. Although the proportion who have heard something about their community's radon levels has doubled since 2013, it is still a small minority.
The survey suggests Health Canada should continue its efforts to inform vulnerable Canadians, but some success is noted concerning those living in radon-prone communities. Residents of these communities are more likely to have heard of radon, more likely to know you can test for radon, more aware of DIY kits, and more likely to know at least one way to remediate radon. They are twice as likely to have had their home tested (although still a small minority), twice as likely to have considered testing, and more willing to hypothetically test, than those in less vulnerable locations. They are more likely to have heard about their community's radon level, but not more likely to have heard the local level is high. Their knowledge about radon is not notably higher than that of their counterparts in non-radon-prone communities. As in previous surveys, smokers and those with lung cancer are not more aware of or knowledgeable about radon, but smokers are somewhat more likely than non-smokers to say they have been motivated for test for radon following what they learned during the survey, so the lines of communication appear to be open.
The proportion of householders expressing doubts that radon is even real remains small, but there is a suggestion in the research this could grow. Canadians are not immune to a generally increasing climate of scepticism with science and distrust of government. Since radon is undetectable by the senses, it may become increasingly important to reinforce it is a real threat and not part of some "conspiracy" to enrich testers or mitigators.
Based on the findings and conclusions of this research, the following recommendations are provided to Health Canada for consideration:
The results of the survey are based on telephone interviews conducted with a representative sample of 1,903 Canadian household decision-makers between February 5 and March 7, 2018. The margin of error for a sample of 1,903 is +/- 2.2 percentage points, in 19 out of 20 samples (the margin of error is greater for results pertaining to regional or socio-demographic subgroups of this population).
A telephone survey was considered to be the best methodology to obtain information from the target audience of Canadians 18 years of age and over living in private households in the 10 provinces and three territories. The telephone methodology offered a chance to identify those who are household decision-makers, in homes with ground floor or basement living space, as these are the primary audience for radon messaging. Finally, this methodology is consistent with that used for the baseline survey conducted in 2007 and the 2013 follow-up survey.
The sampling method was designed to complete 1,900 interviews with the target audience of Canadians 18 years of age and over living in private households in the 10 provinces and three territories.
For the purposes of this survey, the qualifying population was defined as Canadian residents 18 years and older living in the 10 provinces and three territories, who are residents of single family dwellings with ground floor or basement living spaceFootnote 12. From within each household contacted, respondents 18 years of age and older were screened for home decision-making statusFootnote 13. The following provides the incidence based on the eligibility requirements of the survey.
The base sample of 1,602 was stratified across five designated regions to ensure meaningful data and analysis at the regional level. An additional 301 interviews consisted of oversamples of respondents living in identified radon-prone areas. Environics employed industry-standard random-digit-dialling (RDD) methods as a basis for drawing a national sampling frame for this survey.
The data are statistically weighted to ensure the sample is as representative of this population as possible, according to the most recently available Census information (2016).
In the data analysis, the sample, including the radon-prone area oversamples, was weighted by region based on population data to reflect the actual proportions of each region, using 2016 Census information. The sample was also weighted by gender (2016 Census information) to reflect proportions found in the general population, and by age to reflect the age groups of the primary household maintainer for private households in Canada (all Statistics Canada, 2016 Census).
The table below outlines the unweighted and weighted total sample distribution and the associated margin of sampling error.
| Region | Weighted | Unweighted | Margin of ErrorFootnote * |
|---|---|---|---|
Canada |
1,903 | 1,903 | +/- 2.2% |
| Atlantic | 123 | 232 | +/- 6.5% |
| Quebec | 460 | 315 | +/- 5.5% |
| Ontario | 724 | 475 | +/- 4.5% |
| Manitoba/Saskatchewan | 126 | 292 | +/- 5.7% |
| Alberta | 222 | 193 | +/- 7.0% |
| British Columbia | 240 | 270 | +/- 5.9% |
| Territories | 7 | 126 | +/- 8.7% |
| Radon-prone areas (national + o/s) | 408 | 421 | +/- 4.8% |
| Not radon-prone | 1,495 | 1,482 | +/- 2.5% |
Margin of sampling error at the 95% confidence level
The radon-prone areas oversampled are as follows:
| Province | Oversampled areas | Number of interviews conducted | % of province's population living in oversampled areas |
|---|---|---|---|
| British Columbia | Castlegar, Sparwood, Nelson | 20 | 1.8 |
| Alberta | Calgary | 115 | 30.5 |
| Saskatchewan | Regina, Swift Current | 30 | 21.1 |
| Manitoba | Morden, Brandon | 15 | 4.5 |
| Quebec | Gaspé, Chelsea, Rimouski | 20 | 0.9 |
| Ontario | Guelph, Thunder Bay, Windsor | 50 | 3.4 |
| New Brunswick | Bathurst, Miramichi | 11 | 3.9 |
| Nova Scotia | Halifax regional Municipality | 40 | 43.6 |
| Total | n/a | 301 | n/a |
The questionnaire used for this survey was based on the earlier Health Canada National Radon and Indoor Air Quality survey, with reduced emphasis on other indoor air quality issues. Once the questionnaire was finalized and approved by Health Canada, it was translated into French using Environics' professional translators. A copy of the English language version of the questionnaire are attached as an appendix. The French questionnaire is appended to the French survey report.
Pre-test. Prior to finalizing the survey for field, an English telephone pre-test was conducted with 10 qualifying Canadians on February 5, 2018 and a French pretest of 13 respondents on February 6. Recordings of the interviews were audited by Environics' senior research consultant and representatives of Health Canada. The average length of the pre-test survey was 14 minutes for English and 16 minutes for French. No changes were made to the questionnaire as a result of the pretest.
The interviewing was conducted by Elemental Data Collection Inc. of Ottawa, ON, from February 5-March 7, 2018. Field supervisors were present at all times to ensure accurate interviewing and recording of responses. Ten percent of each interviewer's work was unobtrusively monitored for quality control in accordance with the standards set out by the Marketing Research and Intelligence Association (MRIA). The average length of time required to complete an interview was 15 minutes.
Up to eight callbacks were made to reach each household selected in the sample, and such calls were made at different times of the day and days of the week, to maximize the chances of catching someone at home. All surveys were conducted in respondents' official language of choice. This survey was registered with the MRIA's registration system.
The effective response rate for the survey is eight percent. The following table presents the final disposition of all numbers dialed.
| Disposition | Total | National | Oversample |
|---|---|---|---|
| Total Numbers Attempted | 46,240 | 38,151 | 8,089 |
| Out-of-scope - Invalid | 12,062 | 9,987 | 2,075 |
| Unresolved (U) | 16,188 | 12,922 | 3,266 |
| No answer/Answering machine | 16,188 | 12,922 | 3,266 |
| In-scope - Non-responding (IS) | 2,635 | 2,050 | 585 |
| Language barrier | 458 | 378 | 80 |
| Incapable of completing (ill/deceased) | 319 | 282 | 37 |
| Callback (Respondent not available) | 1,858 | 1,390 | 468 |
| Total Asked | 15,355 | 13,192 | 2,163 |
| Refusal | 12,331 | 10,631 | 1,700 |
| Termination | 326 | 285 | 41 |
| In-scope - Responding units (R) | 2,698 | 2,276 | 422 |
| Completed Interview | 1,903 | 1,602 | 301 |
| Quota Full | 300 | 247 | 53 |
| Not qualified: not decision maker | 162 | 142 | 20 |
| Not qualified: no ground floor/basement living space | 333 | 285 | 48 |
| Response Rate | 7.89 | 8.08 | 7.02 |
| Incidence | 70.53 | 70.39 | 71.33 |
| LENGTH | 14.85 | 14.80 | 14.90 |
The final incidence is 70.5% using the formula (completes / (quota full + completes + non-qualified):
1,903/(300 + 1,903 + 495) = 70.5%
Quota full 300
Completed interviews 1,903
Not qualified - Age -
Not qualified - Not decision-maker 162
Not qualified - No ground floor/basement living space 333
Non-response bias analysis
The table below presents a profile of the final sample, compared to the actual population of Canada (2016 Census information). The final sample underrepresents younger Canadians, mainly due to using a landline methodology to identify specific community sample for radon-proneness but also due to the household decision-maker and residence type qualifications. The sample also over-represents those with higher levels of education. Both of these are typical patterns for telephone surveys in Canada (e.g., older people and individuals with more education are more likely to respond to telephone surveys). As well, the survey population is household decision-makers and the majority are homeowners, which is linked to age and also to higher household incomes, a demographic factor that is linked to age and education.
| Characteristic | SampleFootnote * | Canada |
|---|---|---|
| Gender (18+) | ||
| Male | 48 | 49 |
| Female | 52 | 51 |
| Age Footnote ‡ | ||
| Under 25 | <1 | 3 |
| 25 - 34 | 4 | 14 |
| 35 - 44 | 12 | 17 |
| 45 - 54 | 17 | 20 |
| 55 - 64 | 27 | 20 |
| 65+ | 34 | 25 |
| Refused | 5 | n/a |
| Education levelFootnote α | ||
| High school diploma or less | 27 | 35 |
| Trades/College/some university | 30 | 36 |
| University degree | 42 | 29 |
Data are unweighted
Canada age statistics are for primary household maintainer for private households (Statistics Canada), an equivalent population to that surveyed. Data are from 2016 Census.
Actual Census categories differ from those used in this survey and have been recalculated to correspond. Statistics Canada figures for education are for Canadians aged 25 to 64 years. Data are from 2016 Census. Percentaged to exclude dk/na responses
Environics Research Group
January 29-2018
Good morning/afternoon/evening. My name is _______________ and I am calling from Environics Research Group, a public opinion research company, on behalf of Health Canada. Today we are conducting a survey of homeowners and renters about health issues in the home.
Confirm whether respondent prefers English or French
Please be assured that we are not selling or soliciting anything. The survey is voluntary and your responses will be kept entirely confidential and anonymous. Your decision on whether or not to participate will not affect any dealings you may have with the Government of Canada.
[If asked: The survey should take about 15 minutes to complete]
[If asked: The survey is being sponsored by Health Canada]
[If asked: This survey is registered with the national survey registration system. The registration system has been created by the Canadian survey research industry to allow the public to verify that a survey is legitimate, get information about the survey industry or register a complaint. The registration system's toll-free telephone number is 1-888-602-6742, extension 8728].
[If asked: The personal information you provide to Health Canada is governed in accordance with the Privacy Act and is being collected under the authority of section 4 of the Department of Health Act. We require your personal information to obtain insights into your knowledge, awareness, attitudes and behaviours regarding radon. However, your responses are always combined with the responses of others for analysis and reporting; you will never be identified. In addition to protecting your personal information, the Privacy Act gives you the right to request access to and correction of your personal information. For more information about these rights, or about our privacy practices, please contact Health Canada's Privacy Coordinator at 613-948-1219 or privacy-vie.privee@hc-sc.gc.ca. You also have the right to file a complaint with the Privacy Commissioner of Canada if you think your personal information has been handled improperly. The final report written by Environics will be available to the public from Library and Archives Canada (http://www.bac-lac.gc.ca/).]
If asked about what are high or safe or unsafe radon levels at any point in the survey:
Radon levels in homes are considered high when they exceed the Canadian guideline of 200 Becquerels [PRONOUNCED bek-uh-rel; Fr. bekuh-Rel] per cubic metre.
If person selected is not available, arrange for call-back
Before we begin...
Read to all: Here are some facts about radon. Radon is a radioactive gas that is colourless, odorless and tasteless. It is formed by the natural breakdown of uranium in soil, rock and water. Radon gas comes up from the ground. When radon escapes outdoors, it is not a concern. However, radon that enters an enclosed space, like a home, can accumulate and become a health hazard. All homes have some level of radon. Long term exposure to high levels of radon is the second leading cause of lung cancer after smoking, and the number one cause for non-smokers.
All NO/DK at Q.13 (Never had radon testing) Skip to Section C
IF CODE 01 AT Q20 - TOOK ACTION - ASK Q22-23 IN PAST TENSE
IF CODE 97 AT Q20 OR 02 AT Q21, ASK Q22-23 IN FUTURE TENSE
If yes at Q24 skip to Section d
Ask all
Now I'd like to ask you two questions about your health and the health of others in your household…
Finally, I'd like to ask you a few questions about yourself that will help us analyze the results of this survey...
This completes the survey. In case my supervisor would like to verify that I conducted this interview, may I have your first name?
First Name:__________
This survey was conducted on behalf of Health Canada, and is subject to the Federal Access to Information Act. Thank you very much for your participation.
If asked where to obtain more information about radon or radon testing: For more information you can go to the Health Canada web site at http://www.hc-sc.gc.ca/ or you can obtain material about radon by calling the Radiation Protection Bureau at 613-954-6647.
Record:
Note that the northern territories were not included in the 2007 survey.
New in 2018, tenants were included provided they had living space on or below the ground floor, and qualification was extended to basement dwelling space.
Throughout this report the term "radon-prone" is used. "Radon-prone" refers to areas known to have an above-average percentage of homes with radon levels above the Canadian guideline.
http://www.epa.gov/radon/healthrisks.html
Chen, J., D. Moir and J. Whyte, Radiation Protection Bureau, Health Canada. "Canadian population risk of radon induced lung cancer: a reassessment based on the recent cross-Canada radon survey." Radiation Protection Dosimetry, November 2012. http://www.ncbi.nlm.nih.gov/pubmed/22874897
Note that the northern territories were not included in the 2007 survey.
New in 2018, tenants were included provided they had living space on or below the ground floor, and qualification was extended to basement dwelling space.
Those who said "don't know" when asked "what is radon" were skipped over the self-knowledge rating question, but have been included as "know almost nothing" in this analysis.
Note that many will likely continue to feel radon removal is difficult if it requires a professional and costs over $1,000.
As in previous waves, response to this question is likely being based on reasonable assumptions: that a) such remedial action would be possible, that b) would be something they could afford, and c) such repairs would be important to maintaining family health. It should be noted that these results also likely overstate the intention to remediate radon as it is a socially desirable response.
A similar question was asked in 2007, but the (unread) response categories were changed in 2013, making direct comparison challenging. However, in 2007 Health Canada and the federal government were the most cited sources; one-third were unable to recall the sponsor.
Qualified dwellings include single detached houses, semi-detached houses, lower-floor or duplexes and apartments, basement apartments, townhouses, condominiums, mobile homes.
Note that the 2007 and 2013 surveys were conducted with homeowners only; renters were disqualified. Renters were included in 2018 provided they were household decision makers and lived in a unit with ground floor or basement living space.