Section 6—Interest-bearing debt
Public Accounts of Canada 2016 Volume I—Top of the page Navigation
Table of contents
-
Unmatured debt
- Marketable bonds
- Treasury bills
- Retail debt
- Canada bills
- Medium-term notes
- Unamortized discounts and premiums on market debt
- Cross-currency swap revaluation
- Interest rates
- Maturity of Government debt
- Statement of all borrowing transactions on behalf of Her Majesty
- Obligation related to capital leases
- Pensions and other future benefits
- Other liabilities
- Supplementary statements
Interest-bearing debt
This section contains information on the interest-bearing debt of the Government. Interest-bearing debt includes the unmatured debt and pensions, other future benefits and other liabilities.
Some tables in this section present the continuity of accounts, by showing the opening and closing balances, as well as receipts and other credits, and payments and other charges.
Table 6.1 presents the transactions and year-end balances of interest-bearing debt. Chart 6A presents interest-bearing debt by category for the current fiscal year.
The financial statements of the Canada Pension Plan, the Government Annuities Account and the Royal Canadian Mounted Police (Dependants) Pension Fund, together with the Independent Auditor's Reports thereon, are presented at the end of this section.
A narrative description is provided for accounts reported in some tables. Such descriptions follow the same presentation order as their respective tables.
Table summary
The table presents, in dollars, the transactions and balances of interest-bearing debt for the current fiscal year. It consists of five columns: a listing of interest-bearing debt categories; the opening balance for the debt as at April 1 of the current year; Receipts and other credits; Payments and other charges; the closing balance for the debt as at March 31 of the current year. The first series of rows presents unmatured debt categories, followed by a total. The second series of rows presents pensions, other future benefits and other liabilities, followed by a total. A final row presents the total for this table.
| April 1, 2015 | Receipts and other credits | Payments and other charges | March 31, 2016 | |
|---|---|---|---|---|
| Unmatured debtLink to footnote 1 | ||||
| Payable in Canadian currency | ||||
| Marketable bonds, Table 6.2 | 487,881,385,000 | 93,474,530,500 | 77,288,201,000 | 504,067,714,500 |
| Treasury bills, Table 6.3 | 135,691,690,000 | 357,500,000,000 | 355,091,690,000 | 138,100,000,000 |
| Retail debt, Table 6.4 | 5,659,734,773 | 1,876,054,521 | 2,459,736,148 | 5,076,053,146 |
| Subtotal | 629,232,809,773 | 452,850,585,021 | 434,839,627,148 | 647,243,767,646 |
| Payable in foreign currencies | ||||
| Marketable bonds, Table 6.2 | 14,754,356,126 | 554,272,154 | 3,078,215 | 15,305,550,065 |
| Canada bills, Table 6.5 | 3,788,566,525 | 25,557,491,161 | 24,598,654,641 | 4,747,403,045 |
| Medium-term notes, Table 6.6 | 1,724,145,000 | 705,300,000 | – | 2,429,445,000 |
| Subtotal | 20,267,067,651 | 26,817,063,315 | 24,601,732,856 | 22,482,398,110 |
| Total—Market Debt | 649,499,877,424 | 479,667,648,336 | 459,441,360,004 | 669,726,165,756 |
| Unamortized discounts and premiums on market debt, Table 6.7 | 4,295,595,310 | 2,231,037,011 | 1,479,803,188 | 5,046,829,133 |
| Total—Market Debt including unamortized discounts and premiums | 653,795,472,734 | 481,898,685,347 | 460,921,163,192 | 674,772,994,889 |
| Cross-currency swap revaluation | 6,669,558,394 | – | (negative 1,721,833,921) | 8,391,392,315 |
| Obligation related to capital leases, Table 6.12 | 3,709,577,586 | 60,433,238 | 293,129,169 | 3,476,881,655 |
| Other unmatured debt | 1,004,815,733 | 574,432,084 | 9,405,908 | 1,569,841,909 |
| Total—Unmatured debt | 665,179,424,447 | 482,533,550,669 | 459,501,864,348 | 688,211,110,768 |
| Pensions, other future benefits and other liabilities | ||||
| Public sector pensions, Table 6.15 | 152,664,206,404 | 17,340,863,453 | 17,778,004,429 | 152,227,065,428 |
| Other employee and veteran future benefits, Table 6.28 | 76,140,483,000 | 14,237,268,000 | 4,696,440,000 | 85,681,311,000 |
| Other liabilities | ||||
| Due to Canada Pension Plan, Table 6.29 | 212,059,870 | 74,740,072,278 | 74,917,403,413 | 34,728,735 |
| Government Annuities Account | 149,598,084 | 9,849,652 | 25,627,645 | 133,820,091 |
| Deposit and trust accounts, Table 6.30 | 1,674,525,011 | 894,329,922 | 1,124,183,636 | 1,444,671,297 |
| Other specified purpose accounts, Table 6.33 | 3,965,275,386 | 2,462,170,111 | 2,438,831,480 | 3,988,614,017 |
| Total | 6,001,458,351 | 78,106,421,963 | 78,506,046,174 | 5,601,834,140 |
| Total—Pensions, other future benefits and other liabilities | 234,806,147,755 | 109,684,553,416 | 100,980,490,603 | 243,510,210,568 |
| Total | 899,985,572,202 | 592,218,104,085 | 560,482,354,951 | 931,721,321,336 |
Chart 6A
Interest-bearing debt by category at March 31, 2016
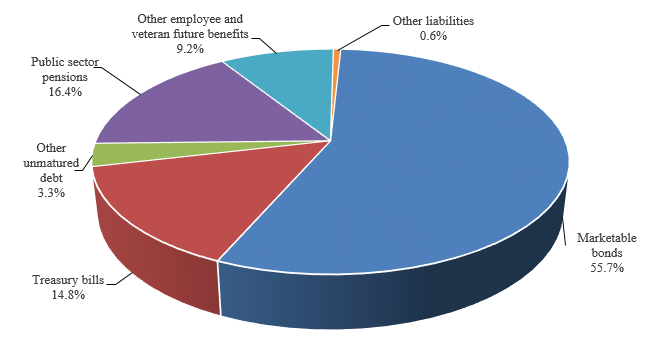
Image description
The graph "Interest-bearing debt by category at March 31, 2016" illustrates the composition of interest-bearing debt for the current year and the relative percentage to the total. The percentage by component is: Marketable Bonds 55.7%; Treasury bills 14.8%; Other unmatured debt 3.3%; Public sector pensions 16.4%; Other employee and veteran future benefits 9.2%; Other liabilities 0.6%.
Public Accounts of Canada 2016 Volume I—Bottom of the page Navigation
- Date modified: