
Prepared for Agriculture and Agri-Food Canada
Supplier Name: Earnscliffe Strategy Group
Contract Number: 01B68-190331/001/CY
Contract Value: $121,479.97 (including HST)
Contract Award Date: August 13, 2018
Date of Delivery: February 21, 2019
Registration Number: POR 031-18
For more information on this report, please contact Agriculture and Agri-Food Canada at: aafc.por-rop.aac@canada.ca
February 21, 2019
This public opinion research report presents the results of focus groups conducted by Earnscliffe Strategy Group on behalf of Agriculture and Agri-Food Canada. The research was conducted in October to December 2018.
Cette publication est aussi disponible en français sous le titre: Sondage 2018-2019 sur les enjeux stratégiques des producteurs (Vague VI) - Rapport de recherche quantitative
This publication may be reproduced for non-commercial purposes only. Prior written permission must be obtained from Agriculture and Agri-Food Canada. For more information on this report, please contact Agriculture and Agri-Food Canada at: aafc.por-rop.aac@canada.ca
Agriculture and Agri-food Canada
1341 Baseline Road
Ottawa, ON K1A 0C5
Catalogue Number: A22-623/1-2019E-PDF
International Standard Book Number (ISBN): 978-0-660-30864-7
Agriculture and Agri-Food Canada Number: 12906E
© Her Majesty the Queen in Right of Canada, as represented by the Minister of Agriculture and Agri-Food Canada, 2019
Earnscliffe Strategy Group (Earnscliffe) is pleased to present this report to Agriculture and Agri-Food Canada (AAFC) summarizing the results of the sixth wave of the Strategic Issues Survey of food producers.
AAFC regularly conducts public opinion research with producers to track key data points over time and to provide insight on new and evolving areas of interest related to farming and agriculture. AAFC contracted Earnscliffe in 2018 to conduct the sixth wave of the department's survey of producers and the second iteration of focus groups with producers. This report outlines solely the quantitative research process and findings. The qualitative phase is presented under a separate cover.
The findings of this research will be used to monitor any changes in the public opinion environment among producers, and to gather data on a variety of new areas of interest for AAFC, including benchmarks of the department's new multi-year agricultural policy framework, the Canadian Agricultural Partnership, that will be tracked over the next five years. The total cost to conduct this research was $121,479.97 including HST.
For the quantitative phase of this research project, Earnscliffe conducted a telephone survey of 1,504 producers aged 18 or older, who hold or share primary responsibility for making decisions regarding their farm operations with $10,000 or more in annual farm sales in 2017. Our quantitative sub-contractor for this project was Léger. The survey was conducted via telephone from Léger's centralized call-centre using their state of the art Computer Aided Telephone Interviewing (CATI) system. Léger relied on sample provided by Research Now SSI as they have proven to have very reliable phone sample. Research Now SSI's business sample is compiled using Dun & Bradstreet lists, which have been used in the past for this project with AAFC. The survey was conducted from October 22, 2018 to December 18, 2018 and was an average of 21 minutes in length.
As done in the past, quotas were set for producers by region and the data was weighted by province and sales volume to reflect the actual proportions found in the producer population, according to Statistics Canada's 2016 Census of Agriculture.
The objectives of the research were to explore optimism in the sector, including jobs and growth, the roles of government and agricultural industries in agricultural programming, perceptions of public trust in the sector, emergency planning and innovation.
The key findings from the research are presented below.
Research Firm: Earnscliffe Strategy Group Inc. (Earnscliffe)
Contract Number: 01B68-190331/001/CY
Contract award date: August 13, 2018
I hereby certify as a Representative of Earnscliffe Strategy Group that the final deliverables fully comply with the Government of Canada political neutrality requirements outlined in the Communications Policy of the Government of Canada and Procedures for Planning and Contracting Public Opinion Research. Specifically, the deliverables do not include information on electoral voting intentions, political party preferences, standings with the electorate or ratings of the performance of a political party or its leaders.
Signed:
Doug Anderson
Principal, Earnscliffe
Date: February 21, 2019
Earnscliffe Strategy Group (Earnscliffe) is pleased to present this report to Agriculture and Agri-Food Canada (AAFC) summarizing the results of the sixth wave of the Strategic Issues Survey of food producers.
AAFC regularly conducts public opinion research with producers to track key data points over time and to provide insight on new and evolving areas of interest related to farming and agriculture. AAFC contracted Earnscliffe in 2018 to conduct the sixth wave of the department's survey of producers and the second iteration of focus groups with producers. This report outlines solely the quantitative research process and findings. The qualitative phase is presented under a separate cover.
This study explored a variety of topics, including producers' view of the future of farming, innovation and public trust. The research also included questions concerning new trade agreements and their anticipated impact on the agricultural sector, emergency preparedness, AAFC initiatives and producers' interactions with AAFC. The findings from this research will be used to update tracking data, and will also serve as a baseline measurement of public opinion on new topics, including the Canadian Agricultural Partnership.
The specific objectives of the research to provide AAFC with up-to-date data on:
To meet the objectives outlined above, Earnscliffe conducted a telephone survey of 1,504 producers aged 18 or older who hold or share primary responsibility for making decisions regarding their farm operations with $10,000 or more in annual farm sales in 2017. The survey was conducted via telephone from our sub-contractor Léger's centralized call-centre using their state of the art Computer Aided Telephone Interviewing (CATI) system. The survey was conducted from October 22, 2018 to December 18, 2018 and was an average of 21 minutes in length. The margin of error for this sample of 1504 Canadian producers is +/-2.52%. The response rate among producers contacted via landline was 9.82%, and the response rate for producers contacted via cell phone was 6.08%.
Léger relied on sample provided by Research Now SSI. Research Now SSI's business sample is compiled using Dun & Bradstreet (D&B) lists, which have been used in the past for this project with AAFC. The sampling frame we used was based off the list of producers from D&B as it provided the greatest coverage within an affordable budget. The survey was completed on a random basis, in that sample was injected into the study on a randomized basis. This means the initial call on every unique contact was done in a randomized fashion.
During the course of data collection, one question (Q55. How many years have you been managing a farm business?) was inadvertently dropped from the interviewers' script. A return to sample was conducted by Léger to gather response data for this question. Léger was able to successfully re-contact 1096 respondents to answer this question, in addition to the 152 responses that had been collected during the initial survey field period, for a total of 1248 responses. Every unresolved number was called at least twice, and most were called at least 7 times.
Tables listing the SIC codes used for sampling, the counts available on the D&B list and the proportion of the sample that is constituted by each code on the D&B list can be found in the survey methodology report.
As done in the past, quotas were set for producers by region and the data was weighted by province and sales volume to reflect the actual proportions found in the producer population, according to Statistics Canada's 2016 Census of Agriculture.
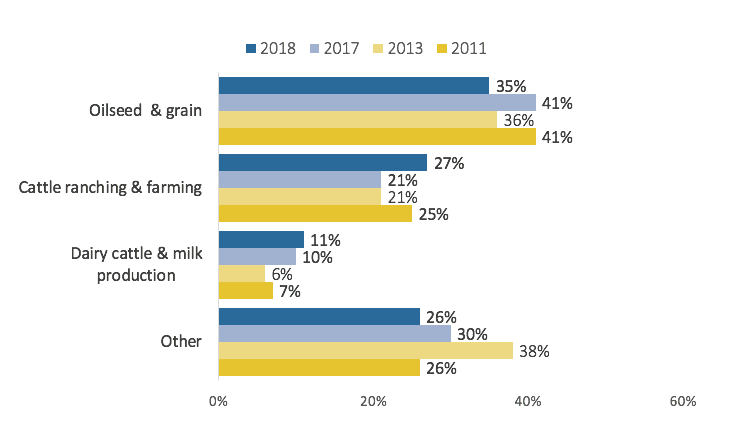
As has been the case since 2011, oilseed and grain farmers make up the plurality of producers surveyed, though the proportion fell slightly from 41% in 2017 to 35% in 2018. Cattle ranching and farming follow (27%), then dairy cattle and milk production (11%), a distribution consistent with previous waves. However, while the overall proportion of dairy farmers in this survey varies little from 2017 (10%), the percentage of producers who are cattle ranchers or farmers is up from 21% in both 2017 and 2013.
Of those surveyed, production type varies by region:
| 2018 | 2017 | 2013 | 2011 | |
|---|---|---|---|---|
| Oilseed and grain | 35 | 41 | 36 | 35 |
| Cattle ranching and farming | 27 | 21 | 21 | 25 |
| Dairy cattle and milk production | 11 | 10 | 6 | 7 |
| Other | 26 | 30 | 38 | 26 |
Q7. In 2017, what type of production contributed most to your gross farm revenue? Base: n=1504
After a decline in the percentage of farmers with sales between $10,000 and $100,000 annually from 2011 to 2017, this group has expanded slightly to 47% of producers surveyed. The proportion with sales between $100,000 to $250,000 remains similar to previous waves at 19%. In keeping with results from 2017, just over one third of producers surveyed report their total farm sales as $250,000 or more.
There is variation in annual farm sales of those surveyed:
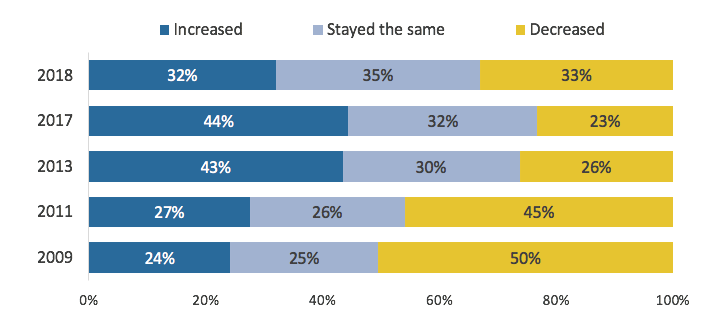
Roughly one in three (32%) feel their net farm income has increased over the last five years, representing a decline from 2017 (44%) and 2013 (43%). Equal percentages feel their net farm income has increased or decreased. One third (33%) describe their farm sales as having decreased – the highest proportion measured since the 2011 study.
| 2018 | 2017 | 2013 | 2011 | 2009 | |
|---|---|---|---|---|---|
| Increased | 32 | 44 | 43 | 27 | 24 |
| Stayed the same | 35 | 32 | 30 | 26 | 25 |
| Decreased | 33 | 23 | 26 | 45 | 50 |
Q56. Focusing now on net farm business income after operating expenses, during the last five years, has the net income of your operation? Base: n=1504. *Don't know / No response removed.
The change in producers' farm net income varied by education level, age, region and type of farm operation. Those more likely to feel their net farm income increased include:
Those who feel their net farm income decreased include:
As reported consistently since 2011, half of producers surveyed receive some form of off-farm income. This situation is more common among those who have attended or completed university (57%), who are between 45 and 54 years old (58%) and those whose farm sales are between $10,000 and $100,000 annually (65%).
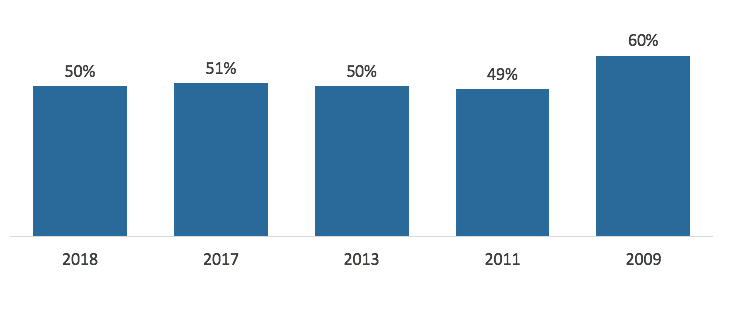
Off-farm income (Percentage who receive off-farm income)
Q58. Does your household receive off-farm income? Base: n=1504.
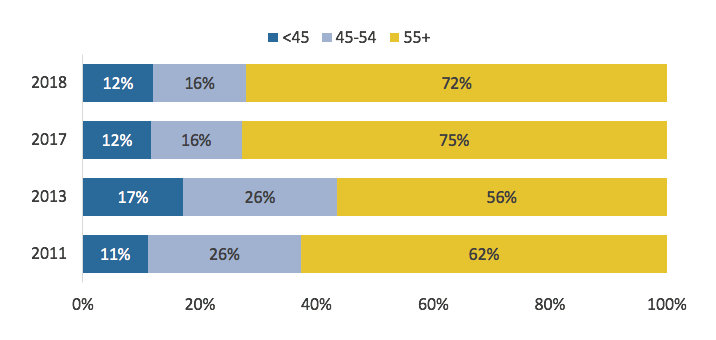
The age breakdown of producers surveyed is almost identical to 2017 data, with almost three-quarters of respondents aged 55 or older. Just under half of the farmers 55 and over are aged 65 or older. Just 12% of producers surveyed are under 45. Quebec is home to the largest group of younger farmers (21% are under 45), while Saskatchewan has the largest proportion of farmers 55 and over (86%). Of note, Saskatchewan and Atlantic Canada are home to the largest percentage of farmers 65 and over (43% in both cases).
| Age group | 2018 |
|---|---|
| Less than 45 | 12 |
| 45-54 | 16 |
| 55-64 | 37 |
| 65 or older | 35 |
| Q3. For classification purposes, in what year were you born? Base: n=1504. | |
| Age group | 2018 | 2017 | 2013 | 2011 |
|---|---|---|---|---|
| Less than 45 | 12 | 12 | 17 | 11 |
| 45-54 | 16 | 16 | 26 | 26 |
| 55 or older | 72 | 75 | 56 | 62 |
Q3. For classification purposes, in what year were you born? Base: n=1504.
This wave's respondents include slightly more female producers (28%) than in previous iterations of this survey. Just over one-third (35%) of producers under 55 are women, compared to 26% of those aged 55 and over. It is worth noting that the highest proportion of female producers is among the 45-54 age group (38%).
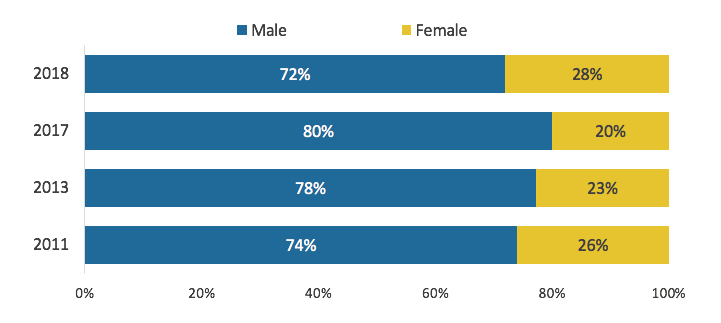
| 2018 | 2017 | 2013 | 2011 | |
|---|---|---|---|---|
| Males | 72 | 80 | 78 | 74 |
| Females | 28 | 20 | 23 | 26 |
Q4. Gender – RECORD. Base: n=1504.
There have been a few small shifts in education levels from the previous wave. The 2018 survey includes fewer farmers who have not completed high school (11%) and who have some or completed a technical, vocational or trade program (9%). A greater proportion in this survey have completed high school (30%), have attended some or completed college (21%) or university (29%) than in any previous wave dating back to 2011.
Educational attainment varies. Gender, age, income and years spent managing a farming business all appear related to educational attainment:
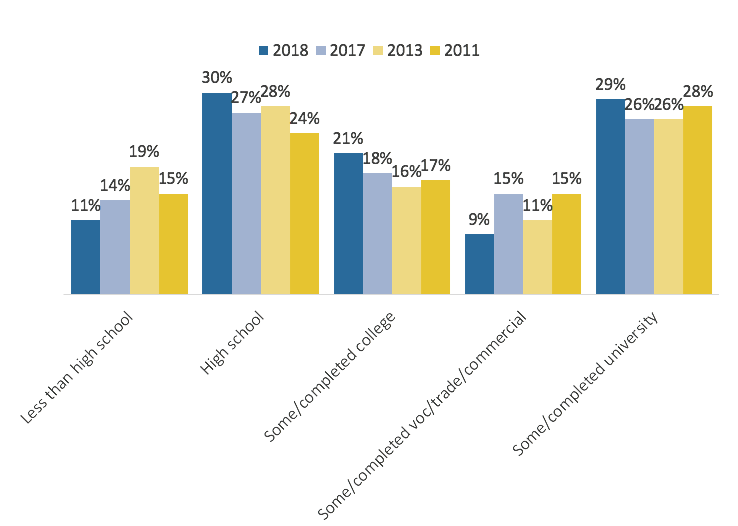
| 2018 | 2017 | 2013 | 2011 | |
|---|---|---|---|---|
| Less than high school | 11 | 14 | 19 | 15 |
| High school | 30 | 27 | 28 | 24 |
| Some/completed college | 21 | 18 | 16 | 17 |
| Some/ completed vocational/trade/commercial | 9 | 15 | 11 | 15 |
| Some/completed university | 29 | 26 | 26 | 28 |
Q57. What is the highest level of formal education that you have completed? Base: n=1504.
When it comes to length of time as an operator, the producers surveyed in this wave of research closely resemble the sample from 2017. Just over one quarter (26%) have been farming less than 25 years, just over one third have been farming for 25-39 years (36%) and for 40 years or more (37%). The 2013 and 2011 studies included a slightly higher proportion of farmers who had been operating for under 25 years, and fewer who had been operating for 40 years or more.
Female producers are more likely to have less than 25 years of experience (30%) than male producers (25%). Almost half of oilseed or grain farmers (48%) have been managing a farm business for 40 or more years. The plurality of cattle farmers and ranchers (44%) have been in business for 40 or more years. In contrast, the plurality (41%) of dairy farmers have between 25-39 years of experience. In terms of variation by region, over half of farmers in Saskatchewan (58%) have been running their operation for over 40 years. Quebec farmers are the newest to the business – 21% have been farming for over 40 years, and 38% have been farming for less than 25 years.
| 2018 | 2017 | 2013 | 2011 | |
|---|---|---|---|---|
| Less than 25 years | 26 | 26 | 37 | 32 |
| 25 to 39 years | 36 | 37 | 38 | 43 |
| 40 years or older | 37 | 37 | 26 | 26 |
Q55. How many years have you been managing a farm business? (n=1248) | ||||
When asked what the top issue facing Canadian agriculture over the next five years will be, trade and international barriers emerged as the greatest concern(16%), followed by production and input costs(13%), weather (11%) and commodity prices (11%). The next tier of responses, ranging from 3% to 5%, are labour shortages, profitability and viability of the sector, marketing/marketing boards/new markets, general concerns about government and the carbon tax.
Responses were not uniform across the provinces. Producers in Ontario (23%) and Manitoba (25%) are more concerned about the challenges trade may present in the future. Production costs are of greater concern in Alberta (20%). Producers in Quebec appear to be more sensitive to profitability and overall viability of the sector (11%), as well as labour shortages (15%). Producers in Atlantic Canada share Quebeckers' concern about overall profitability (17%). The carbon tax appears to be of greater concern in Manitoba (7%) and Saskatchewan (8%). Commodity prices stand out in Ontario and Saskatchewan (both 15%). Finally, producers in BC are significantly more concerned about weather (18%) than their counterparts in other regions.
Top issue also varies by main production type. Dairy farmers feel strongly about the role of trade in the future - well over one-third (38%) list it as the single greatest issue. Oilseed and grains farmers are more concerned about production and input costs (17%) and commodity prices (17%). Cattle ranchers (13%) and grain/oilseed producers (9%) are more concerned about the weather than dairy farmers (3%).
Higher income farmers (with sales of $250,000 or more) are more concerned about international trade (23%), while farmers with sales between $10,000 and $100,000 are more likely to name weather as their top issue (13%). Female farmers are more likely than their male counterparts to name weather as a top issue (14%). Finally, producers under 45 are more concerned about labour shortages (13%) than average.
In previous waves of this study, multiple responses to the question which asks producers the single most important issue facing Canadian agriculture were collected. Only one response was collected in this wave, so direct comparisons between the percentage of farmers who named a certain issue from one wave to the next are not possible. However, it is worth noting that overall, trade ranked higher than it has in the past (it was the second greatest concern in 2017, and was not in the top five in 2013), moving ahead of commodity prices and replacing production costs or input costs as the top issue.
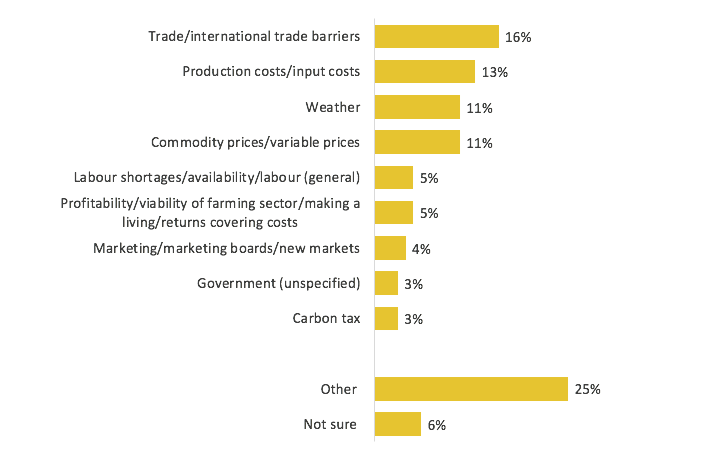
| Total (males and females) (%) | |
|---|---|
| Trade/international trade barriers | 16 |
| Production costs / input costs | 13 |
| Weather | 11 |
| Commodity prices/ variable prices | 11 |
| Labour shortages/ availability/labour (general) | 5 |
| Profitability/viability of farming sector/making a living/returns covering costs | 5 |
| Marketing/marketing boards/new markets | 4 |
| Government (unspecified) | 3 |
| Carbon tax | 3 |
| Other | 25 |
| Not sure | 6 |
Q8. Looking ahead, what do think will be the single most important issue facing Canadian agriculture over the next 5 years? Base: n=1504. *Response categories less than 3% have been collapsed into “Other”.
Since 2013, farmers surveyed have grown increasingly pessimistic about their farm's outlook. The percentage of farmers who expect their operation will be much or a little better off has fallen by 13% since 2013, to 35% in 2018. Of that 35%, just 7% feel their farm will be doing much better in five years. On the opposite end of the spectrum, another 13% more than in 2013 expect their farm will be worse off, a total of 28%. The proportion who do not feel much will change has remained stable at just under one-third (29%).
Producers who are more optimistic (think that their farm operation will be much/a little better off) include:
Producers who are more pessimistic (think that their farm operation will be a little/much worse off) include:
Quebec producers fall into both categories – 46% expect they will be better off, while 35% expect they will be worse off. Significantly fewer than average (15%) expect no change.
Those who anticipate things will overall remain the same for them and their operation include:
Pessimistic producers, who expect they will be worse off, have a similar ranking of most important issues facing Canadian agriculture relative to the entire sample, but exhibit greater concern about a few areas. For example, 21% name trade as a top issue, compared to 16% overall. Production costs are also concerning to a larger proportion of these farmers (16%). They are less likely to name weather (7%) and commodity prices (7%) as a top issue.
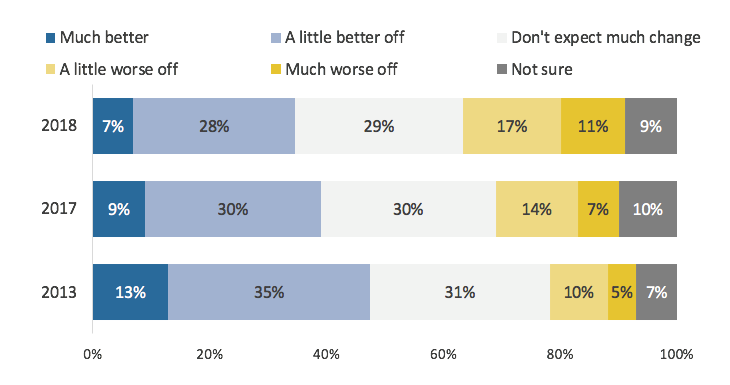
| 2018 | 2017 | 2013 | |
|---|---|---|---|
| Much better | 7 | 9 | 13 |
| A little better off | 28 | 30 | 35 |
| Don't expect much change | 29 | 30 | 31 |
| A little worse off | 17 | 14 | 10 |
| Much worse off | 11 | 7 | 5 |
| Not sure | 9 | 10 | 7 |
Q9. Looking ahead, how much better or worse off will your farm operation be in five years, compared to how it is now? Base: n=1504
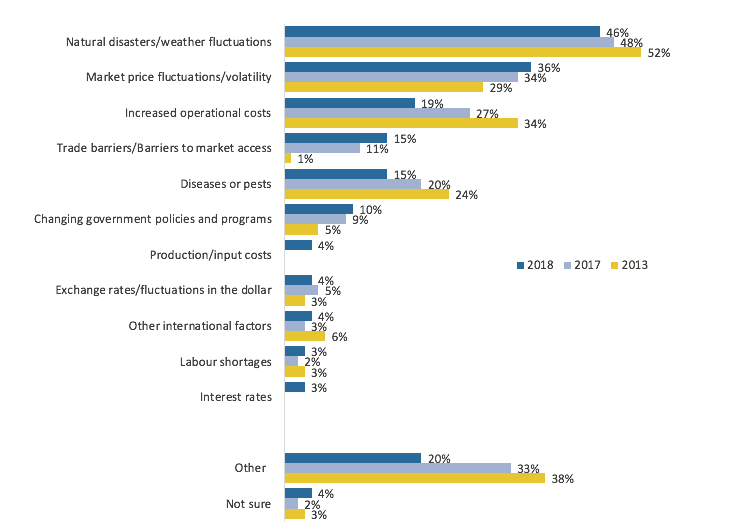
Natural disasters and weather fluctuations remain the top business risk for producers, though the percentage who name this risk has fallen over the years, from 52% in 2013 to 46% in 2018. As in 2017, market price fluctuation and volatility are perceived to be the second biggest risk (36%). Concern about the risk presented by operational costs has fallen from 34% in 2013, to 27% in 2017 and 19% this wave. Similarly, concern about diseases or pests has fallen wave-over-wave, with 24% naming them as a risk in 2013, to 20% in 2017 to 15% in 2018. Trade is a growing concern when it comes to current risks, up from just 1% in 2013, to 11% in 2017 and 15% this wave.
| 2018 | 2017 | 2013 | |
|---|---|---|---|
| Natural disasters/weather fluctuations | 46 | 48 | 52 |
| Market price fluctuations/ volatility | 36 | 34 | 29 |
| Increased operation costs | 19 | 27 | 34 |
| Trade barriers/ to market barriers | 15 | 11 | 1 |
| Disease or pests | 15 | 20 | 24 |
| Changing government policies and programs | 10 | 9 | 5 |
| Production/input costs | 4 | n/a | n/a |
| Exchange rates/fluctuations in the dollar | 4 | 5 | 3 |
| Other international factors | 4 | 3 | 6 |
| Labour shortage | 3 | 2 | 3 |
| Interest rates | 3 | n/a | n/a |
| Other | 20 | 33 | 38 |
| Not sure | 4 | 2 | 3 |
Q10. What type of business risks does your farming operation face? Base: n=1504. *Unless shown for tracking, response categories less than 3% have been collapsed into “Other”.
There are some notable differences in different groups of producers' views on the subject of business risks:
Almost all producers (94%) claim that they have taken some sort of action to manage or plan for emergency risks their farm operation may face. In fact, most have taken multiple actions, with an average of 4.5 actions taken per producer. Just 14% have only taken one action, while 41% have taken between 2 and 5 actions, and 39% have taken 6 or more. Younger producers have taken more steps to prepare for emergencies – almost half of those under 45 have taken 6 or more actions (49%), compared to 41% of those ages 45-54, 40% of those 55-64 and 33% of those 65 or more.
| Number of Actions Taken | 2018 |
|---|---|
| 0 | 6 |
| 1 | 14 |
| 2-5 | 41 |
| 6 or more | 39 |
Q11. What, if any, actions have you taken to manage or plan for the emergency risks that your farm operation may face? Base: n=1504. | |
The most common step taken is environmental or sustainability measures (62%), followed by traceability systems (53%) and animal welfare measures (52%). Almost half have an emergency kit (49%) and power generator (48%). Slightly fewer say they have stockpiled supplies (43%), participate in private insurance programs (40%) or a business risk management program (39%). Just over a third (36%) have taken biosecurity measures. Few have conducted simulation exercises to respond to emergencies (13%), have government insurance (2%) or have made efforts to diversify their farm (1%).
| Action Taken | 2018 |
|---|---|
| Environment and/or sustainability measures | 62 |
| Traceability system | 53 |
| Animal welfare measures | 52 |
| Emergency kit | 49 |
| Power generator | 48 |
| Stockpiled supplies | 43 |
| Participation in a private insurance program | 40 |
| Participation in a business risk management program offered by federal and/or provincial/territorial governments | 39 |
| Biosecurity measures | 36 |
| Simulation exercises to practice response activities | 13 |
| Government insurance/crop insurance | 2 |
| Diversify the farm | 1 |
| Other | 5 |
| None | 6 |
Q11. What, if any, actions have you taken to manage or plan for the emergency risks that your farm operation may face? Base: n=1504. | |
The activities producers have taken to prepare for risks and emergencies vary by region, age, sales and education:
One third of producers surveyed have an emergency management plan in place. More female (43%) than male producers (29%) have a plan, as well as those ages 45-54 (42%) compared to other age categories (33% of producers under 45 and between 45 and 54, and 30% of those 65 years or more). Having an emergency management plan is more common in Ontario (39%) and Alberta (38%), and less common in Quebec (23%), Manitoba (23%), and Saskatchewan (28%). Producers who have attended or completed university (40%) and those whose farm sales total $250,000 or greater (38%) are also more likely to have a plan.
Producers' sense of outlook for the future does not correlate with whether or not they have an emergency management plan. Producers who expect things to be worse are neither more nor less likely to have a plan than those who feel things will improve (one-third of each group have a plan).
However, those who feel the top issue facing the sector is labour shortages are more likely to have an emergency management plan (48%). Similarly, those who feel the greatest business risk is changing government policies and programs are more likely than other producers to have an emergency management plan (48%).
| 2018 | |
|---|---|
| Yes | 33 |
| No | 61 |
| No, but are in the process of making one | 4 |
| Don't know/No response | 1 |
Q12. Do you have an Emergency Management Plan in place for your farm operation? Base: n=1504. | |
Most producers are aware of all three recent trade agreements (CETA, CPTPP and CUSMA). Most producers surveyed (85%) indicated being able to offer an impression of how of at least one of the three agreements would impact their farm operation, including 62% who provide their sense of how all three will affect their farm operation. Across all producers types, respondents were most likely to offer an opinion about CUSMA. Overall, dairy farmers seem to be paying closest attention to the trade agreements tested.
Producers anticipate CETA and CPTPP will have similar effects on their farm operation. Over one third (37%) feel CPTPP will have a positive impact on their farm, and 35% believe CETA will have a positive impact. In contrast, just 24% believe CUSMA will have a positive impact on their farm operation.
Views on the agreements are not uniform across types of producers. Dairy farmers in particular are sensitive to the effects of trade agreements on their operations:
| Producer Type | CETA | CPTPP | CUSMA |
|---|---|---|---|
| Grain/Oilseed Producers | 84 | 83 | 90 |
| Cattle Ranching/Farming | 79 | 74 | 86 |
| Dairy Cattle/Milk Production | 88 | 94 | 98 |
| Other | 74 | 74 | 84 |
Q13-15. What is your impression of how each of the following will impact your farm operation? Base: n=1401. | |||
| Impression | CETA | CPTPP | CUSMA |
|---|---|---|---|
| Very positive | 5 | 6 | 6 |
| Somewhat positive | 30 | 31 | 18 |
| Neither positive or negative | 21 | 18 | 19 |
| Somewhat negative | 14 | 13 | 23 |
| Very negative | 10 | 11 | 22 |
| Don't know about/unfamiliar with the trade agreement | 12 | 12 | 6 |
| Don't know how the trade agreement will affect my farm operation | 6 | 7 | 5 |
| Prefer not to say | 2 | 2 | 1 |
Q13-15. What is your impression of how each of the following will impact your farm operation? Base: n=1401. | |||
The vast majority of producers (79%) feel that at least one of these trade agreements will affect their farm operation, but opinion is torn over how farm operations will be impacted. The proportion of producers who feel there will be positive impacts from at least one of these trade agreements and no negative impacts from any (29%) is slightly lower than the proportion who feel there will be negative impacts from at least one of these trade agreements and no positive impacts from any (34%). Another 17% of producers describe at least one agreement as likely to have a positive impact and at least one other agreement as likely to have a negative impact. One in five (21%) do not express an expectation of any positive or negative impact of any of the three agreements.
| Impression | 2018 |
|---|---|
| Only positive impacts | 29 |
| Both positive and negative impacts | 17 |
| Only negative impacts | 34 |
| No impact expressed | 21 |
Q13-15. What is your impression of how each of the following will impact your farm operation? Base: n=1401. | |
Among that 17% who have different impressions of the impact of each of the three trade deals, the CUSMA is clearly the deal that they more often see as problematic. Within this segment of producers, 57% feel that CETA will have a positive impact and 26% feel it will have a negative impact on their operations. In terms of the CPTPP, two-thirds (68%) feel that CETA will have a positive impact and 17% feel it will have a negative impact on their operations. However, when it comes to CUSMA, only one in five (20%) feel it have a positive impact and 77% feel it will have a negative impact on their operations.
Similarly, among the 30% of producers who see none of these agreements as having a positive impact and at least one as having a negative impact, 93% expect CUSMA to have a negative impact on their operations, compared to 62% feeling that way about CPTPP and 60% expecting CETA to have a negative impact.
Views on the agreements are not uniform across types of producers. Dairy farmers in particular are sensitive to the effects of trade agreements on their operations:
| Trade Agreement | Oilseed/ Grain | Cattle Ranching/ Farming | Dairy Cattle/ Milk Production |
|---|---|---|---|
| CETA | 18 | 16 | 74 |
| CPTPP | 17 | 13 | 79 |
| CUSMA | 38 | 41 | 88 |
Q13-15. What is your impression of how each of the following will impact your farm operation? Base: n=1401. | |||
Among those who think CUSMA will have a negative impact, the top reason for their concern is loss of market share (19%), followed by a sense that the government is not looking out for farmers or keeping its promises (13%). Lower commodity prices (12%), the fear that the agreement gives the United States too much power (11%) and general unease with the American government (11%) follow. Among those who feel CUSMA will have a positive impact on their operation, 43% reason that the agreement will make trade easier and provide stability, while another 42% expect it will improve market access.
| Rationale | 2018 |
|---|---|
| Loss of market share | 19 |
| Government is not looking out for us/keeping its promises | 13 |
| Lower commodity prices/prices will drop | 12 |
| Gives the United States too much power | 11 |
| Due to United States government/Donald Trump/American protectionism | 11 |
| Will increase imports | 10 |
| Barriers to market access | 8 |
| Decreases my profitability | 5 |
| Too many tariffs | 4 |
| Affects supply management | 3 |
| Will reduce production/impede production | 3 |
| Increased cost of equipment | 2 |
| Other | 14 |
| Don't know/No response | 10 |
Q16. [If respondent feels CUSMA will have a positive or negative impact] Why do you feel USMCA will have a [If Q15=1 or 2, insert “positive”/If Q15=3 OR 4, insert “negative”] impact on your farm operation? Note: post Dec 12, 2018 this question read “Why do you feel CUSMA will have a [If Q15=1 or 2, insert “positive”/If Q15=3 or 4, insert “negative”] impact on your farm operation? Base: Think CUSMA will have a negative impact on their farm operation, n=590. | |
| Rationale | 2018 |
|---|---|
| It will make trade easier/keep trade flowing/provide stability | 43 |
| Will improve exports/better market access | 42 |
| Commodity prices will improve | 6 |
| Could reduce/remove some tariffs | 4 |
| Due to United States government/Donald Trump/American protectionism | 1 |
| Too many tariffs | 1 |
| Other | 4 |
| Don't know/No response | 14 |
Q16. [If respondent feels CUSMA will have a positive or negative impact] Why do you feel USMCA will have a [If Q15=1 or 2, insert “positive”/if Q15=3 or 4, insert “negative”] impact on your farm operation? Note: post Dec 12, 2018 this question read “Why do you feel CUSMA will have a [If Q15=1 or 2, insert “positive”/if Q15=3 or 4, insert “negative”] impact on your farm operation? Base: Think CUSMA will have a positive impact on their farm operation, n=388. | |
There is widespread support among producers to diversify markets to help grow the sector. Almost two-thirds (64%) feel it is very important, and another 22% agree it is somewhat important. Dairy farmers are marginally more likely to believe diversification is only slightly important (14%) or not important at all (5%), but even so, over half (52%) consider it to be an important objective.
| Importance | Total | Oilseed/Grain Producers | Cattle Ranching/Farming | Dairy Cattle/Milk Production | Other |
|---|---|---|---|---|---|
| Very important | 64 | 65 | 62 | 52 | 69 |
| Moderately important | 22 | 22 | 26 | 25 | 17 |
| Slightly important | 10 | 10 | 8 | 14 | 11 |
| Not important at all | 2 | 2 | 1 | 5 | 1 |
| Don't know/No response | 3 | 2 | 5 | 4 | 2 |
Q17. How important, if at all, do you feel diversification of markets is for the growth of the Canadian agricultural sector? Base: n=1504. | |||||
Just over one-quarter (28%) have heard of the Canadian Agricultural Partnership (the Partnership). Similarly, 28% have heard of a Food Policy for Canada. Twelve percent of the producers surveyed have heard of both. Farmers who have attended or completed university and those whose sales are equal to or greater than $250,000 report higher levels of familiarity with both. Farmers in Quebec (37%) and those aged 45-54 (34%) are more likely to have heard of the Partnership, while farmers 65 and older are among the least likely to have heard of it (24%).
It is worth noting that 2018 was the Partnership's first year, replacing Growing Forward 2. Growing Forward 2 was at the end of its lifecycle and awareness of the policy framework was significantly higher (64%) in the previous wave of this survey compared to current awareness of the Partnership.
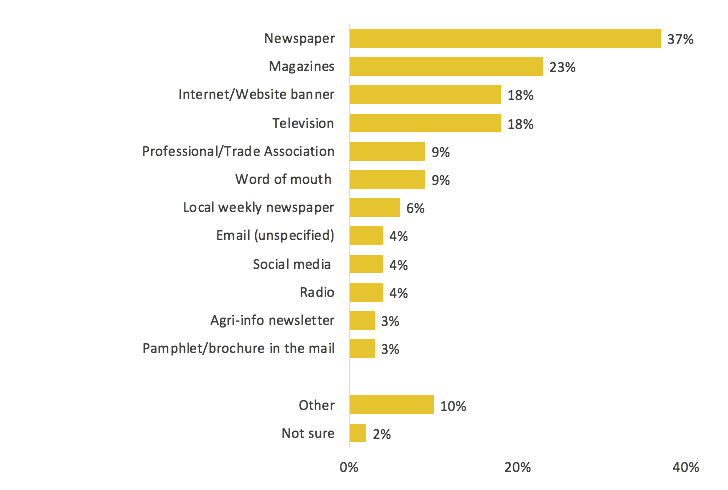
Among those who have heard of the Partnership, over one-third (37%) became aware of it by reading the newspaper. Just under one-quarter (23%) heard about the Partnership in a magazine, while equal proportions heard about the program on the internet or on TV (18%). Overall, younger producers (under 45) are more likely to have heard about the Partnership on social media (18%), than the older cohorts. A larger percentage of the 55 and over group heard about the program in the newspaper (41%).
| Total | |
|---|---|
| Newspaper | 37% |
| Magazines | 23% |
| Internet/Website banner | 18% |
| Television | 18% |
| Professional/trade association | 9% |
| Word of mouth | 9 |
| Local weekly newspaper | 6% |
| Email (unspecified) | 4% |
| Social media | 4% |
| Radio | 4% |
| Agri-info newsletter | 3 |
| Pamphlet/brochure in the mail | 3% |
| Other | 10% |
| Not sure | 2% |
Q19. Where did you see, hear or read about this? Base: Have heard of the Partnership, n=450. *Answer categories less than 3% have been collapsed into “Other”.
Those who have heard of the Partnership are twice as likely to hold positive impressions (49%) than negative impressions (25%), while one-fifth (20%) have a neutral impression. Regionally, positive impressions are highest in Saskatchewan (60% have a very or somewhat positive impression) and lowest in Quebec (21% have a very or somewhat positive impression).
| Impression | 2018 |
|---|---|
| Very positive | 10 |
| Somewhat positive | 39 |
| Neither positive or negative | 20 |
| Somewhat negative | 14 |
| Very negative | 11 |
| Don't know/No response | 6 |
Q20. What is your impression of the Canadian Agricultural Partnership? Base: Have heard of the Partnership, n=450. | |
Familiarity with programming under the Partnership is mixed, with 48% being very or somewhat familiar, while 52% are slightly or not at all familiar. Of note, familiarity is higher among English speakers (50% are very or somewhat familiar) than among French speakers (38%). Producers who have attended or completed university are also more familiar with the programming and services (54%).
| Familiarity | 2018 |
|---|---|
| Very familiar | 13 |
| Somewhat familiar | 34 |
| Slightly familiar | 35 |
| Not at all familiar | 17 |
| Don't know/No response | 1 |
Q21. How familiar are you with programming and services available under the Canadian Agricultural Partnership? Base: Have heard of the Partnership, n=450. | |
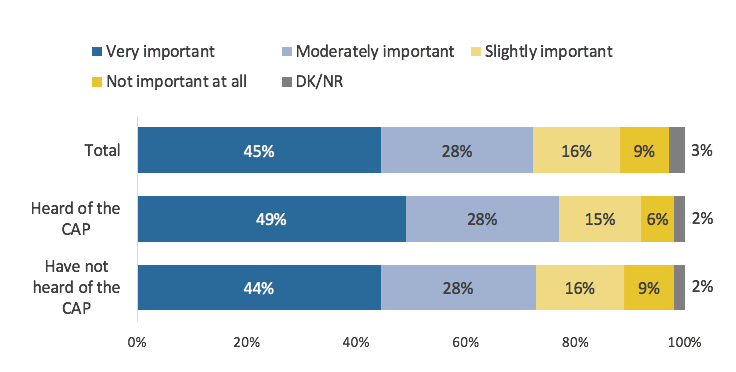
Regardless of whether or not they have heard of the Partnership, the vast majority agree the Partnership is important. In fact, almost half (45%) go as far as to say it is very important. There are some regional and demographic differences in opinion:
| Very important | Moderately important | Slightly important | Not important at all | Don't know/no response | |
|---|---|---|---|---|---|
| Total | 45 | 28 | 16 | 9 | 3 |
| Heard of the CAP | 49 | 28 | 15 | 6 | 2 |
| Have not heard of the CAP | 44 | 28 | 16 | 9 | 2 |
Q22. The Canadian Agriculture Partnership is a 5 year, $3 billion federal-provincial-territorial agreement that replaced Growing Forward 2 and was announced earlier this year. The money will be used to help farmers and the agricultural sector in a variety of ways including investing in agricultural research and expanding markets. As well, some of the money will be directly accessible to farmers who can take actions to do such things as adapt to climate change, conserve water and soil resources, or grow their business. Given this information, how important, if at all, do you believe these investments are for the sector? Base: n=1504.
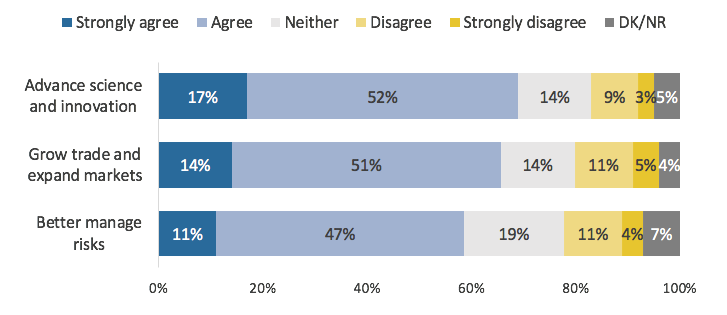
The majority of farmers feel the Partnership could help the sector advance science, grow trade and better manage risks, but agreement is soft. For example, 17% strongly agree the Partnership will help the sector advance science and innovation, while another 52% agree. Similarly, 14% strongly agree and 51% agree the Partnership could grow trade and expand markets. Slightly fewer agree it will help the sector better manage risks (11% strongly agree and 47% agree).
| Strongly agree | Agree | Neither | Disagree | Strongly disagree | Don't know/ no response | |
|---|---|---|---|---|---|---|
| Advanced science and innovation | 17 | 52 | 14 | 9 | 3 | 5 |
| Grow trade and expand markets | 14 | 51 | 14 | 11 | 5 | 4 |
| Better manage risks | 11 | 47 | 19 | 11 | 4 | 7 |
Q23-25. To what extent do you agree or disagree that the Canadian Agricultural Partnership will help the sector to: Base: n=1504.
Almost two-thirds (64%) are likely to look into available programming for their farm, while one-quarter (24%) are not very or not at all likely to do so. Twelve percent claim to have already looked into programming. Among younger farmers (under 45), the percentage rises to 22%. Some producers are more likely to seek out information than others:
| Likelihood | 2018 |
|---|---|
| Very likely | 30 |
| Somewhat likely | 34 |
| Not very likely | 15 |
| Not at all likely | 9 |
| Have already looked into programming | 12 |
| Don't know/No response | 1 |
Q26. How likely are you to look into what programs are available for your farm operation? Base: n=1504. | |
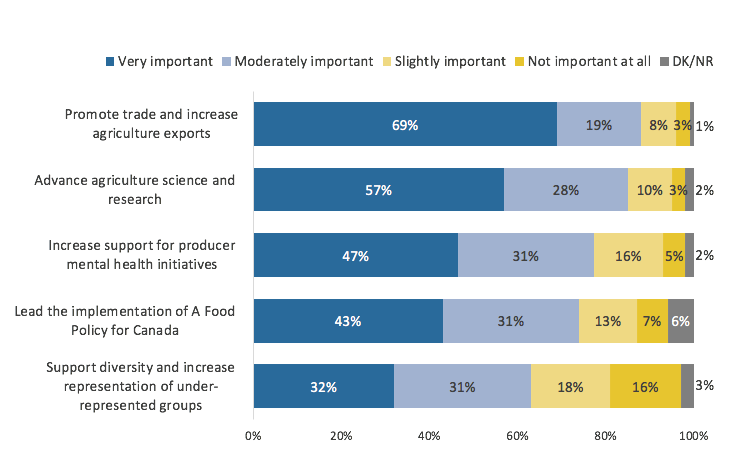
When asked to rate the importance of a series of agricultural priorities, promoting trade and increasing agricultural exports emerges as the most important. Over two-thirds (69%) believe promoting trade is a very important priority, while another 19% say it is moderately important. Over half also feel advancing agricultural science and research is very important, with another 28% saying it is somewhat important. Just under half place strong importance on increasing support for mental health initiatives (47%) and leading the implementation of a Food Policy for Canada (43%), though large majorities agree that both are at least of moderate importance. Supporting diversity and increasing representation of under-represented groups receives less support – 32% say it is very important and 31% feel it is somewhat important.
Promoting trade is universally rated an important issue, but appears to be particularly important for farmers in Manitoba (78% say very important) and Saskatchewan (77% say very important). Producers in the Prairies are less likely to view implementing A Food Policy for Canada as an important priority for government – 29% in Manitoba say this is a very important priority, 36% in Saskatchewan and 27% in Alberta.
Diversity and increasing representation of under-represented groups is more important for female farmers (38% say very important) and farmers in Quebec (48%) and Ontario (39%). Farmers with sales between $10,000 and $100,000 also view this priority as more important than the farmers with higher sales – 37% say it is very important.
| Very important | Moderately important | Slightly important | Not important at all | Don't know/ no response | |
|---|---|---|---|---|---|
| Promote trade and increase agriculture exports | 69 | 19 | 8 | 3 | 1 |
| Advanced agriculture science research | 57 | 28 | 10 | 3 | 2 |
| Increase support for producer mental health initiatives | 47 | 31 | 13 | 7 | 6 |
| Lead the implementation of a food policy for Canada | 43 | 31 | 13 | 7 | 6 |
| Support diversity and increase representation of underrepresented groups | 32 | 31 | 18 | 16 | 3 |
Q28-32. How important, if at all, is it for the Government of Canada to support each of the following priorities: Base: n=1488.
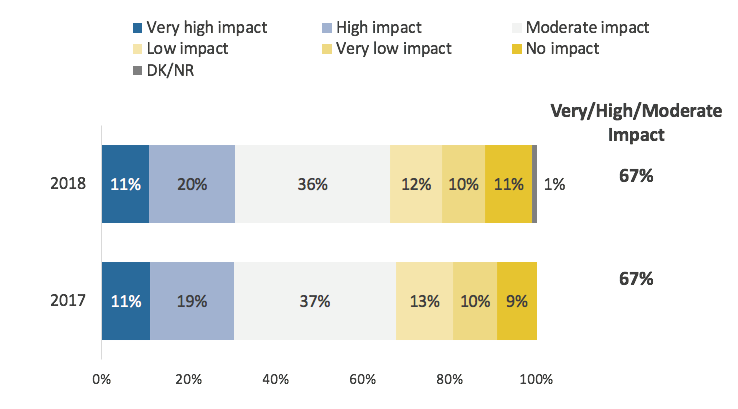
The majority of producers (67%) continue to feel that public perceptions have at least a moderate impact on their farm operations. This represents no real change since 2017.
| 2018 | 2017 | |
|---|---|---|
| Very high impact | 11 | 11 |
| High impact | 20 | 19 |
| Moderate impact | 36 | 37 |
| Low impact | 12 | 13 |
| Very low impact | 10 | 10 |
| No impact | 11 | 9 |
| Don't know / No response | 1% | - |
Q34. To what extent do public perceptions about agriculture and food production currently impact the way you operate your farm and the decisions you make? Base: n=1504.
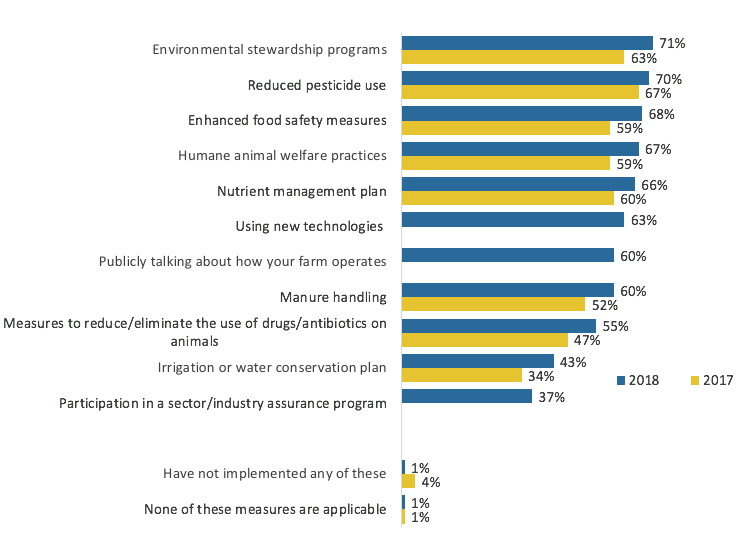
Virtually all producers surveyed (98%) claim to have adopted at least one trust-building measure. Most of the trust-building initiatives tested are widely adopted, and overall more farmers report putting these measures in place this wave than in 2017. For example, 71% now report implementing environmental stewardships programs, compared to 63% in 2017. Environmental measures are also now the most common activity on the list, whereas in 2017 it was reducing pesticide use. For all but two of the measures tested, 60% or more say they have implemented them. Water conservation plans (43%) and participation in an industry assurance program (37%) are less popular.
It is worth noting that among producers who work primarily with animals, the percentage who have adopted humane animal welfare practices is much higher – 94% of cattle ranchers, and 92% of dairy farmers. Similarly, the vast majority of cattle ranchers and dairy farmers have implemented new manure handling practices – 81% and 83%, respectively. Oilseed and grain farmers are more frequent adopters of new technology (74%).
Producers with higher sales, as well as those with a university education, have adopted more of the measures and programs than those who earn less and have not been to university. For example, 74% of farmers whose sales total $250,000 or more are more likely to have a nutrient management plan (74%) than those with sales between $10,000 and $100,000 (60%). Those who have been to university are similarly more likely to have a nutrient management plan in place (72%). They are also more likely to speak publicly about how their farm operates (69%), particularly compared to those who have only completed high school (55%).
| 2018 | 2017 | |
|---|---|---|
| Environmental stewardship programs | 71 | 63 |
| Reduced pesticide use | 70 | 67 |
| Enhance food safety measures | 68 | 59 |
| Human animal welfare practices | 67 | 59 |
| Nutrient management plan | 66 | 60 |
| Using new technologies | 63 | n/a |
| Publically talking about how your farm operates | 60 | n/a |
| Manure handling | 60 | 52 |
| Measures to reduce/ eliminate the use of drugs/ antibiotics on animals | 55 | 47 |
| Irrigation or water conservation plan | 43 | 34 |
| Participation in a sector/ industry assurance program | 37 | n/a |
| Have not implemented any of these | 1 | 4 |
| None of these measures are applicable | 1 | 1 |
Q33. Which of the following measures, programs or practices have you implemented? Base: n=1504.
Few producers believe that Canadians are well informed about agriculture and food production practices – just 4% feel they are very informed, while 21% say somewhat informed. Three-quarters believe Canadians are not very or not at all informed. Older farmers place more faith in Canadians' knowledge (27% say they are very or somewhat informed) as do farmers in Saskatchewan (33%), those who have not completed high school (36%) or who just have a high school education (31%).
| Level of knowledge | 2018 |
|---|---|
| Very informed | 4 |
| Somewhat informed | 21 |
| Not very informed | 50 |
| Not informed at all | 25 |
| Don't know/No response | 1 |
Q35. How informed do you think the public is when it comes to agriculture and food production practices in Canada? Base: n=1504. | |
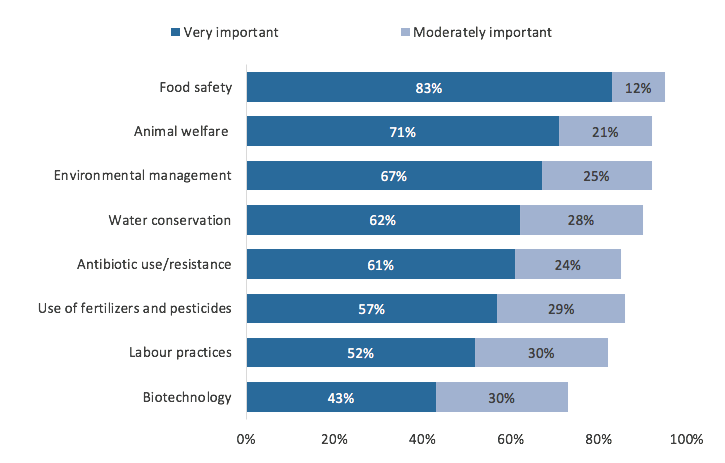
With the exception of biotechnology, the majority of producers rank all of the measures aimed at building and maintaining public trust as very important. Food safety is deemed most important, with almost all (95%) agreeing it is either very important or moderately important. Animal welfare (92%) and environmental management (92%) follow in order of importance.
There are some notable regional and demographic differences in the rankings:
| Factor | Very important | Moderately important |
|---|---|---|
| Food safety | 83% | 12% |
| Animal welfare | 71% | 21% |
| Environmental management | 67% | 25% |
| Water conservation | 62% | 28% |
| Antibiotic use/resistance | 61% | 24% |
| Use of fertilizers and pesticides | 57% | 29% |
| Labour practices | 52% | 30% |
| Biotechnology | 43% | 30% |
| Factor | Total | Oilseed/Grain Producers | Cattle Ranching/Farming | Dairy Cattle/Milk Production | Other |
|---|---|---|---|---|---|
| Food safety | 83 | 83 | 81 | 86 | 86 |
| Animal welfare | 71 | 65 | 78 | 78 | 70 |
| Environmental management | 67 | 63 | 65 | 68 | 72 |
| Water conservation | 62 | 57 | 62 | 66 | 65 |
| Antibiotic use/resistance | 61 | 60 | 60 | 64 | 61> |
| Use of fertilizers & pesticides | 57 | 60 | 51 | 54 | 59 |
| Labour practices | 53 | 50 | 44 | 50 | 66 |
| Biotechnology | 43 | 50 | 35 | 39 | 42 |
Q36-43. In your view, how important, if at all, are each of the following in terms of building or maintaining the public’s trust in agriculture? Base: n=1488. | |||||
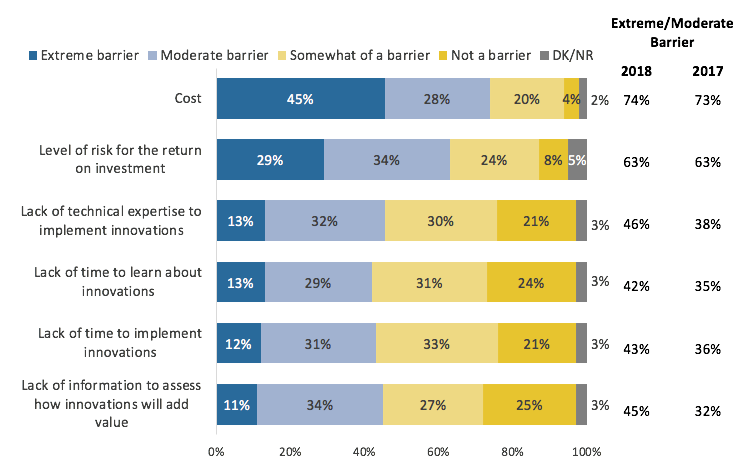
Cost remains the greatest barrier to adopting new technology or farming practices. As was the case in 2017, almost three-quarters (74%) see it as an extreme or moderate barrier. Of note, 51% of those who had some college education or completed college feel cost is an extreme barrier, slightly higher than the entire sample (45%).
Risk for the return on investment once again follows as the second greatest barrier, with 63% in both 2018 and 2017 reporting that for them, it is an extreme or moderate barrier. Lack of time to learn about and implement new technologies, lack of technical expertise and lack of information to assess how new technologies will add value, are all ranked similarly.
Just under half (46%) feel lack of technical expertise poses a problem, while 45% believe lack of information to assess the return on investment does as well. Lack of time to learn about (42%) and implement (43%) innovations follow in terms of the percentage who feel they present an extreme or moderate barrier.
When it comes to assessing how innovations will impact farm operations, producers who attended vocational or trade school are less inclined to view it as a barrier (63% say it is not a barrier/only somewhat of a barrier). The same group is less likely to view time as a barrier (65%). Those who attended college are more likely to view the level of risk compared to return on investment as a barrier (71%).
Overall, farmers in Quebec view each factor as a greater barrier than their colleagues in other provinces. For example, 60% feel lack of time to learn about innovations is an extreme or moderate barrier, compared to just 28% in Manitoba, 35% in Ontario and 36% in Alberta. It is also noteworthy that younger farmers (under 45) view uncertainty about the return on investment as a greater barrier (73%) than those ages 45-54 (68%) and 55 and over (61%).
| Extreme barrier | Moderate barrier | Somewhat of a barrier | Not a barrier | Don't know/ no response | Extreme/ moderate barrier (%) | ||
|---|---|---|---|---|---|---|---|
| 2018 | 2017 | ||||||
| Cost | 45 | 28 | 20 | 4 | 2 | 47 | 73 |
| Level of risk for the return on investment | 29 | 34 | 24 | 8 | 5 | 63 | 63 |
| Lack of technical expertise to implement innovations | 13 | 32 | 30 | 21 | 3 | 46 | 38 |
| Lack of time to learn about innovations | 13 | 29 | 31 | 24 | 3 | 42 | 35 |
| Lack of time to implement innovations | 12 | 31 | 33 | 21 | 3 | 43 | 36 |
| Lack of information to assess how innovation will add value | 11 | 34 | 27 | 25 | 3 | 45 | 32 |
Q44-49. How much of a barrier is each of the following in terms of adopting new technologies and farm practices? Base: n=1504.
More than anything else, producers need financial assistance (73%) to help them make decisions about adopting new technology. In 2017, this question asked if respondents needed financial advice rather than assistance, and while less in demand, it still topped the list. Moving down the list, almost two-thirds (62%) require some form of technical advice, an increase of 20% from 2017. Over half (59%) of producers also want more information, up 23% from 2017. An equal number (59%) choose time to research and implement new technology, up 22% from 2017.
| Need | 2018 | 2017 |
|---|---|---|
| Financial assistance | 73 | 45* |
| Technical advice | 62 | 42 |
| More information | 59 | 36 |
| Time to research and implement a new technology or practice | 59 | 37 |
| Other | 8 | 10 |
| Don't know/No response | 5 | 2 |
Q50. What do you need most to help you make decisions about adopting new technology and farm practices? Base: n=1504. * Combined “Financial advice” & “financial assistance/support”. The category “financial advice” was not included in 2018, while the category “financial assistance/support” emerged in the coding for the 2017 study. | ||
One-in-five (21%) have a subscription to Agri-Info. Subscription rates are highest among:
| 2018 | |
|---|---|
| Yes | 21 |
| No | 76 |
| Don't know/No response | 3 |
Q51. Do you subscribe to Agri-info, AAFC's quarterly newsletter for producers? Base: n=1504. | |
The most popular social media that producers use for business purposes remains Facebook (31%), followed by YouTube (20%), then Twitter (11%). Of note, YouTube appears more popular among the producers surveyed than those reported on in 2017. However, the wording of the question in the 2017 wave differed slightly from how the question was posed in the most recent iteration of this study, so direct comparisons are not possible.
Over half of producers (52%) do not use social media for business purposes, though this varies by age, education and sales:
| Social Media Platform | 2018 | 2017 |
|---|---|---|
| 31 | 28 | |
| YouTube | 20 | 5 |
| 11 | 12 | |
| 9 | 2 | |
| 7 | 5 | |
| None | 52 | 62 |
| Other | 1 | 6 |
| Don't know/No response | 3 | 1 |
Q52. Which of the following social media platforms, if any, do you use for business purposes? Base: n=1488. | ||
One quarter (26%) are aware of AAFC's social media channels. The groups of producers who are more likely to be aware of AAFC's social media include:
| 2018 | |
|---|---|
| Yes | 26 |
| No | 74 |
Q53. Are you aware of any of AAFC's social media channels (e.g., LinkedIn, Facebook, Twitter, YouTube?) Base: n=1504 | |
As in 2017, direct mail is the most preferred method of communication with AAFC. This wave, over half (58%) say they prefer it. Email follows at 50%, followed by Agri-Info (44%), then the AAFC website (34%). (Note that Agri-Info was not offered as a prompted answer category in 2017). Just 18% prefer to be contacted via social media. However, there are generational differences:
| 2018 | 2017 | |
|---|---|---|
| Direct mail | 58 | 46* |
| 50 | 45 | |
| Agri-info (AAFC's quarterly newsletter) | 44 | - |
| AAFC website | 34 | 14 |
| Social media (Facebook, Twitter, LinkedIn, etc.) | 18 | 6 |
| Farm magazines/newspapers | 2 | - |
| In person visit/meetings | 1 | - |
| Media (TV, newspapers, radio) | 1 | - |
| None of these | 3 | 2 |
| Other channels | - | 1 |
| Don't Know/No response | - | 1 |
Q54. How would you prefer to be informed about the latest agricultural news and developments from AAFC? Base: n=1504. * In 2017, this category was labelled “traditional mail”. | ||
The sixth wave of AAFC's Strategic Issues Survey underlines some persistent trends in the public opinion environment among producers, but at the same time provides insight into how current affairs, particularly recently concluded and/or ongoing trade negotiations, can alter that landscape.
Overall, there remains a fairly high proportion of producers with high farm incomes compared to findings measured since 2011. However, assessments of the most recent fluctuations in income and the outlook for the future demonstrate a slightly less positive mindset than was the case as recently as 2017. Fewer describe their incomes as growing and there is an increase in the proportion who expect their farming income to decline in the near term.
Trade and international barriers are viewed as the top issue facing Canadian agriculture in the coming years, and the survey clearly demonstrates that many producers are concerned about what newly minted agreements, particularly CUSMA, will mean for their operation. When asked to name the biggest risks facing their farm operations, more producers than ever before listed trade, though natural disasters and weather fluctuations, as well as market price fluctuation remain the most commonly recognized risks. Respondents overall feel the many policy priorities explored in this research, including advancing agriculture science and implementing A Food Policy for Canada, are important. However, promoting trade and increasing exports ranks highest.
Overall, most have taken steps to plan for emergencies or risks, the most common of which include environmental and sustainability measures, traceability systems, and animal welfare measures.
This wave of research aimed to serve as a baseline for new AAFC initiatives, particularly the Canadian Agricultural Partnership (the Partnership) investment. While the Partnership and the programming that comes along with it are not widely known, those who are familiar with it are more inclined to approve than disapprove of the program. Regardless of whether they have heard of it, respondents generally feel the Partnership is important, once it is explained to them. Taken together, the data suggest that the Partnership has the potential to help improve producers' outlook.
As observed in previous waves, the majority of producers feel public perceptions have at least a moderate impact on their farm operation. Most have adopted measures aimed at building public trust, notably environmental stewardship programs, reducing pesticide use and enhancing food safety measures. While they value the public's perceptions, few believe Canadians are well informed about agriculture and food production practices. As in 2017, financial considerations are both the biggest hurdle and most useful tool to help producers adopt new technologies. Almost three-quarters of producers view cost as an extreme or moderate barrier to adopting new technology, and a similar proportion say that more than anything, they need financial assistance to be able to test out and implement new innovations.
Subsequent qualitative research will undoubtedly shed more light on many of the findings contained in this report. In particular, given the prominent role it is playing in the minds of producers, it is expected that focus group discussions will uncover more about the nature of the concerns regarding trade, how these concerns are evolving and what, if anything, might alleviate them. As well, qualitative research can be leveraged to better understand producers' information needs when it comes to initiatives such as the Partnership.
Earnscliffe's overall approach for this study was to conduct a telephone survey of Canadian farmers or ranchers (18+) who hold or share primary responsibility for making decisions regarding their farm operations with $10,000 or more in annual farm sales in 2017, using Léger's centralized call-centre and state of the art Computer Aided Telephone Interviewing (CATI) system. A detailed discussion of the approach used to complete this research is presented below.
The questionnaire for this study was designed by Earnscliffe and AAFC collaboratively, drawing on previous tracking studies, and provided for fielding to Léger. The survey was offered to respondents in both English and French and completed based on their preferences.
The sampling plan for this study was designed by Earnscliffe to ensure sufficient representation of producers across the country, based on the available sample. Léger used sample provided by Research Now SSI as they have proven to have very reliable phone sample. Research Now SSI's business sample is compiled using Dun & Bradstreet lists, which have been used in the past for this project with AAFC. The sampling frame used is drawn from the D&B list of producers; and, while the list does not provide complete coverage of the universe, it provides the greatest coverage within an affordable budget.
The survey was conducted in English and French, based on the respondent's preference, from October 22, 2018 to December 18, 2018. The survey was undertaken by Leger's telephone data collection operation headquartered in Montréal, Québec.
During the course of data collection, one question (Q55. How many years have you been managing a farm business?) was inadvertently dropped from the interviewers' script. A return to sample was conducted by Léger to gather response data for this question. Leger was able to successfully re-contact 1096 respondents to answer this question, in addition to the 152 responses that had been collected during the initial survey field period, for a total of 1248 responses. Every unresolved number was called at least twice, and most were called at least 7 times.
Quotas were set to ensure that prior to weighting, we completed data collection with a sample that reflected the regional distribution of producers on the D&B list.
The table below lists the SIC codes used for sampling, the counts available on the D&B list and the proportion of the sample that is constituted by each code on the D&B list:
| SIC Code | SIC Description | Total on list (n) | Total on list (%) |
|---|---|---|---|
| 111 | Wheat | 197 | 1.1 |
| 112 | Rice | 7 | 0.0 |
| 115 | Corn | 52 | 0.3 |
| 119 | Cash grains nec | 4,512 | 25.6 |
| 134 | Irish potatoes | 144 | 0.8 |
| 139 | Field crops except cash grains nec | 498 | 2.8 |
| 161 | Vegetables and melons | 432 | 2.5 |
| 171 | Berry crops | 157 | 0.9 |
| 172 | Grapes | 101 | 0.6 |
| 175 | Deciduous tree fruits | 137 | 0.8 |
| 182 | Food crops grown under cover | 190 | 1.1 |
| 191 | General farms primarily crop | 6,713 | 38.1 |
| 211 | Beef cattle feedlots | 83 | 0.5 |
| 212 | Beef cattle-except feedlots | 1,615 | 9.2 |
| 213 | Hogs | 239 | 1.4 |
| 214 | Sheep and goats | 63 | 0.4 |
| 241 | Dairy farms | 1,225 | 7.0 |
| 251 | Broiler fryer & roaster chickens | 91 | 0.5 |
| 252 | Chicken eggs | 31 | 0.2 |
| 253 | Turkey & turkey eggs | 30 | 0.2 |
| 254 | Poultry hatcheries | 68 | 0.4 |
| 259 | Poultry and eggs nec | 199 | 1.1 |
| 271 | Fur-bearing animals & rabbits | 37 | 0.2 |
| 272 | Horses and other equines | 146 | 0.8 |
| 273 | Animal aquaculture | 68 | 0.4 |
| 279 | Animal specialties nec | 207 | 1.2 |
| 291 | General farms livestock and animal spec | 365 | 2.1 |
| TOTAL | 17,607 | 100% |
The table below shows the provincial counts and proportion of farms and the D&B provincial counts and proportions and the target sample sizes for each region.
| Region | Farmers (n) | Farmers (%) | D&B List (n) | D&B List (%) | Proposed sample (n) | Proposed sample (%) |
|---|---|---|---|---|---|---|
| Atlantic Canada | 23,780 | 6.4 | 609 | 3.5 | 52 | 3.5 |
| Quebec | 69,080 | 18.5 | 2,103 | 11.9 | 179 | 11.9 |
| Ontario | 100,650 | 26.9 | 2,429 | 13.8 | 207 | 13.8 |
| Prairies (MB, SK, AB) | 140,405 | 37.5 | 11,516 | 65.4 | 981 | 65.4 |
| British Columbia | 40,025 | 10.7 | 949 | 5.4 | 81 | 5.4 |
| Total | 373,940 | 100% | 17,606 | 100% | 1,500 | 100% |
As done in the past, the data was weighted by province and gross farm receipts to reflect the actual proportions found in the producer population, according to Statistics Canada's 2016 Census of Agriculture.
Leger's data collection quality control process is concretely based on the following elements:
| Landline | Cellphone | |
|---|---|---|
| Total Numbers Attempted | 16190 | 6029 |
| Invalid | 38 | 6 |
| NIS, fax/modem, business/non-res. | 1533 | 1731 |
| Unresolved (U) | 4951 | 2246 |
| Busy | 54 | 32 |
| No answer, answering machine | 4897 | 2214 |
| In-scope - Non-responding (IS) | 8233 | 1785 |
| Household refusal | 640 | 177 |
| Respondent refusal | 4045 | 782 |
| Language problem | 124 | 22 |
| Illness, incapable | 298 | 73 |
| Selected respondent not available | 2946 | 667 |
| Qualified respondent break-off | 180 | 64 |
| In-scope - Responding units (R) | 1435 | 261 |
| Language disqualify | 147 | 45 |
| No one 18+ | ||
| Other disqualify | ||
| Completed interviews | 1288 | 216 |
| Response Rate = R/(U+IS+R) | 9.82% | 6.08% |
Any survey that is conducted is potentially subject to bias or error. The possibility of non-response bias exists within the current sample. In particular, this survey would not include members of the population who do not have access to a telephone or who are not capable of responding to a survey in either English or French.
| Region | Census of Agriculture 2016 (%) | Unweighted Sample (%) | Weighted Sample (%) |
|---|---|---|---|
| Atlantic | 3 | 4 | 4 |
| Quebec | 15 | 15 | 15 |
| Ontario | 26 | 15 | 26 |
| Manitoba/Saskatchewan/Alberta | 46 | 61 | 47 |
| British Columbia | 9 | 5 | 9 |
| Gross Farm Receipts (Sales volume, $) | Census of Agriculture 2016 (%) | Unweighted Sample (%) | Weighted Sample (%) |
|---|---|---|---|
| 10,000 to just under 25,000 | 17 | 5 | 13 |
| 25,000 to just under 50,000 | 15 | 7 | 19 |
| 50,000 to just under 100,000 | 15 | 11 | 15 |
| 100,000 to just under 150,000 | 19 | 9 | 8 |
| 150,000 to just under 200,000 | 7 | 6 | |
| 200,000 to just under 250,000 | 5 | 5 | |
| 250,000 to just under 500,000 | 14 | 16 | 14 |
| 500,000 or more | 20 | 40 | 20 |
The margin of error for this sample of 1504 Canadian producers is +/-2.52%.
The average length of interview was 21 minutes.
Good morning/afternoon/evening. My name is _______________ and I am calling from LEGER Research, a public opinion research company. Would you prefer that I continue in English or French? Préférez-vous que je continue en français ou en anglais? We are conducting a study of agricultural producers on behalf of Agriculture and Agri-Food Canada about some important issues facing the farm sector across Canada. Your participation is voluntary and the survey will take about 20 minutes to complete. Please be assured that your identity and individual answers will be kept strictly confidential.
First, may I confirm that you are one of the decision makers for your farm operation? [tracking]
Interviewer note: If required, read: "In other words, do you make the business and financing decisions regarding your farm operation?")
If yes or joint, continue. If no, ask to speak to that person, read intro again. If unavailable, arrange callback. If no decision maker thank and terminate.
For classification purposes, what were your total farm sales last year, that is, in 2017? [tracking]
Just stop me when I reach the correct category. [Read list]
If Don't know / No response or “less than $10,000”, thank and terminate
For classification purposes, in what year were you born? [ Tracking]
____________ [Record]
If year born is more recent than 2000, thank and terminate
___ ___ ___ ___ ___ ___
Read:
Any information you provide will be administered in accordance with the Privacy Act and other applicable privacy laws. Your decision to participate or not will not affect any dealings you may have with the Government of Canada in any way.
Note: If a respondent asks you about the legitimacy of this project or if the respondent wants to make a complaint or a comment about this project, they may call 1-800-404-2464.
Note: If a respondent requests to speak with a study leader at Agriculture and Agri-Food Canada, please take his / her name and phone number and mention that a supervisor will call back to establish the link with Agriculture and Agri-Food Canada.
Contact: Miriam Wood
Agriculture and Agri-Food Canada / Government of Canada
Phone number: 613-773-2434
We’d like to know a bit more about your farm operation and how you manage risk to your business.
Open end - accept only one response
Do not read – pre-codes
Do not read – Code only one answer
Code one only
Interviewer note: If required: Examples could be: access to markets, increased costs, diseases or pests, or weather fluctuations
Do not read – Code up to three
Read list and check all that apply.
Interviewer note: Emergency Plan refers to the process of outlining procedures to take in an emergency and the roles and responsibilities for those that are involved.
What is your impression of how each of the following will impact your farm operation? [New]
[Randomize order]
Open end, accept ‘don’t know.’
Do not read – Code up to three
Given this information, how important, if at all, do you believe these investments are for the sector? [New]
To what extent do you agree or disagree that the Canadian Agricultural Partnership will help the sector to: [randomize order]
How important, if at all, is it for the Government of Canada to support each of the following priorities:
[randomize]
In these next few questions we would like to understand the ways in which your farming operation may be responding to changing consumer trends.
Randomize items 01-11. 12 and 99 should be anchored at end of list.
Read list and check all that apply. If asked, interviewer should clarify that these programs could have been ones implemented by the farm operator on their own, with a sector/industry association or with government.
Or
Read responses
Read responses
In your view, how important, if at all, are each of the following in terms of building or maintaining the public’s trust in agriculture?
Randomize list
Now, we have a few questions about innovation in the agriculture and agri-food sector.
Increasingly, farmers are adopting precision farming technologies to enhance profitability, save time and protect the environment.
How much of a barrier is each of the following in terms of adopting new technologies and farm practices?
Randomize. Read list
Read list and check all that apply.
The next few questions ask about your experience interacting and communicating with Agriculture and Agri-Food Canada (AAFC).
Read list. Check all that apply.
Read list and check all that apply.
Finally, these last few questions will help us analyse your responses.
Record number of years
Categories for tables:
Read and randomly reverse order of 1 and 3
Do not read – Code one only
Read if necessary – For example, do either you or your partner have a job off the farm that supplements your income from agricultural production?
Do not read – pre-codes – check all that apply
(For respondents living in Quebec): Do you consider yourself to be a member of an Anglophone minority community? (If asked: An Anglophone minority community refers to Anglophones who are living in an English-speaking community in the province of Quebec).
Thank you very much for your time and participation. The results of the research will be available to the general public, on the Library and Archives website, in the coming months.