2019 Survey on Consumer Perceptions of Food (Wave V)
Report
Prepared for Agriculture and Agri-Food Canada
Supplier:EKOS Research Associates Inc.
Contract Number: 01B68-190716/001/CY
Contract Value: $79,965.02
Award Date: September 26, 2018
Delivery Date: May 2, 2019
Registration Number: POR 066-18
For more information on this report, please contact aafc.por-rop.aac@canada.ca
Ce rapport est aussi disponible en français
This public opinion research report presents the results of an online survey conducted by EKOS Research Associates Inc. on behalf of the Department of Agriculture and Agri-Food Canada. The research study was conducted with 3,031 Canadians 18 or older between February 13 and March 1, 2019.
Cette publication est aussi disponible en français sous le titre Sondage de 2019 sur les perceptions des consommateurs à l'égard des aliments (Vague V) – Rapport.
This publication may be reproduced for non-commercial purposes only. Prior written permission must be obtained from Agriculture and Agri-Food Canada. For more information on this report, please contact Agriculture and Agri-Food Canada at: aafc.por-rop.aac@canada.ca.
Public Affairs Branch
Agriculture and Agri-Food Canada
1341 Baseline Road
Ottawa, Ontario K1A 0C5
Catalogue Number: A22-627/2019E-PDF
International Standard Book Number (ISBN): 978-0-660-31237-8
Agriculture and Agri-Food Canada (AAFC) supports the Canadian agriculture and agri-food industry through initiatives that promote innovation and competitiveness. The activities of the Department range from the farmer to the consumer, from the farm to global markets, through all phases of producing, processing and marketing of farm, food and bio-based products. Agriculture is also a shared jurisdiction in Canada, and the Department works closely with provincial and territorial governments in the development and delivery of policies and programs. To support its mandate, the Department regularly conducts public opinion research to determine the opinions and attitudes of Canadians and agricultural producers and agricultural processors. The Department uses the results of the research it commissions to develop policies, services and programs, and communications planning. Results are shared internally, as well as with provincial and territorial counterparts, and the Canadian public.
AAFC has commissioned five waves of the Survey of Consumer Perceptions of Food. The first wave was conducted in 2004, with further iterations of the survey conducted in 2006, 2010, and 2014. Each wave was modified to reflect current issues, while retaining some indicators to track the perceptions of consumers over time. The 2019 Survey on Consumer Perceptions of Food consisted of a sample of 3,031 completed cases with Canadians 18 years of age or over who have at least half of the responsibility for grocery shopping in the household. The survey was conducted between February 13 and March 1, 2019.
Key findings
Awareness and information
Most Canadians have low awareness of some initiatives such as the new Safe Food for Canadians Regulations (20% are aware) or A Food Policy for Canada (25% are aware).
All respondents were subsequently asked about their impressions of the new Safe Food for Canadians Regulations, including a description of the policy for those who were previously unaware of it. More than half of Canadians (55%) indicated a positive impression of the new Safe Food for Canadians Regulations.
Canadians rely on many sources of information to make decisions about food and nutrition. Forty-eight per cent (48%) of Canadians said they rely on doctors, nutritionists, or other health professionals to make decisions about food and nutrition. Other popular sources of information include family and friends (40%), news media (32%), Canada's food guide (32%) and food-specific websites (30%).
Awareness of the updated Canada's food guide is high, with 76% indicating they are aware of the new guide launched in January 2019. Of those aware of it, 23% said the updated food guide will influence their purchasing decisions
Purchase decisions about food
In terms of key attributes Canadians look for when purchasing food:
Most Canadians (84%) seek food items that are considered to be the best value for the money spent as was also the case in 2014. Nutritional value is also key (76%); up from 68% in 2014.
Many look for items that say “Product of Canada” or “Made in Canada” on their product label (69%), or are locally produced (63%). Both of these have increased since 2014; from 52, and 48%, respectively.
Country of origin is also important to more than half (57%, up significantly from 38% in 2014), and about half are concerns with convenience (49%, on par with 2014).
More than half of Canadians look for organic products at least some of the time (55%).
The main barrier to purchasing organic, among those who do not look for organic at least some of the time is the cost (73%).
91% of Canadians look for locally grown food at least some of the time.
Of these individuals, 62% always or often purchase locally grown food items. Among those who at least sometimes purchase locally produced items 70% rely primarily on labels specifying the location of farm, grower, or processing company the food came from.
71% of consumers look for food produced using environmentally sustainable practices.
Reasons for not looking for food produced using environmentally sustainable methods are lack of confidence in the accuracy of labelling (44%) and cost (41%).
66% of consumers look for food produced using humane animal treatment.
Canadians who often purchase products produced under conditions related to the humane treatment of animals rely most (68%) on labels making a claim such as “free range” or “traditional” (up from 58% in 2014).
The two most influential aspects of food for most Canadians are the cost of food (77%) and the nutritional value (65%).
More than two in three (70%) have avoided or boycotted a particular food product because of concerns about the safety of the food; up from 58% in 2014. Slightly fewer have boycotted a particular company (66%) or country (63%).
Use of technology for information
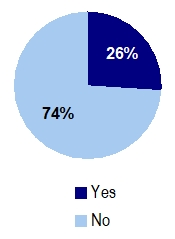
Survey results indicate that 26% of Canadians have used a mobile device to scan a barcode for information on a food or retail product.
Impressions-confidence
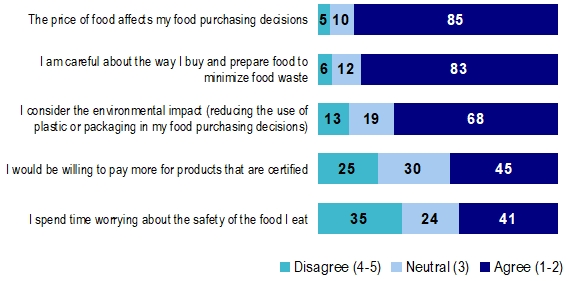
When measuring attitudes about food, the cost of food remains the most important issue to Canadians.
Most (85%) agree that the price of food affects their food purchasing decisions, and they are careful about the way they buy and prepare food to minimize food waste (83%).
Sixty-eight per cent (68%) report that they consider the environmental impact in terms of plastic and packaging when making food purchasing decisions.
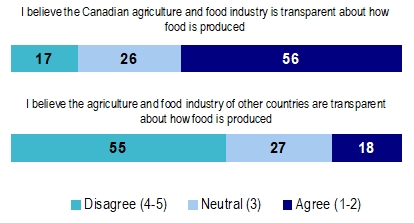
More than half of Canadians (56%) believe the Canadian agriculture and food industry are transparent about how food is produced, whereas relatively few believe in the transparency of other countries (18%).
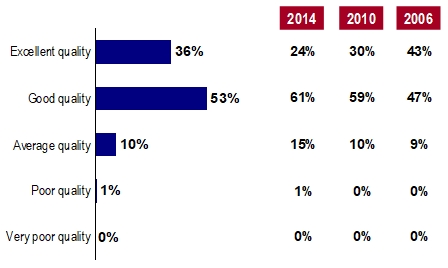
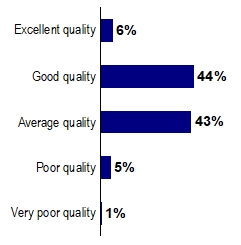
Most Canadians (89%) believe the quality of food produced in Canada is either excellent quality (36%) or good quality (53%). Significantly fewer (50%) rate the quality of imported foods as excellent (6%) or even good (44%).
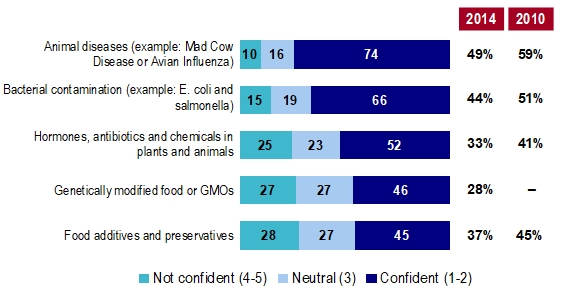
The majority are confident in the system regarding issues such as animal diseases (74%), bacterial contamination (66%), or hormones, antibiotics, and chemicals in plants and animals (52%). Survey results suggest that confidence is generally up considerably from 2014.
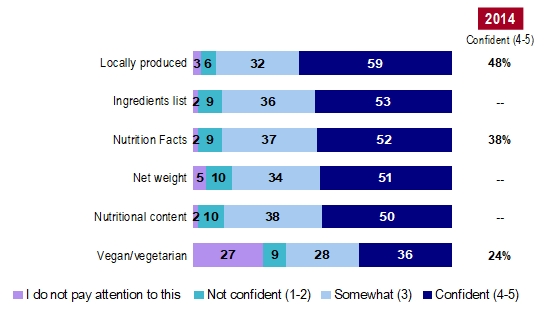
Half to just over half of Canadians expressed confidence in the accuracy of labelling in terms of indicating locally produced (58%), ingredients list (53%), nutrition facts (52%), net weight (51%), and nutritional content (50%).
Government role in public trust
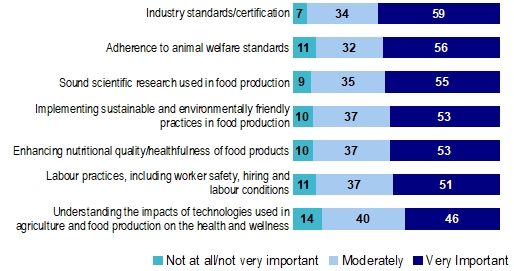
The survey identified many factors that Canadians believe are important in building or maintaining the public's trust in food produced in Canada's agricultural and agri-food industry.
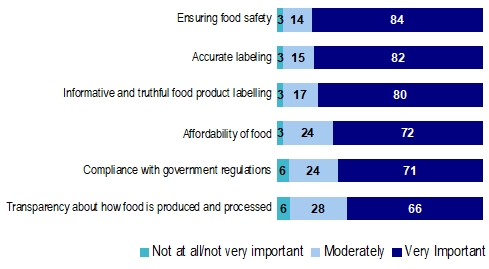
Ensuring food safety (84%), accurate labelling (82%), or informative and truthful food product labelling (80%) are each rated as very important in building trust.
Affordability of food (72%) or compliance with government regulations (71%) are also seen as very important in building or maintaining trust. Transparency about how food is produced and processed was mentioned by 66%.
When asked about efforts the government should make to build, improve, and maintain consumers' trust in food products there is no consensus. Half of Canadians (50%) believe the government should ensure Canadian food standards meet or exceed those of other countries, and that the industry is supported by a strong regulatory system (49%). Ensuring product labelling includes product information is also seen as useful by many (43%).
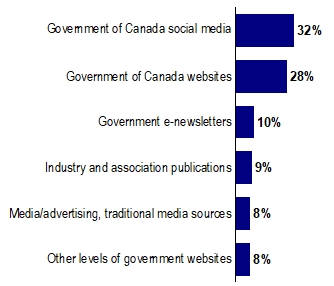
The most effective way for the government to share information with consumers would be through social media (32%) or a Government of Canada website (28%).
The contract value for the POR project is $79, 965.02 (including HST).
This certification is to be submitted with the final report submitted to the Project Authority.
I hereby certify as Senior Officer of EKOS Research Associates Inc. that the deliverables fully comply with the Government of Canada political neutrality requirements outlined in the Communications Policy of the Government of Canada and Procedures for Planning and Contracting Public Opinion Research.
Specifically, the deliverables do not include information on electoral voting intentions, political party preferences, standings with the electorate, or ratings of the performance of a political party or its leaders.
Signed by: Susan Galley (Vice President)
1. Introduction
1.1 Study Context
Agriculture and Agri-Food Canada (AAFC) provides information, develops research and technology, and determines policies and programs to encourage the development and growth of Canada's agriculture and agri-food industry and is involved through all phases of food production, from producing and processing, through to marketing and consumption. To support its mandate, the Department regularly conducts public opinion research to determine the opinions and attitudes of Canadians and agricultural producers and agricultural processors. The Department uses the results of the research it commissions to develop policies, services and programs, and communications planning. Results are shared internally, as well as with provincial and territorial counterparts, and the Canadian public.
The survey of consumer perceptions has been conducted at four-year intervals since 2004, including in 2006, 2010, and 2014. This fifth iteration continues to track the perceptions of consumers over time, although updated by removing less relevant questions and incorporating questions addressing emerging issues. Specific objectives of the survey include learning about:
Consumer awareness of food policies and sources of information used in decision-making
How food attributes that shape consumers' purchasing decisions, influential types of information;
How consumers use of bar code technology to obtain information about food
Consumers confidence in the food system and food safety in Canadian and elsewhere
Consumers' views about accuracy of food labelling; and
Consumers' thoughts on key elements in building public trust and effective government efforts.
1.2 Overview of methodology and sampling
The survey sample consists of 3,031 completed cases with Canadians 18 years of age who have at least shared (50% or greater) responsibility for grocery shopping for the household. Anyone with less than 50% shared responsibility was excluded from the survey. The sample is based on a random selection of Probit panel members from across the country. Probit panellists were selected using a random-digit dial (RDD) landline-cell phone hybrid sample frame. The survey was conducted largely online, with a very small segment completing the survey by telephone. The overall response rate for the survey was 19%.Survey results were weighted to 2016 Census figures. The margin of error for the overall sample of 3.031 is as wide as ±1.8% at a .05 confidence interval. Appendix A provides more detail on the methodology.
1.3 Note to readers
Overall results are presented in text, charts, and tables. Bulleted text is used to describe specific segments of the sample (for example, gender, age, education) and regions, if they are statistically and substantively different from the overall results for the entire sample (that is, at least 5% or more from the overall mean in any given subgroup). If differences are not noted in the report it can be assumed that they are either not statistically significant in their variation from the overall result or that the difference was judged to be too small to be noteworthy. Actual percentages are only presented for sub-groups where they are sizeable (for example, 10% or more higher or lower than the overall result for the sample). Detailed results are available in data tables available in a separate technical appendix (Appendix C).
Readers should note that results for the proportion of respondents in the sample that said either “don't know” or did not provide a response may not be indicated in the graphic representation of the results. Results may also not total to 100% due to rounding.
Where comparable, results are shown from previous surveys conducted in 2006, 2010 and 2104. In some cases, new response categories where added and no comparison is available for these specific responses. These are indicated with “—“. Where there is no reference at all to results from previous years, the 2019 survey items are either newly added, or significantly changed so that comparison to previous results is not possible.
2. Awareness and Information
2.1 Awareness of Initiatives
a) Awareness of the updated Canada's Food Guide
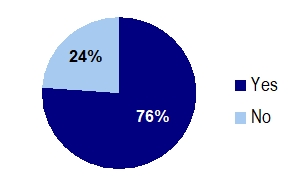
Awareness of the updated Canada's food guide is high given that survey results indicate that 76% of Canadians having heard, seen, or read something about it since the launch of the new guide in January of this year (2019).
Chart 1: Awareness of the updated Canada's Food GuideQ17A: “Have you seen, heard or read anything about the new Canada's food guide that was recently launched in January?”
Base: All Respondents 2019 (n=2979)
Yes: 76%
No: 24%
Awareness of the updated Canada's food guide is somewhat higher among women (78%) compared with men (73%).
It is highest among individuals who are 45 years of age or older (83%), while those under 35 are least likely to have heard information on this subject (62%).
Awareness is highest in Quebec (81%), compared with other regions (74%).
Individuals without post-secondary education (62%) are less likely than those with university education to be aware of the new guide as are those reporting household incomes of less than $40,000. The university-educated (87%) and those reporting household incomes of greater than $100,000 (81%) are the most likely to be aware.
Although awareness is higher (82%), 18% of those who work in the agri-food industry have not heard of the updated Canada's food guide.
2.2 Influencing factors in purchasing decisions
a) Awareness of the updated Canada's Food Guide
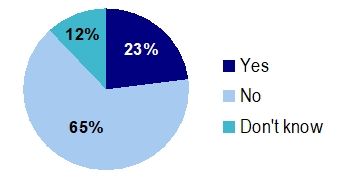
Of the 76% of Canadians who are aware of the updated Canada's food guide, 23% expect the guide will influence their purchasing decisions. Two in three (65%) of those aware of it said the guide will not influence their decisions while slightly over one in 10 (12%) are not sure.
Chart 2: Influence of the updated Canada's Food Guide on purchase decisionsQ17B: “Will the new Canada's food guide influence your purchasing decisions?”
Base: Those aware of the Guide 2019 (n=2413)
Yes: 23%
No: 65%
Don't know: 12%
Younger Canadians (aged 34 and under; 36%), along with university graduates (28%), are more likely to say they expect the new guide to influence their purchase decisions than those who are 35 or older or have less education (22%).
Residents of Quebec (31%) are also more likely than those from other regions to say the updated Canada's food guide will influence their decisions.
b) Awareness of a Food Policy for Canada
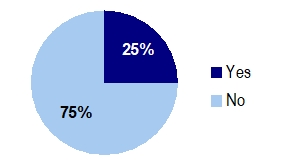
According to survey results, 25% of Canadians have heard, seen, or read something about a Food Policy for Canada, the remaining 75% have not.
Chart 3: Awareness of a Food Policy for CanadaQ11C: “Have you seen, heard or read anything about A Food Policy for Canada?”
Base: All Respondents 2019 (n=2757)
Yes: 25%
No: 75%
Men (30%) are more likely to be aware of A Food Policy for Canada than women (19%).
This is also the case among residents of Quebec (34%) compared with the rest of Canada. Atlantic Canadians (19%) are least likely to have heard, seen or read something about A Food Policy for Canada.
University graduates (30%) are the most likely to be aware of it, while those without post-secondary education (21%) are least likely to be aware of it.
Individuals working in the agri-food industry (52%) are more likely than others to have heard something about this policy.
c) Awareness of Safe Food for Canadians Regulations
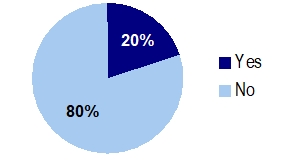
When asked about the new Safe Food for Canadians Regulations, survey results show that 80% of Canadians have not seen, read, or heard any information about it, although 20% have.
Chart 4: Awareness of Safe Food for Canadians RegulationsQ11A: “Have you seen, heard or read anything about the new Safe Food for Canadians Regulations, which came into effect on January 15, 2019?”
Base: All Respondents 2019 (n=2866)
Yes: 20%
No: 80%
Men (23%) are more likely than women (18%) to say they have heard about information on the new Safe Food for Canadians Regulations in some way.
This is also true of individuals aged 65 or older (26%) compared with those under 65.
Canadians living in British Columbia (27%), Saskatchewan or Manitoba (28%) are more likely than those living elsewhere in Canada to have seen or heard something about the new Safe Food for Canadians Regulations. Residents of Quebec (14%) are least likely to have done so.
Agri-food industry workers (37%) are nearly twice as likely as others to have heard about these regulations (20%).
2.3 Impressions of Safe Food for Canadians Regulations
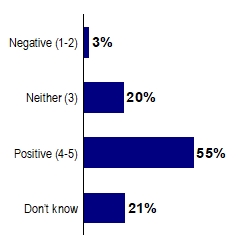
All respondents were subsequently asked about their impressions of the new Safe Food for Canadians Regulations, including a description of the policy for those who were previously unaware of it. Canadians' impression of the Safe Food for Canadians Regulations is favourable, with 55% rating the regulations positively. Only three per cent (3%) have a negative impression. It is notable, however, that 21% said they do not know, and 20% provided a neutral rating, suggesting limited information about the regulations.
Chart 5: Overall Impression of Safe Food for Canadian RegulationsQ11B: “The Safe Food for Canadians Regulations aim to make the Canadian food system safer by focusing on prevention and allowing for faster removal of unsafe food from the marketplace. What is your overall impression of the Safe Food for Canadians Regulations?”
Base: All Respondents 2019 (n=3031)
Negative (1 to 2): 3%
Neither (3): 20 %
Positive (4 to 5): 55%
Don't know: 21%
Individuals under 35 (64%), along with residents of Quebec (64%) are more likely than those 35 or older and/or residents of other regions to be positive about the Safe Food for Canadians Regulations.
2.4 Sources of information for decision-making
When asked about sources of information used to make decisions about food and nutrition, 48% of respondents said they rely on doctors or nutritionists, which is a significant increase from 29% in 2014. Forty per cent (40%) rely on information from family and friends. Approximately one-third pointed to news media (32%), Canada's food guide (32%), or food-specific websites (30%, up from 23% in 2014) as key sources of information.
Other sources of information relied on for decisions about food and nutrition are listed in Table 1. It should be noted that 23% rely on books about food. Only 15% use government websites as a source of information.
Table 1: Sources of information for decision-making
Source of information
2019
2014
n=
2988
3024
Doctors, nutritionists or other health professionals
48%
29%
Family and friends
40%
--
News media
32%
33%
Canada's food guide
32%
--
Food-specific websites
30%
23%
Word of mouth
28%
20%
Food/nutrition labels
26%
--
Books
23%
9%
Government websites
15%
10%
Food advertisements
14%
5%
Social media and blogs
13%
10%
Other
5%
--
None of the above
4%
5%
Q8: What sources of information do you rely on most to make decisions about food and nutrition?
Items with 3% or less not shown
Base: All respondents
Women are more likely than men to rely on books as a main source of information.
Older Canadians (age 55 and over, and in particular those who are 65 or older) are more likely to rely on food advertisements and news media than those under 55. Younger Canadians (under 35) are the most likely age cohort to source Canada's food guide, social media and blogs, and in particular, food nutrition labels (49%).
Regionally, residents of Quebec (39%) and the Atlantic (35%) are most likely to point to food nutrition labels.
Those without post-secondary education tend to rely on word of mouth, food advertisements, and social media more often than others do. Individuals with university education are the mostly likely education group to cite doctors, nutritionists, and other health professionals, along with books, news media, and government websites.
Parents are more likely to rely on food nutrition labels than those with no children at home, while the latter group is more likely to make decisions from news media.
3. Drivers of purchase decisions about food
3.1 What consumers look for
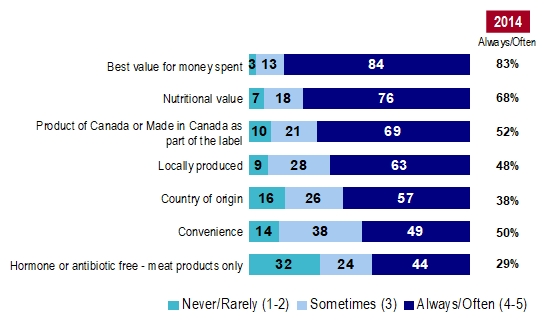
Survey respondents were asked how frequently they seek food items with a number of different attributes, selecting from “always”, “often”, “sometimes”, “rarely”, and “never”. Eighty-four per cent (84%) of Canadians said they always or often seek food items that are considered to be the best value for the money spent, which is consistent with 2014 results. Seventy-six per cent (76%) always or often seek information on nutritional value, which is an increase from 68% in 2014.
Roughly two-thirds always or often seek items labelled as Product of Canada or Made in Canada (69%, a sizable increase from 52% in 2014) or are locally produced (63%, up significantly from 48% in 2014). Fifty-seven per cent (57%) always or often seek information that lists the country of origin, which is a nearly 20-point increase from 38% in 2014. Less than half always or often look for food that is convenient (49%) or for meat products that are hormone or antibiotic free (44%, up from 29% in 2014).
Chart 6a: Seeking Key Attributes When Purchasing FoodQ1: “How frequently do you seek food items with each attribute using the scale provided…?”
Base: All Respondents 2019 (n=3025); 2014 (n=3024)
Table for Chart 6a: Seeking key attributes when purchasing food
Never/rarely (1 to 2) (%)
Sometimes (3) (%)
Always (4 to 5) (%)
2014 (Always/often) (%)
Best value for money spent
3
13
84
83
Natural value
7
18
76
68
Product of Canada or made in Canada as part of the label
10
21
69
52
Locally produced
9
28
63
48
Country of origin
16
26
57
38
Convenience
14
38
49
50
Hormone or antibiotic free-meat products only
32
24
44
29
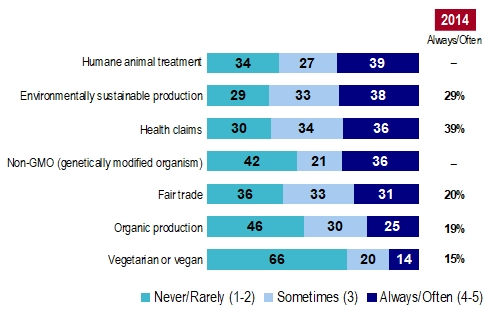
Roughly one-third of Canadians always or often looks for food items that indicate:
humane animal treatment (39%);
environmentally sustainable production (38%, up from 29% in 2014);
specific health claims (36%);
they are not genetically modified organism GMO) (36%); or,
they follow fair trade practices (31%, up from 20% in 2014).
Twenty-five per cent (25%) said they always or often look for food items that involve organic production, which is a slight increase from 19% in 2014. Fourteen per cent (14%) always or often seek items that are vegetarian or vegan.
Chart 6b: Seeking key attributes when purchasing foodQ1: “How frequently do you seek food items with each attribute using the scale provided…?”
Base: All Respondents 2019 (n=3025); 2014 (n=3024)
Table for Chart 6b: Seeking key attributes when purchasing food
Never/rarely (1 to 2) (%)
Sometimes (3) (%)
Always (4 to 5) (%)
2014 (Always/often) (%)
Humane animal treatment
34
27
39
N/A
Environmentally sustainable production
29
33
38
29
Health claims
30
34
36
39
Non-GMO (genetically modified organism)
42
21
36
N/A
Fair trade
36
33
31
20
Organic production
46
30
25
19
Vegetarian or vegan
66
20
14
15
N/A: Not Available
Men are more likely to look for foods that offer convenience. Women are more likely than men to look for:
items that are locally produced, are organically grown
products labelled as Made in Canada, that cite the country of origin
foods that are hormone or antibiotic free (52%), non-GMO, and/or that make specific health claims.
Younger Canadians (under 35) are more likely to look for items that cite specific health claims or are convenient. Older Canadians (55 or older, or in some cases 65 or older) are more likely than others to look for:
Products that are locally produced, made in Canada, and cite the country of origin.
nutritional value of foods, use environmentally sustainable or fair trade practices
hormone or antibiotic free, and non-GMO.
British Columbia residents are more likely than elsewhere in Canada to seek information about country of origin, nutritional value or products using fair trade practices.
Residents of Manitoba and Saskatchewan are least likely to seek foods that are:
Locally grown or organic (also found to be lower in Alberta in both cases) or cite country of origin (47%)
hormone or antibiotic free
use environmentally sustainable, human animal treatment or fair trade practices
making health claim practices
non-GMO,
Residents in Quebec are much more likely than those in other regions to seek food that are:
making health claims, organic in production
locally produced (also found to be higher in Atlantic Canada), Made in Canada
convenient,
produced using environmentally sustainable practices (also found to be higher in British Columbia)
hormone or antibiotic free, or non-GMO.
Respondents with the lowest income are more likely to look for the best value and convenience compared with other Canadians. This propensity to look for the best value decreases as income increases. This segment is less likely than those with more income to look for locally produced items, or examine country of original or nutritional value.
Canadians who spend $700 or more monthly on groceries are least likely to shop for the best value for money spent.
Individuals with university education are more likely than those with less education to look for the nutritional value. They are least likely to search for non-GMO products.
Parents are more likely than others to look for the best value for money.
Individuals who work in the Canadian agri-food industry are more likely than others to seek food that is locally produced (73%), or cite the country of origin (70%). Canadians who work in the agri-food industry are also more likely than others to say they “always” look for food from an organic production or fair trade.
3.2 Considerations for organically produced
a) Frequency of purchase
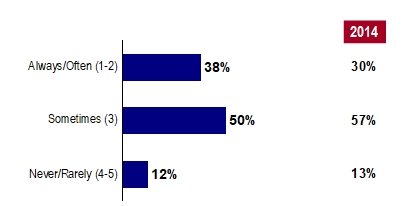
The 55% of survey respondents indicating they “always”, “often”, or “sometimes” seek organic food items were subsequently asked how often they purchase these products when grocery shopping. Thirty-eight per cent (38%) said they always or often purchase organically produced products, which is a modest increase from 30% in 2014. Fifty per cent (50%) indicated they sometimes do, while 12% said they never or rarely purchase organic products.
Chart 7: Frequency of purchasing organic productsQ2A: “When you go grocery shopping, how frequently do you purchase organically produced products?”
Base: Sometimes, often or always seek organic produced items 2019 (n=1667); 2014 (n=1518)
Always/often (1 to 2):
2019 - 38%;
2014 - 30%
Sometimes (3):
2019 - 50%;
2014 - 57%
Never/rarely (4 to 5):
2019 - 12%;
2014 - 13%
Women (41%) are more likely than men (34%) to say they always or often purchase organic products.
This is also true of people reporting household incomes of $40,000 to $60,000 (46%) compared with those reporting more or less income.
Individuals who do all the household grocery shopping (42%), and those who spent $700 or more monthly (45%) are more likely than others to say they frequently buy organic products.
Individuals without post-secondary education are least likely to purchase organic products (17% saying they never or rarely do).
b) Determining organic products
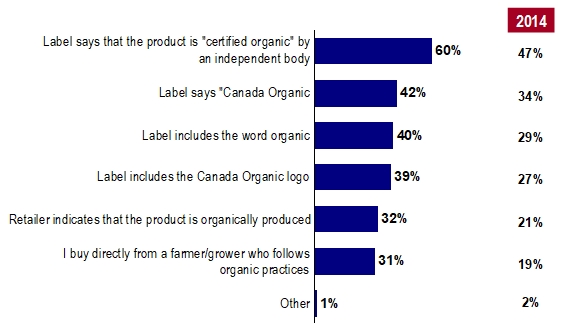
Those who purchase organic food items “sometimes” or often were asked how they determine whether a product is organically produced. Sixty per cent (60%) indicated they consider a product organic if the label says “certified organic” by an independent body. This is a considerable increase from 47% in 2014. Roughly four in 10 rely on whether or not the label says “Canada Organic” (42%, up from 34% in 2014), includes the word organic (40%, up from 29% in 2014), or includes the Canada Organic logo (39%, an increase from 27% in 2014), each of which represents a significant increase from 2014. Also up from 2014, 32% rely on the retailer indicating a product is organically produced, compared with 21% in 2014, or they buy directly from a farmer/grower who follows organic practices (31%, compared with 19% in 2014).
Chart 8: Methods of determining organic productsQ2B: “How do you determine whether a particular product is "organic" or not?”
Base: Sometimes or often purchases organic produced items 2019 (n=1453); 2014 (n=1322)
Table for Chart 8: Methods of determining organic products
(%)
2014 (%)
Labels says that the product is “certified organic” by an independent body
60
47
Label says “Canada Organic”
42
34
Label includes the word organic
40
29
Label includes the Canada Organic logo
39
27
Retailer indicates that the product is organically produced
32
21
I buy directly from a farmer/grower who follows organic practices
31
19
Other
1
2
Women (36%) are more likely than men (26%) to buy directly from a farmer/grower.
Canadians aged 35-54 (72%) are considerably more likely than their counterparts to look for the words “certified organic” on the label, particularly compared with those under 35 (45%).
Residents of Atlantic Canada (44%) are more likely than others across the country to buy directly from a farmer/grower. Those in British Columbia (73%) are more likely than elsewhere in Canada to rely on the label saying “certified organic” by an independent body. Alberta residents (52%) are most likely across the country to rely on labels that include the word “organic”.
Individuals with post-secondary education (66%) and income (68%) are more likely than those with no post-secondary education to say they determine this by looking for a label that says “certified organic” by an independent body, especially compared with those without post-secondary education (48%), and household incomes under $40,000 (51%).
Those who spend more on their groceries ($700 or more per month) (38%) are more likely to know a product is organic because they buy directly from the farmer/grower, especially compared with those who spend $300 or less (24%).
c) Benefits of purchasing organic products
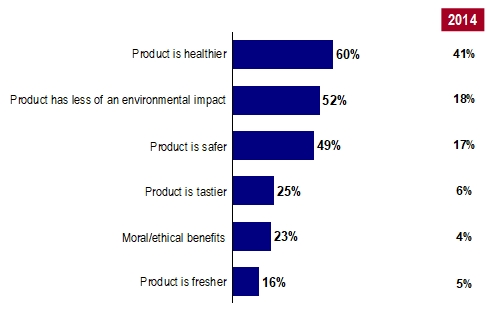
Of the individuals who indicated they purchase organically grown products at least some of the time, 60% said the most important benefit is healthier food, 52% pointed to the reduced environmental impact and 49% said the benefit is a safer product.
Chart 9 provides results for other benefits cited for purchasing organic products.
Results from 2014 are notably different because in 2014, respondents were only able to select a single response. Results from 2014 are not strictly comparable because of this, however, it is interesting to note that the top response is still a healthier product.
Chart 9: Benefits of purchasing organic productsQ2C: “In your opinion, what are the most important benefits of purchasing organic foods?”
Base: Sometimes or often purchase Purchases organically produced items 2019 (n=1341); 2014 (n=1322)
Table for Chart 9: Benefits of purchasing organic products
(%)
2014 (%)
Product is healthier
60
41
Product has less of an environmental impact
52
18
Product is safer
49
17
Product is tastier
25
23
Moral/ethical benefits
23
4
Product is fresher
16
5
Health is more likely to be seen as a primary benefit among residents of Quebec compared with others across the country.
A reduced environmental impact is more likely to be seen as a key benefit among individuals who are aged 45 to 65 compared other age cohorts. This is also true in Quebec (63%) compared with other provinces and among those with university education compared with individuals with less education.
Seeing organic products as safer is more often the case among women, those who are 65 or older and residents of the Atlantic (59%) compared with their counterparts.
d) Willingness to pay more
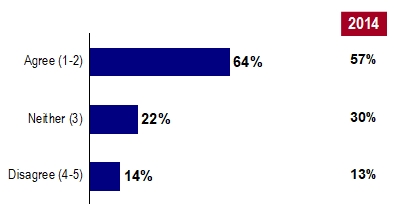
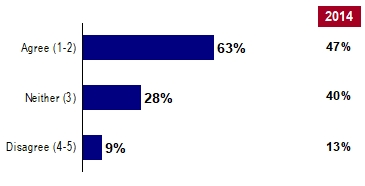
Those who purchase organic food items “sometimes” or “more often” were also asked whether they agree or disagree with a statement about willingness to pay more for products produced organically. Sixty-four per cent (64%) agree they are willing to pay more for organic products, which is a slight increase from 57% in 2014. Fourteen per cent (14%), however, disagree.
Chart 10: Willingness to pay more for organic productsQ2D: “To which extent to you agree or disagree with the following statement: "When grocery shopping, I am willing to pay more for products that are organically produced"?”
Base: Sometimes, often or always purchase organic produced items 2019 (n=1475); 2014 (n=1322)
Agree (1 to 2):
2019 - 64%
2014 - 57%
Neither (3):
2019 - 22%
2014 - 30%
Disagree (4 to 5):
2019 - 14%
2014 - 13%
Individuals with university education (72%) and household incomes of greater than $100,000 (71%) income are more often willing to pay more for organic products than other groups are.
Residents of Manitoba and Saskatchewan (73%) and Alberta (71%) are also more willing to do so than other Canadians.
Agri-food industry workers (76%) are more likely than others to strongly agree that they are willing to pay more for products that are organically produced.
e) Reasons for not purchasing organic
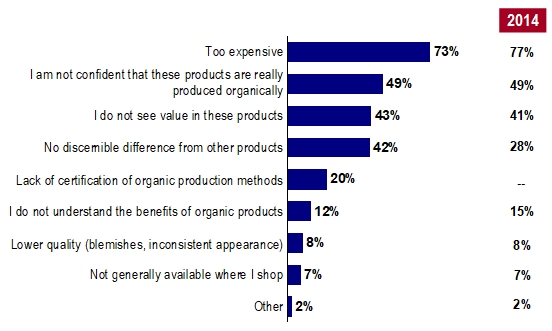
The 46% of the sample who said they never or rarely seek or buy organic products were asked about their main reasons for not doing so. The primary reason cited most often (73%) is that the products are too expensive, although this is down very slightly from 77% in 2014.
Less than half of those who rarely or never seek or purchase organic products said it is because they are not confident that the products are really produced organically (49%), they do not see the value in organic products (43%), or they believe there is no discernable difference from other products (42%, an increase from 28% in 2014).
Chart 11 provides details of reasons selected by 20% or fewer of those who do not buy organic products.
Chart 11: Reasons for not purchasing organic productsQ2E: “What are your main reasons for not purchasing food products labelled as "organic"?”
Base: Rarely or never looks for or purchases organic produced items 2019 (n=1527); 2014 (n=1702)
Table for Chart 11: Reasons for not purchasing organic products
(%)
2014 (%)
Too expensive
73
77
I am not confident that these products are really produced organically
49
49
I do not see value in these products
43
41
No discernible difference from other products
42
28
Lack of certification of organic production methods
20
N/A
I do not understand the benefits of organic products
12
15
Lower quality (blemishes, inconsistent appearance
8
8
Not generally available where I shop
7
7
Other
2
2
N/A: Not Available
Women (78%) are more likely than men (69%) to say they rarely or never purchase organic products because they are too expensive. Men (48%) are more likely than women (34%) to say they do not purchase them because there is no discernable difference from other products or they do not see the value in organic products.
Older Canadians (aged 65 and over) are considerably more likely than those under 55 to indicate each of these as reasons for rarely or never purchasing organic products, although they are no more likely than other age groups to say they are too expensive. They stand out most in saying they lack confidence in the accuracy of the label and see no value in it.
The university-educated who rarely or never purchase organically grown products (52%) are more likely than those with less education to say they:
see no discernable difference from other products (52%);
place no value on organic products (50%); or
do not purchase them because of the lack of certification of organic production methods.
3.3 Considerations for locally produced
a) Frequency of purchase
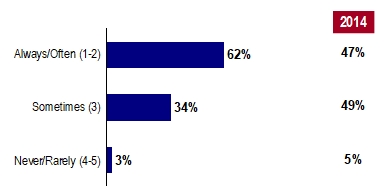
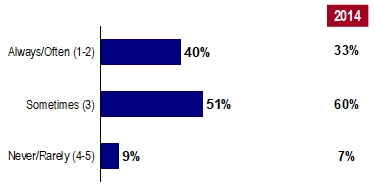
Excluding the 9% of survey respondents indicating they “never” or “rarely” look for locally grown products, those who do at least some of the time were subsequently asked how often they purchase these products when grocery shopping. Sixty-two per cent (62%) of this segment said they always or often purchase locally produced grocery products, which is a large increase from the 47% measured in 2014. Another 34% indicated they sometimes purchase locally produced products. Only 3% said they rarely or never do.
Chart 12: Frequency of purchasing local productsQ3A: “When you go grocery shopping, how frequently do you purchase locally produced products?”
Base: Seek locally produced items 2019 (n=2733); 2014 (n=2594)
Always/often (1 to 2):
2019 - 62%
2014 - 47%
Sometimes (3):
2019 - 34%
2014 - 49%
Never/rarely (4 to 5):
2019 - 3%
2014 - 5%
Older individuals (55 and over) are more likely (68%) than those under 55, particularly those under 35 (55%), to say they always or often purchase locally produced products.
Residents in Quebec are more likely to always or often purchase locally produced products (72%) compared with those in the rest of Canada, particularly in the Prairies (53%) and British Columbia (56%).
Individuals reporting household incomes of $40,000 to $60,000 (67%) are also most likely to purchase local products compared with those with higher or lower incomes.
Individuals who work in the agri-food industry are more likely to say they always purchase locally produced products (18% versus 7% among others).
b) Determining locally grown products
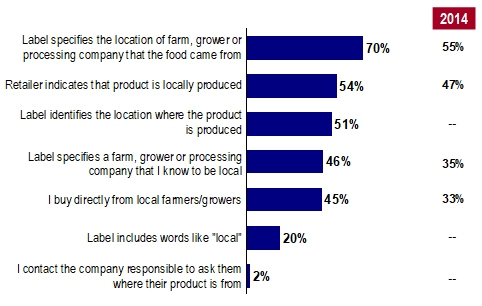
Those who often or sometimes purchase locally grown food items were asked how they determine whether a product is produced locally. Seventy per cent (70%) look to see if the label specifies the location of farm, grower, or processing company the food came from to determine whether a product is locally produced. This is a significant increase from 55% in 2014. Just over half rely on the assertion of the retailer (54%), which has increased slightly from 47% in 2014. Fifty-one per cent (51%) use the label to identify locally grown production. Slightly fewer determine this by the label specifying a farm, grower or processing company they know to be local (46%) or they buy directly from local farmers or growers (45%). Other results can be found in Chart 13.
Chart 13: Methods of determining local productsQ3B: “How do you determine whether a particular product is locally produced or not?”
Base: Sometimes or often purchases locally produced items 2019 (n=2638); 2014 (n=2479)
Table for Chart 13: Methods of determining local products
(%)
2014 (%)
Labels specifies the location of farm, grower or processing company that the food came from
70
55
Retailer indicates that product is locally produced
54
47
Label identifies the location where the product is produced
51
N/A
Label specifies a farm, grower or processing company that I know to be local
46
35
I buy from local farmers/ growers
45
33
Label includes words like” local”
20
N/A
I contact the company responsible to ask them where their product is from
2
N/A
N/A: Not Available
Individuals who are 65 or older are more likely than those under 65 to determine a product is local because the label indicates the location of where the product is produced, or the label includes the word “local”. Those who are 35 to 54 (50%) are more likely than other age cohorts to buy directly from local producers. This is particularly true compared to those under 35 (34%).
Residents of British Columbia and Atlantic Canada are much more likely than others across the country to determine if a product is locally produced by relying on:
the retailer to indicate the product is produced locally (64% and 62% respectively);
the label to specify a farm, grower or processing company that they know to be local (51% and 60% respectively); or,
buying directly from the farmer/grower (54% and 59% respectively).
University graduates and those reporting household incomes of $100,000 or higher are more likely than those with less education or income to determine a product is local based on all factors except if the label generally includes the words “local”.
c) Benefits of purchasing local
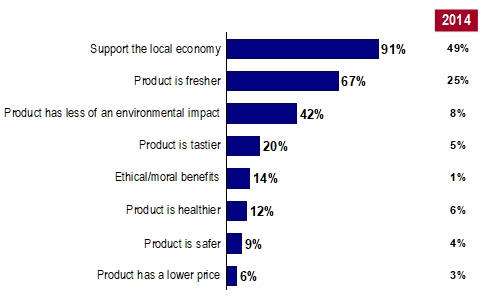
Of the individuals who indicated they purchase locally produced items at least some of the time, the overwhelming majority (91%) said the most important benefit is the support to the local economy.
Two in three consumers who purchase locally grown items (67%) cited freshness as a primary benefit. Considerably fewer (42%) said a primary benefit is the reduced environmental impact. Chart 14 provides results for other benefits cited for purchasing local products.
Results from 2014 are notably different because in 2014, respondents were only able to select a single response. Results from 2014 are not strictly comparable because of this, however, it is interesting to note that the top two responses are still support for the local economy (number one) and freshness (number two).
Chart 14: Benefits of purchasing local productsQ3C: “In your opinion, what are the most important benefits of purchasing locally produced foods?”
Base: Purchases locally produced items 2019 (n=2440); 2014 (n=2479)
Table for Chart 14: Benefits of purchasing local products
(%)
2014 (%)
Support local economy
91
49
Product is fresher
67
25
Product has less of an environment impact
42
8
Product is tastier
20
5
Ethical/ moral benefits
14
1
Product is healthier
12
6
Product is safer
9
4
Product is lower price
6
3
Women, individuals aged 35 to 54 years, as well as the university-educated, are more likely than their counterparts to say they buy local because the product has less of an environmental impact. This is also true of residents of British Columbia compared with the rest of the country.
Freshness is more often taken as a benefit among individuals living in Ontario and those aged 65 or older compared with others.
Consumers over 45 are more likely than those under 45 to say they purchase local to support the local economy.
d) Willingness to pay more
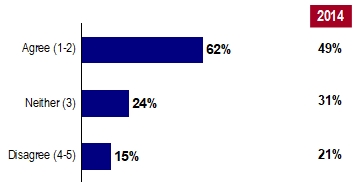
Those who purchase locally grown food items at least some of the time were asked about willingness to pay more for these products, and 62% said they are, which is a significant increase from 49% in 2014. Fifteen per cent (15%), however, are not willing to pay more for products that are produced locally.
Chart 15: Willingness to pay more for local products Q3D: “To which extent to you agree or disagree with the following statement: "When grocery shopping, I am willing to pay more for products that are produced locally"?”
Base: Sometimes, often or always purchase locally produced items 2019 (n=2650); 2014 (n=2479)
Agree (1 to 2):
2019 - 62%
2014 - 49%
Neither (3):
2019 - 24%
2014 - 31%
Disagree (4 to 5):
2019 - 15%
2014 - 21%
Canadians in Atlantic Canada (74%) are much more likely than others across the country to be willing to pay more for products that are produced locally. This is also true of university graduates (67%) and those reporting household incomes of $100,000 or higher (70%) compared with their counterparts.
Residents of Quebec (54%) and those without post-secondary education (57%) and/or household income of $40,000 or lower (56%) are least willing to pay more.
e) Reasons for not purchasing local products
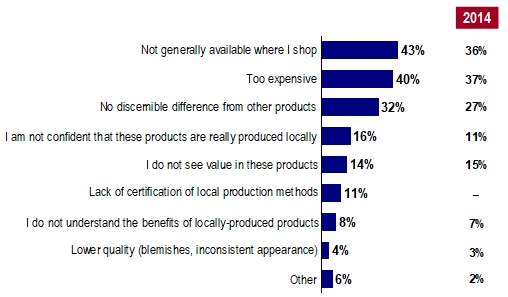
Only 3% of the sample either never or rarely seek or buy local products. These individuals were asked about their main reasons for not doing so. Among this segment, about four in 10 pointed to a general lack of availability where they shop (43%; an increase from 36% in 2014) or the expense (40%; only slightly higher than 37% in 2014). Thirty-two per cent (32%) said they see no discernable difference in local products from other products (up from 27% in 2014). Less prominent reasons are also listed in Chart 16.
Chart 16: Reasons for not purchasing local productsQ3E: “What are your main reasons for not purchasing food products labelled as “local"?”
Base: Rarely or never looks for or purchases locally produced items 2019 (n=313); 2014 (n=545)
Table for Chart 16: Reasons for not purchasing local products
(%)
2014 (%)
Not generally available where I shop
43
36
Too expensive
40
37
No discernible difference from other products
32
27
I am not confident that these products are really produced locally
16
11
I don't see value in these products
14
15
Lack of certification of local production methods
11
N/A
I don't understand the benefits of locally-produced products
Canadians aged 45 and over are more likely than those under this age to point to lack of confidence the products are really produced locally as their main reason for not purchasing local food items.
Residents of Saskatchewan and Manitoba (62%) are much more likely than others across the country to indicate a general lack of availability of locally produced food where they shop. Those in Quebec are more likely than others to say local items are too expensive (60%). Compared with the rest of Canada, residents of Alberta (23%) more often point to the lack of certification of local production methods as the reason.
The university-educated (27%) are more likely than those with less education to say they do not see the value in local products.
3.4 Considerations for environmentally sustainable
a) Frequency of purchase
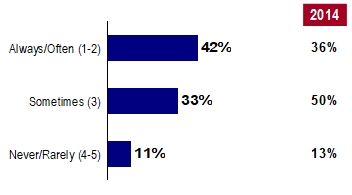
The 71% of survey respondents indicating they look for food items produced using environmentally sustainable methods were subsequently asked how often they purchase these products. Forty per cent (40%) said they always or often purchase foods produced using environmentally sustainable methods, which is up slightly from 33% in 2014. A larger proportion (51%) indicated they sometimes do, although 9% said they rarely or never do.
It is also interesting to note that 11% of respondents said, while they seek items that use environmentally sustainable practices, they feel unsure if such practices where actually used, pointing to possible concerns about labelling and transparency. As in 2014, these cases were not included in the 2019 calculation.
Chart 17: Frequency of Purchasing Environmentally SustainableQ4A: “When you go grocery shopping, how frequently do you purchase foods produced using environmentally sustainable methods?”
Base: Seek environmentally sustainable produced items 2019 (n=1915); 2014 (n=2013)
Always/often (1 to 2):
2019 - 40%
2014 -33%
Sometimes (3):
2019 - 51%
2014 - 60%
Never/rarely (4 to 5):
2019 - 9%
2014 - 7%
Women (39%) are more likely than men (32%) to always or often purchase foods produced using environmentally sustainable methods.
Residents of Quebec (49%) are more likely than the rest of Canada to say they always or often purchase foods produced using environmentally sustainable methods. Residents of Ontario are least likely to do so (30%).
Individuals working in the agri-food industry are more likely than others to say they always purchase products that rely on environmentally sustainable methods (15% compared with 3% among others).
b) Determining environmentally sustainable production
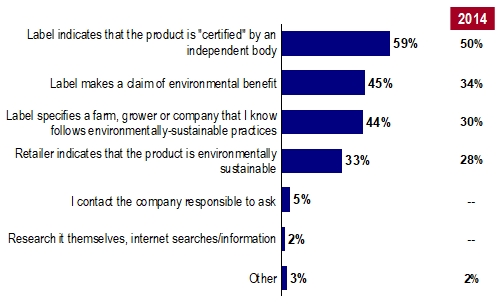
Those who sometimes or often purchase food items produced using environmentally sustainable methods were asked how they determine this about a product. Fifty-nine per cent (59%) said they rely on the label indicating a product is “certified” by an independent body. Over four in 10 rely on labels making a claim of an environmental benefit (45%), or specifying a producer they know follows environmentally sustainable practices (44%). Thirty-three per cent (33%), however, rely on claims from the retailer. Results are generally higher than in 2014 across each of these, although this may be largely driven by a greater tendency to select multiple methods in 2019.
Chart 18: Methods of determining environmentally sustainableQ4B: “How do you determine whether a particular product is produced using environmentally sustainable methods or not?”
Base: Sometimes or often purchases environmentally sustainable products 2019 (n=1657); 2014 (n=1862)
Table for Chart 18: Methods of determining environmentally sustainable
(%)
2014 (%)
Label indicates that the product is “certified” by an independent body
59
50
Label makes a claim of environmental benefit
45
34
Label specifies a farm, grower or company that I know follows environmentally-sustainable practices
44
30
Retailer indicates that the product is environmentally sustainable
33
28
I contact the company responsible to ask
5
N/A
Research it themselves/ internet searches/ information
2
N/A
Other
3
2
N/A: Not Available
Women are more likely than men to rely on labels specifying a farm, grower, or company they know follows environmentally sustainable practices.
Individuals living in Manitoba and Saskatchewan (58%) are more likely than the rest of Canada to rely on the label claiming environmental benefits. Those in Ontario are more likely than others to rely on assertions by the retailer. Residents of Atlantic Canada are more likely than others across the country to rely on a label that specified the producer has followed these practices, which is also the case more often among those 55 or older compared with their younger counterparts.
Those with university education and/or household income of $100,000 or higher are more likely than others to rely on an indication of “certified” in the label.
c) Benefits of purchasing environmentally sustainable products
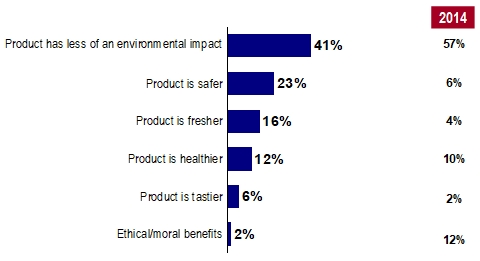
Of the respondents indicating they purchase products grown through environmentally sustainable practices at least some of the time, 41% do so because there is less of an environmental impact. Twenty-three per cent (23%) are motivated by the belief that the product is safer, and others (12%) similarly feel it is healthier. Freshness is seen as a primary benefit among 16%. Other less frequently cited reasons are also shown in Chart 17.
Since respondents in 2014 were only able to select a single response, results are quite different and strictly speaking not precisely comparable. It is interesting to note, however, that the top response is still the environmental impact, followed at a distance by safety, freshness, and health.
Chart 19: Benefits of Purchasing Environmentally SustainableQ4C: “In your opinion, what are the most important benefits of purchasing foods produced using environmentally sustainable methods?”
Older Canadians (aged 65 and over) are more likely to feel the product is fresher than those who are under 65 (26% compared with 12% of those 35 to 64, and 17% among those under 35).
Residents of Alberta (51%) are more likely than others across the country to say the most important benefit is that the product has less of an environmental impact. Those from Ontario are more likely to say the product is fresher than residents of other regions. Residents of Quebec are more likely than the rest of the country to feel the product is safer. Residents of British Columbia are more likely than others to feel the product is healthier.
Those with university education (50%) and household income of $100,000 or higher are more likely to say the most important benefit is that the product has less of an environmental impact. Individuals with no post-secondary education are more likely than others to feel the products are fresher.
d) Willingness to pay more
Individuals who at least sometimes purchase food items grown through environmentally sustainable methods were asked about willingness to pay more for these products. Sixty-three per cent (63%) said they are willing to pay more for products produced in this manner, which is a significant increase from 47% in 2014, when a greater proportion were more ambivalent. Only 9% of those shopping for environmentally sustainable products said they do not wish to pay more.
Chart 20: Willingness to pay more for environmentally sustainableQ4D: “To which extent to you agree or disagree with the following statement: "When grocery shopping, I am willing to pay more for products that are environmentally sustainable"?”
Base: Sometimes, often or always purchases environmentally sustainable products 2019 (n=1725); 2014 (n=1862)
Agree (1 to 2):
2019 - 63%
2014 - 47%
Neither (3):
2019 - 28%
2014 - 40%
Disagree (4 to 5):
2019 - 9%
2014 - 13%
Residents in Atlantic Canada (75%) are more likely than others across the country to agree they are willing to pay more for products that are environmentally sustainable. Those living in Quebec (52%) are least likely to agree.
Individuals with university education (71%) and household income of $100,000 or greater (72%) are more often willing to pay more, particularly when compared with those reporting household incomes of $40,000 to $60,000 (57%) and without post-secondary education (56%).
e) Reasons for not purchasing items produced under environmentally sustainable methods
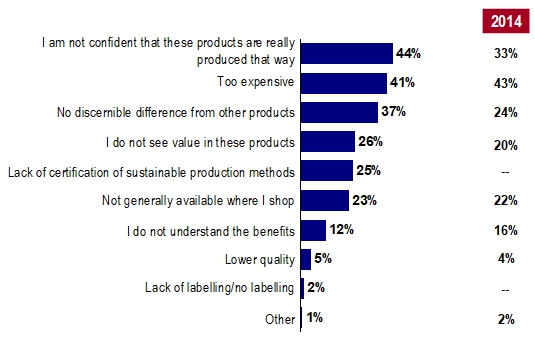
The 34% who rarely or never look for or purchase items produced using environmentally sustainable practices were asked about their main reasons for not doing so. Forty-four per cent (44%) said it is because they are not confident these products are really produced in this way, which is an increase from 33% in 2014. Forty-one per cent (41%) feel these products are too expensive, which is on par with 43% in 2014. Not seeing a discernible difference from other products is a primary reason for 37%, which has also increased from 24% in 2017.
Other reasons, cited by lower proportions, are also shown in Chart 21.
Chart 21: Reasons for not purchasing environmentally sustainable Q4E: “What are your main reasons for not purchasing food products labelled as produced using environmentally sustainable methods?”
Base: Rarely or never looks for or purchases environmentally sustainable products 2019 (n=963); 2014 (n=1162)
(%)
2014 (%)
I am not confident that these products are really produced that way
44
33
Too expensive
41
43
No discernible difference from other products
37
24
I don't see value in these products
26
20
Lack of certification of sustainable production methods
25
N/A
Not generally available where I shop
23
22
I don't understand the benefits
12
16
Lower quality
5
4
Lack of labelling/ no labelling
2
N/A
Other
1
2
N/A: Not Available
Women are more likely than men to point to a lack of availability as a reason for not looking for environmentally sustainable products. Men more often say there is no discernable difference, they see no value in these products, or there is a lack of certification on production methods.
Residents in Alberta (50%) are much more likely to believe there is no discernable difference, or they see no value in these products compared with other residents. Those living in Manitoba or Saskatchewan (46%) are also more likely than others across the country to say they see no discernable difference. Residents of Atlantic Canada or Ontario are more likely in Canada to point to a lack of availability than others. Residents of Alberta (54%) and British Columbia (53%) more often say they lack confidence in the claim of environmentally sustainable practises than in the rest of the country, which is also a view more prominently held among those who are 55 to 64 (57%) compared with other age groups.
The university-educated are also more likely than those with less education to point to the lack of certification of environmental sustainability.
Households with incomes of $100,000 or more are more likely to say the see no value in these products compared with those with lower income.
3.5 Considerations for humane animal treatment
a) Frequency of purchase
The 67% of survey respondents who look for food items produced using humane animal treatment practices at least some of the time were asked how often they purchase these products. Forty-two per cent (42%) said they always or often do so, which is an increase from 36% in 2014. Only 11% rarely or never purchase products produced under conditions related to the humane treatment of animals, which is on par with 13% in 2014.
Chart 22: Frequency of purchasing products that use humane treatmentQ5A: “When you go grocery shopping, how frequently do you purchase products produced under conditions related to the humane treatment of animals?”
Women (45%) are more likely than men (38%) to say they always or often purchase products produced under conditions related to the humane treatment of animals.
Households with no children (44%), along with individuals who do all the grocery shopping (47%), are more likely than others to say they always or often purchase these products.
b) Determining products using humane animal treatment
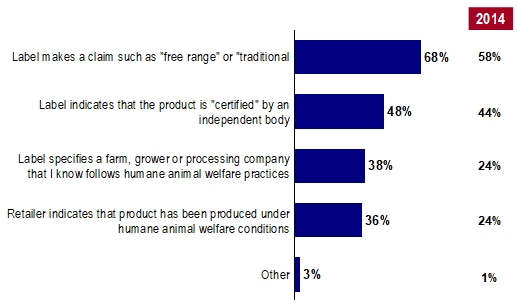
Those who often or sometimes purchase food items grown using humane animal practices were asked how they determine this about a product. Sixty-eight per cent (68%) look for a label that makes a claim such as “free range” or “traditionally raised”, which is somewhat of an increase from 58% in 2014. Forty-eight per cent (48%) rely on labels that indicate products are “certified” by an independent body, which is on par with 44% in 2014. Another 38% look for a label that specified a farm, grower, or processing company they know follows humane animal welfare practices, which is an increase from 24% in 2014. About the sample proportion (36%), however, relies on claims from the retailer, which is also up from 24% in 2014.
Chart 23: Methods of determining products that use humane treatmentQ5B: “How do you determine whether a particular animal-based food is produced under conditions related to the humane treatment of animals?”
Base: Sometimes or often purchases free range items 2019 (n=1395); 2014 (n=1454)
Table for Chart 23: Methods of determining products that use humane treatment
(%)
2014 (%)
Label makes a claim such as “free range” or traditional”
68
58
Label indicates that the product is “ certified” by an independent body
48
44
Label specifies a farm, grower or processing company that I know follows humane animal welfare practices
38
24
Retailer indicates that product has been produced under humane animal welfare conditions
36
24
Other
3
1
Canadians who are 65 years of age or older are more likely than those under 65 to say they determine by if a label specifies a farm they know follows humane animal welfare practices. This is also true of those living in Atlantic Canada (49%).
Those who are 35 to 44 years of age are more likely than other age groups to rely on a label that says “certified”. The university-educated more often determine this by if the label indicates the product is certified than those with less education (also true of those reporting the highest household incomes), or if the retailer indicates the animal product was produced under humane conditions.
Agri-food industry workers, as well as those reporting the highest household incomes, are least likely to rely on a label that makes a claim such as “free range” or “traditionally raised” compared with others.
c) Willingness to pay more
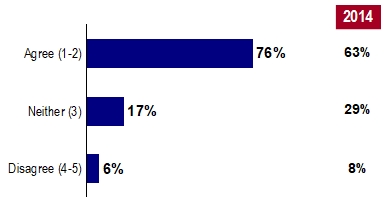
Those who purchase food items grown using humane animal treatment at least some of the time were asked about willingness to pay more for these products. Seventy-six per cent (76%) indicated a willingness to do so, which is an increase from 63% in 2014. Another 17% neither agree nor disagree with this, but only 6% indicated an unwillingness (that is, disagreed), which is similar to the 8% in 2014.
Chart 24: Willingness to pay more for products that use humane treatmentQ5C: “To which extent to you agree or disagree with the following statement: "When grocery shopping, I am willing to pay more for animal-based foods produced under conditions related to the humane treatment of animals"?”
Base: Sometimes, often or always purchases free range items 2019 (n=1421); 2014 (n=1454)
Agree (1 to 2):
2019 - 76%
2014 - 63%
Neither (3):
2019 - 17%
2014 - 29%
Disagree (4 to 5):
2019 - 6%
2014 - 8%
Women (79%) are more likely than men (73%) to be willing to pay more.
Willingness to pay more is also more prevalent in Atlantic Canada (85%) compared with the rest of Canada.
Those with university education (83%) and household incomes of $100,000 or greater (81%) are more likely than others to be willing to pay more.
Households who spend less than $300 monthly on groceries are more likely to disagree (11%) compared with those spending more.
d) Reasons for not purchasing items produced under humane animal conditions
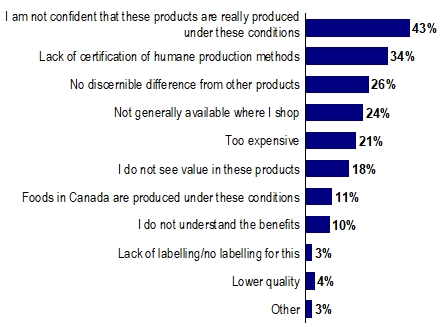
The 34% who rarely or never look for or purchase items produced using humane animal treatment were asked to provide their main reasons for this. Among this segment, 43% pointed to a lack of confidence that products are really produced under these conditions as a primary reason. Thirty-four per cent (34%) said it is because of a lack of certification of humane production methods.
About one in four feel there is no discernible difference from other products (26%) or pointed to the lack of availability of these products where they shop (24%), and 22% believe these products are too expensive.
Chart 25 provides further detail on other reasons selected.
Since lack of certification was not offered as a choice in 2014, results are significantly different and strictly speaking, not comparable. It is interesting to note, however, that lack of confidence is still the top reason, and lack of discernable difference, lack of availability, and lack of perceived value are still secondary key reasons. It appears expense is no longer as significant a barrier as it was in 2014.
Chart 25: Reasons for not purchasing products that use humane treatment of animalsQ5D: “What are your main reasons for not purchasing products produced under conditions related to the humane treatment of animals?”
Base: Rarely or never looks for or purchases free range items 2019 (n=1140)
I am not confident that these products are really produced under these conditions: 43%
Lack of certification of humane production methods: 34 %
No discernible difference from other: 26%
Not generally available where I shop: 24%
Too expensive: 21%
I do not see value in these: 18%
Foods in Canada are produced under these conditions: 11%
I don't understand the benefits: 10%
Lack of labelling/ no labelling for this: 3%
Lower quality: 4%
Other: 3%
Younger Canadians (aged 34 and under), along with those with lower income (under $60,000) are more likely than those who are older or report higher household incomes to say products are too expensive.
Older Canadians (aged 65 or older) are more likely than those under 65 to point to a lack of availability where they shop, which is also a more prevalent view in Ontario than elsewhere in Canada.
Men are more likely than women to feel there is no discernable difference. This view is also more prominently held in Alberta and Quebec compared with the rest of Canada.
Those who are 45 or older more often point to a lack of confidence that the claims are accurate compared with younger Canadians.
Agri-food industry workers are more likely to say foods produced in Canada are generally produced under humane animal conditions anyway.
3.6 Most influential types of information
When asked about the types of information that has most influenced their purchasing decisions in the grocery store over the past year, the most frequently cited source of influence was the cost of food (77%). For 65% of Canadians, the nutritional value of food is influential. Product labels (44%) or food produced in Canada (41%) are also significant in shaping purchase decisions for some. Thirty per cent (30%) pointed to health issues.
Other drivers of purchasing decisions are noted in Table 2.
Table 2: Most influential information
Types of information
2019
n=
3016
Cost of food
77%
Nutritional value
65%
Product labels
44%
Food produced in Canada
41%
Health Issues
30%
Food safety incidents/recalls
28%
Food additives/residues
26%
Specific dietary regimes (weight loss, allergens, etc.)
23%
Information provided by producers
11%
Canada's food guide
11%
Advertising and marketing
10%
Information provided by retailers
8%
Food production technologies
7%
Other
4%
None of the above
1%
Don't now (not sure)
--
Q9: Over the past year, what kinds of information most influenced your purchase decisions in the grocery store? Items with 3% or less not shown
Base: All respondents
Women are more likely than men to be influenced by food produced in Canada, food safety incidents, food additives, and specific dietary regimes.
Canadians aged 55 and over are more likely than those under 55 to cite influence by food produced in Canada (53%), and product labels (52%). Individuals who are 65 or older are more often influenced by information about food additives, and food safety incidents than those under 65.
Residents of Quebec are more likely than those in other regions to be influenced by health issues (41%). Canadians living in Alberta, Manitoba, and Saskatchewan are more likely to be influenced by cost of food. Those in Ontario, along with Atlantic Canada, are more likely to cite food safety incidents than others do.
University graduates tend to be influenced by nutritional value compared with those with less education.
Individuals with the highest income ($100,000 and over) are most likely to be influenced by product labels, or specific dietary regimes.
Parents are more often influenced than others by the cost of food.
Individuals who spend $300 or less on groceries per month are more likely than those who spend more on food to be influenced by the cost of food compared with those who spend more. People who spend the most ($700 or more) are more likely than others to be influenced by specific dietary regimes.
Those who work in the agri-food industry (38%) are more likely to be influenced by food safety incidence or recalls.
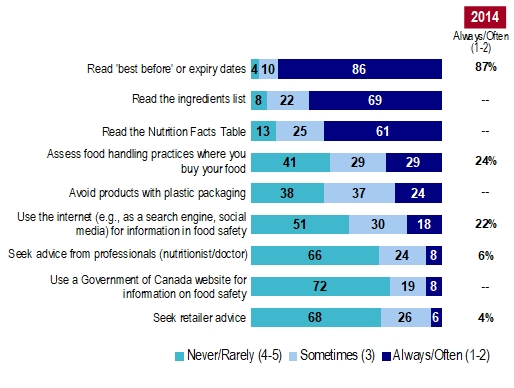
3.7 Use of key information in making decisions
The survey asked about the frequency with which Canadians consider a number of aspects of the food item when making food purchase decisions. Results indicate that 86% always or often read the ”best before” or expiry dates on products, which is similar to 2014 results. Sixty-nine per cent (69%) always or often read the ingredients list, and 61% always or often read the Nutrition Facts Table.
Chart 26 provides detail of other elements and the frequency with which they are considered in shopping decisions.
It is notable that only 8% said they always or often use a Government of Canada website as a source of food safety information, and 72% said they never or rarely do.
Chart 26: Use of key information in purchase decisionQ16: “When making food purchase decisions, how often do you…?”
Base: All Respondents 2019 (n=3021); 2014 (n=3024)
Chart 26: Use of key information in purchase decision
Never/rarely (4 to 5)
Sometimes (3)
Always/often (1 to 2)
2014 Always/often (1-2) (%)
Read ‘best before' or expiry dates
4
10
86
87
Read the ingredients list
8
22
69
N/A
Read the nutrition fact table
13
25
61
N/A
Read food handling practices where you buy your food
41
29
29
24
Avoid products with plastic packaging
38
37
24
N/A
Use the internet (for example, as a search engine, social media) for information in food safety
51
30
18
22
Seek advice from professionals (nutritionist/doctor)
66
24
8
6
Use a Government of Canada Website for information on food safety
72
19
8
N/A
Seek retailer advice
68
26
6
4
N/A: Not Available
Younger Canadians (under 35) are more likely than their older counterparts to look for advice from a health professional, use the Internet or social media (27%), or a Government of Canada website as a source of food safety information. Individuals 55 or older are least likely to use social media. Canadians over 65 are more likely than younger Canadians to read the ingredients list, and those under 35 are least likely to do so. Those without post-secondary education are least likely to do so (57%) compared with those with more education.
Women, along with those with university education and income are more likely than others to read the Nutrition Facts Table. Women are also more likely than men to read the ingredients list.
Avoiding products with plastic packaging is more common among women, residents of British Columbia and Quebec, and those with university education than it is among their counterparts. Residents of Alberta (51%), as well as Manitoba and Saskatchewan (47%) are more likely to say they do not avoid products with plastic packaging.
Agri-food industry workers are more likely to seek retailer advice, seek advice from a professional like a nutritionist or doctor, use a Government of Canada website (21%) as a source of food safety information, or to read the list of ingredients.
Individuals with lower income, along with those who spend the least on groceries (less than $300 per month), are less likely than others to read ”best before” dates, as are those working in the agri-food industry.
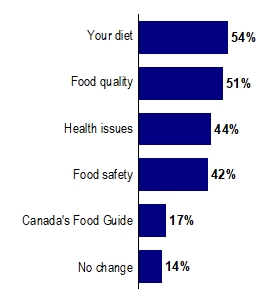
3.8 Food purchasing habits
More than half of Canadians have changed, or plan to change, their food purchasing habits because of their diet (54%) or food quality (51%). Over four in ten have or plan to change their purchasing habits based on health issues (44%) or food safety concerns (42%). Another 17% plan to change their habits based on Canada's food guide. Fourteen per cent (14%) do not expect to make a change.
Chart 27: Expected change of food purchasing habitsQ18: “Have you changed, or do you plan to change your food purchasing habits because of the following…?”
Base: All Respondents 2019 (n=2755)
Your diet: 54%
Food quality: 51%
Health issues: 44%
Food safety: 42%
Canada's Food Guide: 17%
No change: 14%
Older Canadians (age 55 and over) are somewhat more likely than those under 55 to have changed or plan to change their food purchasing habits because of health issues. Individuals who are between 45 and 54 are more likely to be concerned about a diet.
Residents of Quebec are more likely than others across the country to change based on health issues.
Canadians with university education are somewhat more likely to say they will change their habits because of Canada's food guide than those with less education.
Individuals with household incomes of $100,000 or more are somewhat more likely than those with less income to change because of their diet.
3.9 Boycotting
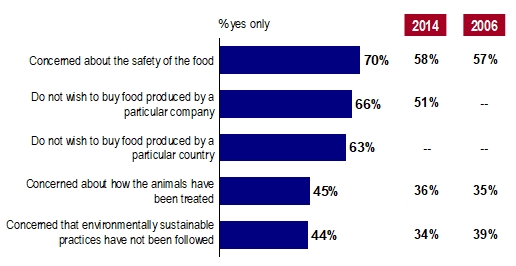
Seventy per cent (70%) of Canadians have avoided or boycotted products because of concern about the safety of the food, which is an increase from 58% in 2014 and 57% in 2006. Sixty-six per cent (66%) have chosen to not buy food produced by a particular company, which is an increase from 51% in 2014. Sixty-three per cent (63%) have not purchased food produced by a particular country. More than four in ten have avoided or boycotted a food product because of concern about how the animals have been treated (45%) or concern that environmentally sustainable practices have not been followed (44%). Each of these represents an increase from 2014.
Chart 28: Reasons for boycotting productsQ15: “Have you ever avoided or boycotted a particular food product because…?”
Base: All Respondents 2019 (n=2943); 2014 (n=3024); 2006 (n=1600)
Chart 28: Reasons for boycotting products
% Yes only
2014 (%)
2006 (%)
Concerned about the safety of food
70
58
57
Do not wish to buy food produced by a particular company
66
51
N/A
Do not wish to buy food produced by a particular country
63
N/A
N/A
Concerned about how the animals have been treated
45
36
35
Concerned that environmentally sustainable practices not been followed
44
34
39
N/A: Not Available
Boycotting because of concerns about food safety is least likely to occur among those who under 35, residents of Manitoba, Saskatchewan, as well as those with no-post secondary education.
Residents of British Columbia are more likely than others across the country to boycott a particular company. Least likely to do so are residents of Manitoba, Saskatchewan and the Atlantic, as well as those under 35 (56%) and/or individuals with no post-secondary education.
Individuals most likely to boycott a particular country are 45 or older (69% among 45-54, and 76% among 55 or older). Least likely to do so are those under 35 (41%), individuals with no-post secondary education (53%) and residents of Manitoba and Saskatchewan (53%).
Boycotting because of concerns about treatment of animals is more likely among women and residents of British Columbia. It is least often the case among residents of Manitoba and Saskatchewan, as well as those with no-post secondary education.
Boycotting as a result of concerns about lack of environmentally sustainable practices is most likely among women and those who are 35 to 44, and/or residents of Quebec (55%). Least likely to take this type of action are residents of Manitoba, Saskatchewan and Alberta (33% in each), along with those with no-post secondary education.
3.10 Use of meal kits or online purchasing services
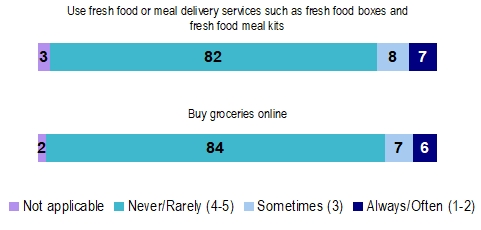
Emerging trends in food purchasing have been adopted by a small minority of Canadians. Fifteen per cent (15%) of people indicated that they frequently (7%) or sometimes (8%) use fresh food or meal delivery services such as fresh food boxes and fresh food meal kits, although there are significant proportions of Canadians under 35 who do. Similarly, 13% frequently (6%) or sometimes (7%) buy groceries online, although this is more popular among those under 35 (see below).
Chart 29: New trends in purchasingQ16J-K: “When making food purchase decisions, how often do you…?”
Base: All Respondents 2019 (n=3031)
Use Fresh food or meal delivery services, such as fresh food boxes and fresh food meal kits:
Not applicable: 3%
Never/rarely (4 to 5): 82%
Sometimes (3): 8%
Always/often (1 to 2): 7%
Buy groceries online:
Not applicable: 2%
Never/rarely (4 to 5): 84%
Sometimes (3): 7%
Always/often (1 to 2): 6%
Younger Canadians (age 34 and under) are more likely than those 35 or older to say they always, often or even sometimes buy groceries online (24%) and use fresh food boxes and meal kits (28%).
This is also the case among those who work in the agri-food industry (24% always, often or even sometimes purchase meal kits and 20% buy groceries online).
Parents, along with those in larger households (four or more people), are more likely than others to always, often or sometimes buy groceries online (21% in each case).
4. Use of technology for information
4.1 Bar codes for information
a) Use of bar code information
When asked about use of a mobile device to scan a barcode for information on a food or retail product, survey results indicate that 26% of Canadians have done this, although 74% have not. It should be noted that 13% indicated they did not know, which has not been included in chart 30
Chart 30: Using bar code information about productsQ13A: “Have you ever used a mobile phone or handheld device to scan a barcode (including 'QR' or '2D' barcodes) for a food or other retail product?”
Base: All Respondents 2019 (n=2650)
Yes: 26%
No: 74%
Men (32%) are more likely to have used bar codes on food products than women (21%), who are more often unsure if they had.
Those under 45 are the most likely to have used bar codes (under 35; 38%, 35 to 44 age group: 34%). Individuals who are 55 or older are least likely to have done so (18% among those 55-64, and 12% among those 65 or older).
Residents of Alberta (35%) also reported higher use of bar codes than those living in other regions. Those living in Manitoba and Saskatchewan are least likely to have done so (19%).
Individuals reporting household incomes of $100,000 or more (35%) are most likely to have scanned bar codes.
Those working in the agri-food industry (36%) are more likely to use their devices for this purpose than others (27%).
b) Type of information accessed
Among the 26% of Canadians who scan bar codes, 21% indicated they always or often scan packages or shelf labels at a food store, and another 32% do so some of the time. Seventeen per cent (17%) always or often do this in another type of store, and 33% do so in other stores some of the time). Fifteen per cent (15%) always or often scan printed materials in newspapers or magazines and another 22% do so some of the time. Twelve per cent (12%) scan posters or displays advertising with bar codes always or often and another 19% do so some of the time.
Chart 31: Type of bar code information accessedQ13B: “Have you ever used a handheld device (for example, mobile phone) or a specific application (for example, health tracking app) to scan a barcode for each of the following?”
Base: Using a device or application to scan a barcode 2019 (n=654)
Chart 31: Type of bar code information accessed
Never/rarely (1 to 2) (%)
Sometimes (3) (%)
Always (4 to 5) (%)
On package or shelf labels in a food store
47
32
21
On package or shelf labels in another type of store
50
33
17
On printed advertisements or articles in newspapers or magazines
63
22
15
On posters or display advertising
69
19
12
Generally, men, those under 35, parents and individuals representing larger households are more likely than other segments to often or always scan bar codes in each of these places. Women and those who are 65 or older are least likely to do so.
Parents and individuals who are wholly responsible for grocery shopping are more likely than others to scan packaging in food and other types of stores. Parents are also more likely than others to scan poster or display ads.
Individuals without post-secondary education and the lowest household incomes (under $40,000), and households spending less than $300 a month on groceries are each most likely than their counterparts to scan bar codes from advertisements, including on:
Posters or displays, or
In print media.
Those with household incomes of $100,000 or more and university education are least likely to do so.
Residents of Quebec are least likely across the country to scan packaging on shelves in food stores, while residents of British Columbia are least likely to scan products in other types of stores, as are those with a university education.
c) Type of information of interest to non-users
Those who have not used bar code information were asked about the type of information they would want to have available through bar code scanning. While 31% said there is no information of interest to them in scanning bar codes, the main types of information of interest to others are price (53%), country of origin (52%), and ingredients (50%), followed by nutritional information (47%). Less popular, but still of interest to some, is information about the weight or quantity of a product (35%) and the method of production (31%). Health claims are of least interest (25%).
Table 3: Types of bar code information of interest to non-users
Desired information available through barcodes
Total
n=
1912
Price
53%
Country of origin
52%
Ingredients
50%
Nutrition Facts
47%
Weight/volume/quantity
35%
Production methods
31%
Health claims
25%
None of these - not interested in scanning bar codes
31%
Q13C: What information do you want to be available through scanning of barcode (including 'QR' or '2D' barcodes)? Items with 3% or less not shown
Base: Respondents who have not used bar codes
Those under 35 years of age are more likely than individuals who are 35 or older to want information on pricing, and nutrition facts than those in other age groups.
Residents of Quebec are more likely than others across the country to want information on prices compared to those in other regions. Residents of Atlantic Canada reported higher interest in ingredients (67%) and nutrition facts than the rest of Canada.
Those with university education are more likely than others to want information on country of origin. Individuals without post-secondary education have the least interest in nutrition, ingredients and country of origin (42%).
Agri-food industry workers (65%) typically show considerably higher interest in information on country of origin than others do.
5. Impressions – confidence
5.1 General orientation towards foods and purchasing
Survey respondents were provided with a variety of statements about their views and habits related to grocery shopping and asked to agree or disagree (mildly or strong) with each one. When it comes to attitudes about food, a large majority of Canadians (85%) indicated the price of food affects their food purchasing decisions. More than eight in ten (83%) said they are careful about the way they buy and prepare food to minimize food waste.
About two-thirds of Canadians (68%) said they consider the environmental impact of foods in purchasing decisions.
Forty-five per cent (45%) of people are willing to pay more for products that are certified, although 25% are not. Forty-one percent (41%) report spending time worrying about the safety of the food they eat, although almost as many (35%) do not.
Chart 32: Attitudes about foodQ14: “Do you agree or disagree with the following statements…?”
Base: All Respondents 2019 (n=3022)
Chart 32: Attitudes about food
Disagree (4 to 5) (%)
Neutral (3) (%)
Agree (1 to 2) (%)
The price of food effects my food purchasing decisions
5
10
85
I am careful about the way I buy and prepare food to minimize food waste
6
12
83
I consider the environmental impact (reducing the use of plastic or packaging in my food purchasing decisions)
13
19
68
I would be willing to pay more for products that are certified
25
30
45
I spend time worrying about the safety of the food I eat
35
24
41
Segments most likely to be focused on price in food purchasing decisions are Canadians under 45, parents, families of four or more, and households with incomes of $60,000 or less. The concentration of concern for price is also more elevated in Manitoba and Saskatchewan than it is elsewhere in the country.
Women are more likely to be conscious of minimizing waste than men, which is also higher among those 55 or older. Those under 35 (72%), and residents of Alberta are least likely to be guided by minimizing waste.
Women, those who are 55 or older, and residents of British Columbia are more likely to consider the environmental impact of reducing plastic or packaging in their food purchasing decisions than others, as are respondents with university education. Men, those under 35, and those without post-secondary education are less likely than others to be guided by environmental impact, as are parents, and larger households (that is, families of four or more).
Those comparatively more willing to pay more for products that are certified are women and individuals with university education, compared with their counterparts. Parents and/or those with four or more in the household are less likely to express a willingness to pay more, which is also most often true of residents of Alberta, Manitoba and Saskatchewan.
Residents of Quebec (75%), those under 45 years old, individuals reporting household incomes of under $60,000 are each more likely than others to worry about the safety of the food they eat. Residents of the British Columbia (28%), Alberta (27%), Manitoba and Saskatchewan (24%) are least likely to spend time worrying about food safety as are individuals reporting household incomes of $100,000 or more.
5.2 Perceptions about transparency
When asked about transparency of the agriculture and food industry, results indicate a much greater degree of confidence in food produced in Canada than food produced elsewhere. Based on the results, more than half of Canadians (56%) believe the Canadian agriculture and food industry is transparent about how food is produced. This is much higher than the 18% who believe in the transparency of the agriculture and food industry of other countries.
Chart 33: Perceptions about transparencyQ14: “Do you agree or disagree with the following statements…?”
Base: All Respondents 2019 (n=3022)
I believe the Canadian agriculture and food industry transportation about how food is produced:
Disagree (4 to 5): 17%
Neutral (3): 26%
Agree (1 to 2): 56%
I believe the agriculture and food industry of other countries are transparent about how food is produced:
Disagree (4 to 5): 55%
Neutral (3): 27%
Agree (1 to 2): 18%
Individuals who work in the agri-food industry are considerably more likely than other Canadians to believe the system in Canada is transparent (70%). Those who are 55 to 64 (62%) are also more positive than others about the transparency in Canada. Individuals with household incomes under $40,000 are less (51%) likely to believe the system is transparent.
Belief in the transparency of the agriculture and food industry of other countries is higher among those under 35 (30%), particularly compared with individuals who are 45 or older (11%). It is also true of those working in the agri-food industry (29%). Individuals who are 45 or older are much less positive about the transparency of other countries (that is, more disagree: 64%, compared with only 37% of those under 35 who disagree).
5.3 Views about quality of food
a) In Canada
Impressions of the quality of food produced in Canada remains high. According to survey results, 89% of Canadians believe the quality to be good to excellent, which is on par with results since 2006. Perception of quality seems to have eroded from “excellent” to “good” between 2006 and 2014 when 24% of Canadians said the quality of Canadian food was excellent. Current results suggest, however, that this assessment is rebounding, with 36% of Canadians saying the quality is excellent. Another 53% assess the quality as “good”. Only 10% indicated the quality of food produced in Canada to be average, down five points from 2014 when the assessment of quality was not as strong (15%), but on par with 2010 and 2006 (10% and 9%, respectively).
Chart 34: Impressions of quality of Canadian foodQ6: “What is your overall impression of the quality of food produced in Canada?”
Individuals under 35 years of age (85%) are marginally less likely to rate the quality of food produced in Canada as excellent or good, particularly when compared with those who are 45 or older (92%).
The same is true of individuals reporting household incomes under $40,000 (84%), particularly when compared with those reporting incomes of $60,000 or higher (91%).
b) Imported foods
As with views about transparency of food production inside and outside of Canada, Canadians have a much more positive view about the quality of food produced in Canada (Chart 34) compared with the quality of food imported from elsewhere (Chart 35 below). When asked about their overall impression of the quality of imported food that is available for consumption in Canada (that is, products from other countries), only 6% rated imported foods to be excellent, compared with 36% indicating the same about food produced in Canada (Chart 34). Another 44% rated the quality of imported foods to be good, compared with 53% rating Canadian food as good (Chart 34). A further 43% rated the quality of imported food to be average, whereas only 10% judged the quality of food produced in Canada to be average (Chart 34).
Chart 35: Impressions of quality of imported foodQ7: “What is your overall impression of the quality of imported food that is available for consumption in Canada?”
Base: All Respondents 2019 (n=2954)
Excellent quality: 6%
Good quality: 44%
Average quality: 43%
Poor quality: 5%
Very poor quality 1%
Men (55%), those who are between 45 and 54 (57%), and individuals with university education (57%) and/or household incomes of $100,000 or higher (56%) are more likely than other Canadians to rate imported food positively.
5.4 Confidence in the Canadian food system
Canadians generally expressed a high level of confidence in the food safety system in Canada across a wide spectrum of areas. The highest proportion (74%) expressed confidence in the system when it comes to animal diseases such as Mad Cow Disease or Avian Influenza, which has increased significantly from 2014 and 2010 when it was 49% and 59%, respectively.
Sixty-six per cent (66%) expressed confidence in the Canadian food system in the area of bacterial contamination, which is also up again from 2014 and 2010 when it was 41% and 51%, respectively. About half (52%) said they are confident in the system when it comes to hormones, antibiotics, and chemicals in plants and animals. This is also higher than 2014 and 2010 when it was 33% and 41%, respectively. Under half (46%) are confident in the system in the area of genetically modified food or GMOs, also up from 28% in 2014. Nearly the same number (45%) said they are confident in the system when it comes to food additives and preservatives, up slightly from 37% in 2014 and on par with findings from 2010.
Chart 36: Confidence in the Canadian Food SystemQ10: “Thinking about food safety, how confident are you in the Canadian food system regarding…?”
Base: All Respondents 2019 (n=2984); 2014 (n=3024); 2010 (n=3144)
Chart 36: Confidence in the Canadian Food System
Not confident (4 to 5) (%)
Neutral (3) (%)
Confident (1 to 2) (%)
2014 Confident (1 to 2) (%)
2010 Confident (1 to 2) (%)
Animal diseases (example: Mad Cow Disease or Avian Influenza)
10
16
74
49
59
Bacterial contamination (example: E.coli and salmonella)
15
19
66
44
51
Hormones, antibiotics and chemicals in plants and animals
25
23
52
33
41
Genetically modified foods or GMOs
27
27
46
28
N/A
Food additives and preservatives
28
27
45
37
45
N/A: Not Available
Confidence in the Canadian food system is generally more likely to be strong among residents of Manitoba and Saskatchewan, as well as in some cases Alberta (animal diseases, hormones, antibiotics and chemical, and GMOs). Confidence in the food system in the area of bacterial contamination is higher in Manitoba and Saskatchewan. Confidence in food safety in the area of animal diseases is also higher among residents of the Atlantic. Residents of British Columbia are more often confident about food safety when it comes to hormones, antibiotics and chemicals. Residents of Quebec are generally least confident across all areas of concern regarding food safety.
Confidence has a positive correlation with age, with the increased concentration of confidence in food safety occurring among those 55 or older, or in some cases 65 or older. Those under 35 are typically less confident except when it comes to confidence in labelling about hormones, antibiotics, and chemicals, and GMOs.
Women are somewhat less likely to be confident than men in each of the areas with the exception of animal diseases where men and women expressed the sample level of confidence.
Those reporting university education and household incomes of $100,000 or higher are more likely to be confident than those with less education and/or income when it comes to food safety from animal diseases, bacterial contamination, and food additives.
Individuals working in the agri-food industry are more confident than other Canadians in terms of food safety from hormones, antibiotics, and chemicals (66%), and GMOs (59%). It is also higher in the area of bacterial contamination where 40% said they are very confident.
5.5 Confidence in accuracy of labelling
Survey respondents were asked to rate their confidence in the accuracy of labelling when it comes to food products with specific attributes, from not at all confident to very confident.
At the top of the list, 59% rate themselves to be confident or very confident in labelling indicating food that is locally produced, which is an increase from 48% in 2014. Slightly fewer indicated confidence in labels of the ingredients list (53%), and nutrition facts (52%). Confidence in the accuracy of the nutrition facts label also increased significantly from 38% in 2014. Similar proportions expressed confidence in the labelling of net weight (51%) and nutritional content (50%).
A lower proportion (36%) said they are confident or very confident about food labelled as vegan or vegetarian, although this represents about half of those looking at labels for vegetarian/vegan items. Confidence has increase from 2014 when it was 24%.
Chart 37a: Confidence in the accuracy of labelling systemQ12: When you seek food products with specific attributes, how confident are you that the food sold in grocery stores is accurately labelled?
Base: All Respondents 2019 (n=2987); 2014 (n=3024)
Chart 37a: Confidence in the accuracy of labelling system
I don't pay attention to this (%)
Not confident (1 to 2) (%)
Somewhat (3) (%)
Confident (4 to 5) (%)
2014 Confident (4 to 5) (%)
Locally produced
3
6
32
59
48
Ingredients list
2
9
36
53
N/A
Nutrition facts
2
9
37
52
38
Net weight
5
10
34
51
N/A
Nutritional content
2
10
38
50
N/A
Vegan/ vegetarian
27
9
28
36
24
N/A: Not Available
Confidence is significantly lower when it comes to labels indicating hormone or antibiotic free (29%), also an increase from 18% in 2014. The same is also true for confidence with regard to accuracy of labelling indicating organic or fair trade (28% in each). Confidence in labelling related to kosher/halal should be interpreted as relatively high, since the 29% expressing confidence is out of the 60% of the public who looks for this.
Confidence is low with regard to labelling for genetically modified or GMO free (23%), and environmentally sustainable (21%, although up five points from 2014), and humane animal welfare practices (21%, up from 14% in 2014). Confidence is lowest of all in the area of health claims (18%, which is fairly similar to the 15% in 2014).
Chart 37b: Confidence in Accuracy of Labelling SystemQ12: “What is your degree of confidence for each of the following food attributes?”
Base: All Respondents 2019 (n=2987); 2014 (n=3024)
Chart 37b: Confidence in Accuracy of Labelling System
I don't pay attention to this (%)
Not confident (1 to 2) (%)
Somewhat (3) (%)
Confident (4 to 5) (%)
2014 Confident (4 to 5) (%)
Hormones or antibiotic free
8
23
40
29
18
Kosher/halal
40
10
21
29
16
Organic
11
24
37
28
20
Fair trade
14
17
40
28
20
Genetically modified or GMO free
14
28
36
23
N/A
Hormone animal welfare practices
14
25
40
21
14
Environmentally sustainable
13
23
42
21
16
Health claims
8
37
38
18
15
N/A: Not Available
Individuals under 35 years of, and in the case of a few areas, those under 45, are generally more confident than those who are 35 or older about most of the food attributes tested. The exceptions are labelling about locally produced items, net weight, ingredients list, and hormone/antibiotic free items, where age does not matter. Canadians who are 55 or older, and in some cases, 65 or older, are less confident than individuals under 55 about the accuracy of labels for all areas tested with the exception of locally produced and fair trade.
Men are more likely than women to be confident in the accuracy of ingredient lists, GMOs', and net weight labels.
Residents of Quebec expressed the most confidence across the country in food being accurately labelled as organic, locally produced or making specific health claims. Those living in British Columbia are more likely than the rest of Canada to be confident in the accuracy of labels for vegan/vegetarian and organic products.
People with a household income over $100,000 and university education are typically more confident than individuals with less income and/or education in the accuracy of labels of:
ingredient lists
nutritional facts
net weight
vegan/vegetarian
nutritional content, and
hormone and antibiotic free.
Individuals without post-secondary education and/or household incomes of less than $60,000 are comparatively more confident than their counterparts about the accuracy of labelling of health claims, relative to those with more education and/or income.
Those working in the agri-food industry are more confident than other Canadians when it comes to the accuracy of labelling about:
GMOs
locally produced
environmentally sustainable practices
human animal treatment practices
hormone and antibiotic free
net weight, or
health claims.
6. Government role in public trust
6.1 Key building blocks in building public trust
Respondents were asked to rate the importance of a series of items in terms of building or maintaining the public's trust in food produced in Canada's agricultural and agri-food industry. For each one, they were asked to indicate whether it is not at all/not very important, moderately important and very important. Survey results indicate that most Canadians believe it is very important to ensure food safety (rated as very important by 84%), and have accurate labelling (82%), as well as informative and truthful food product labelling (80%). Also highlighted as very important were the affordability of food (72%), and compliance with government regulations (71%). A slightly lower proportion (66%) rated transparency about how food is produced and processed as very important.
Chart 38a: Public action in building Canadians' trust in foodQ19: “How important are the following in terms of building or maintaining the public's trust in food produced in Canada's agricultural and agri-food industry…?”
Base: All Respondents 2019 (n=3011)
Chart 38a: Public action in building Canadians' trust in food
Not at all/ not very important (%)
Moderately (%)
Very important (%)
Ensuring food safety
3
14
84
Accurate labeling
3
15
82
Information and truthful food product labeling
3
17
80
Affordability
3
24
72
Compliance with government regulations
6
24
71
Transparency about how food is produced and processed
6
28
66
Slightly fewer rated industry standards or certification as very important (59%). Over half of Canadians believe adherence to animal welfare standards (56%), and sound scientific research used in food production (55%) are also very important in building or maintaining the public's trust, as well as implementing sustainable and environmentally friendly practices in food production (53%). Similarly, 53% rated enhancing nutritional quality or healthfulness of food products as very important; and 51% said this about labour practices, including worker safety, hiring, and labour conditions. Understanding the impacts of technologies used in agriculture and food production on the health and wellness is rated as very important by slightly fewer (46%).
Chart 38b: Public action in building Canadians' trust in foodQ19: “How important are the following in terms of building or maintaining the public's trust in food produced in Canada's agricultural and agri-food industry…?”
Base: All Respondents 2019 (n=3031)
Chart 38b: Public action in building Canadians' trust in food
Not at all/not very important
Moderately
Very important
Industry standards/ certification
7
34
59
Adherence to animal welfare standards
11
32
56
Sound scientific research used in food production
9
35
55
Implementing sustainable and environmentally friendly practices in food production
10
37
53
Enhancing nutritional quality / helpfulness of food products
10
37
53
Labour practices, including worker safety, hiring and labour conditions
11
37
51
Understanding the impacts of technologies used in agriculture and food production on the health and wellness
14
40
46
Women are consistently more likely than men to rate on each of the areas as very important in building or maintaining trust in food produced in Canada. The exception is sound scientific research, which is rated as equally seen as very important among men and women.
Typically individuals who are 55 or older, or in the case of some efforts, 65 or older are considerably more likely to rate most of these efforts as very important. The exceptions are understanding the effects of technologies and enhancing nutritional quality, where there is no age difference in rated importance in building trust. Individuals under 35 are the least likely to place high importance on:
ensuring food safety
accurate labelling
informative labelling
regulatory compliance
transparency, and
labour practices
Regionally, residents of British Columbia are more likely than others across the country to place high importance on:
scientific research
transparency
adherence to animal welfare standards
environmentally sustainable practices, and
labour practices
Residents of Quebec are more likely than the rest of Canada to rate positively the high importance of:
industry standards
adherence to animal welfare standards
environmentally sustainable practices
enhancing nutritional quality, and
understanding the impacts of technologies.
Scientific research is more often seen as very important in building trust among those with university education compared with those with less education.
Agri-food industry workers (65%) are more likely than others to place high importance on scientific research.
6.2 Perceived effective government efforts
When asked about efforts the government should make to build, improve, and maintain consumers' trust in food products there was no consensus. Fifty per cent (50%) believe the government should ensure Canadian food standards meet or exceed those of other countries'. Similarly, 49% think the government should ensure the agriculture and agri-food industry is supported by a strong regulatory system, and 43% believe the government should ensure product labelling includes food production information.
Thirty-one per cent (31%) suggested consulting with Canadians when developing government initiatives, policies and regulations for the industry. Similarly, 30% think the government should support the industry in providing "certified claims" about food products and best practices.
Fewer indicated support for other methods, noted in Table 4.
Table 4: Government efforts to build trust
Efforts to build trust
Total
n=
2936
Ensure Canadian food standards meet/exceed those of other countries'
50%
Ensure the agriculture and agri-food industry is supported by a strong regulatory system
49%
Ensure product labelling includes food production information
43%
Consult with Canadians when developing government initiatives, policies and regulations for the industry
31%
Support the industry in providing "certified claims" about food products and best practices
30%
Provide science based information about agriculture and agri-food
27%
Fund initiatives for farmers, growers, food processors or retailers to demonstrate trustworthiness
27%
Support the development of traceability assurance systems
20%
Other
2%
Q20: What efforts should the government make to build, improve and maintain consumers' trust in food products? Items with 3% or less not shown
Base: All respondents
A significantly larger proportion of residents of Saskatchewan and Manitoba believe the government should ensure Canadian food standards meet/exceed those of other countries' compared with the rest of Canada. It is also more pronounced among those who are 45 to 64, and least so among those under 35.
Individuals who are 55 or older are more likely than those under 55 to believe the government should ensure the agriculture and agri-food industry is supported by a strong regulatory system. This is least likely to be the case among those working in the agri-food industry (30%)
Women, and people who are 65 or older are more likely than their counterparts to rate product labelling that includes food production information as important. This is least likely to be the case among those working in the agri-food industry (32%).
The importance of government consulting with Canadians when developing government initiatives, policies and regulations for the industry is typically higher among men, those under 35, as well as those without post-secondary education, compared with the views of others.
Men are more likely than women to rate science based information about agriculture and agri-food as important in building trust. This is also true of residents of British Columbia compared with the rest of Canada. It is also the case among the university-educated, compared with individuals with less education.
Women are more likely than men to rate government funded initiatives for farmers as important. This is also more often the case among residents of the Atlantic, compared with others across the country. Individuals under 35 also rate government funding for farmers as important more often than those 35 or older do. Similarly, the rated importance is higher among those working in the agri-food industry compared with others (38%).
6.3 Method of sharing information
In terms of effective ways for the Government of Canada to share information with consumers, survey results put the Government of Canada's social media (32%) and websites (28%) at the top of the list. Few other sources are seen as popular choices (see Chart 39), including government e-newsletters selected as effective by only 10%.
Chart 39: Sharing information with Canadian consumers Q21: “What would be the most effective way for government to share information with consumers in Canada?”
Base: All Respondents 2019 (n=2650)
Government of Canada social media: 32%
Government of Canada websites: 28%
Government e-newsletters: 10%
Industry and association publications: 9%
Media/advertising, traditional media sources: 8%
Other levels of government websites: 8%
Government of Canada social media is more likely to be seen as most effective among those under 45, women and residents of Quebec as well as parents, compared with others.
Individuals who are 65 or older are more likely view government e-newsletters as effective compared to all other age cohorts.
7. Conclusions
Information about food
The updated Canada's food guide has significant potential to inform and influence Canadians food-related decisions and consumption.
Awareness of the updated guide is high, with three in four consumers indicating awareness of it, although only one in four of those aware said it is likely to influence their decisions.
Awareness of A Food Policy for Canadians and new Safe Foods for Canadians regulations is fairly low and unlikely to have significant influence on food-related decisions and consumption.
The two most cited sources of information about food are health care professionals, and family and friends, followed by news sources, and the Canada's food guide. Government of Canada websites are not a significant source for information. Canadians are more likely to get information from food-specific television, radio and website content, along with food-related books. These sources have strong implications for government initiatives aimed at public education through strategic partnerships.
Purchase and consumption drivers
As in the past, value for money is the most ubiquitous and powerful driver of food-related decisions. Most Canadians agree that price affects their food purchasing decisions, along with a goal of minimizing waste.
Consumer decisions are also strongly influenced by nutrition. The greatest influencers on changes in food consumption are linked with diet and quality of food, and to a lesser extent health and safety.
The other key factors guiding food decisions relate to whether products are domestic, and local. Many equate this with greater freshness and quality, but decisions are also fuelled by stronger confidence in the Canadian food system, preferred investment in the local economy, and desire to reduce impacts on the environment. There was a significant increase in the proportion of consumers who look for products that are labelled from Canada and that are locally produced.
Many of the more specialized concerns (humane treatment of animals, use of hormones and antibiotics, organic, etc.,) are important to one in three or fewer consumers.
Among those who do look for products that are organic, local, or produced using environmentally sustainable or human animal treatment conditions, between four and six in ten purchase these products reliably. Most of these same consumers are willing to pay more, for such products, believing them to be healthier, safer, and/or better for the environment. An upward trend in consumers' willingness to pay more was observed for such products when compared to 2014 results.
Significant barriers to purchasing these types of products, however, are largely related to cost, as well as lack of availability (local products), and lack of credibility/trust in claims (environmentally sustainable and human animal treatment processes).
Most consumers have strong confidence in the transparency of the Canadian food system, and in the quality of food produced in Canada. They are significantly less confident about the transparency of food systems and in the quality of food outside of the country.
Canadians are also more likely than in the past to boycott foods based on safety (for example, safety recalls), as well as foods produced by a specific company and/or country.
While consumers are also generally confident in the Canadian food system when it comes to animal diseases and bacterial contamination, they are decidedly less confident in areas of environmentally sustainable and humane animal treatment practices, as well as use of GMOs.
Relatively few Canadians have embraced newer trends and technology when it comes to information and consumption of food. For example, only one in four consumers have used bar codes to obtain information, and fewer than one in the order food online or used meal kits with consistency, although numbers are significantly higher among consumers who are under 35 years of age.
Confidence in labeling
The most commonly used information on product labels are best before dates, ingredient lists and Nutrition Tables, relating back to the guiding principles of value for money and nutrition.
Although there is some evidence of improvement, consumer confidence in food labelling is an issue among Canadian consumers. Only half of consumers saying that they feel confident in food labels when it comes to identifying local products, ingredients list, nutritional value and content, and net weight.
Consumers are even less confident about labels of products that are hormone and antibiotic-free, organically produced and use fair trade practices.
As seen in the lower confidence in the food system, consumers are also least confident about product label that claim use of environmentally sustainable and humane animal treatment practices, as well as GMOs, where most rate their confidence as moderate to low.
Recommendations
A critically important area for government action to ensure consumer confidence is in the area of food safety; specifically ensuring that standards meet or exceed those of other countries.
Ensuring accurate, informative and truthful labelling is also seen as very important by most Canadians, but where consumers have decidedly less confidence, making labelling the most significant area for government action.
Other areas seen as very important include ensuring the affordability of food, as well as regulatory compliance and transparency about how food is produced and processed, along with providing strong industry standards and certification, ensuring industry adherence to animal welfare standards, and supporting the creation of sound scientific research in food production.
Appendix A: Survey methodology
The survey sample consists of 3,031 completed cases with Canadians 18 years of age who have at least shared (50% or greater), or full responsibility for grocery shopping for the household. Anyone with less than 50% shared responsibility was excluded from the survey. The sample is based on a random selection of Probit panel members from across the country. Probit panellists were selected using a random-digit dial (RDD) landline-cell phone hybrid sample frame. This is the same sample frame and sampling process used to conduct telephone surveys, which are considered to be representative of the population. Once selected, they are contacted and recruited by telephone and asked to complete a basic profile (that is, base survey instrument) including a range of demographic information about themselves. They are also asked if they would prefer to complete surveys online or by telephone. All sample members are eligible to participate, including those with cell phones only, those with no Internet access and those who simply prefer to respond by telephone rather than online. This panel represents a fully representative sample of Canadians, from which we can draw random samples and collect data in a more cost conscious and timely manner than would otherwise be possible in a traditional telephone survey. This panel of more than 100,000 individuals can be considered representative of the general public in Canada (meaning that the incidence of a given target population within our panel very closely resembles the public at large) and margins of error can be applied.
Sample was randomly drawn from the Probit panel, including 2,021 panel members who were contacted by phone to participate in the survey. Of these, 551 agreed to participate, electing to receive an email invitation to participate, and 186 either completed the survey online or by telephone. In the online portion of the sample, 20,230 valid invitations were sent. The overall response rate for the final sample of 3,031 across online and phone sample 19%Footnote 1. The final survey sample of 3,031 yields a level of precision of ±1.8% for the sample overall and ±3 to 6% for most sub-groups that could be isolated in the analysis (including all regions, age, education, and income segments).
Prior to conducting the survey, the instrument was tested with 20 cases in English and 15 cases in French. Additional questions were placed on the pretest version of the questionnaire asking about length, flow, clarity of wording and so on to elicit feedback from respondents. Minimal changes were made as a result of the testing, although a few questions were removed in order to reduce the survey length.
The survey was administered between February 13 and March 1, 2019, using a bilingual questionnaire, installed on a secure web-server controlled by EKOS. The email invitation included a description and purpose of the survey (in both languages) along with a link to the survey website. The survey database was mounted using a Personalized Identification Number (PIN), so only individuals with a PIN were allowed access to the survey (the PIN was included in the email invitation). The questionnaire was prefaced with a brief introduction to the study and rationale for the research. The voluntary and confidential nature of the survey was also emphasized. Survey data collection adhered to all applicable industry standards. All invited panel members were informed of their rights under current Privacy legislation, as well as how to obtain a copy of their response and results of the survey.
The database was reviewed following data collection for data quality, outliers, coding requirements, weighting and construction of independent variables, and was used to explore sub-group patterns (for example, by age, gender and so on) in the analysis. Weighting of the sample was based on population parameters according to the latest Census on age, gender, education and region of the country.
The following table presents a profile for the sample. This includes the unweighted distribution of demographic characteristics related to region, gender, age and level of education (used in weighting the data), and weighted distribution for presence of children in the home, and ages of children, whether they were born in Canada, current household composition, and annual household income, as well as mother tongue.
Demographic table
Age (unweighted)
--
Total
n=
3031
18-34 years
18%
35-44 years
18%
45-54 years
21%
55-64 years
21%
65 years or older
22%
Prefer not to say
1%
Gender (unweighted)
--
Total
n=
3031
Male
48%
Female
51%
Prefer not to say
1%
Region (unweighted)
--
Total
n=
3031
British Columbia
12%
Alberta
11%
Saskatchewan and Saskatchewan
10%
Ontario
32%
Quebec
23%
Atlantic
10%
Territories
2%
Education (unweighted)
--
Total
n=
3031
Some high school
2%
High School diploma or equivalent
14%
Registered Apprenticeship or other trades certificate or diploma
6%
College, CEGEP or other non-university certificate or diploma
22%
University certificate or diploma below bachelor's level
8%
Bachelor's degree
27%
Post graduate degree above bachelor's level
20%
Prefer not to answer
2%
Language spoken at home
--
Total
n=
3031
English
77%
French
21%
Other
2%
Annual household income
--
Total
n=
3031
Under $20,000
8%
$20,000 to just under $40,000
13%
$40,000 to just under $60,000
16%
$60,000 to just under $80,000
13%
$80,000 to just under $100,000
13%
$100,000 to just under $150,000
15%
$150,000 and above
10%
Prefer not to answer
13%
Employment status
--
Total
n=
3031
Employed - full-time
41%
Employed - part-time
7%
Self-Employed - full-time
6%
Self-Employed - part-time
4%
Retired
26%
Student
4%
Full-time parent, homemaker
4%
Not currently employed
6%
Prefer not to answer
2%
Number of adults (including yourself)
--
Total
n=
3031
1 adult
28%
2 adults
54%
3 adults
10%
4+ adults
6%
Prefer not to answer
2%
Children under 18
--
Total
n=
3031
No children
71%
1 child
11%
2 children
10%
3+ children
5%
Prefer not to answer
4%
Ethnic group
--
Total
n=
3031
European origins
63%
North American origins
24%
Asian origins
4%
Caribbean origins
2%
African origins
1%
Latin, Central and South American origins
1%
Other
5%
Prefer not to answer
6%
Do/did you work in the agri-food industry?
--
Total
n=
3031
Yes
5%
No
94%
Household's grocery shopping done by you
--
Total
n=
3031
All of it
47%
Almost all of it
29%
About half of it
24%
Amount spent on food per month in household
--
Total
n=
3031
Under $300
17%
$300-$499
27%
$500-$699
23%
$700+
21%
Don't know
11%
A comparison of each unweighted sample with 2016 Census figures from Statistics Canada suggests there are similar sources of systematic sample bias in each survey, following patterns typically found in most general public surveys. There is a more educated sample in each survey than found in the population with 47% reporting university education in the survey compared with 25% in the population. As previously described, each sample was weighted by age, gender, region and education (university/non-university).
Appendix B: Survey questionnaire
WINTRO
Thank you for your interest in taking this survey. Agriculture and Agri-food Canada has hired EKOS Research Associates Inc. to conduct a public opinion survey. The government is interested to know your views on a variety of topics related to how you make decisions about the foods you purchase and eat in your household, as well as about confidence in food safety.
Your participation is voluntary and completely confidential. Your answers will remain anonymous. Any information you provide will be administered in accordance with the Privacy Act and other applicable privacy laws.
The survey will take about 20 minutes to complete.
A few reminders before beginning...
On each screen, after selecting your answer, click on the "Continue" button at the bottom of the screen to move forward in the survey.
If you leave the survey before completing it, you can return to the survey URL later, and you will be returned to the page where you left off. Your answers up to that point in the survey will be saved.
If you have any questions about how to complete the survey, please call Probit at 866.211.8881 or send an email to online@probit.ca.
Thank you in advance for your participation.
QS1 - What is your age?
Less than 18
18-34 years
35-44 years
45-54 years
55-64 years
65 years or older
Prefer not to say
QS2 - What is your gender?
Male
Female
Other
Prefer not to say
QS3 - How much of your household's grocery shopping do you, yourself, do?
All of it
Almost all of it
About half of it
Less than half of it
None
Prefer not to say
QS4 - What is your postal code. Please enter your 6 digit postal code with no spaces.
Please specify :
Don't know / Prefer not to say
QPROV - In which province or territory do you live?
Newfoundland and Labrador
Prince Edward Island
Nova Scotia
New Brunswick
Quebec
Ontario
Manitoba
Saskatchewan
Alberta
British Columbia
Yukon
Northwest Territories
Nunavut
Prefer not to say
PQ1 - Listed below are a number of attributes which you may or may not look for when grocery shopping or dining away from home. Please indicate how frequently you seek food items with each attribute using the scale provided.
Q1A - Locally produced
Always
Often
Sometimes
Rarely
Never
Don't know
Q1B - Product of Canada or Made in Canada as part of the label
Always
Often
Sometimes
Rarely
Never
Don't know
Q1C - Country of origin
Always
Often
Sometimes
Rarely
Never
Don't know
Q1D - Best value for money spent
Always
Often
Sometimes
Rarely
Never
Don't know
Q1E - Nutritional value
Always
Often
Sometimes
Rarely
Never
Don't know
Q1F - Convenience
Always
Often
Sometimes
Rarely
Never
Don't know
Q1G - Health claims
Always
Often
Sometimes
Rarely
Never
Don't know
Q1H - Vegetarian or vegan
Always
Often
Sometimes
Rarely
Never
Don't know
Q1I - Environmentally sustainable production
Always
Often
Sometimes
Rarely
Never
Don't know
Q1J - Organic production
Always
Often
Sometimes
Rarely
Never
Don't know
Q1K - Humane animal treatment
Always
Often
Sometimes
Rarely
Never
Don't know
Q1L - Fair trade
Always
Often
Sometimes
Rarely
Never
Don't know
Q1M - Hormone or antibiotic free – meat products only
Always
Often
Sometimes
Rarely
Never
Don't know
Q1N - Non-GMO (genetically modified organism)
Always
Often
Sometimes
Rarely
Never
Don't know
Q2A - When you go grocery shopping, how frequently do you purchase organically produced products?
Always
Often
Sometimes
Rarely
Never
Don't know
Q2B [1,7] - How do you determine whether a particular product is "organic" or not. Please select all that apply
The label says "Canada Organic"
The label includes the Canada Organic logo
The label includes the word organic
The label says that the product is "certified organic" by an independent body
The retailer indicates that the product is organically produced
I buy directly from a farmer/grower who follows organic practices
Other (please specify)
Don't know
Q2C [1,3] - In your opinion, what are the most important benefits of organic foods. Please select up to three
Product is fresher
Product is tastier
Product is safer
Product is healthier
Product has less of an environmental impact
Ethical / moral benefits
Other (please specify)
Don't know
Q2D - Please indicate the extent to which you agree or disagree with the following statement:"When grocery shopping, I am willing to pay more for products that are organically produced".
Strongly agree
Somewhat agree
Neither agree nor disagree
Somewhat disagree
Strongly disagree
Don't know
Q2E [1,9] - What are your main reasons for not purchasing food products labelled as "organic". Please select all that apply
I do not understand the benefits of organic products
I am not confident that these products are really produced organically
Lack of certification of organic production methods
I do not see value in these products
Other (please specify)
Don't know
Q3A - When you go grocery shopping, how frequently do you purchase locally produced products?
Always
Often
Sometimes
Rarely
Never
Don't know
Q3B [1,8] - How do you determine whether a particular product is locally produced or not. Please select all that apply
The label specifies the location of the farm, grower or processing company that the food came from
The label specifies a farm, grower or processing company that I know to be local
The retailer indicates that the product is locally produced
The label includes words like "local"
I buy directly from local farmers/growers
I contact the company responsible to ask them where their product is from
The label identifies the location where the product is produced
Other (please specify)
Don't know
Q3C [1,3] - In your opinion, what are the most important benefits of purchasing locally produced foods. Please select up to three
Support the local economy
Product is fresher
Product is tastier
Product is safer
Product is healthier
Product has less of an environmental impact
Product has a lower price
Ethical / moral benefits
Other (please specify)
Don't know
Q3D - Please indicate the extent to which you agree or disagree with the following statement:"When grocery shopping, I am willing to pay more for products that are produced locally".
Strongly agree
Somewhat agree
Neither agree nor disagree
Somewhat disagree
Strongly disagree
Don't know
Q3E [1,9] - What are your main reasons for not purchasing products labelled as "local". Please select all that apply
I do not understand the benefits of locally-produced products
I am not confident that these products are really produced locally
Lack of certification of local production methods
I do not see value in these products
Other (please specify)
Don't know
Q4A - When you go grocery shopping, how frequently do you purchase foods produced using environmentally sustainable methods?
Always
Often
Sometimes
Rarely
Never
Don't know
Q4B [1,6] - How do you determine whether a particular product is produced using environmentally sustainable methods or not. Please select all that apply
The label makes a claim of environmental benefit
The label indicates that the product is "certified" by an independent body
The retailer indicates that the product is environmentally sustainable
The label specifies a farm, grower or company that I know follows environmentally-sustainable practices
I contact the company responsible to ask them if the product is produced using environmentally sustainable methods
Other sources of information (please specify)
Don't know
Q4C [1,3] - In your opinion, what are the most important benefits of purchasing foods produced using environmentally sustainable methods. Please select up to three
Product is fresher
Product is tastier
Product is safer
Product is healthier
Product has less of an environmental impact
Product has a lower price
Ethical / moral benefits
Other (please specify)
Don't know
Q4D - Please indicate the extent to which you agree or disagree with the following statement: "When grocery shopping, I am willing to pay more for products that are environmentally sustainable".
Strongly agree
Somewhat agree
Neither agree nor disagree
Somewhat disagree
Strongly disagree
Don't know
Q4E [1,9] - What are your main reasons for not purchasing food products labelled as produced using environmentally sustainable methods. Please select all that apply
I do not understand the benefits of environmentally-sustainable production
I am not confident that these products are really produced using environmentally sustainable methods
Lack of certification of sustainable production methods
I do not see value in these products
Other (please specify)
Don't know
Q5A - When you go grocery shopping, how frequently do you purchase products produced under conditions related to the humane treatment of animals?
Always
Often
Sometimes
Rarely
Never
Don't know
Q5B [1,6] - How do you determine whether a particular animal-based food is produced under conditions related to the humane treatment of animals. Please select all that apply
The label makes a claim such as "free range" or "traditionally raised"
The label indicates that the product is "certified" by an independent body
The retailer indicates that the product has been produced under humane animal welfare conditions
The label specifies a farm, grower or processing company that I know follows humane animal welfare practices
Other (please specify)
Don't know
Q5C - Please indicate the extent to which you agree or disagree with the following statement: "When grocery shopping, I am willing to pay more for animal-based foods produced under conditions related to the humane treatment of animals?
Strongly agree
Somewhat agree
Neither agree nor disagree
Somewhat disagree
Strongly disagree
Don't know
Q5D [1,9] - What are your main reasons for not purchasing products produced under conditions related to the humane treatment of animals. Please select all that apply
I do not understand the benefits of food produced under humane animal welfare conditions
I am not confident that these products are really produced under humane animal welfare conditions
Lack of certification of humane production methods
I do not see value in these products
Foods produced in Canada are produced under humane animal conditions
Other (please specify)
Don't know
Q6 - The next few questions relate to the safety and quality of Canadian food. What is your overall impression of the quality of food produced in Canada?
Excellent quality
Good quality
Average quality
Poor quality
Very poor quality
Don't know
Q7 - What is your overall impression of the quality of imported food that is available for consumption in Canada?
Excellent quality
Good quality
Average quality
Poor quality
Very poor quality
Don't know
Q8 [1,5] - What sources of information do you rely on most to make decisions about food and nutrition. Please select up to five
News media
Canada's food guide
Doctors, nutritionists or other health professionals
Social media and blogs
Food-specific websites
Government websites
Word of mouth
Family & friends
Food advertisements
Books
Food/nutrition labels
Other (please specify)
None of the above
Don't know
Q9 [1,5] - Over the past year, what kinds of information most influenced your purchase decisions in the grocery store. Please select up to five
Cost of food
Food safety incidents/recalls
Nutritional value
Health Issues
Food additives / residues
Food production technologies
Product labels
Information provided by retailers
Information provided by producers
Specific dietary regimes (weight loss, allergens, etc.)
Information I have received by contacting the company directly
Advertising and marketing
Canada's food guide
Food produced in Canada
Other (please specify)
None of the above
Don't know
PQ10 - Thinking about food safety, how confident are you in the Canadian food system regarding..
Q10C - Bacterial contamination (example: E. coli and salmonella)
Very confident
Somewhat confident
Neutral
Not very confident
Not at all confident
Don't know
Q10D - Genetically modified food or GMOs
Very confident
Somewhat confident
Neutral
Not very confident
Not at all confident
Don't know
Q10E - Hormones, antibiotics and chemicals in plants and animals
Very confident
Somewhat confident
Neutral
Not very confident
Not at all confident
Don't know
Q11A - Have you seen, heard or read anything about the new Safe Food for Canadians Regulations, which came into effect on January 15, 2019?
Yes
No
Don't know
Q11B - The Safe Food for Canadians Regulations aim to make the Canadian food system safer by focusing on prevention and allowing for faster removal of unsafe food from the marketplace. What is your overall impression of the Safe Food for Canadians Regulations?
Very positive
Somewhat positive
Neither positive or negative
Somewhat negative
Very negative
Don't know
Q11C - Have you seen, heard or read anything about a Food Policy for Canada?
Yes
No
Don't know
PQ12 - The next few questions relate to the Canadian food system including government, industry and independent organizations. When you seek food products with specific attributes, how confident are you that the food sold in grocery stores is accurately labeled?. Please indicate your degree of confidence for each of the following food attributes.
Q12A - Locally produced
Completely confident
Very confident
Somewhat confident
Not very confident
Not at all confident
I do not pay attention to this attribute when I buy food
Don't know
Q12B - Environmentally sustainable
Completely confident
Very confident
Somewhat confident
Not very confident
Not at all confident
I do not pay attention to this attribute when I buy food
Don't know
Q12C - Nutritional content
Completely confident
Very confident
Somewhat confident
Not very confident
Not at all confident
I do not pay attention to this attribute when I buy food
Don't know
Q12D - Health claims
Completely confident
Very confident
Somewhat confident
Not very confident
Not at all confident
I do not pay attention to this attribute when I buy food
Don't know
Q12E - Humane animal welfare practices
Completely confident
Very confident
Somewhat confident
Not very confident
Not at all confident
I do not pay attention to this attribute when I buy food
Don't know
Q12F - Fair trade
Completely confident
Very confident
Somewhat confident
Not very confident
Not at all confident
I do not pay attention to this attribute when I buy food
Don't know
Q12G - Kosher/halal
Completely confident
Very confident
Somewhat confident
Not very confident
Not at all confident
I do not pay attention to this attribute when I buy food
Don't know
Q12H - Organic
Completely confident
Very confident
Somewhat confident
Not very confident
Not at all confident
I do not pay attention to this attribute when I buy food
Don't know
Q12I - Vegan/vegetarian
Completely confident
Very confident
Somewhat confident
Not very confident
Not at all confident
I do not pay attention to this attribute when I buy food
Don't know
Q12J - Hormone or antibiotic free
Completely confident
Very confident
Somewhat confident
Not very confident
Not at all confident
I do not pay attention to this attribute when I buy food
Don't know
Q12K - Genetically modified or GMO free
Completely confident
Very confident
Somewhat confident
Not very confident
Not at all confident
I do not pay attention to this attribute when I buy food
Don't know
Q12L - Net weight
Completely confident
Very confident
Somewhat confident
Not very confident
Not at all confident
I do not pay attention to this attribute when I buy food
Don't know
Q12M - Ingredients list
Completely confident
Very confident
Somewhat confident
Not very confident
Not at all confident
I do not pay attention to this attribute when I buy food
Don't know
Q12N - Nutrition Facts
Completely confident
Very confident
Somewhat confident
Not very confident
Not at all confident
I do not pay attention to this attribute when I buy food
Don't know
Q13A - Have you ever used a mobile phone or handheld device to scan a barcode (including 'QR' or '2D' barcodes) for a food or other retail product. Please do not include self-checkout stations
Yes
No
Didn't know you could do that
Don't know
PQ13B - Have you ever used a handheld device (for example, mobile phone) or a specific application (for example, health tracking app) to scan a barcode for each of the following?
Q13BA - On package or shelf labels in a food store
Always
Often
Sometimes
Rarely
Never
Don't know
Q13BB - On package or shelf labels in another type of store
Always
Often
Sometimes
Rarely
Never
Don't know
Q13BC - On posters or display advertising
Always
Often
Sometimes
Rarely
Never
Don't know
Q13BD - On printed advertisements or articles in newspapers or magazines
Always
Often
Sometimes
Rarely
Never
Don't know
Q13C [1,8] - What information do you want to be available through scanning of barcode (including 'QR' or '2D' barcodes). Please select all that apply
Price
Weight/volume/quantity
Country of origin
Ingredients
Nutrition Facts
Health claims
Production methods
Other (please specify)
None of these – not interested in scanning bar codes
Don't know
PQ14 - Please indicate whether you agree or disagree with the following statements.
Q14A - I spend time worrying about the safety of the food I eat
Strongly agree
Somewhat agree
Neutral
Somewhat disagree
Strongly disagree
Don't know
Q14B - I am careful about the way I buy and prepare food to minimize food waste
Strongly agree
Somewhat agree
Neutral
Somewhat disagree
Strongly disagree
Don't know
Q14C - I would be willing to pay more for products that are certified
Strongly agree
Somewhat agree
Neutral
Somewhat disagree
Strongly disagree
Don't know
Q14D - I believe the Canadian agriculture and food industry is transparent about how food is produced
Strongly agree
Somewhat agree
Neutral
Somewhat disagree
Strongly disagree
Don't know
Q14E - I believe the agriculture and food industry of other countries are transparent about how food is produced
Strongly agree
Somewhat agree
Neutral
Somewhat disagree
Strongly disagree
Don't know
Q14F - The price of food affects my food purchasing decisions
Strongly agree
Somewhat agree
Neutral
Somewhat disagree
Strongly disagree
Don't know
Q14G - I consider the environmental impact such as reducing the use of plastic or packaging in my food purchasing decisions
Strongly agree
Somewhat agree
Neutral
Somewhat disagree
Strongly disagree
Don't know
PQ15 - Have you ever avoided or boycotted a particular food product because..
Q15A - You were concerned about the safety of the food
Yes
No
Don't know
Q15B - You were concerned about how the animals have been treated
Yes
No
Don't know
Q15C - You were concerned that environmentally sustainable practices have not been followed
Yes
No
Don't know
Q15D - You do not wish to buy food produced by a particular company
Yes
No
Don't know
Q15E - You do not wish to buy food produced by a particular country
Yes
No
Don't know
Q15GG [0,1] - Other (please specify)
Yes
No
Don't know
PQ16 - When making food purchase decisions, how often do you..
Q16A - Read 'best before' or expiry dates
Always
Often
Sometimes
Rarely
Never
Not applicable
Don't know
Q16B - Seek retailer advice
Always
Often
Sometimes
Rarely
Never
Not applicable
Don't know
Q16C - Seek advice from a professional like a nutritionist or doctor
Always
Often
Sometimes
Rarely
Never
Not applicable
Don't know
Q16D - Use the Internet such as a search engine or social media as a source of food safety information
Always
Often
Sometimes
Rarely
Never
Not applicable
Don't know
Q16E - Use a government of Canada website as a source of food safety information
Always
Often
Sometimes
Rarely
Never
Not applicable
Don't know
Q16F - Assess food handling practices where you buy your food
Always
Often
Sometimes
Rarely
Never
Not applicable
Don't know
Q16G - Read the Nutrition Facts Table
Always
Often
Sometimes
Rarely
Never
Not applicable
Don't know
Q16H - Read the ingredients list
Always
Often
Sometimes
Rarely
Never
Not applicable
Don't know
Q16I - Avoid products with plastic packaging
Always
Often
Sometimes
Rarely
Never
Not applicable
Don't know
Q16J - Use fresh food or meal delivery services such as fresh food boxes and fresh food meal kits
Always
Often
Sometimes
Rarely
Never
Not applicable
Don't know
Q16K - Buy groceries online
Always
Often
Sometimes
Rarely
Never
Not applicable
Don't know
Q17A - Have you seen, heard or read anything about the new Canada's Food Guide that was recently launched in January?
Yes
No
Don't know
Q17B - Will the new Canada's Food Guide influence your purchasing decisions?
Yes
No
Don't know
Q18 [1,6] - Have you changed, or do you plan to change your food purchasing habits because of the following. Please select all that apply
Food safety
Food quality
Health issues
Canada's food guide
Your diet
Other (please specify)
No change
Don't know
PQ19 - In your view, how important are the following in terms of building or maintaining the public's trust in food produced in Canada's agricultural and agri-food industry?
Q19A - Ensuring food safety
Very important
Moderately important
Not very important
Not important at all
Don't know
Q19B - Affordability of food
Very important
Moderately important
Not very important
Not important at all
Don't know
Q19C - Transparency about how food is produced and processed
Very important
Moderately important
Not very important
Not important at all
Don't know
Q19D - Implementing sustainable and environmentally friendly practices in food production
Very important
Moderately important
Not very important
Not important at all
Don't know
Q19E - Informative and truthful food product labeling (for example, food fraud)
Very important
Moderately important
Not very important
Not important at all
Don't know
Q19F - Accurate labeling
Very important
Moderately important
Not very important
Not important at all
Don't know
Q19G - Labour practices, including worker safety, hiring and labour conditions
Very important
Moderately important
Not very important
Not important at all
Don't know
Q19H - Adherence to animal welfare standards
Very important
Moderately important
Not very important
Not important at all
Don't know
Q19I - Enhancing nutritional quality/healthfulness of food products
Very important
Moderately important
Not very important
Not important at all
Don't know
Q19J - Sound scientific research used in food production
Very important
Moderately important
Not very important
Not important at all
Don't know
Q19K - Compliance with government regulations
Very important
Moderately important
Not very important
Not important at all
Don't know
Q19L - Understanding the impacts of technologies used in agriculture and food production on the health and wellness
Very important
Moderately important
Not very important
Not important at all
Don't know
Q19M - Industry standards/certification
Very important
Moderately important
Not very important
Not important at all
Don't know
Q20 [1,3] - What efforts should the government make to build, improve and maintain consumers' trust in food products. Please select the 3 most important activities.
Consult with Canadians when developing government initiatives, policies and regulations for the industry
Support the industry in providing "certified claims" about food products and best practices
Ensure product labeling includes food production information
Ensure the agriculture and agri-food industry is supported by a strong regulatory system
Fund initiatives for farmers, growers, food processors or retailers to demonstrate trustworthiness
Ensure Canadian food standards meet/exceed those of other countries'.
Provide science based information about agriculture and agri-food
Support the development of traceability assurance systems
Other (please specify)
Don't know
Q21 - What would be the most effective way for government to share information with consumers in Canada?
Government of Canada websites
Other levels of government websites (for example, provincial or municipal)
Government e-newsletters
Government of Canada social media (for example, Twitter, Facebook, YouTube)
Industry and association publications
Other (please specify)
Don't know
D1 - On average, about how much do you spend on food per month in your household?
Amount
Don't know
PD2 - How many people are living or staying at your current address? (Include yourself and any other adults or children who are currently living or staying at this address for at least two months)
D2A - Adults (including yourself)
Total
Prefer not to answer
D2B - Children under 18
Total
Prefer not to answer
D3 - What language do you speak most often at home?
English
French
Other
Prefer not to answer
D4 - What is the highest degree or level of school you have completed If currently enrolled, select the previous grade or highest degree received.
Grade 8 or less
Some high school
High School diploma or equivalent
Registered Apprenticeship or other trades certificate or diploma
College, CEGEP or other non-university certificate or diploma
University certificate or diploma below bachelor's level
Bachelor's degree
Post graduate degree above bachelor's level
Prefer not to answer
D5 - Please indicate your annual household income before taxes.
Under $20,000
$20,000 to just under $40,000
$40,000 to just under $60,000
$60,000 to just under $80,000
$80,000 to just under $100,000
$100,000 to just under $150,000
$150,000 and above
Prefer not to answer
D6 - Which of the following best describes your employment status?
Employed full-time
Employed part-time
Self-Employed full-time
Self-Employed part-time
Retired
Student full-time
Student part-time
Full-time parent, homemaker
Not currently employed
Prefer not to answer
D7 - <Do/did> you work in the agri-food industry?
Yes
No
Prefer not to answer
D8 - Do you self-identify as an Indigenous person, that is First Nations, Métis or Inuit?
Yes
No
Prefer not to answer
D9 [1,9] - Which of the following best describes your ethnicity. Please select all that apply
North American Aboriginal origins
Other North American origins
European origins
Caribbean origins
Latin, Central and South American origins
African origins
Asian origins
Oceania origins
Other
Prefer not to answer
THNK
Thank you very much for taking the time to complete this survey.