Public Opinion Research with Food Businesses to Support Compliance with Food Safety Regulations: 2018-2019
Canadian Food Inspection Agency
March 2019
Prepared for:
Canadian Food Inspection Agency
Supplier Name: Quorus Consulting Group Inc.
Contract Award Date: August 7, 2018
Delivery Date: March 2019
Contract Amount (incl. HST): $112,926.55
Contract #: 39903-190299/001/CY
POR Number: 029-18
For more information, please contact:
cfia.enquiries-demandederenseignements.acia@canada.ca
Ce rapport est aussi disponible en français.
Copyright Page
Public opinion research with food businesses 2018-2019
Final Report
Prepared for the Canadian Food Inspection Agency
Supplier name: Quorus Consulting Group Inc.
March 2019
This public opinion research report presents the results of two waves of telephone surveys conducted by Quorus Consulting Group Inc. on behalf of the Canadian Food Inspection Agency. A first wave of surveys was conducted with 670 businesses in Canada in October and November 2018 and a follow-up wave was conducted with 700 businesses in Canada in February and March 2019. The questionnaire for the follow-up wave was largely similar to the one used for the initial wave.
Cette publication est aussi disponible en français sous le titre : Recherche sur l’opinion publique auprès du secteur alimentaire 2018-2019.
This publication may be reproduced for non-commercial purposes only. Prior written permission must be obtained from the Canadian Food Inspection Agency. For more information on this report, please contact the Canadian Food Inspection Agency at: cfia.enquiries-demandederenseignements.acia@canada.ca or at:
Canadian Food Inspection Agency
1400 Merivale Road
Ottawa, Ontario
K1A 0Y9
Catalogue Number:
A104-150/2019E-PDF
International Standard Book Number (ISBN):
ISBN 978-0-660-28227-5
Related publications (registration number: POR 029-18):
Catalogue Number A104-150/2019F-PDF (Final Report, French)
ISBN 978-0-660-28228-2
© Her Majesty the Queen in Right of Canada, as represented by the Minister of Health, 2019

Political Neutrality Certification
I hereby certify as Senior Officer of Quorus Consulting Group Inc. that the deliverables fully comply with the Government of Canada political neutrality requirements outlined in the Policy on Communications and Federal Identity and the Directive on the Management of Communications - Appendix C.
Specifically, the deliverables do not include information on electoral voting intentions, political party preferences, standings with the electorate or ratings of the performance of a political party or its leaders.
Signed:

Rick Nadeau, President
Quorus Consulting Group Inc.
Table of Contents
Executive Summary
Research Purpose and Objectives
As part of the modern regulatory tool kit, the Canadian Food Inspection Agency (CFIA) combined 14 food safety regulations into the New Safe Food for Canadians Regulations (SFCR). The regulations were published in June of 2018 and came into force January 15, 2019.
CFIA requested public opinion research primarily to obtain insights on the food industry’s views towards their food safety and food safety regulations in Canada, with a focus on small food businesses, food importers and exporters. This was done through a survey with businesses before the SFCR came into force (Wave 1), and a survey with businesses after the SFCR came into force (Wave 2). Specifically, CFIA wanted to gain a better understanding of awareness, motivations, perceptions and attitudes towards the following:
- The level of awareness of existing CFIA information products, including advertising,
- Understanding and confidence in the various roles and responsibilities within the food safety system,
- Resource needs and barriers to complying with regulatory requirements, to identify areas where compliance can be assisted with implementation of compliance promotion, communications, and support services,
- Awareness and satisfaction with My CFIA,
- Satisfaction with current services, and
- Expectations on future services and programs.
Summary of Findings
The research results presented in this report are often based on one of two different segments:
- Select questions were asked exclusively to “Retail-only businesses” in the food industry – these are businesses that self-identified as only selling product to consumers and not importing, preparing food for export or to move across provincial boundaries. These businesses do need to meet traceability requirements under SFCR.
- Other study results focus exclusively on food industry businesses that conduct at least more than one activity that has requirements under SFCR other than just retail – these are referred to as “businesses not exclusively in retail” in this report.
Awareness of CFIA and the Safe Food for Canadians Regulations
Over three quarters of businesses are at least somewhat familiar with CFIA. More specifically, 51% would rate their level of familiarity either a 6 or a 7 on a 7-point scale (where 1 meant not at all familiar and 7 meant very familiar). Another 32% would consider themselves somewhat familiar (a rating of 4 or 5) and 16% feel they are not very familiar (a rating of 1 to 3). Familiarity seems slightly lower from Wave 1 to Wave 2 (87% vs. 83% giving a rating from 4 to 7), however the difference is not statistically significant.
Respondents were asked if they had heard, seen or read any advertisements related to CFIA in the three to four weeks prior to participating in the survey. Of all businesses, 50% of respondents recall being exposed to CFIA advertisements. This includes 5% of respondents who remembered SFCR spontaneously (unaided awareness), 39% who remembered SFCR when asked specifically about it, and 6% who remember other CFIA ads but not specific to SFCR.
Among those having heard, seen or read something about SFCR who are in a business not exclusively in retail (59% of respondents), the most common sources were email (27%), colleagues and industry events (25%), the CFIA website (21%), followed by an online general source (18%). In Wave 1, among those having heard, seen or read something about SFCR who are in a business not exclusively in retail (50% of respondents), the most common sources were colleagues and industry events (30%), a CFIA employee or inspector (21%), the CFIA website (20%), followed by an online general source (18%).
Confidence in Meeting Food Safety Regulations
The majority (91%) of businesses felt very confident that they would meet food safety regulations and requirements if they were to be inspected. Among the remaining respondents, 8% felt somewhat confident and only 1% were not very confident. This is a statistically significant increase from 86% of businesses feeling very confident in meeting food safety regulations and requirements in Wave 1.
Commonly Conducted Food Safety Activities
A list of various food safety-related measures and activities was presented to survey respondents in both waves and they were asked to note the ones that apply to their company. The most popular food safety activities include documenting standard operating procedures on food safety, establishing a traceability program and internal training programs on food safety. Each of these was noted by over three-quarters of businesses in both waves. Additionally, 60% of businesses have preventive controls in place, which are outlined in a written plan.
Over two thirds of businesses not exclusively in retail (68%) have a high understanding of the food safety regulations that apply to their foods. This is a lower rating compared to that observed in Wave 1 (78%).
Survey respondents were provided with three potential challenges that food businesses might encounter and then asked to select the one that, from their perspective, would be the biggest challenge. Just over two in five food businesses (45%) selected traceability of food products as the biggest food safety challenge. This was followed by written preventive controls (30%), and 16% selected licencing.
Contact with CFIA
Over 7 in 10 (73%) businesses that are not exclusively in retail have had some sort of contact with CFIA over the past 12 months. The most common interaction with CFIA over the past 12 months was looking for information about food safety regulations or requirements on the CFIA’s website (57%) while 42% claim to have been inspected, 34% contacted CFIA directly for information or technical advice on food safety regulations or regulatory interpretation, or requested a permission, licence, registration, or certificate from CFIA, and 33% contacted CFIA for information on (rather than requesting) a permission licence or certificate.
Businesses having contacted CFIA over the past 12 months most often did so through CFIA website (63%), followed by contacting CFIA by phone (48%), or by email (48%). A smaller proportion contacted CFIA in person (21%) and only a few did so via social media (1%). These results suggest that businesses in general are using multiple channels to contact CFIA.
Businesses were asked to rate the extent of helpfulness of the website when contacting CFIA for information. Half find the website very helpful.
Website users were asked to suggest what could be done to CFIA’s inspection.gc.ca site to improve it. The main items identified for improvement are to make it easier to navigate and more user-friendly (21%), and to provide clearer information (17%).
Respondents were also asked to rate the helpfulness of email, phone and in-person service received when contacting CFIA for information. Nearly three quarters (75%) of those who contacted CFIA by phone found the support very useful and an additional 20% found it somewhat useful. Nearly two thirds (64%) of those who used email to contact CFIA found it very useful, and 28% somewhat useful. Of those who contacted CFIA in person, 54% found the information very useful and 15% found it somewhat useful. However, 30% did not know how to rate the service received.
Businesses were asked to indicate their preferred method to request and receive regulatory information from CFIA. The preferred method to receive this information is by email, as indicated by 78% of respondents, followed by 47% of respondents indicating to prefer this information by phone. A little over one third of respondents (35%) prefer a live customer service-based chat on the CFIA website, while just over a quarter (27%) prefer using a chatbot (27%). Less than a fifth prefer social media (15%), mail (7%), or in-person service (4%).
When asked the preferred method to receive CFIA services, 74% of businesses prefer to receive them by email, 52% on the CFIA website, 25% prefer to go to a CFIA office and receive them in person, and less than one fifth prefer to receive them by fax (17%), mail (10%), on social media (8%), or by phone (6%).
General Impressions of CFIA
Roughly half of businesses strongly agree that CFIA is fair when inspecting food businesses (54%), that it is easy to understand the information CFIA provides food businesses (52%), and that it provides enough information to meet regulatory obligations (48%). Agreement drops slightly to 40% when asked if CFIA is efficient in its operations. Between 8% and 15% of businesses did not know enough about CFIA to be able to rate them across these five dimensions and about one in ten seem to disagree with each evaluation criteria.
My CFIA
The survey also examined awareness and likelihood to use the new digital service developed for convenient service delivery My CFIA.
Nearly half of respondents (44%) are aware of the My CFIA portal, from which 32% have used it. Both awareness and usage are significantly higher in Wave 2 than in Wave 1. Awareness increased from 26% to 44%, and usage more than doubled from 14% to 32%.
Among the 32% of businesses that have used My CFIA, 68% did so to request a new licence, 44% to register their business, 32% to renew their licence, 28% to obtain a permit, 15% to obtain an export certificate, and 10% only to enroll without using any other portal features.
Overall, satisfaction with the portal is positive, nearly half of users (46%) are very satisfied and 38% are somewhat satisfied. Satisfaction in Wave 1 was much lower, likely due to the higher number of respondents who had only enrolled and had not had the opportunity to experience the services that are now available.
According to participants who provided a lower satisfaction score for My CFIA, the most common reason was that the design was not user-friendly.
The study explored the likely use of My CFIA in the future. a little over, half (53%) of all businesses, not only in retail, are very likely to use My CFIA in the future and another 26% are somewhat likely.
Compliance Burden
Results reveal that over a quarter (28%) of businesses find the paperwork associated with food regulations very burdensome while one quarter (25%) find it not very burdensome.
Nearly one in three (29%) strongly agree that CFIA takes the needs of businesses into account when developing new information products, and a similar proportion (26%) strongly agrees that over the past 12 months they have spent less time searching for food safety information.
Overall Satisfaction with CFIA
Over two in five respondents (45%) felt very satisfied with the overall service received from CFIA in the past 12 months. Another 33% were somewhat satisfied and roughly one in 10 were not very satisfied. An important proportion (13%) did not provide a rating, probably because they had not interacted with CFIA over the past 12 months or they never interact with CFIA.
Finding Food Safety Information
Roughly one in three respondents (34%) indicated they do not have any challenges when it comes to finding information on food safety regulations or requirements. The main challenges for businesses when it comes to finding food safety information are the lack of clear information (15%), too much information (11%), and the CFIA website not being easy to navigate (11%). Other common challenges included time-consuming researching information, lack of notifications or updates, among others.
When asked specifically to identify the topics about which information was difficult to find, nearly half (48%) of all respondents felt there was no topic in particular that proved challenging. Some topics identified included new regulations or changes to rules (16%), labelling (9%), and food products (6%).
Methodology
All research work was conducted in accordance with the professional standards established by the Government of Canada Public Opinion Research Standards, as follows:
- The survey consisted of two national telephone surveys with businesses in the food industry in Canada based on a selected list of North American Industry Classification System (NAICS) codes provided by CFIA. The sample frames were selected from a list of businesses from InfoCanada, a common and reputable list provider in the industry.
- Quorus designed the survey instruments in English in conjunction with CFIA Project Authority. Quorus translated the client-approved English versions of the survey. Respondents had the choice to complete the interview in English or French.
- The survey was conducted following the Standards for the Conduct of Government of Canada Public Opinion Research – Telephone Surveys. Quorus informed respondents of their rights under the Privacy and Access to Information Acts and ensured that those rights were protected throughout the research process.
- The approved final questionnaires were programmed for computer-based telephone data collection. For Wave 2, a total of 700 businesses participated in the survey, from which 200 were “Retail Only”. As for Wave 1, 670 businesses participated in the survey, from which 300 were “Retail Only”. Most of the results in this report are based on businesses that are not exclusively retailers (Wave 2, n=500; Wave 1, n=370) as the key target audience are food businesses that import or prepare food for export or to be sent across provincial or territorial boundaries.
- Data collection for Wave 2 occurred between February 4, 2019, and March 1, 2019. Wave 1 data collection occurred between October 24 and November 9, 2018.
- The margin of error of this sample size is +/- 3.8%, 19 times out of 20. The data was weighted according to the population counts per industry vertical and province as per InfoCanada information.
- This study saw a response rate of 14% across the entire sample in Wave 1 and of 17% in Wave 2.
Detailed Results
Research Purpose and Objectives
As part of the modern regulatory tool kit, the Canadian Food Inspection Agency (CFIA) combined 14 food safety regulations into the New Safe Food for Canadians Regulations (SFCR). The regulations were published in June of 2018 and came into force January 15, 2019.
Results from the 2017-2018 public opinion research show that, as a whole, food businesses are aware of CFIA and are confident in their ability to meet their regulatory requirements. Participants tended to be more satisfied with CFIA if they had recent contact with them, and they are seen as a fairly reasonable and helpful regulator. The My CFIA service had a low awareness, but participants showed interest in it as a time-saving way to interact with CFIA, as most concerns stemmed from difficulty finding relevant information. Knowledge of the name SFCR was limited, or at least the title was not well known. Participants showed more knowledge about specific requirements than the Act itself, perhaps because many food businesses already participated in programs (such as Global Food Safety Initiative) that have some requirements similar to the SFCR. However, there still remains demand for faster answers and clear information regarding food safety and regulation requirements.
The new CFIA regulations affect many companies who previously were not regulated by CFIA. These companies will need to be made aware of the tools and services the Agency offers to help them comply with regulatory obligations.
CFIA requested public opinion research primarily to obtain insights on the food industry’s views towards their food safety and food safety regulations in Canada, with a focus on small food businesses, food importers and exporters. This was done through a survey with businesses before the SFCR came into force (Wave 1), and a survey with businesses after the SFCR came into force (Wave 2). Specifically, CFIA wanted to gain a better understanding of awareness, motivations, perceptions and attitudes towards the following:
- The level of awareness of existing CFIA information products, including advertising,
- Understanding and confidence in the various roles and responsibilities within the food safety system,
- Resource needs and barriers to complying with regulatory requirements, to identify areas where compliance can be assisted with implementation of compliance promotion, communications, and support services,
- Awareness and satisfaction with My CFIA,
- Satisfaction with current services, and
- Expectations on future services and programs.
Summary of Findings
The research results presented in this report are often based on one of two different segments:
- Select questions were asked exclusively to “Retail-only businesses” in the food industry – these are businesses that self-identified as only selling product to consumers and not importing, preparing food for export or to move across provincial boundaries. These businesses do need to meet traceability requirements under SFCR.
- Other study results focus exclusively on food industry businesses that conduct at least more than one activity that has requirements under SFCR other than just retail – these are referred to as “businesses not exclusively in retail” in this report.
Due to the diversity of respondents and the requirement to understand multiple views, not all questions applied to every respondent. Information on the respondents for any specific question can be found in the footer of graphs and data tables presented in this report.
Some displayed results may not add to 100%. This is either due to rounding, because the results are based on questions that allowed multiple mentions or, in very rare instances, because certain response categories were not shown to improve the legibility of certain graphs or data tables.
When data tables are presented, the green squares indicate that the result is statistically significantly different from results in other columns.
Awareness of CFIA and the Safe Food for Canadians Regulations
Over three quarters of businesses are at least somewhat familiar with CFIA. More specifically, 51% would rate their level of familiarity either a 6 or a 7 on a 7-point scale (where 1 meant not at all familiar and 7 meant very familiar). Another 32% would consider themselves somewhat familiar (a rating of 4 or 5) and 16% feel they are not very familiar (a rating of 1 to 3). Familiarity seems slightly lower in Wave 2 compared to Wave 1 (83% vs. 87% giving a rating from 4 to 7), although it should be noted that the difference is not statistically significant.
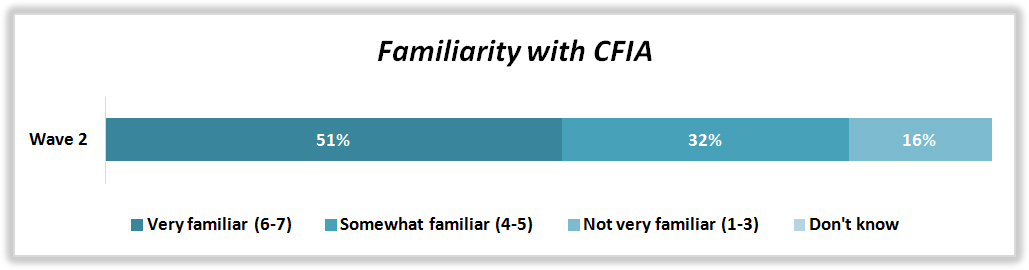
B1: On a scale of 1 to 7, where 1 means not at all familiar and 7 means very familiar, how familiar would you say that you are with the Canadian Food Inspection Agency, also known as the CFIA? Base: Businesses not exclusively in retail, n=500.
The chart representing the level of familiarity of the businesses with CFIA in wave 2 infers the following data: Very familiar (6 to 7)- 51 percent, Somewhat familiar (4 to 5)- 32 percent, Not very familiar (1 to 3)- 16 percent, and Don’t know- 16 percent.

B1: On a scale of 1 to 7, where 1 means not at all familiar and 7 means very familiar, how familiar would you say that you are with the Canadian Food Inspection Agency, also known as the CFIA? Base: Businesses not exclusively in retail, n=370.
The chart representing the level of familiarity of the businesses with CFIA in wave 1 infers the following data: Very familiar (6 to 7)- 58 percent, Somewhat familiar (4 to 5)- 29 percent, Not very familiar (1 to 3)- 12 percent, and Don’t know- 1 percent. Note: Very familiar, somewhat familiar, not very familiar, and don’t know are represented in colors of denim, aegean, blue, and stone, respectively.
By looking at the results from the most recent wave of surveys, businesses in the processor and manufacturer segment and those in the wholesaler and distributor segment were the most familiar with CFIA (65% and 63% respectively), followed by those in agriculture (52%) and then those in retail, among whom one-quarter (32%) positioned their level of familiarity at the lower end of the scale (from a 1 to a 3). Results also reveal that familiarity with CFIA increases with the size of the company, ranging from 36% in the micro segment rating their familiarity either a 6 or a 7, up to 73% among large businesses.
These results are similar from Wave 1 to Wave 2.
|
|
|
Industry Sector |
Company Size |
||||||
|
|
Total (n=500) |
Agriculture (n=99) |
Processor/Manufacturer (n=198) |
Wholesaler/Distributor (n=137) |
Retailer (n=66) |
Micro (n=98) |
Small (n=105) |
Medium (n=224) |
Large (n=70) |
|
Very familiar (6-7) |
51% |
52%1 |
65%1 |
63%1 |
32% |
36% |
44% |
55%1 |
73%1 |
|
Somewhat familiar (4-5) |
32% |
31% |
23% |
23% |
46%1 |
43%1 |
33% |
30% |
23% |
|
Not very familiar (1-3) |
16% |
16% |
12% |
13% |
22% |
21%1 |
21%1 |
15%1 |
4% |
|
Don’t know |
<1% |
- |
- |
2% |
- |
- |
2% |
- |
- |
1 When data tables are presented, the asterisks indicate that the result is statistically significantly different from results in other columns.
|
|
Industry Sector |
Company Size |
||||||
|
Total (n=370) |
Agriculture (n=49) |
Processor/Manufacturer (n=170) |
Wholesaler/Distributor (n=87) |
Retailer (n=64) |
Micro (n=63) |
Small (n=90) |
Medium (n=179) |
Large (n=37) |
Very familiar (6-7) |
58% |
53% |
69%2 |
64% |
40% |
38% |
56%2 |
65%2 |
78%2 |
Somewhat familiar (4-5) |
29% |
32% |
24% |
29% |
34% |
41%2 |
26% |
26% |
22% |
Not very familiar (1-3) |
12% |
13% |
7% |
6% |
25%2 |
16% |
18% |
9% |
- |
Don’t know |
1% |
2% |
- |
1% |
1% |
4% |
- |
- |
- |
2 When data tables are presented, the asterisks indicate that the result is statistically significantly different from results in other columns.
From a regional perspective, and as observed in Wave 1, familiarity is highest in Atlantic Canada (73%) and the lowest in Quebec (39%), while results in Ontario and in Western Canada are fairly similar.
|
|
|
Region |
|||
|
|
Total (n=500) |
Atlantic (n=47) |
Quebec (n=150) |
Ontario (n=134) |
West (n=169) |
|
Very familiar (6-7) |
51% |
73%3 |
39% |
53%3 |
52% |
|
Somewhat familiar (4-5) |
32% |
21% |
39%3 |
33% |
29% |
|
Not very familiar (1-3) |
16% |
6% |
21%3 |
13% |
19%3 |
|
Don’t know |
<1% |
- |
1% |
1% |
- |
3 When data tables are presented, the asterisks indicate that the result is statistically significantly different from results in other columns.
|
|
|
Region |
|||
|
|
Total (n=370) |
Atlantic (n=40) |
Quebec (n=59) |
Ontario (n=106) |
West (n=165) |
|
Very familiar (6-7) |
58% |
82%4 |
36% |
65%4 |
56%4 |
|
Somewhat familiar (4-5) |
29% |
16% |
46%4 |
24% |
29% |
|
Not very familiar (1-3) |
12% |
2% |
16%4 |
11%4 |
14%4 |
|
Don’t know |
1% |
- |
2% |
- |
2% |
4 When data tables are presented, the asterisks indicate that the result is statistically significantly different from results in other columns.
Recall of CFIA Advertising
Respondents were asked if they had heard, seen or read any advertisements related to CFIA in the three to four weeks prior to participating in the survey. In order to explore unaided awareness of the Safe Food for Canadians Regulations through advertising, those who had been exposed to CFIA advertisements were asked what they remembered from the ads. Respondents who did not mention the SFCR spontaneously as well as those who said not remembering being exposed to CFIA advertising were asked specifically if they had heard, seen or read something about the new regulations.
Results across all businesses interviewed during Wave 2 reveal that half (50%) recall hearing, seeing or reading advertisement from CFIA. This includes 5% of respondents who remembered SFCR spontaneously (unaided awareness), 39% who remembered SFCR when asked specifically about it, and 6% who remember other CFIA ads but not specific to SFCR. The graphic below shows the distribution of CFIA advertising awareness among all respondents.
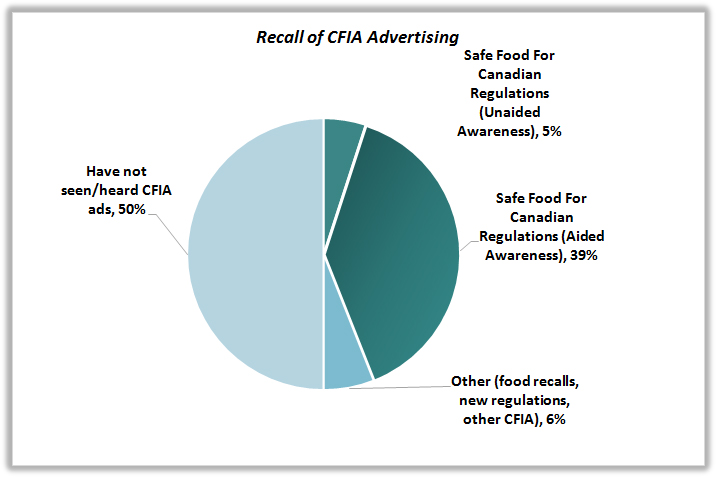
B1a: Over the past three to four weeks, have you seen, read or heard any advertising from the Canadian Food Inspection Agency? B1b. Thinking specifically about the ad or ads that come to mind, what do you remember about the ads. B2. Have you heard, seen or read anything about the Safe Food for Canadians Regulations, which introduces new requirements for food safety and came into force January 15, 2019? Base: All Respondents, Wave 2: n=700.
The pie chart for the distribution of CFIA advertising awareness among respondents is sectioned into four sectors, which infers the following data: Safe food for Canadian regulations (Unaided awareness)- 5 percent, Safe food for Canadian regulations (Aided awareness)- 39 percent, Other (food recalls, new regulations, other CFIA)- 6 percent, and Have not seen/heard CFIA ads- 50 percent.
Other mentions among respondents who remembered seeing CFIA advertisements include general mentions about safe food new regulations, recall information, or other CFIA programs.
In Wave 1, businesses not only in retail were asked specifically if they had heard, seen or read something about the SFCR. When comparing to the results obtained in Wave 2 from businesses not only in retail, there is an increase from 50% to 59%.
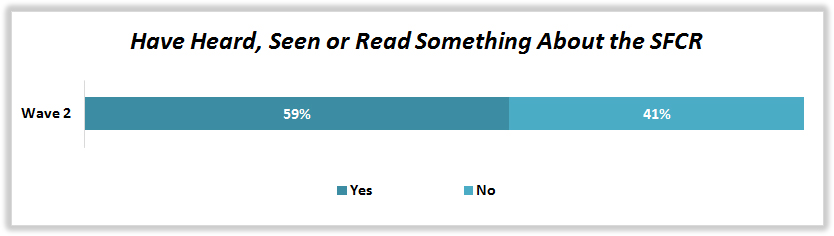
B1b. Thinking specifically about the ad or ads that come to mind, what do you remember about the ads. B2: Have you heard, seen or read anything about the Safe Food for Canadians Regulations, which introduces new requirements for food safety and comes into force January 15, 2019? Base: Businesses not only in retail, n=500.
The chart representing the survey result of the respondents when asked if they have heard, seen, or read something about the SFCR in wave 2 infers the following data: Yes- 59 percent, and No- 41 percent.
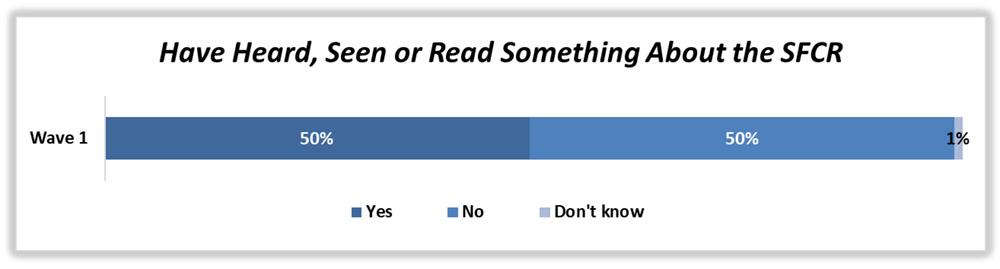
B2: Have you heard, seen or read anything about the Safe Food for Canadians Regulations, which introduces new requirements for food safety and comes into force January 15, 2019? Base: Businesses not only in retail, n=370.
The chart representing the survey result of the respondents when asked if they heard, seen, or read something about the SFCR in wave 1 infers the following data: Yes- 50 percent, and No- 50 percent.
Sub-group trends related to aided awareness of the SFCR are similar to those related to familiarity with CFIA overall. Results show relatively stronger awareness of the SFCR among processors and manufacturers (77%), followed by businesses in agriculture (47%), wholesalers and distributors (47%) and finally, among those in retail (40%).
Awareness of the SFCR generally is greater among large businesses (44%). There are no significant differences from a regional perspective.
|
|
|
Industry Sector |
Company Size |
||||||
|
|
Total (n=500) |
Agriculture (n=99) |
Processor/Manufacturer (n=198) |
Wholesaler/Distributor (n=137) |
Retailer (n=66) |
Micro (n=98) |
Small (n=105) |
Medium (n=224) |
Large (n=70) |
|
Yes |
59% |
61%5 |
80%5 |
60%5 |
43% |
41% |
53% |
68% |
73% |
|
No |
41% |
39%5 |
20% |
40%5* |
57%5 |
59%5 |
47% |
32% |
27% |
|
Don’t know |
<1% |
- |
<1% |
- |
- |
- |
- |
<1% |
- |
5 When data tables are presented, the asterisks indicate that the result is statistically significantly different from results in other columns.
|
|
|
Region |
|||
|
|
Total (n=500) |
Atlantic (n=47) |
Quebec (n=150) |
Ontario (n=134) |
West (n=169) |
|
Yes |
59% |
66% |
54% |
60% |
60% |
|
No |
41% |
34% |
46% |
40% |
49% |
|
Don’t know |
<1% |
- |
- |
- |
<1% |
|
|
|
Industry Sector |
Company Size |
||||||
|
|
Total (n=370) |
Agriculture (n=49) |
Processor/Manufacturer (n=170) |
Wholesaler/Distributor (n=87) |
Retailer (n=64) |
Micro (n=63) |
Small (n=90) |
Medium (n=179) |
Large (n=37) |
|
Yes |
50% |
43%6 |
73%6 |
49%6 |
26% |
40% |
36% |
57%6 |
82%6 |
|
No |
50% |
57%6 |
26% |
51%6 |
73%6 |
58%6 |
63%6 |
43%6 |
18% |
|
Don’t know |
1% |
- |
1% |
- |
1% |
1% |
1% |
- |
- |
6 When data tables are presented, the asterisks indicate that the result is statistically significantly different from results in other columns.
|
|
|
Region |
|||
|
|
Total (n=370) |
Atlantic (n=40) |
Quebec (n=59) |
Ontario (n=106) |
West (n=165) |
|
Yes |
50% |
57%7 |
36% |
56%7 |
47% |
|
No |
50% |
43% |
64%7 |
43% |
52% |
|
Don’t know |
1% |
- |
- |
1% |
1% |
7 When data tables are presented, the asterisks indicate that the result is statistically significantly different from results in other columns.
|
|
|
Industry Sector |
Company Size |
||||||
|
|
Total (n=215) |
Agriculture (n=38) |
Processor/Manufacturer (n=96) |
Wholesaler/Distributor (n=42) |
Retailer (n=39) |
Micro (n=43) |
Small (n=36) |
Medium (n=98) |
Large (n=37) |
|
Safe Food or new regulations/ rule general mention |
24% |
30% |
30% |
33% |
15% |
27% |
18% |
27% |
19% |
|
Safe Food for Canadians Regulations (SFCR) specific mention |
21% |
21% |
30%8 |
20% |
15% |
19% |
12% |
21% |
37%8 |
|
Recall information |
14% |
14% |
12% |
17% |
13% |
10% |
18% |
13% |
16% |
|
Other CFIA program |
6% |
6% |
8% |
10% |
3% |
5% |
6% |
5% |
7% |
|
Other |
13% |
6% |
10% |
13% |
17% |
17% |
7% |
16% |
5% |
|
Don’t know/Can’t Recall |
22% |
23%8 |
9% |
6% |
38%8 |
22% |
39%8 |
18% |
15% |
8 When data tables are presented, the asterisks indicate that the result is statistically significantly different from results in other columns.
|
|
|
Region |
|||
|
|
Total (n=215) |
Atlantic (n=23) |
Quebec (n=66) |
Ontario (n=46) |
West (n=80) |
|
Safe Food or new regulations/ rule general mention |
24% |
12% |
26% |
29% |
22% |
|
Safe Food for Canadians Regulations (SFCR) specific mention |
21% |
22% |
18% |
23% |
21% |
|
Recall information |
14% |
40%9 |
12% |
13% |
9% |
|
Other CFIA program |
6% |
5% |
3% |
7% |
7% |
|
Other |
13% |
14% |
10% |
4% |
22%9 |
|
Don’t know/Can’t Recall |
22% |
7% |
32%9 |
23% |
20% |
9 When data tables are presented, the asterisks indicate that the result is statistically significantly different from results in other columns.
Among those having heard, seen or read something about SFCR who are in a business not exclusively in retail (59% of respondents), the most common sources were email (27%), colleagues and industry events (25%), the CFIA website (21%), followed by a general, unspecified online source (18%). Recall of this sort of information is often vague for respondents so it is not uncommon to see various “general” responses such as “online (general)”, email, a pamphlet, etc. In Wave 1, among those having heard, seen or read something about SFCR who are in a business not exclusively in retail (50% of respondents), the most common sources were colleagues and industry events (30%), a CFIA employee or inspector (21%), the CFIA website (20%), followed by an online general source (18%).
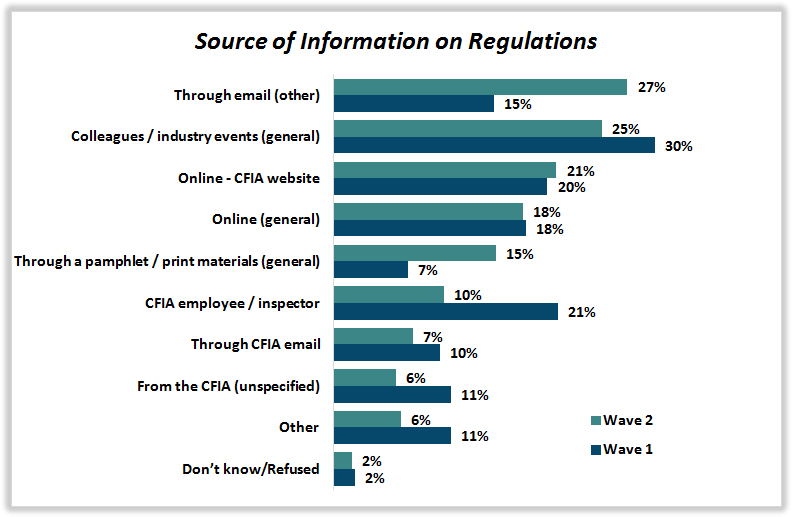
B2A: Where did you hear, see or read about the regulations? Base: Businesses not exclusively in retail that have heard of Safe Food for Canadians Regulations, Wave 2, n= 324, Wave 1, n=204.
A horizontal bar graph presents the source of information on regulations among the respondents who have heard, seen, or read something about the SFCR. The graph shows a set of two bars for each source that represents both wave 1 and wave 2, with the following data:
For Wave 1, the source of information on regulations among the respondents who have heard, seen, or read something about the SFCR are:
- Through email (other): 15%
- Colleagues/ industry events (general): 30%
- Online – CFIA website: 20%
- Online – (general): 18%
- Through a pamphlet/ print material (general): 7%
- CFIA employee/ inspector: 21%
- Through CFIA email: 10%
- From the CFIA (unspecified): 11%
- Other: 11%
- Don't know/ Refused: 2%
For Wave 2, the source of information on regulations among the respondents who have heard, seen, or read something about the SFCR are:
- Through email (other): 27%
- Colleagues/ industry events (general): 25%
- Online – CFIA website: 21%
- Online – (general): 18%
- Through a pamphlet/ print material (general): 15%
- CFIA employee/ inspector: 10%
- Through CFIA email: 7%
- From the CFIA (unspecified): 6%
- Other: 6%
- Don't know/ Refused: 2%
Irrespective of whether they had seen, read or heard anything about the new regulations, in Wave 1 businesses were asked if they thought the new regulations would apply to their business. A majority (63%) of businesses believed the new regulations would apply to their business, which suggests that many businesses assume the new regulations apply to their business even if they have not heard about them. One in ten believed the regulations would not apply to their business while 26% did not know.
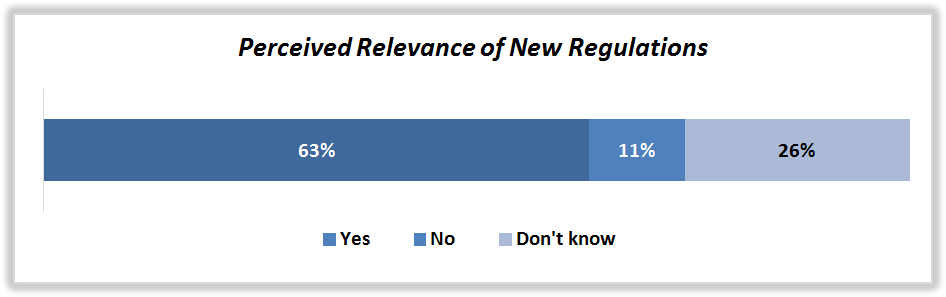
B3: As far as you know, do you think the new Safe Food for Canadians Regulations will apply to your business? Base: Businesses not exclusively in retail, Wave 1, n=370.
The chart representing the perceived relevance of new regulations infers, Yes- 63 percent, No- 11 percent, and Don’t know- 26 percent.
Across the various sub-groups, results (from Wave 1) reveal that perceived relevance is highest among processors and manufacturers (74%) and lowest among businesses in agriculture (51%) and retail (55%). Perceived relevance also increased with the size of the business, ranging from 49% among micro businesses, to 83% among large ones. Smaller businesses were more prone to believe that the new regulations would not apply to their business (rather than simply not knowing). Regionally, perceived relevance was highest in Atlantic Canada (77%) and lowest in Quebec (56%), with results in Ontario and Western Canada fairly similar. Additionally, 22% of those in Quebec did not believe the new regulations would apply to their business.
|
|
|
Industry Sector |
Company Size |
||||||
|
|
Total (n=370) |
Agriculture (n=49) |
Processor/Manufacturer (n=170) |
Wholesaler/Distributor (n=87) |
Retailer (n=64) |
Micro (n=63) |
Small (n=90) |
Medium (n=179) |
Large (n=37) |
|
Yes |
63% |
51% |
74%10 |
63% |
55% |
49% |
62% |
65%10 |
83%10 |
|
No |
11% |
16%10 |
6% |
11% |
14% |
24%10 |
10%10 |
7% |
2% |
|
Don’t know |
26% |
33%10 |
20% |
26% |
31%10 |
27% |
28% |
27%10 |
15% |
10 When data tables are presented, the asterisks indicate that the result is statistically significantly different from results in other columns.
|
|
|
Region |
|||
|
|
Total (n=370) |
Atlantic (n=40) |
Quebec (n=59) |
Ontario (n=106) |
West (n=165) |
|
Yes |
63% |
77%11 |
56% |
65% |
60% |
|
No |
11% |
- |
22%11 |
7% |
12% |
|
Don’t know |
26% |
23% |
22% |
28% |
27% |
11 When data tables are presented, the asterisks indicate that the result is statistically significantly different from results in other columns.
In Wave 1, when specifically asked about three requirements under the new regulations, results reveal that nearly three quarters (74%) of businesses were aware that the new regulations required regulated businesses to have product traceability processes, 60% were aware that they require a written preventive control plan and 52% were aware that they require a licence from CFIA.
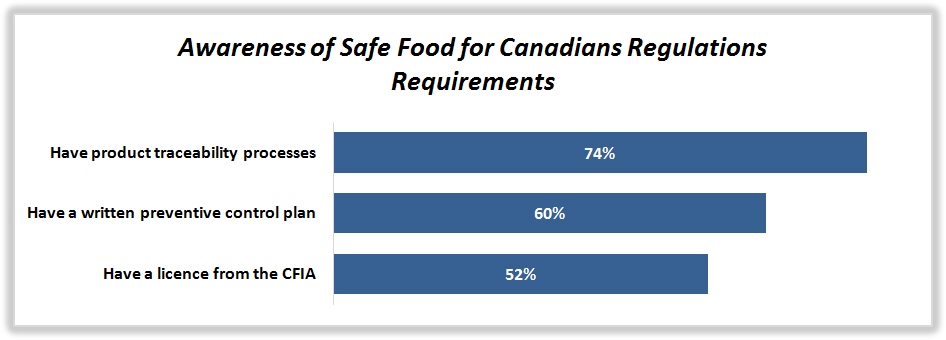
B4: Were you aware that the proposed Safe Food for Canadians Regulations require most businesses regulated by CFIA to: Have a licence from the CFIA. / B5: Have a written preventive control plan. / B6: Have product traceability processes. Base: Businesses not exclusively in retail, Wave 1, n=370.
The chart depicting the awareness of safe food for Canadians regulation requirements infers the following data: Have product traceability processes- 74 percent, Have a written preventive control plan- 60 percent, and Have a licence from the CFIA- 52 percent.
Awareness of these three requirements was consistently lower among businesses in the retail sector and became progressively lower as the size of the business decreased. Furthermore, the requirement for regulated businesses to have a licence from CFIA was also relatively lower among businesses in the agriculture segment (46%) although not as low as in the retail segment (33%).
|
|
|
Industry Sector |
Company Size |
||||||
|
|
Total (n=370) |
Agriculture (n=49) |
Processor/Manufacturer (n=170) |
Wholesaler/Distributor (n=87) |
Retailer (n=64) |
Micro (n=63) |
Small (n=90) |
Medium (n=179) |
Large (n=37) |
|
Have a licence from CFIA |
|||||||||
|
Yes |
52% |
46% |
69%12 |
55%12 |
33% |
29% |
46%12 |
62%12 |
78%12 |
|
No |
43% |
46%12 |
27% |
37% |
64%12 |
68%12 |
45%12 |
34%12 |
19% |
|
Don’t know |
5% |
7% |
4% |
8% |
3% |
3% |
10% |
4% |
3% |
|
Have a written preventive control plan |
|||||||||
|
Yes |
60% |
63%12 |
76%12 |
64%12 |
36% |
34% |
49%12 |
90%12 |
|
|
No |
35% |
33% |
21% |
31%12 |
56%12 |
63%12 |
39%12 |
24%12 |
8% |
|
Don’t know |
5% |
3% |
3% |
4% |
9% |
3% |
12%12 |
2% |
1% |
|
Have product traceability processes |
|||||||||
|
Yes |
74% |
81%12 |
87%12 |
75%12 |
50% |
67% |
63% |
79%12 |
94%12 |
|
No |
25% |
19% |
12% |
24%12 |
45%12 |
32%12 |
33%12 |
20%12 |
6% |
|
Don’t know |
2% |
- |
1% |
1% |
4% |
1% |
4% |
1% |
- |
12 When data tables are presented, the asterisks indicate that the result is statistically significantly different from results in other columns.
From a regional perspective, awareness of each of the three requirements was consistently highest in Atlantic Canada and, with the exception of the requirement to have product traceability processes, awareness was consistently lowest in Quebec.
|
|
Region |
||||
|
|
Total (n=370) |
Atlantic (n=40) |
Quebec (n=59) |
Ontario (n=106) |
West (n=165) |
|
Have a licence from CFIA |
|||||
|
Yes |
52% |
71%13 |
44% |
55% |
49% |
|
No |
43% |
27% |
50%13 |
40% |
44%13 |
|
Don’t know |
5% |
2% |
7% |
4% |
6% |
|
Have a written preventive control plan |
|||||
|
Yes |
60% |
80%13 |
51% |
63% |
59% |
|
No |
35% |
19% |
42%13 |
33%13 |
36%13 |
|
Don’t know |
5% |
1% |
7% |
4% |
6% |
|
Have product traceability processes |
|||||
|
Yes |
74% |
84%13 |
77% |
76%13 |
67% |
|
No |
25% |
16% |
19% |
24% |
30%13 |
|
Don’t know |
2% |
- |
4% |
- |
3% |
13 When data tables are presented, the asterisks indicate that the result is statistically significantly different from results in other columns.
In Wave 1, separate questions related to the traceability of food products and to the SFCR were dedicated to businesses that self-identified as “retail-only” businesses. Results from these questions reveal the following:
- Three-quarters of retailers (74%) have a process in place to trace food back to the company that supplied it.
- Roughly half (52%) are aware of the Safe Food for Canadians Regulations.
- About four in ten (41%) claim to be aware of the new regulation’s requirement for most food companies to be able to trace where their food products were purchased.
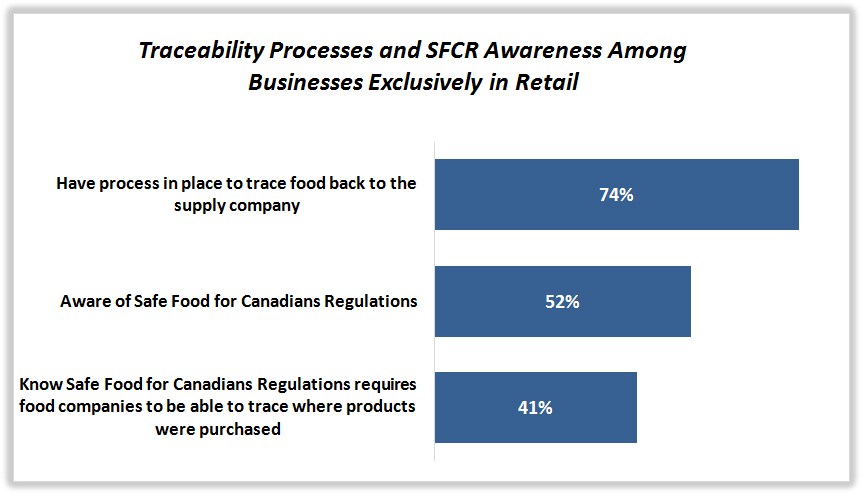
S4: Do you have a process in place that will allow you to trace back your food to the company that supplied it? S4a: Have you heard of the Safe Food for Canadians Regulations? S4b: Do you know that the Safe Food for Canadians Regulations that come into force January 15, 2019 require most food companies to be able to trace where their food products were purchased? Base: Businesses exclusively in retail, Wave 1, n=300.
The chart depicting the traceability processes and SFCR awareness among businesses exclusively in retail infers the following data: Have process in place to trace food back to the supply company- 74 percent, Aware of safe food for Canadians regulations- 52 percent, and Know safe food for Canadians regulations requires food company to be able to trace where products were purchased- 41 percent.
|
Wave 1 |
Has a Processes to Trace Back Food |
Heard of Safe Food for Canadians Regulations |
Understands Traceability Requirements Under New SFCR |
|---|---|---|---|
|
Yes |
74% |
52% |
41% |
|
No |
24% |
42% |
58% |
|
Not sure |
1% |
6% |
- |
|
Don’t know/Refused |
1% |
- |
1% |
Confidence in Meeting Food Safety Regulations
The majority (91%) of businesses felt very confident that they would meet food safety regulations and requirements if they were to be inspected. Among the remaining respondents, 8% felt somewhat confident (gave a rating of 4 or 5 on a 7-point scale) and only 1% were not very confident (gave a rating of 1 to 3). This is a statistically significant increase from 86% of businesses feeling very confident in meeting food safety regulations and requirements in Wave 1. Virtually all large companies are very confident (99%), while medium-sized companies are the most likely to be somewhat confident (10%). Businesses in Quebec are the most likely to be very confident. There were no statistically significant differences across industry verticals.
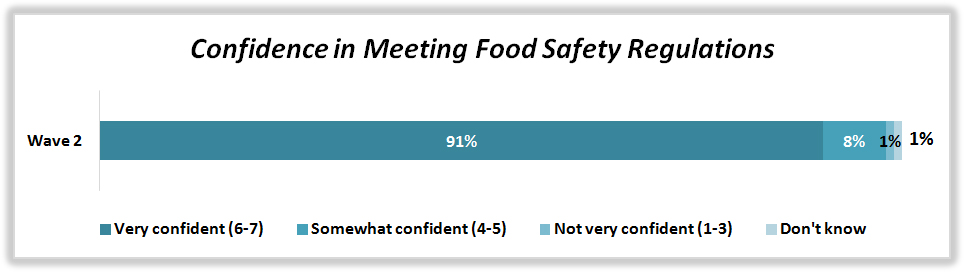
A1: If your business was subject to a CFIA inspection today, how confident are you that you would meet food safety regulations and requirements? Please rate your view on a scale of 1 to 7 where 1 means not at all confident and 7 means very confident. Base: Businesses not exclusively in retail, Wave 2, n=500.
The chart depicting the percentage of confidence in meeting food safety regulations in wave 2 infers the following data: Very confident (6 to 7)- 91 percent, Somewhat confident (4 to 5)- 8 percent, Not very confident (1 to 3)- 1 percent, and Don’t know- 1 percent.
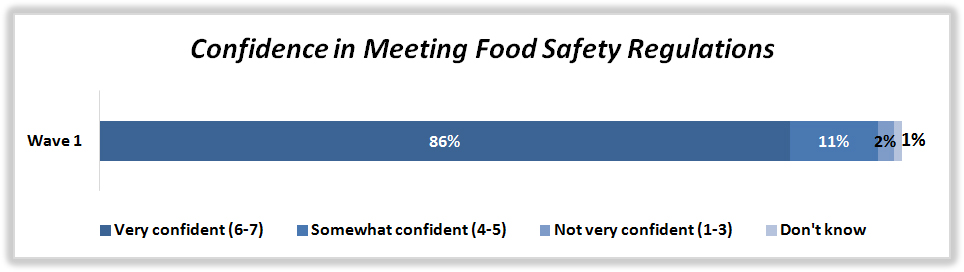
G5: If your business was subject to a CFIA inspection today, how confident are you that you would meet food safety regulations and requirements? Please rate your view on a scale of 1 to 7 where 1 means not at all confident and 7 means very confident. Base: Businesses not exclusively in retail, Wave 1, n=370.
The chart depicting the percentage of confidence in meeting food safety regulations in wave 1 infers the following data: Very confident (6 to 7)- 86 percent, Somewhat confident (4 to 5)- 11 percent, Not very confident (1 to 3)- 2 percent, and Don’t know- 1 percent.
|
|
|
Industry Sector |
Company Size |
||||||
|
|
Total (n=500) |
Agriculture (n=99) |
Processor/Manufacturer (n=198) |
Wholesaler/Distributor (n=137) |
Retailer (n=66) |
Micro (n=98) |
Small (n=105) |
Medium (n=224) |
Large (n=70) |
|
Very confident (6-7) |
91% |
89% |
93% |
90% |
90% |
90% |
91% |
89% |
99%14 |
|
Somewhat confident (4-5) |
8% |
10% |
7% |
5% |
10% |
8% |
7% |
10%14 |
1% |
|
Not very confident (1-3) |
1% |
- |
<1% |
2% |
- |
1% |
<1% |
1% |
- |
|
Don’t know |
1% |
2% |
<1% |
3% |
- |
1% |
2% |
<1% |
- |
14 When data tables are presented, the asterisks indicate that the result is statistically significantly different from results in other columns.
|
|
|
Region |
|||
|
|
Total (n=500) |
Atlantic (n=47) |
Quebec (n=150) |
Ontario (n=134) |
West (n=169) |
|
Very confident (6-7) |
91% |
96% |
97%15 |
86% |
91% |
|
Somewhat confident (4-5) |
8% |
4% |
3% |
11%15 |
8% |
|
Not very confident (1-3) |
1% |
- |
<1% |
1% |
- |
|
Don’t know |
1% |
- |
- |
2% |
1% |
15 When data tables are presented, the asterisks indicate that the result is statistically significantly different from results in other columns.
|
|
|
Industry Sector |
Company Size |
||||||
|
|
Total (n=370) |
Agriculture (n=49) |
Processor/Manufacturer (n=170) |
Wholesaler/Distributor (n=87) |
Retailer (n=64) |
Micro (n=63) |
Small (n=90) |
Medium (n=179) |
Large (n=37) |
|
Very confident (6-7) |
86% |
84% |
90% |
83% |
84% |
86% |
76% |
90%16 |
94%16 |
|
Somewhat confident (4-5) |
11% |
10% |
7% |
14% |
13% |
6% |
22%16 |
7% |
6% |
|
Not very confident (1-3) |
2% |
6% |
1% |
3% |
1% |
6% |
1% |
2% |
- |
|
Don’t know |
1% |
- |
2% |
- |
1% |
2% |
1% |
1% |
- |
16 When data tables are presented, the asterisks indicate that the result is statistically significantly different from results in other columns.
|
|
|
Region |
|||
|
|
Total (n=370) |
Atlantic (n=40) |
Quebec (n=59) |
Ontario (n=106) |
West (n=165) |
|
Very confident (6-7) |
86% |
93% |
85% |
84% |
87% |
|
Somewhat confident (4-5) |
11% |
7% |
13% |
11% |
10% |
|
Not very confident (1-3) |
2% |
- |
2% |
3% |
2% |
|
Don’t know |
1% |
- |
- |
1% |
1% |
Those very confident that they would meet regulations and requirements if they were inspected today attribute this confidence mostly to the fact that they believe they follow the rules and /or comply with regulations (33%). Another 28% are confident because they are inspected regularly / have received positive feedback, and 11% feel they make an effort and try to meet food safety regulations. Response patterns are quite similar when we consider the confidence drivers among those who provided lower confidence ratings.
|
Among Businesses Very Confident (Confidence Rating of 6 or 7) |
Among Businesses Somewhat Confident or Not Very Confident (Confidence Rating of 1 to 5) |
||
|
n=37 |
|||
|
We follow the rules / comply with regulations |
33% |
We make an effort / try to meet food safety regulations |
28% |
|
We are inspected regularly / have received positive feedback |
28% |
We are inspected regularly / have received positive feedback |
19% |
|
We make an effort / try to meet food safety regulations |
11% |
We follow the rules / comply with regulations |
11% |
|
We have a full food safety program in place |
9% |
We only carry low-risk products |
8% |
|
We have recently passed an audit |
5% |
We keep everything clean / organized |
4% |
|
We keep everything clean / organized |
4% |
We have a full food safety program in place |
4% |
|
We have never had an issue in the past |
2% |
Other |
5% |
|
We only carry low-risk products |
2% |
Don’t know/ Refused |
19% |
|
We keep our documentation / paperwork |
2% |
|
|
|
Other |
1% |
|
|
|
Don’t know/ Refused |
2% |
|
|
|
Among Businesses Very Confident (Confidence Rating of 6 or 7) |
Among Businesses Somewhat Confident or Not Very Confident (Confidence Rating of 1 to 5) |
||
|
n=324 |
n=43 |
||
|
We follow the rules / comply with regulations |
55% |
We follow the rules / comply with regulations |
62% |
|
We keep everything clean / organized |
27% |
We keep everything clean / organized |
19% |
|
Inspected regularly / have received positive feedback |
16% |
We have a full food safety program in place |
7% |
|
We have a full food safety program in place |
12% |
We keep our documentation / paperwork |
5% |
|
We have recently passed an audit |
11% |
Inspected regularly / have received positive feedback |
5% |
|
We have never had an issue in the past |
9% |
We have recently passed an audit |
4% |
|
We keep our documentation / paperwork |
6% |
We only carry low-risk products |
2% |
|
We only carry low-risk products |
4% |
Other |
4% |
|
Other |
1% |
Don’t know/ Refused |
16% |
|
Don’t know/ Refused |
4% |
||
Commonly Conducted Food Safety Activities
A list of various food safety-related measures and activities was presented to survey respondents in both waves and they were asked to note the ones that apply to their company. Results from this revealed that the most popular food safety activities include documenting standard operating procedures on food safety, establishing a traceability program and internal training programs on food safety. Each of these was noted by over three-quarters of businesses in both waves. Additionally, 60% of businesses have preventive controls in place, which are outlined in a written plan. Over half of businesses regularly send staff on food safety training (57%) or have a food licence or registration with CFIA. Slightly fewer have preventive controls in place not written or documented in a plan (45%), or use a food safety or quality control certification system (40%). Results from Wave 1 are quite similar to those in Wave 2.
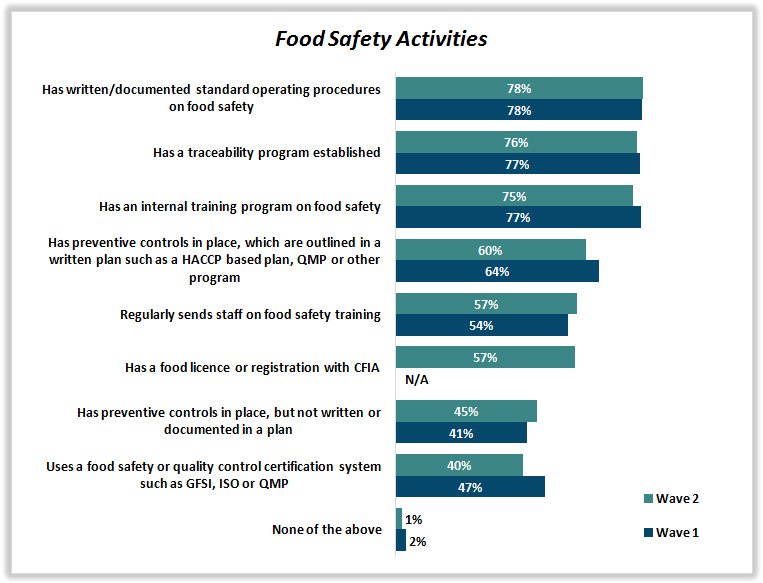
A3: Which of the following, if any, applies at your company? Base: Businesses not exclusively in retail, Wave 2, n=500, Wave 1, n=370.
A horizontal bar graph presents a list of various food safety-related measures and activities that respondents in both waves applied to their company. The graph shows a set of two bars for each source that represents both wave 1 and wave 2, with the following data:
For Wave 1, the following list of various food safety-related measures and activities respondents indicated they apply to their company.
- Has written/ documented standard operating procedures on food safety: 78%
- Has a traceability program established: 77%
- Has an internal training program on food safety: 77%
- Has preventive controls in place, which are outlined in a written plan such as a HACCP based plan, QMP or other program: 64%
- Regularly sends staff on food safety training: 54%
- Has a food licence or registration with CFIA: N/A
- Has preventive controls in place, but not written or documented in a plan: 41%
- Uses a food safety or quality control certification system such as GFSI, ISO or QMP: 47%
- None of the above: 2%
For Wave 2, the following list of various food safety-related measures and activities was presented to respondents to note the ones that apply the following to their company.
- Has written/ documented standard operating procedures on food safety: 78%
- Has a traceability program established: 76%
- Has an internal training program on food safety: 75%
- Has preventive controls in place, which are outlined in a written plan such as a HACCP based plan, QMP or other program: 60%
- Regularly sends staff on food safety training: 57%
- Has a food licence or registration with CFIA: 57%
- Has preventive controls in place, but not written or documented in a plan: 45%
- Uses a food safety or quality control certification system such as GFSI, ISO or QMP: 40%
- None of the above: 1%
Results are dependent on the industry sector and frequently based on the size of the company.
From an industry sector perspective, businesses whose primary activity is retail or wholesale/distribution are the least likely to have food safety measures in place. For retailers, the exceptions are having an internal training program on food safety, regularly sending staff on food safety training and having preventing controls without being written or documented in a plan. Retailers stand out from the other sectors in terms of being more likely to regularly send staff on food safety training. Another noteworthy trend from an industry sector perspective reveals the incidence for nearly each of the measures is highest among processors and manufacturers. These businesses are more likely to:
have an internal training program on food safety (91%); have preventive controls in place outlined in a written plan such as a HACCP based plan, QMP or other program (80%); regularly send staff on food safety training (63%); use a food safety or quality control certification system such as GFSI, ISO or QMP (59%)
From a company size perspective, the larger the business, the more likely they are to have most of the measures in place. As seen below, the incidence of six of the measures exceeds 80% among large businesses. Conversely, the smaller the business, the more likely they are to have preventive controls in place but not written or documented in a plan – this measure reaches 56% among micro businesses. Furthermore, 6% of micro businesses indicate they do not have any of the measures in place at all.
Trends per industry vertical and company size remain similar in Wave 2 compared to those observed in Wave 1.
|
|
|
Industry Sector |
Company Size |
||||||
|
|
Total (n=500) |
Agriculture (n=99) |
Processor/Manufacturer (n=198) |
Wholesaler/Distributor (n=137) |
Retailer (n=66) |
Micro (n=98) |
Small (n=105) |
Medium (n=224) |
Large (n=70) |
|
Has written/documented standard operating procedures on food safety |
78% |
86%17 |
84%17 |
73% |
74% |
60% |
72% |
87%17 |
92%17 |
|
Has a traceability program established |
76% |
89%17 |
87%17 |
82%17 |
60% |
64% |
81%17 |
77%17 |
85%17 |
|
Has an internal training program on food safety |
75% |
77%17 |
91%17 |
64% |
69% |
58% |
65% |
86%17 |
85%17 |
|
Has preventive controls in place, which are outlined in a written plan such as a HACCP based plan, QMP or other program |
60% |
66%17 |
80%17 |
62%17 |
41% |
42% |
45% |
67%17 |
91%17 |
|
Regularly sends staff on food safety training |
57% |
55% |
63%17 |
45% |
62%17 |
43% |
47% |
64%17 |
76%17 |
|
Has a food licence or registration with CFIA |
57% |
57% |
62% |
59% |
51% |
30% |
54%17 |
65%17 |
80%17 |
|
Has preventive controls in place, but not written or documented in a plan |
45% |
40% |
37% |
45% |
51% |
56%17 |
47%17 |
46%17 |
20% |
|
Uses a food safety or quality control certification system such as GFSI, ISO or QMP |
40% |
58%17 |
59%17 |
36% |
23% |
18% |
22% |
50%17 |
79%17 |
|
None of the above |
2% |
2% |
1% |
4% |
2% |
6% |
2% |
<1% |
- |
17 When data tables are presented, the asterisks indicate that the result is statistically significantly different from results in other columns.
|
|
|
Industry Sector |
Company Size |
||||||
|
|
Total (n=370) |
Agriculture (n=49) |
Processor/Manufacturer (n=170) |
Wholesaler/Distributor (n=87) |
Retailer (n=64) |
Micro (n=63) |
Small (n=90) |
Medium (n=179) |
Large (n=37) |
|
Has written/ documented standard operating procedures on food safety |
78% |
82%18 |
88%<18 |
80%18 |
61% |
56% |
67% |
91%18 |
96%18 |
|
Has an internal training program on food safety |
77% |
69% |
90%18 |
68% |
76% |
53% |
74%18 |
87%18 |
92%18 |
|
Has a traceability program established |
77% |
85%18 |
88%18 |
84%18 |
50% |
64% |
63% |
87%18 |
96%18 |
|
Has preventive controls in place, which are outlined in a written plan such as a HACCP based plan, QMP or other program |
64% |
72%18 |
77%18 |
63%18 |
43% |
38% |
48% |
82%18 |
83%18 |
|
Regularly sends staff on food safety training |
54% |
45% |
70%18 |
45% |
50% |
29% |
46%18 |
65%18 |
86%18 |
|
Uses a food safety or quality control certification system such as GFSI, ISO or QMP |
47% |
54%18 |
60%18 |
45%18 |
29% |
29% |
34% |
57%18 |
83%18 |
|
Has preventive controls in place, but not written or documented in a plan |
41% |
34% |
39% |
40% |
50%18 |
48% |
45% |
38% |
33% |
|
Follows six sigma quality control |
25% |
25% |
26% |
25% |
23% |
16% |
22% |
29%18 |
30% |
|
None of the above |
3% |
5% |
2% |
3% |
4% |
14%18 |
- |
1% |
4% |
18 When data tables are presented, the asterisks indicate that the result is statistically significantly different from results in other columns.
From a regional perspective, results suggest a lower level of adoption of the various measures in Quebec. The results on the previous page show that these are in fact two segments where the adoption of the various measures tends to be relatively lower.
Results also show that over three-quarters of the businesses in Atlantic Canada have adopted many of the measures listed, results that are higher than what is seen in the other regions. The adoption of the various measures is very consistent between businesses in Ontario and those in the West.
Results are also similar between Wave 2 and Wave 1.
|
|
|
Region |
|||
|
|
Total (n=500) |
Atlantic (n=47) |
Quebec (n=150) |
Ontario (n=134) |
West (n=169) |
|
Has written/documented standard operating procedures on food safety |
78% |
93%19 |
49% |
89%19 |
80%19 |
|
Has a traceability program established |
76% |
94%19 |
65% |
80%19 |
75% |
|
Has an internal training program on food safety |
75% |
75% |
73% |
76% |
74% |
|
Has preventive controls in place, which are outlined in a written plan such as a HACCP based plan, QMP or other program |
60% |
78%19 |
47% |
62%19 |
62%19 |
|
Regularly sends staff on food safety training |
57% |
55% |
45% |
68%* |
50% |
|
Has a food licence or registration with CFIA |
57% |
81%19 |
42% |
54% |
65%19 |
|
Has preventive controls in place, but not written or documented in a plan |
45% |
41% |
50% |
45% |
42% |
|
Uses a food safety or quality control certification system such as GFSI, ISO or QMP |
40% |
68%19 |
33% |
39% |
42% |
|
None of the above |
2% |
1% |
7%19 |
1% |
1% |
19 When data tables are presented, the asterisks indicate that the result is statistically significantly different from results in other columns.
|
|
|
Region |
|||
|
|
Total (n=370) |
Atlantic (n=40) |
Quebec (n=59) |
Ontario (n=106) |
West (n=165) |
|
Has written/ documented standard operating procedures on food safety |
78% |
88%20 |
46% |
84%20 |
83%20 |
|
Has an internal training program on food safety |
77% |
88%20 |
72% |
78% |
77% |
|
Has a traceability program established |
77% |
93%20 |
60% |
83%20 |
75%20 |
|
Has preventive controls in place, which are outlined in a written plan such as a HACCP based plan, QMP or other program |
64% |
89%20 |
39% |
67%20 |
67%20 |
|
Regularly sends staff on food safety training |
54% |
78%20 |
39% |
51% |
60%20 |
|
Uses a food safety or quality control certification system such as GFSI, ISO or QMP |
47% |
77%20 |
19% |
50%20 |
51%20 |
|
Has preventive controls in place, but not written or documented in a plan |
41% |
46% |
53%20 |
39% |
38% |
|
Follows six sigma quality control |
25% |
39%20 |
14% |
29%20 |
23% |
|
None of the above |
3% |
2% |
8% |
2% |
3% |
20 When data tables are presented, the asterisks indicate that the result is statistically significantly different from results in other columns.
Businesses not exclusively in retail were asked to rate their level of understanding of food regulations that apply to their foods. By using a 7-point scale, where 1 meant not at all and 7 meant very clearly, results reveal that in the second wave of the survey, 68% of businesses not exclusively in retail would rate their understanding of the food safety regulations that apply to their foods a 6 or a 7. This is a lower rating compared to that observed in Wave 1 (78%). However, most of the remaining businesses (25% in Wave 2 and 18% in Wave 1) would give a rating of 4 or 5, which shows how there is a decrease from the “very clear” proportion and an increase to the “somewhat clearly” proportion from Wave 1 to Wave 2 – when combining the top scores provided, we can see the understanding of these regulations is clear to respondents in both waves (93% in Wave 2 and 96% in Wave 1).
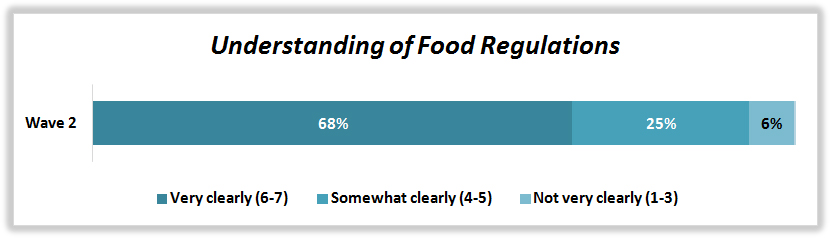
B3: On a scale of 1 to 7, where 1 means not at all and 7 means very clearly, how well do you feel that you understand the food safety regulations that apply to your foods? Base: Businesses not exclusively in retail, Wave 2, n=500.
The chart illustrating the understanding of food regulations among businesses in wave 2 infers the following data: Very clearly (6 to 7)- 68 percent, Somewhat clearly (4 to 5)- 25 percent, and Not very clearly (1 to 3)- 6 percent.
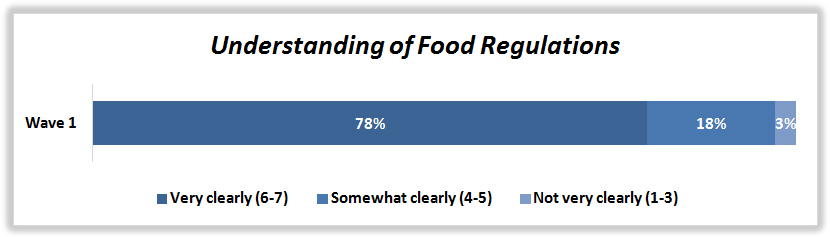
A2: On a scale of 1 to 7, where 1 means not at all and 7 means very clearly, how well do you feel that you understand the food safety regulations that apply to your foods? Base: Businesses not exclusively in retail, Wave 1, n=370.
The chart illustrating the understanding of food regulations among businesses in wave 1 infers the following data: Very clearly (6 to 7)- 78 percent, Somewhat clearly (4 to 5)- 18 percent, and Not very clearly (1 to 3)- 3 percent. Note: very clearly, somewhat clearly, and not very clearly are represented in colors of denim, blue, and stone, respectively.
Reported understanding of the food safety regulations that apply to their foods is stronger among processor/manufacturer businesses (74% selected a rating of 6 or 7). Understanding seems to wane as the size of the businesses decreases in Wave 1. As the tables below indicates, 90% of large businesses gave themselves a rating of 6 or 7 in Wave 1, a score that gradually drops to 69% among micro businesses. From a regional perspective, businesses in Atlantic Canada are more likely to report understanding the food safety regulations that apply to their foods.
|
|
|
Industry Sector |
Company Size |
||||||
|
|
Total (n=500) |
Agriculture (n=99) |
Processor/Manufacturer (n=198) |
Wholesaler/Distributor (n=137) |
Retailer (n=66) |
Micro (n=98) |
Small (n=105) |
Medium (n=224) |
Large (n=70) |
|
Very clearly (6-7) |
68% |
72% |
74%21 |
60% |
68% |
68% |
69% |
67% |
71% |
|
Somewhat clearly (4-5) |
25% |
17% |
20% |
33%21 |
26% |
25% |
26% |
28% |
18% |
|
Not very clearly (1-3) |
6% |
10% |
6% |
6% |
6% |
7% |
4% |
5% |
11% |
|
Don’t know |
<1% |
- |
<1% |
1% |
- |
- |
1% |
<1% |
- |
21 When data tables are presented, the asterisks indicate that the result is statistically significantly different from results in other columns.
|
|
|
Industry Sector |
Company Size |
||||||
|
|
Total (n=370) |
Agriculture (n=49) |
Processor/Manufacturer (n=170) |
Wholesaler/Distributor (n=87) |
Retailer (n=64) |
Micro (n=63) |
Small (n=90) |
Medium (n=179) |
Large (n=37) |
|
Very clearly (6-7) |
78% |
84% |
82% |
79% |
70% |
69% |
72% |
85%22 |
90%22 |
|
Somewhat clearly (4-5) |
18% |
9% |
16% |
20% |
25%22 |
21% |
26%22 |
14% |
10% |
|
Not very clearly (1-3) |
3% |
7% |
2% |
2% |
3% |
9%22 |
2% |
1% |
- |
|
Don’t know |
<1% |
- |
- |
- |
1% |
2% |
- |
- |
- |
22 When data tables are presented, the asterisks indicate that the result is statistically significantly different from results in other columns.
|
|
|
Region |
|||
|
|
Total (n=500) |
Atlantic (n=47) |
Quebec (n=150) |
Ontario (n=134) |
West (n=169) |
|
Very clearly (6-7) |
68% |
77% |
70% |
65% |
69% |
|
Somewhat clearly (4-5) |
25% |
17% |
25% |
26% |
25% |
|
Not very clearly (1-3) |
6% |
6% |
4% |
8% |
6% |
|
Don’t know |
<1% |
- |
<1% |
1% |
- |
|
|
|
Region |
|||
|
|
Total (n=370) |
Atlantic (n=40) |
Quebec (n=59) |
Ontario (n=106) |
West (n=165) |
|
Very clearly (6-7) |
78% |
90%23 |
75% |
82% |
74% |
|
Somewhat clearly (4-5) |
18% |
10% |
23% |
16% |
20% |
|
Not very clearly (1-3) |
3% |
- |
3% |
2% |
4% |
|
Don’t know |
<1% |
- |
- |
- |
1% |
23 When data tables are presented, the asterisks indicate that the result is statistically significantly different from results in other columns.
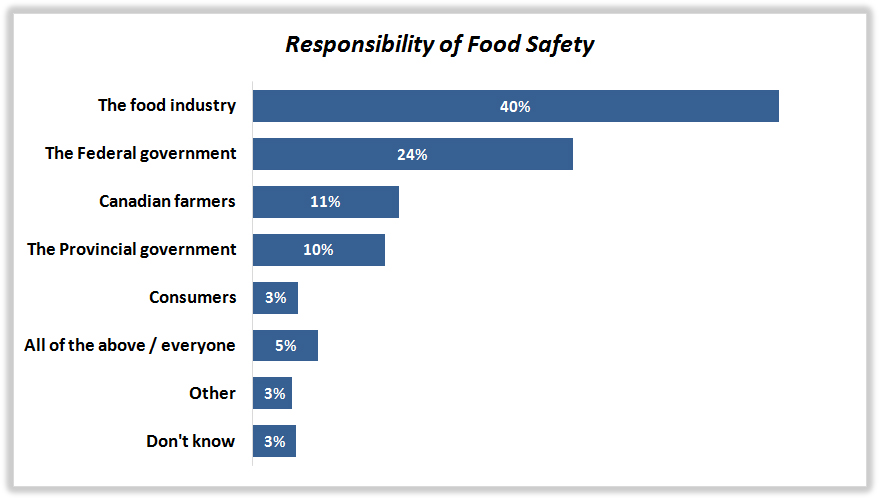
In Wave 1, businesses not exclusively in retail were asked who they believe is responsible for food safety in Canada. Results indicate nearly 2 in 5 businesses think it is the food industry that has the most responsibility to ensure food sold in Canada is safe. Another 24% believe it is the federal government, 11% believe it is Canadian farmers and 10% believe the provincial governments have the most responsibility.
A1: Thinking about food safety in general, who do you think has the most responsibility to ensure the food sold in Canada is safe. Is it… Base: Businesses not exclusively in retail, Wave1, n=370.
The horizontal bar graph represents the survey response of the businesses in wave 1 when asked about the responsibility of food safety in Canada. The graph infers the following data: The food industry- 40 percent, The federal government- 24 percent, Canadian farmers- 11 percent, The provincial government- 10 percent, Consumers- 3 percent, All of the above/everyone- 5 percent, Other- 3 percent, and Don’t know- 3 percent
The attribution of responsibility does differ depending on the industry sector. For instance, a majority of those who identify as processors and manufacturers are inclined to believe that most of the responsibility falls on the shoulders of the food industry itself (57%).
The perception is fairly different among those in agriculture, among whom 40% believe most of the responsibility lies with Canadian farmers, followed by 30% who believe it is the food industry and 20% believe it is the federal government.
The picture is different still among retailers where a provincial government is more likely to be identified (20%), over one quarter believe it is the federal government (27%) and relatively few (at 24%) believe it is the food industry.
Most businesses that are primarily wholesalers and distributors either believe it is the food industry (40%) or the federal government (35%).
From a company size perspective, we can see that the larger the company, the more likely they are to believe that the food industry has the most responsibility.
There are not many regional differences – businesses in Atlantic Canada are much more likely to believe the food industry is primarily responsible.
|
|
|
Industry Sector |
Company Size |
||||||
|
|
Total (n=370) |
Agriculture (n=49) |
Processor/Manufacturer (n=170) |
Wholesaler/Distributor (n=87) |
Retailer (n=64) |
Micro (n=63) |
Small (n=90) |
Medium (n=179) |
Large (n=37) |
|
The food industry |
40% |
30% |
57%24 |
40%24 |
24% |
27% |
34% |
47%24 |
55%24 |
|
The federal government |
24% |
20% |
16% |
35%24 |
27%24 |
31% |
23% |
22% |
26% |
|
Canadian Farmers |
11% |
40%24 |
3% |
8% |
6% |
13% |
10% |
12% |
7% |
|
The Provincial government |
10% |
1% |
7%24 |
8% |
20%24 |
10% |
16% |
7% |
- |
|
Consumers |
3% |
1% |
2% |
3% |
7% |
4% |
7% |
2% |
- |
|
All of the above / everyone |
5% |
9% |
6%24 |
1% |
6% |
6% |
4% |
5% |
5% |
|
Other |
3% |
- |
5% |
2% |
5% |
5% |
4% |
2% |
3% |
|
Don’t know |
3% |
- |
3% |
4% |
5% |
4% |
3% |
3% |
3% |
24 When data tables are presented, the asterisks indicate that the result is statistically significantly different from results in other columns.
|
|
|
Region |
|||
|
|
Total (n=370) |
Atlantic (n=40) |
Quebec (n=59) |
Ontario (n=106) |
West (n=165) |
|
The food industry |
39% |
67%25 |
33% |
41% |
38% |
|
The federal government |
24% |
15% |
24% |
23% |
28%25 |
|
Canadian Farmers |
11% |
- |
14% |
14% |
8% |
|
The Provincial government |
10% |
10% |
17% |
7% |
9% |
|
Consumers |
3% |
3% |
6% |
2% |
4% |
|
All of the above / everyone |
5% |
4% |
1% |
5% |
7% |
|
Other |
3% |
- |
4% |
4% |
2% |
|
Don’t know |
3% |
- |
2% |
4% |
4% |
25 When data tables are presented, the asterisks indicate that the result is statistically significantly different from results in other columns.
Businesses not exclusively in retail from both waves of surveys were provided with three potential challenges that food businesses might encounter and then asked to select the one that, from their perspective, would be the biggest challenge. Just over two in five food businesses (45%) selected traceability of food products as the biggest food safety challenge. This was followed by written preventive controls (30%), and 16% selected licencing. In Wave 2, nearly 1 in 10 did not know which represented the biggest challenge for food businesses.
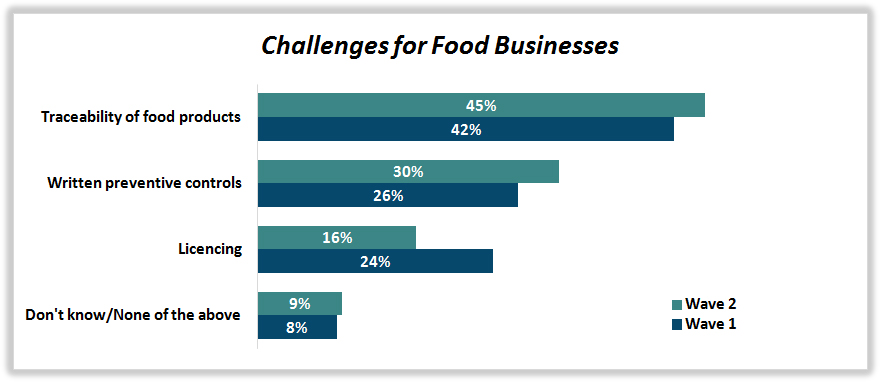
B7: From your perspective which of the following three key food safety elements would be the biggest challenge for food businesses? Would it be… Base: Businesses not exclusively in retail, Wave 2, n=500, Wave 1, n=370.
A horizontal bar graph presents challenges businesses not exclusively in retail might encounter. From their perspective, the following three potential challenges were the biggest. The graph shows a set of two bars for each source that represents both wave 1 and wave 2, with the following data:
For Wave 1, the following challenges were identified as the biggest.
- Traceability of food products: 42%
- Written preventive controls: 26%
- Licencing: 24%
- Don't know/None of the above: 8%
For Wave 2, the following challenges were identified as the biggest.
- Traceability of food products: 45%
- Written preventive controls: 30%
- Licencing: 16%
- Don't know/None of the above: 9%
In the most recent wave of surveys, traceability was still most likely to be considered the biggest challenge among businesses in the retail sector. Notably, businesses in the processor/manufacturer segment were split between traceability (37%) and written preventive controls (38%). The larger the company size, the greater the perceived challenge to have written preventive controls (only 22% for micro businesses compared to 41% for large businesses). These results are somewhat similar to those observed in Wave 1.
|
|
Industry Sector |
Company Size |
||||||
|
Total (n=500) |
Agriculture (n=99) |
Processor/Manufacturer (n=198) |
Wholesaler/Distributor (n=137) |
Retailer (n=66) |
Micro (n=98) |
Small (n=105) |
Medium (n=224) |
Large (n=70) |
Traceability of food products |
45% |
47% |
37% |
36% |
56%26 |
53% |
47% |
41% |
42% |
Written preventive controls |
30% |
30% |
38%26 |
36%26 |
21% |
22% |
23% |
36% |
41%26 |
Licencing |
16% |
16% |
19% |
18% |
12% |
15% |
15% |
18% |
14% |
Don’t know |
9% |
7% |
6% |
10% |
11% |
10% |
15%26 |
6% |
3% |
26 When data tables are presented, the asterisks indicate that the result is statistically significantly different from results in other columns.
|
|
|
Industry Sector |
Company Size |
||||||
|
|
Total (n=370) |
Agriculture (n=49) |
Processor/Manufacturer (n=170) |
Wholesaler/Distributor (n=87) |
Retailer (n=64) |
Micro (n=63) |
Small (n=90) |
Medium (n=179) |
Large (n=37) |
|
Traceability of food products |
42% |
24% |
36% |
50%27 |
52%27 |
35% |
42% |
44% |
45% |
|
Written preventive controls |
26% |
25% |
34%27 |
24% |
20% |
24% |
26% |
26% |
34% |
|
Licencing |
24% |
41%27 |
18% |
19% |
24% |
28% |
26% |
22% |
15% |
|
None of the above |
8% |
9% |
12%27 |
7% |
4% |
14% |
5% |
8% |
7% |
27 When data tables are presented, the asterisks indicate that the result is statistically significantly different from results in other columns.
From a regional perspective, traceability of food products was the most common challenge in all regions, especially among businesses in Quebec (54%) and in Ontario (49%). Written preventive controls was more likely to be a challenge among businesses in Atlantic Canada compared to businesses in other regions. In Wave 1, traceability was also the most common challenge in all regions, particularly in Quebec and Atlantic Canada.
|
|
|
Region |
|||
|
|
Total (n=500) |
Atlantic (n=47) |
Quebec (n=150) |
Ontario (n=134) |
West (n=169) |
|
Traceability of food products |
45% |
26% |
54%28 |
49%28 |
38% |
|
Written preventive controls |
30% |
51%28 |
27% |
26% |
35% |
|
Licencing |
16% |
16% |
10% |
16% |
19% |
|
Don’t know |
9% |
6% |
9% |
9% |
9% |
28 When data tables are presented, the asterisks indicate that the result is statistically significantly different from results in other columns.
|
|
|
Region |
|||
|
|
Total (n=370) |
Atlantic (n=40) |
Quebec (n=59) |
Ontario (n=106) |
West (n=165) |
|
Traceability of food products |
42% |
52%29 |
49%29 |
43% |
36% |
|
Written preventive controls |
26% |
26% |
33% |
22% |
28% |
|
Licencing |
24% |
13% |
13% |
29%29 |
25%29 |
|
None of the above |
8% |
9% |
6% |
7% |
11% |
29 When data tables are presented, the asterisks indicate that the result is statistically significantly different from results in other columns.
Contact with CFIA
Based on results from Wave 2, over 7 in 10 (73%) businesses that are not exclusively in retail have had some sort of contact with CFIA over the past 12 months. The most common interaction with CFIA over the past 12 months was looking for information about food safety regulations or requirements on the CFIA’s website (57%) while 42% claim to have been inspected, 34% contacted CFIA directly for information or technical advice on food safety regulations or regulatory interpretation, or requested a permission, licence, registration, or certificate from CFIA, and 33% contacted CFIA for information on (rather than requesting) a permission licence or certificate. Other results include:
- 27% searched for operational guidance using the Guidance Finder (which was not explored in Wave 1);
- 15% initiated a product recall either voluntarily or ordered.
These results are generally quite similar to those observed in Wave 1, except there are less businesses that have not looked for information from or had any personal contact with CFIA in the previous 12 months.
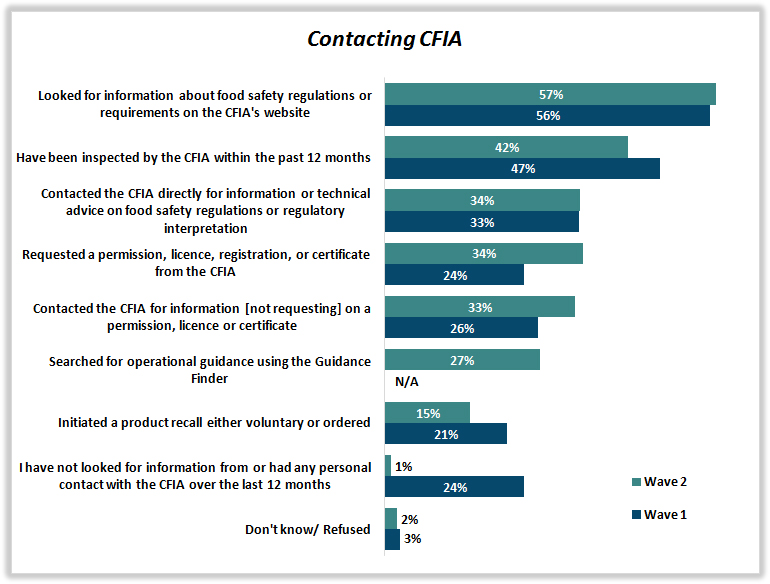
C1a: I will read several statements. Please tell me which activities apply to you or your business over the last 12 months. Base: Businesses not exclusively in retail, Wave 2, n=500, Wave 1, n=370.
A horizontal bar graph presents information of the most common interaction with CFIA over the past 12 months and what information businesses were looking for about food safety regulations or requirements on the CFIA's website. The graph shows a set of two bars for each source that represents both wave 1 and wave 2, with the following data:
For Wave 1, the following list presents the most common information businesses were looking for about food safety regulations or requirements on the CFIA's website.
- Looked for information about food safety regulations or requirements on the CFIA's website: 56%
- Have been inspected by the CFIA within the past 12 months: 47%
- Contacted the CFIA directly for information or technical advice on food safety regulations or regulatory interpretation: 33%
- Requested a permission, licence, registration, or certificate from the CFIA: 24%
- Contacted the CFIA for information [not requesting] on a permission, licence or certificate: 26%
- Searched for operational guidance using the Guidance Finder: N/A
- Initiated a product recall either voluntary or ordered: 21%
- I have not looked for information from or had any personal contact with the CFIA over the last 12 months: 24%
- Don't know/ Refused: 3%
For Wave 2, the following list presents the most common information businesses were looking for about food safety regulations or requirements on the CFIA's website.
- Looked for information about food safety regulations or requirements on the CFIA's website: 57%
- Have been inspected by the CFIA within the past 12 months: 42%
- Contacted the CFIA directly for information or technical advice on food safety regulations or regulatory interpretation: 34%
- Requested a permission, licence, registration, or certificate from the CFIA: 34%
- Contacted the CFIA for information [not requesting] on a permission, licence or certificate: 33%
- Searched for operational guidance using the Guidance Finder: 27%
- Initiated a product recall either voluntary or ordered: 15%
- I have not looked for information from or had any personal contact with the CFIA over the last 12 months: 1%
- Don't know/ Refused: 2%
The most recent survey results reveal that most of these activities or types of contact with CFIA are more common among businesses in the processor and manufacturer segment and many are also more common among those in the wholesaler and distributor segment. Businesses in the retail segment are the least likely to have contact with CFIA, except for searching for operational guidance using the Guidance Finder (34%). Results also show that product recalls are more common among businesses in the wholesale/distributor segment (24%).
As well, the larger the company, the more likely they are to contact CFIA in many ways, except for searching for operational guidance using the Guidance Finder which seems to be more popular among smaller companies.
|
|
|
Industry Sector |
Company Size |
||||||
|
|
Total (n=500) |
Agriculture (n=99) |
Processor/Manufacturer (n=198) |
Wholesaler/Distributor (n=137) |
Retailer (n=66) |
Micro (n=98) |
Small (n=105) |
Medium (n=224) |
Large (n=70) |
|
Looked for information about food safety regulations or requirements on the CFIA’s website |
57% |
59%30 |
77%30 |
63%30 |
38% |
41% |
51% |
61%30 |
79%30 |
|
Have been inspected by CFIA within the past 12 months |
42% |
44% |
53%30 |
42% |
33% |
28% |
30% |
49%30 |
63%30 |
|
Requested a permission, licence, registration, or certificate from CFIA |
34% |
44%30 |
50%30 |
40%30 |
15% |
12% |
29%30 |
40%30 |
61%30 |
|
Contacted CFIA directly for information or technical advice on food safety regulations or regulatory interpretation |
34% |
34%30 |
51%30 |
36%30 |
19% |
27% |
26% |
37% |
47%30 |
|
Contacted CFIA for information [not requesting] on a permission, licence or certificate |
33% |
33%30 |
49%30 |
35%30 |
19% |
19% |
23% |
42%30 |
46%30 |
|
Searched for operational guidance using the Guidance Finder |
27% |
29% |
18% |
24% |
34%30 |
32%30 |
34%30 |
23% |
14% |
|
I have not looked for information from or had any personal contact with CFIA over the last 12 months |
1% |
- |
1% |
2% |
- |
2% |
- |
1% |
- |
|
Initiated a product recall either voluntary or ordered |
15% |
8% |
8% |
24%30 |
16% |
11% |
12% |
15% |
23% |
|
Don’t know/ Refused |
2% |
2% |
1% |
2% |
4% |
|
3% |
1% |
6% |
30 When data tables are presented, the asterisks indicate that the result is statistically significantly different from results in other columns.
|
|
|
Industry Sector |
Company Size |
||||||
|
|
Total (n=370) |
Agriculture (n=49) |
Processor/Manufacturer (n=170) |
Wholesaler/Distributor (n=87) |
Retailer (n=64) |
Micro (n=63) |
Small (n=90) |
Medium (n=179) |
Large (n=37) |
|
Looked for information about food safety regulations or requirements on the CFIA’s website |
56% |
45% |
74%31 |
61%31 |
35% |
40% |
48% |
61%31 |
91%31 |
|
Have been inspected by CFIA within the past 12 months |
47% |
33% |
59%31 |
50%31 |
40% |
22% |
46%31 |
55%31 |
70%31 |
|
Contacted CFIA directly for information or technical advice on food safety regulations or regulatory interpretation |
33% |
26% |
53%31 |
28% |
19% |
18% |
26% |
38%31 |
71%31 |
|
Contacted CFIA for information [not requesting] on a permission, licence or certificate |
26% |
21% |
39%31 |
28%31 |
12% |
8% |
24%31 |
32%31 |
47%31 |
|
Requested a permission, licence, registration, or certificate from CFIA |
24% |
23% |
36%31 |
19% |
14% |
9% |
18% |
29%31 |
54%31 |
|
Initiated a product recall either voluntary or ordered |
21% |
13% |
12% |
33%31 |
25%31 |
14% |
26%31 |
22% |
19% |
|
I have not looked for information from or had any personal contact with CFIA over the last 12 months |
24% |
40%31 |
16% |
18% |
31%31 |
48%31 |
21%31 |
19%31 |
7% |
|
Don’t know/ Refused |
3% |
2% |
- |
2% |
7% |
4% |
4% |
2% |
- |
31 When data tables are presented, the asterisks indicate that the result is statistically significantly different from results in other columns.
From a regional perspective, contact with CFIA is particularly high among businesses in Atlantic Canada. Businesses not exclusively in retail in Ontario and Western Canada are also more likely to have looked for information about food safety regulations or requirements on CFIA’s website.
What is also noteworthy about the extent of contact among businesses in Atlantic Canada is that the incidence of all forms of contact, except recalls and the use of the Guidance Finder, was noticeably higher among these businesses, especially the incidence of inspections, which was noted by 73% of these businesses.
All these results align with what was observed in Wave 1.
|
|
|
Region |
|||
|
|
Total (n=500) |
Atlantic (n=47) |
Quebec (n=150) |
Ontario (n=134) |
West (n=169) |
|
Looked for information about food safety regulations or requirements on the CFIA’s website |
57% |
70%32 |
43% |
61%32 |
58%32 |
|
Have been inspected by CFIA within the past 12 months |
42% |
73%32 |
36% |
43% |
38% |
|
Requested a permission, licence, registration, or certificate from CFIA |
34% |
45%32 |
25% |
38% |
33% |
|
Contacted CFIA directly for information or technical advice on food safety regulations or regulatory interpretation |
34% |
57%32 |
33% |
33% |
30% |
|
Contacted CFIA for information [not requesting] on a permission, licence or certificate |
33% |
56%32 |
29% |
35% |
27% |
|
Searched for operational guidance using the Guidance Finder |
27% |
11% |
39%32 |
23% |
26%32 |
|
I have not looked for information from or had any personal contact with CFIA over the last 12 months |
1% |
- |
- |
1% |
1% |
|
Initiated a product recall either voluntary or ordered |
15% |
19% |
10% |
17% |
14% |
|
Don’t know/ Refused |
2% |
7% |
2% |
- |
4% |
32 When data tables are presented, the asterisks indicate that the result is statistically significantly different from results in other columns.
|
|
|
Region |
|||
|
|
Total (n=370) |
Atlantic (n=40) |
Quebec (n=59) |
Ontario (n=106) |
West (n=165) |
|
Looked for information about food safety regulations or requirements on the CFIA’s website |
56% |
68%33 |
43% |
64%33 |
51% |
|
Have been inspected by CFIA within the past 12 months |
47% |
87%33 |
39% |
48% |
43% |
|
Contacted CFIA directly for information or technical advice on food safety regulations or regulatory interpretation |
33% |
59%33 |
24% |
33% |
34% |
|
Contacted CFIA for information [not requesting] on a permission, licence or certificate |
26% |
43%33 |
17% |
27% |
27% |
|
Requested a permission, licence, registration, or certificate from CFIA |
24% |
63%33 |
22% |
21% |
22% |
|
Initiated a product recall either voluntary or ordered |
21% |
19% |
14% |
24% |
21% |
|
I have not looked for information from or had any personal contact with CFIA over the last 12 months |
24% |
2% |
38%33 |
20%33 |
27%33 |
|
Don’t know/ Refused |
3% |
- |
3% |
2% |
3% |
33 When data tables are presented, the asterisks indicate that the result is statistically significantly different from results in other columns.
Additional analysis does in fact reveal that businesses that were inspected over the past 12 months were significantly more likely to have undertaken the other activities, as seen in the tables below. This seems to suggest that the likelihood of contacting CFIA is in large part determined by whether or not a company gets inspected.
|
Was Inspected by CFIA Within the Past 12 Months |
|
|
Yes (n=219) |
No (n=281) |
Looked for information about food safety regulations or requirements on the CFIA’s website |
74%34 |
45% |
Have been inspected by CFIA within the past 12 months |
100% |
- |
Requested a permission, licence, registration, or certificate from CFIA |
56%34 |
19% |
Contacted CFIA directly for information or technical advice on food safety regulations or regulatory interpretation |
54%34 |
19% |
Contacted CFIA for information [not requesting] on a permission, licence or certificate |
55%34 |
17% |
Searched for operational guidance using the Guidance Finder |
4% |
43%34 |
I have not looked for information from or had any personal contact with CFIA over the last 12 months |
- |
1% |
Initiated a product recall either voluntary or ordered |
17% |
13% |
Don’t know |
- |
4% |
34 When data tables are presented, the asterisks indicate that the result is statistically significantly different from results in other columns.
|
|
Was Inspected by CFIA Within the Past 12 Months |
|
|
|
Yes (n=189) |
No (n=181) |
|
Looked for information about food safety regulations or requirements on the CFIA’s website |
74%35 |
40% |
|
Have been inspected by CFIA within the past 12 months |
100% |
- |
|
Contacted CFIA directly for information or technical advice on food safety regulations or regulatory interpretation |
53%35 |
15% |
|
Contacted CFIA for information [not requesting] on a permission, licence or certificate |
44%35 |
11% |
|
Requested a permission, licence, registration, or certificate from CFIA |
43%35 |
7% 15% |
|
Initiated a product recall either voluntary or ordered |
27%35 |
|
|
I have not looked for information from or had any personal contact with CFIA over the last 12 months |
- |
46%35 |
|
Don’t know/ Refused |
- |
5% |
35 When data tables are presented, the asterisks indicate that the result is statistically significantly different from results in other columns.
Businesses not exclusively in retail having contacted CFIA over the past 12 months most often did so through the CFIA website (63%), followed by contacting CFIA by phone (48%), or by email (48%). A smaller proportion contacted CFIA in person (21%) and only a few did so via social media (1%). These results suggest that businesses in general are using multiple channels to contact CFIA. The preference order of ways to contact CFIA remained similar from Wave 1 to Wave 2, although the proportion of those using the CFIA website, phone, and email is higher in Wave 2, while contacting CFIA in person was slightly less common in Wave 2. The use of webinars was only asked in Wave 2.
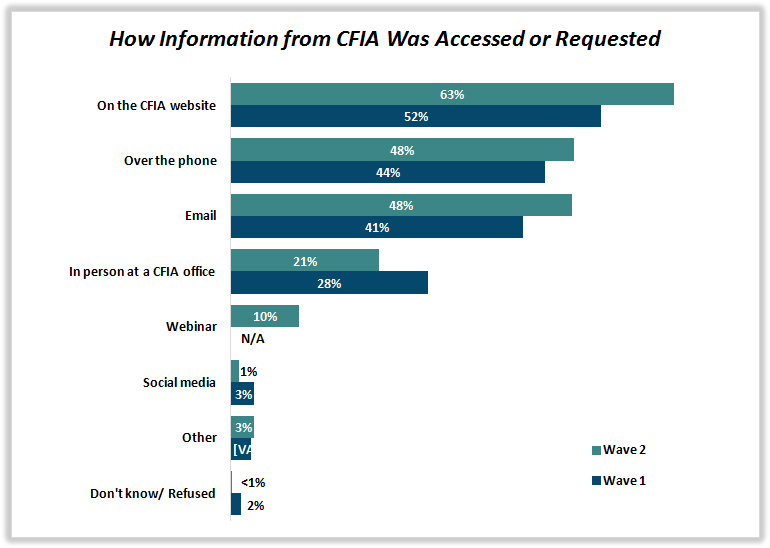
C1: You stated that you contacted the CFIA for information or a service. How did you access or request the service or information from the CFIA? Was it… Base: Businesses not exclusively in retail that had an interaction with CFIA, Wave 2, n=348, Wave 1, n=248.
A horizontal bar graph presents how information was accessed or requested from the CFIA for businesses not exclusively in retail over the past 12 months. The graph shows a set of two bars for each source that represents both wave 1 and wave 2, with the following data:
For Wave 1, the following list presents how information was accessed or requested from the CFIA:
- On the CFIA website: 52%
- Over the phone: 44%
- Email: 41%
- In person at a CFIA office: 28%
- Webinar: N/A
- Social media: 3%
- Other: 3%
- Don't know/ Refused: 2%
For Wave 2, the following list presents how information was accessed or requested from the CFIA:
- On the CFIA website: 63%
- Over the phone: 48%
- Email: 48%
- In person at a CFIA office: 21%
- Webinar: 10%
- Social media: 1%
- Other: 3%
- Don't know/ Refused: 1%
Retailers are the most likely to contact CFIA via the website whereas processors and manufacturers are more likely to use the telephone, contact CFIA in person, or participate in a webinar. Small companies are also more likely to contact CFIA via the website, while medium companies would use email, contact in person or use a webinar, and large companies are most likely to contact CFIA over the phone and are relatively more likely to access a webinar.
|
|
|
Industry Sector |
Company Size |
||||||
|
|
Total (n=348) |
Agriculture (n=64) |
Processor/Manufacturer (n=157) |
Wholesaler/Distributor (n=95) |
Retailer (n=32) |
Micro (n=53) |
Small (n=61) |
Medium (n=168) |
Large (n=64) |
|
On the CFIA website |
63% |
57% |
57% |
56% |
79%36 |
62% |
77%36 |
56% |
64% |
|
Over the phone |
48% |
45% |
58%36 |
49% |
37% |
39% |
38% |
48% |
70%36 |
|
|
48% |
48% |
55% |
47% |
41% |
30% |
51% |
53%36 |
51% |
|
In person |
21% |
20% |
29%36 |
14% |
17% |
11% |
15% |
28%36 |
20% |
|
Webinar |
10% |
8% |
18%36 |
8% |
2% |
3% |
1% |
13%36 |
18%36 |
|
Social media |
1% |
4% |
1% |
2% |
- |
- |
2% |
2% |
- |
|
Other |
3% |
4% |
4% |
5% |
- |
4% |
1% |
2% |
9% |
|
Don’t know/ Refused |
<1% |
- |
- |
1% |
- |
- |
- |
<1% |
- |
36 When data tables are presented, the asterisks indicate that the result is statistically significantly different from results in other columns.
|
|
|
Industry Sector |
Company Size |
||||||
|
|
Total (n=248) |
Agriculture (n=26) |
Processor/Manufacturer (n=140) |
Wholesaler/Distributor (n=57) |
Retailer (n=25) |
Micro (n=25) |
Small (n=54) |
Medium (n=133) |
Large (n=35) |
|
On the CFIA website |
52% |
55% |
41% |
64%37 |
58% |
55% |
54% |
48% |
59% |
|
Over the phone |
44% |
61%37 |
44% |
45% |
31% |
39% |
46% |
43% |
52% |
|
|
41% |
33% |
48% |
40% |
34% |
23% |
38% |
46%37 |
50%37 |
|
In person |
28% |
43%37 |
33%37 |
14% |
26% |
21% |
24% |
28% |
45%37 |
|
Social media |
3% |
- |
1% |
4% |
10% |
7% |
3% |
3% |
2% |
|
Other |
3% |
3% |
4% |
2% |
- |
3% |
3% |
3% |
- |
|
Don’t know/ Refused |
1% |
- |
1% |
4% |
- |
- |
- |
3% |
- |
37 When data tables are presented, the asterisks indicate that the result is statistically significantly different from results in other columns.
Regionally, contact over the phone or email is more likely to happen in Atlantic Canada compared to other regions. Other results reveal that Quebec businesses report using the website more frequently businesses in other regions of the CFIA website and are also more likely to go to a CFIA office.
|
|
|
Region |
|||
|
|
Total (n=348) |
Atlantic (n=37) |
Quebec (n=84) |
Ontario (n=99) |
West (n=128) |
|
On the CFIA website |
63% |
45% |
68%38 |
63% |
62% |
|
Over the phone |
48% |
68%38 |
41% |
47% |
50% |
|
|
48% |
71%38 |
50% |
43% |
48% |
|
In person at a CFIA office |
21% |
24% |
31%38 |
19% |
17% |
|
Webinar |
10% |
8% |
13% |
11% |
7% |
|
Social media |
1% |
- |
- |
2% |
1% |
|
Other |
3% |
- |
8% |
2% |
3% |
|
Don’t know/ Refused |
<1% |
- |
- |
- |
1% |
38 When data tables are presented, the asterisks indicate that the result is statistically significantly different from results in other columns.
|
|
|
Region |
|||
|
|
Total (n=248) |
Atlantic (n=34) |
Quebec (n=30) |
Ontario (n=78) |
West (n=106) |
|
On the CFIA website |
52% |
46% |
34% |
62%39 |
47% |
|
Over the phone |
44% |
51% |
37% |
41% |
50% |
|
|
41% |
46% |
46% |
32% |
51%39 |
|
In person |
28% |
54%39 |
19% |
25% |
28% |
|
Social media |
3% |
9%39 |
4% |
3% |
2% |
|
Other |
3% |
4% |
2% |
3% |
2% |
|
Don’t know/ Refused |
1% |
- |
- |
2% |
1% |
39 When data tables are presented, the asterisks indicate that the result is statistically significantly different from results in other columns.
In Wave 2, businesses were asked to rate the helpfulness of the CFIA website. Half find the website very helpful, giving it a score of 6 or 7. An additional 34% rate the website somewhat helpful (rating of 4 or 5), and 10% found it was not helpful.
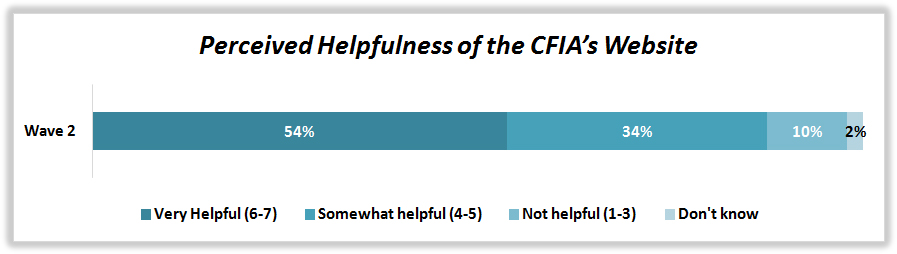
QC1B: To what extent was the information on the CFIA’s website useful in helping you find the information you were looking for? Base: Businesses that have used the CFIA website, Wave 2, n=239.
The chart presenting the ratings of businesses on the perceived helpfulness of the CFIA’s website in wave 2 infers the following data: Very helpful (6 to 7)- 54 percent, Somewhat helpful (4 to 5)- 34 percent, Not very helpful (1 to 3)- 10 percent, and Don’t know- 2 percent.
Retailers, the largest reported users of the website, are the most likely to find it very helpful, while businesses in the agriculture, processor or manufacturer, wholesaler or distributor sectors find it somewhat helpful. Large businesses rate the website somewhat helpful as well. Micro businesses are more likely to find the website not useful. Regionally, businesses in Quebec and Ontario are more likely to find the website useful.
|
|
|
Industry Sector |
Company Size |
||||||
|
|
Total (n=239) |
Agriculture (n=40) |
Processor/Manufacturer (n=102) |
Wholesaler/Distributor (n=57) |
Retailer (n=40) |
Micro (n=38) |
Small (n=31) |
Medium (n=109) |
Large (n=39) |
|
CFIA website |
|||||||||
|
Very helpful (6-7) |
54% |
40% |
52% |
43% |
63%40 |
51% |
51% |
59% |
49% |
|
Somewhat helpful (4-5) |
34% |
53%40 |
40%40 |
43%40 |
21% |
19% |
39% |
32% |
49%40 |
|
Not very helpful (1-3) |
10% |
7% |
7% |
14% |
12% |
21%40 |
10% |
8% |
2% |
|
Don’t know |
2% |
- |
1% |
- |
4% |
9% |
- |
1% |
- |
40 When data tables are presented, the asterisks indicate that the result is statistically significantly different from results in other columns.
|
|
Region |
||||
|
|
Total (n=239) |
Atlantic (n=17) |
Quebec (n=71) |
Ontario (n=69) |
West (n=82) |
|
CFIA website |
|||||
|
Very helpful (6-7) |
54% |
27% |
60%41 |
64%41 |
38% |
|
Somewhat helpful (4-5) |
34% |
54% |
27% |
30% |
42% |
|
Not very helpful (1-3) |
10% |
18% |
9% |
7% |
16% |
|
Don’t know |
2% |
- |
4% |
- |
4% |
41 When data tables are presented, the asterisks indicate that the result is statistically significantly different from results in other columns.
Website users were asked to suggest what could be done to CFIA’s inspection.gc.ca site to improve it. The main suggestions included making it easier to navigate and more user-friendly (21%) and providing clearer information (17%). Other suggestions, which also speak to navigation and being user-friendly, included providing more accessible information (10%) and simplifying the website (7%). Nearly two in five (39%) did not have any suggestions while 14% added that they are satisfied with the site as-is.
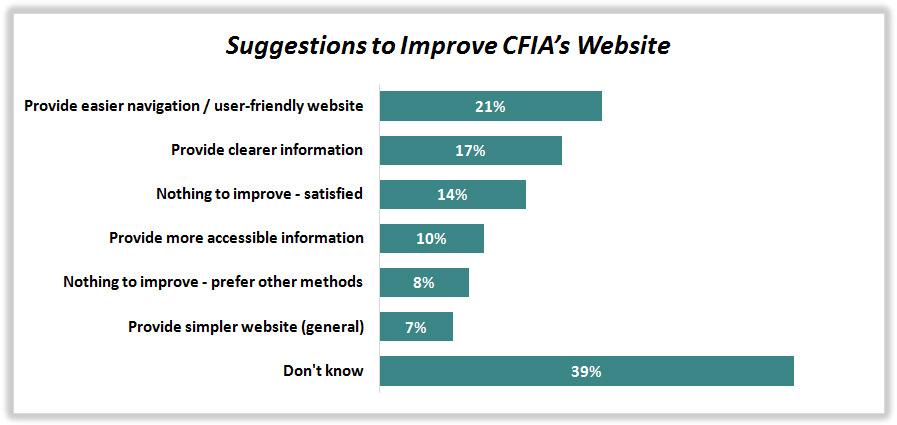
C1c. How could the CFIA improve their website? Base: Businesses that have used the CFIA website, Wave 2: n=239.
The horizontal bar graph presenting the suggestions of the users that need to be done to improve the CFIA’s website infers the following data: Provide easier navigation/user-friendly website- 21 percent, Provide clearer information- 17 percent, Nothing to improve-satisfied- 14 percent, Provide more accessible information- 10 percent, Nothing to improve- prefer other methods- 8 percent, Provide simpler website (general)- 7 percent, and Don’t know- 39 percent.
Respondents were also asked to rate the helpfulness of the Agency’s email, phone, and in-person service when contacting CFIA for information. Nearly three quarters (75%) of those who contacted CFIA by phone found the support very useful and an additional 20% found it somewhat useful. Nearly two thirds (64%) of those who used email to contact CFIA found it very useful, and 28% somewhat useful. Of those who contacted CFIA in person, 54% found the information very useful and 15% found it somewhat useful. However, 30% did not know how to rate the service received.
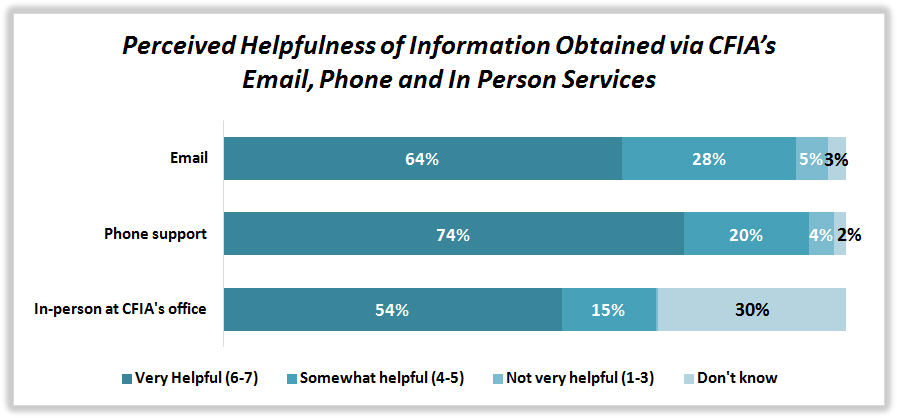
C1D. To what extent was the information provided by email useful in helping you find the information you were looking for? Base: Respondents who have contacted the CFIA by email, Wave 2: n=194. C1E. To what extent was the information provided by phone useful in helping you find the information you were looking for? Base: Respondents who have contacted the CFIA by phone, Wave 2: n=201. C1F. To what extent was the information obtained in person at a CFIA office useful in helping you find the information you were looking for? Base: Respondents who have contacted the CFIA in person, Wave 2: n=88.
The stacked horizontal bar graph depicts the ratings of the respondents on the helpfulness of information obtained via email, phone, and in person services of CFIA. The graph shows a set of four bars incorporated with each source of information representing very helpful (6 to 7), somewhat helpful (4 to 5), not very helpful (1 to 3), and don’t know, and which infers the following data: Email- 64, 28, 5, and 3; Phone support- 74, 20, 4, and 2; In-person at CFIA’s office- 54, 15, 0, and 30.
Results by various business segments suggest that the perceived helpfulness of email information is similar across all business verticals and sizes. Results are presented in the tables below however caution is warranted since many results are based on small sample sizes.
|
|
|
Industry Sector |
Company Size |
||||||
|
|
Total (n=194) |
Agriculture (n=35) |
Processor/Manufacturer (n=89) |
Wholesaler/Distributor (n=45) |
Retailer (n=25) |
Micro (n=20) |
Small (n=37) |
Medium (n=98) |
Large (n=37) |
|
CFIA Email |
|||||||||
|
Very helpful (6-7) |
64% |
75% |
70% |
70% |
51% |
74% |
56% |
66% |
65% |
|
Somewhat helpful (4-5) |
28% |
18% |
24% |
25% |
39% |
15% |
32% |
28% |
35% |
|
Not very helpful (1-3) |
5% |
7% |
4% |
5% |
4% |
4% |
7% |
5% |
- |
|
Don’t know |
3% |
- |
2% |
- |
6% |
8% |
5% |
1% |
- |
|
|
Region |
||||
|
|
Total (n=194) |
Atlantic (n=25) |
Quebec (n=49) |
Ontario (n=47) |
West (n=73) |
|
CFIA Email |
|||||
|
Very helpful (6-7) |
64% |
87%42 |
53% |
71% |
58% |
|
Somewhat helpful (4-5) |
28% |
2% |
34%42 |
24%42 |
37%42 |
|
Not very helpful (1-3) |
5% |
10% |
1% |
5% |
5% |
|
Don’t know |
3% |
- |
11%42 |
- |
1% |
42 When data tables are presented, the asterisks indicate that the result is statistically significantly different from results in other columns.
|
|
|
Industry Sector |
Company Size |
||||||
|
|
Total (n=201) |
Agriculture (n=30) |
Processor/Manufacturer (n=95) |
Wholesaler/Distributor (n=46) |
Retailer (n=30) |
Micro (n=30) |
Small (n=33) |
Medium (n=94) |
Large (n=43) |
|
CFIA Phone Support |
|||||||||
|
Very helpful (6-7) |
74% |
63% |
81% |
68% |
73% |
93%43 |
62% |
72% |
67% |
|
Somewhat helpful (4-5) |
20% |
21% |
12% |
24% |
24% |
1% |
34%43 |
23%43 |
23%43 |
|
Not very helpful (1-3) |
4% |
10% |
7% |
7% |
- |
1% |
5% |
4% |
8% |
|
Don’t know |
2% |
5% |
- |
2% |
3% |
4% |
- |
1% |
3% |
43 When data tables are presented, the asterisks indicate that the result is statistically significantly different from results in other columns.
|
|
Region |
||||
|
|
Total (n=201) |
Atlantic (n=28) |
Quebec (n=48) |
Ontario (n=54) |
West (n=71) |
|
CFIA Phone Support |
|||||
|
Very helpful (6-7) |
74% |
90%44 |
83% |
68% |
71% |
|
Somewhat helpful (4-5) |
20% |
4% |
11% |
23%44 |
26%44 |
|
Not very helpful (1-3) |
4% |
6% |
2% |
7% |
2% |
|
Don’t know |
2% |
- |
5% |
1% |
1% |
44 When data tables are presented, the asterisks indicate that the result is statistically significantly different from results in other columns.
Businesses were asked to indicate how they would prefer to request and receive regulatory information from CFIA. The preferred method by far is email, as indicated by 78% of respondents, followed by phone at 47% and a live customer service-based chat on the CFIA website (35%). Just over a quarter (27%) prefer using a chatbot (27%) and 15% mentioned social media (15%). Very few prefer mail (7%) and in person (4%).
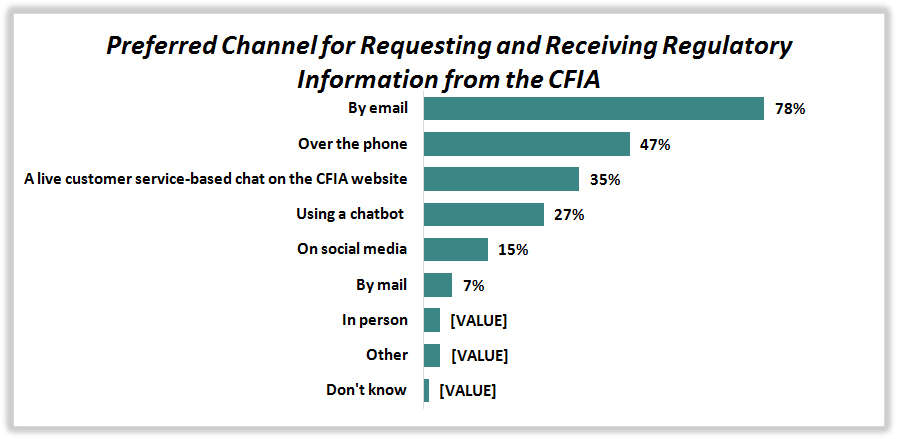
QC1G: How would you prefer to request and receive regulatory information from the CFIA? Base: All Respondents Wave 2, n=700.
The horizontal bar graph presenting the preferred channel of the businesses for requesting and receiving regulatory information from the CFIA infers the following data: By email- 78 percent, Over the phone- 47 percent, A live customer service-based chat on the CFIA website- 35 percent, Using a chatbot- 27 percent, On social media- 15 percent, By email- 7 percent, In person- 4 percent, Other- 4 percent, and Don’t know- 1 percent.
Businesses in the processor or manufacturer sector are more likely to say they prefer to request and receive regulatory information from CFIA through a live customer service-based chat on the CFIA website, or in person, compared to businesses in other sectors (although by email is the most popular channel for this segment, just as it is for every other segment). Compared to a few other sectors, retailers are more likely to prefer receiving this information by mail. In terms of company size, medium and large businesses are more likely to prefer receiving this information by email, while micro companies are more likely to prefer regular mail.
|
|
|
Industry Sector |
Company Size |
||||||
|
|
Total (n=700) |
Agriculture (n=115) |
Processor/Manufacturer (n=227) |
Wholesaler/Distributor (n=146) |
Retailer (n=212) |
Micro (n=168) |
Small (n=168) |
Medium (n=290) |
Large (n=71) |
|
By Email |
78% |
84% |
83% |
78% |
75% |
66% |
75% |
85%45 |
93%45 |
|
Over the phone |
47% |
51% |
49% |
52% |
44% |
46% |
46% |
48% |
52% |
|
Live customer service-based chat on the CFIA website |
35% |
38% |
48%45 |
35% |
32% |
33% |
30% |
38% |
46% |
|
Using a chatbot |
27% |
27% |
30% |
22% |
28% |
26% |
29% |
26% |
35% |
|
Social media |
15% |
11% |
10% |
11% |
17% |
18% |
14% |
15% |
7% |
|
By mail |
7% |
7% |
6% |
3% |
8%45 |
13%45 |
5% |
4% |
3% |
|
In person |
4% |
3% |
7%45 |
1% |
3% |
2% |
6% |
3% |
5% |
|
Other |
4% |
3% |
2% |
2% |
5% |
5% |
4% |
4% |
3% |
|
Don’t know |
1% |
|
|
2% |
2% |
1% |
1% |
2% |
|
45 When data tables are presented, the asterisks indicate that the result is statistically significantly different from results in other columns.
From a regional perspective, businesses in Atlantic Canada are the most likely to prefer receiving regulatory information over the phone, while those in Quebec lean towards using a chatbot or social media. Social media is also relatively more popular in Ontario compared to a few other regions.
|
|
Region |
||||
|
|
Total (n=700) |
Atlantic (n=66) |
Quebec (n=221) |
Ontario (n=171) |
West (n=242) |
|
By Email |
78% |
84% |
76% |
79% |
76% |
|
Over the phone |
47% |
62%46 |
50% |
42% |
46% |
|
Live customer service-based chat on the CFIA website |
35% |
31% |
38% |
37% |
33% |
|
Using a chatbot |
27% |
15% |
36%46 |
27% |
25% |
|
Social media |
15% |
5% |
19%46 |
17%46 |
12% |
|
By mail |
7% |
4% |
5% |
7% |
8% |
|
In person |
4% |
1% |
3% |
5% |
3% |
|
Other |
4% |
2% |
5% |
4% |
4% |
|
Don’t know |
1% |
3% |
1% |
<1% |
2% |
46 When data tables are presented, the asterisks indicate that the result is statistically significantly different from results in other columns.
When asked how they would prefer to receive CFIA services, 74% of businesses prefer to receive them by email, 52% on the CFIA website, 25% prefer to go to a CFIA office and receive them in person, and less than one fifth prefer to receive them by fax (17%), mail (10%), on social media (8%), or by phone (6%).
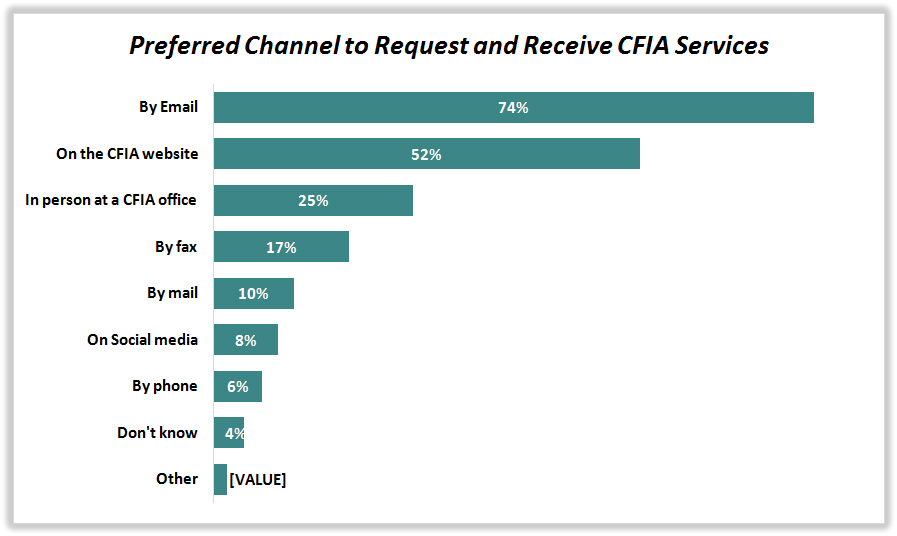
QC1H: How would you prefer to request and receive CFIA services, such as food licenses or export certificates? Base: All Respondents Wave 2, n=700.
The horizontal bar graph presenting the preferred channel of the businesses for requesting and receiving services from the CFIA infers the following data: By email- 74 percent, On the CFIA website- 52 percent, In person at a CFIA office- 25 percent, By fax- 17 percent, By mail- 10 percent, On social media- 8 percent, By phone- 6 percent, Don’t know- 4 percent, and Other- 2 percent.
Businesses in the processor/manufacturer sector are the most likely to prefer receiving CFIA services by email, on the CFIA website, or in person at a CFIA office, while retailers are the most likely to prefer receiving services by mail. In terms of company size, large companies are more likely to prefer email and the CFIA website. Medium size businesses are also more likely to prefer email, while regular mail is more likely to be popular among micro businesses compared to larger businesses.
|
|
|
Industry Sector |
Company Size |
||||||
|
|
Total (n=700) |
Agriculture (n=115) |
Processor/Manufacturer (n=227) |
Wholesaler/Distributor (n=146) |
Retailer (n=212) |
Micro (n=168) |
Small (n=168) |
Medium (n=290) |
Large (n=71) |
|
By Email |
74% |
79% |
80%47 |
79% |
71% |
63% |
74% |
79%47 |
89%47 |
|
On the CFIA website |
52% |
47% |
62%47 |
55% |
50% |
46% |
48% |
56% |
71%47 |
|
In person at a CFIA office |
25% |
24% |
32%47 |
21% |
23% |
24% |
22% |
25% |
30% |
|
By fax |
17% |
22% |
16% |
20% |
15% |
16% |
18% |
17% |
13% |
|
By mail |
10% |
3% |
6% |
4% |
13%47 |
19%47 |
8% |
7% |
- |
|
On Social media |
8% |
9% |
7% |
6% |
9% |
8% |
10% |
7% |
6% |
|
By phone |
6% |
6% |
4% |
4% |
7% |
8% |
5% |
7% |
2% |
|
Other |
2% |
- |
2% |
2% |
2% |
|
3% |
2% |
- |
|
Don’t know |
4% |
3% |
<1% |
4% |
5%47 |
5% |
5% |
3% |
3% |
47 When data tables are presented, the asterisks indicate that the result is statistically significantly different from results in other columns.
Businesses in Western Canada are the most likely to prefer receiving CFIA services by regular mail, while those in Ontario and Quebec are the most likely to prefer social media.
|
|
Region |
||||
|
|
Total (n=700) |
Atlantic (n=66) |
Quebec (n=221) |
Ontario (n=171) |
West (n=242) |
|
By Email |
74% |
77% |
72% |
78% |
71% |
|
On the CFIA website |
52% |
39% |
50% |
55% |
54% |
|
In person at a CFIA office |
25% |
25% |
27% |
24% |
23% |
|
By fax |
17% |
24% |
13% |
17% |
17% |
|
By mail |
10% |
10% |
6% |
9% |
13%48 |
|
On Social media |
8% |
1% |
11%48 |
10%48 |
6% |
|
By phone |
6% |
11% |
4% |
7% |
5% |
|
Other |
2% |
- |
2% |
3% |
<1% |
|
Don’t know |
4% |
7% |
5%48 |
1% |
5%48 |
48 When data tables are presented, the asterisks indicate that the result is statistically significantly different from results in other columns.
General Impressions of CFIA
Roughly half of businesses strongly agree that CFIA is fair when inspecting food businesses (54%), that it provides enough information to meet regulatory obligations (52%), and that the information from CFIA arrives in a timely manner (48%). Agreement drops slightly to 40% when asked if it is easy to understand the information CFIA provides to food businesses. Between 8% and 15% of businesses did not know enough about CFIA to be able to rate them across these specific dimensions and about one in ten seem to disagree with each evaluation criteria. Results from Wave 1 are similar to those obtained in Wave 2, although there is an extra dimension tested in Wave 1.
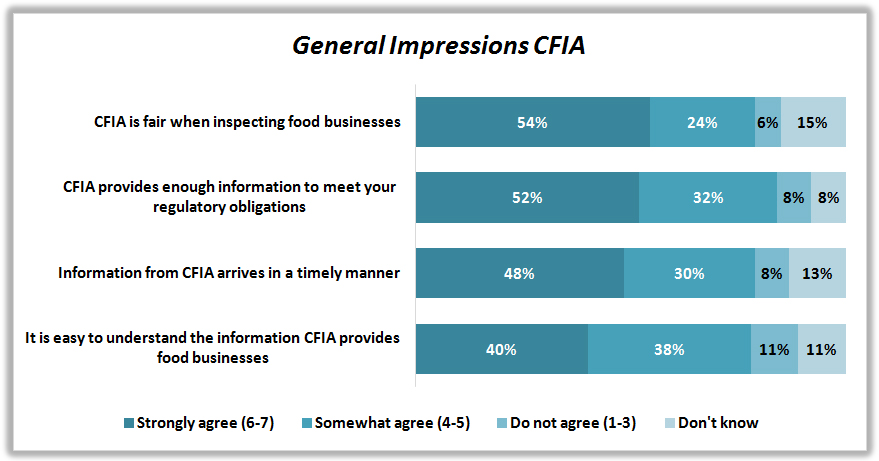
C2: On a scale of 1 to 7, where 1 means “do not agree at all” and 7 means “strongly agree”, based on your general impressions of the CFIA, how would you rate the following statements about the CFIA? Base: Businesses not exclusively in retail, Wave 2 n=500.
The stacked horizontal bar graph presents the general impressions of the businesses in wave 2 when asked about the CFIA’s inspection on food businesses. The graph shows a set of four bars incorporated with each impression representing Strongly agree (6 to 7), somewhat agree (4 to 5), do not agree (1 to 3), and don’t know, and which infers the following data: CFIA is fair when inspecting food businesses- 54, 24, 6, and 15; CFIA provides enough information to meet your regulatory obligations- 52, 32, 8, and 8; Information from CFIA arrives in a timely manner- 48, 30, 8, and 13; It is easy to understand the information CFIA provides food businesses- 40, 38, 11, and 11.
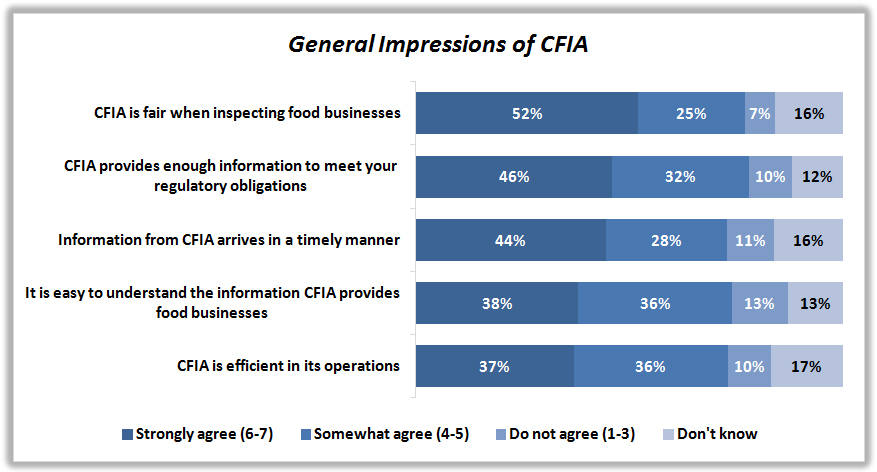
C2: On a scale of 1 to 7, where 1 means “do not agree at all” and 7 means “strongly agree”, based on your general impressions of the CFIA, how would you rate the following statements about the CFIA? (Efficiency in operations was asked only in Wave 1). Base: Businesses not exclusively in retail, Wave 1 n=370.
The stacked horizontal bar graph presents the general impressions of the businesses in wave 1 when asked about the CFIA’s inspection on food businesses. The graph shows a set of four bars incorporated with each impression representing Strongly agree (6 to 7), somewhat agree (4 to 5), do not agree (1 to 3), and don’t know, and which infers the following data: CFIA is fair when inspecting food businesses- 52, 25, 7, and 16; CFIA provides enough information to meet your regulatory obligations- 46, 32, 10, and 12; Information from CFIA arrives in a timely manner- 44, 28, 11, and 16; It is easy to understand the information CFIA provides food businesses- 38, 36, 13, and 13; CFIA is efficient in its operations- 37, 36, 10, and 17.
Respondents who have been inspected by CFIA and those who have been in contact with CFIA over the past 12 months are more likely to agree with all statements compared to those who have not been inspected by or have not been in contact with CFIA. This is observed in both research waves.
|
|
|
Was Inspected by the CFIA Within the Past 12 Months |
Had Contact with CFIA Within the Past 12 Months |
||
|
|
Total (n=500) |
Yes (n=219) |
No (n=281) |
Yes (n=348) |
No (n=152) |
|
CFIA is fair when inspecting food businesses |
|||||
|
Strongly agree (6-7) |
54% |
73%49 |
41% |
62%49 |
40% |
|
Somewhat agree (4-5) |
24% |
20% |
27% |
22% |
29% |
|
Do not agree (1-3) |
6% |
6% |
6% |
5% |
8% |
|
Don’t know |
15% |
1% |
25%49 |
11% |
23%49 |
|
It is easy to understand the information CFIA provides food businesses |
|||||
|
Strongly agree (6-7) |
40% |
50%49 |
32% |
45%49 |
29% |
|
Somewhat agree (4-5) |
38% |
36% |
40% |
43%49 |
30% |
|
Do not agree (1-3) |
11% |
12% |
11% |
10% |
14% |
|
Don’t know |
11% |
2% |
17%49 |
2% |
26%49 |
|
CFIA provides enough information to meet your regulatory obligations |
|||||
|
Strongly agree (6-7) |
52% |
61%49 |
45% |
61%49 |
59% |
|
Somewhat agree (4-5) |
32% |
32% |
33% |
31% |
20% |
|
Do not agree (1-3) |
8% |
7% |
8% |
6% |
21% |
|
Don’t know |
8% |
- |
14%49 |
2% |
-49 |
|
Information from CFIA arrives in a timely manner |
|||||
|
Strongly agree (6-7) |
48% |
54%49 |
43% |
57%49 |
30% |
|
Somewhat agree (4-5) |
30% |
34% |
28% |
31% |
29% |
|
Do not agree (1-3) |
8% |
8% |
9% |
7% |
11% |
|
Don’t know |
13% |
4% |
20%49 |
5% |
29%49 |
49 When data tables are presented, the asterisks indicate that the result is statistically significantly different from results in other columns.
|
|
|
Was Inspected by CFIA Within the Past 12 Months |
Had Contact with CFIA Within the Past 12 Months |
||
|
|
Total (n=370) |
Yes (n=189) |
No (n=181) |
Yes (n=281) |
No (n=82) |
|
CFIA is fair when inspecting food businesses |
|||||
|
Strongly agree (6-7) |
52% |
72%50 |
34% |
63%50 |
20% |
|
Somewhat agree (4-5) |
25% |
23% |
27% |
27% |
22% |
|
Do not agree (1-3) |
7% |
4% |
9% |
4% |
14%50 |
|
Don’t know |
16% |
1% |
30%50 |
6% |
43%50 |
|
CFIA is efficient in its operations |
|||||
|
Strongly agree (6-7) |
37% |
53%50 |
23% |
46%50 |
14% |
|
Somewhat agree (4-5) |
36% |
35% |
37% |
37% |
33% |
|
Do not agree (1-3) |
10% |
7% |
11% |
7% |
17%50 |
|
Don’t know |
17% |
5% |
28%50 |
10% |
37% |
|
It is easy to understand the information CFIA provides food businesses |
|||||
|
Strongly agree (6-7) |
38% |
49%50 |
28% |
46%50 |
15% |
|
Somewhat agree (4-5) |
36% |
38% |
35% |
38% |
32% |
|
Do not agree (1-3) |
13% |
12% |
14% |
13% |
13% |
|
Don’t know |
13% |
1% |
23%50 |
3% |
40%50 |
|
CFIA provides enough information to meet your regulatory obligations |
|||||
|
Strongly agree (6-7) |
46% |
61%50 |
32% |
55%50 |
22% |
|
Somewhat agree (4-5) |
32% |
33% |
32% |
35% |
24% |
|
Do not agree (1-3) |
10% |
5% |
14%50 |
6% |
19%50 |
|
Don’t know |
12% |
1% |
22%50 |
3% |
36%50 |
|
Information from CFIA arrives in a timely manner |
|||||
|
Strongly agree (6-7) |
44% |
60%50 |
30% |
55%50 |
16% |
|
Somewhat agree (4-5) |
28% |
27% |
30% |
30% |
23% |
|
Do not agree (1-3) |
11% |
9% |
14% |
9% |
18% |
|
Don’t know |
16% |
5% |
27%50 |
6% |
43%50 |
50 When data tables are presented, the asterisks indicate that the result is statistically significantly different from results in other columns.
Impressions of CFIA across the four major industry verticals are fairly consistent; although, results show that a relatively higher proportion of processors and manufacturers agree that CFIA is fair when inspecting food businesses, or that the information provided by CFIA arrives in a timely manner. Businesses in the wholesaler or distributor sector are the most likely to disagree with the latter statement. When considering the size of businesses, large companies are the most likely to agree CFIA is fair when inspecting food businesses and that the information from CFIA arrives in a timely manner. Medium, small and micro companies are less likely to be familiar with some aspects of CFIA, which is seen through the higher incidence of “don’t know” ratings among these segments. In Wave 1, results for businesses in the retail sector show a lower familiarity with CFIA than in Wave 2.
|
|
|
Industry Vertical |
Company Size |
||||||
|
|
Total (n=500) |
Agriculture (n=99) |
Processor/Manufacturer (n=198) |
Wholesaler/Distributor (n=137) |
Retailer (n=66) |
Micro (n=98) |
Small (n=105) |
Medium (n=224) |
Large (n=70) |
|
CFIA is fair when inspecting food businesses |
|||||||||
|
Strongly agree (6-7) |
54% |
57% |
65%51 |
56% |
44% |
51% |
45% |
56% |
72%51 |
|
Somewhat agree (4-5) |
24% |
20% |
17% |
26% |
30% |
21% |
33%51 |
24% |
16% |
|
Do not agree (1-3) |
6% |
5% |
6% |
5% |
7% |
7% |
6% |
7% |
3% |
|
Don’t know |
15% |
18% |
12% |
13% |
19% |
21% |
16% |
13% |
9% |
|
It is easy to understand the information CFIA provides food businesses |
|||||||||
|
Strongly agree (6-7) |
40% |
35% |
37% |
43% |
41% |
38% |
38% |
36% |
57% |
|
Somewhat agree (4-5) |
38% |
36% |
46% |
37% |
35% |
41% |
29% |
43% |
36% |
|
Do not agree (1-3) |
11% |
16% |
10% |
12% |
11% |
7% |
14% |
14% |
7% |
|
Don’t know |
11% |
13% |
8% |
8% |
13% |
14%51 |
20%51 |
7%51 |
1% |
|
CFIA provides enough information to meet your regulatory obligations |
|||||||||
|
Strongly agree (6-7) |
52% |
55% |
51% |
54% |
50% |
50% |
49% |
50% |
61% |
|
Somewhat agree (4-5) |
32% |
27% |
34% |
32% |
33% |
33% |
29% |
34% |
33% |
|
Do not agree (1-3) |
8% |
8% |
9% |
6% |
9% |
9% |
9% |
9% |
2% |
|
Don’t know |
8% |
10% |
7% |
8% |
9% |
8% |
13% |
6% |
4% |
|
Information from CFIA arrives in a timely manner |
|||||||||
|
Strongly agree (6-7) |
48% |
54% |
48% |
49% |
45% |
43% |
41% |
52% |
54%51 |
|
Somewhat agree (4-5) |
30% |
23% |
37%51 |
24% |
32% |
22% |
33% |
31% |
38% |
|
Do not agree (1-3) |
8% |
8% |
5% |
13%51 |
7% |
8% |
11% |
9% |
3% |
|
Don’t know |
13% |
15% |
9% |
13% |
16% |
26%51 |
15% |
8% |
6% |
51 When data tables are presented, the asterisks indicate that the result is statistically significantly different from results in other columns.
|
|
|
Industry Vertical |
Company Size |
||||||
|
|
Total (n=370) |
Agriculture (n=49) |
Processor/Manufacturer (n=170) |
Wholesaler/Distributor (n=87) |
Retailer (n=64) |
Micro (n=63) |
Small (n=90) |
Medium (n=179) |
Large (n=37) |
|
CFIA is fair when inspecting food businesses |
|||||||||
|
Strongly agree (6-7) |
52% |
48% |
59% |
59% |
39% |
41% |
44% |
57%52 |
78%52 |
|
Somewhat agree (4-5) |
25% |
25% |
21% |
24% |
30% |
27% |
26% |
25% |
22% |
|
Do not agree (1-3) |
7% |
10% |
8% |
7% |
3% |
9% |
8% |
6% |
- |
|
Don’t know |
16% |
17% |
12% |
10% |
28%52 |
23% |
22% |
13% |
- |
|
CFIA is efficient in its operations |
|||||||||
|
Strongly agree (6-7) |
37% |
33% |
38% |
41% |
35% |
29% |
33% |
41% |
49% |
|
Somewhat agree (4-5) |
36% |
44% |
37% |
36% |
30% |
37% |
33% |
36% |
46% |
|
Do not agree (1-3) |
10% |
14% |
11% |
6% |
8% |
10% |
10% |
10% |
5% |
|
Don’t know |
17% |
9% |
14% |
16% |
27%52 |
23% |
24%52 |
13% |
- |
|
It is easy to understand the information CFIA provides food businesses |
|||||||||
|
Strongly agree (6-7) |
38% |
35% |
34% |
44% |
38% |
34% |
30% |
42% |
49% |
|
Somewhat agree (4-5) |
36% |
45%52 |
40%52 |
37% |
25% |
35% |
38% |
35% |
43% |
|
Do not agree (1-3) |
13% |
7% |
19%52 |
9% |
13% |
15% |
14% |
13% |
9% |
|
Don’t know |
13% |
13% |
6% |
10% |
23%52 |
16% |
19% |
10% |
- |
|
CFIA provides enough information to meet your regulatory obligations |
|||||||||
|
Strongly agree (6-7) |
46% |
43% |
48% |
50% |
42% |
39% |
39% |
52% |
54% |
|
Somewhat agree (4-5) |
32% |
32% |
38% |
30% |
27% |
31% |
33% |
30% |
44% |
|
Do not agree (1-3) |
10% |
15% |
9% |
10% |
7% |
15%52 |
9% |
9% |
3% |
|
Don’t know |
12% |
10% |
5% |
10% |
23%52 |
14% |
18%52 |
9% |
- |
|
Information from CFIA arrives in a timely manner |
|||||||||
|
Strongly agree (6-7) |
44% |
38% |
45% |
44% |
46% |
31% |
42% |
49%52 |
52% |
|
Somewhat agree (4-5) |
28% |
34% |
31% |
27% |
23% |
31% |
22% |
30% |
35% |
|
Do not agree (1-3) |
11% |
15% |
13% |
14% |
5% |
14% |
11% |
11% |
10% |
|
Don’t know |
16% |
13% |
11% |
15% |
26%52 |
24%52 |
24%52 |
10% |
3% |
52 When data tables are presented, the asterisks indicate that the result is statistically significantly different from results in other columns.
Regionally, impressions are generally more positive among businesses in Atlantic Canada, except for how easy it is to understand the information CFIA provides to food businesses. This trend is similar in Wave 1, when Atlantic Canada businesses also had the most positive impressions.
|
|
Region |
||||
|
|
Total (n=500) |
Atlantic (n=47) |
Quebec (n=150) |
Ontario (n=134) |
West (n=169) |
|
CFIA is fair when inspecting food businesses |
|||||
|
Strongly agree (6-7) |
54% |
79%53 |
51% |
55% |
50% |
|
Somewhat agree (4-5) |
24% |
12% |
24% |
26% |
25% |
|
Do not agree (1-3) |
6% |
- |
8% |
5% |
8% |
|
Don’t know |
15% |
9% |
18% |
14% |
17% |
|
It is easy to understand the information CFIA provides food businesses |
|||||
|
Strongly agree (6-7) |
40% |
29% |
36% |
45% |
37% |
|
Somewhat agree (4-5) |
38% |
43% |
34% |
37% |
42% |
|
Do not agree (1-3) |
11% |
15% |
13% |
11% |
11% |
|
Don’t know |
11% |
13% |
17% |
8% |
10% |
|
CFIA provides enough information to meet your regulatory obligations |
|||||
|
Strongly agree (6-7) |
52% |
71%53 |
44% |
54% |
50% |
|
Somewhat agree (4-5) |
32% |
17% |
34%53 |
34%53 |
33%53 |
|
Do not agree (1-3) |
8% |
4% |
10% |
6% |
10% |
|
Don’t know |
8% |
8% |
13% |
7% |
7% |
|
Information from CFIA arrives in a timely manner |
|||||
|
Strongly agree (6-7) |
48% |
55% |
44% |
50% |
45% |
|
Somewhat agree (4-5) |
30% |
21% |
32% |
31% |
31% |
|
Do not agree (1-3) |
8% |
8% |
10% |
8% |
7% |
|
Don’t know |
13% |
15% |
14% |
11% |
17% |
53 When data tables are presented, the asterisks indicate that the result is statistically significantly different from results in other columns.
|
|
Region |
||||
|
|
Total (n=370) |
Atlantic (n=40) |
Quebec (n=59) |
Ontario (n=106) |
West (n=165) |
|
CFIA is fair when inspecting food businesses |
|||||
|
Strongly agree (6-7) |
52% |
72%54 |
30% |
61%54 |
49%54 |
|
Somewhat agree (4-5) |
25% |
22% |
37%54 |
20% |
26% |
|
Do not agree (1-3) |
7% |
1% |
12%54 |
5% |
7% |
|
Don’t know |
16% |
4% |
21%54 |
14% |
19%54 |
|
CFIA is efficient in its operations |
|||||
|
Strongly agree (6-7) |
37% |
58%54 |
33% |
36% |
37% |
|
Somewhat agree (4-5) |
36% |
31% |
39% |
38% |
33% |
|
Do not agree (1-3) |
10% |
2% |
13% |
7% |
13%54 |
|
Don’t know |
17% |
9% |
15% |
19% |
18% |
|
It is easy to understand the information CFIA provides food businesses |
|||||
|
Strongly agree (6-7) |
38% |
47% |
27% |
41% |
37% |
|
Somewhat agree (4-5) |
36% |
40% |
37% |
38% |
33% |
|
Do not agree (1-3) |
13% |
11% |
20%54 |
8% |
16%54 |
|
Don’t know |
13% |
2% |
15%54 |
12%54 |
14%54 |
|
CFIA provides enough information to meet your regulatory obligations |
|||||
|
Strongly agree (6-7) |
46% |
77%54 |
36% |
45% |
47% |
|
Somewhat agree (4-5) |
32% |
15% |
35%54 |
37%54 |
28%54 |
|
Do not agree (1-3) |
10% |
7% |
15% |
6% |
12% |
|
Don’t know |
12% |
2% |
14%54 |
11%54 |
13%54 |
|
Information from CFIA arrives in a timely manner |
|||||
|
Strongly agree (6-7) |
44% |
57%54 |
33% |
44% |
46% |
|
Somewhat agree (4-5) |
28% |
25% |
35% |
30% |
24% |
|
Do not agree (1-3) |
11% |
11% |
11% |
9% |
14% |
|
Don’t know |
16% |
7% |
21%54 |
17% |
15% |
54 When data tables are presented, the asterisks indicate that the result is statistically significantly different from results in other columns.
My CFIA
The survey also examined awareness and likelihood to use the new digital service developed for convenient service delivery My CFIA. Based on the most recent wave of surveys, nearly half of businesses not exclusively in retail (44%) are aware of the My CFIA portal, with 32% having used it. Those in the retailer sector as well as micro or small companies are the least likely to have heard about the portal. Regionally, awareness is the lowest in Quebec (32%) while awareness in the other three regions ranges between 42% in Western Canada and 60% in Atlantic Canada. Both awareness and usage are significantly higher in Wave 2 than in Wave 1. Awareness increased from 26% to 44%, and usage more than doubled from 14% to 32%.
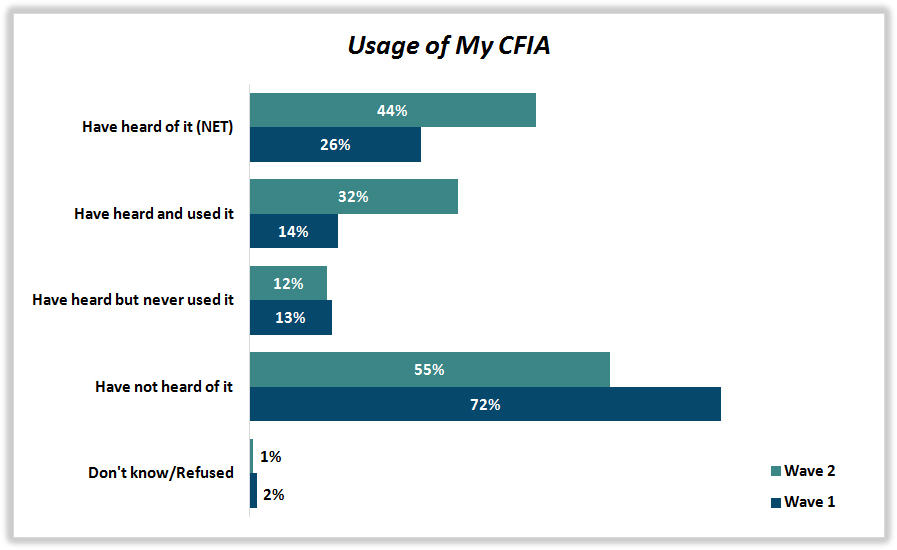
F1: Have you ever heard, seen or read anything about CFIA’s online portal called “My CFIA?” Base: Businesses not exclusively in retail, Wave 2, n=500, Wave 1, n=370.
A horizontal bar graph presents information of the respondent's awareness and likelihood to use the My CFIA. The graph shows a set of two bars for each source that represents both wave 1 and wave 2, with the following data:
For Wave 1, the following list presents the respondent's awareness and likelihood to use My CFIA.
- Have heard of it (NET): 26%
- Have heard and used it: 14%
- Have heard but never used it: 13%
- Have not heard of it: 72%
- Don't know/Refused: 2%
For Wave 2, the following list presents the respondent's awareness and likelihood to use My CFIA.
- Have heard of it (NET): 44%
- Have heard and used it: 32%
- Have heard but never used it: 12%
- Have not heard of it: 55%
- Don't know/Refused: 1%
|
|
|
Industry Sector |
Company Size |
||||||
|
|
Total (n=500) |
Agriculture (n=99) |
Processor/Manufacturer (n=198) |
Wholesaler/Distributor (n=137) |
Retailer (n=66) |
Micro (n=98) |
Small (n=105) |
Medium (n=224) |
Large (n=70) |
|
Yes (NET) |
44% |
43%55 |
68%55 |
54%55 |
20% |
28% |
34% |
52%55 |
62%55 |
|
Yes, I used it |
32% |
33%55 |
50%55 |
40%55 |
13% |
15% |
26% |
38%55 |
51%55 |
|
Yes, but I never used it |
12% |
9% |
17%55 |
14% |
7% |
13% |
9% |
14% |
11% |
|
No |
55% |
56%55 |
32% |
45%55 |
80%55 |
70%55 |
66%55 |
47% |
38% |
|
Don’t know/Not sure |
1% |
2% |
<1% |
1% |
- |
2% |
- |
1% |
- |
55 When data tables are presented, the asterisks indicate that the result is statistically significantly different from results in other columns.
|
|
|
Region |
|||
|
|
Total (n=500) |
Atlantic (n=47) |
Quebec (n=150) |
Ontario (n=134) |
West (n=169) |
|
Yes (NET) |
44% |
60%56 |
32% |
49%56 |
42% |
|
Yes, I used it |
32% |
40%56 |
20% |
37%56 |
31% |
|
Yes, but I never used it |
12% |
20% |
12% |
12% |
11% |
|
No |
55% |
40% |
68%56 |
50% |
58% |
|
Don’t know/Not sure |
1% |
- |
<1% |
1% |
- |
56 When data tables are presented, the asterisks indicate that the result is statistically significantly different from results in other columns.
|
|
|
Industry Sector |
Company Size |
||||||
|
|
Total (n=370) |
Agriculture (n=49) |
Processor/Manufacturer (n=170) |
Wholesaler/Distributor (n=87) |
Retailer (n=64) |
Micro (n=63) |
Small (n=90) |
Medium (n=179) |
Large (n=37) |
|
Yes (NET) |
26% |
21%57 |
49%57 |
24%57 |
4% |
12% |
19% |
32%57 |
56%57 |
|
Yes, I used it |
14% |
10% |
26%57 |
14% |
- |
4% |
7% |
19%57 |
32%57 |
|
Yes, but I never used it |
13% |
10% |
23%57 |
10% |
4% |
8% |
12% |
13% |
24%57 |
|
No |
72% |
78%57 |
51% |
72%57 |
96%57 |
87%57 |
80%57 |
66%57 |
44% |
|
Don’t know/Not sure |
1% |
1% |
- |
4% |
- |
1% |
1% |
1% |
- |
57 When data tables are presented, the asterisks indicate that the result is statistically significantly different from results in other columns.
|
|
|
Region |
|||
|
|
Total (n=370) |
Atlantic (n=40) |
Quebec (n=59) |
Ontario (n=106) |
West (n=165) |
|
Yes |
26% |
39%58 |
15% |
26% |
30%58 |
|
Yes, I used it |
14% |
19% |
8% |
13% |
16% |
|
Yes, but I never used it |
13% |
20% |
7% |
13% |
14% |
|
No |
72% |
61% |
85%58 |
72% |
69% |
|
Don’t know/Not sure |
1% |
- |
- |
2% |
1% |
58 When data tables are presented, the asterisks indicate that the result is statistically significantly different from results in other columns.
Among the 32% of businesses that have used My CFIA, 68% did so to request a new licence, 44% to register their business, 32% to renew their licence, 28% to obtain a permit, 15% to obtain an export certificate, and 10% only to enroll without using any other portal features. The frequency of activities in the portal is similar to results from Wave 1, however, usage in Wave 1 was lower and relatively new to many businesses, since 46% had only enrolled at that time. It should also be noted that results from Wave 1 are only based on 65 respondents. As well, subgroup results have very small sample sizes and potential statistical differences are not highlighted for this question so as to avoid implying or indicating significance that does not exist.
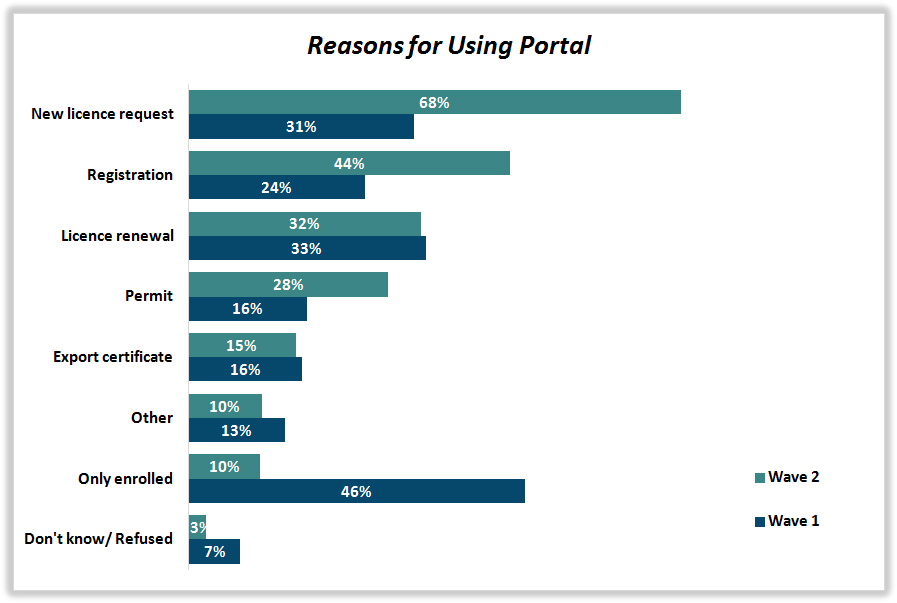
F1A: Have you ever used the portal for a… Base: Businesses not exclusively in retail that have used “My CFIA”, Wave 2, n=183, Wave 1, n=65.
A horizontal bar graph presents the respondent's reasons for using My CFIA. The graph shows a set of two bars for each source that represents both wave 1 and wave 2, with the following data:
For Wave 1, the respondent's reasons for using My CFIA were:
- New licence request: 31%
- Registration: 24%
- Licence renewal: 33%
- Permit: 16%
- Export certificate: 16%
- Other: 13%
- Only enrolled: 46%
- Don't know/ Refused: 7%
For Wave 2, the respondent's reasons for using My CFIA were:
- New licence request: 68%
- Registration: 44%
- Licence renewal: 32%
- Permit: 28%
- Export certificate: 15%
- Other: 10%
- Only enrolled: 10%
- Don't know/ Refused: 3%
Overall, satisfaction with the portal is positive, as nearly half of users (46%) gave a satisfaction rating of 6 or 7 (on a 7-point scale), and 38% a rating of 4 or 5. Satisfaction in Wave 1 was much lower, likely due to the higher number of respondents who had only enrolled and had not had the opportunity to experience the services that are now available.
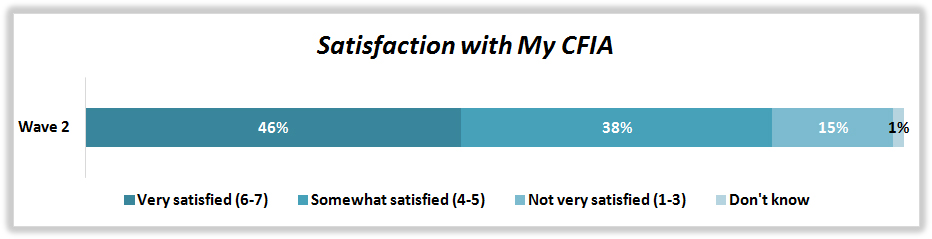
F2: Please rate your overall level of satisfaction with “My CFIA” on a scale of 1 to 7, where 1 means not at all satisfied and 7 means very satisfied. Base: Businesses not exclusively in retail that have used “My CFIA”, Wave 2, n=183.
The chart presenting the ratings of the users on the satisfaction with My CFIA portal in wave 2 infers the following data: Very satisfied (6 to 7)- 46 percent, Somewhat satisfied (4 to 5)- 38 percent, Not very satisfied (1 to 3)- 15 percent, and Don’t know- 1 percent.
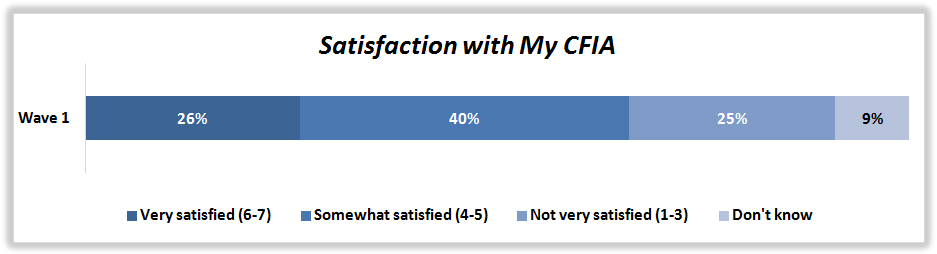
F2: Please rate your overall level of satisfaction with “My CFIA” on a scale of 1 to 7, where 1 means not at all satisfied and 7 means very satisfied. Base: Businesses not exclusively in retail that have used “My CFIA”, Wave 1, n=65.
The chart presenting the ratings of the users on the satisfaction with My CFIA portal in wave 1 infers the following data: Very satisfied (6 to 7)- 26 percent, Somewhat satisfied (4 to 5)- 40 percent, Not very satisfied (1 to 3)- 25 percent, and Don’t know- 9 percent.
According to participants who provided a lower satisfaction score for My CFIA (102 businesses in total gave a satisfaction rating from 1 to 5 in Wave 2 and 40 in Wave 1), the most common reason was that the design was not user-friendly. Other attributes are summarized in the graph below. It should be noted that these results are based on a small number of respondents and should be considered directional.
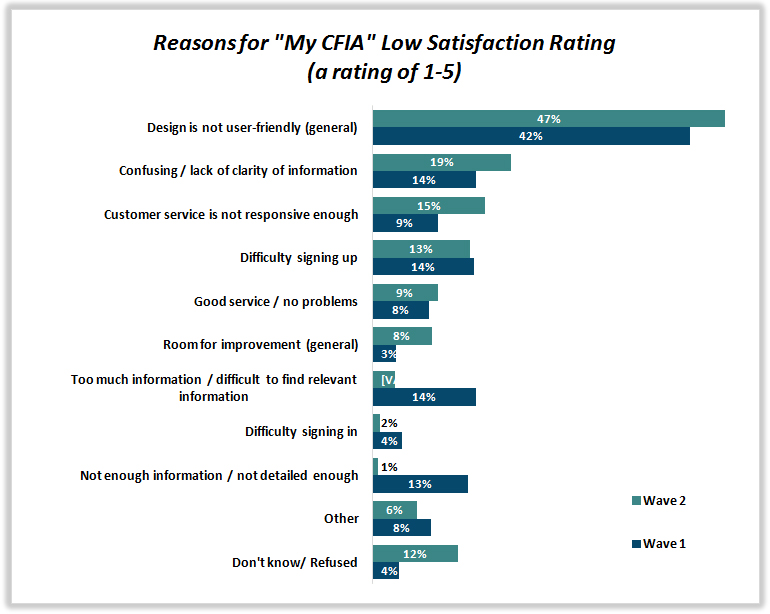
F2A. Please expand on why you provide that rating? Base: Businesses not exclusively in retail that have used “My CFIA” and that provided a satisfaction rating of 1 to 5, Wave 2: n=102, Wave 1 n=40.
A horizontal bar graph presents information of the respondent's low satisfaction rate for My CFIA. The graph shows a set of two bars for each source that represents both wave 1 and wave 2, with the following data:
For Wave 1, the following list presents the respondent's low satisfaction rate for My CFIA.
- Design is not user-friendly (general): 42%
- Confusing / lack of clarity of information: 14%
- Customer service is not responsive enough: 9%
- Difficulty signing up: 14%
- Good service / no problems: 8%
- Room for improvement (general): 3%
- Too much information / difficult to find relevant information: 14%
- Difficulty signing in: 4%
- Not enough information / not detailed enough: 13%
- Other: 8%
- Don't know/ Refused: 4%
For Wave 2, the following list presents the respondent's low satisfaction rate for My CFIA.
- Design is not user-friendly (general): 47%
- Confusing / lack of clarity of information: 19%
- Customer service is not responsive enough: 15%
- Difficulty signing up: 13%
- Good service / no problems: 9%
- Room for improvement (general): 8%
- Too much information / difficult to find relevant information: 3%
- Difficulty signing in: 2%
- Not enough information / not detailed enough: 1%
- Other: 6%
- Don't know/ Refused: 12%
The study explored the likely use of My CFIA in the future. To make sure all respondents had at least some information about the portal, businesses not having read, seen or heard anything about My CFIA were provided the following overview of the portal:
My CFIA is a web portal that provides clients with secure access to a growing number of CFIA services online. It is a convenient and secure way to do business with the CFIA. My CFIA can be used to manage and track service requests online, including permissions such as licences, permits, registrations and export certificates. You can find it at inspection.gc.ca/mycfia.
Based on this description, a little over half (53%) of all businesses not exclusively in retail are very likely to use My CFIA in the future and another 26% are somewhat likely. Interest is weakest among businesses in the processor and manufacturer, wholesale and distributor, and agriculture segments and is especially weak among retailers, small and micro businesses. These results and trends are similar to those obtained in Wave 1.
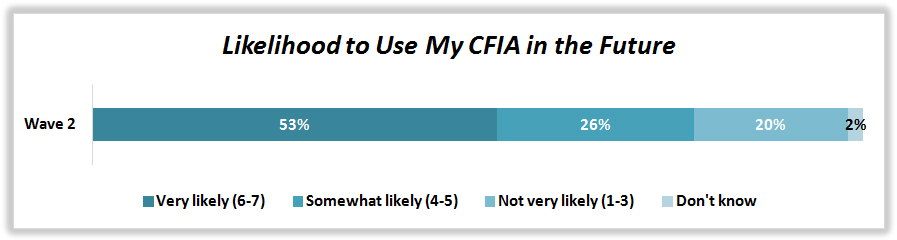
F3. How likely would you be to use “My CFIA” in the future on a scale of 17 where 1 is not at all likely and 7 is very likely? Base: Businesses not exclusively in retail, Wave 2, n=500.
The chart presenting the likelihood of the businesses to use My CFIA portal in the future from wave 2 infers the following data: Very likely (6 to 7)- 53 percent, Somewhat likely (4 to 5)- 26 percent, Not very likely (1 to 3)- 20 percent, and Don’t know- 2 percent.
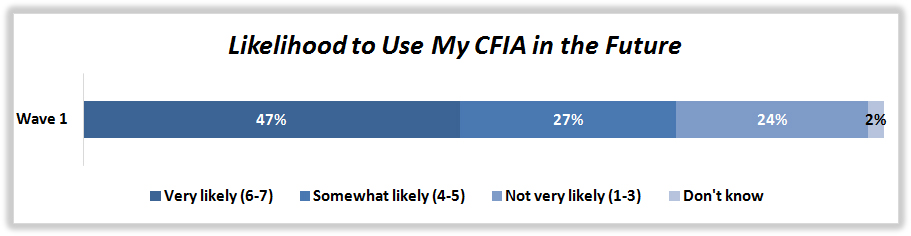
F3. How likely would you be to use “My CFIA” in the future on a scale of 17 where 1 is not at all likely and 7 is very likely? Base: Businesses not exclusively in retail, Wave 1, n=370.
The chart presenting the likelihood of the businesses to use My CFIA portal in the future from wave 1 infers the following data: Very likely (6 to 7)- 47 percent, Somewhat likely (4 to 5)- 27 percent, Not very likely (1 to 3)- 24 percent, and Don’t know- 2 percent.
|
|
|
Industry Sector |
Company Size |
||||||
|
|
Total (n=500) |
Agriculture (n=99) |
Processor/Manufacturer (n=198) |
Wholesaler/Distributor (n=137) |
Retailer (n=66) |
Micro (n=98) |
Small (n=105) |
Medium (n=224) |
Large (n=70) |
|
Very likely (6-7) |
53% |
55%59 |
67%59 |
62%59 |
35% |
36% |
42% |
61%59 |
73%59 |
|
Somewhat likely (4-5) |
26% |
17% |
18% |
23% |
36%59 |
34%59 |
33%59 |
21% |
13% |
|
Not very likely (1-3) |
20% |
26%59 |
14% |
14% |
26% |
30%59 |
22% |
16% |
11% |
|
Don’t know |
2% |
2% |
1% |
1% |
2% |
<1% |
2% |
2% |
3% |
59 When data tables are presented, the asterisks indicate that the result is statistically significantly different from results in other columns.
|
|
|
Region |
|||
|
|
Total (n=500) |
Atlantic (n=47) |
Quebec (n=150) |
Ontario (n=134) |
West (n=169) |
|
Very likely (6-7) |
53% |
55% |
47% |
56% |
51% |
|
Somewhat likely (4-5) |
26% |
26% |
27% |
27% |
23% |
|
Not very likely (1-3) |
20% |
10% |
25%60 |
17% |
23% |
|
Don’t know |
2% |
9%60 |
1% |
0% |
2% |
60 When data tables are presented, the asterisks indicate that the result is statistically significantly different from results in other columns.
|
|
|
Industry Sector |
Company Size |
||||||
|
|
Total (n=370) |
Agriculture (n=49) |
Processor/Manufacturer (n=170) |
Wholesaler/Distributor (n=87) |
Retailer (n=64) |
Micro (n=63) |
Small (n=90) |
Medium (n=179) |
Large (n=37) |
|
Very likely (6-7) |
47% |
44% |
55%61 |
50% |
37% |
42% |
39% |
52% |
67%61 |
|
Somewhat likely (4-5) |
27% |
28% |
23% |
29% |
29% |
25% |
29% |
27% |
20% |
|
Not very likely (1-3) |
24% |
28% |
18% |
19% |
33%61 |
33%61 |
29%61 |
18% |
13% |
|
Don’t know |
2% |
- |
4% |
1% |
1% |
- |
3% |
3% |
- |
61 When data tables are presented, the asterisks indicate that the result is statistically significantly different from results in other columns.
|
|
|
Region |
|||
|
|
Total (n=370) |
Atlantic (n=40) |
Quebec (n=59) |
Ontario (n=106) |
West (n=165) |
|
Very likely (6-7) |
47% |
55% |
42% |
49% |
46% |
|
Somewhat likely (4-5) |
27% |
32% |
29% |
25% |
28% |
|
Not very likely (1-3) |
24% |
13% |
28% |
24% |
24% |
|
Don’t know |
2% |
- |
1% |
2% |
2% |
Results for likelihood to use the portal in the future were further analyzed based on whether or not the businesses had already signed up and, among those subscribed, whether or not they had actually used the portal.
Results show that the strongest likelihood to use the portal moving forward is among those who have actually signed up and used it in the past. Intentions are also robust among those who have signed up but have not made use of it yet as fully 63% indicated they would be very likely to use it moving forward. This analysis also suggests that the portal has some appeal among those who have not signed up or were not even aware of the portal. Fully 67% of these businesses indicated they would be either very or somewhat likely to use the portal in the future. These results are very similar to those observed in Wave 1.
|
|
Usage of My CFIA |
|||
|
|
Total (n=500) |
Signed Up and Have Used It (n=183) |
Signed Up but Have never used it (n=69) |
Not aware, have not signed up (n=245) |
|
Very likely (6-7) |
53% |
77%62 |
63%62 |
36% |
|
Somewhat likely (4-5) |
26% |
15% |
29%62 |
31%62 |
|
Not very likely (1-3) |
20% |
8% |
7% |
30%62 |
|
Don’t know |
2% |
1% |
2% |
3% |
62 When data tables are presented, the asterisks indicate that the result is statistically significantly different from results in other columns.
|
|
Usage of My CFIA |
|||
|
|
Total (n=370) |
Signed Up and Have Used It (n=65) |
Signed Up but Have never used it (n=55) |
Not aware, have not signed up (n=246) |
|
Very likely (6-7) |
47% |
75%63 |
59%63 |
40% |
|
Somewhat likely (4-5) |
27% |
8% |
17% |
32%63 |
|
Not very likely (1-3) |
24% |
14% |
20% |
26%63 |
|
Don’t know |
2% |
3% |
4% |
1% |
63 When data tables are presented, the asterisks indicate that the result is statistically significantly different from results in other columns.
Respondents were asked to expand on their “likelihood to use the portal” rating. Results in the grid below have been segmented based on future intentions. Businesses most likely to use the portal praise it for being easy to use and convenient as well as for the importance and usefulness of the information it provides. Many also seem to understand that using the portal is mandatory to submit registrations or licencing applications. Those somewhat likely to use the portal in the future will do so out of curiosity or because they are already using it, but an important proportion do not seem to feel there is a need for it. Finally, businesses the least likely to use the portal in the future basically believe they have no need for it. Results are similar from one research wave to the other.
|
Among Businesses Very Likely to Use the Portal in the Future (Likelihood Rating of 6 or 7) |
Among Businesses Somewhat Likely to Use the Portal in the Future (Likelihood Rating of 4 or 5) |
Among Businesses Not Very Likely to Use the Portal in the Future (Likelihood Rating of 1 to 3) |
|||
|
n=284 |
n=108 |
n=99 |
|||
|
Easy to use / convenient |
43% |
Curious / interested in using it |
26% |
No need (general) |
57% |
|
Mandatory - have to use for registration / licensing applications |
25% |
No need (general) |
18% |
No need - I don’t have contact with CFIA |
16% |
|
Provides important / useful information |
25% |
Provides important / useful information |
14% |
Website isn’t user-friendly |
10% |
|
Mandatory - have to use for information / regulations |
15% |
Easy to use / convenient |
13% |
I don’t use the internet |
7% |
|
Will use it / continue to use it (general) |
14% |
Unfamiliar with the site / haven’t used before |
10% |
Curious / interested in using it |
4% |
|
Curious / interested in using it |
5% |
Mandatory - have to use for registration / licensing applications |
7% |
Unfamiliar with the site / haven’t used before |
3% |
|
Unfamiliar with the site / haven’t used before |
3% |
Will use it / continue to use it (general) |
5% |
Mandatory - have to use for registration / licensing applications |
3% |
|
Website isn’t user-friendly |
2% |
Website isn’t user-friendly |
3% |
Mandatory - have to use for information / regulations |
2% |
|
I don’t use the internet |
1% |
No need - I don’t have contact with CFIA |
3% |
Will use it / continue to use it (general) |
1% |
|
No need (general) |
1% |
I don’t use the internet |
<1% |
Easy to use / convenient |
1% |
|
No need - I don’t have contact with CFIA |
- |
Mandatory - have to use for information / regulations |
<1% |
Provides important / useful information |
1% |
|
Other |
3% |
Other |
7% |
Other |
2% |
|
Don’t know/ Refused |
4% |
Don’t know/ Refused |
22% |
Don’t know/ Refused |
5% |
|
Among Businesses Very Likely to Use the Portal in the Future (Likelihood Rating of 6 or 7) |
Among Businesses Somewhat Likely to Use the Portal in the Future (Likelihood Rating of 4 or 5) |
Among Businesses Not Very Likely to Use the Portal in the Future (Likelihood Rating of 1 to 3) |
|||
|
n=184 |
n=97 |
n=81 |
|||
|
Provides important / useful information |
26% |
No need (general) |
25% |
No need (general) |
56% |
|
Easy to use / convenient |
25% |
Curious / interested in using it |
15% |
No need - I don’t have contact with CFIA |
7% |
|
Mandatory - have to use for registration / licensing applications |
23% |
Will use it / continue to use it (general) |
11% |
I don’t use the Internet |
6% |
|
Mandatory - have to use for information / regulations |
23% |
Unfamiliar with the site / haven’t used before |
10% |
Website isn’t user-friendly |
5% |
|
Curious / interested in using it |
12% |
Provides important / useful information |
9% |
Unfamiliar with the site / haven’t used before |
5% |
|
Will use it / continue to use it (general) |
9% |
Mandatory - have to use for information / regulations |
8% |
Mandatory - have to use for information / regulations |
4% |
|
No need (general) |
3% |
Website isn’t user-friendly |
7% |
Mandatory - have to use for registration / licensing applications |
4% |
|
Unfamiliar with the site / haven’t used before |
3% |
Mandatory - have to use for registration / licensing applications |
7% |
Provides important / useful information |
4% |
|
Website isn’t user-friendly |
1% |
I don’t use the Internet |
5% |
Will use it / continue to use it (general) |
2% |
|
I don’t use the Internet |
1% |
No need - I don’t have contact with CFIA |
4% |
Curious / interested in using it |
1% |
|
Other |
6% |
Easy to use / convenient |
2% |
Easy to use / convenient |
1% |
|
Don’t know/ Refused |
1% |
Other |
4% |
Other |
6% |
Compliance Burden
Based on the most recent wave of surveys, results reveal that over a quarter (28%) of businesses find the paperwork associated with food regulations very burdensome while one quarter (25%) find it not very burdensome. It is considered somewhat burdensome by 38% of businesses not exclusively in retail. These results are very similar to what was observed in Wave 1.
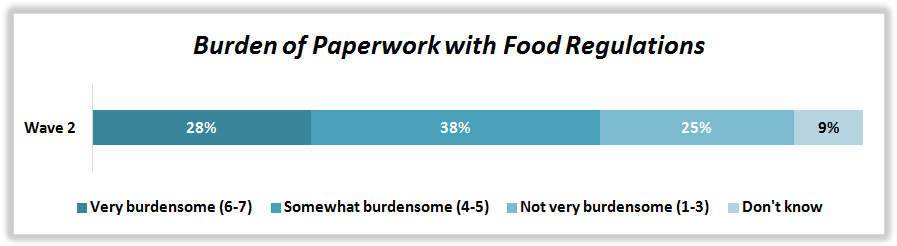
G1: On a scale of 1 to 7 where 1 is not at all burdensome and 7 is very burdensome, how burdensome is the paper work associated with the food regulations in Canada? Base: Businesses not exclusively in retail, Wave 2, n=500.
The chart presents the surveys of the businesses on the amount of burden they are considering with the food regulations’ paperwork in wave 2, and which infers the following data: Very burdensome (6 to 7)- 28 percent, Somewhat burdensome (4 to 5)- 38 percent, Not very burdensome (1 to 3)- 25 percent, and Don’t know- 9 percent.

G1: On a scale of 1 to 7 where 1 is not at all burdensome and 7 is very burdensome, how burdensome is the paper work associated with the food regulations in Canada? Base: Businesses not exclusively in retail, Wave 1, n=370.
The chart presents the surveys of the businesses on the amount of burden they are considering with the food regulations’ paperwork in wave 1, and which infers the following data: Very burdensome (6 to 7)- 28 percent, Somewhat burdensome (4 to 5)- 34 percent, Not very burdensome (1 to 3)- 29 percent, and Don’t know- 9 percent.
Wave 2 results across all subgroups are relatively the same.
In Wave 1, results among those in the retail vertical stand apart in terms of how many feel the paperwork is not very burdensome (45%) while only 15% consider it very burdensome. In terms of company size, small and medium-sized businesses were the most likely to consider the paperwork very burdensome although it should be noted that 19% of micro businesses did not know how to answer. From a regional perspective, businesses in Ontario were the most likely to feel the paperwork is very burdensome (36%).
|
|
|
Industry Sector |
Company Size |
||||||
|
|
Total (n=500) |
Agriculture (n=99) |
Processor/Manufacturer (n=198) |
Wholesaler/Distributor (n=137) |
Retailer (n=66) |
Micro (n=98) |
Small (n=105) |
Medium (n=224) |
Large (n=70) |
|
Very burdensome (6-7) |
28% |
35% |
32% |
27% |
25% |
26% |
23% |
35% |
23% |
|
Somewhat burdensome (4-5) |
38% |
39% |
38% |
39% |
35% |
41% |
38% |
35% |
39% |
|
Not very burdensome (1-3) |
25% |
23% |
22% |
24% |
28% |
24% |
20% |
25% |
35% |
|
Don’t know |
9% |
3% |
8% |
10%64 |
11% |
9% |
19%64 |
5% |
4% |
64 When data tables are presented, the asterisks indicate that the result is statistically significantly different from results in other columns.
|
|
|
Region |
|||
|
|
Total (n=500) |
Atlantic (n=47) |
Quebec (n=150) |
Ontario (n=134) |
West (n=169) |
|
Very burdensome (6-7) |
28% |
22% |
24% |
28% |
33% |
|
Somewhat burdensome (4-5) |
38% |
30% |
46%65 |
41% |
28% |
|
Not very burdensome (1-3) |
25% |
33% |
22% |
24% |
27% |
|
Don’t know |
9% |
15% |
8% |
6% |
13% |
65 When data tables are presented, the asterisks indicate that the result is statistically significantly different from results in other columns.
|
|
|
Industry Sector |
Company Size |
||||||
|
|
Total (n=370) |
Agriculture (n=49) |
Processor/Manufacturer (n=170) |
Wholesaler/Distributor (n=87) |
Retailer (n=64) |
Micro (n=63) |
Small (n=90) |
Medium (n=179) |
Large (n=37) |
|
Very burdensome (6-7) |
28% |
32%66 |
32%66 |
34%66 |
15% |
15% |
32%66 |
33%66 |
21% |
|
Somewhat burdensome (4-5) |
34% |
31% |
42%66 |
35% |
26% |
32% |
31% |
35% |
47% |
|
Not very burdensome (1-3) |
29% |
29% |
23% |
19% |
45%66 |
34% |
26% |
27% |
31% |
|
Don’t know |
9% |
8% |
3% |
12%66 |
13%66 |
19%66 |
11% |
4% |
- |
66 When data tables are presented, the asterisks indicate that the result is statistically significantly different from results in other columns.
|
|
|
Region |
|||
|
|
Total (n=370) |
Atlantic (n=40) |
Quebec (n=59) |
Ontario (n=106) |
West (n=165) |
|
Very burdensome (6-7) |
28% |
20% |
16% |
36%67 |
26% |
|
Somewhat burdensome (4-5) |
34% |
51%67 |
34% |
31% |
35% |
|
Not very burdensome (1-3) |
29% |
27% |
36% |
25% |
31% |
|
Don’t know |
9% |
2% |
14%67 |
8% |
8% |
67 When data tables are presented, the asterisks indicate that the result is statistically significantly different from results in other columns.
Nearly one in three businesses not exclusively in retail (29%) strongly agree that CFIA takes the needs of businesses into account when developing new information products, and a similar proportion (26%) strongly agrees that over the past 12 months they have spent less time searching for food safety information. Results for these two metrics are quite consistent across industry verticals. There is a more noted trend when it comes to company size where results reveal a relatively higher proportion of large businesses strongly agreeing that, over the past 12 months, they’ve spent less time searching for food safety information they require (48%). Medium-sized companies are more inclined than others to somewhat agree with this statement. For both statements, small businesses are more likely than larger companies to indicate they do not search for food safety information. These results are similar to those obtained in Wave 1.
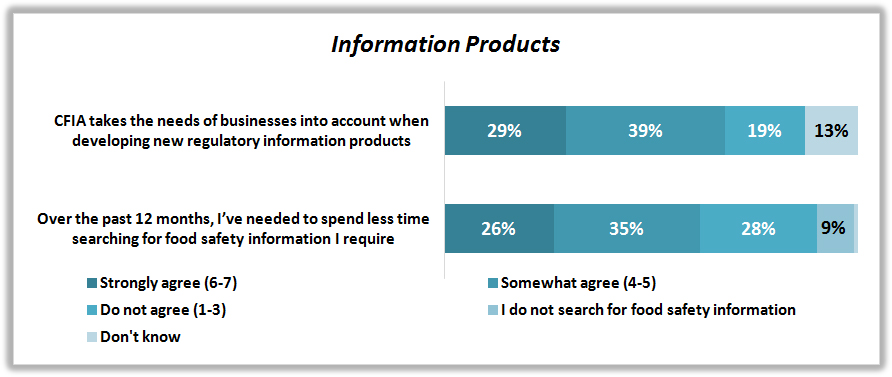
G1A/G1B: With respect to your business, please indicate the extent to which you agree with the following statements. Please use a scale of 1 to 7, where 1 means “do not agree at all” and 7 means “strongly agree”. Base: Businesses not exclusively in retail, Wave 2, n=500.
The stacked horizontal bar graph presents the general impressions of the businesses in wave 2 when asked about the considerations of the CFIA during the development of information products. The graph shows a set of five bars incorporated with each impression marked on the vertical axis and that represents Strongly agree (6 to 7), somewhat agree (4 to 5), do not agree (1 to 3), don’t know, and I do not search for food safety information. The graph infers the following data: CFIA takes the needs of businesses into account when developing new regulatory information products- 29, 39, 19, 13, and 0; Over the past 12 months, I have needed to spend less time searching for food safety information I require- 26, 35, 28, 9, and 0. Note: The values mentioned here are in percent.
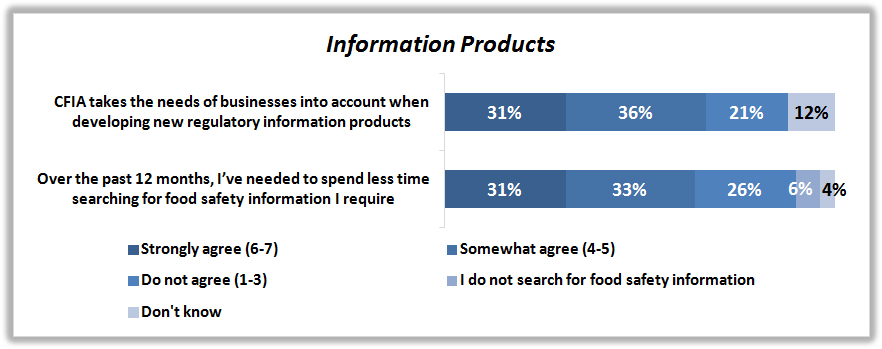
G1A/G1B: With respect to your business, please indicate the extent to which you agree with the following statements. Please use a scale of 1 to 7, where 1 means “do not agree at all” and 7 means “strongly agree”. Base: Businesses not exclusively in retail, Wave 1, n=370.
The stacked horizontal bar graph presents the general impressions of the businesses in wave 1 when asked about the considerations of the CFIA during the development of information products. The graph shows a set of five bars incorporated with each impression marked on the vertical axis and that represents Strongly agree (6 to 7), somewhat agree (4 to 5), do not agree (1 to 3), don’t know, and I do not search for food safety information. The graph infers the following data: CFIA takes the needs of businesses into account when developing new regulatory information products- 31, 36, 21, 12, and 0; Over the past 12 months, I have needed to spend less time searching for food safety information I require- 31, 33, 26, 6, and 4.
|
|
|
Industry Sector |
Company Size |
||||||
|
|
Total (n=500) |
Agriculture (n=99) |
Processor/Manufacturer (n=198) |
Wholesaler/Distributor (n=137) |
Retailer (n=66) |
Micro (n=98) |
Small (n=105) |
Medium (n=224) |
Large (n=70) |
|
CFIA takes the needs of businesses into account when developing new regulatory information products |
|||||||||
|
Strongly agree (6-7) |
29% |
24% |
28% |
35% |
29% |
21% |
34% |
29% |
37% |
|
Somewhat agree (4-5) |
39% |
43% |
44% |
35% |
36% |
43% |
30% |
39% |
46% |
|
Do not agree (1-3) |
19% |
17% |
17% |
22% |
20% |
19% |
22% |
22%68 |
9% |
|
Don’t know |
13% |
17% |
11% |
8% |
16% |
18% |
14% |
10% |
8% |
|
Over the past 12 months, I’ve needed to spend less time searching for food safety information I require |
|||||||||
|
Strongly agree (6-7) |
26% |
21% |
29% |
26% |
27% |
20% |
22% |
33% |
26% |
|
Somewhat agree (4-5) |
35% |
32% |
38% |
33% |
36% |
41% |
35% |
32% |
36% |
|
Do not agree (1-3) |
28% |
36% |
27% |
26% |
28% |
27% |
26% |
28% |
34% |
|
I do not search for food safety information |
9% |
6% |
5% |
14%68 |
10% |
11% |
15%68 |
6% |
4% |
|
Don’t know |
1% |
4% |
2% |
2% |
- |
2% |
2% |
1% |
1% |
68 When data tables are presented, the asterisks indicate that the result is statistically significantly different from results in other columns.
|
|
|
Industry Sector |
Company Size |
||||||
|
|
Total (n=370) |
Agriculture (n=49) |
Processor/Manufacturer (n=170) |
Wholesaler/Distributor (n=87) |
Retailer (n=64) |
Micro (n=63) |
Small (n=90) |
Medium (n=179) |
Large (n=37) |
|
Over the past 12 months, I’ve needed to spend less time searching for food safety information I require |
|||||||||
|
Strongly agree (6-7) |
31% |
36% |
32% |
25% |
32% |
31% |
27% |
30% |
48%69 |
|
Somewhat agree (4-5) |
33% |
27% |
38%69 |
39%69 |
23% |
31% |
30% |
37%69 |
20% |
|
Do not agree (1-3) |
26% |
28% |
24% |
21% |
35% |
18% |
32% |
27% |
26% |
|
I do not search for food safety information |
6% |
7% |
3% |
8% |
8% |
16%69 |
8%69 |
2% |
- |
|
Don’t know |
4% |
2% |
3% |
7% |
3% |
4% |
3% |
4% |
6% |
|
CFIA takes the needs of businesses into account when developing new regulatory information products |
|||||||||
|
Strongly agree (6-7) |
31% |
31% |
31% |
32% |
30% |
29% |
28% |
33% |
38% |
|
Somewhat agree (4-5) |
36% |
36% |
39% |
39% |
30% |
29% |
30% |
42% |
42% |
|
Do not agree (1-3) |
21% |
25% |
19% |
19% |
22% |
23% |
24% |
19% |
18% |
|
Don’t know |
12% |
7% |
10% |
10% |
18% |
19%69 |
18%69 |
6% |
3% |
69 When data tables are presented, the asterisks indicate that the result is statistically significantly different from results in other columns.
Regional results for these two metrics are also quite consistent. Companies in Western Canada are more likely to disagree that they needed to spend less time searching for food safety information in the past 12 months. In Wave 1, Quebec companies stand apart from those in other regions in that they are less likely to “strongly agree” with both metrics.
|
|
|
Region |
|||
|
|
Total (n=500) |
Atlantic (n=47) |
Quebec (n=150) |
Ontario (n=134) |
West (n=169) |
|
CFIA takes the needs of businesses into account when developing new regulatory information products |
|||||
|
Strongly agree (6-7) |
29% |
41% |
28% |
27% |
32% |
|
Somewhat agree (4-5) |
39% |
33% |
40% |
43% |
34% |
|
Do not agree (1-3) |
19% |
18% |
17% |
19% |
21% |
|
Don’t know |
13% |
8% |
15% |
12% |
13% |
|
Over the past 12 months, I’ve needed to spend less time searching for food safety information I require |
|||||
|
Strongly agree (6-7) |
26% |
27% |
27% |
27% |
25% |
|
Somewhat agree (4-5) |
35% |
37% |
28% |
43%70 |
29% |
|
Do not agree (1-3) |
28% |
25% |
29% |
22% |
36%70 |
|
I do not search for food safety information |
9% |
8% |
13% |
7% |
9% |
|
Don’t know |
1% |
3% |
2% |
1% |
1% |
70 When data tables are presented, the asterisks indicate that the result is statistically significantly different from results in other columns.
|
|
|
Region |
|||
|
|
Total (n=370) |
Atlantic (n=40) |
Quebec (n=59) |
Ontario (n=106) |
West (n=165) |
|
Over the past 12 months, I’ve needed to spend less time searching for food safety information I require |
|||||
|
Strongly agree (6-7) |
31% |
37% |
19% |
35%71 |
31% |
|
Somewhat agree (4-5) |
33% |
30% |
27% |
35% |
33% |
|
Do not agree (1-3) |
26% |
28% |
39% |
21% |
27% |
|
I do not search for food safety information |
6% |
2% |
10% |
6% |
6% |
|
Don’t know |
4% |
3% |
4% |
3% |
4% |
|
CFIA takes the needs of businesses into account when developing new regulatory information products |
|||||
|
Strongly agree (6-7) |
31% |
35% |
19% |
34%71 |
34%71 |
|
Somewhat agree (4-5) |
36% |
52%71 |
39% |
36% |
33% |
|
Do not agree (1-3) |
21% |
13% |
30% |
19% |
21% |
|
Don’t know |
12% |
- |
13% |
12% |
13% |
71 When data tables are presented, the asterisks indicate that the result is statistically significantly different from results in other columns.
Overall Satisfaction with CFIA
Over 2 in 5 respondents (45%) felt very satisfied with the overall service received from CFIA in the past 12 months. Another 33% were somewhat satisfied and roughly 1 in 10 were not very satisfied. An important proportion (13%) did not provide a rating, possibly because they had not interacted with CFIA over the past 12 months or they never interact with CFIA. Results from Wave 1 are similar to these results.
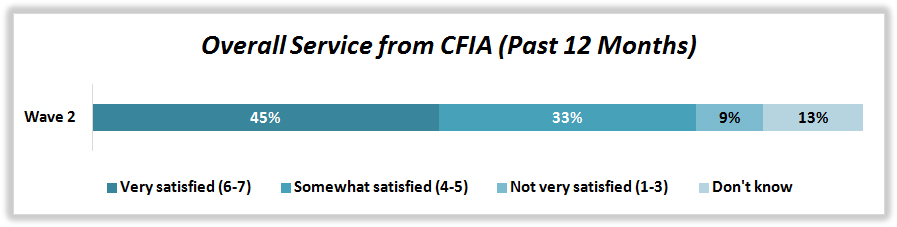
G2: Thinking about the overall service received from the CFIA in the last 12 months, rate your overall satisfaction. Use a scale from 1-7 where 1 is not at all satisfied and 7 is very satisfied. Base: Businesses not exclusively in retail, Wave 2, n=500.
The chart presents the survey response of the respondents in wave 2 on the level of satisfaction with the overall service from CFIA during the past 12 months, and which infers the following data: Very satisfied (6 to 7)- 45 percent, Somewhat satisfied (4 to 5)- 33 percent, Not very satisfied (1 to 3)- 9 percent, and Don’t know- 13 percent.
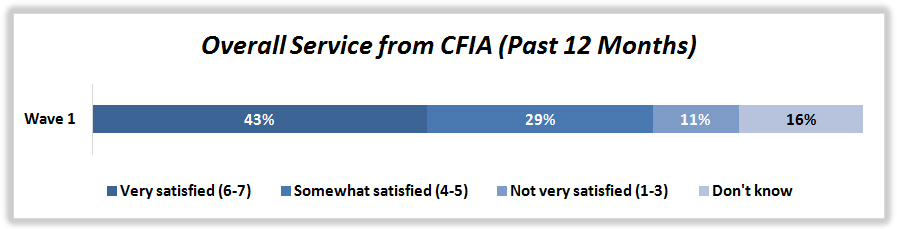
G2: Thinking about the overall service received from the CFIA in the last 12 months, rate your overall satisfaction. Use a scale from 1-7 where 1 is not at all satisfied and 7 is very satisfied. Base: Businesses not exclusively in retail, Wave 1, n=370.
The chart presents the survey response of the respondents in wave 1 on the level of satisfaction with the overall service from CFIA during the past 12 months, and which infers the following data: Very satisfied (6 to 7)- 43 percent, Somewhat satisfied (4 to 5)- 29 percent, Not very satisfied (1 to 3)- 11 percent, and Don’t know- 16 percent.
Satisfaction ratings are consistent across industry sectors. A noteworthy proportion of micro and small businesses “don’t know” CFIA well enough to provide a rating, although it is also worth noting that 15% of micro businesses indicated they were not very satisfied. In Wave 1, medium and large business satisfaction levels were fairly strong, especially among large companies where 65% indicated they were very satisfied.
|
|
|
Industry Sector |
Company Size |
||||||
|
|
Total (n=500) |
Agriculture (n=99) |
Processor/Manufacturer (n=198) |
Wholesaler/Distributor (n=137) |
Retailer (n=66) |
Micro (n=98) |
Small (n=105) |
Medium (n=224) |
Large (n=70) |
|
Very satisfied (6-7) |
45% |
42% |
52% |
47% |
40% |
40% |
47% |
42% |
57% |
|
Somewhat satisfied (4-5) |
33% |
38% |
31% |
31% |
35% |
28% |
26% |
40% |
37% |
|
Not very satisfied (1-3) |
9% |
7% |
7% |
7% |
11% |
15%72 |
6% |
8% |
3% |
|
Don’t know |
13% |
13% |
10% |
15% |
14% |
17%72 |
21%72 |
10%72 |
3% |
72 When data tables are presented, the asterisks indicate that the result is statistically significantly different from results in other columns.
|
|
|
Industry Sector |
Company Size |
||||||
|
|
Total (n=370) |
Agriculture (n=49) |
Processor/Manufacturer (n=170) |
Wholesaler/Distributor (n=87) |
Retailer (n=64) |
Micro (n=63) |
Small (n=90) |
Medium (n=179) |
Large (n=37) |
|
Very satisfied (6-7) |
43% |
36% |
50% |
44% |
39% |
31% |
38% |
48%73 |
65%73 |
|
Somewhat satisfied (4-5) |
29% |
36% |
31% |
29% |
24% |
35% |
20% |
33%73 |
29% |
|
Not very satisfied (1-3) |
11% |
8% |
9% |
14% |
14% |
7% |
18%73 |
10% |
5% |
|
Don’t know |
16% |
20% |
10% |
13% |
24%73 |
27%73 |
24%73 |
9% |
- |
73 When data tables are presented, the asterisks indicate that the result is statistically significantly different from results in other columns.
As with Wave 1, regional results show that satisfaction ratings are strong in Atlantic Canada. Sixty-five percent of respondents indicated they were very satisfied. Quebec businesses stand apart from the other regions especially because 24% “don’t know” CFIA well enough to provide a rating.
|
|
|
Region |
|||
|
|
Total (n=500) |
Atlantic (n=47) |
Quebec (n=150) |
Ontario (n=134) |
West (n=169) |
|
Very satisfied (6-7) |
45% |
65%74 |
43% |
43% |
45% |
|
Somewhat satisfied (4-5) |
33% |
21% |
26% |
37% |
36% |
|
Not very satisfied (1-3) |
9% |
5% |
7% |
11% |
7% |
|
Don’t know |
13% |
8% |
24%74 |
9% |
12% |
74 When data tables are presented, the asterisks indicate that the result is statistically significantly different from results in other columns.
|
|
|
Region |
|||
|
|
Total (n=370) |
Atlantic (n=40) |
Quebec (n=59) |
Ontario (n=106) |
West (n=165) |
|
Very satisfied (6-7) |
43% |
62%75 |
27% |
47%75 |
43%75 |
|
Somewhat satisfied (4-5) |
29% |
33% |
30% |
27% |
30% |
|
Not very satisfied (1-3) |
11% |
3% |
5% |
13% |
14%75 |
|
Don’t know |
16% |
2% |
37%75 |
12% |
13% |
75 When data tables are presented, the asterisks indicate that the result is statistically significantly different from results in other columns.
Satisfaction ratings were also analyzed based on whether or not a business had been inspected by CFIA over the past 12 months. Results show that satisfaction ratings increase among those who have been inspected. Fully 60% of these businesses are very satisfied and another 34% are somewhat satisfied. Among those who have not been inspected, 34% are very satisfied and 33% are somewhat satisfied however fully 22% did not know how to rate CFIA. A similar pattern was observed from Wave 1 results.
|
|
|
Inspected by CFIA |
|
|
|
Total (n=500) |
Have been (n=219) |
Have not been (n=281) |
|
Very satisfied (6-7) |
45% |
60%76 |
34% |
|
Somewhat satisfied (4-5) |
33% |
34% |
33% |
|
Not very satisfied (1-3) |
9% |
5% |
11%76 |
|
Don’t know |
13% |
1% |
22%76 |
76 When data tables are presented, the asterisks indicate that the result is statistically significantly different from results in other columns.
|
|
|
Inspected by CFIA |
|
|
|
Total (n=370) |
Have been (n=189) |
Have not been (n=181) |
|
Very satisfied (6-7) |
43% |
63%77 |
26% |
|
Somewhat satisfied (4-5) |
29% |
29% |
30% |
|
Not very satisfied (1-3) |
11% |
7% |
15%77 |
|
Don’t know |
16% |
1% |
29%77 |
77 When data tables are presented, the asterisks indicate that the result is statistically significantly different from results in other columns.
Respondents were asked to expand on their satisfaction rating. Results in the grid on the next page have been presented based on respondent satisfaction segments. Those who indicated “don’t know” when asked to rate their satisfaction with CFIA are not included in this analysis.
The quality of customer service, high quality of information provided by CFIA, and its responsive service all seem to be key satisfaction drivers. Among those “very satisfied”, 43% provided this rating because they felt CFIA is helpful and provides good customer service, 20% because of the high quality information CFIA provided and another 20% because the service is seen as responsive. In addition, 29% of these respondents have had no problems or issues with CFIA’s service that would otherwise lead them to provide a lower rating.
Among those who were “somewhat satisfied”, we start seeing room for improvement becoming a prominent reason behind the rating. The quality of the customer service is also a factor, with some indicating it is positive and others indicating the service is poor. We also see more respondents indicating they require more information and have not heard from CFIA and that it is difficult to keep up with regulations and processes.
Finally, those the least satisfied especially argue for better customer service, more information from CFIA and that it is difficult to keep up with regulations and processes.
Many in the two lowest satisfaction segments (19% and 44% respectively) did not provide an explanation for their satisfaction rating. These results and trends are very similar to those obtained in Wave 1.
|
Among Businesses Very Satisfied with CFIA (Satisfaction Rating of 6 or 7) |
Among Businesses Somewhat Satisfied with CFIA (Satisfaction Rating of 4 or 5) |
Among Businesses Not Very Satisfied with CFIA (Satisfaction Rating of 1 to 3) |
|||
|
n=232 |
n=161 |
n=38 |
|||
|
Helpful / good customer service |
43% |
Require more information / haven’t heard from them |
23% |
Difficult to keep up with regulations / process |
19% |
|
No problems / no issues |
29% |
Difficult to keep up with regulations / process |
18% |
Require more information / haven’t heard from them |
17% |
|
High quality of information provided |
20% |
Unhelpful / poor customer service |
13% |
Unhelpful / poor customer service |
16% |
|
Responsive service |
20% |
Helpful / good customer service |
13% |
No problems / no issues |
7% |
|
Require more information / haven’t heard from them |
8% |
No problems / no issues |
11% |
Room for improvement (general) |
5% |
|
Room for improvement (general) |
7% |
Room for improvement (general) |
11% |
Helpful / good customer service |
3% |
|
Unhelpful / poor customer service |
2% |
High quality of information provided |
10% |
Room for improvement - website |
2% |
|
Difficult to keep up with regulations / process |
1% |
Room for improvement - website |
6% |
Other |
3% |
|
Room for improvement - website |
1% |
Responsive service |
6% |
Don’t know/ Refused |
44% |
|
Other |
4% |
Other |
9% |
|
|
|
Don’t know/ Refused |
9% |
Don’t know/ Refused |
19% |
|
|
|
Among Businesses Very Satisfied with CFIA (Satisfaction Rating of 6 or 7) |
Among Businesses Somewhat Satisfied with CFIA (Satisfaction Rating of 4 or 5) |
Among Businesses Not Very Satisfied with CFIA (Satisfaction Rating of 1 to 3) |
|||
|
n=169 |
n=110 |
n=39 |
|||
|
Helpful / good customer service |
50% |
Room for improvement (general) |
20% |
Unhelpful / poor customer service |
21% |
|
No problems / no issues |
23% |
Unhelpful / poor customer service |
18% |
Require more information / haven’t heard from them |
18% |
|
High quality of information provided |
21% |
Helpful / good customer service |
12% |
Difficult to keep up with regulations / process |
17% |
|
Responsive service |
17% |
Require more information / haven’t heard from them |
11% |
Helpful / good customer service |
7% |
|
Room for improvement (general) |
7% |
Difficult to keep up with regulations / process |
10% |
Room for improvement (general) |
4% |
|
Require more information / haven’t heard from them |
6% |
Responsive service |
9% |
Room for improvement - website |
1% |
|
Unhelpful / poor customer service |
4% |
No problems / no issues |
8% |
Other |
2% |
|
Difficult to keep up with regulations / process |
3% |
High quality of information provided |
6% |
Don’t know/ Refused |
38% |
|
Room for improvement - website |
2% |
Room for improvement - website |
4% |
||
|
Other |
3% |
Other |
4% |
||
|
Don’t know/ Refused |
6% |
Don’t know/ Refused |
20% |
||
Finding Food Safety Information
Roughly one in three (34%) respondents indicate that they do not have any challenges when it comes to finding this kind of information The main challenges for businesses when it comes to finding food safety information are the lack of clear information (15%), too much information (11%), and the CFIA website not being easy to navigate (11%). Other common challenges included the time-consuming nature of researching information, and the lack of notifications, among others.
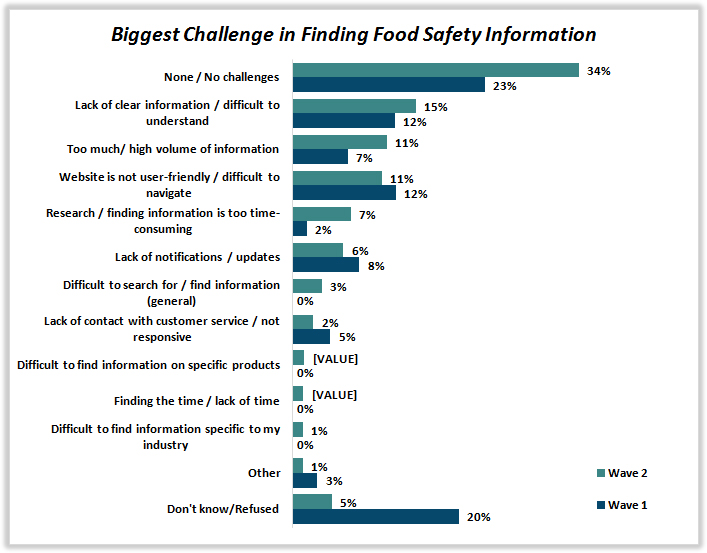
G4: In your opinion, what is the biggest challenge in finding information on food safety regulations or requirements. Base: Businesses not exclusively in retail, Wave, n=500, Wave 1, n=370.
A horizontal bar graph presents the main challenges when it comes to finding food safety information on the CFIA website. The graph shows a set of two bars for each source that represents both wave 1 and wave 2, with the following data:
For Wave 1, the following list presents the respondent's main challenges when it comes to finding food safety information on the CFIA website.
- None / No challenges: 23%
- Lack of clear information / difficult to understand: 12%
- Too much/ high volume of information: 7%
- Website is not user-friendly / difficult to navigate: 12%
- Research / finding information is too time-consuming: 2%
- Lack of notifications / updates: 8%
- Difficult to search for / find information(general): 0%
- Lack of contact with customer service / not responsive: 5%
- Difficult to find information on specific products: 0%
- Finding the time / lack of time: 0%
- Difficult to find information specific to my industry: 0%
- Other: 3%
- Don't know/Refused: 20%
For Wave 2, the following list presents the respondent's main challenges when it comes to finding food safety information on the CFIA website.
- None / No challenges: 34%
- Lack of clear information / difficult to understand: 15%
- Too much/ high volume of information: 11%
- Website is not user-friendly / difficult to navigate: 11%
- Research / finding information is too time-consuming: 7%
- Lack of notifications / updates: 6%
- Difficult to search for / find information(general): 3%
- Lack of contact with customer service / not responsive: 2%
- Difficult to find information on specific products: 1%
- Finding the time / lack of time: 1%
- Difficult to find information specific to my industry: 1%
- Other: 1%
- Don't know/Refused: 5%
When it comes to finding information on food safety regulations or requirements, businesses in the processor or manufacturer sector, and those in the agriculture sector are more likely to face the challenge of lack of information or feeling the information is difficult to understand. Businesses in the processor and manufacturer sector are also more likely to find the website not user friendly and feel the task is time-consuming.
In terms of business size, challenges with the high volume of information available pose a challenge to small- and medium-sized businesses.
|
|
|
Industry Sector |
Company Size |
||||||
|
|
Total (n=500) |
Agriculture (n=99) |
Processor/Manufacturer (n=198) |
Wholesaler/Distributor (n=137) |
Retailer (n=66) |
Micro (n=98) |
Small (n=105) |
Medium (n=224) |
Large (n=70) |
|
Lack of clear information / difficult to understand |
15% |
20%78 |
22%78 |
15% |
8% |
12% |
9% |
18% |
19% |
|
Too much information / high volume of information |
11% |
6% |
8% |
13% |
15% |
10% |
13%78 |
14%78 |
3% |
|
Website is not user-friendly / difficult to navigate |
11% |
11% |
17%78 |
7% |
8% |
9% |
9% |
11% |
13% |
|
Research / finding information is too time-consuming |
7% |
2% |
9%78 |
7% |
7% |
4% |
7% |
9% |
4% |
|
Lack of notifications / updates |
6% |
3% |
4% |
4% |
10% |
9% |
7% |
3% |
10% |
|
Difficult to search for / find information (general) |
3% |
3% |
5% |
2% |
3% |
4% |
1% |
4% |
4% |
|
Lack of contact with customer service / not responsive |
2% |
2% |
4% |
5% |
- |
2% |
1% |
4% |
2% |
|
Difficult to find information on specific products |
1% |
- |
2% |
- |
2% |
- |
4% |
1% |
1% |
|
Finding the time / lack of time |
1% |
4% |
1% |
- |
1% |
1% |
2% |
1% |
1% |
|
Difficult to find information specific to my industry |
1% |
1% |
1% |
3% |
- |
- |
1% |
2% |
2% |
|
Difficult to find import / export information |
<1% |
2% |
- |
- |
- |
- |
- |
- |
1% |
|
Other |
1% |
3% |
1% |
1% |
1% |
3% |
- |
2% |
- |
|
None / No challenges |
34% |
34% |
23% |
39%78 |
39%78 |
44%78 |
36% |
28% |
35% |
|
Don’t Know/Refused |
5% |
8% |
3% |
4% |
5% |
2% |
9% |
3% |
4% |
78 When data tables are presented, the asterisks indicate that the result is statistically significantly different from results in other columns.
|
|
|
Industry Sector |
Company Size |
||||||
|
|
Total (n=370) |
Agriculture (n=49) |
Processor/Manufacturer (n=170) |
Wholesaler/Distributor (n=87) |
Retailer (n=64) |
Micro (n=63) |
Small (n=90) |
Medium (n=179) |
Large (n=37) |
|
Difficult to search for / find information (general) |
18% |
13% |
22% |
20% |
15% |
16% |
18% |
19% |
18% |
|
Website isn’t user-friendly / is difficult to navigate |
12% |
11% |
12% |
13% |
12% |
6% |
11% |
14%79 |
23%79 |
|
Lack of clear information / difficult to understand |
12% |
24%79 |
10% |
13% |
7% |
10% |
11% |
14% |
15% |
|
Lack of notifications / updates |
8% |
10% |
7% |
7% |
9% |
2% |
12%79 |
9%79 |
4% |
|
Too much information / high volume of information |
7% |
5% |
8% |
8% |
4% |
6% |
2% |
9%79 |
7% |
|
Lack of contact with customer service / not responsive |
5% |
4% |
5% |
6% |
2% |
7% |
5% |
3% |
7% |
|
Difficult to find information on specific products |
4% |
3% |
7%79 |
2% |
5% |
8%79 |
1% |
4% |
8% |
|
Difficult to find information specific to my industry |
3% |
5% |
5% |
3% |
- |
3% |
1% |
5%79 |
3% |
|
Difficult to find import / export information |
3% |
5% |
3% |
2% |
2% |
4% |
2% |
2% |
6% |
|
Finding the time / lack of time |
2% |
2% |
2% |
1% |
5% |
3% |
4% |
1% |
3% |
|
Research / finding information is too time-consuming |
2% |
- |
2% |
4% |
- |
4% |
1% |
1% |
- |
|
Other |
3% |
2% |
2% |
- |
7% |
5% |
2% |
3% |
- |
|
None / no challenges |
23% |
21% |
23% |
24% |
23% |
21% |
25% |
24% |
16% |
|
Don’t know/ Refused |
20% |
21% |
15% |
25%79 |
20% |
24% |
20% |
19% |
15% |
79 When data tables are presented, the asterisks indicate that the result is statistically significantly different from results in other columns.
Only a few differences stand out across regions. Too much information and lack of notifications are more of a challenge for businesses in Ontario (15%), while the time-consuming nature of finding information is a challenge for businesses in Quebec (15%).
|
|
|
Region |
|||
|
|
Total (n=500) |
Atlantic (n=47) |
Quebec (n=150) |
Ontario (n=134) |
West (n=169) |
|
Lack of clear information / difficult to understand |
15% |
13% |
15% |
17% |
12% |
|
Too much information / high volume of information |
11% |
4% |
7% |
15%80 |
11% |
|
Website is not user-friendly / difficult to navigate |
11% |
17% |
8% |
9% |
13% |
|
Research / finding information is too time-consuming |
7% |
5% |
15%80 |
6% |
4% |
|
Lack of notifications / updates |
6% |
3% |
2% |
9%80 |
5% |
|
Difficult to search for / find information (general) |
3% |
3% |
7% |
2% |
4% |
|
Lack of contact with customer service / not responsive |
2% |
1% |
4% |
2% |
3% |
|
Difficult to find information on specific products |
1% |
2% |
<1% |
2% |
1% |
|
Finding the time / lack of time |
1% |
6% |
2% |
<1% |
<1% |
|
Difficult to find information specific to my industry |
1% |
- |
2% |
1% |
2% |
|
Difficult to find import / export information |
<1% |
- |
- |
<1% |
- |
|
Other |
1% |
- |
1% |
<1% |
2% |
|
None / No challenges |
34% |
31% |
34% |
33% |
38% |
|
Don’t Know/Refused |
5% |
14%80 |
3% |
4% |
5% |
80 When data tables are presented, the asterisks indicate that the result is statistically significantly different from results in other columns.
|
|
|
Region |
|||
|
|
Total (n=370) |
Atlantic (n=40) |
Quebec (n=59) |
Ontario (n=106) |
West (n=165) |
|
Difficult to search for / find information (general) |
18% |
21% |
24% |
17% |
16% |
|
Website isn’t user-friendly / is difficult to navigate |
12% |
24%81 |
10% |
14% |
10% |
|
Lack of clear information / difficult to understand |
12% |
12% |
6% |
16%81 |
11% |
|
Lack of notifications / updates |
8% |
12% |
7% |
9% |
7% |
|
Too much information / high volume of information |
7% |
13%81 |
3% |
6% |
8% |
|
Lack of contact with customer service / not responsive |
5% |
2% |
4% |
5% |
5% |
|
Difficult to find information on specific products |
4% |
- |
3% |
6% |
5% |
|
Difficult to find information specific to my industry |
3% |
- |
1% |
4% |
4% |
|
Difficult to find import / export information |
3% |
3% |
3% |
2% |
3% |
|
Finding the time / lack of time |
2% |
- |
- |
3% |
3% |
|
Research / finding information is too time-consuming |
2% |
- |
1% |
2% |
2% |
|
Other |
3% |
- |
5% |
- |
6% |
|
None / no challenges |
23% |
19% |
36%81 |
18% |
23% |
|
Don’t know/ Refused |
20% |
16% |
14% |
25%81 |
17% |
81 When data tables are presented, the asterisks indicate that the result is statistically significantly different from results in other columns.
When asked specifically to identify the topics for which information was difficult to find, nearly half (48%) of all respondents felt there was no topic in particular. Some topics identified included new regulations or changes to rules (16%), labelling (9%), and food products (6%).
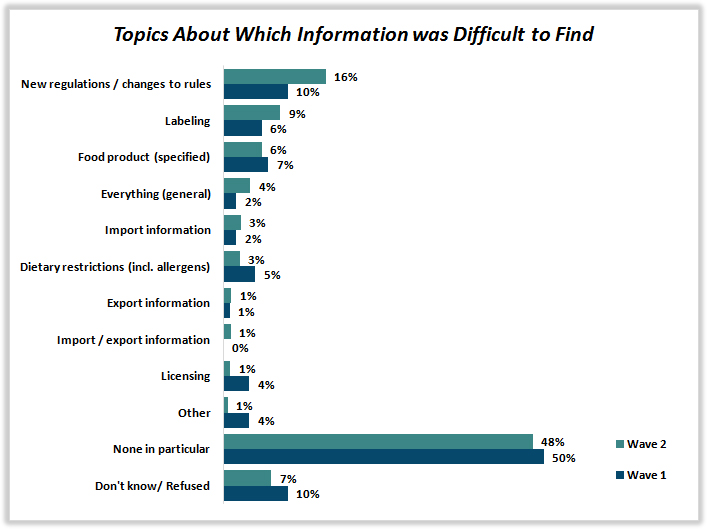
G4A: What were some of the food safety topics you felt were difficult to get clear information on? Base: Businesses not exclusively in retail, Wave 2, n=500, Wave 1, n=370.
A horizontal bar graph identifies topics respondents indicated information was difficult to find on the CFIA website. The graph shows a set of two bars for each source that represents both wave 1 and wave 2, with the following data:
For Wave 1, the following list presents respondent's specific topics they had difficulty finding on the CFIA website.
- New regulations / changes to rules: 10%
- Labeling: 6%
- Food product (specified): 7%
- Everything (general): 2%
- Import information: 2%
- Dietary restrictions (incl. allergens): 5%
- Export information: 1%
- Import / export information: 0%
- Licensing: 4%
- Other: 4%
- None in particular: 50%
- Don't know/ Refused: 10%
For Wave 2, the following list presents respondent's specific topics they had difficulty finding on the CFIA website.
- New regulations / changes to rules: 16%
- Labeling: 9%
- Food product (specified): 6%
- Everything (general): 4%
- Import information: 3%
- Dietary restrictions (incl. allergens): 3%
- Export information: 1%
- Import / export information: 1%
- Licensing: 1%
- Other: 1%
- None in particular: 48%
- Don't know/ Refused: 7%
Businesses in the processor or manufacturer sector are more likely to say it is difficult to find food product information and export information. Businesses in the agricultural sector are more likely to say there is no topic in particular that is challenging, while those in the wholesale or distribution sector are more likely to say everything was difficult to find.
Micro-, small- and medium-sized businesses are more likely to say labeling information was difficult to find, compared to large companies.
|
|
|
Industry Sector |
Company Size |
||||||
|
|
Total (n=500) |
Agriculture (n=99) |
Processor/Manufacturer (n=198) |
Wholesaler/Distributor (n=137) |
Retailer (n=66) |
Micro (n=98) |
Small (n=105) |
Medium (n=224) |
Large (n=70) |
|
New regulations / changes to rules |
16% |
11% |
16% |
17% |
17% |
20% |
14% |
14% |
19% |
|
Labeling |
9% |
4% |
8% |
6% |
13% |
10%82 |
9%82 |
11%82 |
2% |
|
Food product (specified) |
6% |
4% |
10%82 |
9% |
2% |
5% |
6% |
8% |
2% |
|
Everything (general) |
4% |
6% |
4% |
8%82 |
1% |
2% |
6% |
6% |
2% |
|
Import information |
3% |
<1% |
3% |
3% |
4% |
2% |
4% |
3% |
2% |
|
Dietary restrictions (incl. allergens) |
3% |
- |
6% |
4% |
- |
2% |
2% |
3% |
4% |
|
Export information |
1% |
- |
4%82 |
<1% |
- |
- |
- |
2% |
3% |
|
Import / export information |
1% |
4% |
1% |
1% |
- |
- |
- |
1% |
4% |
|
Licensing |
1% |
3% |
2% |
1% |
- |
1% |
- |
2% |
2% |
|
Other |
1% |
- |
1% |
- |
1% |
3% |
<1% |
- |
- |
|
None in particular |
48% |
59%82 |
42% |
46% |
50% |
52% |
51% |
44% |
48% |
|
Don’t know/ Refused |
7% |
8% |
3% |
5% |
12%82 |
5% |
8% |
7% |
12% |
82 When data tables are presented, the asterisks indicate that the result is statistically significantly different from results in other columns.
|
|
|
Industry Sector |
Company Size |
||||||
|
|
Total (n=370) |
Agriculture (n=49) |
Processor/Manufacturer (n=170) |
Wholesaler/Distributor (n=87) |
Retailer (n=64) |
Micro (n=63) |
Small (n=90) |
Medium (n=179) |
Large (n=37) |
|
New regulations / changes to rules |
10% |
5% |
18%83 |
8% |
4% |
4% |
4% |
13%83 |
28%83 |
|
Food product (specified) |
7% |
7% |
7% |
9% |
7% |
7% |
9% |
7% |
5% |
|
Labeling |
6% |
3% |
9%83 |
7%83 |
1% |
3% |
6% |
6% |
6% |
|
Dietary restrictions (incl. allergens) |
5% |
- |
7% |
4% |
5% |
2% |
5% |
7%83 |
- |
|
Licensing |
4% |
4% |
4% |
5% |
2% |
3% |
3% |
5% |
- |
|
Everything (general) |
2% |
- |
1% |
2% |
5% |
- |
5% |
1% |
2% |
|
Import information |
2% |
2% |
2% |
2% |
2% |
5% |
1% |
1% |
3% |
|
Export information |
1% |
1% |
2% |
- |
- |
- |
1% |
1% |
- |
|
Other |
4% |
7% |
2% |
6% |
4% |
1% |
6%83 |
4% |
5% |
|
None in particular |
50% |
51% |
37% |
52%83 |
64%83 |
65%83 |
47% |
46% |
44% |
|
Don’t know/ Refused |
10% |
20%83 |
12% |
7% |
6% |
10% |
13% |
9% |
7% |
83 When data tables are presented, the asterisks indicate that the result is statistically significantly different from results in other columns.
Other than information on new regulations and changes to rules in Ontario and Western Canada, there are no other noteworthy differences from a regional perspective.
|
|
|
Region |
|||
|
|
Total (n=500) |
Atlantic (n=47) |
Quebec (n=150) |
Ontario (n=134) |
West (n=169) |
|
New regulations / changes to rules |
16% |
13% |
7% |
16%84 |
22%84 |
|
Labeling |
9% |
8% |
6% |
11% |
8% |
|
Food product (specified) |
6% |
5% |
9% |
6% |
4% |
|
Everything (general) |
4% |
5% |
6% |
3% |
4% |
|
Import information |
3% |
4% |
3% |
4% |
0% |
|
Dietary restrictions (incl. allergens) |
3% |
1% |
1% |
5% |
1% |
|
Export information |
1% |
- |
1% |
2% |
1% |
|
Import / export information |
1% |
5% |
0% |
1% |
1% |
|
Licensing |
1% |
- |
1% |
2% |
1% |
|
Other |
1% |
- |
3% |
- |
- |
|
None in particular |
48% |
48% |
55% |
42% |
53% |
|
Don’t know/ Refused |
7% |
10% |
6% |
10% |
4% |
84 When data tables are presented, the asterisks indicate that the result is statistically significantly different from results in other columns.
|
|
|
Region |
|||
|
|
Total (n=370) |
Atlantic (n=40) |
Quebec (n=59) |
Ontario (n=106) |
West (n=165) |
|
New regulations / changes to rules |
10% |
5% |
11% |
6% |
14%85 |
|
Food product (specified) |
7% |
13% |
6% |
8% |
6% |
|
Labeling |
6% |
9% |
6% |
6% |
4% |
|
Dietary restrictions (incl. allergens) |
5% |
- |
2% |
7% |
5% |
|
Licensing |
4% |
- |
- |
7%85 |
2% |
|
Everything (general) |
2% |
1% |
5% |
1% |
1% |
|
Import information |
2% |
- |
3% |
1% |
3% |
|
Export information |
1% |
3% |
- |
- |
1% |
|
Other |
4% |
1% |
- |
6% |
5% |
|
None in particular |
50% |
57% |
56% |
48% |
48% |
|
Don’t know/ Refused |
10% |
10% |
11% |
10% |
11% |
85 Lorsque les tableaux de données sont présentés, les astérisques indiquent que le résultat est statistiquement différent des résultats des autres colonnes.
Study Participant Profile
A variety of questions were asked to study participants to obtain information on their business. This information not only allowed the research team to understand the profile of those participating in the study, but also to weight the data and ensure results are representative of the population.
Note: All Results in this Section are Weighted.
|
Region |
Total (n=700) |
Business Activities |
Total (n=700) |
|
Atlantic Canada (NET) |
7% |
Sell food products at retail directly to consumers |
76% |
|
Newfoundland & Labrador |
2% |
Import food products |
25% |
|
Prince Edward Island |
1% |
Send or convey food products across provincial or territorial boundaries (wholesaler/ distributors) |
25% |
|
Nova Scotia |
3% |
Prepare, process, treat, manufacture or preserve food for export or to be sent across provincial or territorial boundaries |
25% |
|
New Brunswick |
2% |
Grade, label or package food for export or to be sent across provincial or territorial boundaries |
19% |
|
Quebec |
23% |
Export food products or prepare food for export |
14% |
|
Ontario |
36% |
Produce organic food [includes: organic meats, dairy, etc.] |
11% |
|
West (NET) |
34% |
Grow fruit, vegetables or grains for export or to be sent across provincial or territorial boundaries |
6% |
|
Manitoba |
4% |
Company Size |
|
|
Saskatchewan |
4% |
1 (Self-employed) |
7% |
|
Alberta |
12% |
2-4 employees |
21% |
|
British Columbia |
14% |
5-10 employees |
28% |
|
Nunavut |
<1% |
11-99 employees |
36% |
|
Northwest Territories |
- |
100-499 employees |
6% |
|
Type of Business |
|
500 employees or more |
2% |
|
Retailer |
61% |
Don’t know |
<1% |
|
Processor or Manufacturer |
17% |
Gross Annual Revenue |
|
|
Wholesaler or distributor |
14% |
$30,000 or less per year |
2% |
|
Agriculture |
8% |
Between $30,000 and less than $100,000 per year |
11% |
|
Indigenous |
|
Between $100,000 and less than $500,000 per year |
17% |
|
Yes |
6% |
Between $500,000 and less than $1 million per year |
14% |
|
No |
92% |
Between $1 million and less than $5 million per year |
21% |
|
Don’t know/Not sure |
2% |
$5 million or more per year |
11% |
|
Import locations |
|
Don’t know |
19% |
|
United States |
75% |
Refused |
5% |
|
Western Europe |
40% |
Export locations |
|
|
Asia (Pacific) |
27% |
United States |
93% |
|
Central America/ Caribbean |
27% |
Asia (Pacific) |
24% |
|
China |
21% |
Western Europe |
21% |
|
South America |
21% |
China |
20% |
|
Eastern Europe |
16% |
Eastern Europe |
14% |
|
India |
12% |
Central America/ Caribbean |
13% |
|
Australia |
12% |
South America |
11% |
|
Middle East |
9% |
Africa |
6% |
|
Africa |
8% |
Australia |
6% |
|
|
Middle East |
5% |
|
|
India |
3% |
||
|
Region |
Total (n=670) |
Business Activities |
Total (n=670) |
|
Atlantic Canada (NET) |
7% |
Sell food products at retail directly to consumers |
78% |
|
Newfoundland & Labrador |
2% |
Import food products |
23% |
|
Prince Edward Island |
1% |
Send or convey food products across provincial or territorial borders (wholesaler/ distributors) |
21% |
|
Nova Scotia |
3% |
Prepare, process, treat, manufacture or preserve food for export or to be sent across provincial or territorial borders |
16% |
|
New Brunswick |
2% |
Export food products or prepare food for export |
16% |
|
Quebec |
23% |
Grade, label or package food for export or to be sent across provincial or territorial borders |
14% |
|
Ontario |
36% |
Produce organic food [includes: organic meats, dairy, etc.] |
8% |
|
West (NET) |
34% |
Grow fruit, vegetables or grains for export or to be sent across provincial or territorial borders |
4% |
|
Manitoba |
4% |
Company Size |
|
|
Saskatchewan |
4% |
1 (Self-employed) |
4% |
|
Alberta |
12% |
2-4 employees |
24% |
|
British Columbia |
14% |
5-10 employees |
33% |
|
Nunavut |
<1% |
11-99 employees |
33% |
|
Northwest Territories |
<1% |
100-499 employees |
5% |
|
Type of Business |
|
500 employees or more |
<1% |
|
Retailer |
62% |
Don’t know |
1% |
|
Processor or Manufacturer |
16% |
Gross Annual Revenue |
|
|
Wholesaler or distributor |
13% |
$30,000 or less per year |
2% |
|
Agriculture |
8% |
Between $30,000 and less than $100,000 per year |
8% |
|
Indigenous |
|
Between $100,000 and less than $500,000 per year |
16% |
|
Yes |
7% |
Between $500,000 and less than $1 million per year |
16% |
|
No |
86% |
Between $1 million and less than $5 million per year |
22% |
|
Don’t know/Not sure |
7% |
$5 million or more per year |
11% |
|
|
Don’t know |
17% |
|
|
Refused |
9% |
||
|
|
|
Industry Sector |
Company Size |
||||||
|
|
Total (n=700) |
Agriculture (n=115) |
Processor/Manufacturer (n=227) |
Wholesaler/Distributor (n=146) |
Retailer (n=212) |
Micro (n=168) |
Small (n=168) |
Medium (n=290) |
Large (n=71) |
|
Atlantic (NET) |
7% |
9% |
7% |
9% |
7% |
8% |
7% |
7% |
10% |
|
Newfoundland & Labrador |
2% |
1% |
1% |
1% |
2% |
3% |
1% |
1% |
3% |
|
Prince Edward Island |
1% |
2% |
<1% |
<1% |
<1% |
1% |
<1% |
1% |
- |
|
Nova Scotia |
3% |
2% |
4% |
6% |
2% |
2% |
3% |
3% |
5% |
|
New Brunswick |
2% |
4% |
1% |
2% |
2% |
3% |
2% |
2% |
2% |
|
Quebec |
23% |
23% |
28% |
15% |
24% |
23% |
31% |
21% |
10% |
|
Ontario |
36% |
42% |
38% |
51% |
31% |
36% |
31% |
35% |
54% |
|
West (NET) |
34% |
26% |
27% |
26% |
38% |
33% |
31% |
38% |
26% |
|
Manitoba |
4% |
6% |
3% |
2% |
4% |
2% |
3% |
6% |
1% |
|
Saskatchewan |
4% |
1% |
3% |
1% |
5% |
5% |
5% |
3% |
3% |
|
Alberta |
12% |
9% |
7% |
6% |
15% |
16% |
13% |
10% |
6% |
|
British Columbia |
14% |
10% |
14% |
17% |
14% |
10% |
10% |
20% |
16% |
|
Nunavut |
<1% |
- |
- |
- |
<1% |
<1% |
- |
- |
- |
|
Northwest Territories |
- |
- |
- |
- |
- |
- |
- |
- |
- |
|
|
|
Industry Sector |
Company Size |
||||||
|
|
Total (n=670) |
Agriculture (n=52) |
Processor/Manufacturing (n=190) |
Wholesaler/Distributor (n=98) |
Retailer (n=330) |
Micro (n=225) |
Small (n=225) |
Medium (n=225) |
Large (n=225) |
|
Atlantic (NET) |
7% |
2% |
9% |
5% |
8% |
4% |
7% |
9% |
15% |
|
Newfoundland & Labrador |
2% |
1% |
1% |
2% |
2% |
2% |
1% |
1% |
2% |
|
Prince Edward Island |
1% |
1% |
1% |
0% |
0% |
0% |
0% |
1% |
1% |
|
Nova Scotia |
3% |
- |
5% |
2% |
3% |
1% |
3% |
4% |
6% |
|
New Brunswick |
2% |
- |
3% |
1% |
3% |
1% |
2% |
3% |
7% |
|
Quebec |
23% |
12% |
19% |
20% |
26% |
30% |
26% |
16% |
15% |
|
Ontario |
36% |
48% |
36% |
48% |
32% |
36% |
37% |
35% |
35% |
|
West (NET) |
34% |
38% |
36% |
27% |
34% |
30% |
30% |
40% |
35% |
|
Manitoba |
4% |
5% |
7% |
3% |
3% |
3% |
4% |
4% |
2% |
|
Saskatchewan |
4% |
4% |
4% |
1% |
4% |
4% |
4% |
3% |
4% |
|
Alberta |
12% |
16% |
12% |
9% |
12% |
12% |
11% |
12% |
14% |
|
British Columbia |
14% |
12% |
13% |
14% |
15% |
12% |
11% |
19% |
15% |
|
Nunavut |
<1% |
- |
0% |
- |
- |
- |
<1% |
<1% |
- |
|
Northwest Territories |
<1% |
- |
- |
- |
<1% |
- |
- |
<1% |
- |
|
|
|
Region |
Company Size |
||||||
|
|
Total (n=700) |
Atlantic (n=66) |
Quebec (n=221) |
Ontario (n=171) |
West (n=242) |
Micro (n=168) |
Small (n=168) |
Medium (n=290) |
Large (n=71) |
|
Retailer |
61% |
56% |
63% |
53% |
70% |
72% |
73% |
52% |
27% |
|
Processor or Manufacturer |
17% |
16% |
21% |
18% |
14% |
10% |
8% |
24% |
41% |
|
Wholesale or distributor |
14% |
17% |
9% |
20% |
11% |
12% |
14% |
14% |
19% |
|
Agriculture |
8% |
10% |
8% |
9% |
6% |
6% |
6% |
9% |
13% |
|
|
|
Region |
Company Size |
||||||
|
|
Total (n=670) |
Atlantic (n=72) |
Quebec (n=144) |
Ontario (n=173) |
West (n=281) |
Micro (n=166) |
Small (n=201) |
Medium (n=255) |
Large (n=45) |
|
Retailer |
62% |
68% |
71% |
55% |
63% |
75% |
74% |
45% |
33% |
|
Processor or Manufacturer |
16% |
21% |
13% |
16% |
18% |
7% |
10% |
27% |
39% |
|
Wholesale or distributor |
13% |
9% |
11% |
18% |
11% |
7% |
13% |
19% |
13% |
|
Agriculture |
8% |
2% |
4% |
11% |
9% |
11% |
3% |
9% |
15% |
|
|
|
Industry Sector |
Region |
||||||
|
|
Total (n=700) |
Agriculture (n=115) |
Processor/Manufacturer (n=227) |
Wholesaler/Distributor (n=146) |
Retailer (n=212) |
Atlantic (n=66) |
Quebec (n=221) |
Ontario (n=171) |
West (n=242) |
|
1 (Self-employed) |
7% |
3% |
3% |
4% |
8% |
|
7% |
7% |
7% |
|
2-4 employees |
21% |
19% |
13% |
20% |
24% |
30% |
20% |
21% |
21% |
|
5-10 employees |
28% |
20% |
13% |
27% |
33% |
27% |
37% |
24% |
25% |
|
11-99 employees |
36% |
44% |
51% |
38% |
31% |
33% |
33% |
36% |
41% |
|
100-499 employees |
6% |
9% |
16% |
9% |
2% |
7% |
2% |
10% |
5% |
|
500 employees or more |
2% |
4% |
3% |
2% |
1% |
4% |
2% |
2% |
1% |
|
Don’t know |
<1% |
1% |
1% |
- |
- |
- |
<1% |
<1% |
<1% |
|
|
|
Industry Sector |
Region |
||||||
|
|
Total (n=670) |
Agriculture (n=52) |
Processor/Manufacturing (n=190) |
Wholesaler/Distributor (n=98) |
Retailer (n=330) |
Atlantic (n=72) |
Quebec (n=144) |
Ontario (n=173) |
West (n=281) |
|
1 (Self-employed) |
4% |
13% |
2% |
4% |
3% |
3% |
2% |
5% |
4% |
|
2-4 employees |
24% |
26% |
10% |
12% |
30% |
13% |
34% |
23% |
21% |
|
5-10 employees |
33% |
12% |
21% |
33% |
39% |
32% |
37% |
34% |
29% |
|
11-99 employees |
33% |
39% |
54% |
47% |
24% |
40% |
23% |
33% |
39% |
|
100-499 employees |
5% |
10% |
12% |
5% |
2% |
10% |
3% |
5% |
5% |
|
500 employees or more |
<1% |
- |
1% |
- |
1% |
1% |
1% |
- |
<1% |
|
Don’t know |
1% |
- |
- |
- |
1% |
- |
- |
1% |
1% |
|
|
|
Industry Sector |
Region |
||||||
|
|
Total (n=700) |
Agriculture (n=115) |
Processor/Manufacturer (n=227) |
Wholesaler/Distributor (n=146) |
Retailer (n=212) |
Atlantic (n=66) |
Quebec (n=221) |
Ontario (n=171) |
West (n=242) |
|
$30,000 or less per year |
2% |
- |
1% |
0% |
3% |
3% |
7% |
1% |
- |
|
Between $30,000 and less than $100,000 per year |
11% |
9% |
4% |
4% |
15% |
16% |
5% |
14% |
10% |
|
Between $100,000 and less than $500,000 per year |
17% |
17% |
15% |
6% |
19% |
16% |
17% |
13% |
20% |
|
Between $500,000 and less than $1 million per year |
14% |
16% |
9% |
9% |
16% |
11% |
20% |
13% |
11% |
|
Between $1 million and less than $5 million per year |
21% |
26% |
24% |
25% |
18% |
17% |
20% |
18% |
25% |
|
$5 million or more per year |
11% |
19% |
17% |
28% |
5% |
11% |
9% |
12% |
12% |
|
Don’t know |
19% |
9% |
27% |
19% |
19% |
24% |
17% |
21% |
18% |
|
Refused |
5% |
4% |
4% |
9% |
4% |
2% |
5% |
7% |
4% |
|
|
|
Industry Sector |
Region |
||||||
|
|
Total (n=670) |
Agriculture (n=52) |
Processor/Manufacturing (n=190) |
Wholesaler /Distributor (n=98) |
Retailer (n=330) |
Atlantic (n=72) |
Quebec (n=144) |
Ontario (n=173) |
West (n=281) |
|
$30,000 or less per year |
2% |
2% |
2% |
1% |
2% |
2% |
3% |
2% |
3% |
|
Between $30,000 and less than $100,000 per year |
8% |
8% |
4% |
1% |
10% |
5% |
9% |
8% |
8% |
|
Between $100,000 and less than $500,000 per year |
16% |
20% |
13% |
11% |
17% |
9% |
12% |
20% |
15% |
|
Between $500,000 and less than $1 million per year |
16% |
22% |
12% |
9% |
17% |
14% |
20% |
13% |
16% |
|
Between $1 million and less than $5 million per year |
22% |
24% |
26% |
27% |
19% |
19% |
22% |
19% |
25% |
|
$5 million or more per year |
11% |
10% |
24% |
28% |
4% |
15% |
6% |
11% |
13% |
|
Don’t know |
17% |
6% |
14% |
16% |
19% |
25% |
14% |
19% |
15% |
|
Refused |
9% |
8% |
6% |
6% |
11% |
10% |
14% |
9% |
6% |
|
|
|
Company Size |
|||
|
|
Total (n=700) |
Micro (n=168) |
Small (n=168) |
Medium (n=290) |
Large (n=71) |
|
$30,000 or less per year |
2% |
8% |
- |
- |
- |
|
Between $30,000 and less than $100,000 per year |
11% |
24% |
15% |
1% |
- |
|
Between $100,000 and less than $500,000 per year |
17% |
27% |
22% |
7% |
5% |
|
Between $500,000 and less than $1 million per year |
14% |
12% |
18% |
15% |
1% |
|
Between $1 million and less than $5 million per year |
21% |
11% |
17% |
32% |
18% |
|
$5 million or more per year |
11% |
2% |
5% |
17% |
39% |
|
Don’t know |
19% |
10% |
17% |
25% |
32% |
|
Refused |
5% |
6% |
6% |
4% |
5% |
|
|
|
Company Size |
|||
|
|
Total (n=670) |
Micro (n=166) |
Small (n=201) |
Medium (n=255) |
Large (n=45) |
|
$30,000 or less per year |
2% |
7% |
1% |
- |
- |
|
Between $30,000 and less than $100,000 per year |
8% |
17% |
6% |
3% |
- |
|
Between $100,000 and less than $500,000 per year |
16% |
26% |
17% |
9% |
- |
|
Between $500,000 and less than $1 million per year |
16% |
18% |
19% |
11% |
12% |
|
Between $1 million and less than $5 million per year |
22% |
6% |
23% |
36% |
8% |
|
$5 million or more per year |
11% |
1% |
4% |
23% |
29% |
|
Don’t know |
17% |
17% |
18% |
11% |
38% |
|
Refused |
9% |
9% |
12% |
6% |
14% |
|
|
|
Industry Sector |
Region |
||||||
|
|
Total (n=700) |
Agriculture (n=115) |
Processor/Manufacturer (n=227) |
Wholesaler/Distributor (n=146) |
Retailer (n=212) |
Atlantic (n=66) |
Quebec (n=221) |
Ontario (n=171) |
West (n=242) |
|
Sell food products at retail directly to consumers |
76% |
43% |
52% |
34% |
96% |
82% |
80% |
68% |
81% |
|
Import food products |
25% |
15% |
33% |
56% |
17% |
23% |
15% |
33% |
23% |
|
Send or convey food products across provincial or territorial boundaries (wholesaler/ distributors) |
25% |
39% |
51% |
58% |
8% |
33% |
14% |
32% |
23% |
|
Prepare, process, treat, manufacture or preserve food for export or to be sent across provincial or territorial boundaries |
25% |
33% |
71% |
32% |
9% |
25% |
25% |
27% |
22% |
|
Grade, label or package food for export or to be sent across provincial or territorial boundaries |
19% |
42% |
58% |
23% |
5% |
27% |
15% |
22% |
18% |
|
Export food products or prepare food for export |
14% |
33% |
44% |
16% |
3% |
27% |
11% |
16% |
11% |
|
Produce organic food [includes: organic meats, dairy, etc.] |
11% |
18% |
23% |
8% |
8% |
9% |
16% |
12% |
9% |
|
Grow fruit, vegetables or grains for export or to be sent across provincial or territorial boundaries |
6% |
49% |
6% |
1% |
1% |
7% |
4% |
7% |
4% |
|
|
|
Industry Sector |
Region |
||||||
|
|
Total (n=670) |
Agriculture (n=52) |
Processor/Manufacturing (n=190) |
Wholesaler /Distributor (n=98) |
Retailer (n=330) |
Atlantic (n=72) |
Quebec (n=144) |
Ontario (n=173) |
West (n=281) |
|
Sell food products at retail directly to consumers |
78% |
34% |
48% |
39% |
99% |
74% |
84% |
75% |
78% |
|
Import food products |
23% |
10% |
36% |
56% |
14% |
19% |
15% |
26% |
25% |
|
Send or convey food products across provincial or territorial borders (wholesaler/ distributors) |
21% |
36% |
50% |
64% |
2% |
26% |
12% |
23% |
23% |
|
Prepare, process, treat, manufacture or preserve food for export or to be sent across provincial or territorial borders |
16% |
37% |
62% |
14% |
2% |
22% |
13% |
17% |
15% |
|
Export food products or prepare food for export |
16% |
33% |
48% |
28% |
2% |
26% |
8% |
18% |
16% |
|
Grade, label or package food for export or to be sent across provincial or territorial borders |
14% |
24% |
54% |
22% |
1% |
24% |
8% |
14% |
16% |
|
Produce organic food [includes: organic meats, dairy, etc.] |
8% |
28% |
17% |
10% |
3% |
5% |
5% |
9% |
10% |
|
Grow fruit, vegetables or grains for export or to be sent across provincial or territorial borders |
4% |
34% |
6% |
2% |
- |
3% |
4% |
5% |
3% |
|
|
|
Company Size |
|||
|
|
Total (n=700) |
Micro (n=168) |
Small (n=168) |
Medium (n=290) |
Large (n=71) |
|
Sell food products at retail directly to consumers |
76% |
81% |
81% |
76% |
45% |
|
Import food products |
25% |
17% |
20% |
27% |
59% |
|
Send or convey food products across provincial or territorial boundaries (wholesaler/ distributors) |
25% |
15% |
19% |
30% |
57% |
|
Prepare, process, treat, manufacture or preserve food for export or to be sent across provincial or territorial boundaries |
25% |
12% |
21% |
31% |
48% |
|
Grade, label or package food for export or to be sent across provincial or territorial boundaries |
19% |
9% |
12% |
25% |
57% |
|
Export food products or prepare food for export |
14% |
5% |
10% |
16% |
51% |
|
Produce organic food [includes: organic meats, dairy, etc.] |
11% |
12% |
8% |
12% |
19% |
|
Grow fruit, vegetables or grains for export or to be sent across provincial or territorial boundaries |
6% |
2% |
2% |
7% |
21% |
|
|
|
Company Size |
|||
|
|
Total (n=670) |
Micro (n=166) |
Small (n=201) |
Medium (n=255) |
Large (n=45) |
|
Sell food products at retail directly to consumers |
78% |
86% |
85% |
67% |
54% |
|
Import food products |
23% |
15% |
18% |
30% |
38% |
|
Send or convey food products across provincial or territorial borders (wholesaler/ distributors) |
21% |
11% |
13% |
33% |
42% |
|
Prepare, process, treat, manufacture or preserve food for export or to be sent across provincial or territorial borders |
16% |
6% |
8% |
28% |
39% |
|
Export food products or prepare food for export |
16% |
6% |
12% |
22% |
48% |
|
Grade, label or package food for export or to be sent across provincial or territorial borders |
14% |
4% |
7% |
25% |
43% |
|
Produce organic food [includes: organic meats, dairy, etc.] |
8% |
5% |
4% |
14% |
13% |
|
Grow fruit, vegetables or grains for export or to be sent across provincial or territorial borders |
4% |
3% |
1% |
6% |
12% |
|
|
|
Industry Sector |
Region |
||||||
|
|
Total (n=700) |
Agriculture (n=115) |
Processor/Manufacturer (n=227) |
Wholesaler/Distributor (n=146) |
Retailer (n=212) |
Atlantic (n=66) |
Quebec (n=221) |
Ontario (n=171) |
West (n=242) |
|
Yes |
6% |
2% |
5% |
3% |
7% |
9% |
2% |
6% |
8% |
|
No |
92% |
97% |
93% |
93% |
92% |
90% |
97% |
92% |
91% |
|
Don’t know / Not Sure |
2% |
1% |
2% |
3% |
1% |
1% |
1% |
2% |
2% |
|
|
|
Industry Sector |
Region |
||||||
|
|
Total (n=670) |
Agriculture (n=52) |
Processor/Manufacturing (n=190) |
Wholesaler /Distributor (n=98) |
Retailer (n=330) |
Atlantic (n=72) |
Quebec (n=144) |
Ontario (n=173) |
West (n=281) |
|
Yes |
7% |
7% |
4% |
12% |
7% |
6% |
3% |
11% |
6% |
|
No |
86% |
90% |
92% |
83% |
85% |
87% |
91% |
82% |
88% |
|
Don’t know / Not Sure |
7% |
3% |
4% |
6% |
8% |
7% |
7% |
7% |
6% |
|
|
|
Company Size |
|||
|
|
Total (n=700) |
Micro (n=168) |
Small (n=168) |
Medium (n=290) |
Large (n=71) |
|
Yes |
6% |
7% |
7% |
4% |
8% |
|
No |
92% |
93% |
92% |
93% |
89% |
|
Don’t know / Not Sure |
2% |
1% |
0% |
3% |
3% |
|
|
|
Company Size |
|||
|
|
Total (n=670) |
Micro (n=166) |
Small (n=201) |
Medium (n=255) |
Large (n=45) |
|
Yes |
7% |
9% |
7% |
6% |
5% |
|
No |
86% |
82% |
84% |
91% |
93% |
|
Don’t know / Not Sure |
7% |
9% |
9% |
4% |
1% |
Methodology
All research work was conducted in accordance with the professional standards established by the Government of Canada Public Opinion Research Standards, as follows:
- The survey consisted of two national telephone surveys with businesses in the food industry in Canada based on a selected list of North American Industry Classification System (NAICS) codes provided by CFIA. The sample frames were selected from a list of businesses from InfoCanada, a common and reputable list provider in the industry.
Targeted Industries with NAICS CodesAgriculture, Forestry, Fishing and Hunting (11)
11121101
Potato Farming
11231001
Chicken Egg Production
11121901
Other Vegetable (Except Potato) & Melon Farming
11233001
Turkey Production
11133101
Apple Orchards
11251901
Other Aquaculture
11133103
Apple Orchards
11251903
Other Aquaculture
11133104
Apple Orchards
11251904
Other Aquaculture
11133402
Berry (Except Strawberry) Farming
11292001
Horse & Other Equine Production
11133902
Other Noncitrus Fruit Farming
11293002
Fur-Bearing Animal & Rabbit Production
11141101
Mushroom Production
11293004
Fur-Bearing Animal & Rabbit Production
11141902
Other Food Crops Grown Under Cover
11299001
All Other Animal Production
11199801
All Other Miscellaneous Crop Farming
11299002
All Other Animal Production
11199803
All Other Miscellaneous Crop Farming
11299003
All Other Animal Production
11199804
All Other Miscellaneous Crop Farming
11299007
All Other Animal Production
11199806
All Other Miscellaneous Crop Farming
11299013
All Other Animal Production
11199807
All Other Miscellaneous Crop Farming
11299017
All Other Animal Production
11199808
All Other Miscellaneous Crop Farming
11421001
Hunting & Trapping
11199809
All Other Miscellaneous Crop Farming
11421004
Hunting & Trapping
11199810
All Other Miscellaneous Crop Farming
11421005
Hunting & Trapping
11199811
All Other Miscellaneous Crop Farming
11421006
Hunting & Trapping
11212001
Dairy Cattle & Milk Production
11421009
Hunting & Trapping
11212002
Dairy Cattle & Milk Production
Manufacturing (31)
31121102
Flour Milling
31161501
Poultry Processing
31121106
Flour Milling
31171001
Seafood Product Preparation & Packaging
31121107
Flour Milling
31171003
Seafood Product Preparation & Packaging
31121301
Malt Manufacturing
31171004
Seafood Product Preparation & Packaging
31122402
Soybean & Other Oilseed Processing
31171007
Seafood Product Preparation & Packaging
31122501
Fats & Oils Refining & Blending
31171008
Seafood Product Preparation & Packaging
31122505
Fats & Oils Refining & Blending
31181101
Retail Bakeries
31122508
Fats & Oils Refining & Blending
31181102
Retail Bakeries
31122511
Fats & Oils Refining & Blending
31181103
Retail Bakeries
31122512
Fats & Oils Refining & Blending
31181104
Retail Bakeries
31122516
Fats & Oils Refining & Blending
31181105
Retail Bakeries
31123001
Breakfast Cereal Manufacturing
31181202
Commercial Bakeries
31131401
Cane Sugar Manufacturing
31182101
Cookie & Cracker Manufacturing
31131403
Cane Sugar Manufacturing
31182403
Dry Pasta Dough/Flour Mixes Mfg-Purchased Flour
31135101
Chocolate/Confectionery Mfg From Cacao Beans
31182404
Dry Pasta Dough/Flour Mixes Mfg-Purchased Flour
31135201
Confectionery Mfg From Purchased Chocolate
31191102
Roasted Nuts & Peanut Butter Manufacturing
31141102
Frozen Fruit Juice & Vegetable Manufacturing
31191901
Other Snack Food Manufacturing
31141202
Frozen Specialty Food Manufacturing
31191905
Other Snack Food Manufacturing
31141203
Frozen Specialty Food Manufacturing
31191906
Other Snack Food Manufacturing
31141204
Frozen Specialty Food Manufacturing
31192001
Coffee & Tea Manufacturing
31142101
Fruit & Vegetable Canning
31192002
Coffee & Tea Manufacturing
31142103
Fruit & Vegetable Canning
31194101
Mayonnaise Dressing & Other Prepared Sauce Mfg
31142104
Fruit & Vegetable Canning
31194103
Mayonnaise Dressing & Other Prepared Sauce Mfg
31142106
Fruit & Vegetable Canning
31194202
Spice & Extract Manufacturing
31142107
Fruit & Vegetable Canning
31194203
Spice & Extract Manufacturing
31142303
Dried & Dehydrated Food Manufacturing
31199901
All Other Miscellaneous Food Manufacturing
31151201
Creamery Better Manufacturing
31199902
All Other Miscellaneous Food Manufacturing
31151301
Cheese Manufacturing
31199905
All Other Miscellaneous Food Manufacturing
31151402
Dry Condensed & Evaporated Dairy Products Mfg
31199906
All Other Miscellaneous Food Manufacturing
31152001
Ice Cream & Frozen Dessert Manufacturing
31199908
All Other Miscellaneous Food Manufacturing
31161101
Animal (Except Poultry) Slaughtering
31199910
All Other Miscellaneous Food Manufacturing
31161102
Animal (Except Poultry) Slaughtering
31199913
All Other Miscellaneous Food Manufacturing
31161103
Animal (Except Poultry) Slaughtering
31199917
All Other Miscellaneous Food Manufacturing
31161104
Animal (Except Poultry) Slaughtering
31199919
All Other Miscellaneous Food Manufacturing
31161202
Meat Processed Form Carcasses
31199920
All Other Miscellaneous Food Manufacturing
31161205
Meat Processed Form Carcasses
31211101
Soft Drink Manufacturing
31161207
Meat Processed Form Carcasses
31211102
Soft Drink Manufacturing
31161301
Rendering & Meat Byproduct Processing
31211103
Soft Drink Manufacturing
31161302
Rendering & Meat Byproduct Processing
Wholesale Trade (42)
42441003
General Line Grocery Merchant Wholesalers
42449010
Other Grocery & Relate Products Merchant Whlsrs
42441004
General Line Grocery Merchant Wholesalers
42449011
Other Grocery & Relate Products Merchant Whlsrs
42441005
General Line Grocery Merchant Wholesalers
42449013
Other Grocery & Relate Products Merchant Whlsrs
42442001
Packaged Frozen Food Merchant Wholesalers
42449015
Other Grocery & Relate Products Merchant Whlsrs
42442002
Packaged Frozen Food Merchant Wholesalers
42449017
Other Grocery & Relate Products Merchant Whlsrs
42442003
Packaged Frozen Food Merchant Wholesalers
42449018
Other Grocery & Relate Products Merchant Whlsrs
42442004
Packaged Frozen Food Merchant Wholesalers
42449019
Other Grocery & Relate Products Merchant Whlsrs
42442005
Packaged Frozen Food Merchant Wholesalers
42449022
Other Grocery & Relate Products Merchant Whlsrs
42442006
Packaged Frozen Food Merchant Wholesalers
42449024
Other Grocery & Relate Products Merchant Whlsrs
42442007
Packaged Frozen Food Merchant Wholesalers
42449026
Other Grocery & Relate Products Merchant Whlsrs
42443009
Dairy Product (Exc Dried Or Canned) Mrchnt Whlsrs
42449027
Other Grocery & Relate Products Merchant Whlsrs
42443010
Dairy Product (Exc Dried Or Canned) Mrchnt Whlsrs
42449030
Other Grocery & Relate Products Merchant Whlsrs
42443012
Dairy Product (Exc Dried Or Canned) Mrchnt Whlsrs
42449032
Other Grocery & Relate Products Merchant Whlsrs
42443013
Dairy Product (Exc Dried Or Canned) Mrchnt Whlsrs
42449033
Other Grocery & Relate Products Merchant Whlsrs
42444001
Poultry & Poultry Product Merchant Wholesalers
42449034
Other Grocery & Relate Products Merchant Whlsrs
42444002
Poultry & Poultry Product Merchant Wholesalers
42449035
Other Grocery & Relate Products Merchant Whlsrs
42444003
Poultry & Poultry Product Merchant Wholesalers
42449037
Other Grocery & Relate Products Merchant Whlsrs
42445002
Confectionery Merchant Wholesalers
42449042
Other Grocery & Relate Products Merchant Whlsrs
42445004
Confectionery Merchant Wholesalers
42449044
Other Grocery & Relate Products Merchant Whlsrs
42445008
Confectionery Merchant Wholesalers
42449046
Other Grocery & Relate Products Merchant Whlsrs
42445010
Confectionery Merchant Wholesalers
42449047
Other Grocery & Relate Products Merchant Whlsrs
42446001
Fish & Seafood Merchant Wholesalers
42449050
Other Grocery & Relate Products Merchant Whlsrs
42446002
Fish & Seafood Merchant Wholesalers
42449055
Other Grocery & Relate Products Merchant Whlsrs
42447002
Meat & Meat Product Merchant Wholesalers
42449056
Other Grocery & Relate Products Merchant Whlsrs
42447005
Meat & Meat Product Merchant Wholesalers
42449057
Other Grocery & Relate Products Merchant Whlsrs
42447006
Meat & Meat Product Merchant Wholesalers
42449061
Other Grocery & Relate Products Merchant Whlsrs
42448007
Fresh Fruit & Vegetable Merchant Wholesalers
42449064
Other Grocery & Relate Products Merchant Whlsrs
42448008
Fresh Fruit & Vegetable Merchant Wholesalers
42451002
Grain & Field Bean Merchant Wholesalers
42448009
Fresh Fruit & Vegetable Merchant Wholesalers
42451005
Grain & Field Bean Merchant Wholesalers
42448010
Fresh Fruit & Vegetable Merchant Wholesalers
42459003
Other Farm Products Raw Merchant Whlsrs
42448011
Fresh Fruit & Vegetable Merchant Wholesalers
42459005
Other Farm Products Raw Merchant Whlsrs
42449002
Other Grocery & Related Products Merchant Whlsrs
42459007
Other Farm Products Raw Merchant Whlsrs
42449003
Other Grocery & Related Products Merchant Whlsrs
42459008
Other Farm Products Raw Merchant Whlsrs
42449005
Other Grocery & Related Products Merchant Whlsrs
42459010
Other Farm Products Raw Merchant Whlsrs
42449006
Other Grocery & Related Products Merchant Whlsrs
42459017
Other Farm Products Raw Merchant Whlsrs
Retail Trade (44)
44511001
Supermarkets/Other Grocery (Exc Convenience) Strs
44529902
All Other Specialty Food Stores
44511002
Supermarkets/Other Grocery (Exc Convenience) Strs
44529903
All Other Specialty Food Stores
44511003
Supermarkets/Other Grocery (Exc Convenience) Strs
44529905
All Other Specialty Food Stores
44511005
Supermarkets/Other Grocery (Exc Convenience) Strs
44529906
All Other Specialty Food Stores
44511006
Supermarkets/Other Grocery (Exc Convenience) Strs
44529907
All Other Specialty Food Stores
44511007
Supermarkets/Other Grocery (Exc Convenience) Strs
44529909
All Other Specialty Food Stores
44511008
Supermarkets/Other Grocery (Exc Convenience) Strs
44529910
All Other Specialty Food Stores
44512001
Convenience Stores
44529911
All Other Specialty Food Stores
44521001
Meat Markets
44529912
All Other Specialty Food Stores
44521003
Meat Markets
44529914
All Other Specialty Food Stores
44521004
Meat Markets
44529915
All Other Specialty Food Stores
44521006
Meat Markets
44529917
All Other Specialty Food Stores
44521009
Meat Markets
44529918
All Other Specialty Food Stores
44521010
Meat Markets
44529920
All Other Specialty Food Stores
44521012
Meat Markets
44529921
All Other Specialty Food Stores
44522003
Fish & Seafood Markets
44529923
All Other Specialty Food Stores
44522004
Fish & Seafood Markets
44529924
All Other Specialty Food Stores
44523001
Fruit & Vegetable Markets
44529927
All Other Specialty Food Stores
44523003
Fruit & Vegetable Markets
44529929
All Other Specialty Food Stores
44523005
Fruit & Vegetable Markets
44529930
All Other Specialty Food Stores
44523006
Fruit & Vegetable Markets
44529932
All Other Specialty Food Stores
44529202
Confectionery & Nut Stores
44529934
All Other Specialty Food Stores
44529204
Confectionery & Nut Stores
44529936
All Other Specialty Food Stores
44529205
Confectionery & Nut Stores
44529938
All Other Specialty Food Stores
44529206
Confectionery & Nut Stores
- Quorus designed the survey instruments in English in conjunction with the CFIA Project Authority. Together, Quorus and CFIA ensured the research objectives were addressed, that plain language was used, and that the questionnaires flowed easily for respondents. Quorus collaborated with CFIA to then finalize the survey instruments for each wave. Quorus translated the client-approved English versions of the survey. Respondents had the choice to complete the interview in English or French.
- Quorus informed respondents of their rights under the Privacy and Access to Information Acts and ensured that those rights were protected throughout the research process. This included: informing participants of the purpose of the research; identifying both the sponsoring department or agency and research supplier at the end of the interview; informing participants that the study will be made available to the public in 6 months after field completion through Library and Archives Canada, informing participants that their participation in the study was voluntary, and that the information provided would be administered according to the requirements of the Privacy Act.
- The approved final questionnaires were programmed for computer-based telephone data collection.
- For Wave 2, a total of 700 businesses participated in the survey, from which 200 were “Retail Only”. As for Wave 1, 670 businesses participated in the survey, from which 300 were “Retail Only”. Most of the results in this report are based on businesses that are not exclusively retailers (Wave 2, n=500; Wave 1, n=370), as the key target audience are food businesses that import or prepare food for export or to be sent across provincial or territorial boundaries. These are businesses in the food industry that may or may not have a retail function.
- Data collection for Wave 2 occurred between February 4th, 2019 and March 1, 2019. Wave 1 data collection occurred between October 24 and November 9, 2018.
- In Wave 2, “Retail Only” participants completed a 14-minute questionnaire, while all other businesses completed an 18-minute questionnaire. For Wave 1, “Retail Only” participants completed a 5-minute questionnaire, while all other businesses completed an 18 to 20-minute interview.
- The survey was conducted following the Standards for the Conduct of Government of Canada Public Opinion Research – Telephone Surveys.
- For this study, a quota for “Retail Only” businesses was established to minimize the dominance of this segment in the overall sample. Data was monitored also to ensure that multiple locations from the same franchises were overrepresented in the sample.
- The margin of error of this sample size is +/- 3.8%, 19 times out of 20. The research findings can be extrapolated to the broader audience considering the margin of error associated with this sample size. The margins of error for the results in this study will vary based on a variety of factors. For instance, results for sub-groups with smaller sample sizes will have a higher margin of error. As well, the margin of error is typically highest for questions where 50% of respondents answered one way and 50% answered another way. The margin of error typically decreases as the percent for a particular response approaches 0% or 100%.
- The data was weighted according to the population counts per industry vertical and province as per InfoCanada information.
- This study saw a response rate of 14% across the entire sample in Wave 1 and of 17% in Wave 2.
Wave 2 - Dialing Disposition Report
|
Total Numbers Attempted |
6872 |
|
Out-of-scope - Invalid |
647 |
|
Unresolved (U) |
1955 |
|
No answer/Answering machine |
1955 |
|
In-scope - Non-responding (IS) |
1248 |
|
Language barrier |
92 |
|
Incapable of completing (ill/deceased) |
167 |
|
Callback (Respondent not available) |
1382 |
|
Total Asked |
2096 |
|
Refusal |
958 |
|
Termination |
56 |
|
In-scope - Responding units (R) |
926 |
|
Completed Interview |
700 |
|
NQ - Quota Full |
272 |
|
NQ - (INT32) Business is not Related to Food Business |
27 |
|
Refusal Rate |
48.38 |
|
Response Rate |
17.47 |
|
Incidence |
75.59 |
Wave 1 - Dialing Disposition Report
|
Total Numbers Attempted |
7314 |
|
Out-of-scope - Invalid |
594 |
|
Unresolved (U) |
3376 |
|
No answer/Answering machine |
3376 |
|
In-scope - Non-responding (IS) |
1248 |
|
Language barrier |
81 |
|
Incapable of completing (ill/deceased) |
99 |
|
Callback (Respondent not available) |
1068 |
|
Total Asked |
2096 |
|
Refusal |
1127 |
|
Termination |
43 |
|
In-scope - Responding units (R) |
926 |
|
Completed Interview |
670 |
|
NQ - Quota Full |
191 |
|
NQ - (INT32) Business is not Related to Food Business |
65 |
|
Refusal Rate |
55.82 |
|
Response Rate |
13.78 |
|
Incidence |
72.35 |
Appendices
Wave 2 - Questionnaires
2019 Survey Questionnaire - English
[Programing instructions are in blue font and in square brackets]
[Interviewer instructions are in black font and square brackets and not read]
Introduction
Hello/Bonjour [pause… In Quebec Bonjour/Hello], the Government of Canada is conducting a research survey with businesses in Canada. I am hoping to speak with the person in your company who is most responsible for food safety of the food products that your business sells or produces. Please note this is not a sales call, this important research will help the Government understand Industry’s views on food safety practices and regulations
This could be the owner of the company or a manager who oversees the sale of food products, food safety manager or quality assurance manager. Are you the right person to speak with? [IF NO: Can you please direct me to the correct person?]
[Repeat from Beginning if Transferred]
[Once Correct Person Identified]
Would you prefer that I continue in English or French? Préférez-vous continuer en français ou en anglais?
[Note: if at this point the respondent prefers to respond in French then the interviewer must be able to either proceed with the interview in French or read the following statement: “Je vous remercie. Quelqu’un vous rappellera bientôt pour mener le sondage en français.”]
My name is _____ calling from Quorus Consulting, the company hired to do the survey.
The survey will take approximately 12 minutes to complete. Please note that your participation is voluntary, confidential and anonymous and we can call back at a better time if you prefer.
To begin, I would like to confirm some information about your business...
S1. [RECORD from sample - not asked] Province/territory
S1A. [RECORD from sample - not asked]
Full 8-digit North American Industry Classification System (NAICS) code
S2. Which of the following categories best describes your business? [READ LIST]
| 11) Agriculture | 1 |
| 31) Processor or Manufacturer | 2 |
| 42) Wholesaler or distributor | 3 |
| 44) Retailer | 4 |
| Other (please specify)______________ | 77 |
S3. Which of the following activities apply to your business [Read List - Select all that Apply]?
| Import food products | 1 |
| Export food products or prepare, process, treat, manufacture or preserve food for export | 2 |
| Prepare, process, treat, manufacture or preserve food to be sent across provincial or territorial boundaries | 3 |
| Grade, label or package food for export or to be sent across provincial or territorial boundaries | 4 |
| Grow fruit, vegetables or grains for export or to be sent across provincial or territorial boundaries | 5 |
| Send or convey food products across provincial or territorial boundaries (wholesaler/ distributors) | 6 |
| Sell food products at retail directly to consumers | 7 |
| Produce organic food [interviewer note: includes organic meats, dairy, etc.] | 8 |
| None of the above | 9 |
S3A. [IF NONE OF THE ABOVE IN S3: Ask] What would you say is your company’s main business activity?
[IF Business is Related to Food Business Recode S3 and Continue, Otherwise Thank and Terminate]
S3B1. [Ask S3B1 IF S3=1] Which regions do you currently import from [Read List - Select all that Apply]?
| United States | 1 |
| Central America / Caribbean | 2 |
| South America | 3 |
| Africa | 4 |
| Western Europe | 5 |
| Eastern Europe | 6 |
| Middle East | 7 |
| Asia (Pacific) | 8 |
| China | 9 |
| India | 10 |
| Australia | 11 |
S3B2. [Ask S3B2 IF S3=2] Which regions do you currently export from [Read List - Select all that Apply]?
| United States | 1 |
| Central America / Caribbean | 2 |
| South America | 3 |
| Africa | 4 |
| Western Europe | 5 |
| Eastern Europe | 6 |
| Middle East | 7 |
| Asia (Pacific) | 8 |
| China | 9 |
| India | 10 |
| Australia | 11 |
[Flag as “Retail Only” if Only Selected “G” at S3]
S5. Which of the following best represents the number of people including yourself your company employs in Canada? If you are a franchisee, please only consider your location. [READ LIST] [Just total number of employees is acceptable including part-time and casual]
| 1 – [Self-employed] | 1 |
| 2-4 employees | 2 |
| 5-10 employees | 3 |
| 11-99 employees | 4 |
| 100-499 employees | 5 |
| 500 employees or more | 6 |
|
Don’t know [do not read] |
8 |
|
Refused [do not read] |
9 |
S6. And which of the following reflects the approximate size of your business by gross annual revenue for your Canadian operations? Again, if you are a franchisee, please only consider your location. [Read List] [If Refuse: Just as a reminder, please understand that we use this information for classification purposes only and do not record or share the identity of any company participating in the study.]
| $30,000 or less per year | 1 |
| Between $30,000 and less than $100,000 per year | 2 |
| Between $100,000 and less than $500,000 per year | 3 |
| Between $500,000 and less than $1 million per year | 4 |
| Between $1 million and less than $5 million per year | 5 |
| $5 million or more per year | 6 |
|
Don’t know [do not read] |
8 |
|
Refused [do not read] |
9 |
S7. Would you classify your company as Indigenous owned or operated?
| Yes | 1 |
| No | 2 |
|
Don’t know / Not Sure [do not read, prompt if necessary] |
9 |
Food Safety Activities
A1. If your business was subject to a CFIA inspection today, how confident are you that you would meet food safety regulations and requirements? Please rate your view on a scale of 1 to 7 where 1 means not at all confident and 7 means very confident.
| 1 – Not at all confident |
| 2 |
| 3 |
| 4 |
| 5 |
| 6 |
| 7 – Very confident |
|
9 – Don’t know [do not read] |
A2. [IF Provided a Score From 1 to 7] Please expand on why you provided that answer.
| Don’t know / Refused | 99 |
A3. Which of the following activities, if any, applies at your company: [READ LIST - Select all that apply] - [Randomize]?
| [SKIP IF retail-only] Has written/documented standard operating procedures on food safety. | 1 |
| [SKIP IF retail-only] Has preventive controls in place, but not written or documented in a plan | 2 |
| [SKIP IF retail-only] Has preventive controls in place, which are outlined in a written plan such as a HACCP based plan, QMP or other program [if asked: HACCP stands for Hazard Analysis and Critical Control Points and QMP = Quality Management Program] | 3 |
| Has a traceability program established [IF NEEDED: written records that trace all food one step back and one step forward, as applicable] | 4 |
| [SKIP IF retail-only] Uses a food safety or quality control certification system such as GFSI, ISO or QMP [If asked: GFSI = Global Food Safety Initiative; ISO = International Organization for Standardization and QMP = Quality Management Program] | 5 |
| [SKIP IF retail-only] Has a food licence or registration with CFIA | 6 |
| Regularly sends staff on food safety training | 7 |
| Has an internal training program on food safety | 8 |
| None of the above | 9 |
Awareness of CFIA and the Safe Food for Canadians Regulations
B1. On a scale of 1 to 7, where 1 means not at all familiar and 7 means very familiar, how familiar would you say that you are with the Canadian Food Inspection Agency, also known as the CFIA?
| 1 – Not at all familiar |
| 2 |
| 3 |
| 4 |
| 5 |
| 6 |
| 7 – Very familiar |
| 9 – Don’t know [do not read] |
B1a. Over the past three to four weeks, have you seen, read or heard any advertising from the Canadian Food Inspection Agency?
| Yes | 1 |
| No | 2 - SKIP to B2 |
B1b. Thinking specifically about the ad or ads that come to mind, what do you remember about the ads? [do not read]
| Safe Food for Canadians Regulations (SFCR) specific mention | 1 |
| Safe food or new regulations /rules general mention | 2 |
| Other CFIA program | 3 |
| Other (Record) _____________________________ | 7 |
B2. [ASK if not Mentioned at B1b] Have you heard, seen or read anything about the Safe Food for Canadians Regulations, which introduces new requirements for food safety and came into force January 15, 2019?
| Yes | 1 |
| No | 2 |
| Don’t know / Not Sure [do not read, prompt if necessary] | 9 |
B2a. [IF B1b=1 OR B2=YES] Where did you hear, see or read about the regulations?
| Don’t know / Refused | 99 |
B3. On a scale from 1 to 7, where 1 means “not at all clearly” and 7 means “very clearly”, how well do you feel that you understand the food safety regulations that apply to your business?
| 1 – Not at all clearly |
| 2 |
| 3 |
| 4 |
| 5 |
| 6 |
| 7 – Very clearly |
| 9 – Don’t know [do not read] |
B7. [SKIP IF retail-only] From your perspective which of the following three key food safety elements would be the biggest challenge for food businesses? Would it be…
[Randomize 1-3] [Read 1-3]
| Licencing | 1 |
| Written preventive controls | 2 |
| Traceability of food products | 3 |
| Other – Please specify: _________________ | 77 |
Contact with CFIA
I’m now going to ask you about any contact you have had with the CFIA in the last year.
C1a. I will read several statements. Please tell me which activities apply to you or your business over the last 12 months. [select all that apply, remind respondent of time frame as necessary]
| Looked for information about food safety regulations or requirements on the CFIA’s website | 1 |
| Contacted the CFIA directly for information or technical advice on food safety regulations or regulatory interpretation, not including permissions, licences, registrations or certifications. | 2 |
| Contacted the CFIA for information [not requesting] on a permission, licence or certificate | 3 |
| Requested a permission, licence, registration, or certificate from the CFIA | 4 |
| Have been inspected by the CFIA within the past 12 months | 5 |
| Initiated a product recall either voluntary or ordered | 6 |
| Searched for operational guidance using the Guidance Finder | 7 |
| I have not looked for information from or had any personal contact with the CFIA over the last 12 months | 8 |
| Don’t know/Refused [do not read] | 9 |
[Ask C1 If any Interaction with CFIA at C1A (1-4)]
C1. You stated that you contacted the CFIA for information or a service. How did you access or request the service or information from the CFIA? Was it… [Read List - Select all that Apply]
| In person at a CFIA office | 1 |
| Over the phone | 2 |
| On the CFIA website | 3 |
| 4 | |
| Social media | 5 |
| Webinar | 6 |
| Other (please specify) ______________ | 77 |
C1b. [ASK if Website Used at C1] To what extent was the information the CFIA’s website useful in helping you find the information you were looking for? Use a scale of 1 to 7, where 1 means “not at all helpful” and 7 means “very helpful”.
| 1 – Not at all helpful |
| 2 |
| 3 |
| 4 |
| 5 |
| 6 |
| 7 – Very helpful |
| 9 – Don’t know [do not read] |
C1c. [ASK if Website Used at C1] How could the CFIA improve their website?
C1d. [ASK if Email Used at C1] To what extent was the information provided by email useful in helping you find the information you were looking for? Use a scale of 1 to 7, where 1 means “not at all helpful” and 7 means “very helpful”.
| 1 – Not at all helpful |
| 2 |
| 3 |
| 4 |
| 5 |
| 6 |
| 7 – Very helpful |
| 9 – Don’t know [do not read] |
C1e. [ASK if Phone Used at C1] To what extent was the information provided by phone useful in helping you find the information you were looking for? Use a scale of 1 to 7, where 1 means “not at all helpful” and 7 means “very helpful”.
| 1 – Not at all helpful |
| 2 |
| 3 |
| 4 |
| 5 |
| 6 |
| 7 – Very helpful |
| 9 – Don’t know [do not read] |
C1f. [ASK if “In Person” at C1] To what extent was the information obtained in person at a CFIA office useful in helping you find the information you were looking for? Use a scale of 1 to 7, where 1 means “not at all helpful” and 7 means “very helpful”.
| 1 – Not at all helpful |
| 2 |
| 3 |
| 4 |
| 5 |
| 6 |
| 7 – Very helpful |
| 9 – Don’t know [do not read] |
C1g. How would you prefer to request and receive regulatory information from the CFIA? [Read List - Select all that Apply]
| Using a chatbot – an interactive chat with computer-activated responses on the CFIA website | 1 |
| A live customer service-based chat on the CFIA website | 2 |
| Over the phone | 3 |
| By Email | 4 |
| On Social media | 5 |
| Other (please specify) ______________ | 77 |
C1h. How would you prefer to request and receive CFIA services, such as food licences or export certificates? [Read List - Select all that Apply]
| On the CFIA website | 1 |
| By Email | 2 |
| On Social media | 3 |
| By fax | 4 |
| In person at a CFIA office | 5 |
| Other (please specify): ______________________________________________ | 77 |
C2. On a scale of 1 to 7, where 1 means “do not agree at all” and 7 means “strongly agree”, based on your general impressions of the CFIA, how would you rate the following statements about the CFIA? [Rotate Statements]
| 1 Do not agree at all | 2 | 3 | 4 | 5 | 6 | 7 Strongly agree | Don’t know [do not read] | |
| a) The CFIA is fair when inspecting food businesses. | ||||||||
| b) It is easy to understand the information the CFIA provides food businesses. | ||||||||
| c) The CFIA provides enough information to meet your regulatory obligations. | ||||||||
| d) Information from the CFIA arrives in a timely manner. |
My CFIA
F1. Have you ever heard, seen or read anything about CFIA’s online portal called “My CFIA?”
| Yes, I used it [Prompt for use if yes] | 1 |
| Yes, but never used it | 2 |
| No | 3 |
| Don’t know/Refused [do not read] | 9 |
[IF F1= ‘Yes, i used it” Ask F1A to F2a]
F1a. Have you ever used the portal for a… [Read List - Select all that Apply]
| New licence request | 1 |
| Licence renewal | 2 |
| Permit | 3 |
| Export certificate | 4 |
| Registration | 5 |
| Only enrolled | 6 |
| Other (please specify) ______________ | 77 |
F2. Please rate your overall level of satisfaction with “My CFIA” on a scale of 1 to 7, where 1 means not at all satisfied and 7 means very satisfied.
| 1 – Not at all satisfied |
| 2 |
| 3 |
| 4 |
| 5 |
| 6 |
| 7 – Very satisfied |
| 9 – Don’t know [do not read] |
F2a. Please expand on why you provide that rating?
| Don’t know / Refused | 99 |
F3. [If F1= yes, do not read statement]: My CFIA is a web portal that provides clients with secure access to a growing number of CFIA services online. It is a convenient and secure way to do business with the CFIA. My CFIA can be used to manage and track service requests online, including permissions such as licences, permits, registrations and export certificates. You can find it at inspection.gc.ca/mycfia (Francais: inspection.gc.ca/monacia)
How likely would you be to use “My CFIA” in the future on a scale of 1-7 where 1 is not at all likely and 7 is very likely?
| 1 – Not at all likely |
| 2 |
| 3 |
| 4 |
| 5 |
| 6 |
| 7 – Very likely |
| 9 – Don’t know [do not read] |
F4. [IF Provided a Score From 1 to 7] Please expand on why you provided that score
| Don’t know / Refused | 99 |
Compliance Burden
G1. On a scale of 1 to 7 where 1 is not at all burdensome and 7 is very burdensome, how burdensome is the paper work associated with the food regulations in Canada? [IF NEEDED: “Burdensome” is defined as unnecessary and undue compliance burden – that is, the time and resources spent by business to demonstrate compliance with the federal government regulations.]
| 1 – Not at all burdensome |
| 2 |
| 3 |
| 4 |
| 5 |
| 6 |
| 7 – Very burdensome |
| 9 – Don’t know [do not read] |
[SKIP IF retail-only] With respect to your business, please indicate the extent to which you agree with the following statements. Please use a scale of 1 to 7, where 1 means “do not agree at all” and 7 means “strongly agree”.
G1A. Over the past 12 months, I’ve needed to spend less time searching for food safety information I require.
| 1 – Do not agree at all |
| 2 |
| 3 |
| 4 |
| 5 |
| 6 |
| 7 – Strongly agree |
| 8 - I do not search for food safety information [do not read] |
| 9 – Don’t know [do not read] |
G1B. [SKIP IF retail-only] The CFIA takes the needs of businesses into account when developing new regulatory information products.
| 1 – Do not agree at all |
| 2 |
| 3 |
| 4 |
| 5 |
| 6 |
| 7 – Strongly agree |
| 9 – Don’t know [do not read] |
G2. Thinking about the overall service received from the CFIA in the last 12 months, rate your overall satisfaction. Use a scale from 1-7 where 1 is not at all satisfied and 7 is very satisfied.
| 1 – Not at all satisfied |
| 2 |
| 3 |
| 4 |
| 5 |
| 6 |
| 7 – Very satisfied |
| 9 – Don’t know [do not read] |
G3. [IF Provided a Score From 1 to 7] Please expand on why you provided that score.
| Don’t know / Refused | 99 |
G4. In your opinion, what is the biggest challenge in finding information on food safety regulations or requirements? [Probe for how they get information, - the type of information is asked next at G4a. – do not read, Select Only One]
| Website is not user-friendly / difficult to navigate | 1 |
| Lack of clear information / difficult to understand | 2 |
| Lack of notifications / updates | 3 |
| Too much information / high volume of information | 4 |
| Lack of contact with customer service / not responsive | 5 |
| Research / finding information is too time-consuming | 6 |
| Other (please specify): ______________ | 7 |
| None / No challenges | 88 |
| Don’t know / Refused | 99 |
G4a. What were some of the food safety topics you felt were difficult to get clear information on?
| None in particular | 98 |
| Don’t know / Refused | 99 |
That concludes the interview. On behalf of the Canadian Food Inspection Agency thank you very much for your participation in this research. If you are interested in learning more about the CFIA and food safety please consult inspection.gc.ca/SafeFood. The CFIA Toolkit for Businesses has informative digital tools that can answer whether or not you need a licence and the required timelines, whether or not you need a written preventive control plan, and also outlines any traceability requirements that may apply to your business.
Wave 1 - Questionnaires
2018-19 Survey Questionnaire - English
[Programing instructions are in blue font and in square brackets]
[Interviewer instructions are in black font and square brackets and not read]
Introduction
Hello/Bonjour [pause… In Quebec Bonjour/Hello], the Government of Canada is conducting a research survey with businesses in Canada. I am hoping to speak with the person in your company who is most responsible for food safety of the food products that your business sells or produces. Please note this is not a sales call, this important research will help the Government understand Industry’s views on food safety practices and regulations
This could be the owner of the company or a manager who oversees the sale of food products, food safety manager or quality assurance manager. Are you the right person to speak with? [IF NO: Can you please direct me to the correct person?]
[Repeat from Beginning if Transferred]
[Once Correct Person Identified]
Would you prefer that I continue in English or French? Préférez-vous continuer en français ou en anglais?
[Note: if at this point the respondent prefers to respond in French then the interviewer must be able to either proceed with the interview in French or read the following statement: “Je vous remercie. Quelqu’un vous rappellera bientôt pour mener le sondage en français.”]
My name is _____ calling from Quorus Consulting, the company hired to do the survey.
The survey will take approximately 12 minutes to complete. Please note that your participation is voluntary, confidential and anonymous and we can call back at a better time if you prefer.
To begin, I would like to confirm some information about your business...
S1. [RECORD from sample - not asked] Province/territory
S1A. [RECORD from sample - not asked]
Full 8-digit North American Industry Classification System (NAICS) code
S2. Which of the following categories best describes your business? [READ LIST]
| 11) Agriculture | 1 |
| 31) Processor or Manufacturer | 2 |
| 42) Wholesaler or distributor | 3 |
| 44) Retailer | 4 |
| Other (please specify) ______________ | 77 |
S3. Which of the following activities apply to your business [Read List - Select all that Apply]?
| Import food products | 1 |
| Export food products or prepare food for export | 2 |
| Prepare, process, treat, manufacture or preserve food for export or to be sent across provincial or territorial borders | 3 |
| Grade, label or package food for export or to be sent across provincial or territorial borders | 4 |
| Grow fruit, vegetables or grains for export or to be sent across provincial or territorial borders | 5 |
| Send or convey food products across provincial or territorial borders (wholesaler/ distributors) | 6 |
| Sell food products at retail directly to consumers | 7 |
| Produce organic food [interviewer note: includes organic meats, dairy, etc.] | 8 |
| None of the above | 9 |
S3A. [If None of the Above in S3: Ask] What would you say is your company’s main business activity?
[If Business is Related to Food Business Recode S3 and Continue, Otherwise Thank and Terminate]
[Flag as “Retail Only” if Only Selected “G” AT S3]
[Ask S4 and S4A and S4B for Retail Only Company]
S4. Do you have a process in place that will allow you to trace back your food to the company that supplied it?
| Yes | 1 |
| No | 2 |
| Not sure | 3 |
S4A. Have you heard of the Safe Food for Canadians Regulations?
| Yes | 1 |
| No | 2 |
| Not sure | 3 |
S4B. Do you know that the Safe Food for Canadians Regulations that come into force January 15, 2019 require most food companies to be able to trace where their food products were purchased?
| Yes | 1 |
| No | 2 |
S5. Which of the following best represents the number of people including yourself your company employs in Canada? If you are a franchisee, please only consider your location. [READ LIST] [Just total number of employees is acceptable including part-time and casual]
| 1 – [Self-employed] | 1 |
| 2-4 employees | 2 |
| 5-10 employees | 3 |
| 11-99 employees | 4 |
| 100-499 employees | 5 |
| 500 employees or more | 6 |
| Don’t know [do not read] | 8 |
| Refused [do not read] | 9 |
S6. And which of the following reflects the approximate size of your business by gross annual revenue for your Canadian operations? Again, if you are a franchisee, please only consider your location. [Read List] [If refuse: Just as a reminder, please understand that we use this information for classification purposes only and do not record or share the identity of any company participating in the study.]
| $30,000 or less per year | 1 |
| Between $30,000 and less than $100,000 per year | 2 |
| Between $100,000 and less than $500,000 per year | 3 |
| Between $500,000 and less than $1 million per year | 4 |
| Between $1 million and less than $5 million per year | 5 |
| $5 million or more per year | 6 |
| Don’t know [do not read] | 8 |
| Refused [do not read] | 9 |
S7. Would you classify your company as Indigenous owned or operated?
| Yes | 1 |
| No | 2 |
| Don’t know / Not Sure [do not read, prompt if necessary] | 9 |
[Terminate if Retail Only quota target is reached - Target quota TBD after first ~200 interviews are completed]
Food Safety Activities
A1. Thinking about food safety in general, who do you think has the most responsibility to ensure the food sold in Canada is safe. Is it… [READ LIST]
[Randomize]
| The Federal government | 1 |
| The food industry | 2 |
| The Provincial government | 3 |
| Canadian Farmers | 4 |
| Consumers | 5 |
| Or someone else? (please specify) [don’t randomize]) ______________ | 77 |
| DK [don’t randomize] | 99 |
A2. On a scale of 1 to 7, where 1 means not at all and 7 means very clearly, how well do you feel that you understand the food safety regulations that apply to your foods?
| 1 – Not at all |
| 2 |
| 3 |
| 4 |
| 5 |
| 6 |
| 7 – Very clearly |
| 9 – Don’t know [do not read] |
A3. Which of the following activities, if any, applies at your company: [READ LIST - Select all that apply] - [Randomize]?
| Has written/documented standard operating procedures on food safety. | 1 |
| Has preventive controls in place, but not written or documented in a plan | 2 |
| Has preventive controls in place, which are outlined in a written plan such as a HACCP based plan, QMP or other program [if asked: HACCP stands for Hazard Analysis and Critical Control Points and QMP = Quality Management Program] | 3 |
| Has a traceability program established [IF NEEDED: written records that trace all food one step back and one step forward, as applicable] | 4 |
| Uses a food safety or quality control certification system such as GFSI, ISO or QMP [If asked: GFSI = Global Food Safety Initiative; ISO = International Organization for Standardization and QMP = Quality Management Program] | 5 |
| Follows six sigma quality control | 6 |
| Regularly sends staff on food safety training | 7 |
| Has an internal training program on food safety | 8 |
| None of the above | 9 |
Awareness of CFIA and the Safe Food for Canadians Regulations
B1. On a scale of 1 to 7, where 1 means not at all familiar and 7 means very familiar, how familiar would you say that you are with the Canadian Food Inspection Agency, also known as the CFIA?
| 1 – Not at all familiar |
| 2 |
| 3 |
| 4 |
| 5 |
| 6 |
| 7 – Very familiar |
| 9 – Don’t know [do not read] |
B2. Have you heard, seen or read anything about the Safe Food for Canadians Regulations, which introduces new requirements for food safety and comes into force January 15, 2019?
| Yes | 1 |
| No | 2 |
| Don’t know / Not Sure [do not read, prompt if necessary] | 9 |
B2A [IF B2=YES] Where did you hear, see or read about the regulations?
| Don’t know / Refused | 99 |
B3. As far as you know, do you think the new Safe Food for Canadians Regulations will apply to your business?
| Yes | 1 |
| No | 2 |
| Not Sure | 9 |
Were you aware that the proposed Safe Food for Canadians Regulations require most businesses regulated by CFIA to:
B4. Have a licence from the CFIA
| Yes | 1 |
| No | 2 |
| Don’t know | 9 |
B5. Have a written preventive control plan
| Yes | 1 |
| No | 2 |
| Don’t know | 9 |
B6. Have product traceability processes
| Yes | 1 |
| No | 2 |
| Don’t know | 9 |
B7. From your perspective which of the following three key food safety elements would be the biggest challenge for food businesses? Would it be…
[Randomize 1-3] [Read 1-3]
| Licencing | 1 |
| Written preventive controls | 2 |
| Traceability of food products | 3 |
| None of the above | 9 |
Contact with CFIA
I’m now going to ask you about any contact you have had with the CFIA in the last year.
C1a. I will read several statements. Please tell me which activities apply to you or your business over the last 12 months. [Select all that apply, remind respondent of time frame as necessary]
| Looked for information about food safety regulations or requirements on the CFIA’s website | 1 |
| Contacted the CFIA directly for information or technical advice on food safety regulations or regulatory interpretation, not including permissions, licences, registrations or certifications. | 2 |
| Contacted the CFIA for information [not requesting] on a permission, licence or certificate | 3 |
| Requested a permission, licence, registration, or certificate from the CFIA | 4 |
| Have been inspected by the CFIA within the past 12 months | 5 |
| Initiated a product recall either voluntary or ordered | 6 |
| I have not looked for information from or had any personal contact with the CFIA over the last 12 months | 7 |
| Don’t know/ Refused [do not read] | 9 |
[Ask C1 If any interaction with CFIA at C1a (1-4)]
C1. You stated that you contacted the CFIA for information or a service. How did you access or request the service or information from the CFIA? Was it… [Read List - Select all that Apply]
| In person | 1 |
| Over the phone | 2 |
| On the CFIA website | 3 |
| 4 | |
| Social media | 5 |
| Other (please specify) ______________ | 77 |
C2. On a scale of 1 to 7, where 1 means “do not agree at all” and 7 means “strongly agree”, based on your general impressions of the CFIA, how would you rate the following statements about the CFIA? [Rotate Statements]
| 1 Do not agree at all | 2 | 3 | 4 | 5 | 6 | 7 Strongly agree | Don’t know [do not read] | |
| e) The CFIA is fair when inspecting food businesses. | ||||||||
| f) The CFIA is efficient in its operations. | ||||||||
| g) It is easy to understand the information the CFIA provides food businesses. | ||||||||
| h) The CFIA provides enough information to meet your regulatory obligations. | ||||||||
| i) Information from the CFIA arrives in a timely manner. |
My CFIA
F1. Have you ever heard, seen or read anything about CFIA’s online portal called “My CFIA?”
| Yes, I used it [prompt for use if yes] | 1 |
| Yes, but never used it | 2 |
| No | 3 |
| Don’t know/Refused [do not read] | 9 |
[IF F1=”Yes, i used it” Ask F1A to F2a]
F1A Have you ever used the portal for a… [Read List - Select all that Apply]
| New licence request | 1 |
| Licence renewal | 2 |
| Permit | 3 |
| Export certificate | 4 |
| Registration | 5 |
| Only enrolled | 6 |
| Other (please specify) ______________ | 77 |
F2. Please rate your overall level of satisfaction with “My CFIA” on a scale of 1 to 7, where 1 means not at all satisfied and 7 means very satisfied.
| 1 – Not at all satisfied |
| 2 |
| 3 |
| 4 |
| 5 |
| 6 |
| 7 – Very satisfied |
| 9 – Don’t know [do not read] |
F2a. Please expand on why you provide that rating?
| Don’t know / Refused | 99 |
F3. [IF F1= Yes, do not read Statement]: My CFIA’ is a web portal that provides clients with secure access to a growing number of CFIA services online. It is a convenient and secure way to do business with the CFIA. My CFIA can be used to manage and track service requests online, including permissions such as licences, permits, registrations and export certificates. You can find it at inspection.gc.ca/mycfia (Francais: inspection.gc.ca/monacia)
How likely would you be to use “My CFIA” in the future on a scale of 1-7 where 1 is not at all likely and 7 is very likely?
| 1 – Not at all likely |
| 2 |
| 3 |
| 4 |
| 5 |
| 6 |
| 7 – Very likely |
| 9 – Don’t know [do not read] |
F4. [IF Provided a Score From 1 to 7] Please expand on why you provided that score
| Don’t know / Refused | 99 |
Compliance Burden
G1. On a scale of 1 to 7 where 1 is not at all burdensome and 7 is very burdensome, how burdensome is the paper work associated with the food regulations in Canada? [IF NEEDED: “Burdensome” is defined as unnecessary and undue compliance burden – that is, the time and resources spent by business to demonstrate compliance with the federal government regulations.]
| 1 – Not at all burdensome |
| 2 |
| 3 |
| 4 |
| 5 |
| 6 |
| 7 – Very burdensome |
| 9 – Don’t know [do not read] |
With respect to your business, please indicate the extent to which you agree with the following statements. Please use a scale of 1 to 7, where 1 means “do not agree at all” and 7 means “strongly agree”.
G1A. Over the past 12 months, I’ve needed to spend less time searching for food safety information I require.
| 1 – Do not agree at all |
| 2 |
| 3 |
| 4 |
| 5 |
| 6 |
| 7 – Strongly agree |
| 8 - I do not search for food safety information [do not read] |
| 9 – Don’t know [do not read] |
G1B. The CFIA takes the needs of businesses into account when developing new regulatory information products.
| 1 – Do not agree at all |
| 2 |
| 3 |
| 4 |
| 5 |
| 6 |
| 7 – Strongly agree |
| 9 – Don’t know [do not read] |
G2. Thinking about the overall service received from the CFIA in the last 12 months, rate your overall satisfaction. Use a scale from 1-7 where 1 is not at all satisfied and 7 is very satisfied.
| 1 – Not at all satisfied |
| 2 |
| 3 |
| 4 |
| 5 |
| 6 |
| 7 – Very satisfied |
| 9 – Don’t know [do not read] |
G3. [IF Provided a Score From 1 to 7] Please expand on why you provided that score.
| Don’t know / Refused | 99 |
G4. In your opinion, what is the biggest challenge in finding information on food safety regulations or requirements. [Probe for how they get information, - the type of information is asked next at G4a.]
| Don’t know / Refused | 99 |
G4a. What were some of the food safety topics you felt were difficult to get clear information on?
| None in particular | 98 |
| Don’t know / Refused | 99 |
G5. If your business was subject to a CFIA inspection today, how confident are you that you would meet food safety regulations and requirements? Please rate your view on a scale of 1 to 7 where 1 means not at all confident and 7 means very confident.
| 1 – Not at all confident |
| 2 |
| 3 |
| 4 |
| 5 |
| 6 |
| 7 – Very confident |
| 9 – Don’t know [do not read] |
G6. [IF Provided a Score From 1 to 7] Please expand on why you provided that answer.
| Don’t know / Refused | 99 |
That concludes the interview. On behalf of the Canadian Food Inspection Agency thank you very much for your participation in this research. If you are interested in learning more about the CFIA and food safety please consult inspection.gc.ca/SafeFood. The CFIA toolkit for businesses has informative digital tools that can answer whether or not you need a licence and the required timelines, whether or not you need a written preventive control plan, and it outlines any traceability requirements that may apply to your business.