Public Opinion Research with Canadians on Food Safety and Food Fraud: 2019-2020
Canadian Food Inspection Agency
March 2020
Prepared for:
Canadian Food Inspection Agency
Supplier Name: Quorus Consulting Group Inc.
Contract Award Date: January 13, 2020
Delivery Date: March 2020
Contract Amount (incl. HST): $22,591.53
Contract #: 39903-200832/001/CY
POR Number: 066-19
For more information, please contact:
cfia.enquiries-demandederenseignements.acia@canada.ca
Ce rapport est aussi disponible en français.
Public Opinion Research with Canadians on Food Safety and Food Fraud: 2019-2020
Report
Prepared for The Canadian Food Inspection Agency
Supplier name:
Quorus Consulting Group Inc.
March 30, 2020
Cette publication est aussi disponible en français sous le titre : Recherche sur l'opinion publique auprès des Canadiens sur la salubrité des aliments et la fraude alimentaire : 2019-2020
This publication may be reproduced for non-commercial purposes only. Prior written permission must be obtained from the Canadian Food Inspection Agency. For more information on this report, please contact the Canadian Food Inspection Agency at: cfia.enquiries-demandederenseignements.acia@canada.ca or at:
The Canadian Food Inspection Agency
1400 Merivale Road
Ottawa, Ontario
K1A 0Y9
Catalogue Number: A104-200/2020E-PDF
International Standard Book Number (ISBN): 978-0-660-34450-8
Related publications (registration number): POR 066-19
A104-200/2020F-PDF
ISBN :
978-0-660-34451-5
© Her Majesty the Queen in Right of Canada, as represented by the Minister of Health, 2020

Political Neutrality Certification
I hereby certify as Senior Officer of Quorus Consulting Group Inc. that the deliverables fully comply with the Government of Canada political neutrality requirements outlined in the Policy on Communications and Federal Identity and the Directive on the Management of Communications - Appendix C.
Specifically, the deliverables do not include information on electoral voting intentions, political party preferences, standings with the electorate or ratings of the performance of a political party or its leaders.
Signed:

Rick Nadeau, President
Quorus Consulting Group Inc.
Table of Contents
Executive Summary
Research purpose and objectives
The Canadian Food Inspection Agency (CFIA) is dedicated to safeguarding food, animals and plants which enhances the health and well-being of Canada's people, environment and economy. The CFIA continually works to improve the overall health of Canadians.
In January 2019, CFIA's Safe Food for Canadians Regulations came into force for many food businesses. The regulations provide clear and consistent rules for food commodities so that consumers can be confident that food on grocery shelves is safe to eat, whether it is produced in Canada or imported. CFIA regulations also require that food is accurately represented. Canadian law prohibits the labelling, packaging, treating, processing, selling or advertising of any food in a manner that is false, misleading or deceptive to consumers.
In order to help understand the public's awareness and perceptions of food safety and food fraud, CFIA commissioned Quorus Consulting to collect up-to-date opinion data from the public on a variety of topics related to food safety and the accurate representation of food. With this feedback from Canadian consumers, the Agency will be better informed to respond to Canadians' needs and concerns, and to develop appropriate communication campaigns. More specifically, the research objectives are to:
- Measure Canadians' awareness and understanding of food safety and food fraud.
- Measure Canadians' habits and concerns about food safety.
- Measure Canadians' sources of information on food safety and food fraud.
- Measure Canadians' perception about food fraud.
- Allow for a comparison of findings with previous POR conducted on this topic.
The research consisted of an online survey of Canadians 18 years of age and older who are at least partially responsible for purchasing groceries. Quorus collaborated with the CFIA to finalize the survey instruments to meet the research objectives. Respondents had the choice to complete the survey in English or French. The survey took on average 14 minutes to complete. A total of 1,504 surveys were completed through the online survey. Data collection occurred between February 14th and February 19th, 2020, including a pretest of 26 surveys. The equivalent margin of error for a probability study of 1,500 cases would be +/- 2.5%. Data were weighted by region, gender, and age to ensure that the final distributions within the final sample mirror those of the Canadian population according to the latest Census data.
Food safety confidence in Canada
Canadians are confident that food in Canada is safe. Eight in ten respondents are confident that food products produced in Canada are safe to eat. At least 7 in 10 respondents agree they are confident Canada's food system protects Canadians, that Canada's food safety system is managing food safety issues, that Canada's food system is protecting Canadians from preventable food safety hazards, and that labels on food in Canada provide the information they need. Confidence levels are much lower when it comes to genetically modified foods, foods imported from other countries, or the use of pesticides.
The Government of Canada is identified as the stakeholder in the food industry with the most responsibility in terms of providing safe food to Canadians, followed by food manufacturers or processors, farmers, provincial governments, and companies that import foods into Canada, and, to a lesser extent, scientists and academics, grocery stores, and consumers.
Communications with the public
Two thirds of respondents say they regularly look for information on food safety. This is usually approached by consulting a search engine, news sites or TV news, visiting the CFIA website, or the Canada Food Guide.
Confidence in sources of information on this topic is highest for healthcare professionals, Canadian farmers, and scientists and academics. To a lesser extent, respondents also trust information coming from international organizations, the Government of Canada, grocery stores in Canada, Canadian food manufacturers or processors, and labels on food packages.
Over six in ten consumers are familiar with the CFIA. Roughly two thirds of these respondents agree the CFIA protects Canadians from unsafe food, and a similar proportion believe the CFIA is fair when inspecting food businesses.
One in ten respondents have contacted the CFIA, mainly for a food safety complaint, for a food labelling complaint or for misrepresented food or suspected food fraud. Nearly four in five of these respondents are satisfied with the service and information received from the CFIA.
Most respondents are interested in knowing more about food-related topics. Topics of most interest include restaurant/food service inspection, food inspection, food containing pesticides/residues, labelling, food recalls, food testing, imported food and food fraud.
Food fraud
Nearly a third of respondents report being aware of food fraud. Food fraud was defined to respondents as the intentional misrepresentation of food for economic or personal gain.
The top-five examples provided by respondents of what is considered misrepresented food include:
- mislabeling in general, including wrong nutritional information, inaccurate weights, misleading pictures,
- fish-related examples portraying false species or origin,
- organic or “natural” foods that do not meet standards,
- a general country of origin misrepresentation where the products are packaged in Canada but grown [or produced] elsewhere,
- and the information in the ingredient labels where not all or the wrong composition ingredients are listed.
Over one third of Canadians say they have encountered misrepresentation of certain foods. The main reported issues are related to mislabeled, mislabeling in general, organic or natural food not meeting standards, and country of origin misrepresentation (i.e. packaged in Canada but grown elsewhere).
Canadians are concerned about the possibility of encountering food-fraud.
At least half of Canadians say they believe it is possible to encounter food fraud with products imported from other countries to Canada, and roughly one quarter say it is possible to encounter misrepresented food in Canada with products made in Canada.
Many (50%) Canadians have confidence in the Government of Canada managing food fraud. The Government of Canada is also perceived as the most responsible stakeholder for ensuring food in Canada is accurately represented. Other stakeholders considered having a high level of responsibility for the accurate representation of food include provincial governments, and food manufacturers or processors.
Over three quarters of respondents agree “food fraud” is the appropriate term to describe the intentional misrepresentation of food. Other terms considered appropriate include “food misrepresentation”, “misrepresented food”, “misrepresentation”, and to a lesser extent “fraudulent”, “cheated food”, “fake or counterfeit food/products”, “food lies or agro-industrial lies”, “food theft” or “imitation food”.
Labelling
There is a high level of confidence in the truthfulness of product labels. Seven out of ten Canadians say they are confident that the information on food labels regarding the common name of the food is truthful. Six in ten are confident the ingredient information, and the nutrition information on food labels is true. Confidence is lower for other aspects such as the best before date of the food, where the food is from, the way the food is produced, health claims, and organic claims.
Food recalls
There is moderate awareness among Canadians regarding food recalls. Over half of respondents say they remember hearing about food recalls in Canada during the past six months. This was mainly through news sites, Facebook, and radio. A CFIA email list was mentioned by 13% of respondents who remember hearing about a food recall.
Most Canadians understand food recalls are inevitable. More than 4 in 5 respondents agree food recalls happen, even with the best of efforts to keep food safe. More than 3 in 5 agree unsafe food is recalled in a timely manner in Canada, and more than 1 in 3 agree Canadians are at a higher risk of consuming unsafe foods today compared to three years ago.
One in five respondents are aware of the Safe Food for Canadians Regulations (SFCR). These respondents mainly heard about SFCR either online, through television, or the news in general.
Most respondents see the positive impact of the SFCR. More than 4 in 5 respondents believe the SFCR improve food safety in Canada.
Six in ten Canadians would like to have more information regarding food safety in Canada. This includes more detailed information than what the food labels provide, general food-related information, information on specific foods, information related to the type of food, information on regulations, and chemicals on foods. The most preferred methods of receiving information related to food safety are social media, email notifications and a mobile app that issues alerts.
Detailed Results
Research purpose and objectives
The Canadian Food Inspection Agency (CFIA) is dedicated to safeguarding food, animals and plants which enhances the health and well-being of Canada's people, environment and economy. CFIA. The CFIA continually works to improve the overall health of Canadians.
The CFIA develops and delivers programs and services to protect Canadians from preventable food safety hazards, to ensure that food safety issues are effectively managed, food is accurately represented, and to ensure that food businesses and the public are aware of—and contribute to— the overall safety of food sold or produced in Canada. In January 2019, the Safe Food for Canadians Regulations came into force for many food businesses. The regulations provide clear and consistent rules for food commodities so that consumers can be confident that food on grocery shelves is safe to eat, whether it is produced in Canada or imported. The regulations require businesses to be licensed and to have preventive controls in place to address potential risks to food safety. They also allow for faster removal of unsafe food from the shelves by requiring businesses that import, or prepare food for export or interprovincial trade to trace their food back to their supplier and forward to whom they sold their products.
CFIA regulations also require that that food is accurately represented. Canadian law prohibits the labelling, packaging, treating, processing, selling or advertising of any food in a manner that is false, misleading or deceptive to consumers. Food fraud occurs when food is intentionally misrepresented. Food fraud can mislead consumers to pay more for a product that is of lower quality or misrepresented. It can also be a food safety issue (for example, when products contain undeclared allergens). The CFIA works to protect consumers from food misrepresentation by conducting inspections, analyzing food samples and when necessary taking enforcement action. Combatting food fraud is a shared responsibility between government, industry and consumers.
While past research indicates that Canadians have been confident that food bought in Canada is safe and accurately represented, several studies indicate that consumer concern may be increasing in Canada. CFIA commissioned Quorus Consulting to collect up-to-date opinion data from the public on a variety of topics related to food safety and the accurate representation of food.
This research helps the CFIA understand the public's awareness of and perceptions towards food safety and food fraud. With this feedback from Canadian consumers, the Agency will be better informed to respond to Canadians' needs and concerns, and to develop appropriate communication campaigns.
More specifically, the research objectives are to:
- Measure Canadians' awareness and understanding of food safety issues, including food fraud.
- Measure Canadians' habits and concerns about food safety.
- Measure Canadians' sources of information on food safety issues, including food fraud.
- Measure Canadians' perception about food fraud.
- Allow for a comparison of findings with previous POR conducted on food safety issues.
Food safety confidence in Canada
Overall, the results of this survey show that Canadians are confident that food in Canada is safe. Eight in ten respondents are confident that food products produced in Canada are safe to eat. Seventy-six percent agree they are confident Canada's food system protects Canadians. In addition, 73% are confident that Canada's food safety system is managing food safety issues and that Canada's food system is protecting Canadians from preventable food safety hazards (71%). Seventy percent believe that labels on food in Canada provide the information they need (70%).
Confidence levels drop for genetically modified foods, foods imported from other countries, or the use of pesticides. Fewer than half of respondents say they are confident that it is generally safe to eat genetically modified food in Canada (42%), that food products imported from other countries are safe to eat (39%), or that it is generally safe to eat food grown with pesticides in Canada (38%). Twenty-two percent disagree that it is generally safe to eat genetically modified food (definition provided as “food which contains genetic material that has been altered in a way that does not occur naturally), 32% disagree that it is generally safe to eat food grown with pesticides, and 26% disagree that food products imported from other countries are safe to eat.
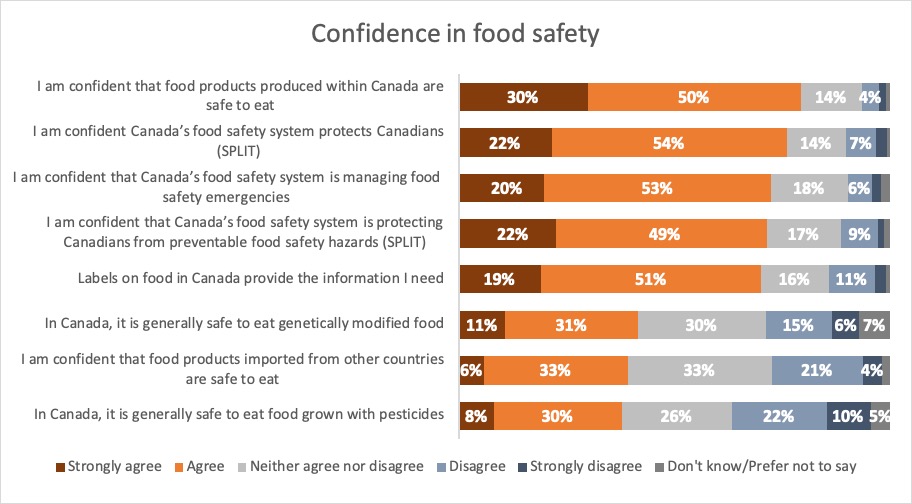
Q4: To what extent do you agree or disagree with each of the following statements? Base: All Respondents, n= 1,504).
| Strongly agree | Agree | Neither agree nor disagree | Disagree | Strongly disagree | Don't know/Prefer not to say | |
|---|---|---|---|---|---|---|
| I am confident that food products produced within Canada are safe to eat | 30% | 50% | 14% | 4% | 2% | 1% |
| I am confident Canada's food safety system protects Canadians (SPLIT) | 22% | 54% | 14% | 7% | 3% | 1% |
| I am confident that Canada's food safety system is managing food safety emergencies | 20% | 53% | 18% | 6% | 2% | 2% |
| I am confident that Canada's food safety system is protecting Canadians from preventable food safety hazards (SPLIT) | 22% | 49% | 17% | 9% | 1% | 1% |
| Labels on food in Canada provide the information I need | 19% | 51% | 16% | 11% | 3% | 1% |
| In Canada, it is generally safe to eat genetically modified food | 11% | 31% | 30% | 15% | 6% | 7% |
| I am confident that food products imported from other countries are safe to eat | 6% | 33% | 33% | 21% | 4% | 2% |
| In Canada, it is generally safe to eat food grown with pesticides | 8% | 30% | 26% | 22% | 10% | 5% |
Results by demographic subgroups show the following findings:
- Quebec residents are the least likely to agree with the statements “Labels on food in Canada provide the information I need”, “In Canada, it is generally safe to eat genetically modified food”, “I am confident that food products imported from other countries are safe to eat”, and “In Canada, it is generally safe to eat food grown with pesticides”, compared to residents in other provinces.
- In terms of age, younger respondents are more likely to agree food labels provides information they need, or that the food products imported from other countries are safe to eat. Respondents between 25 and 54 are more likely to agree that Canada's food safety system is protecting Canadians from preventable food safety hazards, and that it is generally safe to eat food grown with pesticides, compared to either younger or older respondents.
- Men are more likely than women to agree it is generally safe to eat genetically modified food in Canada, that food products imported from other countries are safe to eat, and that it is generally safe to eat food grown with pesticides.
- Respondents with a higher education level are also more likely to agree it is generally safe to eat genetically modified food.
- Respondents working full time as well as those with higher incomes are more likely to agree with most statements.
- Parents of children under 18 years old are more likely to agree that food products imported from other countries are safe to eat, compared to parents without children at home.
Different stakeholders in the food industry were evaluated by survey participants in terms of their responsibility to provide safe food. Over one third of respondents (36%) rated the Government of Canada as having the most responsibility. Over one fifth rated farmers (22%) and food manufacturers or processors (21%) as responsible Adding in the ranking of second and third most responsible, the Government of Canada continues to be perceived as being the most responsible (63%), followed by food manufacturers or processors (61%), farmers (49%), provincial governments (43%), companies that import foods into Canada (38%), scientists and academics (19%), grocery stores (17%), and consumers (10%).
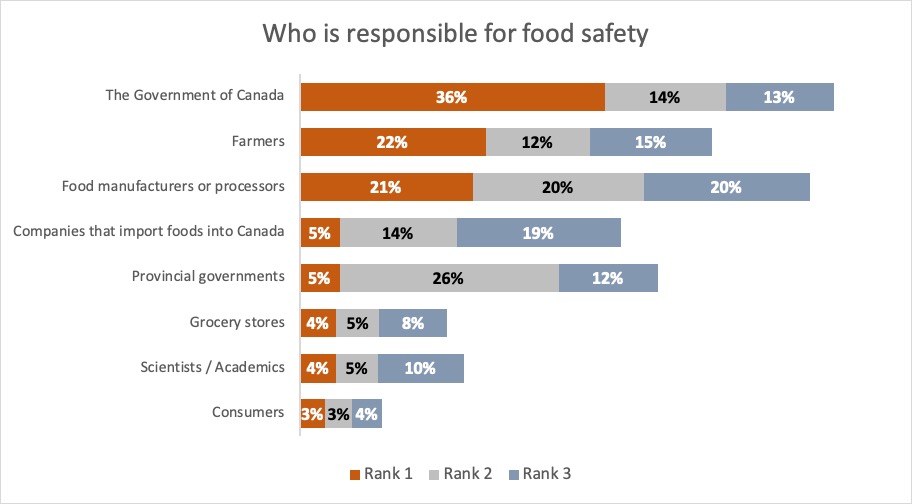
Q5: Please rank the following in order of who you think has the most responsibility to provide safe food. Please drag or match the options on the left with the numbers on the right. Base: All Respondents, n= 1,504.
| Rank 1 | Rank 2 | Rank 3 | |
|---|---|---|---|
| The Government of Canada | 36% | 14% | 13% |
| Farmers | 22% | 12% | 15% |
| Food manufacturers or processors | 21% | 20% | 20% |
| Companies that import foods into Canada | 5% | 14% | 19% |
| Provincial governments | 5% | 26% | 12% |
| Grocery stores | 4% | 5% | 8% |
| Scientists / Academics | 4% | 5% | 10% |
| Consumers | 3% | 3% | 4% |
Demographic differences show that respondents in Quebec are the least likely to rate the Government of Canada as the most responsible to provide safe food. Those who are more likely to rank the federal government as most responsible include respondents who are retired, not working or working part time. Additionally, older respondents are more likely to see the Government of Canada as having the most responsibility to ensure food is safe.
The study explored the perception Canadians have in food products sold in Canada, by asking respondents to rate their confidence on whether certain products are safe to eat, using a scale from 1 to 5, where 1 meant not at all confident, and 5 meant very confident.
The combination of the top-two values (5 and 4 on the 5-point scale used) shows respondents feel most confident about eating eggs in Canada (85%), bakery items (85%), honey (84%), maple (83%), fresh vegetables (82%), dairy (82%), herbs and spices (82%), and fresh fruits (80%). Over two thirds feel confident eating organic foods (72%), meat (72%), and poultry (70%). Nearly 6 in 10 feel confident to eat fish (60%), processed vegetables (57%), and processed fruit (57%). Over half feel confident to eat seafood (55%), and processed egg products (51%).
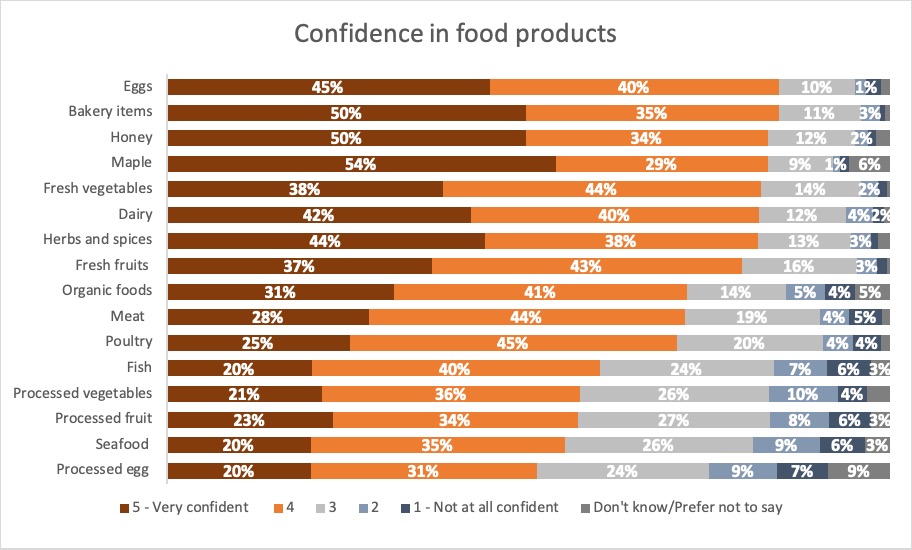
Q7: For each of the following types of food products, please indicate how confident you are that the products sold in Canada are safe to eat. You can do this by using a 5-point scale in which a response of 1 means you are not at all confident and 5 means you are very confident. Base: All respondents n= 752.
| 5 - Very confident | 4 | 3 | 2 | 1 - Not at all confident | Don't know/Prefer not to say | |
|---|---|---|---|---|---|---|
| Eggs | 45% | 40% | 10% | 1% | 2% | 1% |
| Bakery items | 50% | 35% | 11% | 3% | 1% | 1% |
| Honey | 50% | 34% | 12% | 2% | 1% | 2% |
| Maple | 54% | 29% | 9% | 1% | 1% | 6% |
| Fresh vegetables | 38% | 44% | 14% | 2% | 1% | 0% |
| Dairy | 42% | 40% | 12% | 4% | 2% | 1% |
| Herbs and spices | 44% | 38% | 13% | 3% | 1% | 2% |
| Fresh fruits | 37% | 43% | 16% | 3% | 1% | 0% |
| Organic foods | 31% | 41% | 14% | 5% | 4% | 5% |
| Meat | 28% | 44% | 19% | 4% | 5% | 1% |
| Poultry | 25% | 45% | 20% | 4% | 4% | 1% |
| Fish | 20% | 40% | 24% | 7% | 6% | 3% |
| Processed vegetables | 21% | 36% | 26% | 10% | 4% | 3% |
| Processed fruit | 23% | 34% | 27% | 8% | 6% | 3% |
| Seafood | 20% | 35% | 26% | 9% | 6% | 3% |
| Processed egg | 20% | 31% | 24% | 9% | 7% | 9% |
Regional differences among participants show that residents of Manitoba and Saskatchewan are more likely than other residents to say they are confident it is safe to eat meat and poultry in Canada. Confidence to eat fresh fruit is highest in Ontario. British Columbia residents are more likely to say it is safe to eat honey, while those in Quebec are more likely to say it is safe to eat maple and Atlantic Canada residents are more likely to say it is safe to eat fish. These residents as well as those from Ontario, Manitoba and Saskatchewan are more likely to say it is safe to eat eggs in Canada. Conversely, residents of the province of Quebec are the least likely to say it is safe to eat egg products, processed fruit, and processed vegetables.
Communications with the public
Two thirds of respondents (67%) say they either frequently (26%) or sometimes (41%) look for information on food safety. This is usually done by consulting a search engine (45%), news sites or TV news (44%), visiting the CFIA website (38%), or the Canada Food Guide (26%). Other sources used include Facebook (16%), other government sites (15%), radio (15%), and to a lesser extent blogs (7%), Instagram (5%), Twitter (4%), other social media (7%), or the product label itself (1%).
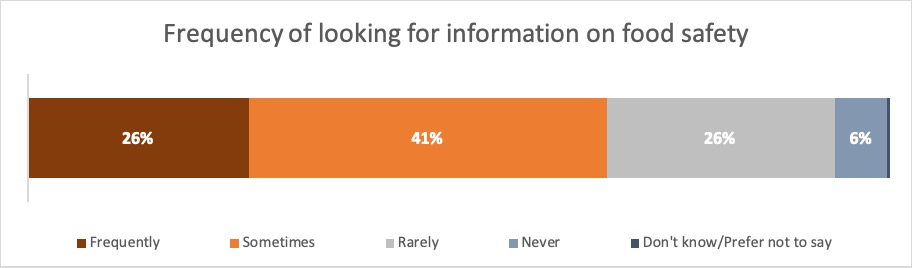
Q8: Generally speaking, how often do you look for information on food safety? Base: All Respondents, n= 1,504.
Frequency of looking for information on food safety
- Frequently: 26%
- Sometimes: 41%
- Rarely: 26%
- Never: 6%
- Don't know/Prefer not to say: 0%
Provinces with the highest proportion of respondents to say they look frequently for information on food safety are, Manitoba and Saskatchewan, and respondents in Quebec are the most likely to say they never look for this information. The higher the education level, the more likely they will look for this information. Also, parents of children under 18 living at home are more likely to say they frequently look for information on food safety.
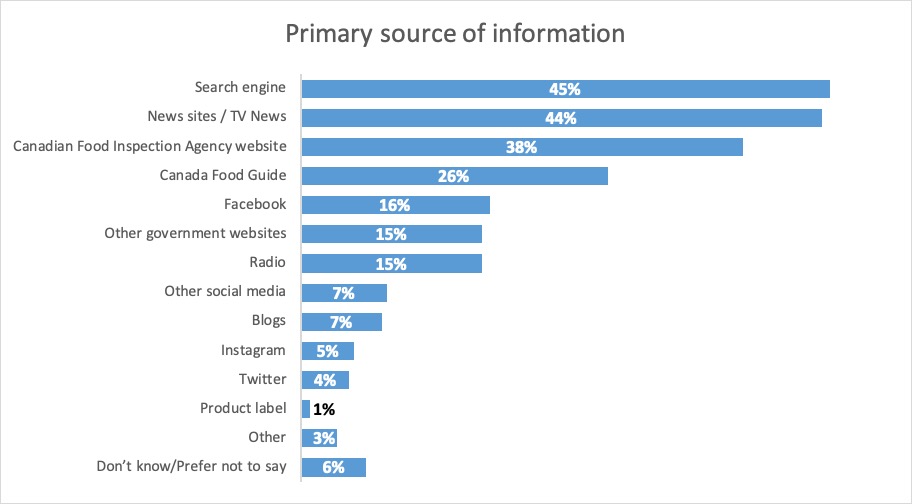
Q9: Where do you primarily get information on food safety? Check all that apply. Base: Those who look for information at least rarely, n= 1,400
Primary source of information
- Search engine: 45%
- News sites / TV News: 44%
- Canadian Food Inspection Agency website: 38%
- Canada Food Guide: 26%
- Facebook: 16%
- Other government websites: 15%
- Radio: 15%
- Other social media: 7%
- Blogs: 7%
- Instagram: 5%
- Twitter: 4%
- Product label: 1%
- Other: 3%
- Don't know/Prefer not to say: 6%
Residents of Atlantic Canada and Quebec are the most likely to say they primarily get information on food safety on the CFIA website. Atlantic Canada residents are also the most likely to say they use the Canada Food Guide. Manitoba and Saskatchewan residents are the least likely to say they use other government websites.
Parents of children under 18 are more likely to say they use social media to look for this information (Facebook, Twitter, and Instagram) than those without children.
Younger respondents are more likely to say they use online resources to look for food safety information including search engines, other government websites, blogs, social media (including Facebook, Twitter and Instagram), while older respondents are more likely to use news sites, TV news or radio for this information.
Survey participants were asked to rate their confidence in certain sources of information or organizations regarding the information they provide about food safety or maintaining the safety of food sold in Canada. To do this, they were asked to use a scale of 1 to 5, where 5 meant very confident and 1 not at all confident. Over two thirds of respondents provided a rating of 4 or 5 to having confidence in healthcare professionals (73%), Canadian farmers (72%), or scientists and academics (69%). These were followed by international organizations such as the World Health Organization (WHO) (65%), the Government of Canada (64%), grocery stores in Canada (56%), Canadian food manufacturers or processors (56%), or labels on food packages (55%). Less than half were confident in the news media and reporters (47%), the natural health products industry (44%), or companies that import foods into Canada (32%).
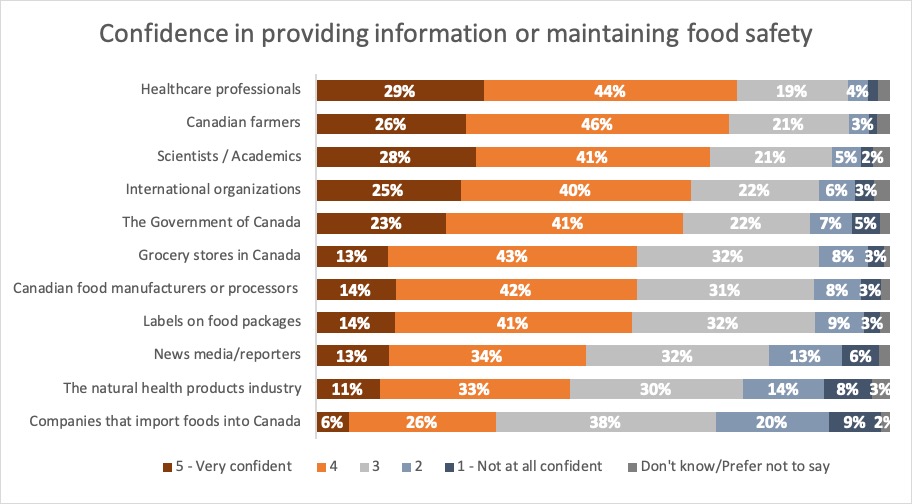
Q10: How confident would you say you are in each of the following when it comes to information about food safety or maintaining the safety of food sold in Canada? Base: All Respondents, n= 1,504.
| 5 - Very confident | 4 | 3 | 2 | 1 - Not at all confident | Don't know/ Prefer not to say | |
|---|---|---|---|---|---|---|
| Healthcare professionals | 29% | 44% | 19% | 4% | 2% | 2% |
| Canadian farmers | 26% | 46% | 21% | 3% | 1% | 2% |
| Scientists / Academics | 28% | 41% | 21% | 5% | 2% | 3% |
| International organizations | 25% | 40% | 22% | 6% | 3% | 3% |
| The Government of Canada | 23% | 41% | 22% | 7% | 5% | 2% |
| Grocery stores in Canada | 13% | 43% | 32% | 8% | 3% | 1% |
| Canadian food manufacturers or processors | 14% | 42% | 31% | 8% | 3% | 2% |
| Labels on food packages | 14% | 41% | 32% | 9% | 3% | 2% |
| News media/reporters | 13% | 34% | 32% | 13% | 6% | 2% |
| The natural health products industry | 11% | 33% | 30% | 14% | 8% | 3% |
| Companies that import foods into Canada | 6% | 26% | 38% | 20% | 9% | 2% |
Quebec and Atlantic Canada residents are the most likely to trust healthcare professionals (i.e. physicians, nutritionists, or dietitians), scientists or academics, and international organizations (e.g. WHO), for information about food safety or maintaining the safety of food sold in Canada. Quebec residents are also the least likely to say they are confident with the information coming from Canadian food manufacturers or processors (i.e. companies that make or process food).
Younger respondents are more likely to say they have confidence in international organizations for this information as well as companies that import foods in Canada, and the least likely to say they trust news media and reporters.
Men are more likely than women to say they are confident in most of the organizations and sources listed when it comes to information about food safety or maintaining the safety of food sold in Canada. The exceptions are the natural health products industry, the Government of Canada, international organizations, and Canadian farmers, for which there is no difference in opinion between men and women.
When asked about their familiarity with the CFIA, over six in ten respondents (62%) say they are familiar with the Agency, with 9% saying they are “very familiar”, and 53% saying they are “somewhat familiar”.
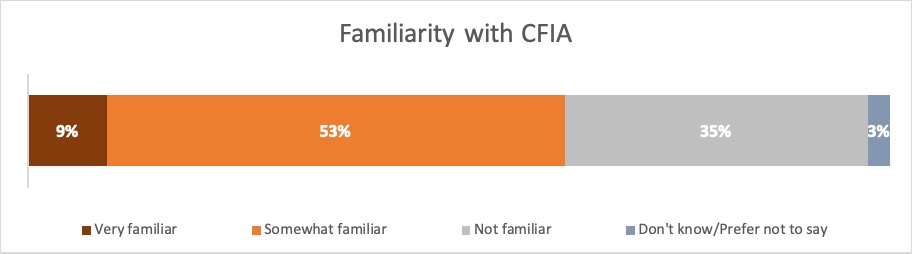
Q11: How familiar would you say you are with the Canadian Food Inspection Agency (CFIA)? Base: All Respondents, n= 1,504.
Familiarity with CFIA
- Very familiar: 9%
- Somewhat familiar: 53%
- Not familiar: 35%
- Don't know/Prefer not to say: 3%
Residents of Quebec and British Columbia are the least likely to be very familiar with the CFIA, compared to the rest of Canada. Younger respondents are more likely to be very familiar with the CFIA, particularly those under 54 years old. In addition, men are more likely to be familiar with the Agency than women.
Among respondents familiar with the CFIA, over two thirds agree the CFIA protects Canadians from unsafe food (69% provided ratings of 5 to 7 on a 7-point agreement scale), and 65% agree the CFIA is fair when inspecting food businesses. Roughly one in ten respondents strongly agree with these statements.
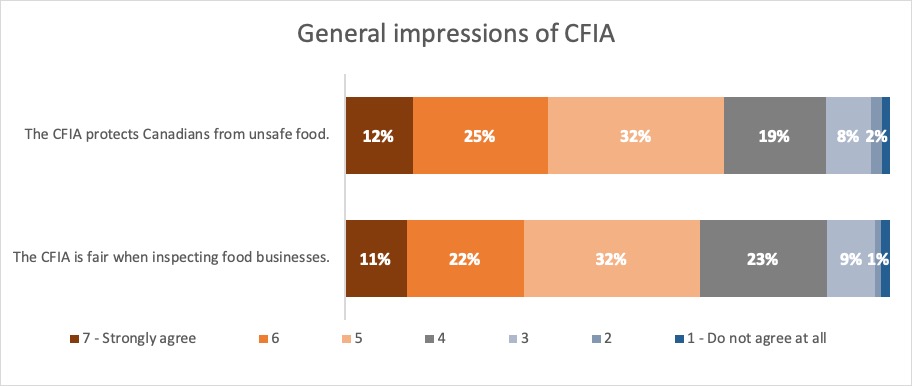
Q12: On a scale of 1 to 7 where 1 means “do not agree at all” and 7 means “strongly agree”, indicate to what extent you agree with the following statements based on your general impressions of the Canadian Food Inspection Agency (CFIA). Base: Those who are very or somewhat familiar with CFIA, n= 948.
| 7 - Strongly agree | 6 | 5 | 4 | 3 | 2 | 1 - Do not agree at all | |
|---|---|---|---|---|---|---|---|
| The CFIA protects Canadians from unsafe food. | 12% | 25% | 32% | 19% | 8% | 2% | 1% |
| The CFIA is fair when inspecting food businesses. | 11% | 22% | 32% | 23% | 9% | 1% | 2% |
Fairness ratings for the CFIA are more likely to be higher among residents of Ontario (70%) than residents of Quebec or British Columbia (58% respectively).
Only 10% of respondents had contacted the CFIA with a concern or information. When looking at the total number of responses provided by respondents contacting the CFIA, nearly half (44%) are related to a food safety complaint, 30% to a food labelling complaint, 24% to misrepresented food or suspected food fraud, and 3% to other reasons.
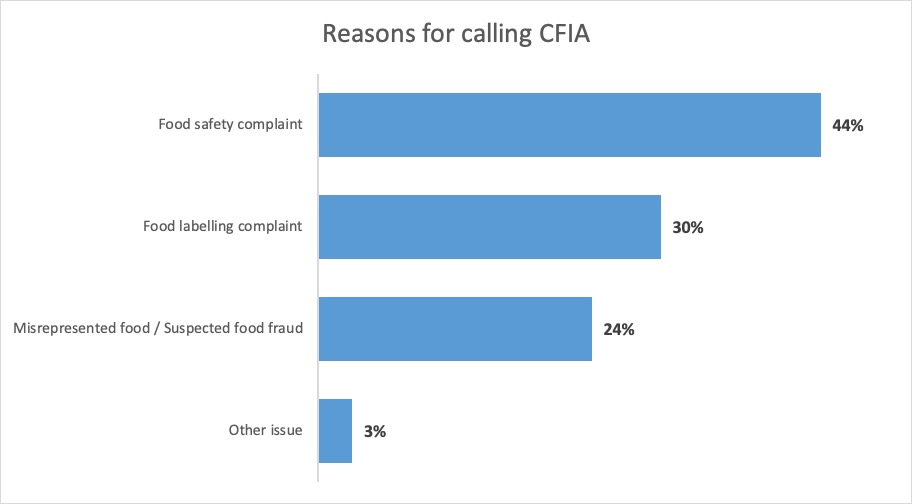
Q13: Have you ever contacted the Canadian Food Inspection Agency (CFIA) with a concern or for information about: Check all that apply. Base: Among 199 responses given by respondents having contacted the CFIA.
Reasons for calling CFIA
- Food safety complaint: 44%
- Food labelling complaint: 30%
- Misrepresented food / Suspected food fraud: 24%
- Other issue: 3%
Roughly 4 in 5 respondents (78%) who contacted the CFIA, rated their overall satisfaction with the service or information received from 4 to 7 on a 7-point satisfaction scale. One in three (29%) stated they were “very satisfied” with the service and information received.
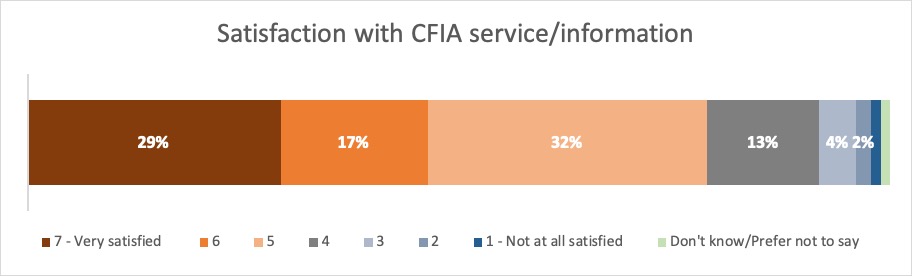
Q14: Thinking about the service or information received from the Canadian Food Inspection Agency after you contacted them, rate your overall satisfaction. Use a scale from 1-7 where 1 is not at all satisfied and 7 is very satisfied. Base: Those who have contacted CFIA, n= 142.
Satisfaction with CFIA service/information
- 7 - Very satisfied: 29%
- 6: 17%
- 5: 32%
- 4: 13%
- 3: 4%
- 2: 2%
- 1 - Not at all satisfied: 1%
- Don't know/Prefer not to say: 1%
Respondents satisfied with the CFIA feel the service or information was good in general, and also found it reliable and trustworthy. Other reasons for being satisfied include the quality of information provided (they got the answers they needed), feeling the CFIA was effective, being provided prompt service, feeling the CFIA fulfilled their purpose of helping the public and keeping food safe, having friendly staff, or good reputation and knowledge.
Some satisfied respondents (rating their satisfaction above 4 on the 7-point scale) feel there is room for improvement, that the CFIA was at times ineffective, lacked quality information, has limited or insufficient staff, that there is a lack of trust of the organization, that they are slow to respond, or are not fully satisfied about existing food regulations.
The few respondents that were less satisfied (providing a rating under 4 on the 7-point scale) had the impression the CFIA was not serious or was dismissive, there was a lack of quality information, there was no follow up, responses were insincere, it was a poor experience overall, it was ineffective, or felt unsatisfied by existing food regulations related.
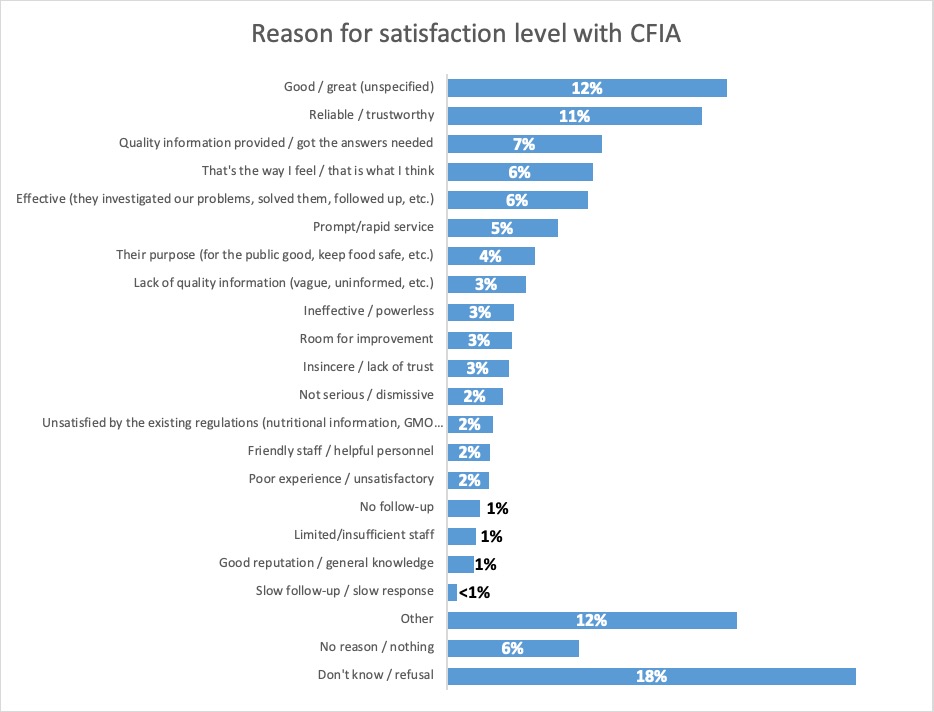
Q15: Please expand on why you provided that score: Base: Those who provided a score at Q14, n= 140.
Reason for satisfaction level with CFIA
- Good / great (unspecified): 12%
- Reliable / trustworthy : 11%
- Quality information provided / got the answers needed: 7%
- That's the way I feel / that is what I think: 6%
- Effective (they investigated our problems, solved them, followed up, etc.): 6%
- Prompt/rapid service: 5%
- Their purpose (for the public good, keep food safe, etc.): 4%
- Lack of quality information (vague, uninformed, etc.): 3%
- Ineffective / powerless: 3%
- Room for improvement: 3%
- Insincere / lack of trust: 3%
- Not serious / dismissive: 2%
- Unsatisfied by the existing regulations (nutritional information, GMO labeling, verification of expired products etc: 2%
- Friendly staff / helpful personnel: 2%
- Poor experience / unsatisfactory: 2%
- No follow-up: 1%
- Limited/insufficient staff: 1%
- Good reputation / general knowledge: 1%
- Slow follow-up / slow response: < 1%
- Other: 12%
- No reason / nothing: 6%
- Don't know / refusal: 18%
Respondents were also asked their interest level in certain food topics. The majority of respondents (91%) indicated having an interest in restaurant or food service inspection, where 49% indicated this as a topic of greatest interest, and 42% of moderate interest. Similarly, roughly 9 in 10 respondents are interested in topics such as food inspection (90%), food recalls, labelling, and food containing pesticides or residues (89% each), where at least half indicate these are topics of greatest interest. Food fraud also presented a high degree of interest, where 46% of respondents indicated this topic was of greatest interest, and 38% indicate having moderate interest, and nearly a fifth (17%) indicate having little or no interest in this topic. Food testing (85%) and imported food (84%) are topics that show a similar level of overall interest, although that is because of a larger percentage indicating a moderate level of interest.
Topics with the least interest include Genetically Modified Organisms (GMOs), allergens, and organic food; for all these topics 25% to 32% of respondents indicated having little or no interest, and less than one third indicated these topics were of greatest interest.
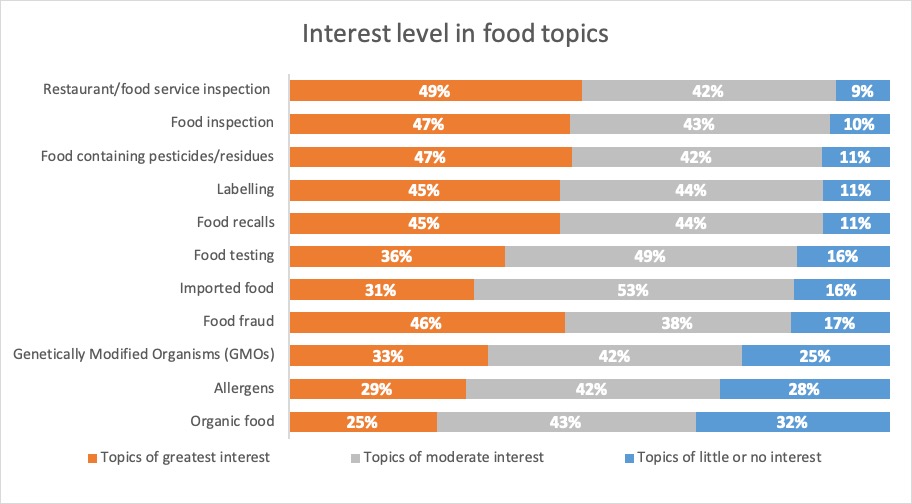
Q16: Please sort the following topics according to which are of little or no interest, of moderate interest, or of greatest interest to you. Base: All Respondents, n= 1,504.
| Topics of greatest interest | Topics of moderate interest | Topics of little or no interest | |
|---|---|---|---|
| Restaurant/food service inspection | 49% | 42% | 9% |
| Food inspection | 47% | 43% | 10% |
| Food containing pesticides/residues | 47% | 42% | 11% |
| Labelling | 45% | 44% | 11% |
| Food recalls | 45% | 44% | 11% |
| Food testing | 36% | 49% | 16% |
| Imported food | 31% | 53% | 16% |
| Food fraud | 46% | 38% | 17% |
| Genetically Modified Organisms (GMOs) | 33% | 42% | 25% |
| Allergens | 29% | 42% | 28% |
| Organic food | 25% | 43% | 32% |
Quebec residents are more likely to be interested in topics such as food inspection, and restaurant and food service inspection compared to other provinces. Allergens are more likely to be a topic of greatest interest to residents of Atlantic Canada, Manitoba and Saskatchewan, and Ontario, compared to residents from other provinces.
Older respondents are more likely to say labelling, food recalls, food inspection, and restaurant/food service inspection are topics of greatest interest, compared to younger respondents. Women are also more likely to feel this way, compared to men. In addition, respondents at least 55 years old are more likely than younger respondents to be greatly interested in topics such as food fraud, imported food, and food testing.
Food fraud
Food fraud was defined to respondents as the intentional misrepresentation of food for economic or personal gain, and respondents were asked to indicate their level of awareness of this topic. Nearly a third of respondents (32%) are aware of food fraud, indicating they have read or heard about food fraud “a great deal” (5%) or “some” (27%). An additional 39% indicate not reading or hearing much about it, and 27% indicate they have not heard about the topic at all.
Reported awareness of food fraud is highest among respondents in Quebec, Ontario and British Columbia, among respondents under 25 years old, and among women, compared to men.
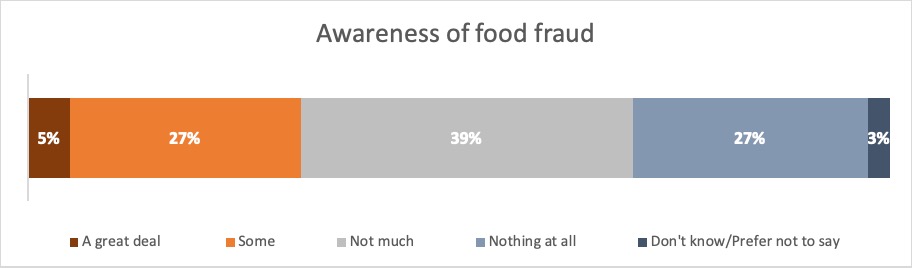
Q17: This section focuses on food fraud - The Canadian Food Inspection Agency defines food fraud as the intentional misrepresentation of food for economic or personal gain. How much have you read or heard about food fraud? Base: All Respondents, n= 1,504.
Awareness of food fraud
- A great deal: 5%
- Some: 27%
- Not much: 39%
- Nothing at all: 27%
- Don't know/Prefer not to say: 3%
Survey participants were asked to provide examples of what they considered misrepresented food.
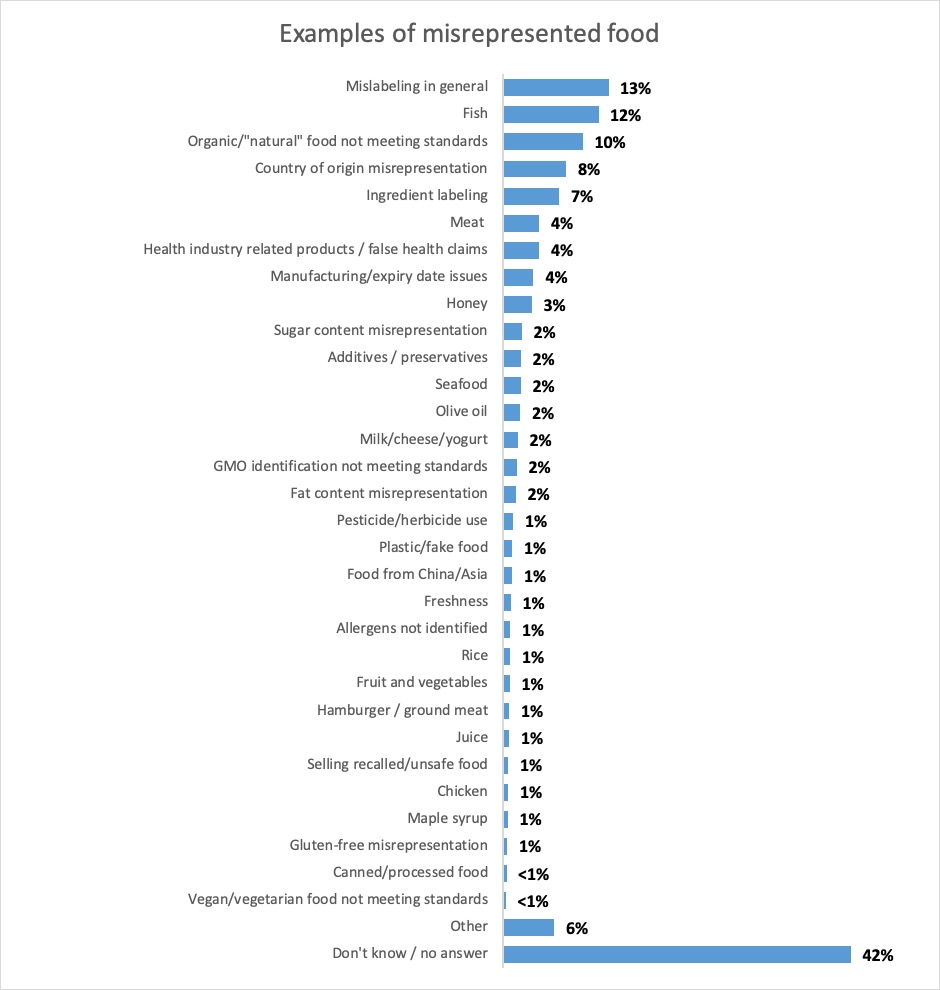
Q18: Please provide some examples of what you would consider to be misrepresented food. Base: All Respondents, n= 1,504.
Examples of misrepresented food
- Mislabeling in general: 13%
- Fish: 12%
- Organic/"natural" food not meeting standards: 10%
- Country of origin misrepresentation: 8%
- Ingredient labeling: 7%
- Meat: 4%
- Health industry related products / false health claims: 4%
- Manufacturing/expiry date issues: 4%
- Honey: 3%
- Sugar content misrepresentation: 2%
- Additives / preservatives: 2%
- Seafood: 2%
- Olive oil: 2%
- Milk/cheese/yogurt: 2%
- GMO identification not meeting standards: 2%
- Fat content misrepresentation: 2%
- Pesticide/herbicide use: 1%
- Plastic/fake food: 1%
- Food from China/Asia: 1%
- Freshness: 1%
- Allergens not identified: 1%
- Rice: 1%
- Fruit and vegetables: 1%
- Hamburger / ground meat: 1%
- Juice: 1%
- Selling recalled/unsafe food: 1%
- Chicken: 1%
- Maple syrup: 1%
- Gluten-free misrepresentation: 1%
- Canned/processed food: < 1%
- Vegan/vegetarian food not meeting standards: < 1%
- Other: 6%
- Don't know / no answer: 42%
The top-five examples include:
- Mislabeling in general (13%) which includes including wrong nutritional information, inaccurate weights, and misleading pictures
- Fish-related examples portraying false species or origin (12%)
- Related to organic or “natural” foods that do not meet standards (10%)
- A general misrepresentation of a country of origin where the products are packaged in Canada but grown elsewhere (8%), and
- Information in the ingredient list where not all or the wrong composition ingredients are listed (7%)
Other examples include the misrepresentation of meat, including the wrong type of meat (4%), false claims with health industry related products such as protein powder or cereal (4%), manufacturing or expiry date issues including switching labels or changing packages (4%), or the labelling information on honey, i.e. if it is diluted or mixed with other sweeteners (3%).
To a lesser extent, examples of misrepresentation in food includes sugar content, additives (ferrous sulfates) or preservatives, the origin of seafood mixed with other food, the purity or processing of olive oil, examples related to milk, cheese or yogurt, GMO identification not meeting standards, and fat content, among others.
Quebec residents are more likely to say manufacturing or expiry date issues are examples of misrepresented food, as well as olive oil issues, compared to other provinces. Women and older respondents are more likely to mention other examples compared to their counterparts, such as organic food not meeting standards, sugar content, additives or preservatives used, or fake food.
Respondents were asked to rate how confident they are that certain types of food commodities they buy are accurately represented, using a 5-point scale. Ratings for the highest confidence levels were assigned to dairy (top-two value of 76%), coffee and tea (75%), fresh fruits and vegetables (75%), maple (72%), and honey (70%). Maple is the food commodity with the highest proportion of respondents indicating they are “very confident” (37%).
Nearly two thirds of respondents are confident of the accurate representation of eggs and processed eggs (68%), spices (66%), meat (64%) and poultry (63%). Over half are confident of oils (58%), and fruit juices (53%). Less than half are confident organic foods (46%), fish (46%), and processed foods (35%) are accurately represented.
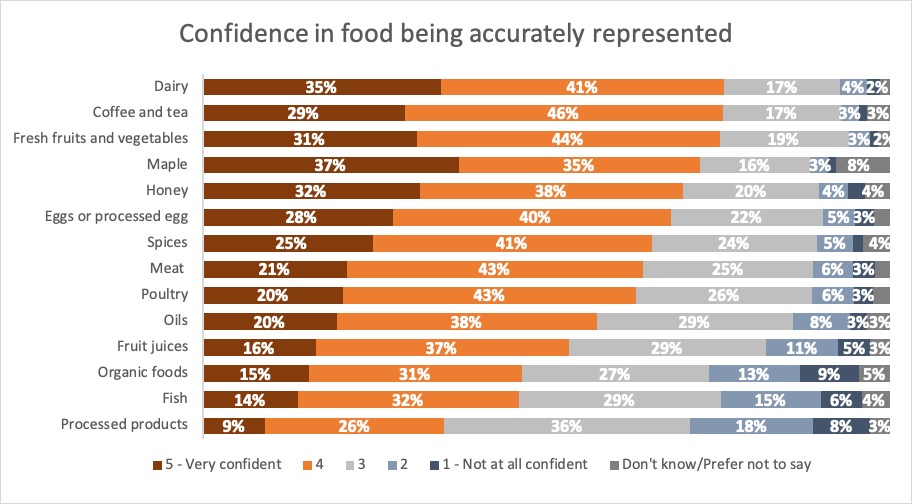
Q19: When purchasing the following types of food commodities, how confident are you that they are accurately represented? Use a 5-point scale in which a response of 1 means you are not at all confident and 5 means you are very confident. Base: All Respondents, n= 1,504.
| 5 - Very confident | 4 | 3 | 2 | 1 - Not at all confident | Don't know/Prefer not to say | |
|---|---|---|---|---|---|---|
| Dairy | 35% | 41% | 17% | 4% | 2% | 2% |
| Coffee and tea | 29% | 46% | 17% | 3% | 1% | 3% |
| Fresh fruits and vegetables | 31% | 44% | 19% | 3% | 1% | 2% |
| Maple | 37% | 35% | 16% | 3% | 1% | 8% |
| Honey | 32% | 38% | 20% | 4% | 2% | 4% |
| Eggs or processed egg | 28% | 40% | 22% | 5% | 3% | 2% |
| Spices | 25% | 41% | 24% | 5% | 1% | 4% |
| Meat | 21% | 43% | 25% | 6% | 3% | 2% |
| Poultry | 20% | 43% | 26% | 6% | 3% | 2% |
| Oils | 20% | 38% | 29% | 8% | 3% | 3% |
| Fruit juices | 16% | 37% | 29% | 11% | 5% | 3% |
| Organic foods | 15% | 31% | 27% | 13% | 9% | 5% |
| Fish | 14% | 32% | 29% | 15% | 6% | 4% |
| Processed products | 9% | 26% | 36% | 18% | 8% | 3% |
Differences among provinces include Alberta residents who show the highest confidence level that meat is accurately represented, Manitoba and Saskatchewan residents feel the same about poultry, Atlantic Canada has the highest confidence level in the accurate representation of fish and fruit juices, Quebec is the least confident in the accurate representation of eggs and processed eggs are accurately represented, but the highest along with British Columbia residents to feel confident about the accurate representation of honey, and the highest to feel confident about maple and organic foods.
Overall, men tend to be more likely than women to feel confident foods are accurately represented in Canada. Respondents who are at least 55 years old are more likely than younger respondents to feel confident that meat, poultry and dairy are accurately represented.
When respondents were asked if they have personally encountered misrepresented food, nearly two thirds (64%) said they have not had this experience with the specific commodities presented to them. Roughly one tenth of respondents have encountered misrepresentation of fish (12%), processed products (10%), fruit juices (9%), organic foods (8%), meat (7%), and honey (7%).
To a lesser extent, respondents have encountered misrepresentation of oils (6%), fresh fruits and vegetables (5%), poultry (4%), dairy (4%), coffee and tea (4%), spices (3%), eggs and processed egg (3%), and maple (3%).
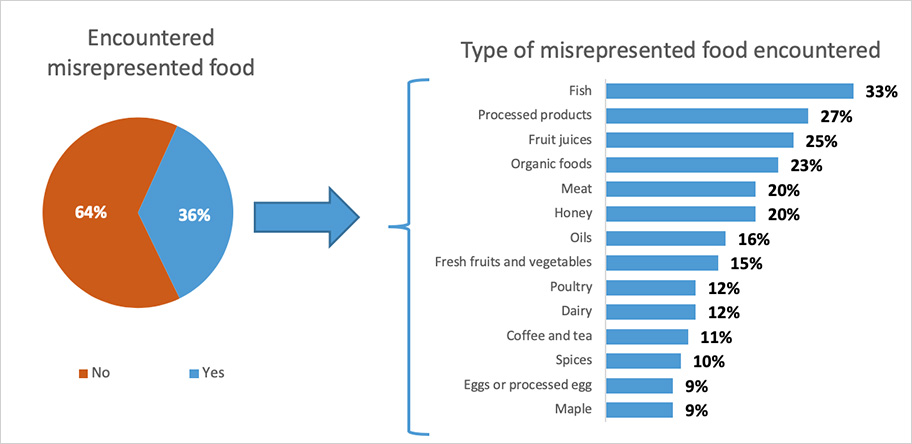
Q20: Have you ever personally encountered misrepresented food with any of the following commodities? Base: All Respondents, n= 1,504 / Respondents encountering misrepresentation of food (n=527).
Encountered misrepresented food
- No: 64%
- Yes: 36%
Type of misrepresented food encountered
- Fish: 33%
- Processed products: 27%
- Fruit juices: 25%
- Organic foods: 23%
- Meat: 20%
- Honey: 20%
- Oils: 16%
- Fresh fruits and vegetables: 15%
- Poultry: 12%
- Dairy: 12%
- Coffee and tea: 11%
- Spices: 10%
- Eggs or processed egg : 9%
- Maple: 9%
Respondents who are at least 65 years old are more likely to say they have encountered misrepresented food issues with fish, compared to their younger counterpart. Respondents who are responsible for purchasing at least 75% of their household groceries are more likely than those responsible of half or less of their household's grocery shopping to say they have encountered misrepresented food issues with processed foods, honey, fresh fruits and vegetables, spices and poultry.
The main reported issues with misrepresented food are related to claiming fish of false species or origin (13%); mislabeling in general, i.e. wrong nutritional information, inaccurate weights, misleading pictures (12%) – particularly among those indicating they encountered misrepresented processed products, spices, coffee and tea, fruit juices or fish; organic or natural food not meeting standards (12%) – more likely among those indicating they encountered misrepresentation of organic foods, or fresh fruits and vegetables; or country of origin misrepresentation i.e. packaged in Canada but grown elsewhere (10%) – this is more likely among those who experienced misrepresentation of fresh fruits and vegetables, fish, honey, eggs or processed egg, or processed products.
To a lesser extent respondents said they had issues with honey's misrepresentation, i.e. dilution, mixed with other sweeteners, etc. (7%), with meat, i.e. the wrong type, adding of colour, or fake meat (7%), with juice i.e. amount of fruit, chemicals or sugar (5%), sugar content misrepresentation (5% - more likely to be mentioned among those encountering misrepresentation of fruit juices or processed products, olive oil, i.e. purity, processing, etc. (5%), manufacturing and expiry dates issues i.e. switching labels, changing packaging, etc. (4% - more likely to be mentioned among respondents experiencing misrepresentation issues of meat and poultry), and artificial freshness or old products (4% - particularly among those reporting to have experienced misrepresentation of fresh fruits and vegetables).
Few respondents said they had issues with ingredient labelling i.e. ingredients not listed, wrong composition, etc. (3%), additives such as ferrous sulfate, MSG, or other preservatives (3%), milk, cheese and other dairy products (3%), seafood i.e. origin, mixed with other food (2%), spices (2%), food from another country mislabeled as a product from Canada (2% - particularly honey, fish and seafood), maple syrup i.e. dilution, mixed with other sweeteners (2%), chicken injected with water, or actually soy protein (2%), selling recalled or unsafe food (2% – particularly among those experiencing issues with dairy and poultry), fruit and vegetables general issues (2%), canned or processed food (2%), eggs not really being free range, being of smaller size, or repackaged (2%), or false health claims of health industry related products such as protein powder or cereals (2%), among others.
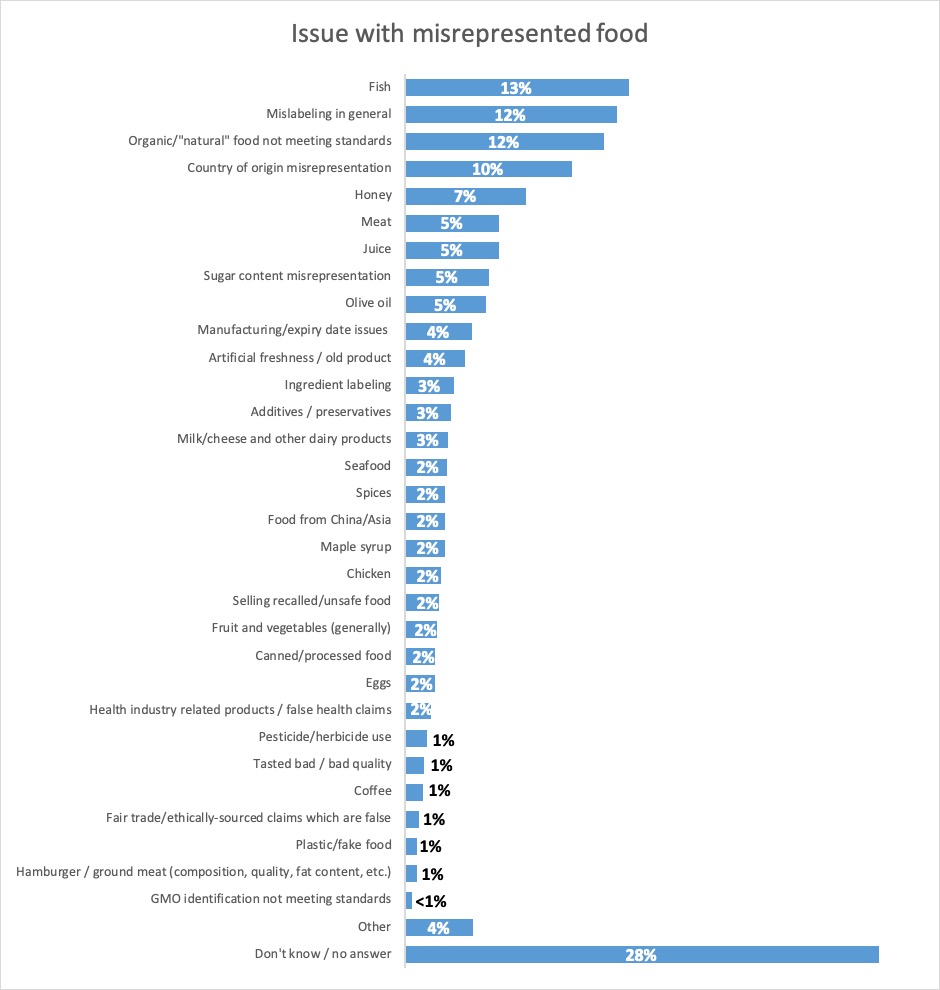
Q21: Please expand on your experience with misrepresented food. What was the specific issue? Base: Respondents who have encountered misrepresented food, n=527.
Issue with misrepresented food
- Fish: 13%
- Mislabeling in general: 12%
- Organic/"natural" food not meeting standards: 12%
- Country of origin misrepresentation: 10%
- Honey: 7%
- Meat: 5%
- Juice: 5%
- Sugar content misrepresentation: 5%
- Olive oil: 5%
- Manufacturing/expiry date issues: 4%
- Artificial freshness / old product: 4%
- Ingredient labeling: 3%
- Additives / preservatives: 3%
- Milk/cheese and other dairy products: 3%
- Seafood: 2%
- Spices: 2%
- Food from China/Asia: 2%
- Maple syrup: 2%
- Chicken: 2%
- Selling recalled/unsafe food: 2%
- Fruit and vegetables (generally): 2%
- Canned/processed food: 2%
- Eggs: 2%
- Health industry related products / false health claims: 2%
- Pesticide/herbicide use: 1%
- Tasted bad / bad quality: 1%
- Coffee: 1%
- Fair trade/ethically-sourced claims which are false: 1%
- Plastic/fake food: 1%
- Hamburger / ground meat (composition, quality, fat content, etc.): 1%
- GMO identification not meeting standards: < 1%
- Other: 4%
- Don't know / no answer: 28%
When asked to rate the likeliness of encountering misrepresented food in Canada, over half (53%) indicated it is likely to encounter food fraud with products imported from other countries to Canada assigning a rating of at least 5 in a 7-point scale. Less than one third (27%) assigned these ratings to the likelihood of encountering misrepresented food in Canada with products made in Canada.
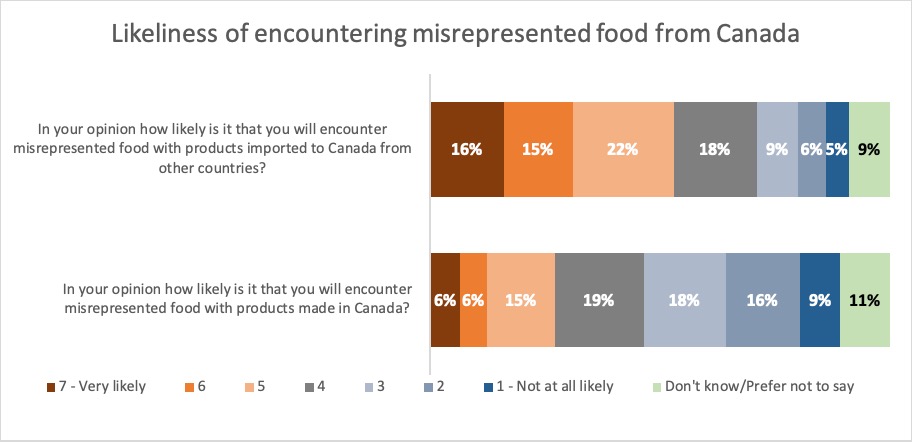
Q22: In your opinion how likely is it that you will encounter misrepresented food with products made in Canada? Use a scale of 1-7 where 1 is not at all likely and 7 is very likely. Base: All Respondents, n= 1,504. Q23: In your opinion how likely is it that you will encounter misrepresented food with products imported to Canada from other countries? Use a scale of 1-7 where 1 is not at all likely and 7 is very likely. Base: All Respondents, n= 1,504.
| 7 - Very likely | 6 | 5 | 4 | 3 | 2 | 1 - Not at all likely | Don't know/Prefer not to say | |
|---|---|---|---|---|---|---|---|---|
| In your opinion how likely is it that you will encounter misrepresented food with products imported to Canada from other countries? | 16% | 15% | 22% | 18% | 9% | 6% | 5% | 9% |
| In your opinion how likely is it that you will encounter misrepresented food with products made in Canada? | 6% | 6% | 15% | 19% | 18% | 16% | 9% | 11% |
Quebec residents are the most likely to say it is “not at all likely” they will encounter misrepresented food with products made in Canada or with products imported to Canada from other countries. However, the rest of Canada is more likely to believe the possibility of encountering misrepresented food with products imported to Canada from other countries is high.
When asked to rate their level of confidence in the Government of Canada managing food fraud, half (50%) of respondents provided a rating above the mid-point on the scale, where 9% said they are “very confident”. In addition, 20% were neutral, 18% said they are not confident, and 11% did not know or preferred to not respond.
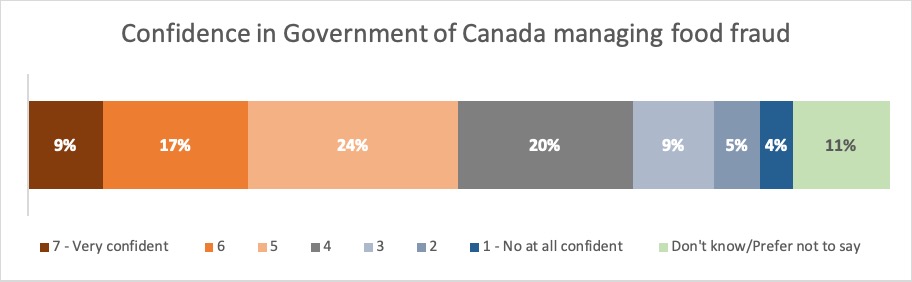
Q24: Please rate your level of confidence in how the Government of Canada manages food fraud? Base: All Respondents, n= 1,504.
Confidence in Government of Canada managing food fraud
- 7 - Very confident: 9%
- 6: 17%
- 5: 24%
- 4: 20%
- 3: 9%
- 2: 5%
- 1: No at all confident 4%
- Don't know/Prefer not to say: 11%
Ontario residents have the highest confidence level in how the Government of Canada manages food fraud, while Alberta residents are the most likely to indicate they are “not at all confident”, compared to residents from other provinces. The higher the household income and education level is among respondents, the more likely they are to be confident in the federal government's handling of food fraud.
The study explored the perceptions of Canadians regarding who is most responsible for ensuring food in Canada is accurately represented. Results show the Government of Canada is perceived as the most responsible stakeholder: over half of respondents (56%) ranked the Government of Canada as the number one with most responsibility on this issue, while 12% ranked it as number two, and 10% as number three, adding up to 78% of respondents.
Provincial governments were ranked the second most responsible stakeholder by 43% of respondents. Provincial governments are seen as the third most responsible for ensuring food in Canada is accurately represented, with only 3% seeing them as the most responsible, but 43% as the second most responsible, and 15% as the third most responsible, adding up to 61% overall.
Food manufacturers or processors were ranked the highest as the third most responsible stakeholder by 29% of respondents. The second most responsible stakeholder is food manufacturers or processors, with 15% of respondents ranking them as number one with most responsibility, 19% ranking them as number two, and 29% ranking them as number three, adding up to 63% of respondents.
Companies that import foods into Canada are seen as the fourth most responsible stakeholder, with 7% ranking them as the number one with most responsibility, 15% as number two, and 24% as number three, adding up to 46% of respondents ranking them in the top-three places.
While farmers were ranked the second highest as the most responsible stakeholder by 16% of respondents, only 6% ranked them as second most responsible, 11% as third most responsible, and 67% as even less important from the list of stakeholders.
To a much lesser extent, Canadians feel grocery stores (15%) and consumers (6%) are ranked in the top-three places for responsibility on this matter.
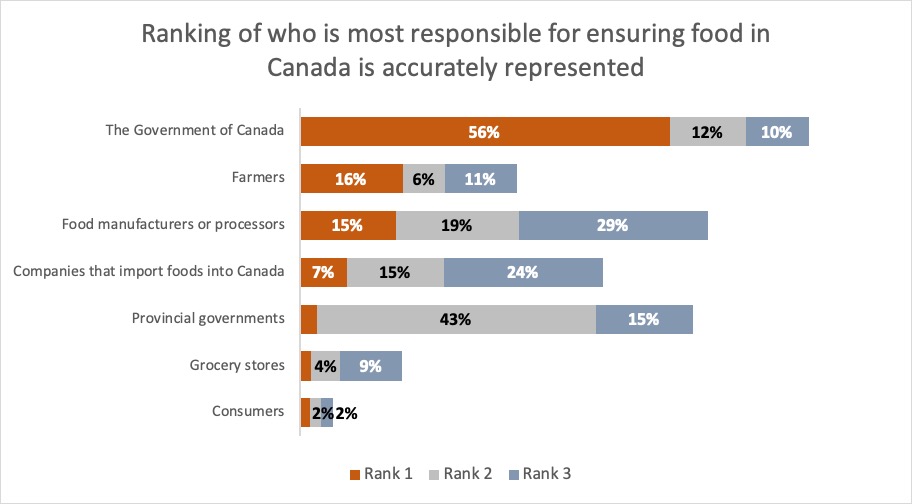
Q25: Please rank the following in order of who you think has the most responsibility for ensuring that food sold in Canada is accurately represented. Base: All Respondents, n= 1,504.
| Rank 1 | Rank 2 | Rank 3 | |
|---|---|---|---|
| Government of Canada | 56% | 12% | 10% |
| Farmers | 16% | 6% | 11% |
| Food manufacturers or processors | 15% | 19% | 29% |
| Companies that import foods into Canada | 7% | 15% | 24% |
| Provincial governments | 3% | 43% | 15% |
| Grocery stores | 2% | 4% | 9% |
| Consumers | 2% | 2% | 2% |
Alberta and British Columbia residents have the highest levels saying the federal government is the most responsible for ensuring that food sold in Canada is accurately represented, while those in Quebec are the most likely to say the opposite. Responsibility assigned to the federal government on this aspect is also higher among older respondents, among those with a higher education level, and among respondents living in households with more than five people.
Quebec residents are the least likely to rank food manufacturers or processors as the most responsible, but the most likely to rank farmers as the most responsible ones.
Regarding the term “food fraud”, over three quarters of respondents (78%) agree “food fraud” (“fraude alimentaire” in French) is the appropriate term to describe the intentional misrepresentation of food. Other terms considered appropriate were: “food misrepresentation” or “misrepresented food” (14%), “misrepresentation” (8%), and 5% or less suggest using “fraudulent” or “cheated food”, “fake or counterfeit food/products, “food lies or agro-industrial lies”, misrepresentation of specific aspect, e.g. source, sugar content, etc., “food theft”, product/food not up-to-par with regulation, or “imitation food”. Six out of ten respondents did not know what better term to suggest.
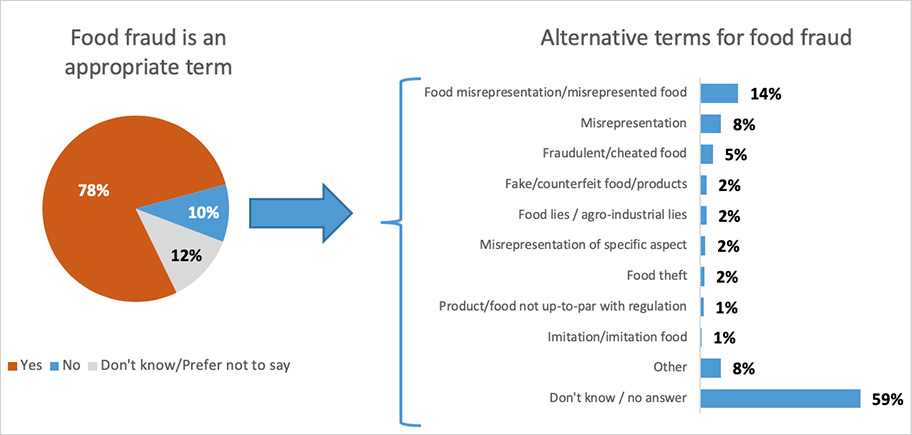
Q26: Do you think “food fraud” is an appropriate term to describe the intentional misrepresentation of food? Base: All Respondents, n=1,504. food, n=137.
Food fraud is an appropriate term
- Yes: 78%
- No: 10%
- Don't know/Prefer not to say: 12%
Q27: What term do you think should be used instead of “food fraud”? Base: Respondents who do not think “food fraud” is an appropriate term for misrepresentation of food, n=137.
Alternative terms for food fraud
- Food misrepresentation/misrepresented food: 14%
- Misrepresentation: 8%
- Fraudulent/cheated food: 5%
- Fake/counterfeit food/products: 2%
- Food lies / agro-industrial lies: 2%
- Misrepresentation of specific aspect: 2%
- Food theft: 2%
- Product/food not up-to-par with regulation: 1%
- Imitation/imitation food: 1%
- Other: 8%
- Don't know / no answer: 59%
Respondents in British Columbia and Quebec have the highest levels of agreement that the terminology “food fraud” or “fraude alimentaire”, respectively, is appropriate; while Alberta residents show the highest agreement level with the English term. The term, in either English or French, is also more accepted among respondents who are at least 35 years old.
Labelling
The truthfulness of labels was another aspect measured in this study. Seven out of ten (70%) say they are confident that the information on food labels regarding the common name of the food is truthful. Six in ten are confident the ingredient information (63%) and the nutrition information in food labels is truthful (62%).
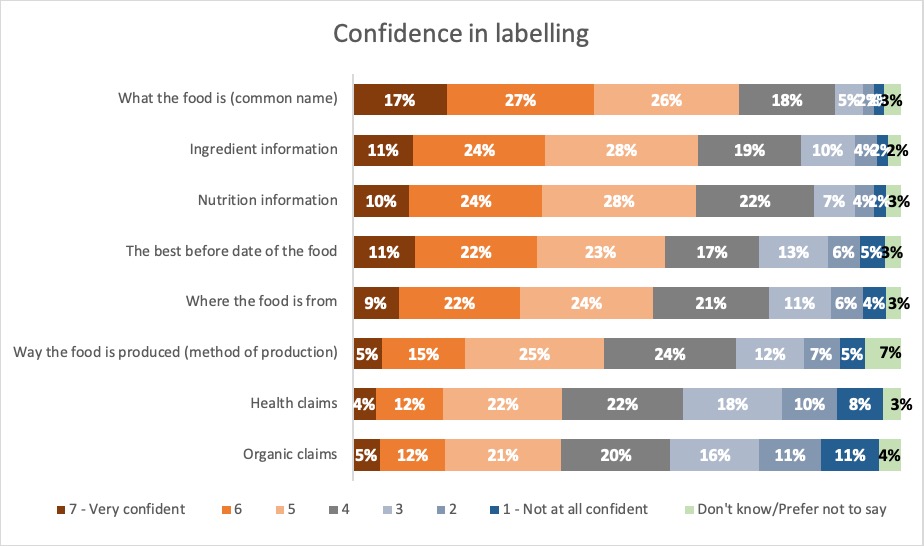
Q28: How confident are you that the following types of labelling information or claims are truthful and accurate on food labels? Base: All Respondents, n= 1,504.
| 7 - Very confident | 6 | 5 | 4 | 3 | 2 | 1 - Not at all confident | Don't know/Prefer not to say | |
|---|---|---|---|---|---|---|---|---|
| What the food is (common name) | 17% | 27% | 26% | 18% | 5% | 2% | 2% | 3% |
| Ingredient information | 11% | 24% | 28% | 19% | 10% | 4% | 2% | 2% |
| Nutrition information | 10% | 24% | 28% | 22% | 7% | 4% | 2% | 3% |
| The best before date of the food | 11% | 22% | 23% | 17% | 13% | 6% | 5% | 3% |
| Where the food is from | 9% | 22% | 24% | 21% | 11% | 6% | 4% | 3% |
| Way the food is produced (method of production) | 5% | 15% | 25% | 24% | 12% | 7% | 5% | 7% |
| Health claims | 4% | 12% | 22% | 22% | 18% | 10% | 8% | 3% |
| Organic claims | 5% | 12% | 21% | 20% | 16% | 11% | 11% | 4% |
Confidence that the food is what the label says is highest among younger respondents, and among respondents in Atlantic Canada, Alberta and Ontario. Respondents who are at least 35 years old are the most likely to say they are not confident organic claims or health claims on labels are truthful or accurate.
The foods that are most discarded when they pass their “best before” or “Use by” date are fresh meat (discarded by 59% of respondents), pre-cooked meat and deli (56%), and milk (53%). Less than half of respondents say they discard yogurt (39%), cheese (29%), fresh juices (25%), bakery (23%), packaged fruit (21%), and packaged vegetables (21%). Nearly one fifth (17%) do not discard any of the above-mentioned foods when they pass their “best before” or “use by” date.
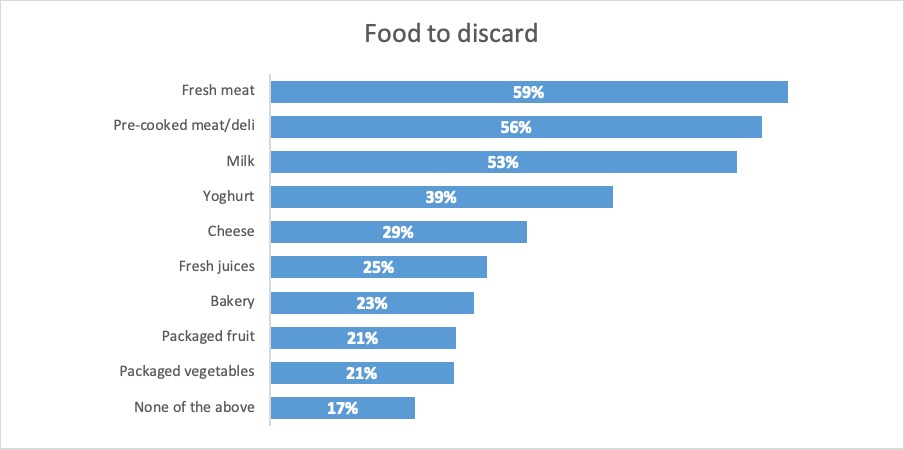
QE3: Which of the following products would you discard when they go past their “best before” or “use by” date? Check all that apply. Base: All Respondents, n=1,504.
Food to discard
- Fresh meat: 59%
- Pre-cooked meat/deli: 56%
- Milk: 53%
- Yoghurt: 39%
- Cheese: 29%
- Fresh juices: 25%
- Bakery: 23%
- Packaged fruit: 21%
- Packaged vegetables: 21%
- None of the above: 17%
Regionally, Quebec and Ontario have the highest proportion of residents saying they discard fresh meat once past the “best before” date. With the exception of fresh meat, Quebec has the smallest proportion of residents saying they discard the products listed above, while Ontario has the highest proportion of residents saying they discard the products listed. Respondents under 55 years old are more likely to say they discard milk, yogurt, cheese and bakery products once their “best before” or “use by” date is past, while those at least 55 years old are the most likely to say they discard pre-cooked meat or deli meat. Older respondents are more likely to say they do not discard any of the products listed above.
Food recalls
Over half of respondents (55%) say they recall hearing about food recalls in Canada during the past six months. This was mainly through news sites (63%), Facebook (38%), and radio (33%). Hearing about food recalls from a CFIA email list was mentioned by 13% of respondents. Less than one tenth of respondents mentioned hearing about food recalls on Twitter (7%), Instagram (6%), television (2%), newspaper (2%), grocery stores (2%), or word of mouth (1%).
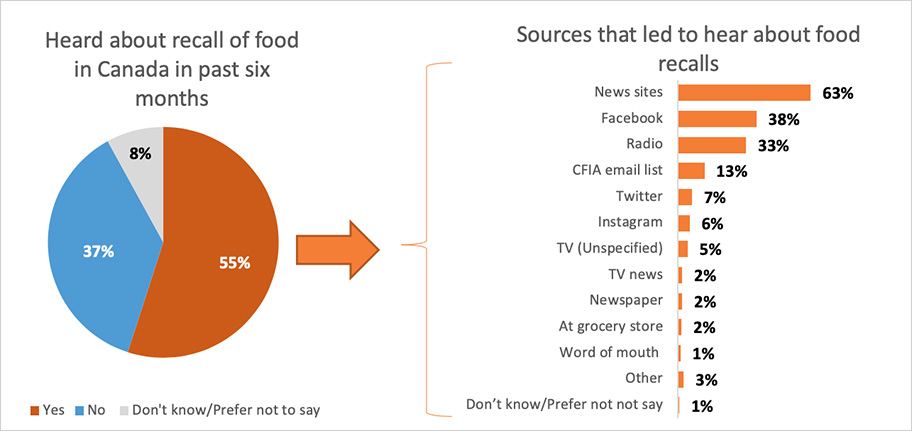
Q29: In the past six months, have you read, seen or heard anything about the recall of food products in Canada? Base: All Respondents, n=1,504.
Heard about recall of food in Canada in past six months
- No: 37%
- Yes: 55%
- Don't know/Prefer not to say: 8%
Q30: Where did you read, see or hear about the food recall? Choose all that apply. Base: Those who have heard of a food recall in Canada in past 6 months, n=829.
Sources that led to hear about food recalls
- News sites: 63%
- Facebook: 38%
- Radio: 33%
- CFIA email list: 13%
- Twitter: 7%
- Instagram: 6%
- TV (Unspecified): 5%
- TV news: 2%
- Newspaper: 2%
- At grocery store: 2%
- Word of mouth: 1%
- Other: 3%
- Don't know/Prefer not say: 1%
Alberta residents are the most likely to say they have not heard about food recalls, compared to residents of Atlantic Canada, Quebec and Ontario, as well as men compared to women. Hearing about food recalls is highest among residents in Atlantic Canada, Ontario, and Quebec.
Respondents who are under 55 years old are more likely to have heard about food recalls through social media, while older respondents are more likely to have heard through news sites, or newspapers.
Regionally, Quebec residents are more likely to have heard through Facebook, and the CFIA's email list. Residents in Atlantic Canada are also likely to have heard about food recalls through the CFIA's email list, and Alberta residents are the most likely to have heard through Instagram. Results for Ontario are similar to those at the overall national level.
Over four in five respondents (84%) agree food recalls happen, even with the best of efforts to keep food safe (30% strongly agree, 54% agree), while 63% agree unsafe food is recalled in a timely manner in Canada (15% strongly agree, 48% agree), and over a third (34%) agree Canadians are at a higher risk of consuming unsafe foods today compared to three years ago.
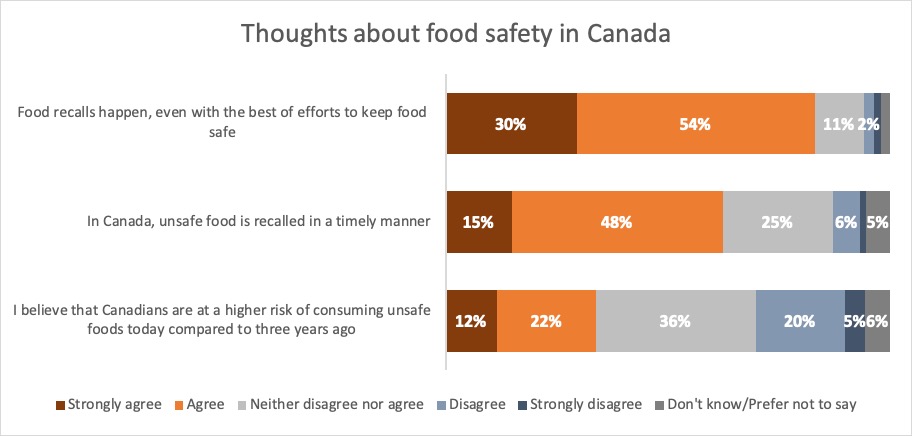
Q31: To what extent do you agree or disagree with each of the following statements? Base: All Respondents, n= 1,504.
| Strongly agree | Agree | Neither disagree nor agree | Disagree | Strongly disagree | Don't know/Prefer not to say | |
|---|---|---|---|---|---|---|
| Food recalls happen, even with the best of efforts to keep food safe | 30% | 54% | 11% | 2% | 2% | 2% |
| In Canada, unsafe food is recalled in a timely manner | 15% | 48% | 25% | 6% | 1% | 5% |
| I believe that Canadians are at a higher risk of consuming unsafe foods today compared to three years ago | 12% | 22% | 36% | 20% | 5% | 6% |
Respondents who are at least 55 years old are more likely to agree food recalls happen even with the best of efforts to keep food safe, while those who are 18 to 24 years old are the least likely to agree unsafe food is recalled in a timely manner in Canada.
One fifth of respondents (20%) are aware of the Safe Food for Canadians Regulations (SFCR). These respondents mainly heard about SFCR online (13%), through television (12%), or the news (12%). At least 5% of respondents mentioned hearing about SFCR through work (8%), at school (7%), on the radio (6%), on social media (5%), newspapers (5%), or word of mouth (5%), among other sources.
Awareness of the SFCR is highest among residents in Quebec, and among respondents under 55 years old, those working full or part time, or parents of a child under 18 living at home.
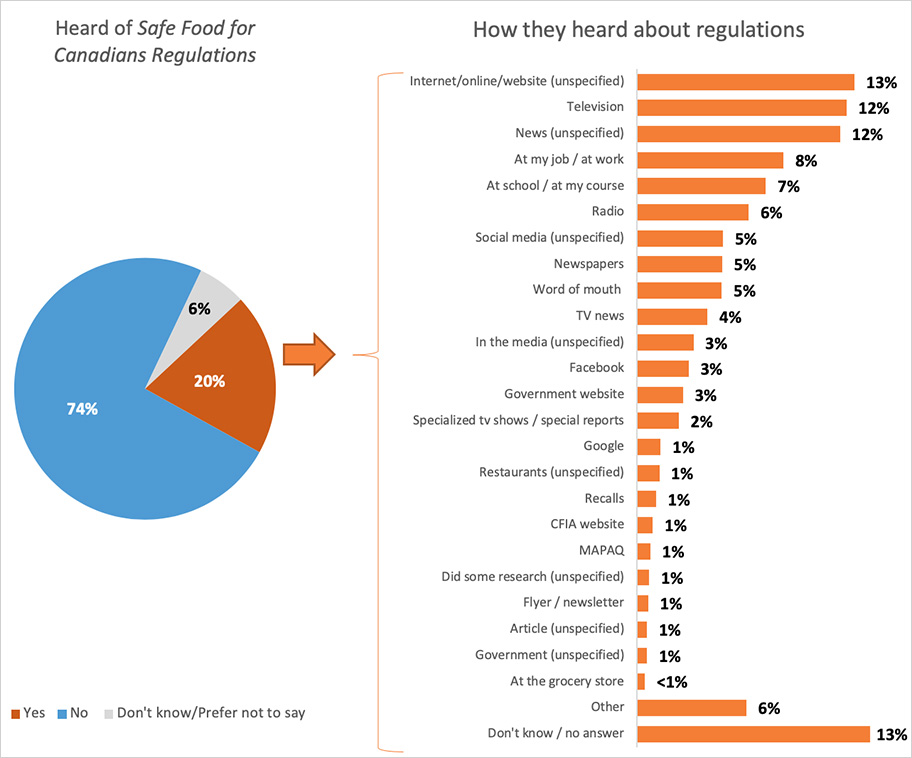
Q32: Have you heard of the Safe Food for Canadians Regulations? Base: All Respondents, n=1,504.
Heard of Safe Food for Canadians Regulations
- No: 74%
- Yes: 20%
- Don't know/Prefer not to say: 6%
Q33: How did you hear about these regulations? Base: Those who have heard of Safe Food for Canadians Regulations, n=283.
How they heard about regulations
- Internet/online/website (unspecified): 13%
- Television: 12%
- News (unspecified) : 12%
- At my job / at work: 8%
- At school / at my course: 7%
- Radio: 6%
- Social media (unspecified) : 5%
- Newspapers: 5%
- Word of mouth: 5%
- TV news: 4%
- In the media (unspecified) : 3%
- Facebook: 3%
- Government website: 3%
- Specialized tv shows / special reports: 2%
- Google: 1%
- Restaurants (unspecified) : 1%
- Recalls: 1%
- CFIA website: 1%
- MAPAQ: 1%
- Did some research (unspecified) : 1%
- Flyer / newsletter: 1%
- Article (unspecified) : 1%
- Government (unspecified) : 1%
- At the grocery store: < 1%
- Other: 6%
- Don't know / no answer: 13%
More than 4 in 5 respondents (81%) believe the SFCR improve food safety in Canada, 8% say they do not believe it improves safety in Canada, and 11% don't know.
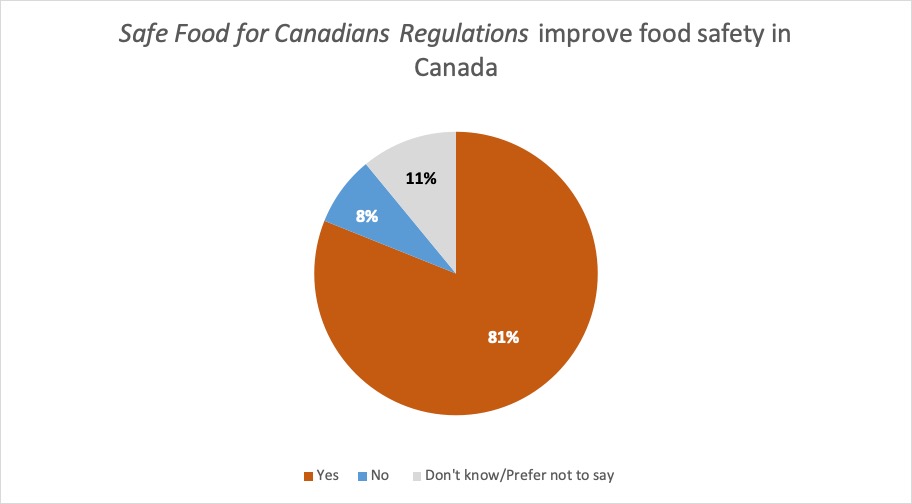
Q34: From what you have heard, do you personally believe the Safe Food for Canadians Regulations improve food safety in Canada? Base: Those who have heard of Safe Food for Canadians Regulations, n=283.
Safe Food for Canadians Regulations improve food safety in Canada
- Yes: 81%
- No : 8%
- Don't know/Prefer not to say: 11%
When it comes to food safety, 21% want more detailed information than what the food labels provide, including country of origin (where the food is produced, not just packaged); manufacturing and expiry date information; more detailed or representative ingredients; more accuracy of labels and their information (nutritional value accuracy, weight accuracy, standardization), and an indication of how healthy a food is.
Canadians are also looking for more general food-related information (21%), including lists of unsafe food or issues with food safety, (i.e. E.coli, early warnings, emails, etc.); food recalls; food treatment methods or production conditions' inspection-related inquiries (i.e. frequency, breadth, qualifications of inspectors, etc.); and information on imported foods (i.e. unreadable labels, false information, etc.)
When responses of the type of information Canadians are looking for are grouped by category, 13% say they want to have more information on foods (this includes foods in general to generate more awareness (4%), meat-related information (4%), fish or seafood source and if they are farmed or not (2%), specific to dairy (milk, yogurt, cheese, etc. – 2%), fruit and vegetables (1%), poultry (1%), or processed or canned food (1%).
Other categories include the types of foods (5%), including organic, and GMO identification; food regulations (5% - information on offenders, safety improvements needed, food fraud, severity of fines, transparency about existing regulations); chemicals used in food including preservatives and pesticides (5%); or other types of information (9%) including restaurant-specific issues, cleanliness or contamination issues, or others in general.
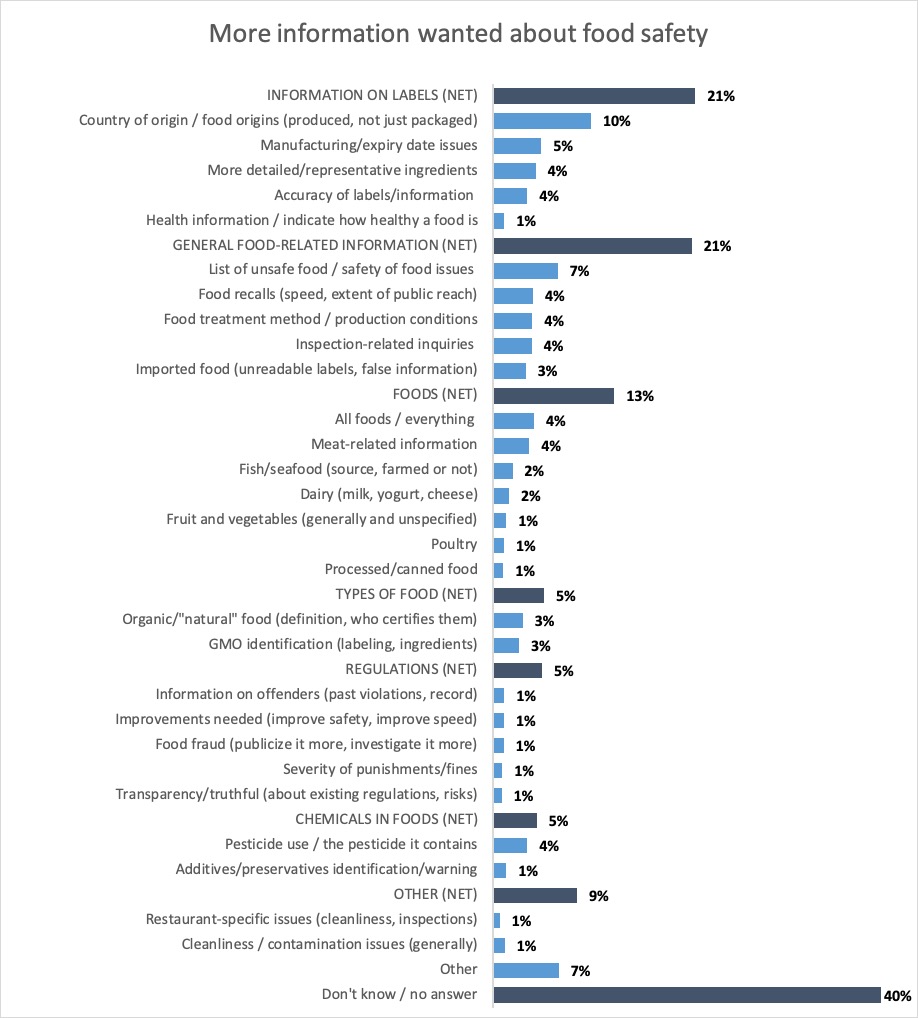
Q35: When it comes to food safety in Canada, please specify anything you would like more information on. Base: All Respondents, n=1,504.
More information wanted about food safety
- Information on labels (net): 21%
- Country of origin / food origins (produced, not just packaged): 10%
- Manufacturing/expiry date issues: 5%
- More detailed/representative ingredients: 4%
- Accuracy of labels/information: 4%
- Health information / indicate how healthy a food is: 1%
- General food-related information (net): 21%
- List of unsafe food / safety of food issues: 7%
- Food recalls (speed, extent of public reach): 4%
- Food treatment method / production conditions: 4%
- Inspection-related inquiries: 4%
- Imported food (unreadable labels, false information) : 3%
- Foods (net): 13%
- All foods / everything: 4%
- Meat-related information: 4%
- Fish/seafood (source, farmed or not): 2%
- Dairy (milk, yogurt, cheese): 2%
- Fruit and vegetables (generally and unspecified): 1%
- Poultry : 1%
- Processed/canned food: 1%
- Types of food (net): 5%
- Organic/"natural" food (definition, who certifies them): 3%
- GMO identification (labeling, ingredients): 3%
- Regulations (net): 5%
- Information on offenders (past violations, record): 1%
- Improvements needed (improve safety, improve speed): 1%
- Food fraud (publicize it more, investigate it more): 1%
- Severity of punishments/fines: 1%
- Transparency/truthful (about existing regulations, risks): 1%
- Chemicals in foods (net): 5%
- Pesticide use / the pesticide it contains: 4%
- Additives/preservatives identification/warning: 1%
- Other (net): 9%
- Restaurant-specific issues (cleanliness, inspections): 1%
- Cleanliness / contamination issues (generally): 1%
- Other: 7%
- Don't know / no answer: 40%
Respondents in Quebec are the most likely to say they want more information on foods (particularly meat-related information). Ontario residents are more likely to say they want more general food-related information, especially the lists of unsafe food or safety of food issues. The priority for residents in Atlantic Canada as well as Manitoba and Saskatchewan is general food-related information, and information on specific labels for Quebec, Alberta and British Columbia.
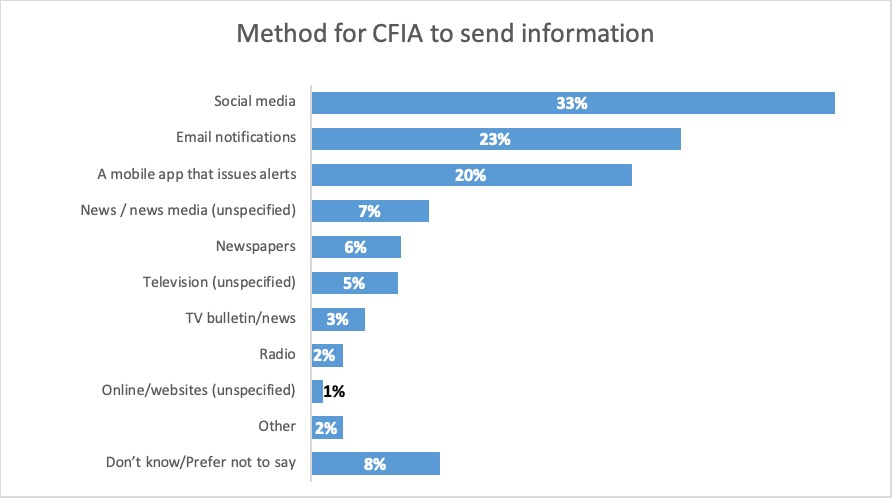
Over 9 in 10 respondents (92%) mentioned at least one preferred way of receiving food safety related information from the CFIA. Social media is the preferred method according to 33% of respondents, followed by email notifications (23%), and a mobile app that issues alerts (20%). A few respondents also prefer to receive this information through the news or news media (7%), newspapers (6%), television in general (5%), TV bulletins or news (3%), radio (2%), or online in general (1%).
Q36: When it comes to food safety, food fraud and food recalls what is the best way for the Canadian Food Inspection Agency to send you information? Check all that apply. Base: All Respondents, n=1,504.
Method for CFIA to send information
- Social media: 33%
- Email notifications: 23%
- A mobile app that issues alerts: 20%
- News / news media (unspecified): 7%
- Newspapers: 6%
- Television (unspecified): 5%
- TV bulletin/news: 3%
- Radio: 2%
- Online/websites (unspecified): 1%
- Other: 2%
- Don't know/Prefer not to say: 8%
Social media is the preferred method to hear from the CFIA for respondents who are 18 to 54 years old. The younger the respondents are, the more they are to select social media as their preferred method. The mobile app that issues alerts is the least popular among respondents at least 65 years old. Respondents who are at least 55 years old would prefer to receive this information in newspapers, television and radio.
Regionally, Quebec residents prefer receiving this information via social media and a mobile app, while Alberta and British Columbia prefer news and news media as the way to hear about food issues.
Methodology
All research work was conducted in accordance with the professional standards established by the Government of Canada Public Opinion Research Standards, as follows:
- The survey consisted of an online survey with Canadians.
- Respondents are 18 years of age and older who were at least partially responsible (25%) for purchasing groceries.
- Quorus collaborated with the CFIA to finalize the survey instrument in English to meet the research objectives. Quorus translated the client-approved English version of the survey. Respondents had the choice to complete the survey in English or French.
- Quorus informed respondents of their rights under the PIPEDA and ensured that those rights were protected throughout the research process. This included informing participants of the purpose of the research; identifying both the sponsoring department or agency and research supplier at the end of the interview; informing participants that the study will be made available to the public in 6 months after field completion through Library and Archives Canada, informing participants that their participation in the study was voluntary, and that the information provided would be administered according to the requirements of the Government of Canada.
- The survey took on average 14 minutes to complete.
- A total of 1,504 surveys were completed through the online survey.
- Data collection occurred between February 14 and February 19, 2020, and included a pretest of 26 surveys with English respondents and 18 with French respondents. The pretest helped assess the flow of the survey, comprehension of the questions, language, data integrity, and particularly the length of the survey.
- For this study, quotas by province were established to generate sufficient data regionally for robust analysis. Data was monitored to aim for a 50/50 gender split in each province, and that no specific age cohort was under-represented. The equivalent margin of error for a probability study of 1,500 cases would be +/- 2.5%.
- Data were weighted by region, gender and age to ensure that the final distributions within the final sample mirror those of the Canadian population according to the latest Census data.
Appendices
Additional analysis
For the first group of foods presented, the combination of the top-two values shows respondents feel most confident about eating eggs in Canada (84%), dairy (82%), maple (82%), and honey (81%), followed closely by fresh fruits and vegetables (78%). Over two thirds feel confident eating meat and poultry (70%), or organic products (69%). Roughly half of participants feel confident eating fish (57%), and 46% feel confident eating processed products (canned, cooked, frozen, etc.).
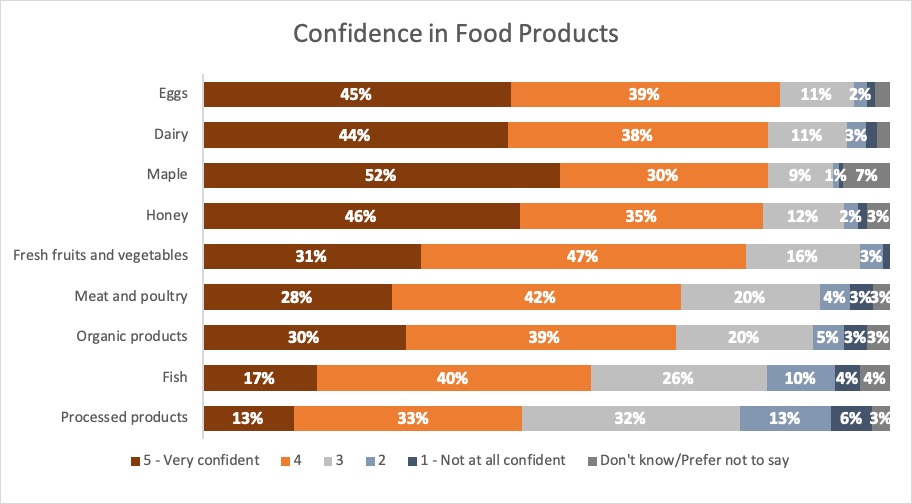
Q6: For each of the following types of food products, please indicate how confident you are that the products sold in Canada are safe to eat. You can do this by using a 5-point scale in which a response of 1 means you are not at all confident and 5 means you are very confident. Base: SPLIT SAMPLE, n= 752.
| 5 - Very confident | 4 | 3 | 2 | 1 - Not at all confident | Don't know/Prefer not to say | |
|---|---|---|---|---|---|---|
| Eggs | 45% | 39% | 11% | 2% | 1% | 2% |
| Dairy | 44% | 38% | 11% | 3% | 2% | 2% |
| Maple | 52% | 30% | 9% | 1% | 1% | 7% |
| Honey | 46% | 35% | 12% | 2% | 1% | 3% |
| Fresh fruits and vegetables | 31% | 47% | 16% | 3% | 1% | 0% |
| Meat and poultry | 28% | 42% | 20% | 4% | 3% | 3% |
| Organic products | 30% | 39% | 20% | 5% | 3% | 3% |
| Fish | 17% | 40% | 26% | 10% | 4% | 4% |
| Processed products | 13% | 33% | 32% | 13% | 6% | 3% |
In terms of regional differences, confidence that meat and poultry and processed products are safe to eat is highest in Alberta, while confidence regarding eggs and maple safety is highest in Quebec. Conversely, respondents in Quebec, British Columbia, and Atlantic Canada are more likely to say they are not confident processed products are safe to eat, compared to respondents from other provinces.
Another trend observed is that the lower the household income, the more likely respondents are to say they are not confident that fish is safe to eat in Canada. The older respondents are more likely to say dairy, fresh and vegetables are safe to eat.
Respondent profile
A variety of questions were asked to study participants to obtain their demographic information. This information not only allowed the research team to understand the profile of those participating in the study, but also to weight the data and ensure results are representative of the population.
| Segment | Unweighted | Weighted |
|---|---|---|
| Male | 50% | 49% |
| Female | 50% | 51% |
| Transgender | <1% | <1% |
| Segment | Unweighted | Weighted |
|---|---|---|
| English | 75% | 76% |
| French | 25% | 24% |
| Segment | Unweighted | Weighted |
|---|---|---|
| 18-24 | 6% | 10% |
| 25-34 | 14% | 18% |
| 35-54 | 39% | 34% |
| 55-64 | 20% | 17% |
| 65+ | 22% | 21% |
| Segment | Unweighted | Weighted |
|---|---|---|
| British Columbia | 12% | 14% |
| Alberta | 10% | 11% |
| Saskatchewan | 4% | 3% |
| Manitoba | 6% | 4% |
| Ontario | 33% | 38% |
| Quebec | 25% | 23% |
| Atlantic | 10% | 7% |
| Segment | Unweighted | Weighted |
|---|---|---|
| 25-50 | 25% | 24% |
| 51-75 | 10% | 11% |
| 76-100 | 65% | 65% |
| Segment | Unweighted | Weighted |
|---|---|---|
| 1 | 21% | 21% |
| 2 | 42% | 40% |
| 3 | 16% | 16% |
| 4 | 13% | 14% |
| 5+ | 6% | 7% |
| DK/Prefer not to say | 2% | 2% |
| Segment | Unweighted | Weighted |
|---|---|---|
| Working full-time | 44% | 44% |
| Working part-time | 9% | 9% |
| Self-employed | 6% | 5% |
| Unemployed | 2% | 2% |
| Student | 4% | 6% |
| Retired | 28% | 26% |
| Not Working | 6% | 6% |
| DK/Prefer not to say | 2% | 1% |
| Segment | Unweighted | Weighted |
|---|---|---|
| Some high school | 3% | 3% |
| High school diploma | 20% | 20% |
| Apprenticeship/College | 31% | 30% |
| Univ. Certif./Bachelor's degree | 31% | 32% |
| Post graduate degree | 14% | 13% |
| DK/Prefer not to say | 1% | 1% |
| Segment | Unweighted | Weighted |
|---|---|---|
| Single | 25% | 28% |
| Married/common law | 60% | 57% |
| Separated/divorced | 11% | 10% |
| Widowed | 4% | 4% |
| Other | <1% | <1% |
| DK/Prefer not to say | 1% | 1% |
| Segment | Unweighted | Weighted |
|---|---|---|
| Under $20,000 | 8% | 9% |
| $20,000 - $40,000 | 14% | 14% |
| $40,000 - $60,000 | 17% | 16% |
| $60,000 - $80,000 | 15% | 15% |
| $80,000 - $100,000 | 13% | 13% |
| $100,000 - $150,000 | 14% | 14% |
| $150,000 and above | 9% | 9% |
| DK/Prefer not to say | 9% | 9% |
Survey instrument
Survey – information in square brackets is not displayed to respondents
[Introduction]
Thank you for participating in this survey. Quorus Consulting Group, a Canadian market research firm, is conducting this survey on behalf of the Government of Canada. The survey will ask you questions in regards to food safety and the truthful representation of food. The survey should take you about 10 to 15 minutes to complete.
Your participation is voluntary and completely confidential. All your answers will remain anonymous. The information provided will be managed according to the requirements of the Privacy Act. The final report on the survey will be available through Library and Archives Canada.
Vous pouvez également répondre au sondage en français.
[Section 1: Screening]
1. To what extent are you responsible for purchasing the household groceries (enter a percentage between 0 and 100)?
[If under 25% terminate]
2. In what year were you born?
[INSERT YEAR. IF YOUNGER THAN 18 YEARS OR PREFER NOT TO SAY, TERMINATE]
GENDER: Please indicate the gender you identify with?
| Male | 1 |
| Female | 2 |
| Other (please specify) ____________ | 77 |
| Don't know/Prefer not to say | 99 |
3. Which province or territory do you live in?
| Newfoundland and Labrador | 1 |
| Nova Scotia | 2 |
| Prince Edward Island | 3 |
| New Brunswick | 4 |
| Quebec | 5 |
| Ontario | 6 |
| Manitoba | 7 |
| Saskatchewan | 8 |
| Alberta | 9 |
| British Columbia | 10 |
| Yukon | 11 |
| Nunavut | 12 |
| Northwest Territories | 13 |
| Don't know/Prefer not to say | 99 |
[Section 2: Food Safety Confidence in Canada]
Food safety is the concept that food will not cause harm to the consumer when it is prepared and/or eaten according to its intended use.
4. To what extent do you agree or disagree with each of the following statements?
[RANDOMIZE]
- a. I am confident that Canada's food safety system is protecting Canadians from preventable food safety hazards[Randomly assign 750]
- a. I am confident Canada's food safety system protects Canadians.[Randomly assign 750]
- b. I am confident that Canada's food safety system is managing food safety emergencies
- c. In Canada, it is generally safe to eat genetically modified food (Hover: Defined as food which contains genetic material that has been altered in a way that does not occur naturally)
- d. In Canada, it is generally safe to eat food grown with pesticides
- e. Labels on food in Canada provide the information I need
- f. I am confident that food products produced within Canada are safe to eat
- g. I am confident that food products imported from other countries are safe to eat
| Strongly disagree | 1 |
| Disagree | 2 |
| Neither disagree nor agree | 3 |
| Agree | 4 |
| Strongly agree | 5 |
| Don't know/Prefer not to say | 9 |
5. Please rank the following in order of who you think has the most responsibility to provide safe food. Please drag or match the options on the left with the numbers on the right.[RANDOMIZE]
- a. Farmers
- b. The Government of Canada
- c. Scientists / Academics
- d. Provincial governments
- e. Food manufacturers or processors (Hover: i.e. companies that make or process food)
- f. Grocery stores
- g. Companies that import foods into Canada
- h. Consumers
6. [SPLIT SAMPLE – randomly assign 50% to Q6 and 50% to Q7 for comparison on commodities] For each of the following types of food products, please indicate how confident you are that the products sold in Canada are safe to eat. You can do this by using a 5-point scale in which a response of 1 means you are not at all confident and 5 means you are very confident. [RANDOMIZE]
- a. Meat and poultry
- b. Fish
- c. Eggs
- d. Dairy (Hover: includes milk, butter, ice cream and cheese)
- e. Processed products (Hover: e.g. canned, cooked, frozen, etc.)
- f. Honey
- g. Maple
- h. Fresh fruits and vegetables
- i. Organic products
| Not at all confident | 1 |
| Very confident | 5 |
| Don't know/Prefer not to say | 9 |
7. [K750 SPLIT SAMPLE – randomly assign 50% to Q6 and 50% to Q7 for comparison on commodities] For each of the following types of food products, please indicate how confident you are that the products sold in Canada are safe to eat. You can do this by using a 5-point scale in which a response of 1 means you are not at all confident and 5 means you are very confident. [RANDOMIZE]
- a. Meat
- b. Poultry
- c. Fish
- d. Seafood
- e. Eggs
- f. Processed egg (Hover: Includes frozen egg, frozen egg mix, liquid egg, liquid egg mix, dried egg, dried egg mix and egg product)
- g. Dairy (Hover: includes milk, butter, ice cream and cheese)
- h. Processed fruit (Hover: i.e. canned, cooked, frozen, etc.)
- i. Processed vegetables (Hover: i.e. canned, cooked, frozen, etc.)
- j. Honey
- k. Maple
- l. Fresh fruits
- m. Fresh vegetables
- n. Organic foods
- o. Bakery items
- p. Herbs and spices
| Not at all confident | 1 |
| Very confident | 5 |
| Don't know/Prefer not to say | 9 |
[Section 3: Communications with the Public]
8. Generally speaking, how often do you look for information on food safety?
| Never | 0 |
| Rarely | 1 |
| Sometimes | 2 |
| Frequently | 3 |
| Don't know/Prefer not to say | 9 |
9. [FOR ANY RESPONDENTS WHO LOOK FOR INFORMATION AT LEAST RARELY] Where do you primarily get information on food safety? Check all that apply
| Search engine | 1 |
| Canadian Food Inspection Agency website | 2 |
| Other government websites | 3 |
| Canada Food Guide | 4 |
| Blogs | 5 |
| 6 | |
| 7 | |
| 8 | |
| Other social media | 9 |
| News sites / TV News | 10 |
| Radio | 11 |
| Other, please specify | 77 |
| Don't know/Prefer not to say | 99 |
10. How confident would you say you are in each of the following when it comes to information about food safety or maintaining the safety of food sold in Canada?
Use a 5-point scale in which a response of 1 means not at all confident and 5 means very confident. [RANDOMIZE – Split page]
- a. Healthcare professionals such as physicians, nutritionists or dietitians
- b. Canadian farmers
- c. International organizations such as the World Health Organization (WHO)
- d. Labels on food packages
- e. The Government of Canada
- f. News media/reporters
- g. The natural health products industry
- h. Scientists / Academics
- i. Canadian food manufacturers or processors (Hover: i.e. companies that make or process food)
- j. Grocery stores in Canada
- k. Companies that import foods into Canada
| Not at all confident | 1 |
| Very confident | 5 |
| Don't know/Prefer not to say | 9 |
11. How familiar would you say you are with the Canadian Food Inspection Agency (CFIA)?
| Not familiar | 1 |
| Somewhat familiar | 2 |
| Very familiar | 3 |
| Don't know/Prefer not to say | 9 |
12. [If SOMEWHAT OR VERY FAMILIAR] On a scale of 1 to 7 where 1 means "do not agree at all" and 7 means "strongly agree", indicate to what extent you agree with the following statements based on your general impressions of the Canadian Food Inspection Agency (CFIA).
- a. The CFIA is fair when inspecting food businesses.
- b. The CFIA protects Canadians from unsafe food.
| Do not agree at all | 1 |
| Strongly agree | 7 |
| Don't know/Prefer not to say | 9 |
13. Have you ever contacted the Canadian Food Inspection Agency (CFIA) with a concern or for information about:
Check all that apply
| Food safety complain | 1 |
| Food labelling complaint | 2 |
| Misrepresented food / Suspected food fraud | 3 |
| Other issue (please specify) __________________ | 77 |
| I've never contacted the CFIA directly | 99 |
14. [If 1-4 is selected at Q13]
Thinking about the service or information received from the Canadian Food Inspection Agency after you contacted them, rate your overall satisfaction. Use a scale from 1-7 where 1 is not at all satisfied and 7 is very satisfied.
| Not at all satisfied | 1 |
| Very satisfied | 7 |
| Don't know/Prefer not to say | 9 |
15. [If a score is provided from 1 to 7] Please expand on why you provided that score:
__________________________________________________________________________
__________________________________________________________________________
__________________________________________________________________________
____________
16. Please sort the following topics according to which are of little or no interest, of moderate interest, or of greatest interest to you. [RANDOMIZE]
- a. Allergens
- b. Labelling
- c. Food recalls
- d. Food testing
- e. Food inspection
- f. Organic food
- g. Imported food
- h. Food containing pesticides/residues
- i. Genetically Modified Organisms (GMOs)
- j. Restaurant/food service inspection
- k. Food fraud
| Topics of little or no interest | 1 |
| Topics of moderate interest | 2 |
| Topics of greatest interest | 3 |
[Section 4 Food Fraud]
17. This section focuses on food fraud - The Canadian Food Inspection Agency defines food fraud as the intentional misrepresentation of food for economic or personal gain. How much have you read or heard about food fraud? [Hover definition anywhere "misrepresented food" appears from now on]
| A great deal | 1 |
| Some | 2 |
| Not much | 3 |
| Nothing at all | 4 |
| Don't know/Prefer not to say | 9 |
18. Please provide some examples of what you would consider to be misrepresented food.
___________________
___________________
___________________
| Don't know/Prefer not to say | 99 |
19. When purchasing the following types of food commodities, how confident are you that they are accurately represented? Use a 5-point scale in which a response of 1 means you are not at all confident and 5 means you are very confident. [RANDOMIZE]
- a. Meat
- b. Poultry
- c. Fish
- d. Eggs or processed egg (Hover: Includes frozen egg, frozen egg mix, liquid egg, liquid egg mix, dried egg, dried egg mix and egg product)
- e. Dairy (Hover: includes milk, butter, ice cream and cheese)
- f. Processed products (Hover: i.e. canned, cooked, frozen, etc.)
- g. Honey
- h. Maple
- i. Oils
- j. Fruit juices
- k. Spices
- l. Coffee and tea
- m. Fresh fruits and vegetables
- n. Organic foods
| Not at all confident | 1 |
| Very confident | 5 |
| Don't know/Prefer not to say | 9 |
20. Have you ever personally encountered misrepresented food with any of the following commodities?
Check all that apply
| Meat | 1 |
| Poultry | 2 |
| Fish | 3 |
| Eggs or processed egg (Hover: Includes frozen egg, frozen egg mix, liquid egg, liquid egg mix, 4 dried egg, dried egg mix and egg product) | 4 |
| Dairy (Hover: includes milk, butter, ice cream and cheese) | 5 |
| Processed products (Hover: i.e. canned, cooked, frozen, etc.) | 6 |
| Honey | 7 |
| Maple | 8 |
| Oils | 9 |
| Fruit juices | 10 |
| Spices | 11 |
| Coffee and tea | 12 |
| Fresh fruits and vegetables | 13 |
| Organic foods | 14 |
| None of the above | 99 |
21. Please expand on your experience with misrepresented food. What was the specific issue?
_____________________
_____________________
_____________________
22. In your opinion how likely is it that you will encounter misrepresented food with products made in Canada? Use a scale of 1-7 where 1 is not at all likely and 7 is very likely.
| Not at all likely | 1 |
| Very likely | 7 |
| Don't know/Prefer not to say | 9 |
23. In your opinion how likely is it that you will encounter misrepresented food with products imported to Canada from other countries? Use a scale of 1-7 where 1 is not at all likely and 7 is very likely.
| Not at all likely | 1 |
| Very likely | 7 |
| Don't know/Prefer not to say | 9 |
24. Please rate your level of confidence in how the Government of Canada manages food fraud?
| Not at all satisfied | 1 |
| Very satisfied | 7 |
| Don't know/Prefer not to say | 9 |
25. Please rank the following in order of who you think has the most responsibility for ensuring that food sold in Canada is accurately represented.
- a. Farmers
- b. The Government of Canada
- c. Provincial governments
- d. Food manufacturers or processors (Hover: i.e. companies that make or process food)
- e. Grocery stores
- f. Companies that import foods into Canada
- g. Consumers
26. Do you think "food fraud" is an appropriate term to describe the intentional misrepresentation of food?
| Yes | 1 |
| No | 2 |
| Don't know/Prefer not to say | 9 |
27. [If no] What term do you think should be used instead of "food fraud"?
__________________
__________________
__________________
__________________
| Don't know/Prefer not to say | 99 |
[Section 5: Labelling]
28. How confident are you that the following types of labelling information or claims are truthful and accurate on food labels?
- a. What the food is (common name)
- b. Organic claims
- c. Where the food is from
- d. Nutrition information
- e. Health claims
- f. The best before date of the food
- g. Ingredient information
- h. Way the food is produced (method of production)
| Not at all confident | 1 |
| Very confident | 7 |
| Don't know/Prefer not to say | 9 |
QE3 [asked on behalf of Environment Canada] Which of the following products would you discard when they go past their "best before" or "use by" date? Check all that apply
| Bakery | 1 |
| Yoghurt | 2 |
| Cheese | 3 |
| Milk | 4 |
| Pre-cooked meat/deli | 5 |
| Fresh meat | 6 |
| Fresh juices | 7 |
| Packaged fruit | 8 |
| Packaged vegetables | 9 |
[Section 6: Food Recalls]
29. In the past six months, have you read, seen or heard anything about the recall of food products in Canada?
| Yes | 1 |
| No | 2 |
| Don't know/Prefer not to say | 9 |
30. [If yes] Where did you read, see or hear about the food recall? [RANDOMIZE]
| 1 | |
| 2 | |
| 3 | |
| News sites | 4 |
| Radio | 5 |
| Canadian Food Inspection Agency email list | 6 |
| Other (please specify) __________ | 77 |
| Don't know/Prefer not to say | 99 |
31. To what extent do you agree or disagree with each of the following statements?
- a. Food recalls happen, even with the best of efforts to keep food safe
- b. In Canada, unsafe food is recalled in a timely manner
- c. I believe that Canadians are at a higher risk of consuming unsafe foods today compared to three years ago
| Strongly disagree | 1 |
| Disagree | 2 |
| Neither disagree nor agree | 3 |
| Agree | 4 |
| Strongly agree | 5 |
| Don't know/Prefer not to say | 9 |
32. Have you heard of the Safe Food for Canadians Regulations?
| Yes | 1 |
| No | 2 |
| Don't know/Prefer not to say | 9 |
33. [IF YES TO Q32 – ask Q33 and 34] How did you hear about these regulations? [OPEN END]
__________________
__________________
__________________
34. From what you have heard, do you personally believe the Safe Food for Canadians Regulations improve food safety in Canada?
| Yes | 1 |
| No | 2 |
| Don't know/Prefer not to say | 9 |
35. When it comes to food safety in Canada, please specify anything you would like more information on. [OPEN END]
__________________
__________________
__________________
36. When it comes to food safety, food fraud and food recalls what is the best way for the Canadian Food Inspection Agency to send you information?
| Email notifications | 1 |
| Social media | 2 |
| A mobile app that issues alerts | 3 |
| Other (please specify) _________________ | 77 |
| Don't know/Prefer not to say | 99 |
PRETEST QUESTIONS [TO BE REMOVED AFTER COMPLETING PRETEST]:
P1. The survey you just finished is one of the very first we have done for this study, please answer the following few questions to help us improve the survey.
Do you strongly agree, somewhat agree, somewhat disagree or strongly disagree with the following statements?
- a. Overall, this survey was easy to complete
- b. The time it took to be interviewed was reasonable
| Strongly agree | 1 |
| Somewhat agree | 2 |
| Somewhat disagree | 3 |
| Strongly disagree | 4 |
| Don't know/Prefer not to say | 9 |
P2. Overall, how would you rate the extent to which the questions in this survey were easy to understand? Please use a scale from 0 to 10 where 0 means "very difficult", and 10 means "very easy".
P3. [IF P2 IS LESS THAN 8] Please tell us why you gave this rating to the survey. What specific words or questions did you find difficult to understand?
[Section 8: Demographics]
The last few questions are strictly for statistical purposes. All of your answers are completely confidential.
38. Which of the following best describes your current employment status?
| Working full-time, that is, 35 or more hours per week | 1 |
| Working part-time, that is, less than 35 hours per week | 2 |
| Self-employed | 3 |
| Unemployed, but looking for work | 4 |
| A student attending school full-time | 5 |
| Retired | 6 |
| Not in the workforce (full-time homemaker, unemployed, not looking for work) | 7 |
| Don't know/Prefer not to say | 9 |
39. What is the highest level of education that you have completed?
| Some high school | 2 |
| High school diploma or equivalent | 3 |
| Registered apprenticeship or other trades certificate or diploma | 4 |
| College, CEGEP or other non-university certificate or diploma | 5 |
| University certificate or diploma below bachelor's level | 6 |
| Bachelor's degree | 7 |
| Post graduate degree above bachelor's level | 8 |
| Don't know/Prefer not to say | 9 |
40. What is your marital status?
| Single | 1 |
| Married/living with someone/common law | 2 |
| Separated/divorced | 3 |
| Widowed | 4 |
| Other, please specify _________________ | 77 |
| Don't know/Prefer not to say | 99 |
41. How many individuals, including yourself, currently live in your household?
[NUMERICAL OPEN-END]
| Don't know/Prefer not to say | 99 |
42. Are you a parent or guardian of a child under the age of 18?
| Yes | 1 |
| No | 2 |
| Don't know/Prefer not to say | 9 |
43. Which of the following categories best describes your total household income for 2019? That is, the total income of all persons in your household combined, before taxes?
| Under $20,000 | 1 |
| $20,000 to just under $40,000 | 2 |
| $40,000 to just under $60,000 | 3 |
| $60,000 to just under $80,000 | 4 |
| $80,000 to just under $100,000 | 5 |
| $100,000 to just under $150,000 | 6 |
| $150,000 and above | 7 |
| Don't know/Prefer not to say | 9 |
44. What are the first three digits of your postal code?
[INSERT FIRST THREE DIGITS OF POSTAL CODE. FORMAT A1A]
| Don't know/Prefer not to say | 9 |
This concludes the survey. Your answers have been submitted. Thank you for your participation!
For more information on food safety, food fraud or to sign up for email notification of food recalls please visit Canadian Food Inspection Agency. (Inspection.gc.ca)