2020 Canada Day Satisfaction Survey
Canadian Heritage
October 2020
Prepared for:
Canadian Heritage
Supplier Name: Quorus Consulting Group Inc.
Contract Award Date: June 22, 2020
Delivery Date: October 2020
Contract Amount (incl. HST): $54,934.95
Contract #: C1111-200132/001/CY
POR Number: 011-20
For more information on this report, please contact Canadian Heritage at:
Ce rapport est aussi disponible en français.
Copyright Page
2020 Canada Day Satisfaction Survey
Final Report
Prepared for Canadian Heritage
Supplier name: Quorus Consulting Group Inc.
October 2020
Catalogue Number: CH4-192/2020E-PDF
International Standard Book Number (ISBN): 978-0-660-36203-8
This publication may be reproduced for non-commercial purposes only. Prior written permission must be obtained from Public Services and Procurement Canada. For more information on this report, please contact Public Services and Procurement Canada at: tpsgc.questions-questions.pwgsc@tpsgc-pwgsc.gc.ca or at: Canadian Heritage at por-rop@pch.gc.ca
Communications Branch
Public Services and Procurement Canada
Portage III Tower A
16A1-11 Laurier Street
Gatineau QC K1A 0S5
Rapport final du Sondage sur la satisfaction à l’égard de la fête du Canada 2020
Préparé pour Patrimoine canadien
Nom du fournisseur : Le groupe-conseil Quorus inc.
Octobre 2020
Numéro de catalogue : CH4-192/2020F-PDF
Numéro international normalisé du livre (ISBN) : 978-0-660-36204-5
La présente publication peut être reproduite à des fins non commerciales. Pour toute autre utilisation, veuillez obtenir au préalable une permission écrite de Services publics et Approvisionnement Canada. Pour de plus amples renseignements sur ce rapport, veuillez communiquer avec Services publics et Approvisionnement Canada à l’adresse suivante : tpsgc.questions-questions.pwgsc@tpsgc-pwgsc.gc.ca ou à Patrimoine canadien à por-rop@pch.gc.ca.
Direction générale des Communications
Services publics et Approvisionnement Canada
Portage III Tour A
16A1-11 rue Laurier
Gatineau QC K1A 0S5

Political Neutrality Certification
I hereby certify as Senior Officer of Quorus Consulting Group Inc. that the deliverables fully comply with the Government of Canada political neutrality requirements outlined in the Policy on Communications and Federal Identity and the Directive on the Management of Communications - Appendix C.
Specifically, the deliverables do not include information on electoral voting intentions, political party preferences, standings with the electorate or ratings of the performance of a political party or its leaders.
Signed:

Rick Nadeau, President
Quorus Consulting Group Inc.
Table of Contents
Executive Summary
Research Purpose and Objectives
The Department of Canadian Heritage’s Major Events, Commemorations and Capital Experience Branch, plays a vital role in ensuring yearly Canadian celebrations build trust, pride and a sense of national purpose. In response to the COVID-19 pandemic, the Department wanted to conduct public opinion research to gauge Canadians’ satisfaction with all Canada Day programming, limited exclusively to broadcast, online and social media channels.
In 2020, it is expected that many Canadians experienced a shift in how they chose to celebrate Canada Day given the restrictions on large gatherings. Ultimately, this research sought to learn what Canadians did to celebrate and gauge the satisfaction of any respondents who had watched Canada Day programming. With the goal of improving future Canada Day engagement, it is important to continue conducting surveys evaluating Canadian attitudes towards Canada Day programming. This research will compliment additional projects conducted by the Department, including website visitation and social media analysis.
The key objectives of the research included:
Exploring unique opportunity to gain insights into Canadian celebrations, taking place outside of large, organized events;
Understanding Canadians’ attitudes surrounding their preferred means of celebrating Canada Day;
Gauging the effectiveness and satisfaction of Canadian Heritage’s or partners’ Canada Day programming;
Continuing to survey the public to assist in the development of future Canada Day programming.
Summary of Findings
Celebrating Canada Day
Overall, 40% of Canadians indicated they celebrated Canada Day this year in one way or another. Among those who did not celebrate, the main barrier appears to have been concerns related to COVID-19 (as noted by 18% of those who did not celebrate Canada Day). Among other common reasons, 14% indicated they do not typically celebrate Canada Day and 10% indicated that activities and events, like fireworks, had been cancelled.
While 40% celebrated Canada Day, roughly half this proportion (22%) indicated they had looked for information related to how and where they could celebrate Canada Day this year. The most common resource used was the Internet: 40% said they used certain websites, 39% resorted to Google searches, and 20% said they specifically looked for information on the Government of Canada website. Among all the remaining sources used, the top ones would include Facebook (at 33%) and television, as noted by roughly 1 in four (26%) Canadians.
Government of Canada Virtual Canada Day Celebrations
This year, various Canada Day programming presented by the Government of Canada was “virtual” – in other words it was activities on the Web, televised and streamed online through a range of social media platforms. Over the course of the few weeks preceding July 1, 54% of Canadians recalled having seen, read or heard Government of Canada advertising about the 2020 virtual Canada Day celebrations. Those who did recall seeing advertising were most likely to mention having seen something on television (55%), while 29% recalled something on Facebook and 21% mentioned hearing something on the radio.
Participation or viewership of the various types of virtual programming was measured. Overall, 25% of Canadians indicated taking in at least one of the Government of Canada virtual programming offerings. More specifically:
10% of respondents took in the Canada Day virtual fireworks. Among these respondents, 48% would say that their level of pride in Canada increased (with 16% saying it increased a lot and 15% saying it increase moderately). Among these same respondents, 68% were satisfied with this programming (with 32% indicating they were very satisfied).
8% of respondents viewed the National Day Time Virtual Show on a CBC platform and 5% viewed this programming through social media, a total of over one in ten (13%). Among these respondents, 58% would say that their level of pride in Canada increased (with 15% saying it increased a lot and 23% saying it increase moderately). Among these same respondents, 71% were satisfied with this programming (with 28% indicating they were very satisfied).
7% of respondents viewed the National Evening Virtual Show on a CBC platform and 3% viewed this programming through social media, a total of one in ten (10%). Among these respondents, 49% would say that their level of pride in Canada increased (with 14% saying it increased a lot and 18% saying it increase moderately). Among these same respondents, 67% were satisfied with this programming (with 27% indicating they were very satisfied).
3% of respondents viewed or participated in one of the special Canada Day web videos (e.g. Let’s Cook Together!). Among these respondents, 66% would say that their level of pride in Canada increased (with 20% saying it increased a lot and 22% saying it increase moderately). Among these same respondents, 72% were satisfied with this programming (with 35% indicating they were very satisfied).
When prompted to indicate how else the Canada Day programming made them feel, respondents were most likely to select (among a list of sentiments presented in the survey) “entertained” (41%), “proud” (35%), “joyful” (26%), and “satisfied” (25%).
Among the two free online Canada Day tools offered, 4% of all respondents used the Canada Day playlists and 3% used the Canada Day online celebration kit. Roughly 4 out of 5 playlist users were satisfied with this tool (among whom 38% were very satisfied). Satisfaction was higher among the online celebration kit users, among whom 88% expressed satisfaction with that tool specifically (with 55% indicating they were very satisfied).
Among respondents at least aware of the Canada Day programming presented by the Government of Canada, 10% indicated unprompted the name of a sponsor. The most common one mentioned was Tim Hortons (3%) while other notable mentions (each at about 1% notoriety) included Bell, Canadian Tire, CBC, the Government of Canada, and Rogers.
Looking to the future, very few respondents proposed new ways to help them enjoy Canada Day at home. For the most part (65%), participants did not propose anything while 5% felt everything was “good as is.” Among those who did mention something, ideas included better or more advertising or promotion of what is offered (9%), more “live” events and activities (such as fireworks, musical acts, etc.), try to appeal to different age groups, improving the sound and/or video quality, having more or better representation across Canadian cultures, making the programming longer or available at more times during the day, integrating viewer reactions such as live feedback, Q&A, messaging, etc., and having more virtual activities or making the event more interactive.
Beyond taking in any virtual Government of Canada programming, Canadians celebrated Canada Day in a variety of other ways. When specifically prompted about other virtual programming, 9% indicated they had watched or participated in virtual Canada Day programs offered by other organizations such as municipalities, provincial governments, museums and other private organizations.
Among a host of other activities Canadians mentioned in an unprompted fashion, we find 6% who had a BBQ with friends and/or family, 6% held their own fireworks, 5% put up decorations or wore “Canadian” colours or attire, 5% celebrated at home or had a family dinner, and another 5% celebrated with friends and/or family in the backyard.
Canadian Pride
A majority of respondents would say they are “very proud” to be Canadian (51%), another 25% would say they are “proud” and 14% would say they are “somewhat proud.” Among these respondents, the greatest sources of pride are derived from:
Our “freedoms”, a sense that Canada is “strong and free”, or that it is a free country (18%);
That Canada is a large and/or beautiful country (12%);
Diversity (11%);
The healthcare system – that it is “free”, universal, etc. (10%);
This is where they were born, that this is “their country” and that they love their country (9%), and,
That Canada and Canadians are caring, kind and helpful (9%).
Social Media
Most Canadians (93%) use at least one of the social media channels listed in the study at least once a month. Among the ones listed, the most likely to be used at least once a month were Facebook (78%), YouTube (64%), Instagram (45%) and Twitter (26%). Among social media users, 12% shared their Canada Day experience on social media. Among this narrower group of respondents, 31% used the hashtag #CanadaDay or #FêteduCanada.
Methodology
Report findings are based on a non-probability sample, as respondents had volunteered to participate in Government of Canada online surveys using an online panel. The data have been weighted to reflect the demographic composition of the Canadian general population. As the sample is based on those who initially self-selected for participation in the online panel, no estimates of sampling error can be calculated.
All research work was conducted in accordance with the professional standards established by the Government of Canada Public Opinion Research Standards.
The survey consisted of a national online survey with Canadians, 16 years of age and older. Respondents were invited to participate through an online panel of Canadians.
Quorus collaborated with the client team to design the survey instrument in English and translated the client-approved English version of the survey into French. The approved final questionnaires were programmed for online data collection.
Respondents had the choice to complete the interview in English or French and were informed of their rights under the Privacy and Access to Information Acts.
The survey took on average 10 minutes to complete and consisted of mostly closed-ended questions. Data collection occurred between July 2 and July 16, 2020, including a pretest of the questionnaire.
A total of 5,173 surveys were completed using a stratified random sampling approach within the online panel of Canadian households. For this study, quotas by province were established to generate sufficient data regionally for robust analysis. Data was monitored to aim for a 50/50 gender split in each province, and that no specific age cohort was under-represented. The equivalent margin of error for a probability study would be +/- 1.36%.
Data was weighted by region, gender, and age to ensure that the final distributions within the final sample mirror those of the Canadian population according to the latest Census data.
Detailed Results
Awareness of Virtual Canada Day Celebration
Respondents were asked to specify whether they had been made aware of the Government of Canada virtual Canada Day celebrations through advertising during the weeks preceding the event. Respondents who answered that they had been made aware were then asked to identify the sources of their exposure to virtual celebration advertising.
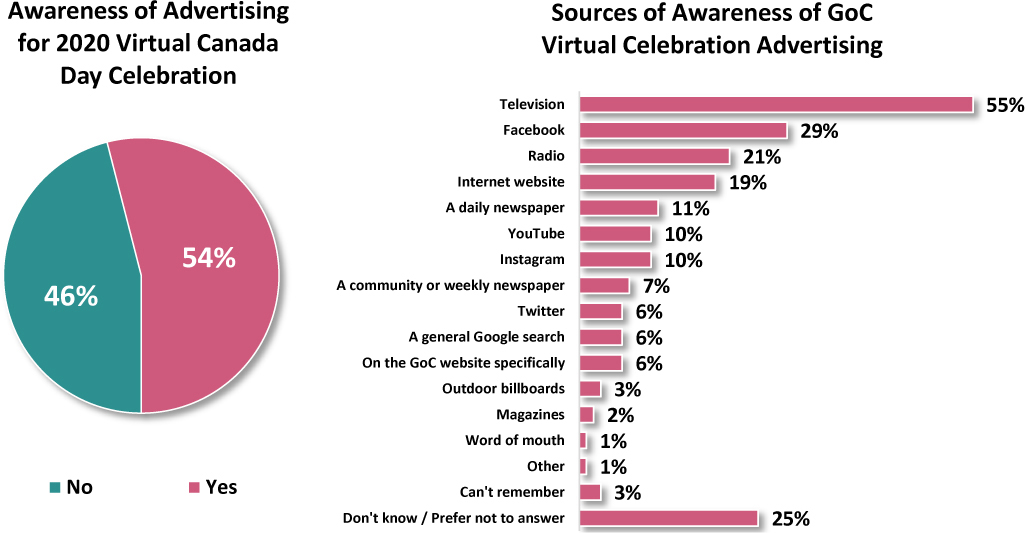
More than half of surveyed Canadians (54%) were aware of Government of Canada advertising for the 2020 virtual Canada Day celebrations.
Sources of awareness of virtual celebration advertising include the following:
The primary source of awareness for virtual celebration advertising was television, reported by over half of those aware (55%). Online sources were prevalent, including Facebook (29%), internet websites (19%), YouTube (10%), and Instagram (10%).
Traditional media sources such as radio (21%) and a daily newspaper (11%) were commonly referenced among aware Canadians.
More than a quarter of respondents who were aware of virtual celebration advertising did not provide a source for the weeks preceding the virtual event.
Q1a: This year, various Canada Day programming presented by the Government of Canada was “virtual” – in other words it was activities on the Web, televised and streamed online through a range of social media platforms. Over the past few weeks, have you seen, read or heard any Government of Canada advertising about the 2020 virtual Canada Day celebrations? Base: All Respondents, n=5,173. Q1b: Where did you see, read or hear Government of Canada advertising about the 2020 virtual Canada Day celebration? (Select all that apply) Base: Respondents aware of GoC virtual celebration advertising, n=2,709.
Charts depict the awareness percent and sources of awareness of GoC Virtual Celebration advertising.
A pie chart depicts the percent of awareness of advertising for 2020 Virtual Canada Day Celebrations. Out of the total people surveyed, 54 percent were aware of the advertising for the 2020 virtual Canada Day celebration. The remaining 46 percent were not aware of the advertisement. A horizontal bar chart shows different sources of awareness of GoC virtual celebration advertising. The different sources and the corresponding percent are as follows: Television - 55 percent; Facebook - 29 percent; Radio - 21 percent; Internet website - 19 percent; a daily newspaper - 11 percent; YouTube - 10 percent; Instagram - 10 percent; a community or weekly newspaper - 7 percent; Twitter - 6 percent; a general Google search - 6 percent; on the GoC website specifically - 6 percent; outdoor billboards - 3 percent; magazines - 2 percent; word of mouth - 1 percent; other - 1 percent; can’t remember - 3 percent; don’t know or prefer not to answer - 25 percent.
Subgroup differences observed related to the awareness of Canada Day advertising include:
Canadians aged 55 and older were more likely to be aware of advertising for the 2020 virtual Canada Day celebrations when compared with respondents under the age of 55 (59% vs. 51%).
Women were more aware (55%) compared to men (52%), with Facebook reported as an advertising source more among women (32%) than men (26%).
Q1a: This year, various Canada Day programming presented by the Government of Canada was “virtual” – in other words it was activities on the Web, televised and streamed online through a range of social media platforms. Over the past few weeks, have you seen, read or heard any Government of Canada advertising about the 2020 virtual Canada Day celebrations? Base: All Respondents, n=5,173.
| Region | Age | Gender | |||||||||||||
|---|---|---|---|---|---|---|---|---|---|---|---|---|---|---|---|
TOTAL (n=5,173) |
ATL (n=1,004) |
QC (n=1,001) |
ON (n=1,009) |
MB/SK (n=1,004) |
AB/BC (n=1,005) |
YK/NWT/NU (n=150) |
16-24 (n=542) |
25-34 (n=622) |
35-44 (n=891) |
45-54 (n=1,048) |
55-64 (n=950) |
65+ (n=1,120) |
M (n=2,478) |
F (n=2,669) |
|
| Yes | 54% | 56% | 50% | 59% | 46% | 52% | 58% | 48% | 54% | 50% | 50% | 59% | 60% | 52% | 55% |
| No | 46% | 44% | 50% | 41% | 54% | 48% | 42% | 52% | 46% | 50% | 50% | 41% | 40% | 48% | 45% |
Age differences among the different types of sources recalled include:
In general, older respondents recalled the advertising in more traditional media sources, while younger respondents were more likely to recall online sources.
Respondents aged 16 to 24 were the least aware of the virtual celebration advertising, as less than half (48%) were aware.
Television was the primary source of exposure to virtual celebration advertising among respondents over the age of 45 (69% vs. 36%).
When comparing regions, the following differences are identified:
Awareness of the advertising for the virtual Canada Day celebration was highest in Ontario (59%) and Atlantic Canada (56%). These findings are higher than both Quebec (50%) and the Prairies (46%).
In Quebec, television (67%) was reported as a primary source to a greater extent, when compared to all other regions (52%).
Q1b: Where did you see, read or hear Government of Canada advertising about the 2020 virtual Canada Day celebration? (Select all that apply) Base: Respondents aware of GoC virtual celebration advertising, n=2,709.
| Region | Age | Gender | |||||||||||||
|---|---|---|---|---|---|---|---|---|---|---|---|---|---|---|---|
TOTAL (n=2,709) |
ATL (n=556) |
QC (n=488) |
ON (n=588) |
MB/SK (n=469) |
AB/BC (n=521) |
YK/NWT/NU (n=87) |
16-24 (n=254) |
25-34 (n=330) |
35-44 (n=450) |
45-54 (n=499) |
55-64 (n=531) |
65+ (n=645) |
M (n=1,262) |
F (n=1,431) |
|
| Television | 55% | 54% | 67% | 52% | 53% | 51% | 45% | 32% | 35% | 39% | 57% | 67% | 80% | 53% | 57% |
| 29% | 43% | 29% | 27% | 30% | 30% | 51% | 41% | 46% | 34% | 27% | 24% | 14% | 26% | 32% | |
| Radio | 21% | 21% | 20% | 23% | 19% | 20% | 23% | 18% | 21% | 23% | 18% | 26% | 20% | 21% | 21% |
| Internet website | 19% | 18% | 14% | 22% | 18% | 20% | 30% | 30% | 22% | 23% | 19% | 17% | 12% | 22% | 17% |
| A daily newspaper | 11% | 6% | 13% | 11% | 10% | 10% | 10% | 6% | 9% | 7% | 9% | 12% | 18% | 11% | 11% |
| 10% | 7% | 6% | 12% | 12% | 12% | 9% | 29% | 23% | 9% | 5% | 4% | <1% | 11% | 10% | |
| YouTube | 10% | 8% | 7% | 12% | 9% | 11% | 7% | 23% | 16% | 14% | 8% | 5% | 2% | 12% | 8% |
| A community or weekly newspaper | 7% | 5% | 3% | 8% | 6% | 9% | 6% | 9% | 7% | 6% | 6% | 6% | 7% | 7% | 7% |
| On the Government of Canada website specifically | 6% | 5% | 4% | 8% | 6% | 6% | 16% | 7% | 9% | 9% | 7% | 5% | 3% | 7% | 6% |
| 6% | 8% | 2% | 7% | 7% | 7% | 12% | 11% | 9% | 5% | 10% | 3% | 2% | 7% | 5% | |
| A general Google search | 6% | 4% | 3% | 7% | 6% | 7% | 9% | 12% | 10% | 5% | 5% | 3% | 2% | 6% | 6% |
| Outdoor billboards | 3% | 1% | 1% | 3% | 2% | 3% | 2% | 5% | 4% | 3% | 2% | 1% | 1% | 3% | 2% |
| Magazines | 2% | 1% | <1% | 3% | 2% | 2% | 2% | 3% | 4% | 3% | 2% | - | <1% | 3% | 1% |
| Word of mouth | 1% | 2% | <1% | 1% | 1% | 1% | - | 1% | <1% | 2% | 1% | 1% | 1% | 1% | 1% |
| Other | 1% | <1% | 1% | <1% | <1% | 1% | 2% | 2% | <1% | 1% | <1% | <1% | <1% | 1% | 1% |
| Can’t remember | 3% | 3% | 3% | 3% | 4% | 4% | 6% | 2% | 3% | 4% | 4% | 4% | 3% | 3% | 3% |
| Don’t know / Refuse to answer | <1% | <1% | - | <1% | 1% | <1% | - | <1% | <1% | <1% | <1% | <1% | <1% | <1% | <1% |
A variety of differences among ethnic groups emerged from the findings, including the following:
Six in ten surveyed racialized Canadians (60%) were more likely to have remembered seeing advertising about the 2020 Canada Day celebration when compared to non-racialized Canadians (52%).
Non-racialized surveyed Canadians were more likely to mention television among the sources of awareness for Canada Day celebration advertising (60%) when compared to racialized Canadians (43%).
Racialized Canadians were more likely to report seeing celebration advertising through several online sources when compared to non-racialized Canadians, including an Internet website (27% vs. 17%), Instagram (19% vs. 8%), YouTube (20% vs. 6%), GoC Website (12% vs. 5%), and Twitter (9% vs. 5%).
Indigenous respondents were more likely to report observing 2020 Canada Day celebration advertising on YouTube (25%) when compared to non-racialized Canadians (6%).
Interest in Canada Day Celebrations
Respondents were asked whether or not they had actively searched for information related to 2020 Canada Day celebrations in the weeks preceding the event. Those that had searched for information were then asked to identify which sources they had searched.
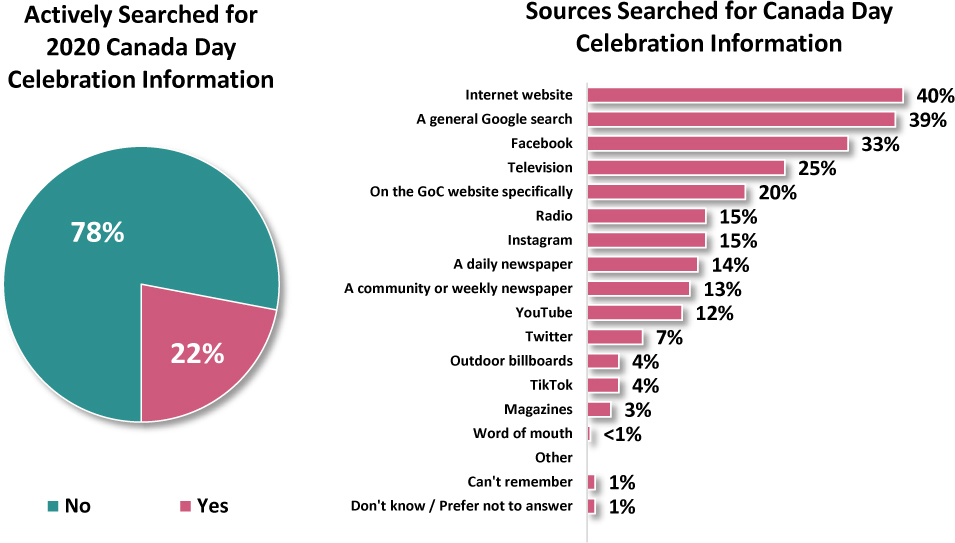
More than one in five surveyed Canadians (22%) actively searched for information regarding the details for 2020 Canada Day celebrations.
The primary sources searched for information surrounding Canada Day celebrations were internet searches through websites (40%), Google (39%), Facebook (33%) and the GoC website specifically (20%). Traditional streams such as television were used by a quarter (25%) of active searching participants.
Q2a: Did you look for any information related to how and where you could celebrate Canada Day this year? Base: All Respondents, n=5,173. Q2b: When looking for information about Canada Day this year, what sources did you use? (Select all that apply) Base: Respondents who searched for Canada Day virtual celebration information, n=1,082.
Percent of Canadians who searched, and the sources searched for Canada Day Celebration information.
A pie chart presents the percentage of Canadians who searched for information regarding details for 2020 Canada day celebrations. Out of the total Canadians surveyed, 22 percent actively searched for 2020 Canada Day celebration information while 78 percent did not search for the information. A horizontal bar chart presents the percent distribution of the different sources searched for Canada day celebration information. The sources searched for Canada day celebration and the corresponding percent are as follows: Internet website - 40 percent; a general Google search - 39 percent; Facebook - 33 percent; television - 25 percent; on the GoC website specifically - 20 percent; radio - 15 percent; Instagram - 15 percent; a daily newspaper - 14 percent; a community or weekly newspaper - 13 percent; YouTube - 12 percent; twitter - 7 percent; outdoor billboards - 4 percent; TikTok - 4 percent; magazines - 3 percent; word of mouth - less than 1 percent; other - nil; can’t remember - 1 percent; don’t know or prefer not to answer - 1 percent.
Demographic differences among active searching respondents include:
When comparing regions, respondents living in Quebec (10%) were less likely than the rest of Canada (25%) to actively search for Canada Day celebration information.
Respondents in the 16 to 44 age segments were more likely to actively search for information than segments 45 and older (29% vs. 16%).
Q2a: Did you look for any information related to how and where you could celebrate Canada Day this year? Base: All Respondents, n=5,173.
| Region | Age | Gender | |||||||||||||
|---|---|---|---|---|---|---|---|---|---|---|---|---|---|---|---|
TOTAL (n=5,173) |
ATL (n=1,004) |
QC (n=1,001) |
ON (n=1,009) |
MB/SK (n=1,004) |
AB/BC (n=1,005) |
YK/NWT/NU (n=150) |
16-24 (n=542) |
25-34 (n=622) |
35-44 (n=891) |
45-54 (n=1,048) |
55-64 (n=950) |
65+ (n=1,120) |
M (n=2,478) |
F (n=2,669) |
|
| Yes | 22% | 25% | 10% | 26% | 25% | 25% | 18% | 32% | 31% | 24% | 18% | 16% | 12% | 23% | 20% |
| No | 78% | 75% | 90% | 74% | 75% | 75% | 82% | 68% | 69% | 76% | 82% | 84% | 88% | 77% | 80% |
Subgroup differences among the different types of sources used include:
Individuals over the age of 65 were the least likely to actively search for information (12%), particularly through websites (26%), Google (26%) and all social media searches.
Comparing men and women who actively searched for information on social media, Facebook was more commonly used among women, while YouTube and Twitter were used more among men.
Q2b: When looking for information about Canada Day this year, what sources did you use? (Select all that apply) Base: Respondents who searched for Canada Day virtual celebration information, n=1,082.
| Region | Age | Gender | |||||||||||||
|---|---|---|---|---|---|---|---|---|---|---|---|---|---|---|---|
TOTAL (n=1,082) |
ATL (n=242) |
QC (n=95) |
ON (n=252) |
MB/SK (n=226) |
AB/BC (n=239) |
YK/NWT/NU (n=28) |
16-24 (n=166) |
25-34 (n=189) |
35-44 (n=234) |
45-54 (n=196) |
55-64 (n=150) |
65+ (n=147) |
M (n=512) |
F (n=565) |
|
| Internet website | 40% | 28% | 33% | 43% | 35% | 42% | 29% | 41% | 38% | 43% | 41% | 41% | 32% | 40% | 38% |
| A general Google search | 39% | 31% | 45% | 36% | 35% | 46% | 29% | 45% | 42% | 38% | 39% | 41% | 26% | 37% | 42% |
| 33% | 59% | 29% | 31% | 39% | 29% | 59% | 31% | 41% | 34% | 31% | 29% | 25% | 27% | 40% | |
| Television | 25% | 21% | 26% | 29% | 19% | 22% | 17% | 16% | 21% | 19% | 29% | 32% | 49% | 26% | 25% |
| On the Government of Canada website specifically | 20% | 21% | 15% | 22% | 12% | 19% | 19% | 22% | 21% | 19% | 20% | 20% | 13% | 22% | 17% |
| Radio | 15% | 15% | 11% | 17% | 14% | 15% | 15% | 9% | 21% | 10% | 21% | 15% | 15% | 18% | 13% |
| 15% | 11% | 8% | 17% | 14% | 16% | 10% | 29% | 25% | 13% | 5% | 4% | 1% | 17% | 13% | |
| A daily newspaper | 14% | 10% | 13% | 11% | 15% | 20% | 4% | 10% | 11% | 9% | 13% | 22% | 27% | 15% | 13% |
| A community or weekly newspaper | 13% | 12% | 8% | 14% | 11% | 15% | 12% | 5% | 13% | 8% | 20% | 20% | 18% | 13% | 13% |
| YouTube | 12% | 9% | 14% | 12% | 12% | 11% | 11% | 15% | 12% | 16% | 12% | 8% | 4% | 15% | 8% |
| 7% | 8% | 3% | 8% | 7% | 8% | 9% | 9% | 7% | 8% | 12% | 1% | 4% | 9% | 5% | |
| Outdoor billboards | 4% | 2% | 3% | 3% | 5% | 6% | - | 6% | 6% | 4% | 3% | <1% | 3% | 5% | 3% |
| TikTok | 4% | 1% | 3% | 3% | 5% | 5% | - | 8% | 5% | 2% | 1% | 2% | - | 4% | 3% |
| Magazines | 3% | 1% | - | 3% | 1% | 6% | 3% | 2% | 5% | 6% | 4% | - | <1% | 5% | 1% |
| Word of mouth | <1% | 1% | - | - | 2% | - | 4% | <1% | - | <1% | <1% | <1% | - | <1% | <1% |
| Other | <1% | - | - | - | - | - | 4% | - | - | - | - | - | <1% | <1% | - |
| Can’t remember | 1% | <1% | 2% | 1% | <1% | 1% | 3% | 1% | - | 1% | <1% | 2% | 3% | 1% | 1% |
| Don’t know / Refuse to answer | 1% | 1% | 1% | 1% | <1% | <1% | - | 2% | 1% | <1% | - | - | - | 1% | <1% |
A variety of differences among ethnic groups emerged from the findings, including the following:
Respondents identifying as racialized Canadians were more likely to actively seek out information related to how and where they could celebrate Canada Day in 2020 (38%) when compared to Indigenous Canadians (25%) and non-racialized Canadians (17%).
Indigenous respondents were less likely to seek out information on the GoC website (6%) when compared to both racialized (20%) and non-racialized (19%) Canadians.
Comparatively, nearly one in three surveyed Indigenous Canadians actively searched for celebration information in a community newspaper (30%).
Racialized respondents were more likely to actively search for information using social media platforms including Instagram (19%) and YouTube (20%) when compared to non-racialized Canadians (12% and 7% respectively).
Celebrating Canada Day in 2020
In the days immediately following the event, respondents were asked to specify whether or not they had celebrated Canada in any way in 2020. Those that did not participate in Canada Day celebrations were then asked to list the main reason they did not celebrate.
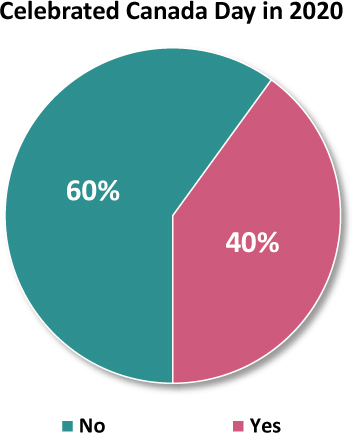
A total of three in five surveyed Canadians (60%) reported that they did not celebrate Canada Day in any way in 2020.
A variety of demographic differences emerged from the findings, including the following:
Men were more likely to have celebrated Canada Day (43%) when compared to women (37%).
Surveyed Canadians between the ages of 16 to 34 were more likely to celebrate than all older age segments (50% vs. 36%).
Respondents living in Quebec were less likely to celebrate Canada Day in any way when compared to respondents in the rest of the country (16% vs. 47%).
Q3a: Did you celebrate Canada Day this year in any way? Base: All Respondents, n=5,173.
A pie chart depicts the percent distribution of Canadians who celebrated Canada day.
A pie chart presents the percent of Canadians who celebrated Canada day in any way in 2020. Out of the total Canadians surveyed, 40 percent celebrated Canada day, whereas 60 percent did not celebrate Canada day.
Q3a: Did you celebrate Canada Day this year in any way? Base: All Respondents, n=5,173.
| Region | Age | Gender | |||||||||||||
|---|---|---|---|---|---|---|---|---|---|---|---|---|---|---|---|
TOTAL (n=5,173) |
ATL (n=1,004) |
QC (n=1,001) |
ON (n=1,009) |
MB/SK (n=1,004) |
AB/BC (n=1,005) |
YK/NWT/NU (n=150) |
16-24 (n=542) |
25-34 (n=622) |
35-44 (n=891) |
45-54 (n=1,048) |
55-64 (n=950) |
65+ (n=1,120) |
M (n=2,478) |
F (n=2,669) |
|
| Yes | 40% | 44% | 16% | 52% | 46% | 41% | 54% | 53% | 47% | 41% | 36% | 36% | 32% | 43% | 37% |
| No | 60% | 56% | 84% | 48% | 54% | 59% | 46% | 47% | 53% | 59% | 64% | 64% | 68% | 57% | 63% |
Overall respondents were primarily concerned with safety surrounding the COVID-19 pandemic, likely accounting for atypical celebration figures. Many respondents felt that Canada Day was just like any other and would not have participated regardless of the conditions surrounding the pandemic. The most directly attributable dip in participation due to a reduced experience came in the form of the cancellation of fireworks.
Q3b: What is the main reason you did not celebrate Canada Day this year? Base: Respondents who did not celebrate Canada Day, n=3,145.
A bar chart depicts the main reasons for not celebrating Canada day in 2020.
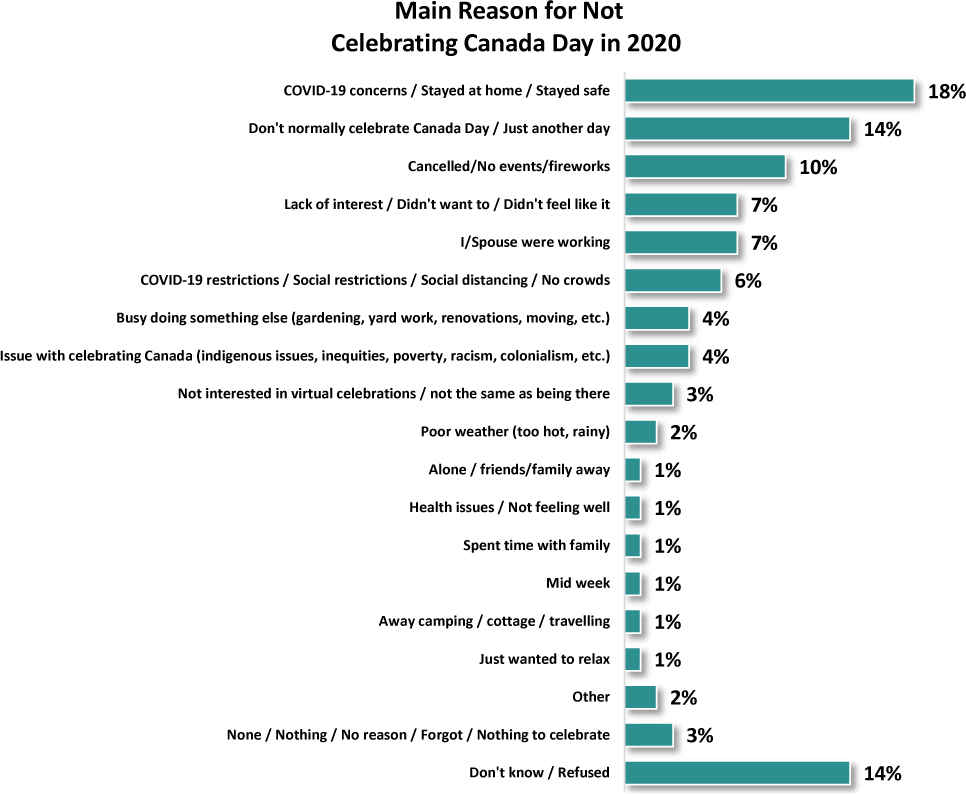
A horizontal bar chart presents the percent distribution of various reasons for not celebrating Canada day in 2020. The main reasons and the corresponding percent are as follows: Covid-19 concerns or stayed at home or stayed safe - 18 percent; don’t normally celebrate Canada day or just another day - 14 percent; cancelled or no events or fireworks: 10 percent; lack of interest or didn’t want to or didn’t feel like it - 7 percent; oneself or one’s spouse were working - 7 percent; Covid-19 restrictions or social restrictions or social distancing or no crowds - 6 percent; busy doing something else (gardening, yard work, renovations, moving, et cetera) - 4 percent; issue with celebrating Canada (indigenous issues, inequities, poverty, racism, colonialism, et cetera) - 4 percent; not interested in virtual celebrations or not the same as being there - 3 percent; poor weather (too hot, rainy) - 2 percent; alone or friends or family away - 1 percent; health issues or not feeling well - 1 percent; spent time with family - 1 percent; mid week - 1 percent; away camping or cottage or travelling - 1 percent; just wanted to relax - 1 percent; other - 2 percent; none or nothing or no reason or forgot or nothing to celebrate - 3 percent; and don’t know or refused - 14 percent.
Various reasoning for a lack of celebration emerged from the findings, including the following:
Among respondents who did not celebrate Canada Day in 2020, nearly one in five (18%) chose to stay home surrounding COVID-19 safety concerns.
Comparatively, one in ten Canadians who did not celebrate, felt that Canada Day was cancelled due to no events being held, particularly a lack of fireworks.
More than one in ten respondents (14%) who did not celebrate would not normally celebrate Canada Day regardless of circumstances surrounding COVID-19.
Less than one in ten (6%) of surveyed Canadians who did not celebrate Canada Day, felt they could not celebrate adequately based on the social restrictions in place.
Respondents over the age of 44 were more likely to have stayed home than younger respondents (20% vs. 15%).
Q3b: What is the main reason you did not celebrate Canada Day this year? Base: Respondents who did not celebrate Canada Day, n=3,145.
| Region | Age | Gender | |||||||||||||
|---|---|---|---|---|---|---|---|---|---|---|---|---|---|---|---|
TOTAL (n=3,145) |
ATL (n=573) |
QC (n=850) |
ON (n=486) |
MB/SK (n=562) |
AB/BC (n=599) |
YK/NWT/NU (n=75) |
16-24 (n=276) |
25-34 (n=327) |
35-44 (n=522) |
45-54 (n=683) |
55-64 (n=601) |
65+ (n=736) |
M (n=1,452) |
F (n=1,676) |
|
| COVID-19 concerns / Stayed at home / Stayed safe | 18% | 16% | 15% | 23% | 17% | 19% | 10% | 12% | 16% | 17% | 18% | 21% | 22% | 18% | 19% |
| Don’t normally celebrate Canada Day / Just another day | 14% | 11% | 26% | 8% | 10% | 7% | 4% | 18% | 8% | 16% | 14% | 16% | 12% | 13% | 15% |
| Cancelled/No events/fireworks | 10% | 14% | 7% | 9% | 17% | 12% | 12% | 7% | 9% | 12% | 10% | 9% | 10% | 8% | 11% |
| Lack of interest / Didn’t want to / Didn’t feel like it | 7% | 4% | 12% | 6% | 4% | 4% | 3% | 4% | 8% | 8% | 6% | 8% | 9% | 9% | 6% |
| I/Spouse were working | 7% | 7% | 6% | 7% | 7% | 10% | 10% | 11% | 12% | 10% | 9% | 4% | 1% | 8% | 7% |
| COVID-19 restrictions / Social restrictions / Social distancing / No crowds | 6% | 7% | 3% | 7% | 7% | 6% | 5% | 2% | 3% | 4% | 7% | 6% | 8% | 4% | 7% |
| Busy doing something else (gardening, yard work, renovations, moving, etc.) | 4% | 4% | 5% | 3% | 3% | 4% | 9% | 5% | 7% | 3% | 3% | 5% | 3% | 4% | 5% |
| Issue with celebrating Canada (indigenous issues, inequities, poverty, racism, colonialism, etc.) | 4% | 3% | 2% | 5% | 6% | 7% | 5% | 11% | 5% | 3% | 3% | 3% | 3% | 5% | 3% |
| Not interested in virtual celebrations / not the same as being there | 3% | 3% | 2% | 3% | 2% | 3% | 6% | 1% | 2% | 3% | 3% | 2% | 4% | 3% | 3% |
| Poor weather (too hot, rainy) | 2% | <1% | 1% | 2% | 1% | 3% | 2% | <1% | 1% | 2% | 2% | 2% | 2% | 2% | 2% |
| Alone / friends/family away | 1% | 2% | 1% | 2% | 1% | 2% | 1% | 1% | 1% | 1% | 1% | 1% | 3% | 1% | 2% |
| Health issues / Not feeling well | 1% | 3% | 1% | 1% | 1% | 1% | 5% | 1% | 1% | <1% | 1% | 2% | 2% | 1% | 1% |
| Spent time with family | 1% | 1% | 1% | 1% | 1% | 1% | - | 1% | - | 1% | 1% | 1% | 2% | 1% | 1% |
| Mid week | 1% | <1% | <1% | 2% | 2% | 1% | - | <1% | 1% | 1% | 2% | 1% | <1% | 1% | 1% |
| Away camping / cottage / travelling | 1% | 2% | 1% | 1% | 2% | 1% | 3% | - | 1% | 1% | 2% | 1% | <1% | 1% | 1% |
| Just wanted to relax | 1% | 1% | 1% | 1% | 1% | 1% | - | - | <1% | 1% | 2% | 1% | <1% | 1% | 1% |
| Other | 2% | 2% | 1% | 2% | 2% | 2% | 3% | 1% | 1% | 2% | 1% | 2% | 3% | 2% | 2% |
| None / Nothing / No reason / Forgot / Nothing to celebrate | 3% | 4% | 2% | 3% | 3% | 4% | 8% | 3% | 2% | 1% | 3% | 3% | 4% | 3% | 3% |
| Don’t know / Refused | 14% | 16% | 14% | 17% | 13% | 11% | 12% | 23% | 21% | 13% | 12% | 11% | 11% | 16% | 13% |
Differences among ethnic groups emerged from the findings, including the following:
More than half of respondents identifying as racialized Canadians (51%) reported celebrating Canada Day in any way in 2020, higher than non-racialized Canadians (36%).
Among surveyed non-racialized Canadians who did not celebrate Canada Day in 2020, nearly two in five (15%) did not normally celebrate, higher when compared to racialized Canadians (7%) and Indigenous Canadians (4%).
Outside of any virtual programs, respondents were asked to describe any alternative forms of celebration they had undertaken for Canada Day 2020.
Nearly three in five survey participants (61%) did not celebrate Canada Day this year, while nearly two in five participants (39%) celebrated Canada Day in alternative ways.
Among the most popular alternatives to the virtual Canada Day celebration, having a BBQ with family and friends was the preferred alternative (6%), followed closely by watching fireworks (6%), putting up decorations or wearing Canadian attire (5%), spending time with family in the backyard (5%), and staying at home for a family dinner (5%).
Q9: Did you celebrate Canada Day in any other ways? If so, please briefly describe what you did. Base: All Respondents, n=5,173
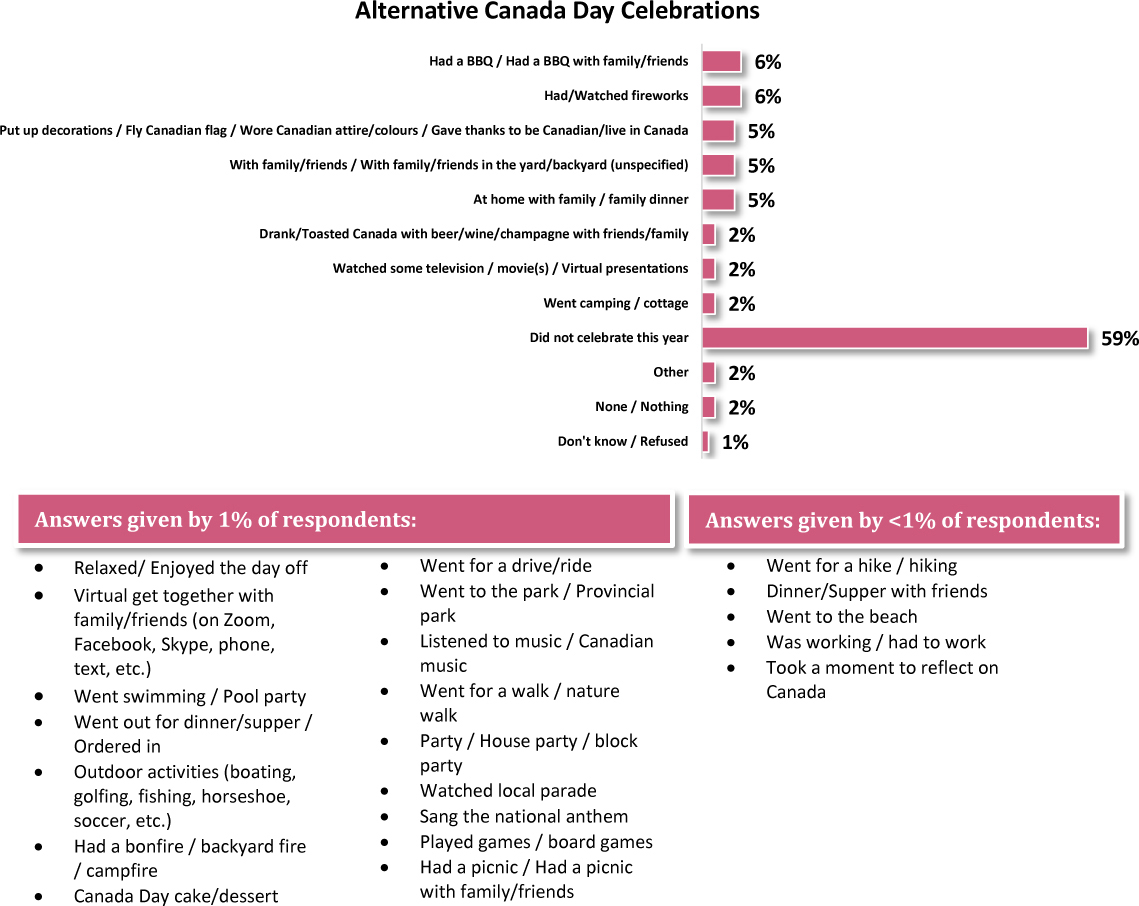
A bar chart presents the alternative ways in which the respondents celebrated Canada day.
A horizontal bar graph depicts the percent distribution of the alternative ways in which the survey participants celebrated Canada day. The data inferred from the bar graph are as follows: had a barbecue or had a barbecue with family or friends - 6 percent; had or watched fireworks - 6 percent; put up decorations or fly Canadian flag or wore Canadian attire or colors or gave thanks to be Canadian or live in - 5 percent; with family or friends or with family or friends in the yard or backyard (unspecified) - 5 percent; at home with family or family dinner - 5 percent; drank or toasted Canada with beer or wine or champagne with friends or family - 2 percent; watched some television or movies or virtual presentations - 2 percent; went camping or cottage - 2 percent; did not celebrate this year - 59 percent; other - 2 percent; none or nothing - 2 percent; don’t know or refused - 1 percent. Answers given by 1 percent of respondents are as follows: relaxed or enjoyed day off, virtual get together with family or friends, went swimming or pool party, went out for dinner or supper or ordered in, outdoor activities, had a bonfire or backyard fire or campfire, Canada day cake or dessert, went for a drive or ride, went to the park or provincial park, listened to music or Canadian music, went for a walk or nature walk, party or house party or block party, watched local parade, sang the national anthem, played games or board games, and had a picnic or had a picnic with family or friends. Answers given by less than 1 percent of respondents are as follows: went for a hike or hiking, dinner or supper with friends, went to the beach, was working or had to work, and took a moment to reflect on Canada.
Various demographic differences emerged from the findings, including the following:
Racialized Canadians who celebrated Canada Day in alternative ways were more likely to report being at home with family or having a family dinner (7%) when compared to non-racialized Canadians (4%).
Survey participants living in Quebec were less likely to participate in any of the top 5 most popular activities when compared to multiple regions across Canada.
As the household income increases, so does the likelihood to participate in activities to celebrate Canada Day in other ways.
Women were more likely to have celebrated Canada Day by watching fireworks (7%), compared to men (4%).
Q9: Did you celebrate Canada Day in any other ways? If so, please briefly describe what you did. Base: All Respondents, n=5,173.
| Region | Age | Gender | |||||||||||||
|---|---|---|---|---|---|---|---|---|---|---|---|---|---|---|---|
TOTAL (n=5,173) |
ATL (n=1,004) |
QC (n=1,001) |
ON (n=1,009) |
MB/SK (n=1,004) |
AB/BC (n=1,005) |
YK/NWT/NU (n=150) |
16-24 (n=542) |
25-34 (n=622) |
35-44 (n=891) |
45-54 (n=1,048) |
55-64 (n=950) |
65+ (n=1,120) |
M (n=2,478) |
F (n=2,669) |
|
| Had a BBQ / Had a BBQ with family/friends | 6% | 10% | 2% | 8% | 8% | 5% | 11% | 3% | 8% | 6% | 8% | 6% | 4% | 6% | 7% |
| Had/Watched fireworks | 6% | 5% | 1% | 11% | 9% | 3% | 1% | 8% | 6% | 7% | 6% | 5% | 4% | 4% | 7% |
| Put up decorations / Fly Canadian flag / Wore Canadian attire / colours / Gave thanks to be Canadian/live in Canada | 5% | 7% | 1% | 6% | 5% | 6% | 6% | 1% | 2% | 5% | 6% | 7% | 9% | 5% | 6% |
| With family/friends / With family/friends in the yard/backyard (unspecified) | 5% | 7% | 3% | 6% | 4% | 5% | 6% | 7% | 5% | 5% | 4% | 6% | 4% | 6% | 4% |
| At home with family / family dinner | 5% | 5% | 2% | 6% | 6% | 5% | 4% | 6% | 5% | 3% | 6% | 6% | 4% | 5% | 5% |
| Drank/Toasted Canada with beer/wine/champagne with friends/family | 2% | 4% | 1% | 3% | 2% | 2% | 1% | 2% | 3% | 2% | 2% | 2% | 3% | 3% | 2% |
| Watched some television / movie(s) / Virtual presentations | 2% | 1% | 1% | 3% | 3% | 2% | 3% | 2% | 2% | 2% | 2% | 1% | 3% | 2% | 2% |
| Went camping / cottage | 2% | 2% | 1% | 3% | 2% | 2% | 2% | 1% | 2% | 4% | 2% | 2% | 1% | 2% | 2% |
| Relaxed / Enjoyed day off | 1% | 2% | 1% | 2% | 1% | 1% | 1% | <1% | 1% | 1% | 3% | 1% | 1% | 1% | 1% |
| Virtual get together with family/friends (Zoom, Facebook, Skype, phone, text, etc.) | 1% | 1% | 1% | 2% | 1% | 1% | 4% | 2% | 1% | 1% | 1% | 1% | 2% | 1% | 1% |
| Went swimming / Pool party | 1% | 1% | 1% | 3% | 1% | <1% | - | 1% | <1% | 2% | 1% | 1% | 2% | 1% | 2% |
| Went out for dinner/supper / Ordered in | 1% | 2% | <1% | 1% | 1% | 2% | - | 2% | <1% | 1% | 1% | 1% | 1% | 1% | 1% |
| Outdoor activities (boating, golfing, fishing, horseshoe, soccer, etc.) | 1% | 1% | 1% | 1% | 2% | 1% | 4% | 1% | 1% | <1% | 1% | 2% | 1% | 1% | 1% |
| Had a bonfire / backyard fire / campfire | 1% | 1% | 1% | 1% | 1% | 1% | - | 2% | 2% | 1% | 1% | 1% | <1% | 1% | 1% |
| Canada Day cake/dessert | 1% | 1% | <1% | 1% | 1% | 1% | 2% | <1% | 1% | 1% | 1% | 1% | 1% | 1% | 1% |
| Went for a drive/ride | 1% | 1% | - | 2% | 1% | 1% | 1% | 1% | 1% | <1% | 1% | 1% | 1% | 1% | 1% |
| Went to the park / Provincial park | 1% | <1% | <1% | 1% | 2% | <1% | 1% | 1% | 2% | 1% | 1% | <1% | <1% | 1% | 1% |
| Listened to music / Canadian music | 1% | 1% | <1% | 1% | <1% | 1% | 2% | <1% | 1% | 1% | 1% | 1% | <1% | 1% | 1% |
| Went for a walk / nature walk | 1% | 1% | <1% | 1% | <1% | 1% | 1% | 1% | 1% | 1% | 1% | <1% | 1% | <1% | 1% |
| Party / House party / block party | 1% | 1% | <1% | 1% | 1% | 1% | - | 1% | 1% | <1% | <1% | 1% | <1% | 1% | 1% |
| Watched local parade | 1% | <1% | <1% | <1% | 1% | 2% | 10% | <1% | 1% | 1% | 1% | <1% | 1% | 1% | 1% |
| Sang the national anthem | 1% | <1% | <1% | 1% | <1% | 1% | - | <1% | - | 1% | 1% | 1% | 1% | 1% | 1% |
| Played games / board games | 1% | 1% | - | 1% | 1% | 1% | - | <1% | 1% | 1% | <1% | 1% | <1% | 1% | <1% |
| Had a picnic / Had a picnic with family/friends | 1% | 1% | <1% | 1% | 1% | 1% | 2% | 1% | <1% | <1% | <1% | 1% | <1% | <1% | 1% |
| Went for a hike / hiking | <1% | 1% | <1% | <1% | <1% | 1% | 2% | 1% | 1% | 1% | <1% | <1% | <1% | <1% | 1% |
| Dinner/Supper with friends | <1% | 1% | 1% | <1% | <1% | 1% | - | 1% | 1% | <1% | 1% | <1% | <1% | <1% | 1% |
| Went to the beach | <1% | 1% | <1% | 1% | 1% | - | 1% | 1% | 1% | <1% | <1% | <1% | <1% | <1% | <1% |
| Was working / had to work | <1% | <1% | <1% | <1% | <1% | <1% | 1% | 1% | <1% | 1% | 1% | <1% | - | <1% | <1% |
| Took a moment to reflect on Canada | <1% | <1% | <1% | - | 1% | 1% | 1% | <1% | <1% | <1% | 1% | <1% | <1% | <1% | <1% |
| Did not celebrate this year | 59% | 54% | 80% | 48% | 55% | 56% | 44% | 56% | 56% | 59% | 56% | 60% | 63% | 58% | 59% |
| Other | 2% | 2% | <1% | 1% | 2% | 4% | 7% | 2% | 2% | 1% | 1% | 2% | 2% | 2% | 2% |
| None / Nothing | 2% | 1% | 3% | 2% | 1% | 2% | 1% | 2% | 1% | 1% | 3% | 2% | 3% | 3% | 2% |
| Don’t know / Refused | 1% | 1% | <1% | 1% | 1% | 1% | - | 1% | 1% | 1% | <1% | <1% | <1% | 1% | <1% |
Canada Day Special Programming Experience
Respondents were asked to select which Government of Canada virtual Canada Day programming they had watched or participated in for Canada Day 2020.
One in four surveyed Canadians (25%) watched or participated in at least one of the Government of Canada’s Canada Day celebration special programs.
Viewership figures among the Canada Day special programming revealed the following:
The most watched of the Canada Day special programs was the virtual fireworks, viewed by one in ten surveyed Canadians (10%).
Social media and online platforms were generally the least viewed platform for Canada Day special programming.
Q4a: Please indicate if you watched/participated in any of the following Government of Canada special programming: (Select all that apply) Base: All Respondents, n=5,173.
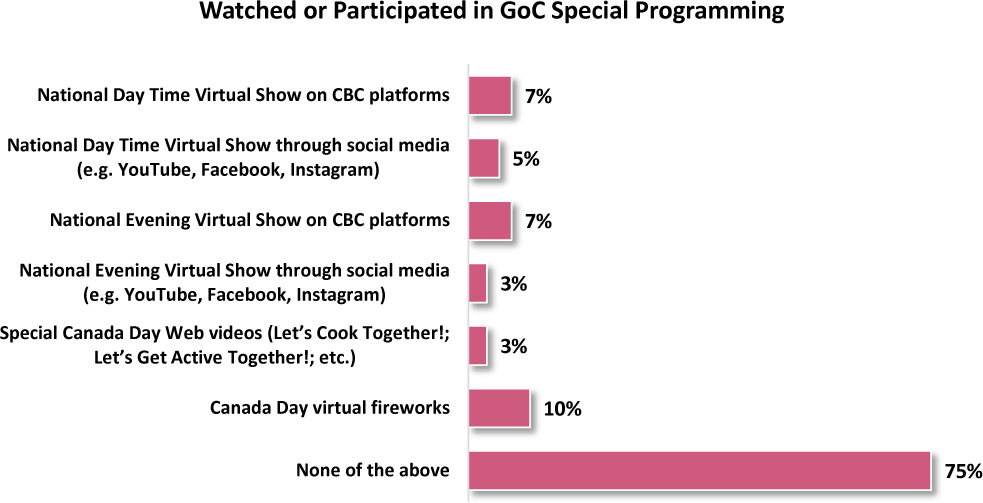
A chart depicts the percent of respondents who watched or participated in GoC special programming.
A horizontal bar chart presents the percent distribution of Government of Canada special programming watched or participated by Canadians surveyed. The data inferred from the bar graph are as follows: national day time virtual show on CBC platforms - 7 percent; national day time virtual show through social media (example: YouTube, Facebook, Instagram) - 5 percent; national evening virtual show on CBC platforms - 7 percent; national evening virtual show through social media (example: YouTube, Facebook, Instagram) - 3 percent; special Canada day web videos (let’s cook together, let’s get active together, et cetera) - 3 percent; Canada Day virtual fireworks - 10 percent; and none of the above - 75 percent.
Additional demographic differences emerged from the findings, including the following:
Canadians under the age of 35 were more likely to watch or participate in at least one Canada Day celebration special program.
Participation in both the National Day Time and Evening Virtual Show, was higher through social media among respondents aged 16-34 when compared to those over the age of 34 (National Day Time Show 8% vs. 5%, Evening Virtual Show 6% vs. 3%).
Respondents 65 years or older were more likely to watch the evening show on CBC and Radio-Canada platforms when compared to all other age groups (12% vs. 6%).
Men were more likely than women to participate in the day time programming regardless of platform, while women were more likely to have not watched any special Canada Day programming (77% vs 73%).
Q4a: Please indicate if you watched/participated in any of the following Government of Canada special programming: (Select all that apply) Base: All Respondents, n=5,173.
| Region | Age | Gender | |||||||||||||
|---|---|---|---|---|---|---|---|---|---|---|---|---|---|---|---|
TOTAL (n=5,173) |
ATL (n=1,004) |
QC (n=1,001) |
ON (n=1,009) |
MB/SK (n=1,004) |
AB/BC (n=1,005) |
YK/NWT/NU (n=150) |
16-24 (n=542) |
25-34 (n=622) |
35-44 (n=891) |
45-54 (n=1,048) |
55-64 (n=950) |
65+ (n=1,120) |
M (n=2,478) |
F (n=2,669) |
|
| National Day Time Virtual Show on CBC and Radio-Canada platforms | 7% | 7% | 9% | 7% | 6% | 7% | 7% | 7% | 9% | 6% | 7% | 7% | 8% | 9% | 6% |
| National Day Time Virtual Show through social media | 5% | 4% | 2% | 5% | 4% | 6% | 5% | 8% | 8% | 5% | 4% | 2% | 2% | 5% | 4% |
| National Evening Virtual Show on CBC and Radio-Canada platforms | 7% | 7% | 7% | 8% | 6% | 6% | 6% | 6% | 5% | 6% | 5% | 8% | 12% | 7% | 8% |
| National Evening Virtual Show through social media | 3% | 3% | 2% | 3% | 3% | 5% | 3% | 7% | 5% | 3% | 3% | 2% | 1% | 3% | 3% |
| Special Canada Day Web videos | 3% | 2% | 1% | 4% | 3% | 3% | 3% | 4% | 5% | 4% | 2% | 2% | 1% | 3% | 3% |
| Canada Day virtual fireworks | 10% | 11% | 4% | 13% | 10% | 10% | 7% | 16% | 13% | 11% | 8% | 7% | 7% | 11% | 9% |
| None of the above | 75% | 76% | 80% | 71% | 78% | 77% | 80% | 67% | 71% | 77% | 79% | 79% | 77% | 73% | 77% |
Differences among ethnic groups emerged from the findings, including the following:
Racialized Canadian respondents were more likely to watch or participate in the day time programming on CBC and Radio-Canada platforms (12%), through social media (12%), and the Canada Day 2020 fireworks (17%) when compared to both non-racialized and Indigenous Canadians.
Both non-racialized Canadians and Indigenous Canadians were more likely to have not watched or participated in any of the Canada Day 2020 special programming (79%) when compared to racialized Canadians (62%).
Respondents who participated in each of the respective Canada Day programs were asked to indicate whether or not the special program had any influence on their level of Canadian pride.
Nearly half of respondents who observed any of the virtual Canada Day celebrations (at least 48%) reported an increase in their level of Canadian pride.
The Special Canada Day Web Videos scored the greatest positive impact on pride in Canada among participating respondents (66%), followed by the National Day Time Virtual Show (58%), the National Evening Virtual Show (48%) and the Canada Day virtual fireworks (48%).
Q4b: For each specific Canada Day programming that you watched or in which you participated, how did your level of pride in Canada change, if at all? Base: Respondents who watched or participated in Government of Canada special programming, n=1,180.
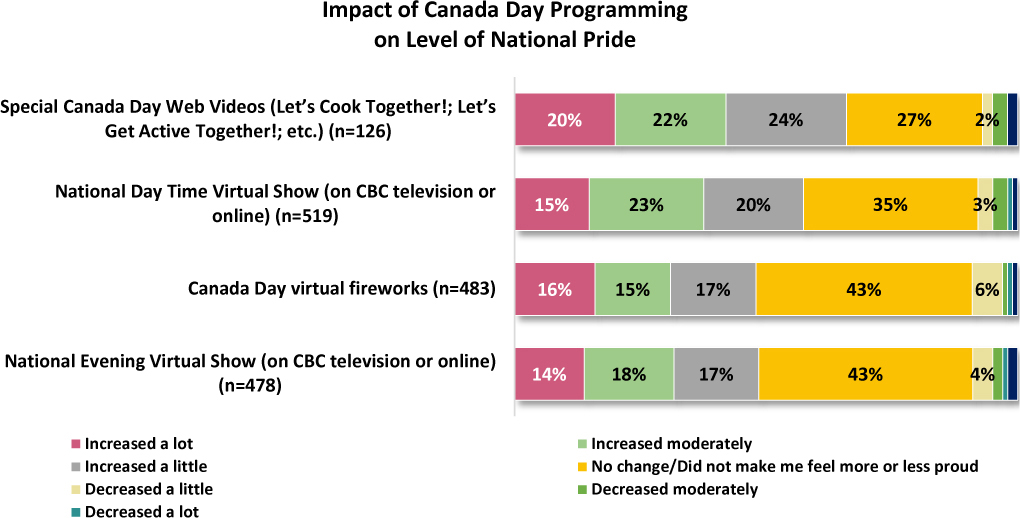
A bar chart depicts the impact of Canada day programming on the level of national pride.
A horizontal bar chart presents the impact of Canada day programming on the level of national pride of Canadians. The different levels of impact on national pride mentioned are as follows: increased a lot, increased moderately, increased a little, no change or did not make me feel more or less proud, decreased a little, decreased moderately, and decreased a lot. The data inferred in the mentioned order are as follows: Special Canada Day Web Videos, such as Let’s Cook Together, Let’s Get Active Together, et cetera (n equals 126): increased a lot - 20 percent, increased moderately - 22 percent, increased a little - 24 percent, no change or did not make me feel more or less proud - 27 percent, and decreased a little -2 percent; National Day Time Virtual Show, on CBC television or online, (n equals 519): increased a lot - 15 percent, increased moderately - 23 percent, increased a little - 20 percent, no change or did not make me feel more or less proud - 35 percent, and decreased a little - 3 percent; Canada Day Virtual Fireworks (n equals 483): increased a lot - 16 percent, increased moderately - 15 percent, increased a little - 17 percent, no change or did not make me feel more or less proud - 43 percent, and decreased a little - 6 percent; National Evening Virtual Show, on CBC television or online (n equals 478): increased a lot - 14 percent, increased moderately - 18 percent, Increased a little - 17 percent, no change or did not make me feel more or less proud - 43 percent, and decreased a little - 4 percent. The impact levels (such as, decreased moderately and decreased a lot) with lesser values are not mentioned.
National Day Time Virtual Show
Nearly three in five respondents who watched the National Day Time Virtual Show (58%) reported a positive change in their level of Canadian pride.
A variety of demographic differences emerged from the findings, including the following:
Viewers living in Manitoba or Saskatchewan (68%), Alberta or British Columbia (65%), and Ontario (61%) were more likely to increase in any amount of pride when compared to those living in Quebec (42%).
Those living in Quebec were more likely to experience no change in level of pride after viewing the National Day Time Virtual Show (49%), when compared to Alberta or British Columbia (31%), Ontario (29%), and Manitoba or Saskatchewan (26%).
Viewers aged 16 to 44 were more likely to report a positive change when compared to Canadians aged 45 or older (68% vs. 46%).
Racialized Canadians were more likely to report an increase in level of pride (75%) when compared to non-racialized (46%) and Indigenous Canadians (37%).
National Evening Virtual Show
Nearly half of respondents who watched the National Evening Virtual Show (48%) reported a positive change in their level of Canadian pride.
A variety of demographic differences emerged from the findings, including the following:
Viewers of the National Evening Virtual Show that are 16 to 44 years old were more likely to increase any amount of pride compared to those older than 65 (55% vs. 39%).
Viewers living in Quebec were less likely to report an increase in pride (25%) when compared to the rest of Canada (55%), and more likely to report no change in pride (62% vs. 38%).
Racialized Canadians were more likely to report an increase in level of pride (66%) when compared to Indigenous (52%) and non-racialized Canadians (40%).
Special Canada Day Web Videos
Two in three respondents who watched the Special Canada Day Web Videos (66%) reported a positive change in their level of Canadian pride.
Viewers under 35 years old were more likely to report their level of pride increased a lot (30%), compared to older respondents (12%).
Canada Day Virtual Fireworks
Nearly half of respondents who watched the Canada Day Virtual Fireworks (48%) reported a positive change in their level of Canadian pride.
A variety of demographic differences emerged from the findings, including the following:
Women who watched the virtual fireworks were more likely to indicate their level of pride increased a lot (21%) when compared to men (12%).
Viewers of the virtual fireworks that were 55 to 64 years old were more likely than all other age segments to indicate their level of pride increased a lot (39%).
Viewers living in the Prairies (15%) or Ontario (10%) were more likely to report a negative change in their level of pride when compared to those living in Quebec (2%).
Racialized Canadians were more likely to report an increase in level of pride (56%) when compared to non-racialized (43%) and Indigenous Canadians (29%).
Q4b: For each specific Canada Day programming that you watched or in which you participated, how did your level of pride in Canada change, if at all? Base: Respondents who watched or participated in Government of Canada special programming, n=1,180.
| Region | Age | Gender | |||||||||||||
|---|---|---|---|---|---|---|---|---|---|---|---|---|---|---|---|
TOTAL (n=519) |
ATL (n=101) |
QC (n=107) |
ON (n=111) |
MB/SK (n=83) |
AB/BC (n=102) |
YK/NWT/NU (n=15) |
16-24 (n=62) |
25-34 (n=84) |
35-44 (n=89) |
45-54 (n=93) |
55-64 (n=82) |
65+ (n=109) |
M (n=288) |
F (n=228) |
|
| Increased a lot | 15% | 13% | 14% | 15% | 16% | 15% | 37% | 21% | 18% | 16% | 14% | 9% | 10% | 17% | 12% |
| Increased moderately | 23% | 20% | 9% | 30% | 28% | 22% | - | 16% | 37% | 28% | 13% | 12% | 21% | 22% | 23% |
| Increased a little | 20% | 21% | 19% | 16% | 25% | 28% | 24% | 28% | 16% | 22% | 20% | 17% | 19% | 22% | 18% |
| No change/Did not make me feel more or less proud | 35% | 37% | 49% | 29% | 26% | 31% | 39% | 28% | 23% | 28% | 37% | 53% | 43% | 32% | 38% |
| Decreased a little | 3% | 4% | 4% | 1% | 3% | 2% | - | 3% | 2% | 2% | 5% | 1% | 2% | 2% | 3% |
| Decreased moderately | 3% | 1% | 2% | 5% | - | <1% | - | 1% | 2% | 4% | 5% | 4% | 2% | 3% | 3% |
| Decreased a lot | 1% | - | 2% | 1% | 2% | 1% | - | - | <1% | - | 3% | 3% | - | 1% | 1% |
| Don’t know | 1% | 3% | 1% | 2% | 1% | - | - | 3% | <1% | <1% | 3% | - | 2% | 1% | 2% |
| TOP 3-SCORE | 58% | 55% | 42% | 61% | 68% | 65% | 61% | 65% | 72% | 66% | 47% | 39% | 51% | 61% | 53% |
| BOTTOM 3-SCORE | 6% | 5% | 8% | 8% | 5% | 4% | - | 4% | 4% | 6% | 12% | 8% | 5% | 6% | 7% |
| Region | Age | Gender | |||||||||||||
|---|---|---|---|---|---|---|---|---|---|---|---|---|---|---|---|
TOTAL (n=478) |
ATL (n=89) |
QC (n=95) |
ON (n=107) |
MB/SK (n=84) |
AB/BC (n=92) |
YK/NWT/NU (n=11) |
16-24 (n=51) |
25-34 (n=56) |
35-44 (n=76) |
45-54 (n=78) |
55-64 (n=94) |
65+ (n=123) |
M (n=227) |
F (n=246) |
|
| Increased a lot | 14% | 24% | 8% | 16% | 17% | 12% | 17% | 17% | 17% | 14% | 13% | 13% | 10% | 15% | 13% |
| Increased moderately | 18% | 20% | 9% | 18% | 22% | 25% | 11% | 21% | 17% | 24% | 12% | 16% | 18% | 19% | 17% |
| Increased a little | 17% | 13% | 9% | 15% | 17% | 29% | 30% | 24% | 11% | 22% | 17% | 22% | 11% | 18% | 16% |
| No change/Did not make me feel more or less proud | 43% | 37% | 62% | 44% | 32% | 28% | 42% | 29% | 48% | 34% | 47% | 43% | 51% | 37% | 48% |
| Decreased a little | 4% | 2% | 5% | 4% | 6% | 2% | - | 4% | - | 2% | 8% | 4% | 4% | 5% | 3% |
| Decreased moderately | 2% | 2% | 4% | 1% | - | 1% | - | - | 3% | 2% | 3% | <1% | 2% | 2% | 1% |
| Decreased a lot | 1% | - | 1% | 1% | 2% | 1% | - | - | 2% | - | - | 1% | 1% | 1% | 1% |
| Don’t know | 2% | 2% | 2% | 1% | 4% | 3% | - | 5% | 1% | 3% | - | 1% | 2% | 2% | 2% |
| TOP 3-SCORE | 48% | 57% | 25% | 49% | 56% | 65% | 58% | 62% | 45% | 60% | 42% | 51% | 39% | 52% | 46% |
| BOTTOM 3-SCORE | 6% | 4% | 11% | 6% | 7% | 4% | - | 4% | 6% | 4% | 11% | 5% | 8% | 8% | 5% |
| Region | Age | Gender | |||||||||||||
|---|---|---|---|---|---|---|---|---|---|---|---|---|---|---|---|
TOTAL (n=126) |
ATL (n=21) |
QC (n=11) |
ON (n=38) |
MB/SK (n=28) |
AB/BC (n=24) |
YK/NWT/NU (n=4) |
16-24 (n=24) |
25-34 (n=25) |
35-44 (n=28) |
45-54 (n=18) |
55-64 (n=16) |
65+ (n=15) |
M (n=63) |
F (n=61) |
|
| Increased a lot | 20% | 21% | - | 25% | 31% | 15% | 43% | 20% | 37% | 14% | 9% | 20% | 3% | 21% | 19% |
| Increased moderately | 22% | 33% | 11% | 21% | 19% | 28% | 36% | 23% | 27% | 35% | 9% | 10% | 11% | 25% | 19% |
| Increased a little | 24% | 9% | 21% | 23% | 25% | 29% | 21% | 25% | 5% | 28% | 48% | 22% | 35% | 20% | 27% |
| No change/Did not make me feel more or less proud | 27% | 21% | 57% | 28% | 17% | 15% | - | 17% | 20% | 18% | 33% | 48% | 51% | 23% | 33% |
| Decreased a little | 2% | 4% | - | - | 4% | 7% | - | - | 8% | - | 1% | - | - | 4% | 1% |
| Decreased moderately | 3% | - | - | 2% | 4% | 6% | - | 8% | 1% | 5% | - | - | - | 5% | 1% |
| Decreased a lot | - | - | - | - | - | - | - | - | - | - | - | - | - | - | - |
| Don’t know | 2% | 12% | 11% | - | - | - | - | 8% | 1% | - | - | - | - | 2% | - |
| TOP 3-SCORE | 66% | 63% | 32% | 70% | 75% | 72% | 100% | 67% | 69% | 77% | 65% | 52% | 49% | 66% | 65% |
| BOTTOM 3-SCORE | 5% | 4% | - | 2% | 9% | 13% | - | 8% | 9% | 5% | 1% | - | - | 8% | 1% |
| Region | Age | Gender | |||||||||||||
|---|---|---|---|---|---|---|---|---|---|---|---|---|---|---|---|
TOTAL (n=483) |
ATL (n=109) |
QC (n=40) |
ON (n=133) |
MB/SK (n=94) |
AB/BC (n=94) |
YK/NWT/NU (n=13) |
16-24 (n=77) |
25-34 (n=78) |
35-44 (n=103) |
45-54 (n=74) |
55-64 (n=67) |
65+ (n=84) |
M (n=232) |
F (n=250) |
|
| Increased a lot | 16% | 17% | 16% | 16% | 13% | 18% | 5% | 11% | 12% | 15% | 16% | 39% | 14% | 12% | 21% |
| Increased moderately | 15% | 19% | 13% | 16% | 15% | 10% | 16% | 15% | 10% | 20% | 8% | 11% | 23% | 15% | 14% |
| Increased a little | 17% | 15% | 7% | 16% | 22% | 22% | 6% | 24% | 16% | 13% | 21% | 6% | 16% | 16% | 17% |
| No change/Did not make me feel more or less proud | 43% | 45% | 58% | 42% | 36% | 42% | 64% | 36% | 50% | 44% | 45% | 38% | 44% | 44% | 42% |
| Decreased a little | 6% | 3% | - | 7% | 9% | 6% | 9% | 13% | 8% | 2% | 4% | 3% | - | 6% | 5% |
| Decreased moderately | 1% | 2% | - | 2% | 1% | 1% | - | - | 3% | 2% | <1% | 2% | <1% | 2% | <1% |
| Decreased a lot | 1% | - | 2% | 1% | 4% | 1% | - | - | 1% | <1% | 4% | 2% | 2% | 2% | 1% |
| Don’t know | 1% | - | 4% | 1% | - | 1% | - | - | - | 4% | 2% | - | - | 1% | <1% |
| TOP-3 SCORE | 48% | 51% | 36% | 48% | 50% | 50% | 27% | 51% | 38% | 48% | 45% | 56% | 53% | 44% | 52% |
| BOTTOM-3 SCORE | 8% | 4% | 2% | 10% | 15% | 7% | 9% | 13% | 12% | 4% | 8% | 6% | 3% | 10% | 6% |
General Satisfaction and How the Programming Made People Feel
Respondents who participated in each of the respective Canada Day programs were then asked to indicate their level of satisfaction with the virtual programming.
At least two in three respondents who watched any of the virtual Canada Day celebrations (67% or more) reported being at least somewhat satisfied with the programming they had seen.
The Special Canada Day Web Videos scored the highest level of satisfaction among participating respondents (72%), followed by the National Day Time Virtual Show (71%), the Canada Day Virtual Fireworks (68%) and the National Evening Virtual Show (67%).
Q4c: Please indicate your level of satisfaction with the Government of Canada’s Canada Day programming that you watched/participated in: Base: Respondents who watched or participated in Government of Canada special programming, n=1,180.
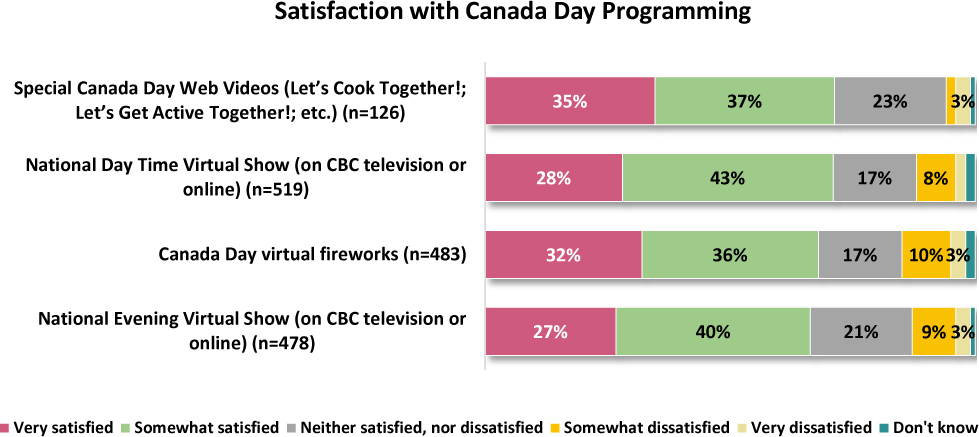
A bar chart depicts the satisfaction of Canadians with Canada day programming.
A horizontal bar chart presents the different levels of satisfaction of Canadians with Canada day programming. The different levels of satisfaction mentioned are as follows: very satisfied, somewhat satisfied, neither satisfied, nor dissatisfied, somewhat dissatisfied, very dissatisfied, and don’t know. The data inferred from the chart are as follows: Special Canada Day Web Videos, such as, Let’s cook together, Let’s Get Active Together, et cetera (n equals 126): very satisfied - 35 percent, somewhat satisfied - 37 percent, neither satisfied nor dissatisfied - 23 percent, and somewhat dissatisfied - 3 percent; National Day Time Virtual Show, on CBC television or online (n equals 519): very satisfied - 28 percent, somewhat satisfied - 43 percent, neither satisfied nor dissatisfied - 17 percent, and somewhat dissatisfied - 8 percent; Canada Day Virtual Fireworks (n equals 483): very satisfied - 32 percent, somewhat satisfied - 36 percent, neither satisfied nor dissatisfied - 17 percent, somewhat dissatisfied - 10 percent, and very dissatisfied - 3 percent; National evening virtual show on CBC television or online (n equals 478): very satisfied - 27 percent, somewhat satisfied - 40 percent, neither satisfied nor dissatisfied - 21 percent, somewhat dissatisfied - 9 percent, and very dissatisfied - 3 percent. The percentage for the satisfaction levels (such as very dissatisfied and don’t know) are not mentioned above in some cases, as the percentages are very less.
National Day Time Virtual Show
Over seven in ten viewers (71%) reported that they were at least somewhat satisfied with the National Day Time Virtual Show.
A variety of demographic differences emerged from the findings, including the following:
Viewers in Ontario were more likely to be at least somewhat satisfied with the National Day Time Virtual Show (78%) when compared to those living in Quebec (63%).
Respondents aged 25 to 34 who watched were more likely to be at least somewhat satisfied with the National Day Time Virtual Show than those 35 to 55 years old (83% vs. 66%).
Non-racialized respondents were more likely to report being dissatisfied with the National Day Time programming (13%) when compared with racialized Canadians (5%).
National Evening Virtual Show
Nearly seven in ten viewers (67%) reported that they were at least somewhat satisfied with the National Evening Virtual Show.
A variety of demographic differences emerged from the findings, including the following:
Viewers in Quebec were more likely to be dissatisfied with the National Evening Virtual Show (23%), when compared with the rest of Canada (8%).
Viewers aged 65 years or older were more likely to report being dissatisfied (22%) in comparison to younger age segments (8%).
Respondents aged 16 to 24 did not report any dissatisfaction with the National Evening Virtual Show.
Non-racialized Canadians were more likely to be dissatisfied with the National Evening programming (14%), when compared with racialized Canadians (5%).
Special Canada Day Web Videos
Over seven in ten viewers (72%) reported that they were at least somewhat satisfied with the Special Canada Day Web Videos.
Sample sizes for demographic subgroups are too small to perform any analysis at this level.
Canada Day Virtual Fireworks
Nearly seven in ten viewers (68%) reported that they were at least somewhat satisfied with the Canada Day Virtual Fireworks.
Viewers over the age of 54 were more likely to report being very satisfied when compared to younger respondents (44% vs. 27%).
Q4c: Please indicate your level of satisfaction with the Government of Canada’s Canada Day programming that you watched/participated in: Base: Respondents who watched or participated in Government of Canada special programming, n=1,180.
| Region | Age | Gender | |||||||||||||
|---|---|---|---|---|---|---|---|---|---|---|---|---|---|---|---|
TOTAL (n=519) |
ATL (n=101) |
QC (n=107) |
ON (n=111) |
MB/SK (n=83) |
AB/BC (n=102) |
YK/NWT/NU (n=31) |
16-24 (n=62) |
25-34 (n=84) |
35-44 (n=89) |
45-54 (n=93) |
55-64 (n=82) |
65+ (n=109) |
M (n=288) |
F (n=228) |
|
| Very satisfied | 28% | 28% | 21% | 30% | 30% | 31% | 32% | 22% | 34% | 29% | 24% | 32% | 27% | 29% | 28% |
| Somewhat satisfied | 43% | 42% | 41% | 47% | 38% | 38% | 50% | 51% | 48% | 37% | 37% | 36% | 43% | 41% | 45% |
| Neither satisfied, nor dissatisfied | 17% | 20% | 17% | 15% | 17% | 20% | 15% | 21% | 10% | 20% | 24% | 17% | 15% | 17% | 17% |
| Somewhat dissatisfied | 8% | 9% | 12% | 7% | 7% | 5% | - | 3% | 5% | 10% | 11% | 7% | 11% | 9% | 5% |
| Very dissatisfied | 2% | 2% | 3% | 1% | 6% | 3% | - | 1% | 2% | 4% | 2% | 5% | 1% | 2% | 3% |
| Don’t know | 2% | - | 5% | - | 2% | 3% | 3% | 3% | - | - | 2% | 3% | 4% | 2% | 2% |
| TOP-2 SCORE | 71% | 69% | 63% | 78% | 68% | 69% | 82% | 73% | 83% | 66% | 61% | 68% | 70% | 70% | 73% |
| BOTTOM-2 SCORE | 10% | 11% | 15% | 8% | 13% | 8% | - | 4% | 7% | 14% | 13% | 12% | 12% | 11% | 8% |
| Region | Age | Gender | |||||||||||||
|---|---|---|---|---|---|---|---|---|---|---|---|---|---|---|---|
TOTAL (n=478) |
ATL (n=89) |
QC (n=95) |
ON (n=107) |
MB/SK (n=84) |
AB/BC (n=92) |
YK/NWT/NU (n=11) |
16-24 (n=51) |
25-34 (n=56) |
35-44 (n=76) |
45-54 (n=78) |
55-64 (n=94) |
65+ (n=123) |
M (n=227) |
F (n=246) |
|
| Very satisfied | 27% | 41% | 15% | 28% | 35% | 28% | 54% | 28% | 24% | 19% | 27% | 33% | 27% | 24% | 30% |
| Somewhat satisfied | 40% | 32% | 37% | 39% | 32% | 49% | 29% | 47% | 39% | 38% | 37% | 38% | 41% | 42% | 37% |
| Neither satisfied, nor dissatisfied | 21% | 22% | 24% | 21% | 22% | 16% | 6% | 24% | 26% | 28% | 23% | 21% | 10% | 23% | 18% |
| Somewhat dissatisfied | 9% | 2% | 18% | 9% | 3% | 5% | - | - | 9% | 10% | 7% | 4% | 18% | 9% | 9% |
| Very dissatisfied | 3% | 2% | 5% | 2% | 4% | 1% | 10% | - | 1% | 3% | 4% | 2% | 5% | 1% | 4% |
| Don’t know | 1% | 1% | 1% | 1% | 4% | 2% | - | 1% | 1% | 2% | 2% | 2% | - | 1% | 2% |
| TOP-2 SCORE | 67% | 73% | 53% | 67% | 67% | 77% | 84% | 75% | 64% | 57% | 64% | 70% | 68% | 66% | 67% |
| BOTTOM-2 SCORE | 12% | 4% | 23% | 11% | 7% | 6% | 10% | - | 10% | 13% | 10% | 7% | 22% | 10% | 13% |
| Region | Age | Gender | |||||||||||||
|---|---|---|---|---|---|---|---|---|---|---|---|---|---|---|---|
TOTAL (n=126) |
ATL (n=21) |
QC (n=11) |
ON (n=38) |
MB/SK (n=28) |
AB/BC (n=24) |
YK/NWT/NU (n=4) |
16-24 (n=24) |
25-34 (n=25) |
35-44 (n=28) |
45-54 (n=18) |
55-64 (n=16) |
65+ (n=15) |
M (n=63) |
F (n=61) |
|
| Very satisfied | 35% | 19% | 41% | 36% | 36% | 31% | 80% | 21% | 43% | 35% | 31% | 65% | 10% | 35% | 33% |
| Somewhat satisfied | 37% | 41% | 28% | 40% | 49% | 31% | 20% | 50% | 35% | 33% | 51% | 12% | 34% | 41% | 33% |
| Neither satisfied, nor dissatisfied | 23% | 28% | 31% | 19% | 4% | 32% | - | 21% | 18% | 17% | 18% | 23% | 55% | 20% | 26% |
| Somewhat dissatisfied | 2% | 5% | - | 3% | 2% | - | - | - | - | 8% | - | - | 1% | - | 3% |
| Very dissatisfied | 3% | - | - | 3% | 5% | 6% | - | 8% | 1% | 7% | - | - | - | 3% | 3% |
| Don’t know | 1% | 8% | - | - | 4% | - | - | - | 3% | - | - | - | - | - | - |
| TOP-2 SCORE | 72% | 60% | 69% | 76% | 86% | 62% | 100% | 71% | 78% | 68% | 82% | 77% | 44% | 76% | 67% |
| BOTTOM-2 SCORE | 5% | 5% | - | 5% | 6% | 6% | - | 8% | 1% | 15% | - | - | 1% | 4% | 6% |
| Region | Age | Gender | |||||||||||||
|---|---|---|---|---|---|---|---|---|---|---|---|---|---|---|---|
TOTAL (n=483) |
ATL (n=109) |
QC (n=40) |
ON (n=133) |
MB/SK (n=94) |
AB/BC (n=94) |
YK/NWT/NU (n=13) |
16-24 (n=77) |
25-34 (n=78) |
35-44 (n=103) |
45-54 (n=74) |
55-64 (n=67) |
65+ (n=84) |
M (n=232) |
F (n=250) |
|
| Very satisfied | 32% | 40% | 32% | 31% | 26% | 33% | 8% | 22% | 30% | 33% | 22% | 45% | 44% | 27% | 37% |
| Somewhat satisfied | 36% | 34% | 40% | 32% | 46% | 40% | 70% | 42% | 36% | 35% | 42% | 27% | 33% | 40% | 33% |
| Neither satisfied, nor dissatisfied | 17% | 18% | 16% | 20% | 22% | 9% | 8% | 22% | 13% | 21% | 24% | 13% | 8% | 18% | 16% |
| Somewhat dissatisfied | 10% | 6% | 8% | 10% | 4% | 15% | 14% | 13% | 13% | 7% | 6% | 7% | 11% | 11% | 9% |
| Very dissatisfied | 3% | 2% | 2% | 3% | 1% | 2% | - | - | 6% | 2% | 2% | 4% | - | 3% | 2% |
| Don’t know | 2% | 1% | 2% | 3% | 1% | 1% | - | - | 2% | 1% | 4% | 4% | 4% | 1% | 4% |
| TOP-2 SCORE | 68% | 74% | 72% | 64% | 72% | 73% | 78% | 64% | 66% | 69% | 64% | 72% | 77% | 67% | 70% |
| BOTTOM-2 SCORE | 13% | 8% | 10% | 13% | 5% | 17% | 14% | 13% | 19% | 10% | 8% | 11% | 11% | 14% | 11% |
Respondents who participated in or watched at least one of the Canada Day programs were then asked to describe how the virtual programming made them feel. A list of emotions was presented to respondents and they were asked to select at least one but no more than three.
More than two in five respondents who watched or participated in Canada Day special programming (41%) explained that the programming they watched made them feel entertained.
Q4d: How else did the Canada Day programming you watched make you feel? Please select at least one but no more than three answers from the list below: Base: Respondents who watched or participated in Government of Canada special programming, n=1,180.
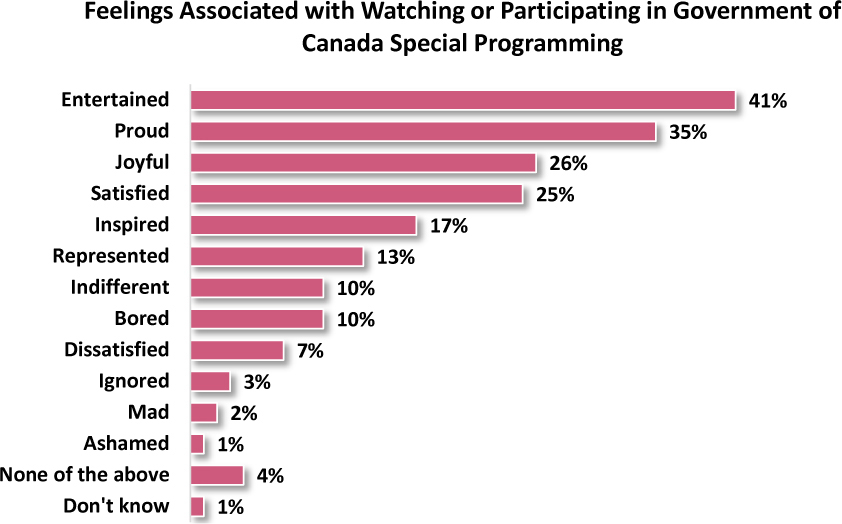
A bar chart depicts the feelings after watching or participating in GoC special programming.
A horizontal bar chart presents the various feelings of Canadians after participating in the Government of Canada special programming. The data inferred from the bar chart are as follows. Entertained: 41 percent, proud: 35 percent, joyful: 26 percent, satisfied: 25 percent, inspired: 17 percent, represented: 13 percent, indifferent: 10 percent, bored: 10 percent, dissatisfied: 7 percent, ignored: 3 percent, mad: 2 percent, ashamed: 1 percent, none of the above: 4 percent, and don’t know: 1 percent.
A variety of demographic differences emerged from the findings, including the following:
At a regional level, the largest differences exist between Quebec and the rest of Canada as traits such as pride, satisfaction and inspiration scored generally lower.
Alternatively, feelings such as indifference (16%) and boredom (14%) scored higher than average in Quebec.
Comparatively, women were more likely to report feeling joyful (30%) watching the Canada Day programming, while men were more likely to report feeling ignored (5%).
Age group insights emerged from the findings, including the following:
Among those who watched or participated in Canada Day special programming, respondents aged 16 to 24 (49%) and older than 55 (46%) were more likely to feel entertained in comparison with those 25 to 54 years old (34%).
Participants aged 55 to 64 were more likely to report feeling pride when compared to those 16 to 54 years old (46% vs. 32%).
Those aged 16 to 44 were more likely to report feeling joy when compared to respondents aged 55 to 64 years old (30% vs. 17%).
Q4d: How else did the Canada Day programming you watched make you feel? Please select at least one but no more than three answers from the list below: Base: Respondents who watched or participated in Government of Canada special programming, n=1,180.
| Region | Age | Gender | |||||||||||||
|---|---|---|---|---|---|---|---|---|---|---|---|---|---|---|---|
TOTAL (n=1,180) |
ATL (n=240) |
QC (n=203) |
ON (n=285) |
MB/SK (n=204) |
AB/BC (n=217) |
YK/NWT/NU (n=31) |
16-24 (n=162) |
25-34 (n=169) |
35-44 (n=219) |
45-54 (n=199) |
55-64 (n=189) |
65+ (n=242) |
M (n=597) |
F (n=575) |
|
| Entertained | 41% | 41% | 44% | 42% | 42% | 34% | 49% | 49% | 33% | 35% | 35% | 46% | 46% | 39% | 43% |
| Proud | 35% | 42% | 25% | 37% | 39% | 38% | 43% | 32% | 30% | 32% | 33% | 46% | 39% | 37% | 34% |
| Joyful | 26% | 25% | 22% | 24% | 26% | 31% | 34% | 33% | 29% | 28% | 22% | 17% | 23% | 22% | 30% |
| Satisfied | 25% | 26% | 17% | 24% | 25% | 32% | 35% | 23% | 23% | 26% | 24% | 28% | 24% | 23% | 27% |
| Inspired | 17% | 19% | 7% | 18% | 20% | 20% | 26% | 17% | 14% | 21% | 18% | 19% | 14% | 18% | 15% |
| Represented | 13% | 11% | 17% | 12% | 13% | 12% | 19% | 11% | 17% | 14% | 17% | 9% | 10% | 14% | 12% |
| Indifferent | 10% | 11% | 16% | 8% | 10% | 11% | 5% | 9% | 13% | 9% | 11% | 9% | 11% | 12% | 9% |
| Bored | 10% | 9% | 14% | 10% | 7% | 7% | 7% | 8% | 14% | 8% | 10% | 9% | 10% | 10% | 11% |
| Dissatisfied | 7% | 6% | 7% | 6% | 6% | 7% | 4% | 5% | 10% | 7% | 5% | 4% | 7% | 6% | 7% |
| Ignored | 3% | 2% | 4% | 3% | 3% | 3% | - | 2% | 4% | 4% | 5% | 2% | 1% | 5% | 1% |
| Mad | 2% | 3% | 1% | 2% | 1% | 1% | - | - | 2% | 3% | 1% | 3% | 1% | 2% | 2% |
| Ashamed | 1% | - | 2% | 1% | 3% | 3% | - | - | 4% | 1% | 1% | 2% | 1% | 2% | 1% |
| None of the above | 4% | 3% | 5% | 4% | 4% | 3% | 3% | 2% | 2% | 5% | 5% | 6% | 4% | 4% | 4% |
| Don’t know | 1% | 2% | 2% | 1% | 1% | 2% | 6% | 1% | 1% | <1% | 2% | 3% | 1% | 1% | 2% |
Differences among ethnic groups emerged from the findings, including the following:
Racialized Canadian respondents who watched or participated in special Canada Day programming were more likely to report feeling joyful (36%) when compared to non-racialized (22%) and Indigenous Canadians (6%).
Non-racialized (37%) and racialized Canadians (35%) were both more likely to have felt proud while participating in Canada Day programming compared to Indigenous Canadians (16%).
Indigenous participants were more likely to report feeling ignored (17%) when compared to both non-racialized and racialized Canadians (2%).
Experience with Canada Day Free Tools
Respondents were asked whether or not they had made use of either the free Canada Day tools offered to Canadians. Those who made use of each respective free tool, were then asked to rate their level of satisfaction with the tool(s) they had used.
Nearly one in ten surveyed Canadians (7%) made use of either the Canada Day Online Celebration Kit or the Canada Day Playlists.
Differences among age groups emerged from the findings, including the following:
As age increases, the use of the Canada Day tools decreases. Respondents aged 65 and older were less likely to have used either tool when compared to those 16 to 24 (1% vs. 14%).
Younger respondents, specifically those 16 to 34 years old, were more active users of the Canada Day Playlists when compared to respondents aged 35 years or older (8% vs. 3%).
Respondents aged 16 to 44 were more likely to use the Online Celebration Kit compared to those 45 years or older (6% vs. 1%).
Additional demographic differences emerged from the findings, including the following:
Surveyed Canadians living in Quebec were more likely to have not used either of the Canada Day Online Celebration Kit or the Canada Day Playlists tools when compared to Ontario and Alberta or British Columbia (95% vs. 92%).
Women were less likely to have used either of these tools (5% vs. 9%).
Non-racialized (95%) and Indigenous respondents (93%) were more likely to have not used any of the free tools when compared to racialized Canadians (84%).
Racialized Canadians were more likely to have used the Canada Day Online Celebration Kit (10%) when compared to both non-racialized (2%) and Indigenous Canadians (2%).
Q5a: Please indicate if you used any of the free Canada Day tools offered by the Government of Canada listed below: Base: All Respondents, n=5,173. 5b. Please indicate your level of satisfaction with the free Canada Day tools that you used. Base: Respondents who used free Canada Day tools, Canada Day Online Celebration Kit, n=130; Canada Day playlists, n=181.
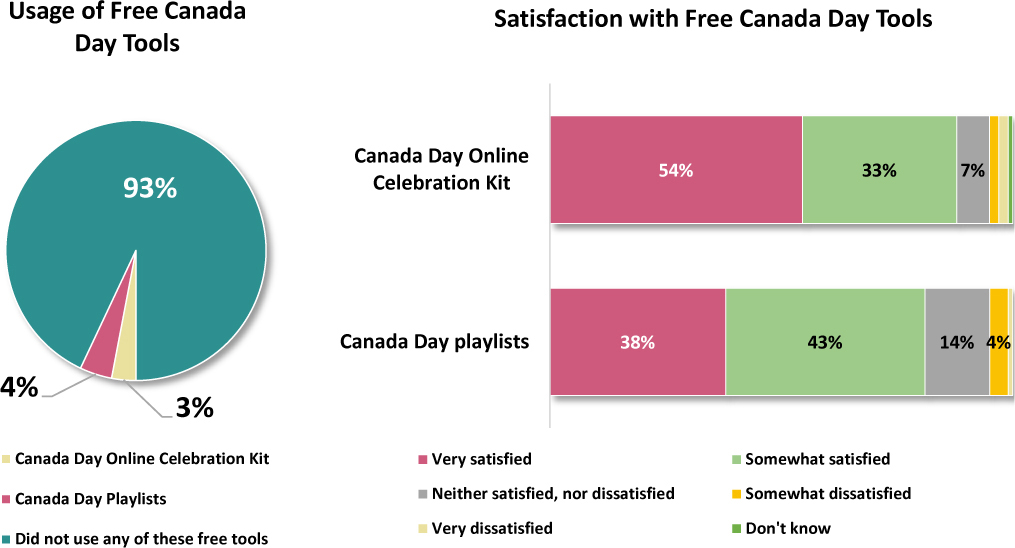
Two charts present the usage and satisfaction percent of respondents with free Canada day tools.
A pie chart and a bar chart are given. The pie chart depicts the usage of free Canada day tools by Canadians offered by the Government of Canada. The data inferred from the pie chart are as follows: 3 percent of respondents used Canada day online celebration kit, 4 percent used Canada day playlists, and 93 percent of respondents did not use any of these free tools. A horizontal bar chart presents the percent distribution of levels of satisfaction of respondents with free Canada day tools. The different levels of satisfaction are as follows: very satisfied, somewhat satisfied, neither satisfied, nor dissatisfied, somewhat dissatisfied, very dissatisfied, and don’t know. The data inferred from the bar chart in the mentioned order are as follows: Canada Day Online Celebration kit: 54 percent, 33 percent, and 7 percent; Canada Day Playlists: 38 percent, 43 percent, 14 percent, and 4 percent.
Canada Day Online Celebration Kit
Three percent (3%) of surveyed Canadians used the Canada Day Online Celebration Kit. Nearly nine in ten (88%) users of this tool reported that they were at least somewhat satisfied with it.
Demographic subgroups are too small to highlight any differences among them.
Canada Day Playlists
Four percent (4%) of surveyed Canadians made use of the Canada Day Playlists tool. Over four in five users of the Canada Day Playlists (81%), reported that they were at least somewhat satisfied with their usage of the free tool.
Demographic differences emerged from the findings, including the following:
Respondents living in Ontario were more likely report being very satisfied with the Canada Day Playlists (50%) when compared with Alberta or British Columbia (25%).
Women who used the Canada Day Playlists were more likely to be at least somewhat satisfied with the free tool (89%) when compared to men (75%).
Q5a: Please indicate if you used any of the free Canada Day tools offered by the Government of Canada listed below: Base: All Respondents, n=5,173.
| Region | Age | Gender | |||||||||||||
|---|---|---|---|---|---|---|---|---|---|---|---|---|---|---|---|
TOTAL (n=5,173) |
ATL (n=1,004) |
QC (n=1,001) |
ON (n=1,009) |
MB/SK (n=1,004) |
AB/BC (n=1,005) |
YK/NWT/NU (n=150) |
16-24 (n=542) |
25-34 (n=622) |
35-44 (n=891) |
45-54 (n=1,048) |
55-64 (n=950) |
65+ (n=1,120) |
M (n=2,478) |
F (n=2,669) |
|
| Canada Day Online Celebration Kit | 3% | 3% | 1% | 4% | 3% | 4% | 3% | 7% | 7% | 6% | 2% | 1% | <1% | 5% | 2% |
| Canada Day Playlists | 4% | 4% | 4% | 5% | 3% | 4% | 3% | 7% | 9% | 4% | 4% | 2% | 1% | 5% | 4% |
| Did not use any of these free tools | 93% | 94% | 95% | 92% | 94% | 92% | 94% | 86% | 86% | 92% | 94% | 97% | 99% | 91% | 95% |
Q5b. Please indicate your level of satisfaction with the free Canada Day tools that you used. Base: Respondents who used free Canada Day tools, Canada Day Online Celebration Kit, n=130; Canada Day playlists, n=181.
| Region | Age | Gender | |||||||||||||
|---|---|---|---|---|---|---|---|---|---|---|---|---|---|---|---|
TOTAL (n=130) |
ATL (n=22) |
QC (n=9) |
ON (n=42) |
MB/SK (n=21) |
AB/BC (n=31) |
YK/NWT/NU (n=5) |
16-24 (n=28) |
25-34 (n=38) |
35-44 (n=41) |
45-54 (n=14) |
55-64 (n=7) |
65+ (n=2) |
M (n=83) |
F (n=47) |
|
| Very satisfied | 54% | 40% | 53% | 62% | 40% | 48% | 70% | 38% | 73% | 36% | 62% | 75% | 100% | 55% | 53% |
| Somewhat satisfied | 33% | 26% | 34% | 30% | 47% | 38% | 30% | 53% | 16% | 46% | 27% | 14% | - | 32% | 36% |
| Neither satisfied, nor dissatisfied | 7% | 26% | 5% | 6% | 13% | 5% | - | 3% | 6% | 19% | - | - | - | 6% | 10% |
| Somewhat dissatisfied | 2% | 8% | - | - | - | 4% | - | 6% | 1% | - | - | - | - | 2% | <1% |
| Very dissatisfied | 2% | - | 7% | - | - | 5% | - | - | 4% | - | - | 11% | - | 3% | - |
| Don’t know | 1% | - | - | 2% | - | - | - | - | - | - | 10% | - | - | 1% | - |
| TOP-2 SCORE | 88% | 66% | 88% | 92% | 87% | 86% | 100% | 91% | 89% | 81% | 90% | 89% | 100% | 87% | 89% |
| BOTTOM-2 SCORE | 4% | 8% | 7% | - | - | 9% | - | 6% | 5% | - | - | 11% | - | 5% | <1% |
| Region | Age | Gender | |||||||||||||
|---|---|---|---|---|---|---|---|---|---|---|---|---|---|---|---|
TOTAL (n=181) |
ATL (n=34) |
QC (n=33) |
ON (n=49) |
MB/SK (n=24) |
AB/BC (n=37) |
YK/NWT/NU (n=4) |
16-24 (n=37) |
25-34 (n=52) |
35-44 (n=31) |
45-54 (n=36) |
55-64 (n=17) |
65+ (n=8) |
M (n=92) |
F (n=86) |
|
| Very satisfied | 38% | 36% | 32% | 50% | 21% | 25% | 42% | 25% | 42% | 40% | 34% | 52% | 47% | 32% | 47% |
| Somewhat satisfied | 43% | 41% | 40% | 37% | 56% | 54% | 58% | 46% | 37% | 43% | 52% | 37% | 53% | 43% | 42% |
| Neither satisfied, nor dissatisfied | 14% | 19% | 18% | 11% | 19% | 15% | - | 19% | 20% | 8% | 9% | 5% | - | 20% | 8% |
| Somewhat dissatisfied | 4% | 4% | 5% | 2% | - | 6% | - | 10% | - | 5% | 2% | 5% | - | 4% | 3% |
| Very dissatisfied | 1% | - | 5% | - | 4% | - | - | - | 1% | 4% | 3% | - | - | 2% | <1% |
| Don’t know | - | - | - | - | - | - | - | - | - | - | - | - | - | - | - |
| TOP-2 SCORE | 81% | 77% | 72% | 87% | 77% | 79% | 100% | 71% | 79% | 83% | 86% | 89% | 100% | 75% | 89% |
| BOTTOM-2 SCORE | 5% | 4% | 10% | 2% | 4% | 6% | - | 10% | 1% | 8% | 5% | 5% | - | 6% | 3% |
Awareness of Canada Day Programming Sponsorship
Respondents who saw, read or heard advertising; watched or participated in special programming; or used any of the free Canada Day tools, were asked to recall program sponsors from the virtual Canada Day events.
Nearly nine in ten (87%) surveyed Canadians who were either exposed to advertising, participated in special programming or used any free Canada Day tools could not recall seeing or hearing any sponsors during the presentation of the Canada Day programming.
Among the approximately one in ten surveyed Canadians who recalled being exposed to sponsorship materials, the most notable mentions include Tim Hortons (2%), Rogers (1%), CBC and Radio-Canada (1%), Canadian Tire (1%), Bell (1%) and the Government of Canada (1%).
Q6: Many sponsors/partners contributed to help make this programming happen. Which sponsors do you recall seeing or hearing about during the Canada Day programming presented by the Government of Canada? Base: Respondents who saw, read or heard advertising; watched/participated in special programming; or used any of the free Canada Day tools, n=2,905.
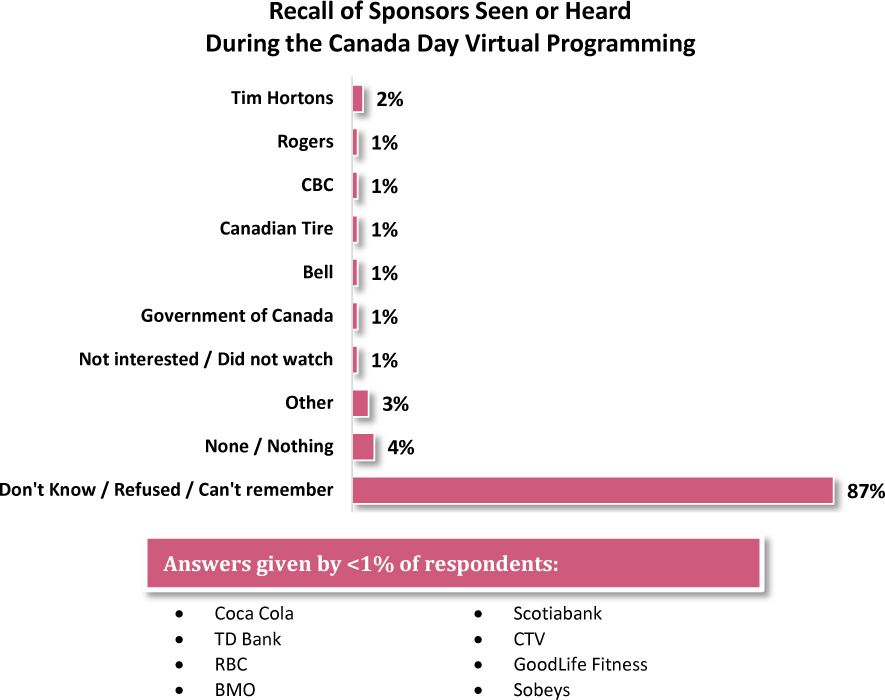
A bar chart presents the percent of awareness of Canada day programming sponsorship.
A horizontal bar chart depicts the percent of recall of sponsors seen or heard during the Canada day virtual programming by 2905 respondents. The percent inferred from the chart are as follows: Tim Hortons: 2 percent; Rogers: 1 percent; CBC: 1 percent; Canadian tire: 1 percent; Bell: 1 percent; Government of Canada: 1 percent; not interested or did not watch: 1 percent; other: 3 percent; none or nothing: 4 percent; and don’t know or refused or can’t remember: 87 percent. Answers given by less than 1 percent of respondents include Coca Cola, TD bank, RBC, BMO, Scotiabank, CTV, Goodlife Fitness, and Sobeys.
Demographic differences emerged from the findings, including the following:
Men were more likely to recall seeing or hearing of any sponsorship during exposure to any of the Canada Day programming (11%) compared to women (6%).
Respondents aged 16 to 44 were more likely to recall seeing or hearing of any sponsorship during exposure to any of the Canada Day programming compared to those 65 years and older (16% vs. 9%).
Surveyed Canadians living in Alberta and British Columbia were more likely to recall seeing or hearing of any sponsorship during exposure to any of the Canada Day programming, compared to those living in Quebec and the Prairies (16% vs. 10%).
Residents of Alberta and British Columbia are more likely to recall Tim Hortons as a sponsor (3%) in comparison to the Prairies (1%).
Comparatively, respondents aged 65 years and older were less likely to recall seeing Tim Hortons as a sponsor compared to younger respondents (1% vs. 3%).
Q6: Many sponsors/partners contributed to help make this programming happen. Which sponsors do you recall seeing or hearing about during the Canada Day programming presented by the Government of Canada? Base: Respondents who saw, read or heard advertising; watched/participated in special programming; or used any of the free Canada Day tools, n=2,905.
| Region | Age | Gender | |||||||||||||
|---|---|---|---|---|---|---|---|---|---|---|---|---|---|---|---|
TOTAL (n=2,905) |
ATL (n=590) |
QC (n=523) |
ON (n=629) |
MB/SK (n=516) |
AB/BC (n=553) |
YK/NWT/NU (n=94) |
16-24 (n=286) |
25-34 (n=356) |
35-44 (n=488) |
45-54 (n=539) |
55-64 (n=553) |
65+ (n=683) |
M (n=1,368) |
F (n=1,520) |
|
| Tim Hortons | 2% | 3% | 2% | 3% | 1% | 3% | 3% | 5% | 2% | 3% | 3% | 3% | 1% | 3% | 2% |
| Rogers | 1% | 1% | 1% | 2% | 1% | 1% | - | 1% | 1% | 2% | 1% | 2% | 1% | 2% | 1% |
| CBC and Radio-Canada | 1% | 1% | - | 1% | 1% | 1% | 1% | 1% | 1% | 1% | 1% | 1% | <1% | 1% | 1% |
| Canadian Tire | 1% | 1% | <1% | 1% | <1% | 1% | - | 1% | 1% | 1% | <1% | 1% | <1% | 1% | <1% |
| Bell | 1% | 1% | - | 1% | - | 1% | 2% | - | 2% | 1% | <1% | 1% | <1% | 1% | <1% |
| Government of Canada | 1% | 1% | 1% | <1% | <1% | 1% | 1% | 1% | 1% | <1% | <1% | 1% | <1% | <1% | 1% |
| Coca Cola | <1% | <1% | - | <1% | - | 1% | 1% | 1% | 1% | 1% | <1% | - | <1% | <1% | <1% |
| TD Bank | <1% | <1% | - | <1% | <1% | <1% | - | 1% | <1% | 1% | <1% | - | <1% | <1% | <1% |
| RBC | <1% | <1% | - | <1% | <1% | 1% | 2% | 1% | <1% | 1% | - | <1% | - | <1% | <1% |
| BMO | <1% | - | <1% | <1% | - | <1% | - | 1% | - | <1% | <1% | <1% | - | <1% | <1% |
| Scotiabank | <1% | 1% | - | <1% | - | <1% | 2% | <1% | 1% | - | - | <1% | - | <1% | <1% |
| CTV | <1% | <1% | - | - | <1% | <1% | - | 1% | - | <1% | <1% | <1% | - | <1% | <1% |
| GoodLife Fitness | <1% | <1% | - | <1% | <1% | - | - | - | - | 1% | - | - | <1% | <1% | <1% |
| Sobeys | <1% | <1% | - | - | <1% | <1% | - | <1% | - | <1% | <1% | <1% | - | <1% | <1% |
| Not interested / Did not watch | 1% | 1% | 1% | 1% | 1% | 1% | 1% | - | <1% | 2% | 1% | 1% | 2% | 1% | 1% |
| Other | 3% | 2% | 2% | 4% | 3% | 3% | 2% | 3% | 5% | 3% | 3% | 2% | 2% | 3% | 2% |
| None / Nothing | 4% | 3% | 3% | 3% | 3% | 5% | 3% | 2% | 4% | 3% | 3% | 4% | 4% | 4% | 3% |
| Don’t know / Refused / Can’t remember | 87% | 88% | 90% | 87% | 90% | 84% | 87% | 85% | 84% | 84% | 87% | 88% | 91% | 84% | 89% |
Improving Future Virtual Celebrations
After the first year of implementing virtual forms of Canada Day programming, respondents were asked to provide their feedback for ways the Government of Canada can improve future virtual celebrations.
Nearly one in ten surveyed Canadians felt that in order to improve virtual celebrations in the future, there must be better promotion of the event across all media platforms (9%).
Alternatively, less than one in ten felt that virtual celebrations would not be of interest to them (7%), as it is not the same experience as in person.
Age group differences emerged from the findings, including the following:
Respondents aged 16 to 44 were more likely to describe the need for more promotion, compared with those aged 45 years or more (12% vs. 7%).
Those aged 45 years and older were more likely to not be interested in virtual celebrations compared with those 16 to 44 (8% vs. 5%).
Q7: This year, for the first time, the Government of Canada developed new ways to help you enjoy Canada Day at home. What could they do to improve virtual celebrations in the future? Base: All Respondents, n=5,173.
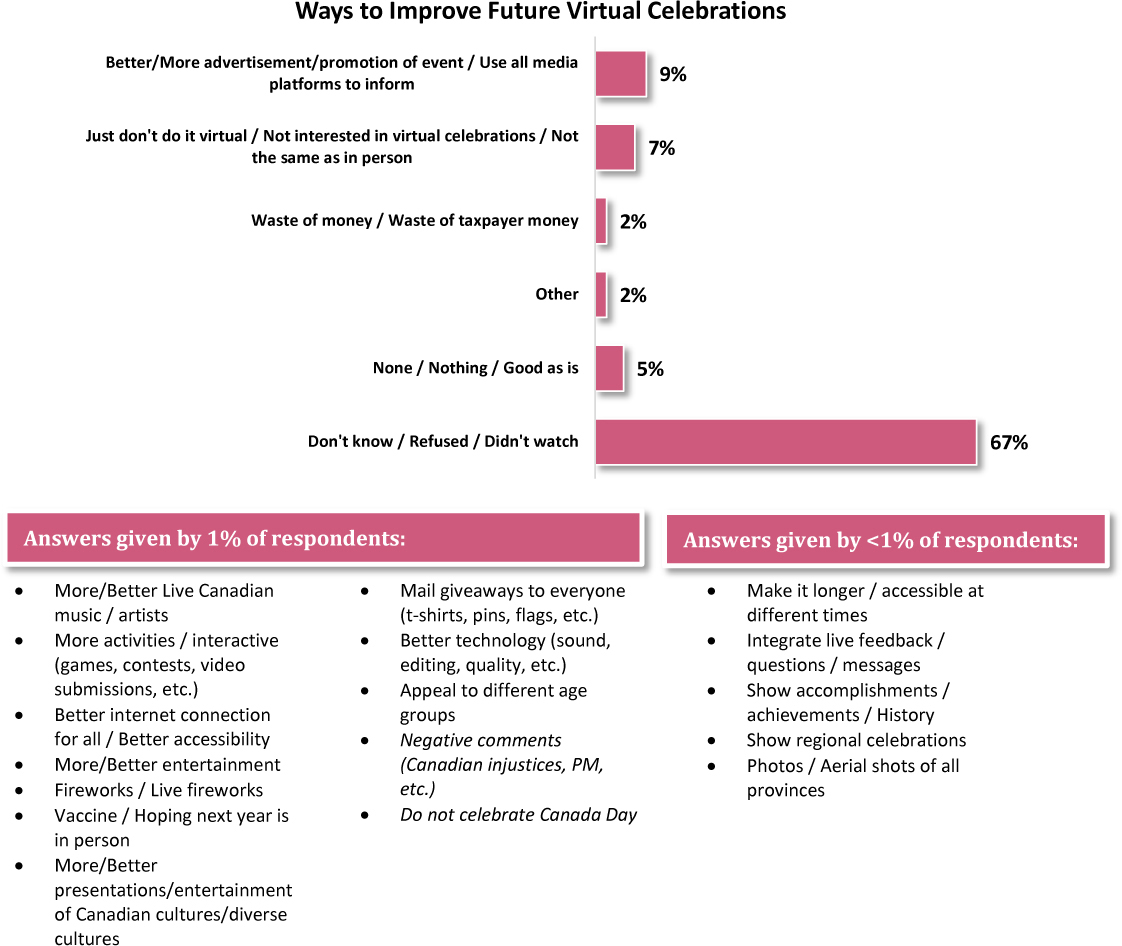
A bar chart presents ways to improve future virtual celebrations.
A horizontal bar chart depicts different ways to improve virtual celebrations in the future. The percent inferred from the chart are as follows. Better or more advertisement or promotion of an event or use all media platforms to inform: 9 percent; just don’t do it virtual or not interested in virtual celebrations or not the same as in-person: 7 percent; waste of money or waste of taxpayer money: 2 percent; other: 2 percent; none or nothing or good as is: 5 percent; and don’t know or refused or didn’t watch: 67 percent. Answers given by 1 percent of respondents are as follows. More or better live Canadian music or artists, more activities or interactive (games, contests, video, submissions, et cetera), better internet connection for all or better accessibility, more or better entertainment, fireworks or live fireworks, vaccine or hoping next year is in person, more or better presentations or entertainment of Canadian cultures or diverse cultures, mail giveaways to everyone (t-shirts, pins, flags, et cetera), better technology (sound, editing, quality, et cetera), appeal to different age groups, negative comments (Canadian injustices, PM, et cetera), do not celebrate Canada Day. Answers given by less than 1 percent of respondents are as follows. Make it longer or accessible at different times, integrate live feedback or questions or messages, show accomplishments or achievements or history, show regional celebrations, photos, or aerial shots of all provinces.
Additional demographic differences emerged from the findings, including the following:
At a regional level, surveyed Canadians living in Quebec were less likely to recommend more advertising for virtual celebrations when compared with the rest of Canada, excluding those living in the North (6% vs. 10%).
Women were more likely to recommend improved advertising across all media platforms (11%) when compared to men (8%).
Racialized Canadians were more likely to recommend increasing the amount of advertising promoted (12%) when compared to non-racialized Canadians (9%) and Indigenous Canadians (8%).
Q7: This year, for the first time, the Government of Canada developed new ways to help you enjoy Canada Day at home. What could they do to improve virtual celebrations in the future? Base: All Respondents, n=5,173.
| Region | Age | Gender | |||||||||||||
|---|---|---|---|---|---|---|---|---|---|---|---|---|---|---|---|
TOTAL (n=5,173) |
ATL (n=1,004) |
QC (n=1,001) |
ON (n=1,009) |
MB/SK (n=1,004) |
AB/BC (n=1,005) |
YK/NWT/NU (n=150) |
16-24 (n=542) |
25-34 (n=622) |
35-44 (n=891) |
45-54 (n=1,048) |
55-64 (n=950) |
65+ (n=1,120) |
M (n=2,478) |
F (n=2,669) |
|
| Better/More advertisement/promotion of event / Use all media platforms to inform | 9% | 9% | 6% | 10% | 10% | 10% | 11% | 15% | 10% | 12% | 8% | 8% | 5% | 8% | 11% |
| Just don’t do it virtual / Not interested in virtual celebrations / Not the same as in person | 7% | 6% | 6% | 7% | 8% | 8% | 4% | 4% | 6% | 6% | 7% | 8% | 8% | 8% | 6% |
| Waste of money / Waste of taxpayer money | 2% | 1% | 2% | 1% | 2% | 2% | 2% | <1% | 2% | 3% | 1% | 2% | 1% | 3% | 1% |
| More/Better Live Canadian music / artists | 1% | 1% | 1% | 1% | 1% | 1% | 1% | 1% | 2% | 1% | 1% | 2% | 1% | 1% | 1% |
| More activities / interactive (games, contests, video submissions, etc.) | 1% | 1% | 1% | 1% | 1% | 1% | 3% | 2% | 2% | 1% | 1% | 1% | <1% | 1% | 1% |
| Better internet connection for all / Better accessibility | 1% | 1% | 1% | 1% | 1% | 1% | 1% | 2% | 2% | <1% | 1% | 1% | 1% | 1% | 1% |
| More/Better entertainment | 1% | 1% | 1% | 1% | <1% | 1% | - | 1% | 1% | 1% | 1% | 1% | 1% | 1% | 1% |
| Fireworks / Live fireworks | 1% | <1% | <1% | 1% | 1% | 1% | - | 2% | 1% | 1% | 1% | <1% | 1% | 1% | 1% |
| Vaccine / Hoping next year is in person | 1% | 2% | 1% | 1% | 1% | 1% | - | <1% | 1% | <1% | 1% | 1% | 2% | 1% | 1% |
| More/Better presentations/entertainment of Canadian cultures/diverse cultures | 1% | <1% | 1% | 1% | <1% | 1% | 2% | 1% | <1% | <1% | 1% | <1% | 2% | 1% | 1% |
| Mail giveaways to everyone (t-shirts, pins, flags, etc.) | 1% | 1% | <1% | 1% | 1% | 1% | 1% | <1% | 1% | 1% | 1% | <1% | <1% | <1% | 1% |
| Better technology (sound, editing, quality, etc.) | 1% | <1% | <1% | 1% | <1% | 1% | - | <1% | 1% | 1% | <1% | <1% | <1% | 1% | <1% |
| Appeal to different age groups | 1% | <1% | <1% | 1% | <1% | <1% | 1% | 2% | <1% | 1% | <1% | <1% | <1% | <1% | 1% |
| Make it longer / accessible at different times | <1% | <1% | <1% | 1% | <1% | <1% | 1% | 1% | <1% | 1% | <1% | <1% | 1% | <1% | 1% |
| Integrate live feedback / questions / messages | <1% | 1% | <1% | 1% | <1% | <1% | - | 1% | 1% | <1% | 1% | <1% | <1% | 1% | <1% |
| Show accomplishments / achievements / History | <1% | <1% | <1% | <1% | <1% | <1% | 2% | <1% | 1% | <1% | 1% | <1% | <1% | <1% | <1% |
| Show regional celebrations | <1% | <1% | 1% | - | <1% | <1% | 2% | - | - | <1% | 1% | <1% | 1% | <1% | <1% |
| Photos / Aerial shots of all provinces | <1% | <1% | <1% | <1% | <1% | <1% | 2% | <1% | - | <1% | <1% | <1% | <1% | <1% | <1% |
| Negative comments (Canadian injustices, PM, etc.) | 1% | <1% | <1% | 1% | 1% | 1% | - | 1% | 1% | <1% | 1% | <1% | 1% | 1% | 1% |
| Do not celebrate Canada Day | 1% | <1% | 1% | - | <1% | 1% | 1% | <1% | <1% | <1% | <1% | 1% | 1% | 1% | 1% |
| Other | 2% | 2% | 1% | 1% | 2% | 3% | 1% | 1% | 3% | 2% | 1% | 1% | 1% | 2% | 1% |
| None / Nothing / Good as is | 5% | 6% | 5% | 5% | 3% | 4% | 4% | 3% | 4% | 5% | 5% | 5% | 5% | 4% | 5% |
| Don’t know / Refused / Didn’t watch | 67% | 69% | 72% | 67% | 67% | 62% | 65% | 63% | 63% | 67% | 69% | 69% | 70% | 66% | 68% |
Alternative Virtual Celebrations
Respondents were asked to identify whether or not they had watched or participated in alternative virtual Canada Day offerings from organizations outside of the Government of Canada.
Nearly one in ten surveyed Canadians (9%) watched or participated in virtual Canada Day programs offered by another organization.
A variety of demographic differences emerged from the findings, including the following:
Respondents living in Quebec were less likely to have participated in any virtual programming offered by another organization, compared to the rest of Canadians (5% vs. 11%).
Racialized Canadians were more likely to participate in alternative virtual Canada Day programs (17%), compared to Indigenous Canadians (8%) and non-racialized respondents (7%).
Q8: Did you watch or participate in any virtual Canada Day programs offered by other organizations such as municipalities, provincial governments, museums and other private organizations? Base: All Respondents, n=5,173.
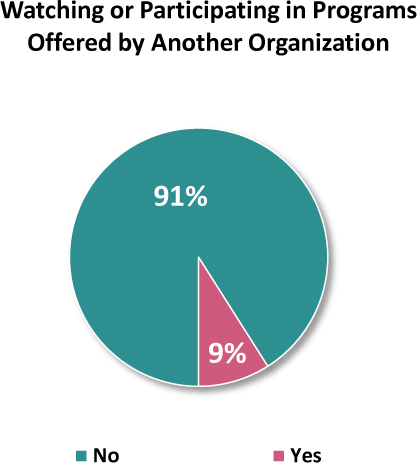
A pie chart presents the participation of Canadians in alternative virtual Canada day celebrations.
A pie chart depicts the percent of participation by Canadian respondents in programs offered by another organization. Out of the total surveyed, 91 percent of Canadians did not participate in any program offered by another organization while 9 percent participated in various programs offered.
When comparing age segments, respondents under 35 years old were more likely to participate in other organizations’ virtual offerings, compared to those 35 years or older (13% vs. 8%).
Men were more likely to participate in other organizations’ virtual Canada Day programs (11%), compared to women (8%).
Q8: Did you watch or participate in any virtual Canada Day programs offered by other organizations such as municipalities, provincial governments, museums and other private organizations? Base: All Respondents, n=5,173.
| Region | Age | Gender | |||||||||||||
|---|---|---|---|---|---|---|---|---|---|---|---|---|---|---|---|
TOTAL (n=5,173) |
ATL (n=1,004) |
QC (n=1,001) |
ON (n=1,009) |
MB/SK (n=1,004) |
AB/BC (n=1,005) |
YK/NWT/NU (n=150) |
16-24 (n=542) |
25-34 (n=622) |
35-44 (n=891) |
45-54 (n=1,048) |
55-64 (n=950) |
65+ (n=1,120) |
M (n=2,478) |
F (n=2,669) |
|
| Yes | 9% | 11% | 5% | 11% | 9% | 11% | 20% | 12% | 13% | 9% | 8% | 5% | 9% | 11% | 8% |
| No | 91% | 89% | 95% | 89% | 91% | 89% | 80% | 88% | 87% | 91% | 92% | 95% | 91% | 89% | 92% |
Pride in Canadian Heritage
Respondents were asked to rate their level of pride in their Canadian heritage, specifically how proud they are to be Canadian.
Nine in ten surveyed Canadians (90%) reported feeling at least somewhat proud to be a Canadian, while more than half (51%) were very proud to be Canadian.
Regional differences emerged from the findings, including the following:
Respondents living in Quebec were more likely to report feeling not very proud or not proud at all, when compared to the rest of Canada (13% vs. 4%).
Comparatively, the rest of Canada was more likely to feel very proud, when compared to those living in Quebec (57% vs. 30%).
Ethnic differences emerged from the findings, including the following:
Non-racialized Canadians were more likely to report being very proud to be Canadian (53%), compared to racialized (46%) and Indigenous respondents (38%).
Indigenous respondents were more likely to report feeling not very proud or not proud at all to be Canadian (21%), compared to non-racialized (6%) and racialized Canadians (3%).
Q10: How proud are you to be Canadian? Base: All Respondents, n=5,173.
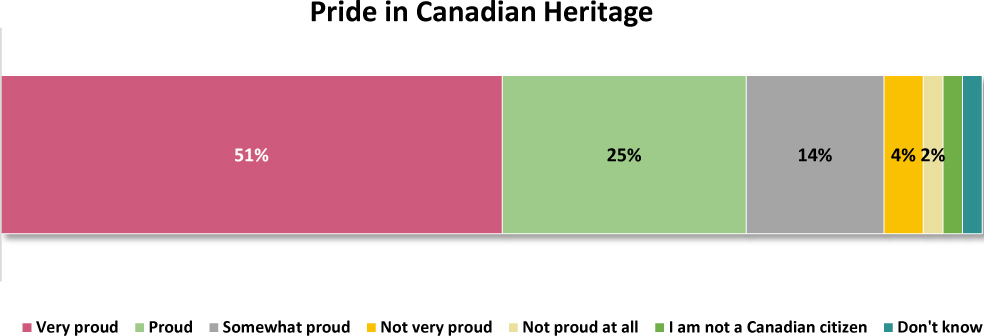
A bar chart presents the level of pride in Canadian heritage.
A horizontal bar chart depicts the level of pride of 5,173 respondents in Canadian heritage. The percent inferred from the chart are as follows. Very proud: 51 percent; proud: 25 percent; somewhat proud: 14 percent; not very proud: 4 percent; not proud at all: 2 percent; I am not a Canadian citizen: 2 percent; and don’t know: 2 percent.
Additional demographic differences emerged from the findings, including the following:
As a general trend, older respondents were more likely to report feeling at least somewhat proud in comparison to younger age segments.
More specifically, respondents aged 35 years or older were more likely to report feeling very proud, when compared to those 16 to 34 years old (55% vs. 41%).
Women were more likely to report feeling at least somewhat proud to be Canadian (92%), when compared to men (88%).
Q10: How proud are you to be Canadian? Base: All Respondents, n=5,173.
| Region | Age | Gender | |||||||||||||
|---|---|---|---|---|---|---|---|---|---|---|---|---|---|---|---|
TOTAL (n=5,173) |
ATL (n=1,004) |
QC (n=1,001) |
ON (n=1,009) |
MB/SK (n=1,004) |
AB/BC (n=1,005) |
YK/NWT/NU (n=150) |
16-24 (n=542) |
25-34 (n=622) |
35-44 (n=891) |
45-54 (n=1,048) |
55-64 (n=950) |
65+ (n=1,120) |
M (n=2,478) |
F (n=2,669) |
|
| Very proud | 51% | 62% | 30% | 58% | 54% | 55% | 56% | 38% | 44% | 46% | 56% | 55% | 60% | 50% | 52% |
| Proud | 25% | 24% | 22% | 27% | 27% | 26% | 20% | 34% | 28% | 28% | 22% | 22% | 22% | 24% | 26% |
| Somewhat proud | 14% | 6% | 29% | 8% | 11% | 10% | 15% | 15% | 16% | 15% | 12% | 14% | 11% | 14% | 14% |
| Not very proud | 4% | 3% | 8% | 2% | 2% | 4% | 1% | 4% | 3% | 4% | 4% | 4% | 4% | 5% | 3% |
| Not proud at all | 2% | 1% | 5% | 1% | 2% | 2% | 1% | 1% | 2% | 3% | 2% | 3% | 2% | 3% | 1% |
| I am not a Canadian citizen | 2% | 2% | 2% | 2% | 3% | 2% | 3% | 5% | 5% | 2% | 1% | 1% | 1% | 2% | 2% |
| Don’t know | 2% | 1% | 4% | 1% | 1% | 1% | 4% | 2% | 2% | 1% | 2% | 1% | 1% | 2% | 2% |
| TOP-3 SCORE | 90% | 92% | 81% | 94% | 92% | 91% | 91% | 87% | 88% | 89% | 91% | 90% | 93% | 88% | 92% |
| BOTTOM-2 SCORE | 6% | 4% | 13% | 3% | 4% | 6% | 2% | 6% | 5% | 7% | 6% | 8% | 6% | 8% | 4% |
Respondents who were are least somewhat proud to be Canadian were then asked to describe the source(s) or reasons for their pride.
Nearly one in five (18%) surveyed Canadians who were at least somewhat proud to be Canadian described freedom and strength as one of their sources of pride.
Other commonly reported sources of pride include the beauty of the country (12%), its diversity (10%), universal healthcare (10%) and love for being born in Canada (9%).
Regional differences emerged from the findings, including the following:
Respondents who were at least somewhat proud to be Canadian and living in Quebec were less likely than the rest of Canada, excluding the North, to list strength and freedom as a source of pride (15% vs. 19%).
Those respondents living in Quebec were more likely to report beauty and the size of the country when compared to the rest of the country (19% vs. 10%).
Q11: What makes you proud to be Canadian? Base: Respondents at least “somewhat proud” to be Canadian, n=4,679.
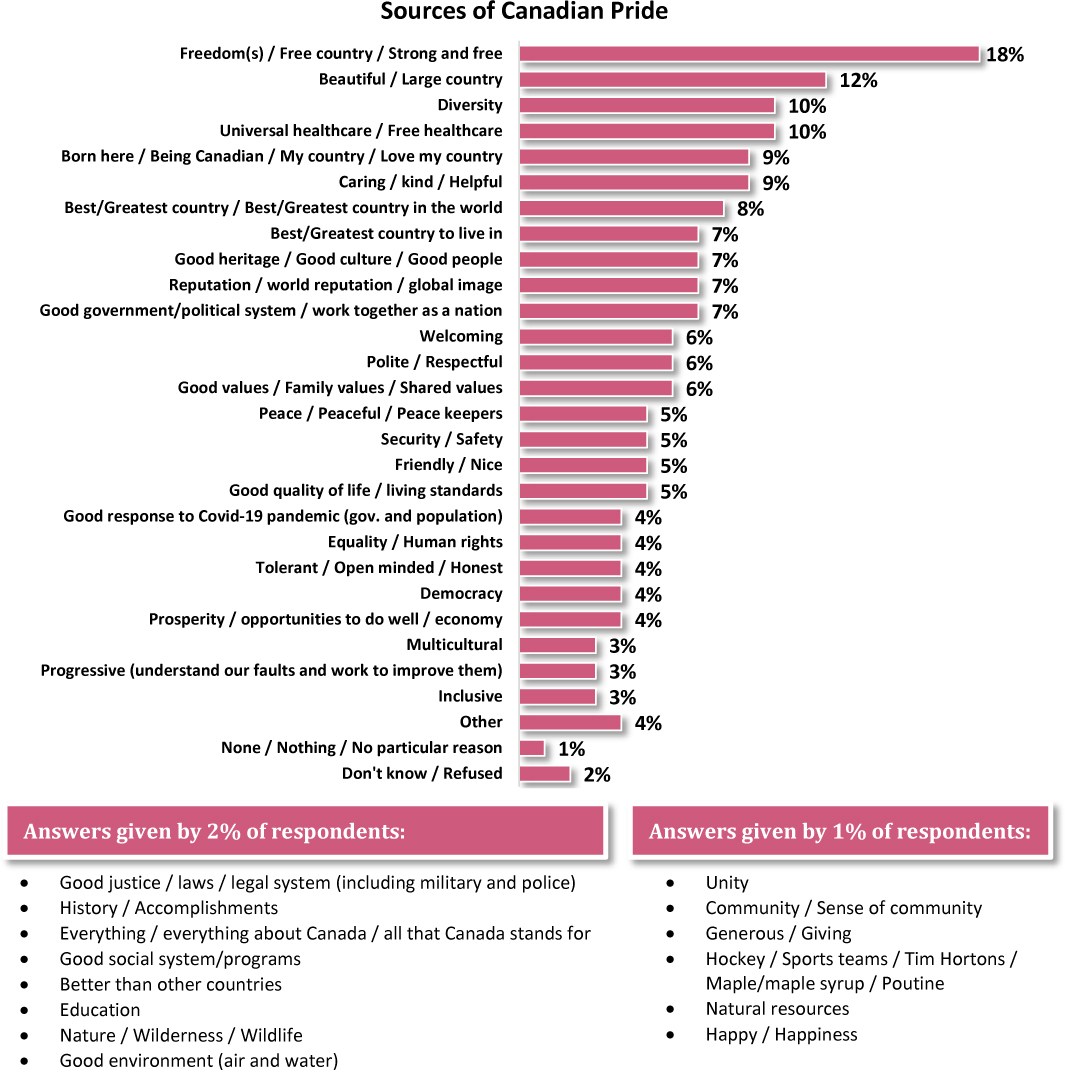
A bar chart presents different sources of Canadian pride.
A horizontal bar chart depicts the sources of pride of 4,679 respondents on the Canadian heritage. The percent inferred from the chart are as follows. Freedom or free country or strong and free: 18 percent; beautiful or large country: 12 percent; Diversity: 10 percent; universal healthcare or free healthcare: 10 percent; born here or being Canadian or my country or love my country: 9 percent; caring or kind or helpful: 9 percent; best or greatest country or best or greatest country in the world: 8 percent; best or greatest country to live in: 7 percent; good heritage or good culture or good people: 7 percent; reputation or world reputation or global image: 7 percent; good government or political system or work together as a nation: 7 percent; welcoming: 6 percent; polite or respectful: 6 percent; good values or family values or shared values: 6 percent; peace or peaceful or peace keepers: 5 percent; security or safety: 5 percent; friendly or nice: 5 percent; good quality of life or living standards: 5 percent; good response to Covid-19 pandemic (government and population): 4 percent; equality or human rights: 4 percent; tolerant or open minded or honest: 4 percent; Democracy: 4 percent; prosperity or opportunities to do well or economy: 4 percent; multicultural: 3 percent; progressive (understand out faults and work to improve them): 3 percent; inclusive: 3 percent; other: 4 percent; none or nothing or no particular reason: 1 percent; and don’t know or refused: 2 percent. Answers given by 2 percent of respondents are as follows. Good justice or laws or legal system (including military and police), history or accomplishments, everything or everything about Canada or all that Canada stands for, good social system or programs, better than other countries, education, nature or wilderness or wildlife, good environment (air and water). Answers given by 1 percent of respondents are as follows: unity, community or sense of community, generous or giving, hockey or sports teams or Tim Hortons or Maple or maple syrup or poutine, natural sources, happy or happiness.
The following subgroup differences are found among respondents at least somewhat proud to be Canadian:
Respondents aged 16 to 24 were less likely to describe freedom and strength (13%) as a source of Canadian pride, when compared to their older counterpart (13% vs. 19%).
Surveyed Canadians under the age of 65 years old were more likely to mention diversity as a source of pride when compared to those 65 years or older (12% vs. 6%).
Conversely, those at least 55 years old were more likely to mention Canada being their birthplace than those 16 to 54 years old (13% vs. 7%).
Women were more likely to describe Canada’s beauty (15% vs. 9%) and the availability of universal healthcare, when compared to men (13% vs. 7%).
Q11: What makes you proud to be Canadian? Base: Respondents at least “somewhat proud” to be Canadian, n=4,679.
| Region | Age | Gender | |||||||||||||
|---|---|---|---|---|---|---|---|---|---|---|---|---|---|---|---|
TOTAL (n=4,679) |
ATL (n=932) |
QC (n=818) |
ON (n=944) |
MB/SK (n=931) |
AB/BC (n=917) |
YK/NWT/NU (n=137) |
16-24 (n=480) |
25-34 (n=541) |
35-44 (n=793) |
45-54 (n=954) |
55-64 (n=868) |
65+ (n=1,043) |
M (n=2,197) |
F (n=2,464) |
|
| Freedom(s) / Free country / Strong and free | 18% | 22% | 15% | 19% | 23% | 18% | 19% | 13% | 19% | 17% | 21% | 20% | 19% | 18% | 18% |
| Beautiful / Large country | 12% | 10% | 19% | 11% | 11% | 10% | 8% | 12% | 11% | 11% | 12% | 13% | 13% | 9% | 15% |
| Diversity | 10% | 8% | 6% | 13% | 9% | 11% | 17% | 12% | 15% | 12% | 10% | 10% | 6% | 9% | 11% |
| Universal healthcare / Free healthcare | 10% | 12% | 2% | 12% | 11% | 11% | 14% | 11% | 11% | 11% | 9% | 9% | 9% | 7% | 13% |
| Born here / Being Canadian / My country / Love my country | 9% | 8% | 14% | 7% | 10% | 9% | 11% | 6% | 6% | 6% | 9% | 12% | 14% | 9% | 10% |
| Caring / kind / Helpful | 9% | 10% | 3% | 11% | 7% | 11% | 7% | 10% | 8% | 9% | 9% | 9% | 9% | 7% | 11% |
| Best/Greatest country / Best/Greatest country in the world | 8% | 9% | 6% | 9% | 8% | 9% | 5% | 5% | 7% | 8% | 8% | 9% | 11% | 9% | 7% |
| Best/Greatest country to live in | 7% | 9% | 5% | 9% | 6% | 7% | 7% | 3% | 4% | 6% | 8% | 8% | 11% | 7% | 8% |
| Good heritage / Good culture / Good people | 7% | 8% | 4% | 8% | 7% | 6% | 8% | 8% | 7% | 5% | 7% | 8% | 6% | 6% | 7% |
| Reputation / world reputation / global image | 7% | 5% | 8% | 6% | 7% | 6% | 7% | 7% | 6% | 5% | 8% | 6% | 7% | 6% | 7% |
| Good government/political system / work together as a nation/ supportive of citizens | 7% | 8% | 4% | 7% | 6% | 7% | 5% | 6% | 6% | 6% | 6% | 7% | 8% | 6% | 8% |
| Welcoming | 6% | 4% | 6% | 7% | 6% | 6% | 9% | 7% | 7% | 8% | 5% | 7% | 5% | 5% | 8% |
| Polite / Respectful | 6% | 6% | 6% | 6% | 3% | 5% | 4% | 7% | 5% | 5% | 6% | 6% | 5% | 5% | 6% |
| Good values / Family values / Shared values | 6% | 6% | 8% | 6% | 4% | 6% | 8% | 3% | 6% | 7% | 6% | 6% | 5% | 6% | 6% |
| Peace / Peaceful / Peace keepers | 5% | 4% | 9% | 4% | 5% | 5% | 3% | 4% | 5% | 7% | 6% | 5% | 5% | 5% | 6% |
| Security / Safety | 5% | 5% | 5% | 6% | 5% | 4% | 1% | 3% | 4% | 6% | 5% | 7% | 5% | 5% | 6% |
| Friendly / Nice | 5% | 6% | 1% | 5% | 6% | 6% | 3% | 9% | 5% | 4% | 6% | 3% | 2% | 3% | 6% |
| Good quality of life / living standards | 5% | 4% | 8% | 3% | 4% | 4% | 3% | 5% | 4% | 3% | 5% | 4% | 6% | 4% | 5% |
| Good response to Covid-19 pandemic (government and population) | 4% | 6% | 2% | 5% | 3% | 4% | 4% | 1% | 3% | 4% | 5% | 5% | 4% | 3% | 5% |
| Equality / Human rights | 4% | 4% | 6% | 3% | 3% | 3% | 6% | 4% | 6% | 4% | 4% | 3% | 3% | 4% | 4% |
| Tolerant / Open minded / Honest | 4% | 3% | 4% | 4% | 4% | 3% | 4% | 4% | 2% | 5% | 2% | 5% | 4% | 3% | 4% |
| Democracy | 4% | 3% | 4% | 4% | 3% | 3% | 7% | 2% | 4% | 2% | 4% | 4% | 6% | 4% | 3% |
| Prosperity / opportunities to do well / economy | 4% | 2% | 3% | 4% | 4% | 4% | 5% | 5% | 2% | 3% | 3% | 4% | 4% | 4% | 4% |
| Multicultural | 3% | 2% | 2% | 4% | 3% | 5% | 7% | 4% | 4% | 3% | 4% | 3% | 3% | 3% | 4% |
| Progressive (understand our faults and work to improve them) | 3% | 3% | 2% | 3% | 5% | 4% | 5% | 5% | 4% | 3% | 2% | 4% | 3% | 3% | 3% |
| Inclusive | 3% | 2% | 2% | 3% | 2% | 3% | 2% | 5% | 3% | 3% | 3% | 3% | 2% | 3% | 3% |
| Good justice / laws / legal system (including military and police) | 2% | 3% | 3% | 2% | 2% | 2% | 4% | 4% | 1% | 2% | 2% | 4% | 3% | 3% | 2% |
| History / Accomplishments | 2% | 2% | 1% | 3% | 3% | 2% | 6% | 4% | 2% | 2% | 2% | 2% | 2% | 3% | 1% |
| Everything / everything about Canada / all that Canada stands for | 2% | 2% | <1% | 2% | 3% | 2% | 3% | 3% | 3% | 3% | 1% | 1% | 1% | 2% | 2% |
| Good social system/programs | 2% | 3% | 2% | 2% | 2% | 2% | 6% | 2% | 1% | 2% | 2% | 2% | 2% | 2% | 2% |
| Better than other countries | 2% | 3% | 2% | 2% | 2% | 2% | - | 4% | 1% | 1% | 2% | 2% | 2% | 2% | 1% |
| Education | 2% | 2% | 1% | 3% | 1% | 1% | 1% | 2% | 2% | 3% | 1% | 1% | 2% | 1% | 3% |
| Nature / Wilderness / Wildlife | 2% | 2% | 1% | 2% | 2% | 3% | 2% | 2% | 2% | 2% | 2% | 2% | 1% | 1% | 2% |
| Good environment (air and water) | 2% | 1% | 1% | 2% | 1% | 2% | 3% | 1% | 2% | 1% | 2% | 2% | 1% | 2% | 2% |
| Unity | 1% | 2% | <1% | 2% | 1% | 1% | 1% | 1% | 2% | 2% | 1% | 1% | 2% | 1% | 1% |
| Community / Sense of community | 1% | 1% | 1% | 2% | 1% | 1% | 1% | 3% | 1% | 1% | 1% | 1% | 1% | 1% | 1% |
| Generous / Giving | 1% | 1% | 1% | 1% | 1% | 2% | 1% | 1% | 1% | 1% | 2% | 1% | 2% | 1% | 1% |
| Hockey / Sports teams / Tim Hortons / Maple/maple syrup / Poutine | 1% | 1% | 1% | 1% | 1% | 1% | 1% | 3% | 2% | 1% | <1% | 1% | <1% | 2% | 1% |
| Natural resources | 1% | 1% | 2% | 1% | <1% | 2% | 1% | 1% | 1% | 1% | 2% | 1% | 1% | 1% | 1% |
| Happy / Happiness | 1% | 1% | <1% | 1% | 1% | 1% | - | 1% | 1% | 1% | 1% | 1% | 1% | 1% | 1% |
| Other | 4% | 2% | 5% | 3% | 4% | 4% | 4% | 4% | 2% | 4% | 3% | 4% | 5% | 4% | 4% |
| None / Nothing / No particular reason | 1% | 1% | 2% | 1% | 2% | 1% | 2% | 1% | 1% | 2% | 1% | 1% | 1% | 2% | 1% |
| Don’t know / Refused | 2% | 2% | 2% | 2% | 2% | 3% | 4% | 2% | 2% | 3% | 2% | 3% | 2% | 2% | 2% |
Differences among ethnic groups emerged from the findings, including the following:
Indigenous Canadians were more likely to refer to history and accomplishments (11%) as a source of Canadian pride when compared to both non-racialized and racialized Canadians (2%).
Racialized respondents were more likely to cite diversity (16%) as a source of Canadian pride when compared to non-racialized respondents (9%).
Social Media Usage and Sharing
Respondents were asked to indicate the social media platforms they use at least once a month.
Nearly four in five surveyed Canadians (78%) reported using Facebook at least once a month, the most commonly used social media channel.
Respondents made considerable mention of several social media channels that they use at least once a month, including but not limited to YouTube (64%), Instagram (45%), Twitter (26%) and LinkedIn (22%).
Demographic differences among respondents who do not use social media emerged from the findings, including the following:
Less than one in ten respondents (7%) reported that they do not use social media.
Respondents over the age of 65 are more likely not to use social media at least once a month compared to all other age cohorts (15% vs. 5%).
Non-racialized Canadians were more likely not to use social media (8%) when compared to Indigenous (4%) and racialized (3%) Canadians.
Q12a: Which of the following social media channels do you use at least once a month? (Select all that apply). Base: All Respondents, n=5,173.
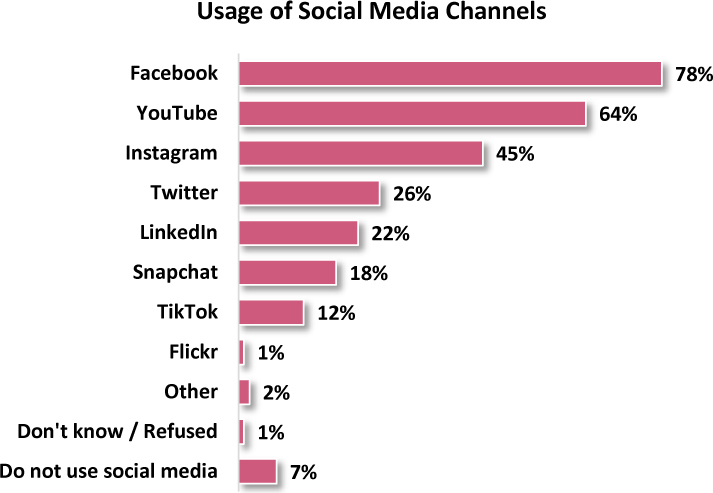
A bar chart presents the usage of social media platforms by the respondents.
A horizontal bar chart depicts the survey result on the usage of social media channels by 5,173 respondents. The percent inferred from the chart are as follows: Facebook: 78 percent; YouTube: 64 percent; Instagram: 45 percent; Twitter: 26 percent; LinkedIn: 22 percent; Snapchat: 18 percent; Tiktok: 12 percent; Flickr: 1 percent; other: 2 percent; don’t know or refused: 1 percent; and do not use social media: 7 percent.
Demographic differences among social media channels used emerged from the findings, including the following:
Surveyed Canadians aged 16 to 24 years old were more likely to report usage of all but Facebook and LinkedIn, when compared to all older age segments.
With Facebook and LinkedIn as the exceptions, as respondents age, usage of social media channels decreases compared to each younger age segment. Facebook and LinkedIn usage among respondents 16 to 24 years old is low, comparable to the usage among those at least 65 years old. Usage is higher among those 25 to 34 years old, and decreases as age increases.
Women were more likely than men to identify regular usage of Facebook (83% vs. 72%), Instagram (50% vs. 38%), SnapChat (21% vs. 15%) and TikTok (15% vs. 9%); while men were more likely to make usage of YouTube (66% vs. 62%), Twitter (29% vs. 23%) and LinkedIn (25% vs. 19%).
Q12a: Which of the following social media channels do you use at least once a month? (Select all that apply). Base: All Respondents, n=5,173.
| Region | Age | Gender | |||||||||||||
|---|---|---|---|---|---|---|---|---|---|---|---|---|---|---|---|
TOTAL (n=5,173) |
ATL (n=1,004) |
QC (n=1,001) |
ON (n=1,009) |
MB/SK (n=1,004) |
AB/BC (n=1,005) |
YK/NWT/NU (n=150) |
16-24 (n=542) |
25-34 (n=622) |
35-44 (n=891) |
45-54 (n=1,048) |
55-64 (n=950) |
65+ (n=1,120) |
M (n=2,478) |
F (n=2,669) |
|
| 78% | 83% | 84% | 76% | 74% | 74% | 77% | 76% | 85% | 82% | 78% | 73% | 73% | 72% | 83% | |
| YouTube | 64% | 65% | 60% | 66% | 62% | 64% | 67% | 82% | 70% | 69% | 64% | 59% | 49% | 66% | 62% |
| 45% | 40% | 37% | 49% | 50% | 44% | 42% | 84% | 70% | 49% | 39% | 27% | 15% | 38% | 50% | |
| 26% | 32% | 15% | 31% | 26% | 26% | 29% | 34% | 29% | 29% | 32% | 25% | 12% | 29% | 23% | |
| 22% | 16% | 18% | 26% | 15% | 22% | 23% | 16% | 30% | 27% | 26% | 20% | 13% | 25% | 19% | |
| Snapchat | 18% | 20% | 17% | 19% | 24% | 17% | 17% | 67% | 35% | 11% | 9% | 3% | 1% | 15% | 21% |
| TikTok | 12% | 12% | 13% | 12% | 12% | 12% | 11% | 45% | 18% | 10% | 8% | 3% | 1% | 9% | 15% |
| Flickr | 1% | 1% | 1% | 1% | 1% | 1% | 2% | 2% | 1% | 1% | <1% | 1% | <1% | 1% | <1% |
| Other | 2% | 2% | 1% | 2% | 3% | 2% | 2% | 3% | 2% | 2% | 2% | 2% | 2% | 2% | 2% |
| Don’t know / Refused | 1% | <1% | 1% | 1% | 1% | 1% | 1% | <1% | <1% | <1% | <1% | 1% | 1% | 1% | 1% |
| Do not use social media | 7% | 5% | 6% | 7% | 8% | 9% | 10% | 2% | 2% | 3% | 6% | 11% | 15% | 8% | 6% |
Differences among ethnic groups emerged from the findings, including the following:
Racialized Canadians were more likely to use all social media channels excluding Facebook when compared to non-racialized Canadians.
Racialized Canadians were more likely to report using Instagram on a regular basis (60%) when compared to both Indigenous (48%) and non-racialized Canadians (41%).
The same was observed for racialized Canadians using LinkedIn (31%), greater usage compared to non-racialized (19%) and Indigenous (16%) Canadians.
Q12b: Did you share your Canada Day experience on social media? Base: Respondents who use social media channels, n=4,778. Q12c: Did you use the hashtag #CanadaDay or #FêteduCanada? Base: Respondents who shared their Canada Day experience on social media, and are users of Facebook, Twitter, Instagram, LinkedIn or YouTube, n=541.
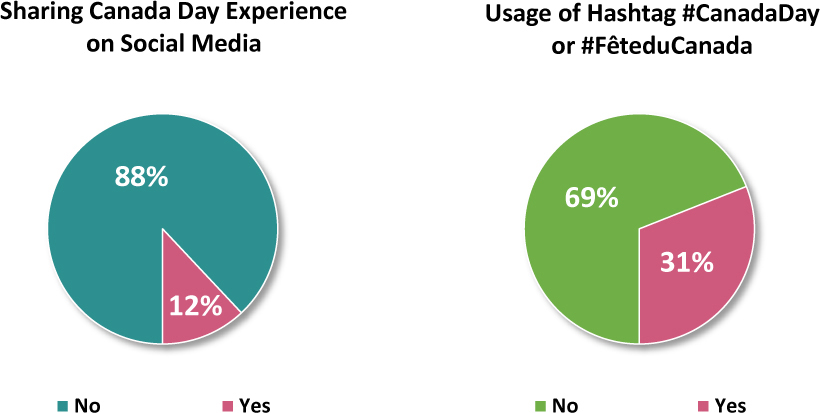
Two charts show the usage of the ‘CanadaDay’ Hashtag and percent of Canada day experience on media.
Two charts are given. The first pie chart depicts the percent of sharing of the Canada day experience by Canadians on social media. Out of the total 4,778 respondents surveyed, 12 percent shared Canada day experience on social media while 88 percent did not share the experience. The second pie chart depicts the percentage of the usage of the ‘CanadaDay’ Hashtag by Canadians. Out of the total 541 respondents surveyed, 31 percent used Hashtag, CanadaDay while 69 percent did not use the Hashtag.
Shared Experience on Social Media
More than one in ten (12%) surveyed Canadians who use at least one social media channel shared their Canada Day experience on social media.
A variety of demographic differences emerged from the findings, including the following:
As a general trend, as respondents’ age increases they are less likely to have shared their Canada Day experience on social media.
Specifically, respondents 16 to 34 years old were more likely to share their experience on social media when compared to older respondents (19% vs. 9%).
Respondents living in Quebec were less likely to share their Canada Day experience when compared to the rest of Canada (6% vs. 14%).
Racialized Canadians were more likely to share their Canada Day experience on social media (21%) when compared to both non-racialized and Indigenous respondents (10%).
Use of Hashtag #CanadaDay
Nearly one in three surveyed Canadians who shared their Canada Day experience on Facebook, Twitter, Instagram, LinkedIn or YouTube (31%), did so using the hashtag #CanadaDay or #FêteduCanada.
A variety of demographic differences emerged from the findings, including the following:
Respondents aged 65 years or older were less likely to share their experience using either of the hashtags, when compared with all younger age segments (3% vs. 34%).
Respondents living in Quebec were more likely to use the hashtag #CanadaDay or #FêteduCanada (47%), when compared to those living in Ontario (29%), the Prairies (27%), and Atlantic Canada (18%).
Men were more likely to share their Canada Day experience with the hashtag #CanadaDay or #FêteduCanada (42%), when compared to women (22%).
Racialized Canadians were more likely to use the hashtag #CanadaDay or #FêteduCanada (44%) when compared to non-racialized (22%) Canadians.
Q12b: Did you share your Canada Day experience on social media? Base: Respondents who use social media channels, n=4,778.
| Region | Age | Gender | |||||||||||||
|---|---|---|---|---|---|---|---|---|---|---|---|---|---|---|---|
TOTAL (n=4,778) |
ATL (n=948) |
QC (n=943) |
ON (n=945) |
MB/SK (n=905) |
AB/BC (n=903) |
YK/NWT/NU (n=134) |
16-24 (n=538) |
25-34 (n=608) |
35-44 (n=857) |
45-54 (n=982) |
55-64 (n=845) |
65+ (n=948) |
M (n=2,237) |
F (n=2,518) |
|
| Yes | 12% | 13% | 6% | 16% | 13% | 14% | 16% | 16% | 21% | 13% | 10% | 8% | 7% | 12% | 12% |
| No | 88% | 87% | 94% | 84% | 87% | 86% | 84% | 84% | 79% | 87% | 90% | 92% | 93% | 88% | 88% |
Q12c: Did you use the hashtag #CanadaDay or #FêteduCanada? Base: Respondents who shared their Canada Day experience on social media, and are users of Facebook, Twitter, Instagram, LinkedIn or YouTube, n=541.
| Region | Age | Gender | |||||||||||||
|---|---|---|---|---|---|---|---|---|---|---|---|---|---|---|---|
TOTAL (n=541) |
ATL (n=121) |
QC (n=48) |
ON (n=142) |
MB/SK (n=99) |
AB/BC (n=108) |
YK/NWT/NU (n=23) |
16-24 (n=75) |
25-34 (n=126) |
35-44 (n=110) |
45-54 (n=88) |
55-64 (n=71) |
65+ (n=71) |
M (n=223) |
F (n=305) |
|
| Yes | 31% | 18% | 47% | 29% | 27% | 33% | 13% | 33% | 43% | 40% | 20% | 24% | 3% | 42% | 22% |
| No | 69% | 82% | 53% | 71% | 73% | 67% | 87% | 67% | 57% | 60% | 80% | 76% | 97% | 58% | 78% |
Methodology
Report findings are based on a non-probability sample, as respondents had volunteered to participate in Government of Canada online surveys using an online panel. The data have been weighted to reflect the demographic composition of the Canadian general population. As the sample is based on those who initially self-selected for participation in the online panel, no estimates of sampling error can be calculated. All research work was conducted in accordance with the professional standards established by the Government of Canada Public Opinion Research Standards, as follows:
The survey consisted of a national online survey with Canadians, 16 years of age and older. Respondents were invited to participate through an online panel of Canadians.
Quorus collaborated with the client team at Canadian Heritage to design the survey instrument in English and translated the client-approved English version of the survey into French.
Respondents had the choice to complete the survey in English or French and were informed of their rights under the Privacy and Access to Information Acts.
The survey took on average 10 minutes to complete and consisted of mostly closed-ended questions.
Data collection occurred between July 2 and July 16, 2020, and included a pretest of 11 surveys with English respondents and 10 with French respondents. The pretest helped to assess the flow of the survey, comprehension of the questions, language, data integrity, and particularly the length of the survey.
A total of 5,173 surveys were completed using a stratified random sampling approach within the online panel of Canadian households. For this study, quotas by province were established to generate sufficient data regionally for robust analysis. Data was monitored to aim for a 50/50 gender split in each province, and that no specific age cohort was under-represented. The equivalent margin of error for a probability study would be +/- 1.36%.
Data were weighted by region, gender and age to ensure that the final distributions within the final sample mirror those of the Canadian population according to the latest Census data.
This report compares significant findings among key demographic subgroups including region, age and gender. Significant results by ethnicity have been included where appropriate with data not displayed in the tables due to spacing. For the purpose of this study, non-racialized respondents are defined as those identifying as white or Canadian. Racialized respondents are defined as those that identify as at least one or more ethnicities.
Appendices
Respondent profile
A variety of questions were asked to participants to obtain their demographic information. This information not only allowed the research team to understand the profile of those participating in the study, but also to weight the data and ensure results are representative of the population.
| Segment | Unweighted (n=5,173) |
Weighted (n=5,173) |
|---|---|---|
| Newfoundland and Labrador | 4% | 2% |
| Nova Scotia | 8% | 3% |
| Prince Edward Island | 1% | <1% |
| New Brunswick | 6% | 2% |
| Quebec | 19% | 23% |
| Ontario | 20% | 38% |
| Manitoba | 11% | 4% |
| Saskatchewan | 8% | 3% |
| Alberta | 9% | 11% |
| British Columbia | 10% | 14% |
| Yukon | 1% | <1% |
| Nunavut | 1% | <1% |
| Northwest Territories | 1% | <1% |
| Segment | Unweighted (n=5,173) |
Weighted (n=5,173) |
|---|---|---|
| 16-24 | 11% | 12% |
| 25-34 | 12% | 17% |
| 35-44 | 17% | 16% |
| 45-54 | 20% | 17% |
| 55-64 | 18% | 17% |
| 65-74 | 16% | 15% |
| 75 or older | 6% | 5% |
| Segment | Unweighted (n=5,173) |
Weighted (n=5,173) |
|---|---|---|
| Male gender | 48% | 48% |
| Female gender | 52% | 51% |
| Gender diverse | <1% | <1% |
| Prefer not to answer | <1% | <1% |
| Segment | Unweighted (n=5,173) |
Weighted (n=5,173) |
|---|---|---|
| Children age 12 or younger | 17% | 17% |
| Children 13 to 17 years old | 13% | 13% |
| I do not have children under 18 living with me | 70% | 69% |
| Prefer not to answer | 3% | 3% |
| Mean of children 12 or under | 1.55 | 1.55 |
| Mean of children 13 to 17 | 1.31 | 1.31 |
| Segment | Unweighted (n=5,173) |
Weighted (n=5,173) |
|---|---|---|
| French | 23% | 26% |
| English | 76% | 72% |
| An Indigenous language | <1% | <1% |
| Other | 6% | 7% |
| Prefer not to answer | <1% | <1% |
| Segment | Unweighted (n=5,173) |
Weighted (n=5,173) |
|---|---|---|
| Yes | 16% | 15% |
| No | 84% | 85% |
| Segment | Unweighted (n=5,173) |
Weighted (n=5,173) |
|---|---|---|
| Indigenous | 3% | 2% |
| South Asian (e.g., East Indian, Pakistani, Sri Lankan) | 4% | 5% |
| Chinese | 4% | 6% |
| Black | 2% | 2% |
| Filipino | 1% | 1% |
| Arab | 1% | 1% |
| Latin American | 1% | 1% |
| Southeast Asian (e.g., Vietnamese, Cambodian, Laotian, Thai) | 1% | 1% |
| West Asian (e.g., Iranian, Afghan) | <1% | <1% |
| Korean | <1% | <1% |
| Japanese | 1% | 1% |
| White | 80% | 76% |
| Other | 2% | 4% |
| Prefer not to answer | 2% | 2% |
| Segment | Unweighted (n=5,173) |
Weighted (n=5,173) |
|---|---|---|
| Under $20,000 | 6% | 6% |
| $20,000 to $39,999 | 13% | 13% |
| $40,000 to $59,999 | 15% | 15% |
| $60,000 to $79,999 | 13% | 13% |
| $80,000 to $99,999 | 13% | 13% |
| $100,000 to $149,999 | 17% | 17% |
| $150,000 or more | 10% | 9% |
| Prefer not to answer | 13% | 13% |
Questionnaire
Thank you for participating in this survey. Quorus Consulting Group, a Canadian market research firm, is conducting this survey on behalf of the Government of Canada. The survey will ask you questions regarding Canada Day and your feedback is important irrespective of what you did on Canada Day. The survey should take you about 10 minutes to complete.
Your participation is voluntary and completely confidential. All your answers will remain anonymous. The information provided will be managed according to the requirements of the Privacy Act. The final report on the survey will be available through Library and Archives Canada.
Vous pouvez également répondre au sondage en français.
PROV. Which province or territory do you live in?
Newfoundland and Labrador 1
Nova Scotia 2
Prince Edward Island 3
New Brunswick 4
Quebec 5
Ontario 6
Manitoba 7
Saskatchewan 8
Alberta 9
British Columbia 10
Yukon 11
Nunavut 12
Northwest Territories 13
Don’t know/Prefer not to answer 99
AGE. Please indicate in which of the following age categories you belong?
16 - 24 1
25 - 34 2
35 - 44 3
45 - 54 4
55 - 64 5
65 - 74 6
75 or older 7
Prefer not to answer 9
GENDER. What is your gender?
Male gender 1
Female gender 2
Gender diverse 3
Prefer not to answer 9
1a. This year, various Canada Day programming presented by the Government of Canada was “virtual” – in other words it was activities on the Web, televised and streamed online through a range of social media platforms. Over the past few weeks, have you seen, read or heard any Government of Canada advertising about the 2020 virtual Canada Day celebrations?
Yes 1
No [Go to 2a] 2
1b. Where did you see, read or hear Government of Canada advertising about the 2020 virtual Canada Day celebration? (Select all that apply)
[Randomize the order of response choices 1 to 13]
Internet website 1
Magazines 2
A daily newspaper 3
A community or weekly newspaper 4
Outdoor billboards 5
Radio 6
Television 7
Facebook 8
Twitter 9
YouTube 10
Instagram 11
A general Google search 12
On the Government of Canada website specifically 13
Other (please specify): _________ 77
Can’t remember 98
Don’t know / Prefer not to answer 99
2a. Did you look for any information related to how and where you could celebrate Canada Day this year?
Yes 1
No [Go to 3a] 2
2b. When looking for information about Canada Day this year, what sources did you use? (Select all that apply)
[Randomize the order of response choices 1 to 14]
Internet website 1
Magazines 2
A daily newspaper 3
A community or weekly newspaper 4
Outdoor billboards 5
Radio 6
Television 7
Facebook 8
Twitter 9
YouTube 10
Instagram 11
TikTok 12
A general Google search 13
On the Government of Canada website specifically 14
Other (please specify): _____ 77
Can’t remember 98
Don’t know / Prefer not to answer 99
3a. Did you celebrate Canada Day this year in any way?
Yes [Go to 4a] 1
No 2
3b. What is the main reason you did not celebrate Canada Day this year?
[Open Text Box Field]
Don’t know/Prefer not to answer 99
4a. Please indicate if you watched/participated in any of the following Government of Canada special programming: (Select all that apply)
National Day Time Virtual Show on CBC platforms 1
National Day Time Virtual Show through social media (e.g. YouTube, Facebook, Instagram) 2
National Evening Virtual Show on CBC platforms 3
National Evening Virtual Show through social media (e.g. YouTube, Facebook, Instagram) 4
Special Canada Day Web videos (Let’s Cook Together!; Let’s Get Active Together!; Let’s Innovate Together!; Let’s Discover Together!; and Let’s Celebrate Together!) 5
Canada Day virtual fireworks 6
None of the above [Go to Q5a] 9
4b. For each specific Canada Day programming that you watched or in which you participated, how did your level of pride in Canada change, if at all?
[Display items selected in 4a]
National Day Time Virtual Show (on CBC television or online)
National Evening Virtual Show (on CBC television or online)
Special Canada Day Web Videos (Let’s Cook Together!; Let’s Get Active Together!; Let’s Innovate Together!; Let’s Discover Together!; and Let’s Celebrate Together!)
Canada Day virtual fireworks
Increased a lot 1
Increased moderately 2
Increased a little 3
No change/Did not make me feel more or less proud 4
Decreased a little 5
Decreased moderately 6
Decreased a lot 7
Don’t know 9
4c. Please indicate your level of satisfaction with the Government of Canada’s Canada Day programming that you watched/participated in:
Note: You can hover over each item listed below to see additional information.
[Display items selected in 4a] [Text in brackets to show when respondent hovers over each item]
National Day Time Virtual Show (on CBC television or online)
National Evening Virtual Show (on CBC television or online)
Special Canada Day Web Videos (Let’s Cook Together!; Let’s Get Active Together!; Let’s Innovate Together!; Let’s Discover Together!; and Let’s Celebrate Together!)
Canada Day virtual fireworks
Very satisfied 1
Somewhat satisfied 2
Neither satisfied, nor dissatisfied 3
Somewhat dissatisfied 4
Very dissatisfied 5
Don’t know 9
4d. How else did the Canada Day programming you watched make you feel? Please select at least one but no more than three answers from the list below: (Select up to three responses)
[Randomly present response choice 1 to 12]
Joyful 1
Mad 2
Entertained 3
Bored 4
Proud 5
Ashamed 6
Inspired 7
Indifferent 8
Satisfied 9
Dissatisfied 10
Represented 11
Ignored 12
None of the above 88
Don’t know 99
5a. Please indicate if you used any of the free Canada Day tools offered by the Government of Canada listed below:
Canada Day Online Celebration Kit 1
Canada Day playlists 2
Did not use any of these free tools [Go to Q6] 9
5b. Please indicate your level of satisfaction with the free Canada Day tools that you used.
[Display items selected in 5a]
Canada Day Online Celebration Kit
Canada Day playlists
Very satisfied 1
Somewhat satisfied 2
Neither satisfied, nor dissatisfied 3
Somewhat dissatisfied 4
Very dissatisfied 5
Don’t know 9
[SKIP Q6 IF Q1a=”NO” AND Q4a=”None of the above” AND Q5a=”Did not use any of these free tools”]
6. Many sponsors/partners contributed to help make this programming happen. Which sponsors do you recall seeing or hearing about during the Canada Day programming presented by the Government of Canada?
[Open Text Box Field]
Cannot remember any sponsors 99
7. This year, for the first time, the Government of Canada developed new ways to help you enjoy Canada Day at home. What could they do to improve virtual celebrations in the future?
[Open Text Box Field]
Don’t know/Prefer not to answer 99
8. Did you watch or participate in any virtual Canada Day programs offered by other organizations such as municipalities, provincial governments, museums and other private organizations?
Yes 1
No 2
9. Did you celebrate Canada Day in any other ways? If so, please briefly describe what you did.
[Open Text Box Field]
No – I did not celebrate Canada Day in any other ways 99
10. How proud are you to be Canadian?
Very proud 1
Proud 2
Somewhat proud 3
Not very proud [Go to Q12a] 4
Not proud at all [Go to Q12a] 5
I am not a Canadian citizen [Go to Q12a] 6
Don’t know [Go to Q12a] 9
11. What makes you proud to be Canadian?
[Open Text Box Field]
12a. Which of the following social media channels do you use at least once a month? (Select all that apply)
Facebook 1
Twitter 2
Instagram 3
Tik Tok 4
LinkedIn 5
Snapchat 6
Flickr 7
YouTube 8
Other (please specify): ________________ 77
Do not use social media 99 [Exclusive]
12b. [Asked only to those that use social media channels.] Did you share your Canada Day experience on social media?
Yes 1
No 2
12c. [Asked only to those that shared Canada Day experience on social media in Q12b, and selected Facebook, Twitter, Instagram, LinkedIn, or Youtube in Q12a] Did you use the hashtag #CanadaDay or #FêteduCanada?
Yes 1
No 2
The last few questions are strictly for statistical purposes. All of your answers are completely confidential.
13. What is your postal code?
[Open Text Box Field]
Don’t know/Prefer not to answer 99
14. Would you be willing to share just the first 3 digits of your postal code instead?
[Open Text Box Field]
Don’t know/Prefer not to answer 99
15. What language do you speak most often at home? (Select all that apply)
French 1
English 2
An Indigenous language 3
Other 8
Prefer not to answer 9
16. Do you identify as a person with a disability? A person with a disability is a person who has a long-term or recurring impairment such as vision, hearing, mobility, flexibility, dexterity, pain, learning, developmental, memory or mental health-related impairments which limits their daily activities inside or outside the home such as at school, work, or in the community in general.
Yes 1
No 2
17. The following question collects information in accordance with the Employment Equity Act and its Regulations and Guidelines to support programs that promote equal opportunity for everyone to share in the social, cultural, and economic life of Canada.
Are you:
Indigenous 1
South Asian (e.g., East Indian, Pakistani, Sri Lankan) 2
Chinese 3
Black 4
Filipino 5
Arab 6
Latin American 7
Southeast Asian (e.g., Vietnamese, Cambodian, Laotian, Thai) 8
West Asian (e.g., Iranian, Afghan) 9
Korean 10
Japanese 11
White 12
Other – please specify: _____________ 77
Prefer not to answer 99
18. Please specify the number of children living at home with you in the following age categories:
# of children age 12 or younger ______
# of children 13 to 17 years old ______
I do not have children under 18 living with me 88
Prefer not to answer 99
19. Which of the following categories best describes your total household income in 2019? That is, the total of all persons in your household combined, before taxes.
Under $20,000 1
$20,000 to $39,999 2
$40,000 to $59,999 3
$60,000 to $79,999 4
$80,000 to $99,999 5
$100,000 to $149,999 6
$150,000 or more 7
Prefer not to answer 9
PRETEST QUESTIONS [TO BE REMOVED AFTER COMPLETING PRETEST]:
The survey you just finished is one of the very first we have done for this survey, please answer the following few questions to help us improve the survey.
P1. Overall, how would you rate the extent to which the questions in this survey were easy to understand? Please use a scale from 0 to 10 where 0 means “very difficult”, and 10 means “very easy”.
P2. [IF P1 IS LESS THAN 8] Please tell us why you gave this rating to the survey. What specific questions or words did you find difficult to understand?
P3. Approximately, how long did it take you to complete the survey?
______ minutes
This concludes the survey. Your answers have been submitted. Thank you for your participation!