Prepared for Sport Canada, Department of Canadian Heritage
Supplier: Ekos Research Associates Inc.
Contract Number: C1111-180883/001/CY
Contract Value: $69,938.98
Award Date: December 13, 2018
Delivery Date: August 28, 2020
Registration Number: POR 091-18
For more information on this report, please contact Canadian Heritage at por-rop@pch.gc.ca
Ce rapport est aussi disponible en français
2019-20 Status of the High Performance Athlete
Final Report
Prepared for Sport Canada, Department of Canadian Heritage
Supplier: Ekos Research Associates Inc.
Supplier name: Ekos Research Associates Inc.
Date: August 2020
This public opinion research report presents the results of an online survey conducted by Ekos Research Associates Inc. on behalf of Sport Canada (Canadian Heritage). The research study was conducted with 846 Canadian high performance athletes, as well as 84 National Team Coaches and High Performance Directors and 13 Presidents and Athlete Service Managers of Canadian Sport Institutes between March 2019 and February 2020.
Cette publication est aussi disponible en français sous le titre : La situation de l'athlète de haut niveau en 2019-2020 : rapport final.
This publication may be reproduced for non-commercial purposes only. Prior written permission must be obtained from Public Services and Procurement Canada. For more information on this report, please contact Public Services and Procurement Canada at: tpsgc.questions-questions.pwgsc@tpsgc-pwgsc.gc.ca or at: Canadian Heritage at por-rop@pch.gc.ca
Communications Branch
Public Services and Procurement Canada
Portage III Tower A
16A1-11 Laurier Street
Gatineau QC K1A 0S5
Catalogue Number:
CH24-50/2020E-PDF
International Standard Book Number (ISBN):
978-0-660-35418-7
Related publications (registration number: POR 130-16):
© Her Majesty the Queen in Right of Canada, as represented by the Minister of Public Works and Government Services, 2020
This report represents the sixth study of high performance athletes since the early 90's. As was the case with the previous studies in 1992, 1997, 2004, 2009, and 2014 the primary goal is to gather information from various sport stakeholders in order to paint a current picture of the characteristics of high-performance athletes. The original 1992 study provided a comprehensive examination of athletes' sport, social and economic characteristics and was a key contributor to the development of athlete support policies at Sport Canada. Each report has drawn upon multiple lines of evidence collected from carded athletes, coaches and National Sport Organizations, updating information collected from previous research. A key objective of the research is to provide a picture the costs of sport and the needs of athletes with respect to assistance through Sport Canada's Athlete Assistance Program.
This survey of high performance athletes builds on much of the data from the earlier studies. The specific areas of investigation include:
This project involved three individual lines of evidence with different target populations. The employed methodologies included:
In each case, a census approach was taken (i.e., attempts were made to include all members of the population). Since no sampling was conducted, a margin of error is also not applicable to the results. In each survey, sizable and representative proportions of the population were captured in the survey, and results are therefor considered projectable to the broader population.
The survey of athletes was designed as a self-administered, web-based survey. All 1,955 high-performance athletes carded at the time of the survey were invited to participate and every attempt was made to reach as many of these athletes as possible. Specifically, Sport Canada circulated advance communications to athletes, National Sport Organizations and Canadian Sport Centres, and communicated with National Sport Organizations at several intervals throughout the data collection period. National Sport Organizations and Canadian Sport Centres were also sent an announcement to distribute or post on their social media feeds. Ekos, who conducted the study under contract for Canadian Heritage, also offered a cash lottery draw as an incentive to respond. Additional e-mail reminders were issued over several months, as well as reminder calls made to more than 1,000 non-responding athletes by telephone at two separate intervals (July 2019 and February 2020 prior to the close of the survey collection). The survey was conducted between March 2019, and end of February 2020, collecting 846 completed interviews. The overall response rate for the survey, out of the athlete pool for which there was full, valid contact information is 44%, which is lower than the 51% achieved in 2014, but similar to the 46% achieved in 2009.
Over the course of the 12 months a total of seven attempts were made by email to remind all non-responding athletes.
The survey instrument relied on previous questionnaire (2014), although some revisions were made to reduce the overall length of the survey. The questionnaire focused on the areas of investigation already cited and included some of the questions that were asked of athletes in the 1992, 1997, 2004 and 2009 surveys of high-performance athletes in order to track changes in status and experiences. Prior to the survey start-up, the instrument was tested with 15 athletes in English and French and changes were made to the wording, programming, and language as needed. The average time to complete the interview was 25 minutes.
Based on a review of the complete set of records (1,955 carded athletes as of February 2019), a weighting scheme was applied to increase the representativeness of the final sample of 846 athletes, based on type of sport (team/individual), by card level, and by gender.
The second component of the study involved an online survey of 84 National Team Coaches and High Performance Directors (of the 143 that were invited to participate from a list provided by Sport Canada). The online survey required an average of 25 minutes to complete. The survey data was collected during the same data collection period as that of the CSC Presidents/Service Managers and athletes. All respondents received an e-mail invitation as well as several reminders. Calls were also made by telephone to all non-respondents in the month prior to the close of the survey. The overall survey collection took place between March 2019 and late February 2020. The response rate for the survey was 59 per cent.
The third data collection activity for this project was a small survey conducted online with the seven Presidents and 11 Athlete Service Managers of the four CSIs (Quebec, Ontario, Calgary, and Pacific) and three CSCs (Atlantic, Manitoba, and Saskatchewan). All contact information on potential respondents (name, organization, and telephone number) was provided by Sport Canada, who also helped determine which staff to survey. Some of the questions in the survey questionnaire were qualitative, open-ended in nature and others were closed ended. Each questionnaire took an average 25 minutes to complete. The questionnaire was administered over the same data collection period as that of the athletes and coaches. Of the 18 individuals invited, 13 responded (i.e., 72 per cent).
According to survey results most athletes are motivated largely by enjoyment of their sport, pursuit of excellence, and a sense of personal fulfillment, rather than by recognition or monetary gains. Desire to win, however, is also a strong motivator. Only 18% of athletes said that they are in it to pursue a professional career in sport which is in line with the 13% to 15% found in 2009 and 2014.
As seen in previous years, high performance athletes continue to exhibit high levels of satisfaction with their career as a high performance athlete. Virtually all athletes said that they are content with the level of enjoyment they get from their sport, and nine in ten are satisfied with their confidence in experiencing a sport that is safe, and free of both performance enhancing drugs and violence. Over eight in ten are satisfied with their level of performance and an environment that is free from abuse. Only slightly fewer are content with the respect with which they are treated and satisfied that their sport environment is fair and inclusive. Satisfaction with recognition received is modest with only six in ten saying they are satisfied, although it has climbed significantly from 2004, and remained steady since 2009. There is considerable dissatisfaction, however, with regards to income/material rewards, where fewer than four in ten are satisfied and a higher proportion is dissatisfied than satisfied. That being said, satisfaction levels with income/material rewards have climbed since 1992 when only 16% were satisfied.
As found in 2009 and 2014, findings from the athletes' survey show that although the majority of athletes (two in three) have individual, formalized plans for their development, there is a sizable proportion that do not. Of the respondents who have a written plan, one in three were drawn up by the national team coach, one in four were created by a personal coach and in nearly one in ten cases (9%) athletes developed their own plan. Six in ten athletes indicate a high degree of satisfaction with their involvement in their development of the training and competition plan. Just over six in ten athletes indicate high levels of satisfaction with their plan overall, although athletes without personal coaches are also less often satisfied with it.
Nearly half of athletes have a principal coach who is employed by their National Sport Organization (NSO) on a full-time basis. One in four athletes follow the direction of a personal coach who is not employed or contracted by their NSO. Athletes spent an average of 19 hours per week with a coach out of the 34 hours a week that athletes spend in training. Findings point to a reasonably high level of satisfaction with both the overall quality of the coaching and the technical expertise demonstrated by their coaches, although satisfaction with the overall quality of coaching has declined since 2009 (68% and 67% in 2019 and 2014 respectively, versus 74% in 2009). Results are marginally weaker, in terms of satisfaction with the time the coaches spend with their athletes with only just over half of athletes expressing satisfaction with this indicator.
The majority of athletes (two out of three) feel that they are adequately supported in terms of the training experience, quality of training and type of competition experience. Six in ten rate the adequacy of access to training facilities high, an increase to 61% from 54% in 2014. Over half rate the amount of competition they are getting or the sport science and medicine they are getting highly. The financial support that athletes receive is rated much lower, with only one in four saying it is adequate and half saying it is moderately adequate. Results are largely on par, however, with those found in 2014 and 2009. Coaches provide generally lower responses than athletes, particularly in the areas of access to high quality training facilities and the amount of competition experience.
Similar to 2014, just over half of athletes say they have been able to access all the needed sport science and sport medicine services from their CSC. CSC sport science services rated most important by both athletes and coaches surveyed are strength and conditioning, nutrition, and sport psychology. The importance of skill and technique analysis increased to 66% from 57% in 2014. Coaches largely place a higher importance on each service, particularly strength and conditioning, and sport psychology. When asked about services in need of improvement, as with 2014, there is a diverse response across a range of services, with no one or two standing out strongly. Among coaches, far fewer identify the need to improve sport psychology as reported in 2014.
Athletes report that of sport medicine services provided by CSCs, massage and physiotherapy are the most highly valued.
Carded athletes reported an average annual income of $28,858 for 2018. The largest proportion of this income is derived from Federal and/or Provincial athlete assistance. The average is $13,613 annually from Sport Canada's Athlete Assistance Program (AAP) and $3,689 from Provincial Assistance. Smaller proportions of athletes' incomes are derived from employment income ($10,074 annually), sport-related sources ($5,218), and sports awards ($1,264). Only a small proportion is derived from the National Sport Organization ($864) or other sources combined ($1,143 annually). The 2018[1] annual average personal income for high performance athletes is exactly the same as the 2013-14 annual income and lower than reported in 2009 when these income figures are adjusted for inflation to 2019 constant dollars.
Expenses, on the other hand, are close to $4,400 per month and have increased more than 15% since 2013-14, and nearly 30% since 2009. In particular, shelter costs have increased considerably (over 35%), followed by both living expenses and sport-related expenses, which have gone up by about 15% since 2013-14. Overall, athletes are spending over $600 a month more in 2018 than they were in 2013-14, which is nearly double the $300 increase between 2009 and 2013-14.
This picture of increasing expenses but stable income leaves athletes facing a deficit of $1,800 per month, or close to $22,000 a year. This is a considerable increase in the deficit athletes reported in 2013-2014 ($15,300 in 2019 constant dollars), and in 2009 ($6,100 in 2019 constant dollars).
In terms of personal debt, almost one in five athletes said that they have incurred some level of repayable debt in the pursuit of their athletic career, which is on par with 2014 and lower than the 24% in 2009. Loans from family and credit cards are at the top of the list, followed by loans to financial institutions and then student loans. When loan amounts are added together they amount to an average of just under $4,300 in repayable debt across all athletes, which is lower than reported in 2013/14 (closer to $8,000), suggesting that non-repayable support has increased from parents, spouses and other family members.
Athletes reported that they rely heavily on Sport Canada's AAP as the most prevalent source of financial support; according to three in four athletes, as was also the case in 2014 and 2009. This is followed at a distance by a reliance on family and/or Provincial AAP; key sources for just over four in ten athletes in each case.
Although athletes are operating in the red, money is typically not a large barrier to accessing most of the basic necessities and things that athletes need to concentrate on and excel in their sport. That being said, some athletes (about one in five) see money as a strong barrier to international competitions and sport medicine services.
Over four in five athletes agree that the AAP has made it possible to achieve higher levels of athletic performance. Coaches were in relatively similar agreement at 86%. Less than half of athletes report that the AAP is assisting (or has assisted) them in pursuing post-secondary education. Three in four coaches, however, agree. A less strong, but still relatively positive result: two in five athletes agree that the funding by AAP is sufficient to meet living and training needs, which has continually increased from just under one in four in 2004. It is interesting to note that one in four athletes say that they received their funding too late in their career. This level of agreement has decreased steadily over time, however, from 38% in 2004.
Most athletes are aware that Tuition and Deferred Tuition support can be applied to coaching courses (just under three in four). Only about six in ten athletes are aware of the three supplementary support measures that have been changed in AAP benefits (allowance for Paralympic athletes, excellence living and training allowance, and child dependent allowance). Further, only one in four are aware that the tuition and deferred tuition includes $5,500 per carding cycle and a lifetime maximum of $26,500.
The main contact for athletes receiving AAP support is their NSO, however, from time to time athletes contact AAP staff for information about the Program or questions regarding the benefits of the Program. Similar to 2014 results, one in three athletes have contacted this part of Sport Canada in the past 12 months, primarily for financial issues (primarily tuition or payments), which has remained higher than the 22% reported in 2009. When contacting AAP staff, email is the most prevalent method of contact (by nearly nine in ten). Satisfaction with service is very high among athletes that have contacted Sport Canada's AAP staff in the recent past. Virtually all athletes (88%) indicate that they were satisfied or very satisfied with the overall quality of service they received when contacting Sport Canada. Similarly, nine in ten coaches were satisfied or very satisfied with the overall quality of service from AAP staff.
Detailed findings are presented in the sections that follow. Overall results are presented in the main portion of the narrative and are typically supported by graphic or tabular presentation of results. Bulleted text is also used to point out any statistically and substantively significant differences between sub-groups of respondents. If differences are not noted in the report, it can be assumed that they are either not statistically significant[2] in their variation from the overall result or that the difference was deemed to be substantively too small to be noteworthy. The programmed survey instruments can be found in the appendices.
Results for the proportion of respondents in the sample who either said “don't know” or did not provide a response may not be indicated in the graphic representation of the results in all cases, particularly where they are not sizable (e.g., 10% or less). Results may also not total to 100% due to rounding.
The contract value for the POR project is $69,938.98 (including HST).
Supplier Name: Ekos Research Associates
PWGSC Contract Number: C1111-180883/001/CY
Contract Award Date: December 13, 2018
To obtain more information on this study, please e-mail por-rop@pch.gc.ca
I hereby certify as Senior Officer of Ekos Research Associates Inc. that the deliverables fully comply with the Government of Canada political neutrality requirements outlined in the Communications Policy of the Government of Canada and Procedures for Planning and Contracting Public Opinion Research.
Specifically, the deliverables do not include information on electoral voting intentions, political party preferences, standings with the electorate, or ratings of the performance of a political party or its leaders.
Signed by:
Susan Galley (Vice President)
The following table provides details on the sample of athletes represented in this report. The comparison shows that the sample is well aligned with the population on all parameters. The sample is weighted to restore it to population proportions in terms of gender, type of sport (individual/team), class (Olympic, Paralympic and Non-Olympic), as well as preferred language. That is, where the number of athletes responding to the survey in a certain category was higher or lower than expected given the number in the full universe of carded athletes, a weight was applied to the cases so that across the entire sample, they accounted for the expected proportion of respondents.
The table also compares the sample distribution in 2019-20 with the sample collected in 2013-2014. By and large the samples are very similar. There are more summer athletes in the current population and sample relative to 2014. There are also slightly fewer athletes who are between the ages of 20 and 24.
| Col1 | 2019-2020 Population n=1,955 | 2019-2020 Unweighted Sample n=846 | 2014 Population n=1,973 | 2014 Unweighted Sample n=967 | ||||
|---|---|---|---|---|---|---|---|---|
| # | % | # | % | # | % | # | % | |
| Season | ||||||||
| Summer | 1,368 | 70 | 584 | 69 | 1,510 | 77 | 726 | 75 |
| Winter | 587 | 30 | 262 | 31 | 463 | 24 | 241 | 25 |
| Sport Type | ||||||||
| Individual | 1,218 | 62 | 542 | 64 | 1,177 | 60 | 622 | 64 |
| Team Sport | 737 | 38 | 304 | 36 | 796 | 40 | 345 | 36 |
| Sport Class | ||||||||
| Olympic | 1,649 | 84 | 697 | 82 | 1,583 | 80 | 762 | 79 |
| Paralympic | 285 | 15 | 137 | 16 | 291 | 15 | 157 | 16 |
| Non-Olympic | 21 | 1 | 12 | 1 | 98 | 5 | 47 | 5 |
| Carding Level | ||||||||
| D | 874 | 45 | 374 | 44 | 886 | 45 | 382 | 40 |
| C1 | 165 | 8 | 67 | 8 | 182 | 9 | 100 | 10 |
| SR | 549 | 28 | 245 | 29 | 475 | 24 | 244 | 25 |
| SR1/2's | 367 | 19 | 160 | 19 | 428 | 22 | 241 | 25 |
| Gender | ||||||||
| Male | 983 | 50 | 379 | 45 | 1,024 | 52 | 472 | 49 |
| Female | 972 | 50 | 467 | 55 | 948 | 48 | 493 | 51 |
| Language | ||||||||
| English | 1,666 | 85 | 739 | 87 | 1,677 | 85 | 807 | 83 |
| French | 289 | 15 | 107 | 13 | 195 | 15 | 159 | 16 |
| Age | ||||||||
| <20 | 342 | 18 | 163 | 19 | -- | -- | 137 | 14 |
| 20-24 | 679 | 35 | 262 | 31 | -- | -- | 365 | 38 |
| 25-29 | 519 | 27 | 215 | 25 | -- | -- | 260 | 27 |
| 30+ | 401 | 21 | 203 | 24 | -- | -- | 202 | 21 |
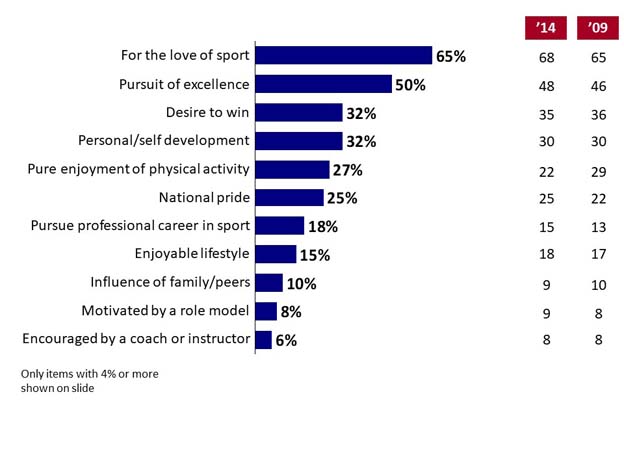
Athletes responding to the survey were asked to identify the top three factors in their decision to pursue an athletic career. As was found in previous surveys, responses suggest that most athletes are motivated largely by enjoyment of their sport and a sense of personal fulfilment, rather than by recognition or monetary gains. Two in three athletes (65%) identified love of the sport as one of their primary motivations for becoming a high performance athlete and half (50%) cited the pursuit of excellence. A compelling desire to win was also listed by one in three (32%) as a major factor in their career choice, as was personal development. Pure enjoyment of physical activity (27%, an increase from 22% in 2014, but closer to the 29% reported in 2009) and national pride (25%) are key for about one in four. Pursuit of a professional career in sport was noted by 18% of athletes and 15% said they enjoy the lifestyle. Influences of others (family, peers, coach or a role model) are also important influencers for a sizable proportion of athletes (24% when combined). Money/material rewards, and fame and glory were only indicated by two and three percent respectively (not shown in chart).
Motives are similar to those found in previous years (i.e., 1992 through 2004), however, results are not directly comparable as the method of administration was changed in 2009. The love of sport, pursuit of excellence and desire to win have traditionally been the top three motives since 1992. Personal development, national pride, pure enjoyment of physical activity and enjoyable lifestyle have traditionally also been at a middle tier, although national pride may have moved up slightly as a motive cited by a moderate number of athletes. Influence of others have always been among the least likely to motivate athletes.
Q1. There are a number of reasons why a person might become a high performance athlete. Which of the following are the top three factors in your decision to pursue an athletic career?
Base: n=846
2019 '14 '09
The 846 respondents in the 2019 survey responded as follows:
For the love of sport, 65%
Pursuit of excellence, 50%
Desire to win, 32%
Personal/self development, 32%
Pure enjoyment of physical activity, 27%
National pride, 25%
Pursue professional career in sport, 18%
Enjoyable lifestyle, 15%
Influence of family/peers, 10%
Motivated by a role model, 8%
Encouraged by a coach or instructor, 6%
Only items with 4% or more shown on slide
The respondents in the 2014 survey responded as follows:
For the love of sport, 68%
Pursuit of excellence, 48%
Desire to win, 35%
Personal/self development, 30%
Pure enjoyment of physical activity, 22%
National pride, 25%
Pursue professional career in sport, 15%
Enjoyable lifestyle, 18%
Influence of family/peers, 9%
Motivated by a role model, 9%
Encouraged by a coach or instructor, 8%
Only items with 4% or more shown on slide
The respondents in the 2009 survey responded as follows:
For the love of sport, 65%
Pursuit of excellence, 46%
Desire to win, 36%
Personal/self development, 30%
Pure enjoyment of physical activity, 29%
National pride, 22%
Pursue professional career in sport, 13%
Enjoyable lifestyle, 17%
Influence of family/peers, 10%
Motivated by a role model, 8%
Encouraged by a coach or instructor, 8%
Only items with 4% or more shown on slide
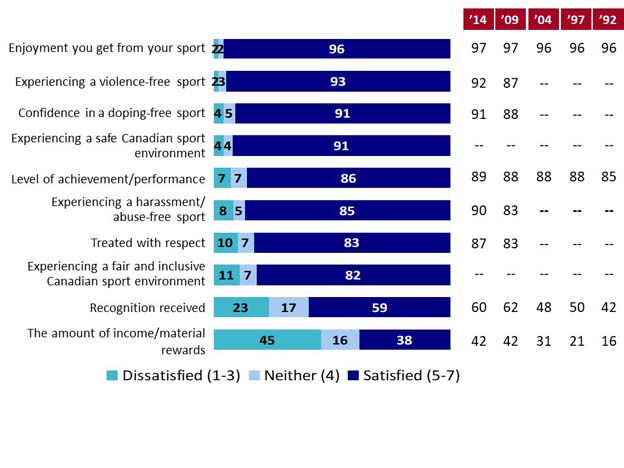
As seen in previous years, high performance athletes continue to exhibit high levels of satisfaction with their athletic career. Virtually all athletes (96%) said that they are content with the level of enjoyment they get from their sport. Approximately nine in ten respondents expressed satisfaction with their confidence in experiencing a sport that is free of violence (94%), performance enhancing drugs (91%), and experiencing a safe sport environment (91%; new item in 2019). Only slightly fewer (86%) are satisfied with their level of performance, and a sport environment that is free from harassment and abuse (85%, although down from 90% in 2014, but similar to levels in 2009). Respectful treatment is also an area where 83% indicated satisfaction, although this is down marginally from 87% in 2014, but on par with 2009. Similarly, 82% said they are satisfied with the extent to which they feel they are in a fair and inclusive sport environment.
As in 2009 and 2014, when a similar wording was used, athletes expressed moderate satisfaction with the recognition they receive (59%). Meanwhile, significant levels of dissatisfaction are only present with regards to income/material rewards, where only 38% are satisfied, and a higher proportion (45%) is dissatisfied. Although never high, satisfaction with income may be slipping back towards levels found in 2004 and earlier.
Q2a-j. To what extent are you satisfied with the following aspects of your experience in high performance sport?
Base: n=846
The 846 respondents in the 2019 survey responded as follows:
Enjoyment you get from your sport
Dissatisfied (1-3), 2%
Neither (4), 2%
Satisfied (5-7), 96%
The respondents responded as follows in previous years (satisfied 5-7):
2014, 97%
2009, 97%
2004, 96%
1997, 96%
1992, 96%
The 846 respondents in the 2019 survey responded as follows:
Experiencing a violence free sport
Dissatisfied (1-3), 2%
Neither (4), 3%
Satisfied (5-7), 93%
The respondents responded as follows in previous years (satisfied 5-7):
2014, 92%
2009, 87%
2004, --
1997, --
1992, --
The 846 respondents in the 2019 survey responded as follows:
Confidence in a doping free sport
Dissatisfied (1-3), 4%
Neither (4), 5%
Satisfied (5-7), 91%
The respondents responded as follows in previous years (satisfied 5-7):
2014, 91%
2009, 88%
2004, --
1997, --
1992, --
The 846 respondents in the 2019 survey responded as follows:
Experiencing a safe Canadian sport environment
Dissatisfied (1-3), 4%
Neither (4), 4%
Satisfied (5-7), 91%
The respondents responded as follows in previous years (satisfied 5-7):
2014, --
2009, --
2004, --
1997, --
1992, --
The 846 respondents in the 2019 survey responded as follows:
Level of achievement/performance
Dissatisfied (1-3), 7%
Neither (4), 7%
Satisfied (5-7), 86%
The respondents responded as follows in previous years (satisfied 5-7):
2014, 89%
2009, 88%
2004, 88%
1997, 88%
1992, 85%
The 846 respondents in the 2019 survey responded as follows:
Experiencing a harassment/abuse-free sport
Dissatisfied (1-3), 8%
Neither (4), 5%
Satisfied (5-7), 85%
The respondents responded as follows in previous years (satisfied 5-7):
2014, 90%
2009, 83%
2004, --
1997, --
1992, --
The 846 respondents in the 2019 survey responded as follows:
Treated with respect
Dissatisfied (1-3), 10%
Neither (4), 7%
Satisfied (5-7), 83%
The respondents responded as follows in previous years (satisfied 5-7):
2014, 87%
2009, 83%
2004, --
1997, --
1992, --
The 846 respondents in the 2019 survey responded as follows:
Experiencing a fair and inclusive Canadian sport environment
Dissatisfied (1-3), 11%
Neither (4), 7%
Satisfied (5-7), 82%
The respondents responded as follows in previous years (satisfied 5-7):
2014, --
2009, --
2004, --
1997, --
1992, --
The 846 respondents in the 2019 survey responded as follows:
Recognition received
Dissatisfied (1-3), 23%
Neither (4), 17%
Satisfied (5-7), 59%
The respondents responded as follows in previous years (satisfied 5-7):
2014, 60%
2009, 62%
2004, 48%
1997, 50%
1992, 42%
The 846 respondents in the 2019 survey responded as follows:
The amount of income/material rewards
Dissatisfied (1-3), 45%
Neither (4), 16%
Satisfied (5-7), 38%
The respondents responded as follows in previous years (satisfied 5-7):
2014, 42%
2009, 42%
2004, 31%
1997, 21%
1992, 16%
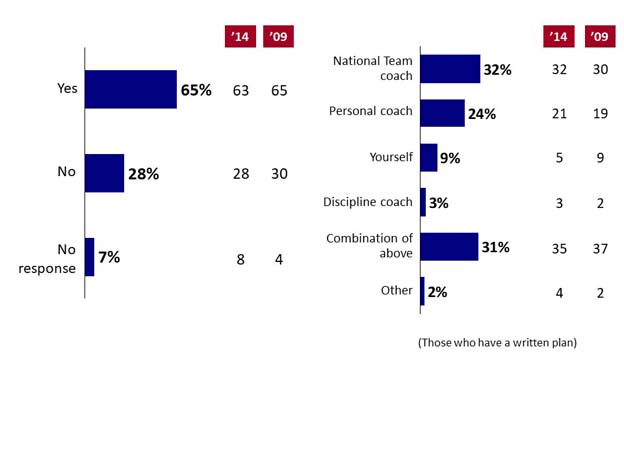
Findings show that although the majority of athletes have individual, formalized plans for their development, there remains a sizable proportion that does not. Two in three athletes (65%) have a written annual training and competition plan that is tailored to them specifically, essentially unchanged since 2014 (63%) and 2009 (65%). That said, just over one in four (28%) do not.
Of the respondents who have a written plan, 32% had those plans created by their national team coach (consistent with 32% reported in 2014 and 30% in 2009). In 24% of cases the plan is created by their personal coach. Nearly one in ten of these respondents (9%) developed their own plan and 3% follow a plan written by a discipline coach. The training and competition plan was a collaborative effort in about three in ten cases (31%), slightly lower than the 35% reported in 2014 and 37% in 2009.
Q3. Do you have a written annual training and competition plan that is tailored to you specifically? Base: n=846
Q4. Who is primarily responsible for developing your annual training and competition plan? Base: n=551
The 846 respondents in the 2019 survey responded as follows:
Yes, 65%
No, 28%
No response, 7%
The respondents in the 2014 survey responded as follows:
Yes, 63%
No, 28%
No response, 8%
The respondents in the 2009 survey responded as follows:
Yes, 65%
No, 30%
No response, 4%
Q4. Who is primarily responsible for developing your annual training and competition plan? Base: n=551
The 551 respondents in the 2019 survey responded as follows:
National Team coach, 32%
Personal coach, 24%
Yourself, 9%
Discipline coach, 3%
Combination of above, 31%
Other, 2%
(Those who have a written plan)
The respondents in the 2014 survey responded as follows:
National Team coach, 32%
Personal coach, 21%
Yourself, 5%
Discipline coach, 3%
Combination of above, 35%
Other, 4%
(Those who have a written plan)
The respondents in the 2009 survey responded as follows:
National Team coach, 30%
Personal coach, 19%
Yourself, 9%
Discipline coach, 2%
Combination of above, 37%
Other, 2%
(Those who have a written plan)
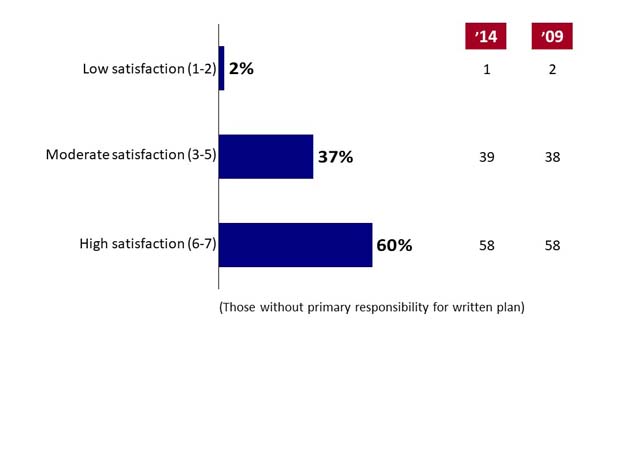
Athletes were asked to rate their satisfaction with the amount of input they had in the development of their training plans. Survey results over the last three measurement periods show that athletes are largely satisfied with the amount of input they had, with six in ten (58%) rating themselves as satisfied or very satisfied (i.e., six or seven on the seven-point scale). An additional nearly four in ten (37%) indicated that they are moderately satisfied. Very few (2%) indicated a low level of satisfaction.
Q5. How satisfied are you with the extent of input that you had into the development of your training and competition plan?
Base: n=504
The 504 respondents in the 2019 survey responded as follows:
Low satisfaction (1-2), 2%
Moderate satisfaction (3-5), 37%
High satisfaction (6-7), 60%
(Those without primary responsibility for written plan)
The respondents in the 2014 survey responded as follows:
Low satisfaction (1-2), 1%
Moderate satisfaction (3-5), 39%
High satisfaction (6-7), 58%
The respondents in the 2009 survey responded as follows:
Low satisfaction (1-2), 2%
Moderate satisfaction (3-5), 38%
High satisfaction (6-7), 58%
Satisfaction with Training Plan
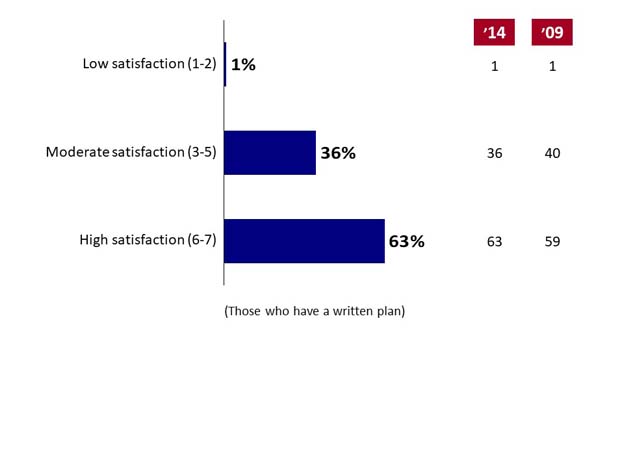
Given the high levels of satisfaction athletes have with the amount of input they put into their training and competition plans, it is not surprising to continue to see strong satisfaction also registered with these plans overall. More than six in ten respondents (63%) rated themselves as satisfied or highly satisfied with their plan (i.e., a six or seven on the scale), which is identical to 2014 results and marginally higher than found in 2009. Another 36% are moderately satisfied, and only 1% expressed any dissatisfaction with their current plan.
Q6. How satisfied are you with your training and competition plan overall?
Base: n=551
The 551 respondents in the 2019 survey responded as follows:
Low satisfaction (1-2), 1%
Moderate satisfaction (3-5), 36%
High satisfaction (6-7), 63%
(Those who have a written plan)
The respondents in the 2014 survey responded as follows:
Low satisfaction (1-2), 1%
Moderate satisfaction (3-5), 36%
High satisfaction (6-7), 63%
The respondents in the 2009 survey responded as follows:
Low satisfaction (1-2), 1%
Moderate satisfaction (3-5), 40%
High satisfaction (6-7), 59%
As in previous measurement periods, nearly half of athletes (47%) have a principal coach who is employed by their National Sport Organization (NSO) on a full-time basis. In contrast, one in four athletes (24%) follow the direction of a personal coach who is not employed or contracted by their NSO. An additional one in ten athletes is managed by a coach who is employed by their NSO on a part-time basis (10%) and 6% are not trained under a person they consider to be their coach. All figures are very similar to those found in 2014 and 2009.
Athletes with coaches spend many hours with them during training and competition periods. Reflecting the proportions reported in 2014 and 2009, only 13% report spending less than 6 hours per week with their coach. Almost one in two athletes reported spending 6-20 hours with their coaches on a weekly basis. Specifically, 23% spend 6-14 hours while another 21% spend 15-20. Meanwhile, 24% spend more than 20 hours a week with their coaches. Overall, athletes spend an average of 19 hours per week training with their coaches.
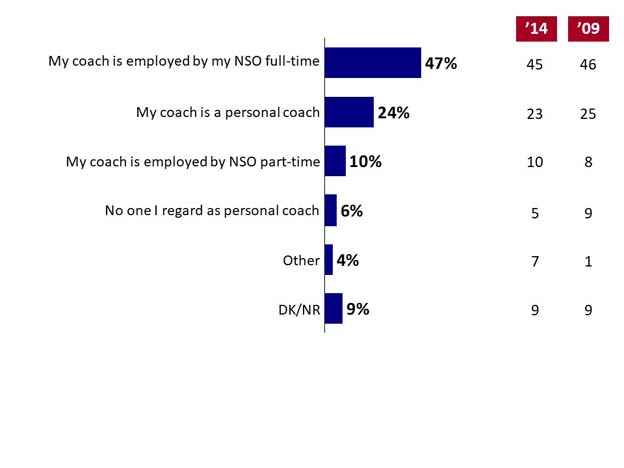
Q7. Which of these best describes your sport-specific principal coach?
Base: n=846
2019 '14 '09
The 846 respondents in the 2019 survey responded as follows:
My coach is employed by my NSO full-time, 47%
My coach is a personal coach, 24%
My coach is employed by NSO part-time, 10%
No one I regard as personal coach, 6%
Other, 4%
dk/nr, 9%
The respondents in the 2014 survey responded as follows:
My coach is employed by my NSO full-time, 45%
My coach is a personal coach, 23%
My coach is employed by NSO part-time, 10%
No one I regard as personal coach, 5%
Other, 7%
dk/nr, 9%
The respondents in the 2009 survey responded as follows:
My coach is employed by my NSO full-time, 46%
My coach is a personal coach, 25%
My coach is employed by NSO part-time, 8%
No one I regard as personal coach, 9%
Other, 1%
dk/nr, 9%
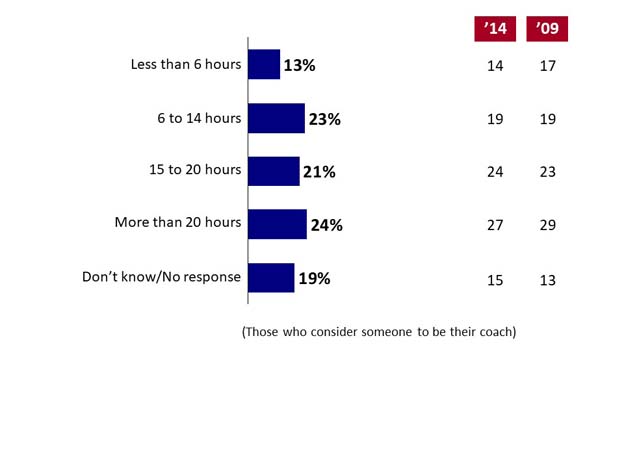
QAQ8. On average, how many hours per week do you have contact with your principal coach during training and competition periods?
Base: n=797
The 797 respondents in the 2019 survey responded as follows:
Less than 6 hours, 13%
6 to 14 hours, 23%
15 to 20 hours, 21%
More than 20 hours, 24%
Don’t know/No response, 19%
(Those who consider someone to be their coach)
The respondents in the 2014 survey responded as follows:
Less than 6 hours, 14%
6 to 14 hours, 19%
15 to 20 hours, 24%
More than 20 hours, 27%
Don’t know/No response, 15%
The respondents in the 2009 survey responded as follows:
Less than 6 hours, 17%
6 to 14 hours, 19%
15 to 20 hours, 23%
More than 20 hours, 29%
Don’t know/No response, 13%
Findings identify that athletes are largely satisfied with their principal coaches, although less satisfied with the amount of time coaches spend with them. Almost three in four respondents (71%, down slightly over time from 78% in 2009) said that they are very satisfied with the technical expertise demonstrated by their principal coaches. Overall, two in three (68%) were highly satisfied with the overall quality of coaching; however as with 2014, this continues to be lower than the 74% reported in 2009 indicating that satisfaction with coaching is declining over time. Compared to ratings on quality and expertise, relatively fewer athletes, but still the majority at 58%, are satisfied with the amount of time they spend with principal coaches.
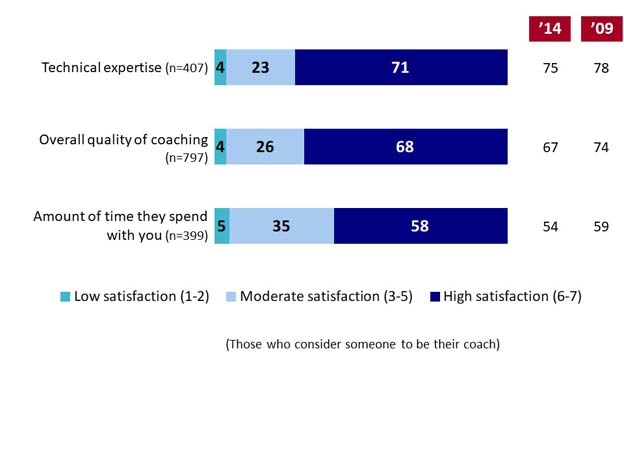
Q9a-c. How satisfied are you with the following about your principal coach?
The respondents in the 2019 survey responded as follows:
Technical expertise (n=407)
Low satisfaction (1-2), 4%
Moderate satisfaction (3-5), 23%
High satisfaction (6-7), 71%
(Those who consider someone to be their coach)
The respondents responded as follows in previous years (high satisfaction 6-7):
2014, 75%
2009, 78%
The respondents in the 2019 survey responded as follows:
Overall quality of coaching (n=797)
Low satisfaction (1-2), 4%
Moderate satisfaction (3-5), 26%
High satisfaction (6-7), 68%
(Those who consider someone to be their coach)
The respondents responded as follows in previous years (high satisfaction 6-7):
2014, 67%
2009, 74%
The respondents in the 2019 survey responded as follows:
Amount of time they spend with you (n=399)
Low satisfaction (1-2), 5%
Moderate satisfaction (3-5), 35%
High satisfaction (6-7), 58%
(Those who consider someone to be their coach)
The respondents responded as follows in previous years (high satisfaction 6-7):
2014, 54%
2009, 59%
Chart 10: Adequacy of Supports for Athletes
Q11a-h. How adequate or inadequate are each of the following to support your Olympic/Paralympic/World Championship aspiration?
Base: n=846
The 846 respondents in the 2019 survey responded as follows:
Amount of training experience you are getting
Low (1-2), 2%
Moderate (3-5), 29%
High (6-7), 67%
The respondents responded as follows in previous years (high 6-7):
2014, 66%
2009, 69%
Coaches 2019, 42%
Coaches 2014, 60%
Coaches 2009, 49%
The 846 respondents in the 2019 survey responded as follows:
Quality of training you are getting
Low (1-2), 2%
Moderate (3-5), 32%
High (6-7), 64%
The respondents responded as follows in previous years (high 6-7):
2014, 65%
2009, 69%
Coaches 2019, 55%
Coaches 2014, 56%
Coaches 2009, 61%
The 846 respondents in the 2019 survey responded as follows:
Type of competition experience you are getting
Low (1-2), 2%
Moderate (3-5), 32%
High (6-7), 63%
The respondents responded as follows in previous years (high 6-7):
2014, 63%
2009, 64%
Coaches 2019, 49%
Coaches 2014, 40%
Coaches 2009, 52%
The 846 respondents in the 2019 survey responded as follows:
Physical access to high quality training facilities
Low (1-2), 5%
Moderate (3-5), 33%
High (6-7), 60%
The respondents responded as follows in previous years (high 6-7):
2014, 54%
2009, 55%
Coaches 2019, 38%
Coaches 2014, 42%
Coaches 2009, 47%
The 846 respondents in the 2019 survey responded as follows:
Amount of competition experience you are getting
Low (1-2), 5%
Moderate (3-5), 38%
High (6-7), 56%
The respondents responded as follows in previous years (high 6-7):
2014, 52%
2009, 55%
Coaches 2019, 38%
Coaches 2014, 36%
Coaches 2009, 48%
The 846 respondents in the 2019 survey responded as follows:
Sport science/medicine services you are getting during competitions
Low (1-2), 11%
Moderate (3-5), 37%
High (6-7), 50%
The respondents responded as follows in previous years (high 6-7):
2014, --
2009, --
Coaches 2019, 42% (combined with next statement)
Coaches 2014, 38% (combined with next statement)
Coaches 2009, 48% (combined with next statement)
The 846 respondents in the 2019 survey responded as follows:
Sport science/medicine services you are getting during training
Low (1-2), 10%
Moderate (3-5), 41%
High (6-7), 47%
The respondents responded as follows in previous years (high 6-7):
2014, 44%
2009, 49%
Coaches 2019, (see previous statement)
Coaches 2014, (see previous statement)
Coaches 2009, (see previous statement)
The 846 respondents in the 2019 survey responded as follows:
Financial support for all sources
Low (1-2), 21%
Moderate (3-5), 52%
High (6-7), 26%
The respondents responded as follows in previous years (high 6-7):
2014, 24%
2009, 27%
Coaches 2019, 13%
Coaches 2014, 12%
Coaches 2009, 21%
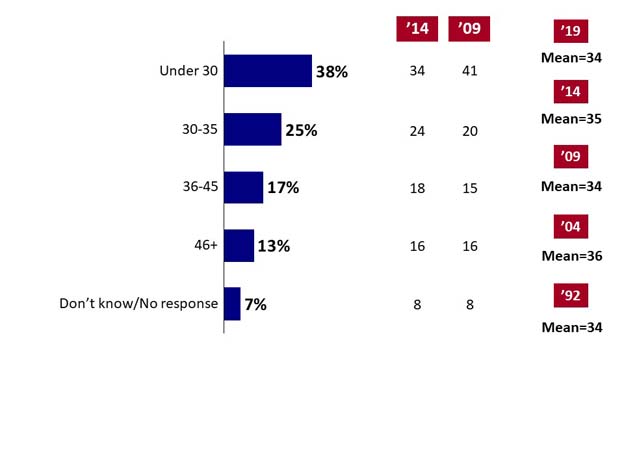
The amount of time athletes devote to their sport has remained relatively unchanged over the last two decades. Overall, the average number of hours allotted by athletes in any given week stands at 34 hours per week. Nearly four in ten athletes (38%) spend less than 30 hours per week training and competing, slightly above the 34% reported in 2014 but nearly the 41% reported in 2009. A full one in four (25%) devotes between 30 and 34 hours to their weekly schedule. Another 17% spend between 36 and 45 hours per week and 13% spend in excess of 45 hours per week training.
AQ10. What was the average number of hours per week you devoted to your sport during the training and competitive period in the past year?
Base: n=846
The 846 respondents in the 2019 survey responded as follows:
Under 30, 38%
30-35, 25%
36-45, 17%
46+, 13%
Don’t know/No response, 7%
The respondents in the 2014 survey responded as follows:
Under 30, 34%
30-35, 24%
36-45, 18%
46+, 16%
Don’t know/No response, 8%
The respondents in the 2009 survey responded as follows:
Under 30, 41%
30-35, 20%
36-45, 15%
46+, 16%
Don’t know/No response, 8%
Mean 2019 = 34
Mean 2014 = 35
Mean 2009 = 34
Mean 2004 = 36
Mean 1992 = 34
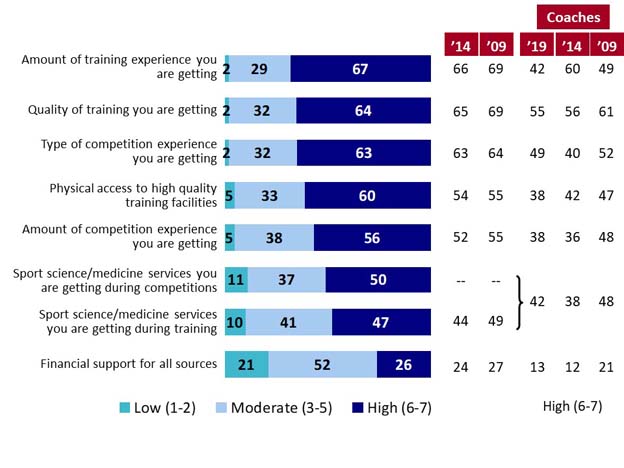
In this section, athletes rated the adequacy of the support they receive for their Olympic/ Paralympic/World Championship aspirations in the way of training, competitions, facilities, medical attention and financial needs. Athletes are reasonably content with the amount of training, where two in three (67%) rated the adequacy as high, on par with results from 2014 and 2009. This is followed by the perceived adequacy with the quality of training, (64%), and the type of competition experience (64%), and also reflects the 2014 and 2009 results.
Adequacy is not as strong in other areas. About six in ten athletes feel positively about their physical access to high quality training facilities (61%) and the amount of competition they are getting (57%), both marginally higher than found in 2014. Fewer still rated the type of sport science/medicine services they are receiving during competitions (50%) and during training (47%) as adequate, although the latter is marginally higher than found in 2014, but on par with 2009. As in past years, the lowest rated type of support is the level of financial support. Only one in four (26%) believe that they receive adequate monetary support, while 52% rate it as moderate and another 21% rate it as inadequate.
Reflecting similar patterns in 2009 and 2014, coaches were generally less positive than athletes in their views about the adequacy of support across all areas, particularly in the type of competition and amount of training and competition experience that athletes were receiving, as well as the physical access to high quality facilities.
Q11a-h. How adequate or inadequate are each of the following to support your Olympic/Paralympic/World Championship aspiration?
Base: n=846
The 846 respondents in the 2019 survey responded as follows:
Low (1-2)
Amount of training experience you are getting, 2%
Quality of training you are getting, 2%
Type of competition experience you are getting, 2%
Physical access to high quality training facilities, 5%
Amount of competition experience you are getting, 5%
Sport science/medicine services you are getting during competitions, 11%
Sport science/medicine services you are getting during training, 10%
Financial support for all sources, 21%
The 846 respondents in the 2019 survey responded as follows:
Moderate (3-5)
Amount of training experience you are getting, 29%
Quality of training you are getting, 32%
Type of competition experience you are getting, 32%
Physical access to high quality training facilities, 33%
Amount of competition experience you are getting, 38%
Sport science/medicine services you are getting during competitions, 37%
Sport science/medicine services you are getting during training, 41%
Financial support for all sources, 52%
The 846 respondents in the 2019 survey responded as follows:
High (6-7)
Amount of training experience you are getting, 67%
Quality of training you are getting, 64%
Type of competition experience you are getting, 63%
Physical access to high quality training facilities, 60%
Amount of competition experience you are getting, 56%
Sport science/medicine services you are getting during competitions, 50%
Sport science/medicine services you are getting during training, 47%
Financial support for all sources, 26%
The respondents in the 2014 survey responded as follows:
High (6-7)
Amount of training experience you are getting, 66%
Quality of training you are getting, 65%
Type of competition experience you are getting, 63%
Physical access to high quality training facilities, 54%
Amount of competition experience you are getting, 52%
Sport science/medicine services you are getting during competitions, --
Sport science/medicine services you are getting during training, 44%
Financial support for all sources, 24%
The respondents in the 2009 survey responded as follows:
High (6-7)
Amount of training experience you are getting, 69%
Quality of training you are getting, 69%
Type of competition experience you are getting, 64%
Physical access to high quality training facilities, 55%
Amount of competition experience you are getting, 55%
Sport science/medicine services you are getting during competitions, --
Sport science/medicine services you are getting during training, 49%
Financial support for all sources, 27%
The respondents in the 2019 survey (coaches) responded as follows:
High (6-7)
Amount of training experience you are getting, 42%
Quality of training you are getting, 55%
Type of competition experience you are getting, 49%
Physical access to high quality training facilities, 38%
Amount of competition experience you are getting, 38%
Sport science/medicine services you are getting during competitions, )
Sport science/medicine services you , ) 42%
are getting during training, )
Financial support for all sources, 13%
The respondents in the 2014 survey (coaches) responded as follows:
High (6-7)
Amount of training experience you are getting, 60%
Quality of training you are getting, 56%
Type of competition experience you are getting, 40%
Physical access to high quality training facilities, 42%
Amount of competition experience you are getting, 36%
Sport science/medicine services you are getting during competitions, )
Sport science/medicine services you , ) 38%
are getting during training, )
Financial support for all sources, 12%
The respondents in the 2009 survey (coaches) responded as follows:
High (6-7)
Amount of training experience you are getting, 49%
Quality of training you are getting, 61%
Type of competition experience you are getting, 52%
Physical access to high quality training facilities, 47%
Amount of competition experience you are getting, 48%
Sport science/medicine services you are getting during competitions, )
Sport science/medicine services you , ) 48%
are getting during training, )
Financial support for all sources, 21%
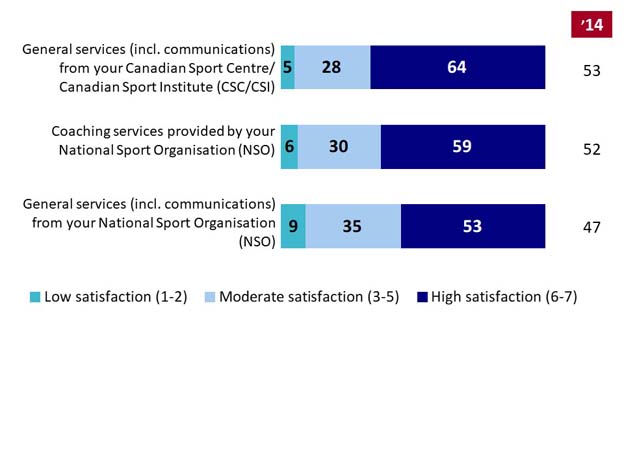
Responding athletes indicated reasonably high levels of satisfaction with their access to services in their language of choice. Nearly two in three (64%, an increase from 53% in 2014) rated themselves as satisfied or highly satisfied with the services that they receive from their Canadian Sport Centre/Canadian Sport Institute (CSC/CSI). Six in ten (59%) rated themselves as satisfied or highly satisfied with the services that they receive from their National Sport Organization (NSO) in terms of coaching services, and 53% are satisfied with general services provided by their NSO. About one in three is moderately satisfied and only five to nine percent indicated dissatisfaction.
Q12a-c. Thinking about the last 12 months, how satisfied or dissatisfied have you been with your access to the following services in the official language of your choice?
Base: n=846
The 846 respondents in the 2019 survey responded as follows:
General services (incl. communications) from your Canadian Sport Centre/Canadian Sport Institute (CSC/CSI)
Low satisfaction (1-2), 5%
Moderate satisfaction (3-5), 28%
High satisfaction (6-7), 64%
The respondents responded as follows in previous year (high 6-7):
2014, 53%
The 846 respondents in the 2019 survey responded as follows:
Coaching services provided by your National Sport Organisation (NSO)
Low satisfaction (1-2), 6%
Moderate satisfaction (3-5), 30%
High satisfaction (6-7), 59%
The respondents responded as follows in previous year (high 6-7):
2014, 52%
The 846 respondents in the 2019 survey responded as follows:
General services (incl. communications) from your National Sport Organisation (NSO)
Low satisfaction (1-2), 9%
Moderate satisfaction (3-5), 35%
High satisfaction (6-7), 53%
The respondents responded as follows in previous year (high 6-7):
2014, 47%
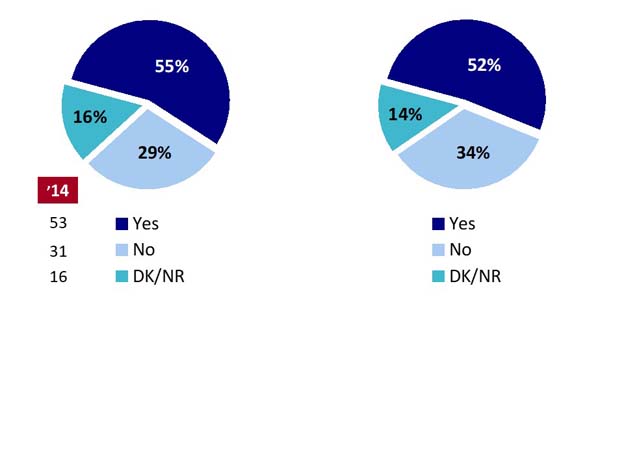
As in 2014, just over half of the respondents (55%) indicated they were able to access all of the sport science and sport medicine services that they needed over the last twelve months. Another three in ten (29%) said that they could not (or perhaps did not) access these services.
Asked for the first time in 2019, half of athletes (52%) indicated they have enough information about the types of services available, although 33% believe they need more information and 15% are unsure.
Q13. Were you able to access all the sport science and sport medicine services you needed over the last 12 months from your CSC/CSI? Base: n=846
The 846 respondents in the 2019 survey responded as follows:
Yes, 55%
No, 29%
dk/nr, 16%
The respondents in the 2014 survey responded as follows:
Yes, 53%
No, 31%
dk/nr, 16%
Q13b. Do you feel there is sufficient information available about the type of sport science and sport medicine services available from your Canadian Sport Institute (CSI)? Base: n=846
The 846 respondents in the 2019 survey responded as follows:
Yes, 52%
No, 34%
dk/nr, 14%
Game Plan is a new service offered by CSIs. Six in ten athletes (59%) indicated that they are aware of this service, although 31% are not and a further 10% said they don't know. Of athletes aware of the service, 55% said they have used Game Plan (39% have not and 5% said they don't know).
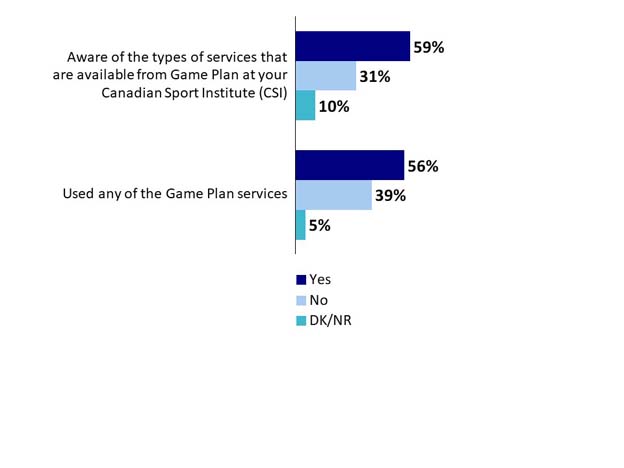
Q14. Are you aware of the types of services that are available from Game Plan at your Canadian Sport Institute (CSI)? Base: n=846
The 846 respondents in the 2019 survey responded as follows:
Aware of the types of services that are available from Game Plan at your Canadian Sport Institute (CSI)
Yes, 59%
No, 31%
dk/nr, 10%
Q14b. Have you used any of the Game Plan services? Base: n=505, those who have used CSI services
The 505 respondents in the 2019 survey responded as follows:
Used any of the Game Plan services
Yes, 56%
No, 39%
dk/nr, 5%
Among those who have used Game Plan, satisfaction is reasonably high at 61%, although 37% indicated only moderate satisfaction (but only 1% said they are dissatisfied).
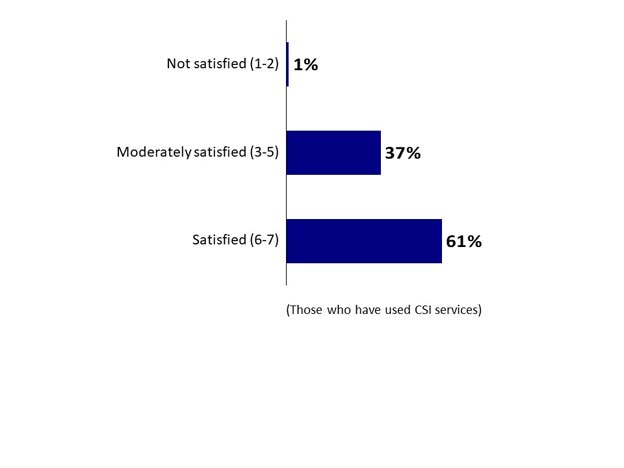
Q14c. How satisfied would you say you are with the Game Plan services you have received?
Base: n=284
The 284 respondents in the 2019 survey responded as follows:
Not satisfied (1-2), 1%
Moderately satisfied (3-5), 37%
Satisfied (6-7), 61%
(Those who have used CSI services)
Athletes were asked about the relative level of importance of various sport science services provided by the CSCs/CSIs, as well as the quality of each of the same services. At the top of the list is strength and conditioning, with 84% of respondents rating it highly important, followed closely by nearly eight in ten athletes who feel that nutrition (78%) and sports psychology (77%) are crucial services. In a second tier of importance are performance analysis (66%), skill and technique analysis (61%), and physiology assessment and monitoring (57%). In a third tier, about half of athletes find fitness testing (51%), international competition performance analysis (50%) and biometrics (46%) to be important. Note that, compared with results from 2014, the importance of sport psychology and performance analysis seem to have seen the largest increase in perceived importance over time, with some modest increase also found in fitness testing.
While everyone agrees that strength and conditioning are the most important services for athletes to receive, compared with athletes, coaches are even more likely to put sport psychology near the top of the list (94%), along with skill/technique analysis, performance analysis (83%), physiology assessment (83%) and international competition performance analysis (82%). In fact, nutrition falls to the sixth place on the list among coaches, after performance analysis. Compared with 2014, coaches place more importance on strength and conditioning, sport psychology, physiology assessment, performance analysis and nutrition than they did five years ago.
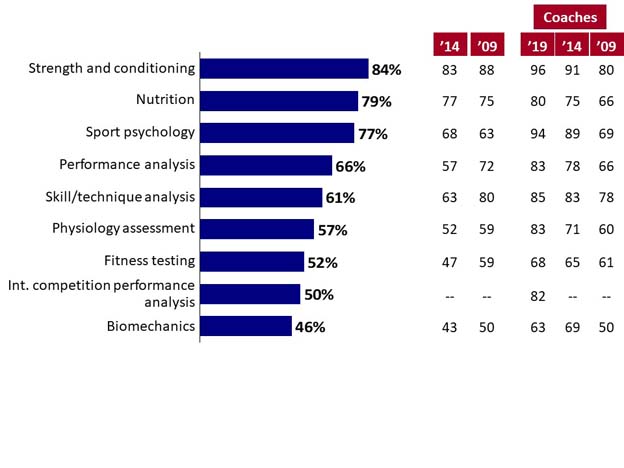
Q15. Which of the following sport science services would you consider to be important to you in terms of the positive impact that they can have on your performance?*
Base: n=846
* Note change in approach to Question since 2009
The 846 respondents in the 2019 survey responded as follows:
Strength and conditioning, 84%
Nutrition, 79%
Sport psychology, 77%
Performance analysis, 66%
Skill/technique analysis, 61%
Physiology assessment, 57%
Fitness testing, 52%
Int. competition performance analysis, 50%
Biomechanics, 46%
The respondents in the 2014 survey responded as follows:
Strength and conditioning, 83%
Nutrition, 77%
Sport psychology, 68%
Performance analysis, 57%
Skill/technique analysis, 63%
Physiology assessment, 52%
Fitness testing, 47%
Int. competition performance analysis, --
Biomechanics, 43%
The respondents in the 2009 survey responded as follows:
Strength and conditioning, 88%
Nutrition, 75%
Sport psychology, 63%
Performance analysis, 72%
Skill/technique analysis, 80%
Physiology assessment, 59%
Fitness testing, 59%
Int. competition performance analysis, --
Biomechanics, 50%
The respondents in the 2019 survey (coaches) responded as follows:
Strength and conditioning, 96%
Nutrition, 80%
Sport psychology, 94%
Performance analysis, 83%
Skill/technique analysis, 85%
Physiology assessment, 83%
Fitness testing, 68%
Int. competition performance analysis, 82%
Biomechanics, 63%
The respondents in the 2014 survey (coaches) responded as follows:
Strength and conditioning, 91%
Nutrition, 75%
Sport psychology, 89%
Performance analysis, 78%
Skill/technique analysis, 83%
Physiology assessment, 71%
Fitness testing, 65%
Int. competition performance analysis, --
Biomechanics, 69%
The respondents in the 2009 survey (coaches) responded as follows:
Strength and conditioning, 80%
Nutrition, 66%
Sport psychology, 69%
Performance analysis, 66%
Skill/technique analysis, 78%
Physiology assessment, 60%
Fitness testing, 61%
Int. competition performance analysis, --
Biomechanics, 50%
Based on their experience of the previous 12 months, athletes were asked the need for improvement in the quality of sport science services. A total of 45% said that they either did not know (28%) or did not see the need for improvement (17%). Just over half (55%), however, suggested one or more sport sciences where improvements are needed. Sport psychology (23%), performance analysis (21%) and nutrition (19%) services sit at the top of the list. About one in six (14% to 17%) see the need for improvements in the areas of skills and technique analysis, physiology assessment, international competition performance analysis, strength and conditioning, and biomechanics. Only 8% see a need for improvements in fitness testing.
Results are largely similar among coaches, however, compared with athletes there is a more compelling argument made by coaches for improvements in performance analysis (29%), and physiology, as well as biomechanics. Compared with 2014, coaches' views are similar, although there is less of a need for improvements in 2019 in the area of sports psychology.
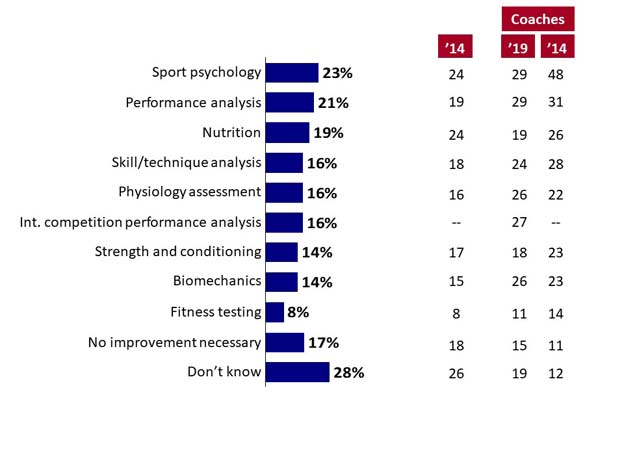
Q16. Thinking about the quality of the sport science services you have received from the CSC/CSI over the last 12 months, which ones, if any, would you say are in need of improvement?
Base: n=833
The 833 respondents in the 2019 survey responded as follows:
Sport psychology, 23%
Performance analysis, 21%
Nutrition, 19%
Skill/technique analysis, 16%
Physiology assessment, 16%
Int. competition performance analysis, 16%
Strength and conditioning, 14%
Biomechanics, 14%
Fitness testing, 8%
No improvement necessary, 17%
Don’t know, 28%
The 833 respondents in the 2014 survey responded as follows:
Sport psychology, 24%
Performance analysis, 19%
Nutrition, 24%
Skill/technique analysis, 18%
Physiology assessment, 16%
Int. competition performance analysis, --
Strength and conditioning, 17%
Biomechanics, 15%
Fitness testing, 8%
No improvement necessary, 18%
Don’t know, 26%
The respondents in the 2019 survey (coaches) responded as follows:
Sport psychology, 29%
Performance analysis, 29%
Nutrition, 19%
Skill/technique analysis, 24%
Physiology assessment, 26%
Int. competition performance analysis, 27%
Strength and conditioning, 18%
Biomechanics, 26%
Fitness testing, 11%
No improvement necessary, 15%
Don’t know, 19%
The respondents in the 2014 survey (coaches) responded as follows:
Sport psychology, 48%
Performance analysis, 31%
Nutrition, 26%
Skill/technique analysis, 28%
Physiology assessment, 22%
Int. competition performance analysis, --
Strength and conditioning, 23%
Biomechanics, 23%
Fitness testing, 14%
No improvement necessary, 11%
Don’t know, 12%
Athletes were similarly asked to rate the importance and need for improvement of various sport medicine services provided by CSCs/CSIs. In terms of importance to performance, physiotherapy (84%) and massage (82%) are perceived as the most important services. About six in ten people value athletic therapy (63%), advice and treatment from a sport doctor (60%) and mental health assessments and care (59%) as key services. This is followed by physical health assessments and care (50%) and chiropractic services (44%). Other medical services garnered lower importance ratings including osteopathy (25%), and podiatry (10%). These results are similar to those found in 2014 where comparisons are possible, with perhaps slightly greater emphasis in 2019 on advice and treatment from a sport doctor. Although the administration of this question changed after 2009 making comparison difficult, results suggest that massage has become more important over time, while athletic therapy and advice and treatment from a sport doctor have become less so over time.
Coaches are largely in agreement with athletes on the ranking of these services in terms of their relative importance, although advice from a sport doctor, and mental and physical health assessments and care are given considerably greater weight than accorded by athletes. And, although physiotherapy is seen as important by the greatest proportion of both athletes and coaches, a considerably higher proportion of coaches see this as key.
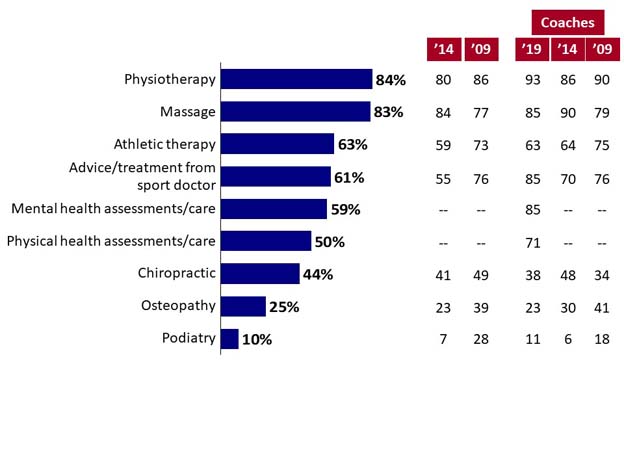
Q17. Which of the following sport medicine services would you consider to be important to you in terms of the positive impact that they can have on your performance?*
Base: n=846
* Note change in approach to Question since 2009
The 846 respondents in the 2019 survey responded as follows:
Physiotherapy, 84%
Massage, 83%
Athletic therapy, 63%
Advice/treatment from sport doctor, 61%
Mental health assessments/care, 59%
Physical health assessments/care, 50%
Chiropractic, 44%
Osteopathy, 25%
Podiatry, 10%
The respondents in the 2014 survey responded as follows:
Physiotherapy, 80%
Massage, 84%
Athletic therapy, 59%
Advice/treatment from sport doctor, 55%
Mental health assessments/care, --
Physical health assessments/care, --
Chiropractic, 41%
Osteopathy, 23%
Podiatry, 7%
The respondents in the 2009 survey responded as follows:
Physiotherapy, 86%
Massage, 77%
Athletic therapy, 73%
Advice/treatment from sport doctor, 76%
Mental health assessments/care, --
Physical health assessments/care, --
Chiropractic, 49%
Osteopathy, 39%
Podiatry, 28%
The respondents in the 2019 survey (coaches) responded as follows:
Physiotherapy, 93%
Massage, 85%
Athletic therapy, 63%
Advice/treatment from sport doctor, 85%
Mental health assessments/care, 85%
Physical health assessments/care, 71%
Chiropractic, 38%
Osteopathy, 23%
Podiatry, 11%
The respondents in the 2014 survey (coaches) responded as follows:
Physiotherapy, 86%
Massage, 90%
Athletic therapy, 64%
Advice/treatment from sport doctor, 70%
Mental health assessments/care, --
Physical health assessments/care, --
Chiropractic, 48%
Osteopathy, 30%
Podiatry, 6%
The respondents in the 2009 survey (coaches) responded as follows:
Physiotherapy, 90%
Massage, 79%
Athletic therapy, 75%
Advice/treatment from sport doctor, 76%
Mental health assessments/care, --
Physical health assessments/care, --
Chiropractic, 34%
Osteopathy, 41%
Podiatry, 18%
Compared with the need for improvements in sport sciences, fewer athletes put forward areas of sports medicine where improvements are required. Three in ten indicated no areas for improvement and one in four said they did not know (24%). Among the 44% suggesting areas for improvement, half pointed to mental health assessments (22% overall). Massage (17%), physiotherapy (14%), and advice and treatments from a sport doctor (13%) were also cited as areas for improvement. These are not only the areas where the most athletes suggested need for improvement they are also the top three rated services in terms of importance to athletes (and coaches). Athletic therapy, physical health assessments and care (10%), and chiropractic services (9%) were also noted. Osteopathy and podiatry are less apt to be areas where athletes see the need for improvements.
Results are similar among coaches although mental health assessments and care, advice from a sports doctor, physiotherapy and chiropractic services seem to be noticeably more in need of improvements among coaches than perceived to be the case among athletes. Compared with 2014 considerably fewer coaches see a need for improvement in physiotherapy and massage in 2019, although there is a much greater need for improvements in advice and treatment from a sports doctor. Overall, fewer coaches in 2019 say there is no need for improvements compared with 2014.
Among the coaches who identified additional sport science or sport medicine services, the suggested services include biomechanics, sport psychology, and general expansion of services.
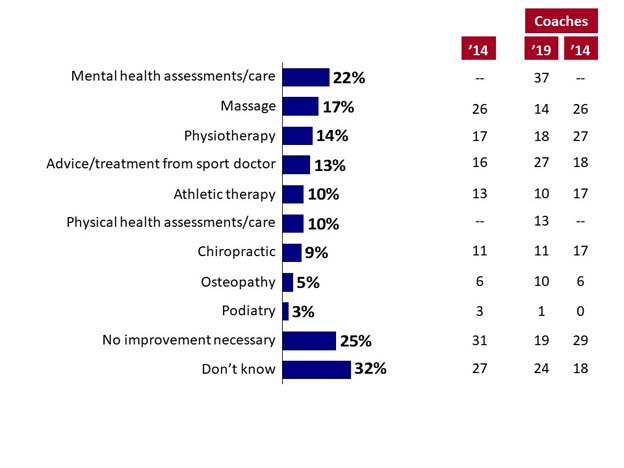
Q18. Thinking about the quality of the sport medicine services you have received from the CSC/CSI over the last 12 months, which ones, if any, would you say are in need of improvement?
Base: n=829
The 829 respondents in the 2019 survey responded as follows:
Mental health assessments/care, 22%
Massage, 17%
Physiotherapy, 14%
Advice/treatment from sport doctor, 13%
Athletic therapy, 10%
Physical health assessments/care, 10%
Chiropractic, 9%
Osteopathy, 5%
Podiatry, 3%
No improvement necessary, 25%
Don’t know, 32%
The respondents in the 2014 survey responded as follows:
Mental health assessments/care, --
Massage, 26%
Physiotherapy, 17%
Advice/treatment from sport doctor, 16%
Athletic therapy, 13%
Physical health assessments/care, --
Chiropractic, 11%
Osteopathy, 6%
Podiatry, 3%
No improvement necessary, 31%
Don’t know, 27%
The respondents in the 2019 survey (coaches) responded as follows:
Mental health assessments/care, 37%
Massage, 14%
Physiotherapy, 18%
Advice/treatment from sport doctor, 27%
Athletic therapy, 10%
Physical health assessments/care, 13%
Chiropractic, 11%
Osteopathy, 10%
Podiatry, 1%
No improvement necessary, 19%
Don’t know, 24%
The respondents in the 2014 survey (coaches) responded as follows:
Mental health assessments/care, --
Massage, 26%
Physiotherapy, 27%
Advice/treatment from sport doctor, 18%
Athletic therapy, 17%
Physical health assessments/care, --
Chiropractic, 17%
Osteopathy, 6%
Podiatry, 0%
No improvement necessary, 29%
Don’t know, 18%
In addition to the evidence of athletes and coaches regarding importance of the various sport science and sport medicine services, CSC Presidents and Service Managers were also asked about the level of demand that they see for these same services that they offer at their CSC's. At the top of the list are strength and conditioning (13 out of 13 respondents), followed by massage (10 of 13), physiotherapy (9 out of 13), advice from a sports doctor (8 out of 13), career planning services (8 out of 13), sport psychology (7 out of 13), physiology assessment and monitoring (6 out of 13) and individual performance analysis (5 out of 13). The lowest demand reported is for podiatry and osteopathy as well as skill/technique analysis, athletic therapy, and chiropractic services.
Respondents were also asked if current services could be enhanced by increased availability, or quality, to which each of the 13 respondents agreed that services could be enhanced. When asked which services they could see enhanced, many pointed to sport psychology (10), mental health assessments (9), nutrition (9), career planning services, individual athlete performance analysis, strength and conditioning, career planning, employment assistance, and education/ Game Plan support services (8 in each case).
Over the past several years CSCs have received additional funds to provide sport science/sport medicine services to athletes and targeted sports - Summer and Winter. A few CSC representatives stated that the additional funds have helped to work specifically with targeted athletes and training groups, and allowed them to “take the next step”.
CSC representatives suggested areas that would enhance these services over what is currently offered. These include working toward better alignment of service and athlete development models, increase awareness of programs and services, and investments in staff (including data analytics experts and mental performance consultants).
Most of the CSC representatives (9 out of 13) said that athletes need services that they are not getting, although responses were varied in terms of what those services were. Nearly half of these representatives mention mental health support as needed services. Other mentions include staff capacity for physician and therapy services, dental and vision care, life skills coaches (including financial planning, and adjusting to relocating), and support for accommodations.
The benefit of offering these services, according to eight CSC respondents, includes greater health and wellness, or “healthier and happier athletes”. As stated by one, it involves a “holistic approach to athlete health”.
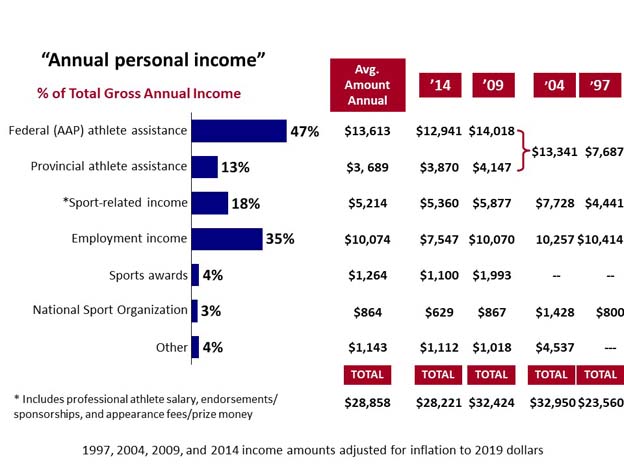
Carded athletes reported an average annual income of $28,858[3] for 2018. Consistent with the 2014 and 2009 studies, the largest proportion of this income is derived from government assistance; six in ten athletes' average income is from either Federal and/or Provincial/ Territorial athlete assistance. Of this government assistance, the majority is from the Federal level ($13,613 annually on average) while Provincial athlete assistance is less prominent ($3,689 annually on average). Smaller proportions of athletes' incomes are derived from actual employment income (35% or $10,074 annually among all athletes although half do not report employment income) and sport-related sources (such as professional salaries, endorsements/ sponsorships or appearance fees/prize money - an average of $5,218 across all athletes, although more than half do not report sport-related income). Only a very small proportion is derived from other sources ($1,143 annually), sports awards ($1,264), and the NSO's ($864).
The average annual average personal income for high performance athletes has remained remarkably consistent over time. It is exactly on par with 2014, but has decreased slightly since 2009[4]. All figures from 2009 and 2014 are adjusted for inflation to 2019 dollars. Across most categories results are very similar to 2014, although employment income went down considerably in 2014.
AQ20a-f. What was the approximate (gross) amount you received in 2018 for the following sources?
Base: n=829
The 829 respondents in the 2019 survey responded as follows:
% of Total Gross Annual Income
Federal (AAP) athlete assistance, 47%
Provincial athlete assistance, 13%
*Sport-related income, 18%
Employment income, 35%
Sports awards, 4%
National Sport Organization, 3%
Other, 4%
* Includes professional athlete salary, endorsements/sponsorships, and appearance fees/prize money
The 829 respondents in the 2019 survey responded as follows:
Annual Avg. Amount
Federal (AAP) athlete assistance, $13,613
Provincial athlete assistance, $3,689
*Sport-related income, $5,214
Employment income, $10,074
Sports awards, $1,264
National Sport Organization, $864
Other, $1,143
Total: $28,858
* Includes professional athlete salary, endorsements/sponsorships, and appearance fees/prize money
The respondents in the 2014 survey responded as follows:
% of Total Gross Annual Income
Federal (AAP) athlete assistance, $12,941
Provincial athlete assistance, $3,870
*Sport-related income, $5,360
Employment income, $7,547
Sports awards, $1,100
National Sport Organization, $629
Other, $1,112
Total: $28,221
* Includes professional athlete salary, endorsements/sponsorships, and appearance fees/prize money
1997, 2004, 2009, and 2014 income amounts adjusted for inflation to 2019 dollars
The respondents in the 2009 survey responded as follows:
% of Total Gross Annual Income
Federal (AAP) athlete assistance, $14,018
Provincial athlete assistance, $4,147
*Sport-related income, $5,877
Employment income, $10,070
Sports awards, $1,993
National Sport Organization, $867
Other, $1,018
Total: $32,424
* Includes professional athlete salary, endorsements/sponsorships, and appearance fees/prize money
The respondents in the 2004 survey responded as follows:
% of Total Gross Annual Income
Federal (AAP) athlete assistance )
Provincial athlete assistance ) $13,341
*Sport-related income, $7,728
Employment income, $10,257
Sports awards, --
National Sport Organization, $1,428
Other, $4,537
Total: $32,950
* Includes professional athlete salary, endorsements/sponsorships, and appearance fees/prize money
The respondents in the 1997 survey responded as follows:
% of Total Gross Annual Income
Federal (AAP) athlete assistance )
Provincial athlete assistance ) $7,687
*Sport-related income, $4,441
Employment income, $10,414
Sports awards, --
National Sport Organization, $800
Other, --
Total: $23,560
* Includes professional athlete salary, endorsements/sponsorships, and appearance fees/prize money
1997, 2004, 2009, and 2014 income amounts adjusted for inflation to 2019 dollars
Table 2 provides the average annual income reported in each category across all athletes. Figures indicate that winter sport athletes are commanding considerably higher incomes than summer sport athletes, largely driven by higher employment and sport-related income. This is also true of those in team sports in terms of employment, and individual sport athletes in terms of AAP income.
Income increases by card level contributed to mostly by higher employment income and from higher government assistance, although sport-related income and even awards are also significantly higher among SRs compared with C1 and D card athletes.
Paralympians are also making much more income, largely from higher employment income, which is perhaps not surprising given that employment income rises with age and Paralympians are typically much older and have a higher incidence of being employed. The amount indicated under “other” is also much higher. They also receive a higher amount in AAP, which may be necessitated by the fact that Olympic athletes have a sport-related income that is much higher than that of Paralympic athletes.
Income goes up with age (in most income categories). There is very little difference based on gender.
| Col1 | Total ($) | Employment Income ($) | AAP ($) | Provincial Assistance ($) | Sport-Related Income ($) | Sport Awards ($) | Other ($) | NSO ($) |
|---|---|---|---|---|---|---|---|---|
| All athletes (2009) | 27,125 | 8,424 | 11,727 | 3,469 | 4,916 | 1,667 | 852 | 725 |
| All athletes (2009 after inflation)[5] | 29,424 | 10,070 | 14,018 | 3,147 | 5,877 | 1,993 | 1,018 | 867 |
| All athletes (2014) | 25,616 | 6,850 | 11,746 | 3,513 | 4,865 | 998 | 1,009 | 571 |
| All athletes (2014 after inflation) | 28,221 | 7,547 | 12,941 | 3,870 | 5,360 | 1,100 | 1,112 | 629 |
| All athletes (2018) | 28,858 | 10,074 | 13,613 | 3,689 | 5,214 | 1,264 | 1,143 | 864 |
| Season | ||||||||
| Summer | 28,136 | 9,244 | 14,044 | 3,733 | 4,073 | 1,459 | 1,072 | 929 |
| Winter | 33,031 | 12,114 | 14,525 | 4,048 | 7,743 | 944 | 1,234 | 674 |
| Sport Type | ||||||||
| Individual | 29,581 | 8,038 | 15,187 | 4,296 | 4,683 | 1,579 | 1,251 | 709 |
| Team Sport | 29,546 | 14,132 | 12,422 | 2,906 | 6,188 | 760 | 868 | 1,149 |
| Sport Class[6] | ||||||||
| Olympic | 28,555 | 9,341 | 13,728 | 3,764 | 5,714 | 1,367 | 794 | 798 |
| Paralympic | 33,073 | 14,095 | 16,432 | 4,080 | 1,695 | 845 | 2,667 | 900 |
| Carding Level | ||||||||
| D | 19,716 | 7,708 | 8,496 | 2,790 | 3,351 | 737 | 731 | 328 |
| C1 | 29,080 | 12,553 | 9,132 | 2,965 | 6,952 | 380 | 1,530 | 1,888 |
| SR | 34,860 | 11,571 | 17,593 | 4,185 | 5,784 | 1,390 | 1,302 | 817 |
| SR1 | 42,733 | 12,574 | 20,716 | 5,317 | 8,554 | 2,273 | 1,442 | 1,768 |
| SR2 | 44,452 | 13,352 | 20,798 | 5,046 | 7,014 | 2,984 | 2,076 | 1,620 |
| Age | ||||||||
| Under 20 | 13,103 | 1,533 | 8,973 | 2,338 | 1,704 | 812 | 409 | 587 |
| 20 – 24 | 23,616 | 4,633 | 12,488 | 3,779 | 4,569 | 1,460 | 1,082 | 287 |
| 25 – 29 | 34,657 | 11,294 | 14,201 | 3,898 | 6,807 | 1,368 | 856 | 1,114 |
| 30 or older | 41,878 | 19,874 | 17,572 | 4144 | 6,295 | 1,206 | 1,971 | 1,360 |
| Gender | ||||||||
| Male | 28,324 | 10,361 | 13,612 | 3,645 | 4,855 | 1,101 | 1,610 | 492 |
| Female | 29,379 | 9,810 | 13,614 | 3,733 | 5,562 | 1,419 | 664 | 1,249 |
A separate table is available with the proportion of athletes reporting some income in each of the seven income categories as well as the average annual income among those reporting some level of income (e.g., proportion reporting employment income and average income reported for those employed). This table can be found in Appendix C.
Looking at monthly expenses, athletes reported an average of close to $4,400[7] and about $600 per month more than reported in 2014 even when accounting for inflation (i.e., in 2019 dollars), and seems to be growing at a steadily increasing rate over time. This increase is driven by increases in sport-related costs, housing and living expenses, with the largest jump in shelter costs (over $400 a month even after indexed to inflation). As in the past, sport-related expenses are the single biggest expense averaging over $1,800 a month, accounting for 43% of expenses. Shelter costs take up 37%, followed closely by living expenses at 30%.
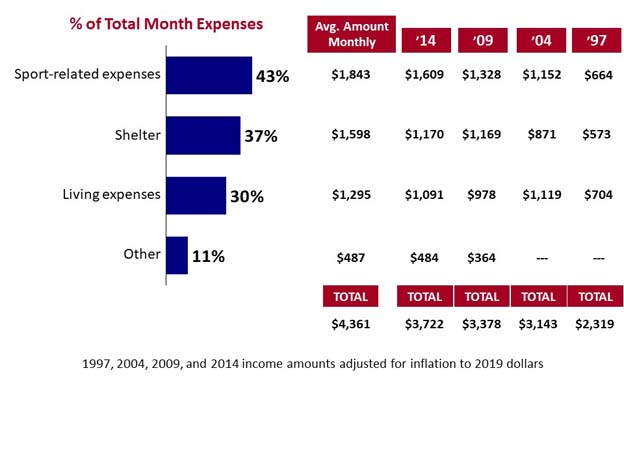
AQ25a-d. What are your average (monthly) personal expenses in each of the following areas?
The respondents in the 2019 survey responded as follows:
% of Total Month Expenses
Sport-related expenses, 43%
Shelter, 37%
Living expenses, 30%
Other, 11%
The respondents in the 2019 survey responded as follows:
Avg. Amount Monthly
Sport-related expenses, $1,843
Shelter, $1,598
Living expenses, $1,295
Other, $487
Total: $4,361
The respondents in the 2014 survey responded as follows:
% of Total Month Expenses
Sport-related expenses, $1,609
Shelter, $1,170
Living expenses, $1,091
Other, $484
Total: $3,722
The respondents in the 2009 survey responded as follows:
% of Total Month Expenses
Sport-related expenses, $1,328
Shelter, $1,169
Living expenses, $978
Other, $364
Total: $3,378
The respondents in the 2004 survey responded as follows:
% of Total Month Expenses
Sport-related expenses, 1,152
Shelter, $871
Living expenses, 1,119
Other, --
Total: 3,143
The respondents in the 1997 survey responded as follows:
% of Total Month Expenses
Sport-related expenses, $664
Shelter, $573
Living expenses, $704
Other, --
Total: $2,319
1997, 2004, 2009, and 2014 income amounts adjusted for inflation to 2019 dollars
As shown in Table 3, SR card, as well as Paralympic athletes report the highest shelter costs. Living costs are highest among SR1 card athletes and those pursuing individual sports, along with those training with the NSO coaching services.
| Col1 | Total ($)[8] | Sport-Related ($) | Living ($) | Shelter ($) | Other ($) |
|---|---|---|---|---|---|
| All athletes (2009) | 2,826 | 1,111 | 818 | 978 | 304 |
| All athletes (2009 - with inflation) | 3,379 | 1,328 | 978 | 1,169 | 364 |
| All athletes (2014) | 3,378 | 1,460 | 990 | 1,062 | 439 |
| Al athletes (2014 – with inflation) | 3,722 | 1,609 | 1,091 | 1,170 | 484 |
| All athletes (2018) | 4,361 | 1,843 | 1,295 | 1,598 | 487 |
| Season | |||||
| Summer | 4,517 | 1,726 | 1,378 | 1,723 | 476 |
| Winter | 4,095 | 2,038 | 1,223 | 1,400 | 493 |
| Sport Type | |||||
| Individual | 5,036 | 2,367 | 1,512 | 1,590 | 538 |
| Team Sport | 3,228 | 791 | 996 | 1,676 | 379 |
| Sport Class[9] | |||||
| Olympic | 4,215 | 1,790 | 1,317 | 1,463 | 473 |
| Paralympic | 4,667 | 1,528 | 1,382 | 2,348 | 483 |
| Carding Level | |||||
| D | 3,669 | 1,841 | 1,034 | 1,247 | 380 |
| C1 | 3,950 | 2,179 | 713 | 1,083 | 376 |
| SR | 4,495 | 1,702 | 1,471 | 1,673 | 521 |
| SR1 | 6,469 | 1,640 | 2,135 | 2,493 | 687 |
| SR2 | 4,428 | 2,073 | 1,095 | 2,050 | 511 |
| Age | |||||
| Under 20 | 3,350 | 1,981 | 782 | 920 | 539 |
| 20-24 | 4,540 | 2,258 | 1,440 | 1397 | 451 |
| 25-29 | 4,077 | 1,360 | 1,311 | 1506 | 508 |
| 30 or Older | 4,976 | 1,774 | 1,360 | 2275 | 489 |
| Gender | |||||
| Male | 4,681 | 2,002 | 1,405 | 1,750 | 532 |
| Female | 4,046 | 1,686 | 1,187 | 1,450 | 446 |
Considering the average income of $28,853 and the expenses of $4,361 a month, athletes seem to be facing a monthly shortage of over $1,800 or $21,900 a year. Previous results highlight the ever widening gap between income and expenses for high performance athletes. In 2009, income and expenses showed an annual deficit of $5,100 (just over $6,100 once indexed to 2019 dollars). In 2014, the deficit had more than doubled to $13,900 ($15,300 after indexation for inflation). In 2018 it has risen again, this time by closer to 50% to $21,900 annually.
This gap is highest among younger athletes. Among those under 20 years of age it is $27,100, and among those 20 to 24 it is $29,700. Athletes who are 25 or older have a gap of roughly $15,000, although this gap has increased most significantly for those over 30, where the gap used to be closer to $5,000 annually. Athletes with the lowest annual deficit are involved in winter sports ($11,900) and team sports ($8,300), as well as athletes who are employed ($11,700). Deficits are highest, however, among athletes in summer sports ($27,100), individual sports ($28,900), as well as those with SR cards ($27,100). It is highest across the country among Francophone athletes ($39,900) and those living in Quebec ($38,000).
In terms of personal debt, on par with 2014, close to one in five athletes (18%) said that they have incurred some level of repayable debt in the pursuit of their athletic career. The numbers show a trend since 2004, where levels of debt have consistently lowered: in 2004, 45% said that they had debt, in 2009 24% had incurred debt, and in 2014 this was 20%. Results suggest that while athletes' personal debt levels are lowering, the families of athletes are carrying a significant portion of debt related to their development (see page 53).
The average gap between income and expenses in not significantly higher among those reporting loans (i.e., less than $3,000 higher than it is among those without loans), nor is the gap very different based on type of loan, largely because of the lack of cases to detect a statistically significant difference.
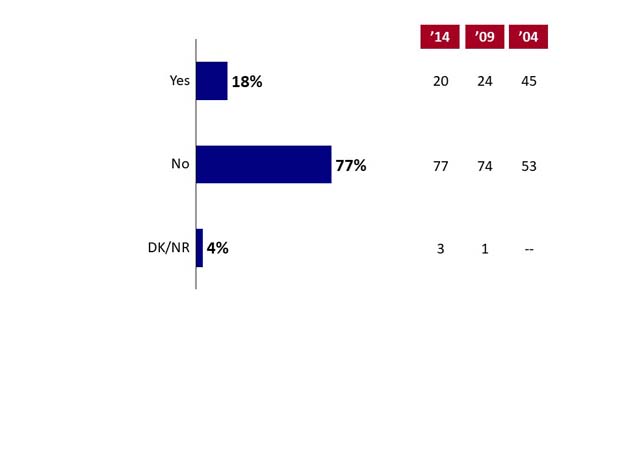
Q22a. Have you incurred any loans to assist you to pursue your athletic career?
Base: n=846
The 846 respondents in the 2019 survey responded as follows:
Yes, 18%
No, 77%
dk/nr, 4%
The respondents in the 2014 survey responded as follows:
Yes, 20%
No, 77%
dk/nr, 3%
The respondents in the 2009 survey responded as follows:
Yes, 24%
No, 74%
dk/nr, 1%
The respondents in the 2004 survey responded as follows:
Yes, 45%
No, 53%
dk/nr, --
With regard to the types of repayable loans, results are similar to the previous study. Loans from family (including parents, spouse, and friends) top the list at 65% of those who have taken loans (12% of all athletes). This is significantly higher than found in the past at 49% to 56%. Credit card debt is also significant at 44% among those with loans (8% of all athletes), although this is decreasing steadily over time from 2014 (49%) and 2009 (55%). One in four athletes with loans (26%; 5% of all athletes) received loans from financial institutions for something other than a mortgage. This has also been decreasing steadily over time from 2014 (35%) and 2009 (45%). Even student loans, with much better loan conditions, are lower at 25% of students with loans (5% of all athletes), compared with 2014 (29%), although similar to 2009. Overall, results suggest that families are bearing the brunt of supporting athletes, which is successfully keeping athletes out of debt to other, presumably higher interest sources.
When loan amounts are added together they amount to an average of just under $4,300 in repayable debt across all athletes. Including only the 18% of athletes with loans, however, the amount is almost $28,400.
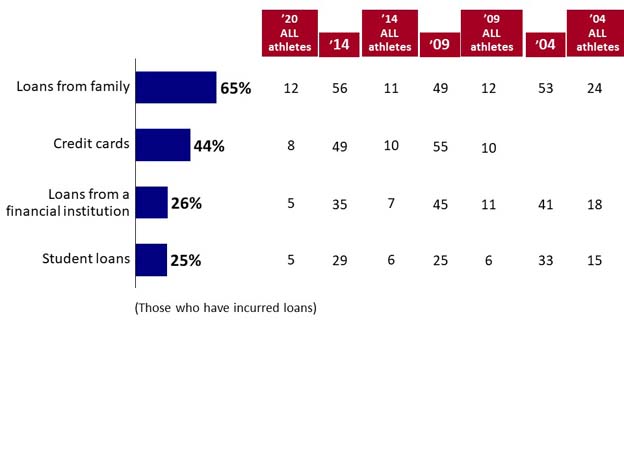
Q22b. Which of the following type of loans do you have currently?
Base: n=155
The 155 respondents in the 2019 survey responded as follows:
Loans from family, 65%
Credit cards, 44%
Loans from a financial institution, 26%
Student loans, 25%
(Those who have incurred loans)
The 155 respondents in the 2019 survey (all athletes) responded as follows:
Loans from family, 12%
Credit cards, 8%
Loans from a financial institution, 5%
Student loans, 5%
(Those who have incurred loans)
The respondents in the 2014 survey responded as follows:
Loans from family, 56%
Credit cards, 49%
Loans from a financial institution, 35%
Student loans, 29%
The respondents in the 2014 survey (all athletes) responded as follows:
Loans from family, 11%
Credit cards, 10%
Loans from a financial institution, 7%
Student loans, 6%
The respondents in the 2009 survey responded as follows:
Loans from family, 49%
Credit cards, 55%
Loans from a financial institution, 45%
Student loans, 25%
The respondents in the 2009 survey (all athletes) responded as follows:
Loans from family, 12%
Credit cards, 10%
Loans from a financial institution, 11%
Student loans, 6%
The respondents in the 2004 survey responded as follows:
Loans from family, 53%
Credit cards,
Loans from a financial institution, 41%
Student loans, 33%
The respondents in the 2004 survey (all athletes) responded as follows:
Loans from family, 24%
Credit cards,
Loans from a financial institution, 18%
Student loans, 15%
Athletes were also asked to indicate the extent to which they are dependent on various sources for financial or material support that they are not required to pay back. As in 2014 and 2009, Sport Canada's AAP is by far the most prevalent source of financial support; three in four (76%) rely on the AAP to a great extent. The next most relied-upon sources of financial support are family and Provincial/Territorial AAP, rated as strong sources by 42% and 46% of athletes, respectively.
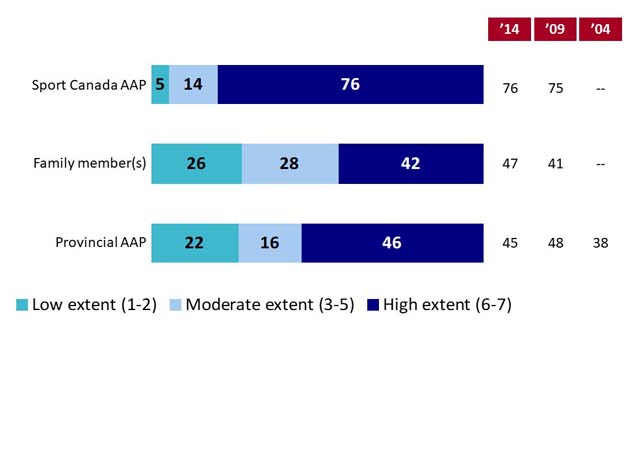
Q24a-b. To what extent do you depend on each of the following sources for financial or material support that you are not required to pay back?
Base: n=846
The 846 respondents in the 2019 survey responded as follows:
Sport Canada AAP
Low extent (1-2), 5%
Moderate extent (3-5), 14%
High extent (6-7), 76%
The respondents responded as follows in previous years (high extent 6-7):
2014, 76%
2009, 75%
2004, --
The 846 respondents in the 2019 survey responded as follows:
Family member(s)
Low extent (1-2), 26%
Moderate extent (3-5), 28%
High extent (6-7), 42%
The respondents responded as follows in previous years (high extent 6-7):
2014, 47%
2009, 41%
2004, --
The 846 respondents in the 2019 survey responded as follows:
Provincial AAP
Low extent (1-2), 22%
Moderate extent (3-5), 16%
High extent (6-7), 46%
The respondents responded as follows in previous years (high extent 6-7):
2014, 45%
2009, 48%
2004, 38%
Athletes were asked to indicate the extent to which money has been a barrier to accessing a variety of resources. Perceptions of money as a barrier to a high extent are roughly on par with 2014 and also fairly similar to 2009; the highest number is one in five athletes believing that money has been a significant barrier to international competitions. Note that in 2009 athletes were asked about “competitions” without the specification of international vs. domestic. After international competitions, money is seen as a significant barrier to obtaining sport science services for 18%; also on par with 2014, but marginally higher than in 2009 when it was posed as sport-related expenses. Appropriate nutrition, equipment, and proper housing are also areas where 13% to 15% have financial barriers. Money also presents a barrier in accessing coaching services, training facilities and domestic competitions for one in ten athletes.
Compared with athletes, coaches see money as a greater barrier for athletes for most of the aspects of sport tested – international competitions in particular, followed by sport medicine facilities, coaching services, proper housing, and training facilities.
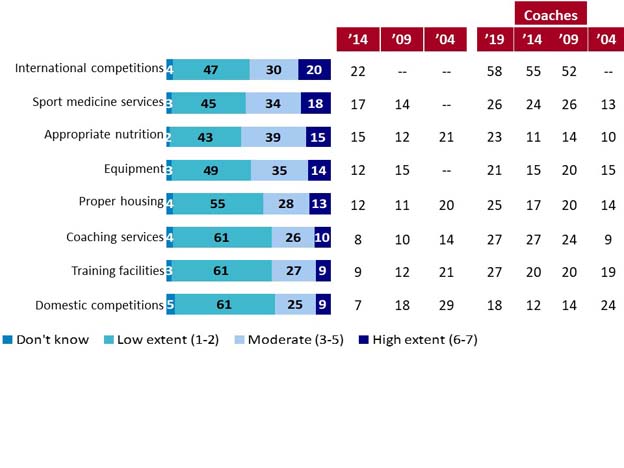
Q26a-h. Thinking about the last 12 months, how much has money been a barrier to your accessing each of the following?
Base: n=846
The 846 respondents in the 2019 survey responded as follows:
International competitions
Don’t know, 4%
Low extent (1-2), 47%
Moderate extent (3-5), 30%
High extent (6-7), 20%
The respondents responded as follows in previous years (high 6-7):
2014, 22%
2009, --
2004, --
Coaches 2019, 58%
Coaches 2014, 55%
Coaches 2009, 52%
Coaches 2004, --
The 846 respondents in the 2019 survey responded as follows:
Sport medicine services
Don’t know, 3%
Low extent (1-2), 45%
Moderate extent (3-5), 34%
High extent (6-7), 18%
The respondents responded as follows in previous years (high 6-7):
2014, 17%
2009, 14%
2004, --
Coaches 2019, 26%
Coaches 2014, 24%
Coaches 2009, 26%
Coaches 2004, 13%
The 846 respondents in the 2019 survey responded as follows:
Appropriate nutrition
Don’t know, 2%
Low extent (1-2), 43%
Moderate extent (3-5), 39%
High extent (6-7), 15%
The respondents responded as follows in previous years (high 6-7):
2014, 15%
2009, 12%
2004, 21%
Coaches 2019, 23%
Coaches 2014, 11%
Coaches 2009, 14%
Coaches 2004, 10%
The 846 respondents in the 2019 survey responded as follows:
Equipment
Don’t know, 3%
Low extent (1-2), 49%
Moderate extent (3-5), 35%
High extent (6-7), 14%
The respondents responded as follows in previous years (high 6-7):
2014, 12%
2009, 15%
2004, --
Coaches 2019, 21%
Coaches 2014, 15%
Coaches 2009, 20%
Coaches 2004, 15%
The 846 respondents in the 2019 survey responded as follows:
Proper housing
Don’t know, 4%
Low extent (1-2), 55%
Moderate extent (3-5), 28%
High extent (6-7), 13%
The respondents responded as follows in previous years (high 6-7):
2014, 12%
2009, 11%
2004, 20%
Coaches 2019, 25%
Coaches 2014, 17%
Coaches 2009, 20%
Coaches 2004, 14%
The 846 respondents in the 2019 survey responded as follows:
Coaching services
Don’t know, 4%
Low extent (1-2), 61%
Moderate extent (3-5), 26%
High extent (6-7), 10%
The respondents responded as follows in previous years (high 6-7):
2014, 8%
2009, 10%
2004, 14%
Coaches 2019, 27%
Coaches 2014, 27%
Coaches 2009, 24%
Coaches 2004, 9%
The 846 respondents in the 2019 survey responded as follows:
Training facilities
Don’t know, 3%
Low extent (1-2), 61%
Moderate extent (3-5), 27%
High extent (6-7), 9%
The respondents responded as follows in previous years (high 6-7):
2014, 9%
2009, 12%
2004, 21%
Coaches 2019, 27%
Coaches 2014, 20%
Coaches 2009, 20%
Coaches 2004, 19%
The 846 respondents in the 2019 survey responded as follows:
Domestic competitions
Don’t know, 5%
Low extent (1-2), 61%
Moderate extent (3-5), 25%
High extent (6-7), 9%
The respondents responded as follows in previous years (high 6-7):
2014, 7%
2009, 18%
2004, 29%
Coaches 2019, 18%
Coaches 2014, 12%
Coaches 2009, 14%
Coaches 2004, 24%
As follow-up questions, athletes were asked about the level of income at which AAP funds would no longer be necessary and for the minimum necessary amount they would need to support themselves and train full-time. Just as in previous years, about half of athletes (48%) want between $30,000 and $59,999 to not have to rely on AAP funding. This has also been 47% to 50% since 2004. In 2019 only 17% said they could get along with less than $30,000, which has decreased consistently as a proportion of carded athletes since 2004 when it was 35%.
The amount of personal income at which AAP would not be necessary continues to be a great deal more than the presumed amount needed to train full-time. There is a lean towards the upper end of the scale in a similar range to previous years at roughly $50,000 (i.e., only about a quarter to a third of athletes put the limit below $50,000 even as far back as 2004, although only one in four in 2019).
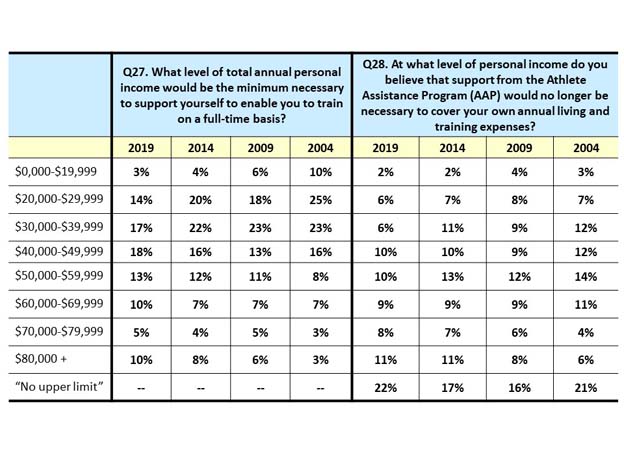
Base: n=846
The 846 respondents in the 2019 survey responded as follows:
$0,000-$19,999, 3%
$20,000-$29,999, 14%
$30,000-$39,999, 17%
$40,000-$49,999, 18%
$50,000-$59,999, 13%
$60,000-$69,999, 10%
$70,000-$79,999, 5%
$80,000 +, 10%
“No upper limit”, --
The respondents in the 2014 survey responded as follows:
$0,000-$19,999, 4%
$20,000-$29,999, 20%
$30,000-$39,999, 22%
$40,000-$49,999, 16%
$50,000-$59,999, 12%
$60,000-$69,999, 7%
$70,000-$79,999, 4%
$80,000 +, 8%
“No upper limit”, --
The respondents in the 2009 survey responded as follows:
$0,000-$19,999, 6%
$20,000-$29,999, 18%
$30,000-$39,999, 23%
$40,000-$49,999, 13%
$50,000-$59,999, 11%
$60,000-$69,999, 7%
$70,000-$79,999, 5%
$80,000 +, 6%
“No upper limit”, --
The respondents in the 2004 survey responded as follows:
$0,000-$19,999, 10%
$20,000-$29,999, 25%
$30,000-$39,999, 23%
$40,000-$49,999, 16%
$50,000-$59,999, 8%
$60,000-$69,999, 7%
$70,000-$79,999, 3%
$80,000 +, 3%
“No upper limit”, --
Q28. At what level of personal income do you believe that support from the Athlete Assistance Program (AAP) would no longer be necessary to cover your own annual living and training expenses?
Base: n=846
The 846 respondents in the 2019 survey responded as follows:
$0,000-$19,999, 2%
$20,000-$29,999, 6%
$30,000-$39,999, 6%
$40,000-$49,999, 10%
$50,000-$59,999, 10%
$60,000-$69,999, 9%
$70,000-$79,999, 8%
$80,000 +, 11%
“No upper limit”, 22%
The respondents in the 2014 survey responded as follows:
$0,000-$19,999, 2%
$20,000-$29,999, 7%
$30,000-$39,999, 11%
$40,000-$49,999, 10%
$50,000-$59,999, 13%
$60,000-$69,999, 9%
$70,000-$79,999, 7%
$80,000 +, 11%
“No upper limit”, 17%
The respondents in the 2009 survey responded as follows:
$0,000-$19,999, 4%
$20,000-$29,999, 8%
$30,000-$39,999, 9%
$40,000-$49,999, 9%
$50,000-$59,999, 12%
$60,000-$69,999, 9%
$70,000-$79,999, 6%
$80,000 +, 8%
“No upper limit”, 16%
The respondents in the 2004 survey responded as follows:
$0,000-$19,999, 3%
$20,000-$29,999, 7%
$30,000-$39,999, 12%
$40,000-$49,999, 12%
$50,000-$59,999, 14%
$60,000-$69,999, 11%
$70,000-$79,999, 4%
$80,000 +, 6%
“No upper limit”, 21%
Athletes were asked to provide their opinion on a number of statements relating to the Athlete Assistance Program (AAP). Athletes most often agree (83%) that the AAP has made it possible to achieve higher levels of athletic performance; only a small number (7%) disagrees that this is the case. These results are consistent across coaches and athletes over the past measurement periods.
Nearly half (49%) of athletes agree that the AAP is assisting or has assisted them in pursuing post-secondary education. This is a slight decrease from 2014, but consistent with 2009 results. Nonetheless, almost two in ten (19%) disagree. Agreement rises to 71% among those currently attending post-secondary education, although only 42% post-secondary graduates agree. Coaches are considerably more positive than the athletes on this point with 75% agreeing that AAP has assisted with post-secondary education. Agreement among coaches has gone down, however, from 82% in 2014.
Although athletes tend to agree that the AAP has helped make their training possible, relatively few (41%, although a slight increase from 35% in 2014 and 2009) feel the AAP funding is sufficient to meet their living and training needs. A higher proportion (46%) disagrees with this statement. This opinion is much less apt to be supported by coaches where only 22% believe that funding is sufficient.
In terms of timing of AAP funding, over one in four (27%) athletes agree that funding came too late in their career. Nearly half (48%) of athletes, however, disagree that the funding came too late. The trend over time is finding that less athletes agree that funding came too late since the high of 38% in 2004. Coaches share a similar view about AAP funding being received too late in the athletes' careers (30%), although agreement was as high as 42% in 2014, and 48% in 2009.
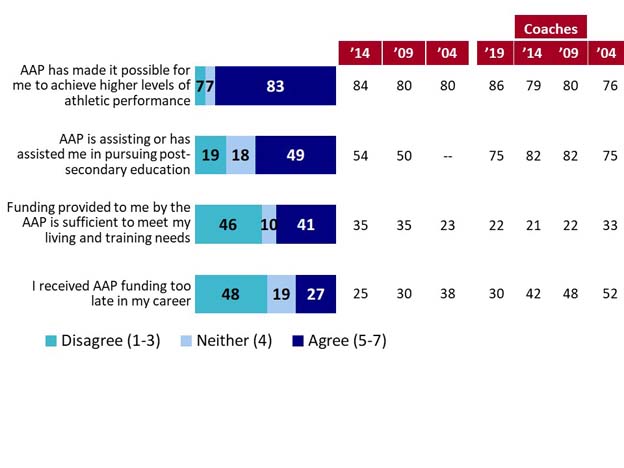
Q29a-d. To what extent do you agree or disagree with each of the following statements?
Base: n=846
The 846 respondents in the 2019 survey responded as follows:
AAP has made it possible for me to achieve higher levels of athletic performance
Disagree (1-3), 7%
Neither (4), 7%
Agree (5-7), 83%
The respondents responded as follows in previous years (agree 5-7):
2014, 84%
2009, 80%
2004, 80%
Coaches 2019, 86%
Coaches 2014, 79%
Coaches 2009, 80%
Coaches 2004, 76%
The 846 respondents in the 2019 survey responded as follows:
AAP is assisting or has assisted me in pursuing post-secondary education
Disagree (1-3), 19%
Neither (4), 18%
Agree (5-7), 49%
The respondents responded as follows in previous years (agree 5-7):
2014, 54%
2009, 50%
2004, --
Coaches 2019, 75%
Coaches 2014, 82%
Coaches 2009, 82%
Coaches 2004, 75%
The 846 respondents in the 2019 survey responded as follows:
Funding provided to me by the AAP is sufficient to meet my living and training needs
Disagree (1-3), 46%
Neither (4), 10%
Agree (5-7), 41%
The respondents responded as follows in previous years (agree 5-7):
2014, 35%
2009, 35%
2004, 23%
Coaches 2019, 22%
Coaches 2014, 21%
Coaches 2009, 22%
Coaches 2004, 33%
The 846 respondents in the 2019 survey responded as follows:
I received AAP funding too late in my career
Disagree (1-3), 48%
Neither (4), 19%
Agree (5-7), 27%
The respondents responded as follows in previous years (agree 5-7):
2014, 25%
2009, 30%
2004, 38%
Coaches 2019, 30%
Coaches 2014, 42%
Coaches 2009, 48%
Coaches 2004, 52%
Coaches who do not feel that AAP assistance is adequate to meet the living and training needs of athletes cite a variety of reasons, most commonly that the level of support is not high enough for the cost of the sport and associated travel and training, or that the support does not cover living expenses, particularly in major Canadian cities. A few argue that the level of support needs to be augmented with other income to be sufficient for training and living expenses. A few also mention that the level of support has not increased proportionally with the cost of living. As one coach articulated, “It's simply not enough dollars to get by. Athletes use that money for basic living requirements but also for expenses”.
As noted, 30% of coaches feel that athletes receive AAP funding too late in their career. Through open end responses, most of these coaches stated that the current funding model supports athletes who have already achieved success; as noted, “it's a reward for past performance” or that “we tend to prioritize funding once they get to the podium potential level”. Many coaches who feel funding comes too late state that funding should come earlier, often in teenage years, to aid in developing athletes to reach their potential and avoid elite athletes leaving the sport or the system (such as to NCAA).
Awareness of Tuition and Deferred Tuition, up to a lifetime maximum of $26,500 (in 2019 and will increase by $500 each year until it reaches $27,500), is strong among athletes with seven in ten (70%) aware of this support. Awareness of further AAP supplementary support services remains very low among athletes. Nearly one in three (31%) are aware of the supplementary support for the child dependant allowance, up to $6,000. Two in five (23%) athletes are aware that tuition and deferred tuition support can be applied to coaching courses; however, 70% are unaware, fewer than in 2014 (79%). A similar proportion are aware of supplementary support for excellence living and training allowance up to $6,000 (23%), or for training and competition allowance for Paralympic athletes with high support needs, up to $6,000 (20%).
As with 2014, coaches are more apt to be aware of the $5,500 ($5,000 in 2014) annual tuition assistance (82% awareness in 2019 and 61% in 2014) than athletes. In the case of some of the supplementary support programs, however, coaches are less familiar with the programs than athletes are (e.g. excellence living and training allowance, and training and competition allowance for Paralympic athletes with high support needs). Overall, awareness among coaches is considerably higher than it was in 2014.
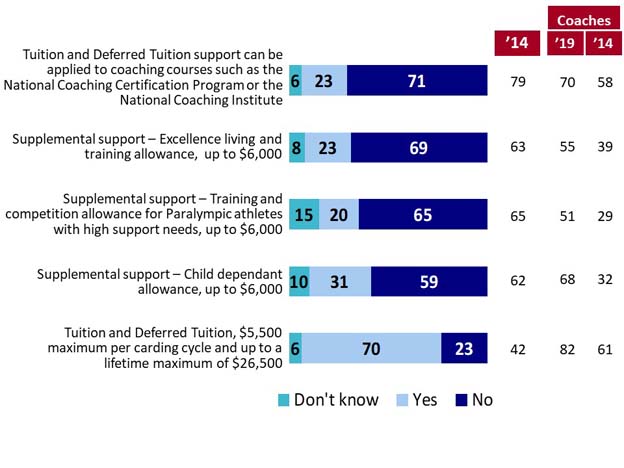
Q30a-d, Q31. Are you aware of these other AAP supplemental support services?
Base: n=846
The 846 respondents in the 2019 survey responded as follows:
Tuition and Deferred Tuition support can be applied to coaching courses such as the National Coaching Certification Program or the National Coaching Institute
Don’t know, 6%
Yes, 23%
No, 71%
The respondents responded as follows in previous years (no):
2014, 79%
Coaches 2019, 70%
Coaches 2014, 58%
The 846 respondents in the 2019 survey responded as follows:
Supplemental support – Excellence living and training allowance, up to $6,000
Don’t know, 8%
Yes, 23%
No, 69%
The respondents responded as follows in previous years (no):
2014, 63%
Coaches 2019, 55%
Coaches 2014, 39%
The 846 respondents in the 2019 survey responded as follows:
Supplemental support – Training and competition allowance for Paralympic athletes with high support needs, up to $6,000
Don’t know, 15%
Yes, 20%
No, 65%
The respondents responded as follows in previous years (no):
2014, 65%
Coaches 2019, 51%
Coaches 2014, 29%
The 846 respondents in the 2019 survey responded as follows:
Supplemental support – Child dependant allowance, up to $6,000
Don’t know, 10%
Yes, 31%
No, 59%
The respondents responded as follows in previous years (no):
2014, 62%
Coaches 2019, 68%
Coaches 2014, 32%
The 846 respondents in the 2019 survey responded as follows:
Tuition and Deferred Tuition, $5,500 maximum per carding cycle and up to a lifetime maximum of $26,500
Don’t know, 6%
Yes, 70%
No, 23%
The respondents responded as follows in previous years (no):
2014, 42%
Coaches 2019, 82%
Coaches 2014, 61%
CSC representatives were also asked about their awareness of three other AAP supplementary support for athletes: Child-care assistance; relocation assistance; and retirement assistance. Results indicate that awareness is high among CSC representatives, with nine or 10 respondents aware, out of the 13 in each case.
Generally CSC Presidents and Service Managers are also aware of supplementary support for Excellence living and training allowance, child dependant allowance and training and competition allowance for Paralympic athletes with high needs (9 to 11 out of 13), as well that Tuition and Deferred Tuition could be applied to coaching courses (10 of 13). When asked about other areas where they believe that Sport Canada should consider providing assistance, two CSC representatives stated that mandatory on-boarding and an annual renewal for athletes with their local CSI/CSC which would include Game Plan as a condition of receiving AAP funding would be helpful. Other areas included support for purchase of training related equipment and technologies, or funding for Paralympic athletes to participate in extra competitions to be classified.
Some coaches offered suggestions around the carding system such as carding for university athletes for a longer period and allowing more cards (including D cards) in the system. Some others specified the need for more supports, including extended health insurance (physio, dental, drug), post-career support, and increased funding levels to cover higher associated costs for para-athletes. A few said that athletes would benefit from a move away from the “one size fits all” approach as the funding and expense realities among all sports can be vastly different.
The main contact for athletes receiving AAP support is their NSO, however, from time to time athletes contact AAP staff for information about the Program or questions regarding the benefits of the Program. The study explored athletes' and coaches' levels of satisfaction with AAP staff. Contact with Sport Canada's AAP staff is relatively low among athletes; however, the contact has remained higher than in 2009. Similar to 2014, one in three (33%) have contacted Sport Canada AAP in the past 12 months compared with only 22% in 2009. This may be driven by the considerable increase in contact by email (see next page) and the addition of an AAP email address since 2009.
Athletes were asked if they felt they were served in the official language of their choice. Nearly all, 95%, stated that they were served in their language of choice, down slightly from 99% in 2014.
Coaches reported a higher incidence of contacting Sport Canada, with 62% indicating they have contacted the organization in the past year. Two in three CSC representatives (8 of the 13) indicated contact with AAP staff.
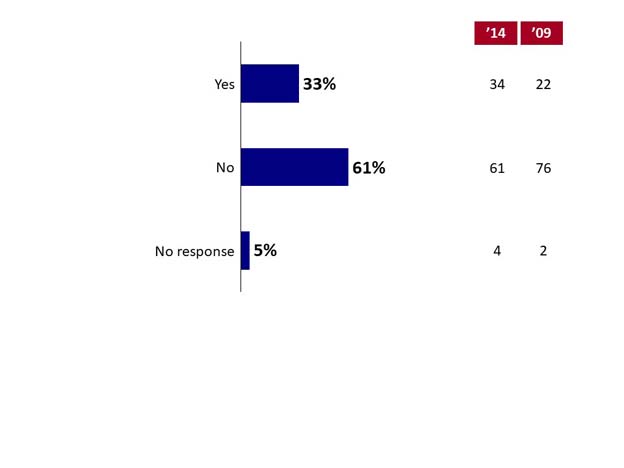
Q36. Have you contacted Sport Canada AAP staff in the past 12 months?
Base: n=846
The 846 respondents in the 2019 survey responded as follows:
Yes, 33%
No, 61%
No response, 5%
The respondents in the 2014 survey responded as follows:
Yes, 34%
No, 61%
No response, 4%
The respondents in the 2009 survey responded as follows:
Yes, 22%
No, 76%
No response, 2%
Email is by far the most prevalent method of contacting Sport Canada's AAP staff. The use of email for contact has increased from 53% in 2009 to 89% in 2019. Far fewer, 8%, are using the telephone as a method of contact, a notable decrease in the past decade from 39% in 2009. The use of traditional mail remains low at 2%.
Results for coaches and CSC representatives are similar, with the highest concentration of contact occurring by email, although one in four coaches contacted by telephone.
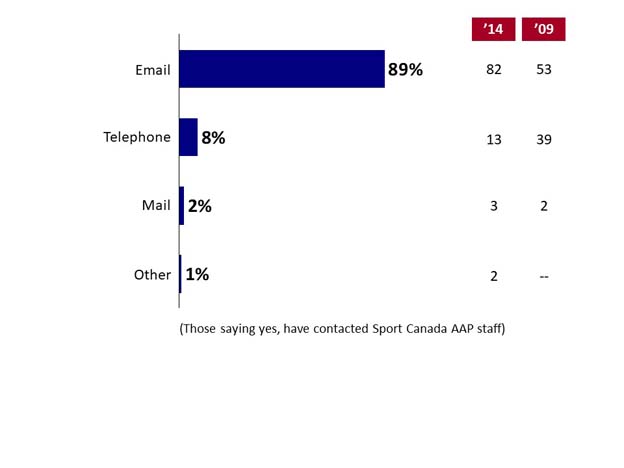
Q38. How did you contact the Sport Canada AAP staff?
Base: n=285
The 285 respondents in the 2019 survey responded as follows:
Email, 89%
Telephone, 8%
Mail, 2%
Other, 1%
(Those saying yes, have contacted Sport Canada AAP staff)
The respondents in the 2014 survey responded as follows:
Email, 82%
Telephone, 13%
Mail, 3%
Other, 2%
The respondents in the 2009 survey responded as follows:
Email, 53%
Telephone, 39%
Mail, 2%
Other, --
Satisfaction with the overall quality of service is high among athletes that have contacted Sport Canada's AAP staff. Most athletes were either satisfied (45%) or very satisfied (44%) with the overall quality of service they received when contacting Sport Canada. The proportion of those very satisfied have increased since 2014 when 39% indicated very satisfied, but remains lower than the 57% who were very satisfied in 2009.
Coaches were 85% satisfied or very satisfied with the overall quality of service from AAP staff; with 23% being satisfied and 62% very satisfied. Seven of the eight CSC representatives contacting AAP also said that they were satisfied or very satisfied. Each of the eight also felt that they were provided service in the language of their choice, as was also the case among coaches.
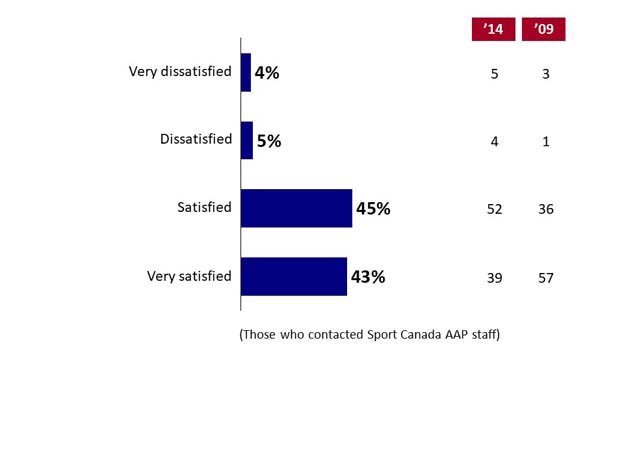
Q39. How satisfied were you with the overall quality of service you received?
Base: n=285
The 285 respondents in the 2019 survey responded as follows:
Very dissatisfied, 4%
Dissatisfied, 5%
Satisfied, 45%
Very satisfied, 43%
(Those who contacted Sport Canada AAP staff)
The respondents in the 2014 survey responded as follows:
Very dissatisfied, 5%
Dissatisfied, 4%
Satisfied, 52%
Very satisfied, 39%
The respondents in the 2009 survey responded as follows:
Very dissatisfied, 3%
Dissatisfied, 1%
Satisfied, 36%
Very satisfied, 57%
Athletes were asked about their satisfaction with their NSO athlete representative. Three in ten (30%) said that they did not know who their athlete representative is or indicated “don't know”. Of those who are familiar with their athlete representative, over half (54%) said that they are satisfied with the communication they have had with their NSO athlete representative, although 27% are neither satisfied nor dissatisfied, and one in five (20%) athletes expressed dissatisfaction with their NSO representative. Satisfaction is lower than the 58% reported in 2009, although an increase from the 48% in 2014.
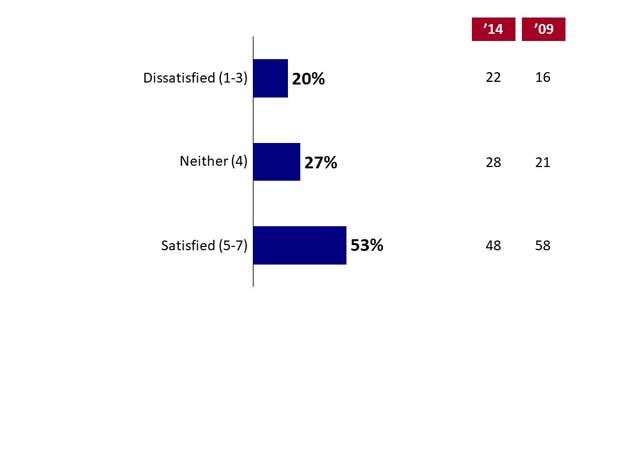
Q32. How satisfied are you with the contact and consultation that you have with your NSO athlete representative for your sport?
Base: n=607, those aware of athlete representative
The 607 respondents in the 2019 survey responded as follows:
Dissatisfied (1-3), 20%
Neither (4), 27%
Satisfied (5-7), 53%
The respondents in the 2014 survey responded as follows:
Dissatisfied (1-3), 22%
Neither (4), 28%
Satisfied (5-7), 48%
The respondents in the 2009 survey responded as follows:
Dissatisfied (1-3), 16%
Neither (4), 21%
Satisfied (5-7), 58%
Only one in four athletes indicates that they have a high-quality relationship with their National Sports Organization. The majority (55%) are fairly neutral, rating three, four or five out of seven. Ratings have fluctuated over time, the high point of 40% in 2009.
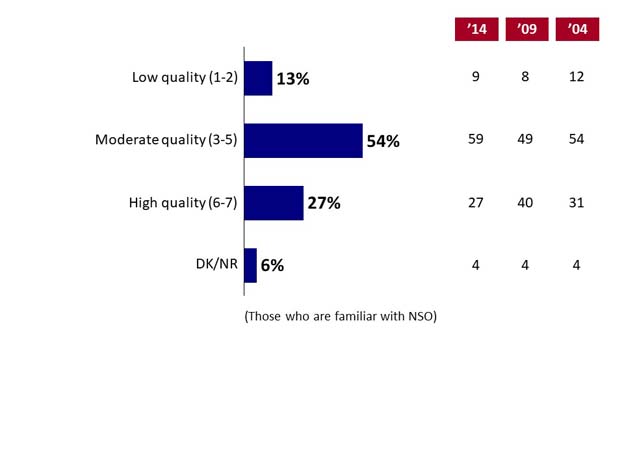
Q33. How would you rate the quality of your relationship with your National Sport Organization?
Base: n=607
The 607 respondents in the 2019 survey responded as follows:
Low quality (1-2), 13%
Moderate quality (3-5), 54%
High quality (6-7), 27%
dk/nr, 6%
(Those who are familiar with NSO)
The respondents in the 2014 survey responded as follows:
Low quality (1-2), 9%
Moderate quality (3-5), 59%
High quality (6-7), 27%
dk/nr, 4%
The respondents in the 2009 survey responded as follows:
Low quality (1-2), 8%
Moderate quality (3-5), 49%
High quality (6-7), 40%
dk/nr, 4%
The respondents in the 2004 survey responded as follows:
Low quality (1-2), 12%
Moderate quality (3-5), 54%
High quality (6-7), 31%
dk/nr, 4%
Survey results point to a moderately high level of awareness of AthletesCAN, with just over half (51%) of athletes claiming that they know its purpose. That said, two in five (41%) said that they are not familiar with this organization. These results are marginally lower than found in 2014 (56% aware) and 2009 (60% aware).
Even among those familiar, nearly one in three (32%) were not able to rate their satisfaction with the representation of AthletesCAN on issues relevant to their sport. Among those who could rate it, 21% indicated they were extremely satisfied. Over two in five (43%) rated their satisfaction as moderate and few rated their satisfaction as low (4%).
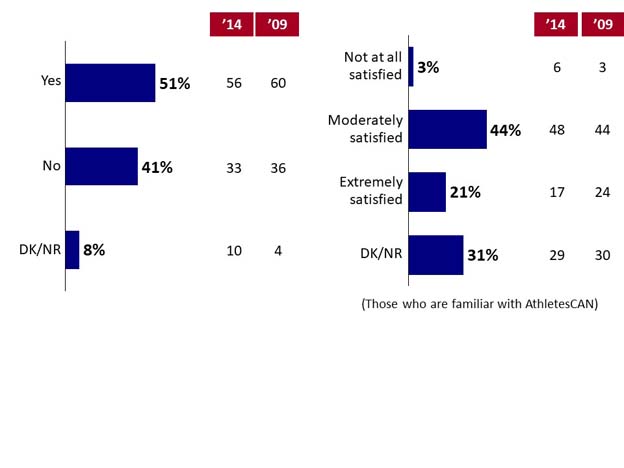
Q34. Do you know what the purpose of AthletesCAN is? Base: n=403
The 403 respondents in the 2019 survey responded as follows:
Yes, 51%
No, 41%
dk/nr, 8%
The respondents in the 2014 survey responded as follows:
Yes, 56%
No, 33%
dk/nr, 10%
The respondents in the 2009 survey responded as follows:
Yes, 60%
No, 36%
dk/nr, 4%
Q35. How satisfied are you with the athlete representation that you think AthletesCAN provides on issues relevant to your sport? Base: n=211
The 211 respondents in the 2019 survey responded as follows:
Not at all satisfied, 3%
Moderately satisfied, 44%
Extremely satisfied, 21%
dk/nr, 31%
(Those who are familiar with AthletesCAN)
The respondents in the 2014 survey responded as follows:
Not at all satisfied, 6%
Moderately satisfied, 48%
Extremely satisfied, 17%
dk/nr, 29%
(Those who are familiar with AthletesCAN)
The respondents in the 2009 survey responded as follows:
Not at all satisfied, 3%
Moderately satisfied, 44%
Extremely satisfied, 24%
dk/nr, 30%
(Those who are familiar with AthletesCAN)
Athletes were asked about their perceptions of the supportiveness of the Canadian sport system overall. One in three (33%, consistent with previous measurement periods) rated the system as supportive or very supportive, however, most athletes (60%) said that it is only moderately supportive, rating it a three, four or five out of seven. Only a handful of athletes (5%) gave it a lower rating.
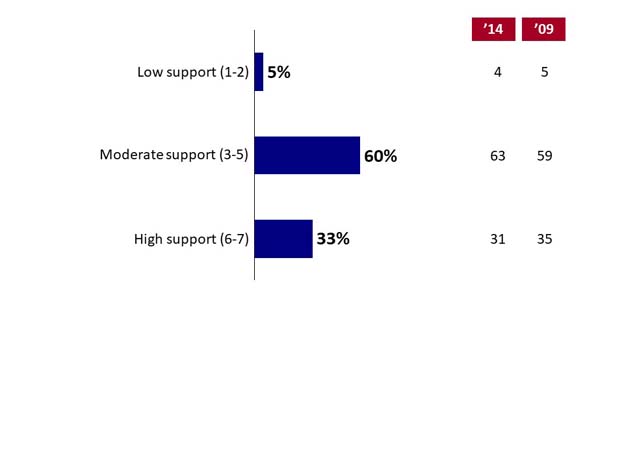
Q47. Thinking about what you need to reach your potential, how supportive would you say the Canadian sport system has been overall?
Base: n=846
The 846 respondents in the 2019 survey responded as follows:
Low support (1-2), 5%
Moderate support (3-5), 60%
High support (6-7), 33%
The respondents in the 2014 survey responded as follows:
Low support (1-2), 4%
Moderate support (3-5), 63%
High support (6-7), 31%
The respondents in the 2009 survey responded as follows:
Low support (1-2), 5%
Moderate support (3-5), 59%
High support (6-7), 35%
Coaches are similarly tepid in their view of the supportiveness of the Canada sport system, with 32% rating it a six or seven and another 63% giving it a three, four or five, again with the majority rating it a four or five. One in ten said that the system is poor in regards to supporting athletes reach their potential. CSC representatives are more positive about the Canadian sport system than athletes, with 7 out of the 13 rating it with a six or seven, and another five giving it a five.
Through closing comments in the survey, a few coaches advocated for the need for Sport Canada to work more closely with NSOs (through sharing of information, best practices, support mutual understanding), and for AAP to increase communication of programs to athletes. A few CSC representatives also identified the need for improved communication with athletes, NSOs, Athlete Services Managers, and the Canadian Olympic and Paralympic Sport Institute Network.
Nonetheless, the vast majority (88%) of carded athletes said that, if faced with the same decision again, they would still choose to become a high performance athlete. Only one in ten were less apt to agree. Again, results are similar to 2014 (89% agreed), and marginally less positive than they were in 2009 when 92% agreed.
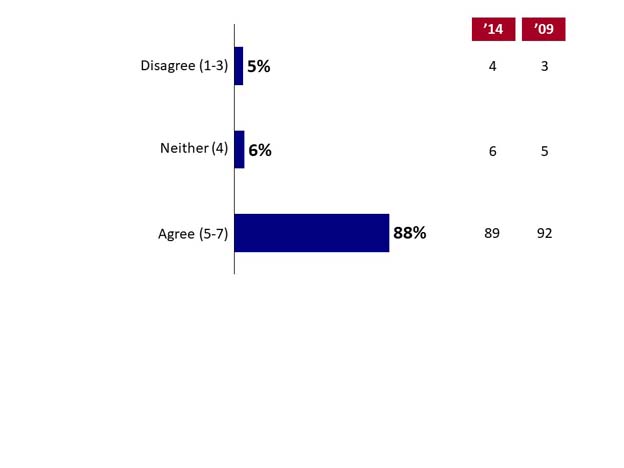
Q48. To what extent would you say you agree or disagree with the statement: If faced with the same decision again, I would still choose to become a high performance athlete?
Base: n=846, Don't know – 2%
The 846 respondents in the 2019 survey responded as follows:
Disagree (1-3), 5%
Neither (4), 6%
Agree (5-7), 88%
The respondents in the 2014 survey responded as follows:
Disagree (1-3), 4%
Neither (4), 6%
Agree (5-7), 89%
The respondents in the 2009 survey responded as follows:
Disagree (1-3), 3%
Neither (4), 5%
Agree (5-7), 92%
The results indicate that premature retirement is a significant concern among coaches. Three out of four coaches (74%) indicated they are aware of high performance athletes in their sport who have retired before reaching their full potential; higher than the 50% who believed this in 2014 although the question changed from more of a belief to an actual awareness in 2019. Nine of the 13 CSC representatives also believe that athletes retire prematurely. That said, 24% of athlete respondents to the survey are 30 years of age or older.
These 74% of coaches aware of athletes in their sport retiring too early were asked to identify what they believe to be the primary factors that motivate athletes to leave their sport. The results point to financial issues and outside career goals as the perceived leading causes of premature retirement. Fully seven in ten of these respondents rated the impact of insufficient income as important. Similarly, about half pointed to family commitments (60%), full-time career pursuits (53%), and conflicts with non-sports career goals (44%) as important. Other areas cited by one in three include lack of financial support, lack of placement on a national team or professional options, or general life balance.
According to CSC representatives, athletes often leave for a wide variety of reasons, but place injury at the top of the list (9 of 13). This is followed by 5 or 6 out of 13 pointing to inadequate technical support, insufficient income, conflict with non-sport career or educational goals, and dissatisfaction with performance. Other reasons offered by CSC representatives include difficulty managing stress, undesirable training environment, lack of transparency (in selection process, or unfair playing field), lack of support from NSO, or insufficient income.
ENG
Sport Canada Status of the Athlete Survey / Sondage sur la situation de l'athlète de Sport Canada
(La version française du message suit)
Dear Sir/Madam,
Ekos Research Associates has been commissioned by Sport Canada to conduct a survey of high performance athletes. This important study designed to provide up-to-date information on the needs of Canada's high performance athletes. This study looks at training, economic, social, education, work, and other areas of athletes' lives, as well as the environment of Canadian high performance sport. This research will help to develop policies and programs that are responsive to the needs of Canadian athletes and reflect the realities of international sport. The survey takes 20 minutes and by participating, your name will be entered into a lottery draw to win 1 of 4 prizes of $300. An electronic message informing you and National Sport Organizations about this survey was recently disseminated from Sport Canada. The survey is being conducted by Ekos Research Associates, an independent research consultant and only we will see your responses. Your answers are completely confidential. No results will be associated with any personal identities. The reporting of results will be rolled up into large categories of athletes (with no fewer than 30 people in any group reported), so that confidentiality may be protected. To participate, please visit the survey website at:
For an accessible version of the survey use the link here:
Note that this link contains an access code unique to you, so please do not forward it to others. Everyone will receive their own unique link. If you leave the survey before completing it, you can return to the survey URL later, and you will be returned to the page where you left off. Your answers up to that point in the survey will be saved. If you have any questions regarding this survey, please email us at athleteassistanceprogram@ekos.com or call us at 1-800-388-2873. You may also call Bob Price, Manager of the Athletes Assistance Program, at Sport Canada at (819) 956-8027 if you have any questions about the legitimacy of or context for the survey. Please note that the survey will close on February 10. Thank you in advance for your participation. Susan Galley
Senior Vice President, Quantitative Research
Telephone (613) 235-7215 ext. 123
Facsimile (613) 235-8498
Madame/Monsieur,
Sport Canada a chargé Les Associés de recherche Ekos d'effectuer un sondage auprès des athlètes canadiens de haut niveau. Le but de cette recherche est d'obtenir une information à jour sur les besoins des athlètes de haut niveau. L'étude porte sur la formation, la situation socioéconomique, les études, le travail et divers autres aspects de la vie d'un athlète, de même que sur l'environnement de la pratique sportive de haut niveau au Canada. La présente recherche vise à actualiser des politiques et des programmes qui répondent aux besoins des athlètes canadiens et qui reflètent la réalité du sport à l'échelle internationale. Il vous faudra environ 20 minutes pour répondre au questionnaire, nous allons inscrire votre nom en vue d'un tirage au sort s'apparentant à une loterie. Vous aurez une chance de gagner l'un des 4 prix de 300 $. Sport Canada a adressé récemment aux organismes nationaux de sport un message électronique pour les informer de la tenue du présent sondage. Le sondage est mené par les Associés de recherche Ekos, une maison de recherche indépendante, et nous serons les seuls à prendre connaissance de vos réponses. Celles-ci vont demeurer absolument confidentielles. Aucun résultat ne pourra être attribué à quelqu'un en particulier. Pour le rapport, les résultats seront groupés en de grandes catégories d'athlètes (tout groupe dont le rapport fera état sera composé d'au moins 30 personnes), de manière à garantir l'anonymat des répondants. Pour participer, veuillez vous rendre dans le site Web du sondage à cette adresse:
Pour une version du sondage accessible, utilisez ce lien :
Précisons que ce lien renferme un code d'accès qui vous appartient en propre; par conséquent veuillez ne pas le transmettre à quelqu'un d'autre. Chaque répondant aura son lien unique en soi. Si vous quittez le sondage avant de l'avoir terminé, vous pourrez recomposer l'adresse URL plus tard pour être ramené à la page où vous étiez en quittant. Les réponses que vous aurez données jusque là auront été sauvegardées. Pour toute question au sujet du présent sondage, veuillez adresser un courriel à athleteassistanceprogram@ekos.com ou nous téléphoner au 1-800-388-2873. Vous pourrez également communiquer avec Bob Price, gestionnaire du Programme d'aide aux athlètes à Sport Canada, au (819) 956-8027, si vous avez des questions concernant l'authenticité de ce sondage ou son contexte. Veuillez noter que le sondage se termine le 10 février. Merci à l'avance de votre participation. Susan Galley
Vice-présidente principale, Recherche quantitative
Téléphone (613) 235-7215, poste 123
Télécopieur (613) 235-8498
WINTRO
Ekos Research Associates has been commissioned by Sport Canada to conduct a survey of high performance athletes. The purpose of this research is to provide up-to-date information on the needs of Canada's high performance athletes. This study looks at training, economic, social, education, work, and other areas of athletes' lives, as well as the environment of Canadian high performance sport. This research will help to develop policies and programs that are responsive to the needs of Canadian athletes and reflect the realities of international sport. The survey takes about 20 minutes and by completing this survey, your name will be entered into a lottery-style draw to win 1 of 4 prizes of $300. Your participation is voluntary and completely confidential. Any information you provide will be administered in accordance with the Privacy Act and other applicable privacy laws.
If you leave the survey before completing it, you can return to the survey URL later, and you will be returned to the page where you left off. Your answers up to that point in the survey will be saved.
If you have any questions about how to complete the survey, please call Ekos Research Associates at 1-800-388-2873 or send an email to athleteassistanceprogram@ekos.com. Thank you in advance for your participation.
Continue 1 DI
Q1 [1,3]
There are a number of reasons why a person might become a high performance athlete. Which of the following are the top three factors in your decision to pursue an athletic career?
Desire to win 1
Pursuit of excellence 2
Money/material rewards 3
Fame and glory 4
National pride 5
Pure enjoyment of physical activity 6
Enjoyable lifestyle 7
Influence of family/peers 8
Personal/self development 9
Motivated by a role model 10
Encouraged by a coach or instructor 11
Pursue professional career in sport 12
For the love of sport 13
Other (please specify) 77 B
Don't know/No response 99 BX
PQ2
Following is a list of factors that can influence how satisfied you are with your career as a high performance athlete. Using the scale provided, to what extent are you satisfied with the following aspects of your experience in high performance sport?
Q2A
Your level of achievement/performance
Extremely dissatisfied 1 1
2 2
3 3
Neither 4 4
5 5
6 6
Extremely satisfied 7 7
Don't know/ Not applicable 99 S
Q2B
The recognition you receive
Extremely dissatisfied 1 1
2 2
3 3
Neither 4 4
5 5
6 6
Extremely satisfied 7 7
Don't know/ Not applicable 99 S
Q2C
Enjoyment you get from your sport
Extremely dissatisfied 1 1
2 2
3 3
Neither 4 4
5 5
6 6
Extremely satisfied 7 7
Don't know/ Not applicable 99 S
Q2D
The amount of income/material rewards derived from your involvement in sport
Extremely dissatisfied 1 1
2 2
3 3
Neither 4 4
5 5
6 6
Extremely satisfied 7 7
Don't know/ Not applicable 99 S
Q2E
Confidence in a doping-free Canadian sport environment
Extremely dissatisfied 1 1
2 2
3 3
Neither 4 4
5 5
6 6
Extremely satisfied 7 7
Don't know/ Not applicable 99 S
Q2F
Experiencing a violence-free Canadian sport environment
Extremely dissatisfied 1 1
2 2
3 3
Neither 4 4
5 5
6 6
Extremely satisfied 7 7
Don't know/ Not applicable 99 S
Q2G
Treated with respect within your Canadian sport environment
Extremely dissatisfied 1 1
2 2
3 3
Neither 4 4
5 5
6 6
Extremely satisfied 7 7
Don't know/ Not applicable 99 S
Q2H
Experiencing a harassment/abuse-free Canadian sport environment
Extremely dissatisfied 1 1
2 2
3 3
Neither 4 4
5 5
6 6
Extremely satisfied 7 7
Don't know/ Not applicable 99 S
Q2I
Experiencing a safe Canadian sport environment
Extremely dissatisfied 1 1
2 2
3 3
Neither 4 4
5 5
6 6
Extremely satisfied 7 7
Don't know/ Not applicable 99 S
Q2J
Experiencing a fair and inclusive Canadian sport environment
Extremely dissatisfied 1 1
2 2
3 3
Neither 4 4
5 5
6 6
Extremely satisfied 7 7
Don't know/ Not applicable 99 S
Q3
Do you have a written annual training and competition plan that is tailored to you specifically?
Yes 1
No 2 -Q7
Don't know/No response 99 -Q7
Q4
If... Q3 = 1
Who is primarily responsible for developing your annual training and competition plan?
National Team Coach 1
Discipline Coach 2
Personal Coach 3
Yourself 4 -Q6
Combination of above 5
Other (please specify) 77
Don't know/No response 99 -Q6
Q5
If... Q3 = 1
How satisfied are you with the extent of input that you had into the development of your training and competition plan?
1 Not at all satisfied 1
2 2
3 3
4 Moderately satisfied 4
5 5
6 6
7 Extremely satisfied 7
Don't know/No response 99
Q6
If... Q3 = 1
How satisfied are you with your training and competition plan overall?
1 Not at all satisfied 1
2 2
3 3
4 Moderately satisfied 4
5 5
6 6
7 Extremely satisfied 7
Don't know/No response 99
Q7
Which of these best describes your sport-specific principal coach?
My coach is employed by my National Sport Organization (NSO) on a full-time basis 1
My coach is employed or contracted by my NSO on a part-time basis 2
My coach is my personal coach (i.e. not employed or contracted by my NSO) 3
There is no one person whom I regard as my principal coach 4 -Q10
Other (please specify) 77
Don't know/No response 99
Q8P
If... Q7 not = 4
The next few questions are referring to this same "principal coach".
Q8
If... Q7 not = 4
On average, how many hours per week do you have contact with your principal coach during training and competition periods?
Hours per week 1 >
Don't know/No response 99
Q8A
If... Q7 not = 4
How much do you pay annually, on average for the services provided by principal coach?
Fee per year 1 >
Don't know/No response 99
PQ9
If... Q7 not = 4
How satisfied are you with the following about your principal coach?
Q9A
If... ROTQ9 = 1,3
Amount of time they spend with you
Not at all satisfied 1 1
2 2
3 3
Moderately satisfied 4 4
5 5
6 6
Extremely satisfied 7 7
Don't know 99 S
Q9B
If... ROTQ9 = 2,3
Technical expertise
Not at all satisfied 1 1
2 2
3 3
Moderately satisfied 4 4
5 5
6 6
Extremely satisfied 7 7
Don't know 99 S
Q9C
If... Q7 not = 4
Overall quality of coaching
Not at all satisfied 1 1
2 2
3 3
Moderately satisfied 4 4
5 5
6 6
Extremely satisfied 7 7
Don't know 99 S
Q10
What was the average number of hours per week you devoted to your sport during the training and competitive period in the past year? Please include the time you devoted to training, meetings with coaches and sport scientists, competitions, travel, recovery activities, etc.
Hours per week 1 >
Don't know/No response 99
PQ11
How adequate or inadequate are each of the following to support your Olympic/ Paralympic/World Championship aspiration?
Q11A
The type of competition experience you are getting
Not at all adequate 1 1
2 2
3 3
Moderately adequate 4 4
5 5
6 6
Completely adequate 7 7
Don't know/ Not applicable 99 S
Q11B
The amount of competition experience you are getting
Not at all adequate 1 1
2 2
3 3
Moderately adequate 4 4
5 5
6 6
Completely adequate 7 7
Don't know/ Not applicable 99 S
Q11C
The quality of training you are getting
Not at all adequate 1 1
2 2
3 3
Moderately adequate 4 4
5 5
6 6
Completely adequate 7 7
Don't know/ Not applicable 99 S
Q11D
The amount of training experience you are getting
Not at all adequate 1 1
2 2
3 3
Moderately adequate 4 4
5 5
6 6
Completely adequate 7 7
Don't know/ Not applicable 99 S
Q11E
The sport science and sport medicine services you are getting during training
Not at all adequate 1 1
2 2
3 3
Moderately adequate 4 4
5 5
6 6
Completely adequate 7 7
Don't know/ Not applicable 99 S
Q11F
The sport science and sport medicine services you are getting during competition periods
Not at all adequate 1 1
2 2
3 3
Moderately adequate 4 4
5 5
6 6
Completely adequate 7 7
Don't know/ Not applicable 99 S
Q11G
The physical access you have to high quality training facilities
Not at all adequate 1 1
2 2
3 3
Moderately adequate 4 4
5 5
6 6
Completely adequate 7 7
Don't know/ Not applicable 99 S
Q11H
Financial support from all sources
Not at all adequate 1 1
2 2
3 3
Moderately adequate 4 4
5 5
6 6
Completely adequate 7 7
Don't know/ Not applicable 99 S
PQ12
Thinking about the last 12 months, how satisfied or dissatisfied have you been with your access to the following services in the official language of your choice?
Q12A
Coaching services provided by your National Sport Organisation (NSO)
Not at all satisfied 1 1
2 2
3 3
Moderately satisfied 4 4
5 5
6 6
Extremely satisfied 7 7
Don't know/ Not applicable 99 S
Q12B
General services (including communications) from your National Sport Organisation (NSO)
Not at all satisfied 1 1
2 2
3 3
Moderately satisfied 4 4
5 5
6 6
Extremely satisfied 7 7
Don't know/ Not applicable 99 S
Q12C
General services (including communications) from your Canadian Sport Institute (CSI)
Not at all satisfied 1 1
2 2
3 3
Moderately satisfied 4 4
5 5
6 6
Extremely satisfied 7 7
Don't know/ Not applicable 99 S
Q13
Were you able to access all the sport science and sport medicine services you needed over the last 12 months from your Canadian Sport Institute (CSI)?
Yes 1
No 2
Don't know/No response 99
Q13B
Do you feel there is sufficient information available about the type of sport science and sport medicine services available from your Canadian Sport Institute (CSI)?
Yes 1
No 2
Don't know/No response 99
Q14
Are you aware of the types of services that are available from Game Plan at your Canadian Sport Institute (CSI)?
Yes 1
No 2
Don't know/No response 99
Q14B
If... Q14 = 1
Have you used any of the Game Plan services?
Yes 1
No 2
Don't know/No response 99
Q14C
If... Q14B = 1
How satisfied would you say you are with the Game Plan services you have received?
1 Not at all satisfied 1
2 2
3 3
4 Moderately satisfied 4
5 5
6 6
7 Extremely satisfied 7
Not applicable 98
Don't know 99
Q15 [1,9]
Which of the following sport science services would you consider to be important to you in terms of the positive impact that they can have on your performance?
Select all that apply
Biomechanics 1
Fitness testing 2
Nutrition 3
Individual athlete performance analysis Measurement and analysis of an individual athlete's performance over time to determine progression toward specific performance goals in the annual training plan. 4
International competition performance analysis Collection of athlete performance in international competition over time to understand: Canadian athlete standing relative to world performance. Establish performance pathways and gold medal profiles over Olympic/Paralympic cycles. Understand ranking of Canadians athletes in the world to establish short and long term performance goals and requisite training and competitive programs. 5
Physiology assessment and monitoring 6
Sport psychology 7
Skill/technique analysis 8
Strength and conditioning 9
None 98 BX
Don't know 99 BX
Q16 [1,9]
Not NA/DK/NR, Q15; Only showing items selected, Q15
If... Q15 = 1-9
Thinking about the quality of the sport science services you have received from the CSI over the last 12 months, which ones, if any, would you say are in need of improvement?
Select all that apply
Q15 = 1
Biomechanics 1
Q15 = 2
Fitness testing 2
Q15 = 3
Nutrition 3
Q15 = 4
Individual athlete performance analysis Measurement and analysis of an individual athlete's performance over time to determine progression toward specific performance goals in the annual training plan. 4
Q15 = 5
International competition performance analysis Collection of athlete performance in international competition over time to understand: Canadian athlete standing relative to world performance. Establish performance pathways and gold medal profiles over Olympic/Paralympic cycles. Understand ranking of Canadians athletes in the world to establish short and long term performance goals and requisite training and competitive programs. 5
Q15 = 6
Physiology assessment and monitoring 6
Q15 = 7
Sport psychology 7
Q15 = 8
Skill/technique analysis 8
Q15 = 9
Strength and conditioning 9
No improvement necessary 98 BX
Don't know 99 BX
Q17 [1,9]
Which of the following sport medicine services would you consider to be important to you in terms of the positive impact that they can have on your performance?
Select all that apply
Chiropractic 1
Massage 2
Osteopathy 3
Physiotherapy 4
Podiatry 5
Advice/treatment from a sport doctor (e.g. team doctor, CSI-based doctor) 6
Athletic therapy 7
Physical health assessments and care 8
Mental health assessments and care 9
None 98 BX
Don't know 99 BX
Q18 [1,9]
Not NA/DK/NR, Q17; Only showing items selected, Q17
If... Q17 = 1-9
Thinking about the quality of the sport medicine services you have received from the CSI over the last 12 months, which ones, if any, would you say are in need of improvement?
Select all that apply
Q17 = 1
Chiropractic 1
Q17 = 2
Massage 2
Q17 = 3
Osteopathy 3
Q17 = 4
Physiotherapy 4
Q17 = 5
Podiatry 5
Q17 = 6
Advice/treatment from a sport doctor (e.g. team doctor, CSI-based doctor) 6
Q17 = 7
Athletic therapy 7
Q17 = 8
Physical health assessments and care 8
Q17 = 9
Mental health assessments and care 9
No improvement necessary 98 BX
Don't know 99 BX
PQ19A
The following section will help to profile the current economic situation for carded athletes and the potential need for assistance. Please be assured that all responses will be seen only by the research team at Ekos Research and will be kept completely confidential. No data sent back to Sport Canada will enable the identification of individual athletes.
PQ20
What was the approximate breakdown of your gross annual income (i.e., before taxes are deducted) in 2018 from each of the following sources:
Please enter numbers without commas and enter zero if no income is received from a specific source on an annual basis.
Q20F
Employment - full or part-time
Gross annual income 1
Don't know/ No response 99 S
Q20G
Sport Canada's Athlete Assistance Program
Gross annual income 1
Don't know/ No response 99 S
Q20A
Provincial/Territorial government athlete assistance
Gross annual income 1
Don't know/ No response 99 S
Q20B
NSO direct support - performance bonus, living and training subsidy etc.
Gross annual income 1
Don't know/ No response 99 S
Q20C
Sport-related income - pro-salary, prize money, sponsorship, endorsements, athletic scholarship etc.
Gross annual income 1
Don't know/ No response 99 S
Q20D
Sport awards - RONA, HBC, Petro Canada, Bell, Investors Group, RBC, VISA, CAN Fund, Fast Canada, COC Athlete Excellence Fund, Fondation de l'athlète d'excellence du Québec, Fondation Nordiques etc.
Gross annual income 1
Don't know/ No response 99 S
Q20E
Other - donations, employment insurance or social assistance, interest or dividends, provincial/territorial sport organization financial support, etc.
Gross annual income 1
Don't know/ No response 99 S
Q22A
Have you incurred any loans to assist you to pursue your athletic career?
Yes 1
No 2
Don't know/No response 99
Q22B [1,5]
Loans, Q22A
If... Q22A = 1
Which of the following type of loans do you have currently?
Select all that apply
Government student loans 1
Loans from parents, spouse, friend 2
Loans from financial institutions (excluding mortgages) 3
Credit cards 4
Other (please specify) 77
Don't know/No response 99 X
Q23
Loans, Q22A
If... Q22A = 1
Approximately how much would you say that you owe in loans where there is an expectation that they will be paid back?
Amount owed 1 >
Don't know / No response 99
PQ24
To what extent do you depend on each of the following sources for financial or material support that you are not required to pay back?
Q24A
Family member(s) (Parents, spouse/partner, sister, friends, etc...)
No extent at all 1 1
2 2
3 3
Moderate extent 4 4
5 5
6 6
Great extent 7 7
Don't know/ Not applicable 99 S
Q24B
Sport Canada AAP
No extent at all 1 1
2 2
3 3
Moderate extent 4 4
5 5
6 6
Great extent 7 7
Don't know/ Not applicable 99 S
Q24C
Provincial/territorial AAP
No extent at all 1 1
2 2
3 3
Moderate extent 4 4
5 5
6 6
Great extent 7 7
Don't know/ Not applicable 99 S
PQ25
What are the approximate average monthly expenses you incur in each of the following areas?
Please enter numbers without commas and enter zero if no expenses are incurred on a monthly basis.
Q25A
Housing (including mortgage/rent, utilities and all housing related expenses)
Amount 1
Don't know/ No response 99 S
Q25B
Living expenses - food, clothing, transportation etc
Amount 1
Don't know/ No response 99 S
Q25C
Sport expenses - equipment, competition entry fees, coaching fees, travel, facility user fees etc
Amount 1
Don't know/ No response 99 S
Q25D
Other (any other monthly expenses not accounted for above)
Amount 1
Don't know/ No response 99 S
PQ26
Thinking about the last 12 months, how much has money been a barrier to your accessing each of the following:
Q26A
Appropriate nutrition
No extent at all 1 1
2 2
3 3
Moderate extent 4 4
5 5
6 6
Great extent 7 7
Don't know 99 S
Q26B
Coaching services
No extent at all 1 1
2 2
3 3
Moderate extent 4 4
5 5
6 6
Great extent 7 7
Don't know 99 S
Q26C
Domestic Competitions
No extent at all 1 1
2 2
3 3
Moderate extent 4 4
5 5
6 6
Great extent 7 7
Don't know 99 S
Q26D
International Competitions
No extent at all 1 1
2 2
3 3
Moderate extent 4 4
5 5
6 6
Great extent 7 7
Don't know 99 S
Q26E
Equipment
No extent at all 1 1
2 2
3 3
Moderate extent 4 4
5 5
6 6
Great extent 7 7
Don't know 99 S
Q26F
Proper housing
No extent at all 1 1
2 2
3 3
Moderate extent 4 4
5 5
6 6
Great extent 7 7
Don't know 99 S
Q26G
Sport medicine services
No extent at all 1 1
2 2
3 3
Moderate extent 4 4
5 5
6 6
Great extent 7 7
Don't know 99 S
Q26H
Training facilities
No extent at all 1 1
2 2
3 3
Moderate extent 4 4
5 5
6 6
Great extent 7 7
Don't know 99 S
Q27
Approximately what level of total gross annual personal income (before taxes are deducted) would be the minimum necessary to support yourself and enable you to train on a full-time basis?
Less than $20,000 1
$20,000-$29,999 2
$30,000-$39,999 3
$40,000-$49,999 4
$50,000-$59,999 5
$60,000-$69,999 6
$70,000-$79,999 7
$80,000-$99,999 8
$100,000-$119,999 9
$120,000 or more 10
Don't know/No response 99
Q28
At what level of total gross annual personal income (before taxes are deducted) do you believe that support from the AAP would no longer be necessary to cover your own annual living expenses?
Less than $20,000 1
$20,000-$29,999 2
$30,000-$39,999 3
$40,000-$49,999 4
$50,000-$59,999 5
$60,000-$69,999 6
$70,000-$79,999 7
$80,000-$99,999 8
$100,000-$119,999 9
$120,000 or more 10
Do not believe that there should be an upper limit on personal income for AAP 98
Don't know/No response 99
PQ29
The following reflect various views on Sport Canada financial support for athletes.
Please indicate the extent to which you agree or disagree with each of the following statements.
Q29A
The AAP has made it possible for me to achieve higher levels of athletic performance
Strongly disagree 1 1
2 2
3 3
Neither 4 4
5 5
6 6
Strongly agree 7 7
Don't know 99 S
Q29B
The funding provided to me by the AAP is sufficient to meet my living and training needs
Strongly disagree 1 1
2 2
3 3
Neither 4 4
5 5
6 6
Strongly agree 7 7
Don't know 99 S
Q29C
I received AAP funding too late in my career
Strongly disagree 1 1
2 2
3 3
Neither 4 4
5 5
6 6
Strongly agree 7 7
Don't know 99 S
Q29D
AAP is assisting or has assisted me in pursuing post-secondary education
Strongly disagree 1 1
2 2
3 3
Neither 4 4
5 5
6 6
Strongly agree 7 7
Don't know 99 S
PQ30
Are you aware of these other AAP supplemental support services?
Q30A
Tuition and Deferred Tuition, $5,500 maximum per carding cycle and up to a lifetime maximum of $26,500 as of April 2019
Yes 1
No 2
Don't know 99 S
Q30B
Supplemental support – Excellence living and training allowance, up to $6,000
Yes 1
No 2
Don't know 99 S
Q30C
Supplemental support – Child dependant allowance, up to $6,000
Yes 1
No 2
Don't know 99 S
Q30D
Supplemental support – Training and competition allowance for Paralympic athletes with high support needs, up to $6,000
Yes 1
No 2
Don't know 99 S
Q31
Did you know that Tuition and Deferred Tuition support can be applied to coaching courses such as the National Coaching Certification Program or the National Coaching Institute?
Yes 1
No 2
Don't know 99
Q32
How satisfied are you with the contact and consultation that you have with your NSO athlete representative for your sport?
1 Extremely dissatisfied 1
2 2
3 3
4 Neither 4
5 5
6 6
7 Extremely satisfied 7
Not aware of who my athlete representative is 98
Don't know/No response 99
Q33
Aware, Q32 1-7
If... Q32 = 1-7
How would you rate the quality of your relationship with your NSO?
1 Extremely low quality 1
2 2
3 3
4 Moderate quality 4
5 5
6 6
7 Extremely high quality 7
Don't know/No response 99
Q34
Half-sample, Q34
If... ROTQ34 = 1
Do you know what the purpose of AthletesCAN is?
Yes 1
No 2
Don't know/No response 99
Q35
Yes, Q34
If... Q34 = 1
How satisfied are you with the athlete representation that you think AthletesCAN provides on issues relevant to your sport?
Not at all satisfied 1
Moderately satisfied 2
Extremely satisfied 3
Don't know enough to comment 99
Q36
The main contact for athletes receiving AAP support is their NSO, however from time to time athletes contact AAP staff for information about the Program or questions regarding the benefits of the Program. The following section is designed to ascertain your satisfaction as an athlete with the service provided by AAP staff.
Have you contacted Sport Canada AAP staff in the past 12 months?
Yes 1
No 2
No response 99
Q37A
Yes, Q36
If... Q36 = 1
Do you feel that athlete voices have an impact in decision-making at your National Sport Organization (NSO)?
Yes 1
No 2
No response 99
Q37B
Yes, Q36
If... Q36 = 1
Did you feel that you were being served in the language of your choice (i.e., English or French)?
Yes 1
No 2
No response 99
Q38
Yes, Q36
If... Q36 = 1
How did you contact the Sport Canada AAP staff?
(Please select main method if you used more than one)
Telephone 1
Email 2
Mail 3
Fax 4
Other (please specify) 77 B
No response 99 B
Q39
Yes, Q36
If... Q36 = 1
How satisfied were you with the overall quality of service you received?
Very dissatisfied 1
Dissatisfied 2
Satisfied 3
Very satisfied 4
Not used/Not applicable 98
Don't know/No response 99
Q40P
In this final section, you are being asked a series of questions about your background, including your education and family status. This information is being gathered in order to better understand the groups of athletes that have provided specific types of responses and your responses will be kept strictly confidential.
Q40
Are you currently attending school?
Yes 1
No 2
No response 99
Q41
If... Q40 = 1
Is that full-time or part-time?
Full-time 1
Part-time 2
No response 99
Q42
If... Q40 = 1
Do you attend:
High school 1
College/CEGEP 2
Vocational school 3
University 4
Other (please specify) 77
No response 99
Q42B
University, Q42
If... Q42 = 4
Is this in Canada?
Yes 1
No 2
No response 99
Q42C
If... Q42 = 2 or Q42 = 3 or Q42 = 4 or Q42 = 77
What field of study is this in?
Arts 1
Business Administration 2
Communications 3
Economics 4
Engineering 5
Human Kinetics 6
Human Resources 7
Information Management or Information Technology 8
Labour and Trades 9
Nursing 10
Policy 11
Sciences 12
Social Sciences 13
Technical Fields 14
Other(please specify) 77
No response 99
Q43
What is the highest level of formal education that you have completed?
Primary School 1
High School 2
College/CEGEP 3
University Undergraduate 4
University Graduate or post graduate 5
Other (please specify) 77
No response 99
Q44
What is your current marital status?
Never married 1
Now married/common law 2
Separated 3
Divorced 4
Widowed 5
No response 99
PQ45
Do you have any dependents? A dependent is a person who you provide material support for (e.g., living expenses, shelter).
Q45A
Number of dependents
Yes, specify number 1
No 98
No response 99 S
Q46
Do you live with your parents?
Yes 1
No 2
No response 99
Q47
Thinking about what you need to reach your potential, how supportive would you say the Canadian sport system has been overall?
1 Not at all supportive 1
2 2
3 3
4 Moderately supportive 4
5 5
6 6
7 Very supportive 7
Don't know/No response 99
Q48
To what extent would you say you agree or disagree with the statement:
If faced with the same decision again, I would still choose to become a high performance athlete.
1 Strongly disagree 1
2 2
3 3
4 Neither agree nor disagree 4
5 5
6 6
7 Strongly agree 7
Don't know/No response 99
Q49
Finally, do you have any comments on topics not addressed in the questionnaire that you wish to bring to the attention of AAP management?
Yes (please specify) 77
No other comments 98 X
Don't know/No answer 99 X
THNK
Thank you very much for taking the time to complete this survey.
WINTRO
Web Intro
Welcome to the survey! Ekos Research Associates has been commissioned by Sport Canada to conduct a survey of coaches of high performance athletes. The purpose of this research is to provide up-to-date information on the needs of Canada's high performance athletes. The purpose of this research is to provide up-to-date information on the needs of Canada's high performance athletes. This study looks at training, economic, social, education, work, and other areas of athletes' lives, as well as the environment of Canadian high performance sport. This research is aimed at updating information collected regularly since 1990, designed to help develop policies and programs that are responsive to the needs of Canadian athletes and reflect the realities of international sport.
Your participation is voluntary and completely confidential. Any information you provide will be administered in accordance with the Privacy Act and other applicable privacy laws. The survey will likely take about 15 minutes to complete.
Instructions
Please consider the questions and your answers carefully.
On each screen, after selecting your answer, click on the "Continue" or "Back" buttons at the bottom of the screen to move forward or backward in the questionnaire
If you leave the survey before completing it, you can return to the survey URL later, and you will be returned to the page where you left off. Your answers up to that point in the survey will be saved
If you have any questions about how to complete the survey, please call Ekos Research Associates at 1-800-388-2873 or send an email to athletes@ekos.com
Thank you in advance for your participation.
Q1
Would you describe your position as:
High Performance Director 1
National Team Coach 2
Other (please specify) 77
Q2 [1,6]
Are you employed by a:
National Sport Organization 1
Provincial Sport Organization 2
Club 3
University 4
Self-employed 5
Any other sport-related organization or group 77
No response 99
Q3
Skip if high performance director, Q1
How many nationally carded athletes do you currently coach or work with?
Total 1
Don't know/No response 99
Q4
Have you coached/worked with any athletes to Olympic, Paralympic or World Championship medals?
Yes 1
No 2
Don't know/No response 99
Q4B
Yes, Q4
In which year was the most recent medal won?
Year 1
Never 98
Don't know/No response 99
Q5P
In a number of the questions throughout the questionnaire you will be asked to respond on the basis of all athletes you work with on a regular basis. The purpose of these questions is to ask coaches and High Performance Directors to provide an overall perspective across all of the athletes that you are in contact with.
Q6
How satisfied are you with the extent of input that you have into the development of the training and competition plans of the athletes you work with?
1 Not at all satisfied 1
2 2
3 3
4 Moderately satisfied 4
5 5
6 6
7 Extremely satisfied 7
Don't know/No response 99
Q7P
How adequate or inadequate are each of the following to support the Olympic/Paralympic/ World Championship aspirations of the athletes you work with?
Q7A
The type of competition experience they are getting
Not at all adequate 1 1
2 2
3 3
Moderately adequate 4 4
5 5
6 6
Completely adequate 7 7
Not applicable 98
Don't know 99
Q7B
The amount of competition experience they are getting
Not at all adequate 1 1
2 2
3 3
Moderately adequate 4 4
5 5
6 6
Completely adequate 7 7
Not applicable 98
Don't know 99
Q7C
The quality of training they are getting
Not at all adequate 1 1
2 2
3 3
Moderately adequate 4 4
5 5
6 6
Completely adequate 7 7
Not applicable 98
Don't know 99
Q7D
The amount of training experience they are getting
Not at all adequate 1 1
2 2
3 3
Moderately adequate 4 4
5 5
6 6
Completely adequate 7 7
Not applicable 98
Don't know 99
Q7E
The sport science and sport medicine services they are getting
Not at all adequate 1 1
2 2
3 3
Moderately adequate 4 4
5 5
6 6
Completely adequate 7 7
Not applicable 98
Don't know 99
Q7F
The physical access they have to high quality training facilities
Not at all adequate 1 1
2 2
3 3
Moderately adequate 4 4
5 5
6 6
Completely adequate 7 7
Not applicable 98
Don't know 99
Q7G
Financial support they have from all sources
Not at all adequate 1 1
2 2
3 3
Moderately adequate 4 4
5 5
6 6
Completely adequate 7 7
Not applicable 98
Don't know 99
Q8
Are you aware of high performance athletes in your sport who have retired prematurely from the national team; that is before they reach their full potential?
Yes 1
No 2
Don't know/No response 99
Q9P
Relatively speaking, how important do you think each of the following reasons are for why high performance athletes in your sport retire prematurely?
Q9A
Yes, Q8
Dissatisfaction with their own performance
Extremely unimportant 1 1
2 2
3 3
Neither 4 4
5 5
6 6
Extremely important 7 7
Don't know 99
Q9B
Yes, Q8
Insufficient income to support family (that is, income from all sources)
Extremely unimportant 1 1
2 2
3 3
Neither 4 4
5 5
6 6
Extremely important 7 7
Don't know 99
Q9C
Yes, Q8
Family commitments (i.e., time constraints)
Extremely unimportant 1 1
2 2
3 3
Neither 4 4
5 5
6 6
Extremely important 7 7
Don't know 99
Q9D
Yes, Q8
Conflict with non-sport career goals
Extremely unimportant 1 1
2 2
3 3
Neither 4 4
5 5
6 6
Extremely important 7 7
Don't know 99
Q9E
Yes, Q8
Conflict with educational goals
Extremely unimportant 1 1
2 2
3 3
Neither 4 4
5 5
6 6
Extremely important 7 7
Don't know 99
Q9F
Yes, Q8
Inadequate technical support (e.g., coaches and facilities)
Extremely unimportant 1 1
2 2
3 3
Neither 4 4
5 5
6 6
Extremely important 7 7
Don't know 99
Q9G
Yes, Q8
Injury
Extremely unimportant 1 1
2 2
3 3
Neither 4 4
5 5
6 6
Extremely important 7 7
Don't know 99
Q9H
Yes, Q8
Conflict with coaches
Extremely unimportant 1 1
2 2
3 3
Neither 4 4
5 5
6 6
Extremely important 7 7
Don't know 99
Q9I
Yes, Q8
Reached personal objectives
Extremely unimportant 1 1
2 2
3 3
Neither 4 4
5 5
6 6
Extremely important 7 7
Don't know 99
Q9J
Yes, Q8
Unwillingness to relocate
Extremely unimportant 1 1
2 2
3 3
Neither 4 4
5 5
6 6
Extremely important 7 7
Don't know 99
Q9K
Yes, Q8
Pursued professional sport opportunities
Extremely unimportant 1 1
2 2
3 3
Neither 4 4
5 5
6 6
Extremely important 7 7
Don't know 99
Q9L
Yes, Q8
Pursued a full-time career
Extremely unimportant 1 1
2 2
3 3
Neither 4 4
5 5
6 6
Extremely important 7 7
Don't know 99
Q9M
Is there any other reason why athletes retire prematurely that has not already been covered here?
Response 77
No other reason 98
Don't know/No response 99
Q10P [1,9]
Which of the following sport science services would you consider to be important to you in terms of the positive impact that they can have on the performance of your athlete(s)?
Select all that apply
Biomechanics 1
Fitness testing 2
Nutrition 3
Individual athlete performance analysis [Roll over] Measurement and analysis of an individual athlete's performance over time to determine progression toward specific performance goals in the annual training plan. 4
International competition performance analysis [Roll over] Collection of athlete performance in international competition over time to understand: Canadian athlete standing relative to world performance. Establish performance pathways and gold medal profiles over Olympic/Paralympic cycles. Understand ranking of Canadians athletes in the world to establish short and long term performance goals and requisite training and competitive programs. 5
Physiology assessment and monitoring 6
Sport psychology 7
Skill/technique analysis 8
Strength and conditioning 9
None 98
Don't know 99
Q11P [1,9]
Not NA/DK/NR, Q10P; Only showing items selected, Q10P
Thinking about the quality of the sport science services your athlete(s) has/have received from the CSI over the last 12 months, which ones, if any, would you say are in need of improvement?
Select all that apply
Q10P = 1
Biomechanics 1
Q10P = 2
Fitness testing 2
Q10P = 3
Nutrition 3
Q10P = 4
Individual athlete performance analysis [Roll over] Measurement and analysis of an individual athlete's performance over time to determine progression toward specific performance goals in the annual training plan. 4
Q10P = 5
International competition performance analysis [Roll over] Collection of athlete performance in international competition over time to understand: Canadian athlete standing relative to world performance. Establish performance pathways and gold medal profiles over Olympic/Paralympic cycles. Understand ranking of Canadians athletes in the world to establish short and long term performance goals and requisite training and competitive programs. 5
Q10P = 6
Physiology assessment and monitoring 6
Q10P = 7
Sport psychology 7
Q10P = 8
Skill/technique analysis 8
Q10P = 9
Strength and conditioning 9
No improvement necessary 98
Don't know 99
Q12P [1,9]
Which of the following sport medicine services would you consider to be important to your athlete(s) in terms of the positive impact that they can have on their performance?
Select all that apply
Chiropractic 1
Massage 2
Osteopathy 3
Physiotherapy 4
Podiatry 5
Advice/treatment from a sport doctor (e.g. team doctor, CSC-based doctor) 6
Athletic therapy 7
Physical health assessments and care 8
Mental health assessments and care 9
None 98
Don't know 99
Q13P [1,9]
Not NA/DK/NR, Q12P; Only showing items selected, Q12P
Thinking about the quality of the sport medicine services your athlete(s) has/have received from the CSI over the last 12 months, which ones, if any, would you say are in need of improvement?
Select all that apply
Q12P = 1
Chiropractic 1
Q12P = 2
Massage 2
Q12P = 3
Osteopathy 3
Q12P = 4
Physiotherapy 4
Q12P = 5
Podiatry 5
Q12P = 6
Advice/treatment from a sport doctor (e.g. team doctor, CSI-based doctor) 6
Q12P = 7
Athletic therapy 7
Q12P = 8
Physical health assessments and care 8
Q12P = 9
Mental health assessments and care 9
No improvement necessary 98
Don't know 99
Q14
Given what you have seen from the athlete(s) that you work with, what additional sport science and/or sport medicine services would you like them to receive?
Response 77
Don't know/No response 99
Q15P
Thinking about the last 12 months, how much has money been a barrier to your athletes accessing each of the following?
Q15A
Appropriate nutrition
No extent at all 1 1
2 2
3 3
Moderate extent 4 4
5 5
6 6
Great extent 7 7
Don't know 99
Q15B
Coaching
No extent at all 1 1
2 2
3 3
Moderate extent 4 4
5 5
6 6
Great extent 7 7
Don't know 99
Q15C
Appropriate training environment
No extent at all 1 1
2 2
3 3
Moderate extent 4 4
5 5
6 6
Great extent 7 7
Don't know 99
Q15D
Domestic Competitions
No extent at all 1 1
2 2
3 3
Moderate extent 4 4
5 5
6 6
Great extent 7 7
Don't know 99
Q15E
International Competitions
No extent at all 1 1
2 2
3 3
Moderate extent 4 4
5 5
6 6
Great extent 7 7
Don't know 99
Q15F
Equipment
No extent at all 1 1
2 2
3 3
Moderate extent 4 4
5 5
6 6
Great extent 7 7
Don't know 99
Q15G
Proper housing
No extent at all 1 1
2 2
3 3
Moderate extent 4 4
5 5
6 6
Great extent 7 7
Don't know 99
Q15H
Sport medicine services
No extent at all 1 1
2 2
3 3
Moderate extent 4 4
5 5
6 6
Great extent 7 7
Don't know 99
Q15I
Training facilities
No extent at all 1 1
2 2
3 3
Moderate extent 4 4
5 5
6 6
Great extent 7 7
Don't know 99
Q16P
The following reflect various views on Sport Canada financial support for athletes via the Athlete Assistance Program (AAP).
Please indicate the extent to which you agree or disagree with each of the following statements.
Q16A
The AAP has made it possible for athletes to achieve higher levels of athletic performance
Strongly disagree 1 1
2 2
3 3
Neither 4 4
5 5
6 6
Strongly agree 7 7
Don't know 99
Q16B
The funding provided to athletes by the AAP is sufficient to meet their living and training needs
Strongly disagree 1 1
2 2
3 3
Neither 4 4
5 5
6 6
Strongly agree 7 7
Don't know 99
Q16C
Athletes receive AAP funding too late in their career
Strongly disagree 1 1
2 2
3 3
Neither 4 4
5 5
6 6
Strongly agree 7 7
Don't know 99
Q16D
AAP assists athletes to pursue post-secondary education
Strongly disagree 1 1
2 2
3 3
Neither 4 4
5 5
6 6
Strongly agree 7 7
Don't know 99
Q16E2
Disagree, Q16B
Why don't you feel that the AAP assistance is adequate to meet the living and training needs of athletes?
Response 77
Don't know/No response 99
Q16F2
Agree, Q16C
Why do you think that athletes receive AAP assistance too late in their career?
Response 77
Don't know/No response 99
Q17
Did you know that Tuition and Deferred Tuition support can be applied to coaching courses for carded athletes such as the National Coaching Certification Program or the National Coaching Institute?
Yes 1
No 2
Don't know 99
PQ18
Are you aware of these other AAP supplemental supports for carded athletes:
Q18A
Child-care expenses
Yes 1
No 2
Don't know 99
Q18B
Relocation assistance
Yes 1
No 2
Don't know 99
Q18C
Retirement assistance
Yes 1
No 2
Don't know 99
Q18D
Tuition and Deferred Tuition, $5,500 maximum per carding cycle and up to a lifetime maximum of $26,500 as of April 2019
Yes 1
No 2
Don't know 99
Q18E
Supplemental support – Excellence living and training allowance, up to $6,000
Yes 1
No 2
Don't know 99
Q18F
Supplemental support – Child dependant allowance, up to $6,000
Yes 1
No 2
Don't know 99
Q18G
Supplemental support – Training and competition allowance for Paralympic athletes with high support needs, up to $6,000
Yes 1
No 2
Don't know 99
Q19
Did you know that Tuition and Deferred Tuition support can be applied to coaching courses for carded athletes such as the National Coaching Certification Program or the National Coaching Institute?
Yes 1
No 2
Don't know 99
Q20
Are there additional areas that you believe Sport Canada should consider under the AAP Supplemental Support category for carded athletes?
Yes (please specify) 77
No 2
Don't know/No response 99
Q21
The main contact for athletes receiving AAP support is their National Sport Organization or NSO, however from time to time coaches or High Performance Directors contact AAP staff for information about the Program or questions regarding the benefits of the Program. The following questions have been designed to ascertain your satisfaction as a coach or High Performance Director with the service provided by AAP staff.
Have you contacted Sport Canada AAP staff in the past 12 months?
Yes 1
No 2
No response 99
Q22
Yes, Q21
Did you feel that you were being served in the language of your choice (i.e., English or French)?
Yes 1
No 2
No response 99
Q23
Yes, Q21
How did you contact the Sport Canada AAP staff?
(Please select main method if you used more than one)
Telephone 1
Email 2
Mail 3
Fax 4
Other (please specify) 77
No response 99
Q24
Yes, Q21
How satisfied were you with the overall quality of service you received?
Very dissatisfied 1
Dissatisfied 2
Satisfied 3
Very satisfied 4
Not used/Not applicable 98
Don't know/No response 99
Q25
Thinking about the needs of the athletes that you work with to reach their potential, how supportive would you say the Canadian sport system has been overall?
1 Not at all supportive 1
2 2
3 3
4 Moderately supportive 4
5 5
6 6
7 Very supportive 7
Don't know/No response 99
Q26
Finally, do you have any comments on topics not addressed in the questionnaire that you wish to bring to the attention of AAP management?
Yes (please specify) 77
No other comments 98
Don't know/No response 99
THNKW - Thank you very much for taking the time to complete this survey.
WINTRO
Web Intro
Welcome to the survey! Ekos Research Associates has been commissioned by Sport Canada to conduct a survey of CSI/NSO Presidents and Service Managers regarding high performance athletes. The purpose of this research is to provide up-to-date information on the needs of Canada's high performance athletes. This study looks at training, economic, social, education, work, and other areas of athletes' lives, as well as the environment of Canadian high performance sport. This research is aimed at updating information collected regularly since 1990, designed to help develop policies and programs that are responsive to the needs of Canadian athletes and reflect the realities of international sport.
Your participation is voluntary and completely confidential. Any information you provide will be administered in accordance with the Privacy Act and other applicable privacy laws. The survey will likely take between 10 and 15 minutes to complete.
Instructions
Please consider the questions and your answers carefully
On each screen, after selecting your answer, click on the "Continue" or "Back" buttons at the bottom of the screen to move forward or backward in the questionnaire
If you leave the survey before completing it, you can return to the survey URL later, and you will be returned to the page where you left off. Your answers up to that point in the survey will be saved
If you have any questions about how to complete the survey, please call Ekos Research Associates at 1-800-388-2873 or send an email to athletes@ekos.com
Thank you in advance for your participation.
Q1
Are you a CSI/NSO...?
President 1
Athlete Services Manager 2
Q2
How many Sport Canada carded athletes receive services from your Institute?
Total 1
Don't know/No response 99
PQ3
Please rate the level of demand for the services that are offered at your Institute on a scale where 1 is a very low demand and 5 is a very high demand. Use "Not Applicable" to indicate that a service is not offered at your Institute.
Q3A
Nutrition
Very low demand 1 1
2 2
Moderate demand 3 3
4 4
Very high demand 5 5
Not applicable 98
Don't know/ No response 99
Q3B
Individual athlete performance analysis [Roll over] Measurement and analysis of an individual athlete's performance over time to determine progression toward specific performance goals in the annual training plan.
Very low demand 1 1
2 2
Moderate demand 3 3
4 4
Very high demand 5 5
Not applicable 98
Don't know/ No response 99
Q3C
International competition performance analysis [Roll over] Collection of athlete performance in international competition over time to understand:
- Canadian athlete standing relative to world performance.
- Establish performance pathways and gold medal profiles over Olympic/Paralympic cycles.
- Understand ranking of Canadians athletes in the world to establish short and long term performance goals and requisite training and competitive programs.
Very low demand 1 1
2 2
Moderate demand 3 3
4 4
Very high demand 5 5
Not applicable 98
Don't know/ No response 99
Q3D
Physiology assessment and monitoring
Very low demand 1 1
2 2
Moderate demand 3 3
4 4
Very high demand 5 5
Not applicable 98
Don't know/ No response 99
Q3E
Sport psychology
Very low demand 1 1
2 2
Moderate demand 3 3
4 4
Very high demand 5 5
Not applicable 98
Don't know/ No response 99
Q3F
Skill/technique analysis
Very low demand 1 1
2 2
Moderate demand 3 3
4 4
Very high demand 5 5
Not applicable 98
Don't know/ No response 99
Q3G
Strength and conditioning
Very low demand 1 1
2 2
Moderate demand 3 3
4 4
Very high demand 5 5
Not applicable 98
Don't know/ No response 99
Q3H [0,1]
Other - please specify
Very low demand 1 1
2 2
Moderate demand 3 3
4 4
Very high demand 5 5
Not applicable 98
Don't know/ No response 99
PQ3I
Please rate the level of demand for the services that are offered at your Institute on a scale where 1 is a very low demand and 5 is a very high demand. Use "Not Applicable" to indicate that a service is not offered at your Institute.
Q3I
Chiropractice
Very low demand 1 1
2 2
Moderate demand 3 3
4 4
Very high demand 5 5
Not applicable 98
Don't know/ No response 99
Q3J
Massage
Very low demand 1 1
2 2
Moderate demand 3 3
4 4
Very high demand 5 5
Not applicable 98
Don't know/ No response 99
Q3K
Osteopathy
Very low demand 1 1
2 2
Moderate demand 3 3
4 4
Very high demand 5 5
Not applicable 98
Don't know/ No response 99
Q3L
Physiotherapy
Very low demand 1 1
2 2
Moderate demand 3 3
4 4
Very high demand 5 5
Not applicable 98
Don't know/ No response 99
Q3M
Podiatry
Very low demand 1 1
2 2
Moderate demand 3 3
4 4
Very high demand 5 5
Not applicable 98
Don't know/ No response 99
Q3N
Advice/treatment from a sport doctor
(e.g. team doctor, CSI-based doctor)
Very low demand 1 1
2 2
Moderate demand 3 3
4 4
Very high demand 5 5
Not applicable 98
Don't know/ No response 99
Q3O
Athletic therapy
Very low demand 1 1
2 2
Moderate demand 3 3
4 4
Very high demand 5 5
Not applicable 98
Don't know/ No response 99
Q3O2 [0,1]
Other - please specify
Very low demand 1 1
2 2
Moderate demand 3 3
4 4
Very high demand 5 5
Not applicable 98
Don't know/ No response 99
PQ3P
Please rate the level of demand for the services that are offered at your Institute on a scale where 1 is a very low demand and 5 is a very high demand. Use "Not Applicable" to indicate that a service is not offered at your Institute.
Q3P
Career planning services
Very low demand 1 1
2 2
Moderate demand 3 3
4 4
Very high demand 5 5
Not applicable 98
Don't know/ No response 99
Q3Q
Employment assistance
Very low demand 1 1
2 2
Moderate demand 3 3
4 4
Very high demand 5 5
Not applicable 98
Don't know/ No response 99
Q3R
Accommodation assistance
Very low demand 1 1
2 2
Moderate demand 3 3
4 4
Very high demand 5 5
Not applicable 98
Don't know/ No response 99
Q3S
Education support services
(e.g., counseling, courses, tuition support)
Very low demand 1 1
2 2
Moderate demand 3 3
4 4
Very high demand 5 5
Not applicable 98
Don't know/ No response 99
Q3T
Other Game Plan services
Very low demand 1 1
2 2
Moderate demand 3 3
4 4
Very high demand 5 5
Not applicable 98
Don't know/ No response 99
Q4
Over the past several years CSIs/NSOs have received additional funds to provide sport science/sport medicine services to athletes and targeted sports - Summer and Winter. Do you feel that the additional funds over the past five to six years have been beneficial, to athletes and high performance sports in Canada? Please explain why this is?
Yes, please explain 1
No, please explain 2
Don't know/No response 99
Q5
Are there services that your CSI/NSO currently provides to high performance athletes, but which could be enhanced by increasing the availability, nature or quality of the service?
Yes 1
No 2
Don't know/No response 99
Q6 [1,21]
Yes, Q5
What services could be enhanced?
Select all that apply
Nutrition 1
Individual athlete performance analysis [Roll over]Measurement and analysis of an individual athlete's performance over time to determine progression toward specific performance goals in the annual training plan. 2
International competition performance analysis [Roll over]Collection of athlete performance in international competition over time to understand: Canadian athlete standing relative to world performance. Establish performance pathways and gold medal profiles over Olympic/Paralympic cycles. Understand ranking of Canadians athletes in the world to establish short and long term performance goals and requisite training and competitive programs. 3
Physiology assessment and monitoring 4
Sport psychology 5
Skill/technique analysis 6
Strength and conditioning 7
Chiropractics 8
Massage 9
Osteopathy 10
Physiotherapy 11
Podiatry 12
Advice/treatment from a sport doctor (e.g. team doctor, CSI-based doctor) 13
Athletic therapy 14
Physical health assessments and care 15
Mental health assessments and care 16
Career planning services 17
Employment assistance 18
Accommodation assistance 19
Education and/or Game Plan support services 20
Other please list services 77
Don't know/No response 99
Q7
Yes, Q5; Do not show categories
What would it take to enhance these services over what is currently offered?
Select all that apply
Funding 1
Available equipment 2
Available space 3
Adequate trained personnel to provide them 4
Please specify 77
Don't know/No response 99
Q8
Are there services that you think high-performance athletes need but that are not currently being provided by your CSI/NSO?
Yes 1
No 2
Don't know 99
Q9
Yes, Q8
What are the top 3 services that are not currently provided for which there is a need?
Please specify 77
Don't know/No response 99
Q10 [1,3]
Yes, Q8
What benefits, if any, would result from these services being offered? What evidence is there, if any, that these services would have an impact on athlete performance?
Select all that apply
Fewer injuries 1
Faster recovery time 2
Increased number of training days 3
Other (specify) 77
Don't know/No response 99
Q11
Are you aware of high performance athletes in your sport who have retired prematurely from the national team; that is before they reach their full potential?
Yes 1
No 2
Don't know/No response 99
PQ12
Yes, Q11
Relatively speaking, how important do you think each of the following reasons are for why high performance athletes at your institute retire prematurely?
Q12A
Dissatisfaction with their own performance
Extremely unimportant 1 1
2 2
3 3
Neither 4 4
5 5
6 6
Extremely important 7 7
Don't know 99
Q12B
Insufficient income to support family (that is, income from all sources)
Extremely unimportant 1 1
2 2
3 3
Neither 4 4
5 5
6 6
Extremely important 7 7
Don't know 99
Q12C
Family commitments (i.e., time constraints)
Extremely unimportant 1 1
2 2
3 3
Neither 4 4
5 5
6 6
Extremely important 7 7
Don't know 99
Q12D
Conflict with non-sport career goals
Extremely unimportant 1 1
2 2
3 3
Neither 4 4
5 5
6 6
Extremely important 7 7
Don't know 99
Q12E
Conflict with educational goals
Extremely unimportant 1 1
2 2
3 3
Neither 4 4
5 5
6 6
Extremely important 7 7
Don't know 99
Q12F
Inadequate technical support (e.g., coaches and facilities)
Extremely unimportant 1 1
2 2
3 3
Neither 4 4
5 5
6 6
Extremely important 7 7
Don't know 99
Q12G
Injury
Extremely unimportant 1 1
2 2
3 3
Neither 4 4
5 5
6 6
Extremely important 7 7
Don't know 99
Q12H
Conflict with coaches
Extremely unimportant 1 1
2 2
3 3
Neither 4 4
5 5
6 6
Extremely important 7 7
Don't know 99
Q12I
Reached personal objectives
Extremely unimportant 1 1
2 2
3 3
Neither 4 4
5 5
6 6
Extremely important 7 7
Don't know 99
Q12J
Unwillingness to relocate
Extremely unimportant 1 1
2 2
3 3
Neither 4 4
5 5
6 6
Extremely important 7 7
Don't know 99
Q12K
Pursued professional sport opportunities
Extremely unimportant 1 1
2 2
3 3
Neither 4 4
5 5
6 6
Extremely important 7 7
Don't know 99
Q12L
Pursued a full-time career
Extremely unimportant 1 1
2 2
3 3
Neither 4 4
5 5
6 6
Extremely important 7 7
Don't know 99
Q12M
Is there any other reason why athletes retire prematurely that has not already been covered here?
Please specify 77
No other reason 98
Don't know/No response 99
PQ13
Are you aware of these other AAP supplemental supports for carded athletes:
Q13A
Child-care expenses
Yes 1
No 2
Don't know 99
Q13B
Relocation assistance
Yes 1
No 2
Don't know 99
Q13C
Retirement assistance
Yes 1
No 2
Don't know 99
Q13D
Tuition and Deferred Tuition, $5,500 maximum per carding cycle and up to a lifetime maximum of $26,500 as of April 2019
Yes 1
No 2
Don't know 99
Q13E
Supplemental Support – Excellence living and training allowance, up to $6,000
Yes 1
No 2
Don't know 99
Q13F
Supplemental Support – Child dependent allowance, up to $6,000
Yes 1
No 2
Don't know 99
Q13G
Supplemental Support – Training and competition allowance for Paralympic athletes with high support needs, up to $6,000
Yes 1
No 2
Don't know 99
Q14
Did you know that Tuition and Deferred Tuition support can be applied to coaching courses for carded athletes such as the National Coaching Certification Program or the National Coaching Institute?
Yes 1
No 2
Don't know 99
Q15
Are there additional areas that you believe Sport Canada should consider under the supplemental support category for carded athletes?
Yes (please specify) 77
No 2
Don't know/No response 99
PQ16
The main contact for athletes receiving AAP support is their National Sport Organization or NSO, however from time to time CSI/NSO staff contact AAP staff for information about the Program or questions regarding the benefits of the Program. The following questions have been designed to ascertain your satisfaction as a CSI President or Athlete Services Manager with the service provided by AAP staff.
Q16
Have you contacted Sport Canada AAP staff in the past 12 months?
Yes 1
No 2
No response 99
Q17
Yes, Q16
Did you feel that you were being served in the language of your choice (i.e., English or French)?
Yes 1
No 2
No response 99
Q18
Yes, Q16
How did you contact the Sport Canada AAP staff?
(Please select main method if you used more than one)
Telephone 1
Email 2
Mail 3
Fax 4
Other (please specify) 77
No response 99
Q19
Yes, Q16
How satisfied were you with the overall quality of service you received?
Very dissatisfied 1
Dissatisfied 2
Satisfied 3
Very satisfied 4
Not used/Not applicable 8
Don't know/No response 99
Q20
Thinking about the needs of the athletes that you work with, how supportive would you say the Canadian sport system has been overall?
1 Not at all supportive 1
2 2
3 3
4 Moderately supportive 4
5 5
6 6
7 Very supportive 7
Don't know/No response 99
Q21
Finally, do you have any comments on topics not addressed in the questionnaire that you wish to bring to the attention of AAP management?
Yes (please specify) 77
No other comments 98
Don't know/No response 99
THNKW -- Thank you very much for taking the time to complete this survey.
| Col1 | Sport | Total | Complete | Rate |
|---|---|---|---|---|
| 1 | Alpine Ski | 30 | 14 | 47% |
| 2 | Alpine Ski - Paralympic | 12 | 7 | 58% |
| 3 | Archery | 8 | 5 | 63% |
| 4 | Archery - Paralympic | 3 | 1 | 33% |
| 5 | Athletics | 74 | 26 | 35% |
| 6 | Athletics - Paralympic | 37 | 17 | 46% |
| 7 | Badminton | 9 | 2 | 22% |
| 8 | Baseball - Men | 32 | 14 | 44% |
| 9 | Basketball - Men | 37 | 10 | 27% |
| 10 | Basketball - Paralympic - Men | 24 | 7 | 29% |
| 11 | Basketball - Paralympic - Women | 15 | 6 | 40% |
| 12 | Basketball - Women | 61 | 28 | 46% |
| 13 | Biathlon | 13 | 10 | 77% |
| 14 | Bobsleigh - Men | 20 | 11 | 55% |
| 15 | Bobsleigh - Women | 17 | 13 | 76% |
| 16 | Boccia - Paralympic | 12 | 9 | 75% |
| 17 | Boxing - Men | 7 | 2 | 29% |
| 18 | Boxing - Women | 6 | 5 | 83% |
| 19 | Canoeing | 33 | 18 | 55% |
| 20 | Canoeing Paralympic | 5 | 1 | 20% |
| 21 | Cross Country Ski | 33 | 14 | 42% |
| 22 | Cross Country Ski - Paralympic | 10 | 5 | 50% |
| 23 | Curling - Men | 22 | 7 | 32% |
| 24 | Curling - Mixed | 13 | 9 | 69% |
| 25 | Curling - Paralympic | 9 | 9 | 100% |
| 26 | Curling - Women | 31 | 16 | 52% |
| 27 | Cycling | 60 | 30 | 50% |
| 28 | Cycling - Paralympic | 19 | 9 | 47% |
| 29 | Diving | 28 | 9 | 32% |
| 30 | Equestrian | 18 | 4 | 22% |
| 31 | Equestrian - Paralympic | 5 | 3 | 60% |
| 32 | Fencing | 14 | 8 | 57% |
| 33 | Fencing - Paralympic | 3 | 2 | 67% |
| 34 | Field Hockey - Men | 23 | 16 | 70% |
| 35 | Field Hockey - Women | 31 | 19 | 61% |
| 36 | Figure Skating | 44 | 25 | 57% |
| 37 | Freestyle Ski | 60 | 16 | 27% |
| 38 | Goalball - Men - Paralympic | 8 | 2 | 25% |
| 39 | Goalball - Women - Paralympic | 5 | 2 | 40% |
| 40 | Golf | 16 | 7 | 44% |
| 41 | Gymnastics - Men | 9 | 5 | 56% |
| 42 | Gymnastics - Rhythmic | 7 | 3 | 43% |
| 43 | Gymnastics - Trampoline | 8 | 4 | 50% |
| 44 | Gymnastics - Women | 19 | 12 | 63% |
| 45 | Hockey - Sledge - Paralympic | 24 | 5 | 21% |
| 46 | Hockey - Women | 64 | 25 | 39% |
| 47 | Judo | 21 | 6 | 29% |
| 48 | Judo - Paralympic | 2 | 1 | 50% |
| 49 | Karate | 9 | 4 | 44% |
| 50 | Luge | 22 | 10 | 45% |
| 51 | Racquetball | 4 | 3 | 75% |
| 52 | Rowing | 59 | 27 | 46% |
| 53 | Rowing - Paralympic | 8 | 4 | 50% |
| 54 | Rugby - Men | 22 | 4 | 18% |
| 55 | Rugby - Paralympic | 21 | 5 | 24% |
| 56 | Rugby - Women | 27 | 10 | 37% |
| 57 | Sailing | 26 | 14 | 54% |
| 58 | Sailing - Paralympic | 5 | 3 | 60% |
| 59 | Shooting | 5 | 3 | 60% |
| 60 | Shooting - Paralympic | 2 | 1 | 50% |
| 61 | Skeleton | 9 | 6 | 67% |
| 62 | Ski Cross | 25 | 13 | 52% |
| 63 | Ski Jumping | 5 | 4 | 80% |
| 64 | Snowboard | 42 | 14 | 33% |
| 65 | Snowboard Paralympic | 3 | 3 | 100% |
| 66 | Soccer - Men | 30 | 6 | 20% |
| 67 | Soccer - Women | 24 | 7 | 29% |
| 68 | Softball - Women | 22 | 13 | 59% |
| 69 | Speed Skating | 79 | 26 | 33% |
| 70 | Squash | 5 | 2 | 40% |
| 71 | Swimming | 87 | 33 | 38% |
| 72 | Swimming - Paralympic | 23 | 14 | 61% |
| 73 | Synchro Swim | 12 | 8 | 67% |
| 74 | Table Tennis | 5 | 3 | 60% |
| 75 | Taekwondo | 5 | 1 | 20% |
| 76 | Taekwondo - Paralympic | 1 | 0 | 0% |
| 77 | Tennis | 24 | 6 | 25% |
| 78 | Tennis - Paralympic | 3 | 2 | 67% |
| 79 | Triathlon | 11 | 4 | 36% |
| 80 | Triathlon Paralympic | 6 | 2 | 33% |
| 81 | Volleyball - Beach | 28 | 9 | 32% |
| 82 | Volleyball - Men | 71 | 23 | 32% |
| 83 | Volleyball - Sitting - Men | 13 | 8 | 62% |
| 84 | Volleyball - Sitting - Women | 12 | 12 | 100% |
| 85 | Volleyball - Women | 33 | 18 | 55% |
| 86 | Water Polo - Men | 26 | 9 | 35% |
| 87 | Water Polo - Women | 25 | 6 | 24% |
| 88 | Water Ski | 7 | 4 | 57% |
| 89 | Weightlifting - Men | 3 | 2 | 67% |
| 90 | Weightlifting - Women | 4 | 3 | 75% |
| 91 | White Water Canoe | 8 | 5 | 63% |
| 92 | Wrestling - Men | 13 | 4 | 31% |
| 93 | Wrestling - Women | 20 | 9 | 45% |
| -- | Total | 1,955 | 846 | 43% |
| Col1 | Card Level | Total | Complete | Rate |
|---|---|---|---|---|
| 1 | C1 | 165 | 67 | 41% |
| 2 | D | 864 | 370 | 43% |
| 3 | DI | 10 | 4 | 40% |
| 4 | SR | 549 | 245 | 45% |
| 5 | SR1 | 201 | 87 | 43% |
| 6 | SR2 | 150 | 66 | 44% |
| 7 | SRI | 16 | 7 | 44% |
| -- | Total | 1,955 | 846 | 43% |
Table 6: Average Personal Income by Athlete Characteristic
The first column (%) indicates the proportion of respondents reporting some level of income. The second column presents the average income reported across only those athletes reporting income from this source.