2023 Status of the High-Performance Athlete - Final Report
Prepared for Sport Canada, Department of Canadian Heritage
Supplier:
Ekos Research Associates Inc.
Contract Number:
CW2268682
Contract Value:
$80,184.80
Award Date:
January 17, 2023
Delivery Date:
April 19, 2024
Registration Number:
POR 108-22
For more information on this report, please contact Canadian Heritage at por-rop@pch.gc.ca
This public opinion research report presents the results of an online survey conducted by Ekos Research Associates Inc. on behalf of Sport Canada (Canadian Heritage). The research study was conducted with 857 Canadian high-performance athletes, as well as 132 National Team Coaches and High Performance Directors and 15 Presidents and Athlete Service Managers of Canadian Sport Institutes between March and December 2023.
Cette publication est aussi disponible en français sous le titre : La situation de l'athlète de haut niveau en 2023 : rapport final.
This publication may be reproduced for non-commercial purposes only. Prior written permission must be obtained from Public Services and Procurement Canada. For more information on this report, please contact Public Services and Procurement Canada at tpsgc.questions-questions.pwgsc@tpsgc-pwgsc.gc.ca or at: Canadian Heritage at por-rop@pch.gc.ca
Communications Branch
Public Services and Procurement Canada
Portage III Tower A
16A1-11 Laurier Street
Gatineau QC K1A 0S5
Catalogue Number:
CH24-50/2024E-PDF
International Standard Book Number (ISBN):
978-0-660-72081-4
Related publications (registration number: POR 108-22):
Table 2: Important Sport Science Services – Coaches' Perspective
Table 3: Important Sport Medicine Services – Coaches' Perspective
Table 4a: Average Personal Income over Time
Table 4b: Average Personal Income by Athlete Characteristic
Table 5a: Average Monthly Expenses over Time
Table 5b: Average Monthly Expenses by Athlete Characteristic
Table 6: Type of Financial Loans
Table 7: Financial Barriers
Table 8: Required Income Levels
Table 9: Response Rate by Sport
List of Charts
Chart 1: Satisfaction with Athletic Career
Chart 2: Awareness of UCCMS
Chart 3: Incidence of Safe Sport Training
Chart 4: Awareness of How to Access Assistance
Chart 5: Annual Training and Competition Plan
Chart 6: Primary Responsibility for Plan
Chart 7: Satisfaction with Input into Plan
Chart 8: Satisfaction with Plan
Chart 9: Principal Coach
Chart 10: Hours Per Week with Coach
Chart 11: Average Annual Expenditure for Coaching Services
Chart 12: Satisfaction with Principal Coach
Chart 13: Time Devoted in Past Year to Sport
Chart 14: Adequacy of Supports for Athletes (Athletes' Perspective)
Chart 15: Adequacy of Supports for Athletes (Coaches' Perspective)
Chart 16: Satisfaction with Access to Services in Preferred Language
Chart 17: Accessibility of Services Required from CSC/CSI
Chart 18: Awareness and Use of Game Plan
Chart 19: Satisfaction with Game Plan
Chart 20: Important Sport Science Services
Chart 21: Need for Improvements in Sport Science Services
Chart 22: Important Sport Medicine Services
Chart 23: Need for Improvement in Sport Medicine Services
Chart 24: Financial Loans
Chart 25: Source of Financial Support
Chart 26: Financial Barriers
Chart 27: AAP Positive/Negative Aspects
Chart 28: AAP Contact in Past Year
Chart 29: Satisfaction of Overall Quality of Service Received
Chart 30: Satisfaction with Athlete Representative
Chart 31: Awareness of Purpose of AthletesCAN
Chart 32: Satisfaction with Representation by AthletesCAN
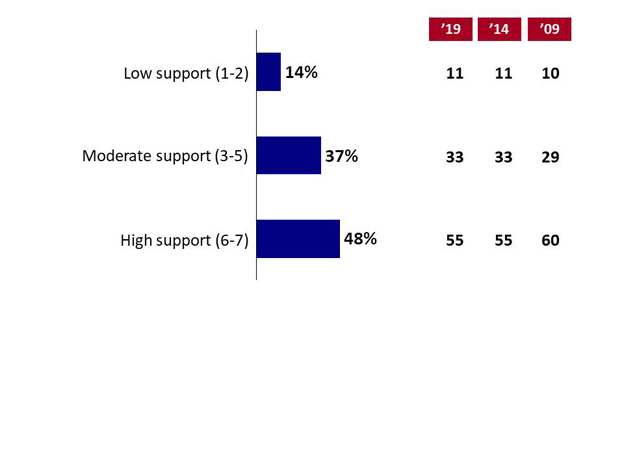
Chart 33: Perceived Supportiveness of Canadian Sport System
Chart 34: Satisfaction with Decision
Executive Summary
A. Background and Objectives
This report presents results of the sixth study of high-performance athletes since the early 90's. As was the case with the previous studies in 1992, 1997, 2004, 2009, 2014 and 2019 the primary goal is to gather information from various sport stakeholders in order to paint a current picture of the characteristics of high-performance athletes. The original 1992 study provided a comprehensive examination of athletes' sport, social and economic characteristics and was a key contributor to the development of athlete support policies at Sport Canada. Each report has drawn upon multiple lines of evidence collected from carded athletes, coaches and National Sport Organizations, updating information collected from previous research. A key objective of the research is to provide a picture of the costs of sport and the needs of athletes with respect to assistance through Sport Canada's Athlete Assistance Program (AAP). Results from the 2023 study are particularly important, in the wake of the global COVID-19 pandemic, impacting the world in 2020 and 2021, with resulting spike in inflation in 2022 and 2023.
This survey builds on much of the data from the earlier studies. The specific areas of investigation include:
Training, competition and other sport-related activities;
Adequacy of support services available to athletes;
Social and economic characteristics; and
Satisfaction with the AAP
B. Survey Methods
This project involved collecting sets of data from three different target populations. Data were collected through:
An online survey of AAP carded high-performance athletes;
An online survey of National Team Coaches and High Performance Directors.
An online survey of Presidents and Athlete Service Managers of the seven Canadian Sport Centres; and
Each survey instrument relied on previous questionnaires (2019), although some revisions were made to reduce the overall length of the survey. Each questionnaire focused on the areas of investigation already cited and included some of the questions that were asked of athletes in the 1992, 1997, 2004, 2009, 2014 and 2019 surveys of high-performance athletes to track changes in status and experiences. Prior to collection of the survey, the athlete instrument was tested with 13 athletes in English (9) and French (4) and changes were made to the wording, programming, and language as needed. The average time to complete the athlete survey was 19 minutes.
For each survey, all members of the population were included. There were no exclusionary criteria. Since no sampling was conducted, a margin of error is not applicable to the results. In each survey, sizable and reasonably representative proportions of the population were captured, and results are therefore considered projectable to the broader population.
Online Survey of High-performance Athletes
A self-administered, web-based survey was conducted between March 20, 2023, and December 18, 2023. The survey was shared with 1,971 high-performance athletes who were carded at the time of the survey. Sport Canada circulated advance communications to athletes, National Sport Organizations and Canadian Sport Centres, and communicated with National Sport Organizations at several intervals throughout the data collection period. National Sport Organizations and Canadian Sport Centres also sent an announcement to distribute or post on their social media feeds. Ekos, who conducted the study under contract for the Department of Canadian Heritage, also offered a gift card draw as an incentive to respond. Additional e-mail reminders were issued over several months, as well as reminder calls made by telephone to roughly 1,200 non-responding athletes (November and early December 2023). From the 1,971 carded athletes, 857 (43%) responded. The overall response rate for the survey, was similar to 2019 and 2009 response rates, but lower than the 51% achieved in 2014.
Based on a review of the complete set of records (1,971 carded athletes as of May 2023 when the list was updated from March 2023), a weighting scheme was applied to increase the representativeness of the final sample of 857 athletes, based on region, athlete class (Olympic/Paralympic), season (summer/winter), type of sport (team/individual), by card level, and by gender.
Online Survey of National Team Coaches and High Performance Directors
The second component of the study involved an online survey shared with 546 National Team Coaches and High Performance Directors. A total of 132 of the 546 responded for a response rate of24%. The online survey took an average of 19 minutes to complete. The survey data was collected between June 6 and December 12, 2023. All respondents received an e-mail invitation as well as several reminders.
Online Survey of Presidents and Service Managers of CSCs
The third data collection activity for this project was a small survey conducted online with the seven Presidents and eight Athlete Service Managers. All contact information on potential respondents (name, organization, and telephone number) was provided by Sport Canada, who also helped determine which staff to include. Some of the questions in the survey questionnaire were qualitative, open-ended in nature and others were closed ended. The questionnaire was administered over the same data collection period as that of the coaches. Of the 25 individuals invited, 15 responded (i.e., 69%).
Data Analysis
Overall results are presented in the main portion of the narrative and are typically supported by graphic or tabular presentation of results. Results for the proportion of respondents in the sample who either said "don't know" or did not provide a response may not be indicated in the graphic representation of the results in all cases, particularly where they are not sizable (e.g., 10% or less). Results may also not total to 100% due to rounding.
Results are compared to the previous two to three iterations of the study (i.e., 2019, 2014 and 2009). The reference period for questions about annual income and monthly expenses are for the complete previous year, therefore reference in this section of the report is to 2022, 2018, and 2012, respectively. In 2019 and 2014, as well as in previous years, questions requiring a scaled response were based on seven points. These were changed to five-point scales in 2023 in order to design a more mobile-friendly presentation of the survey. Labels of the low, mid- and high points of each scale, however, were not changed[1].
Bulleted text is used to point out any statistically and substantively significant differences between sub-groups of respondents which can also be found in the detailed data tables (separate document). If differences are not noted in the report, it can be assumed that they are either not statistically significant[2] in their variation from the overall result or that the difference was deemed to be substantively too small to be noteworthy. The programmed survey instruments can be found in the appendices.
C. Key Findings
Motivation and Satisfaction
High-performance athletes continue to exhibit high levels of satisfaction with their career as a high-performance athlete. Almost all athletes are satisfied with their confidence in experiencing a sport that is safe, and free of performance enhancing drugs. More than eight in ten are satisfied with the enjoyment they get from their sport and that the environment is safe. Eight in ten also rate themselves as satisfied with the environment as it is free from harassment and discrimination, and three in four see it as respectful and fair. Only 69%, however, are satisfied with their level of achievement or performance.
Training, Training Plans and Coaching
Just over half of athletes indicated that they have individual, formalized plans for their development. Eight in ten athletes indicate satisfaction with their involvement in their development of the training and competition plan. The same proportion also indicated satisfaction with their plan overall. Findings point to a reasonably high level of satisfaction with the overall quality of the coaching and the technical expertise demonstrated by their coaches, which is on par with previous years. More than eight in ten athletes also indicated satisfaction with coaches' ability to promote and foster a respectful and healthy environment. Three in four athletes are satisfied with the time the coaches spend with their athletes, which is largely on par with previous results.
CSC Services and Supports
Three in four athletes feel they are adequately supported in terms of the quality of training, access to support for mental health, the quality of competition experience and performance services they receive during competitions. Two in three rate the adequacy of physical access to training facilities and performance services they receive during training positively. The financial support that athletes receive is rated much lower, with just under four in ten saying it is adequate and a similar proportion rating it as less than adequate.
Six in ten athletes believe they have been able to access all the needed sport science and sport medicine services from their CSI. Three in four athletes feel they have sufficient information about the type of sport science and sports medicine services available from their CSI. Sport science services rated most important by athletes are strength and conditioning, nutrition, and sport psychology. This is followed by performance analysis, and skill and technique analysis, seen as important by six in ten athletes. Of sport medicine services provided by CSIs, physiotherapy and massage are the most highly valued, according to eight in ten athletes. This is followed by six in ten athletes noting the value of advice or treatment from a sport doctor, mental health assessments and athletic therapy.
Financial Picture
Carded athletes were asked to report their annual income from a variety of sources for 2022. The average annual income report was $34,945 for 2022. The largest proportion of this income is derived from Federal and/or Provincial athlete assistance ($13,744 from Sport Canada's AAP and $3,730 from Provincial Assistance). A smaller proportion of an athletes' income is derived from employment ($11,990 annually), sport-related sources such as sponsorship, prize money, scholarships, etc. ($5,884), and sports awards ($1,381).
Expenses, on the other hand, are $3,294 per month, or $39,528 per year. This includes close to $1,300 per month for housing, over $1,100 per month in sport-related expenses and close to $1,300 per month in living (food, clothing, transportation) and other expenses. Considering the average annual income of an athlete is $34,945 and the expenses amount to $39,528 per year, athletes are facing a shortage of $4,583 per year or $382 per month.
Almost one in seven athletes said that they have incurred some level of repayable debt in the pursuit of their athletic career. Loans from credit cards (56% of athletes with debt) and family (47% of those with debt) are at the top of the list, followed by loans to financial institutions (36%) and then student loans (34%). When loan amounts are added together they amount to an average of just under $3,000 in repayable debt across all athletes.
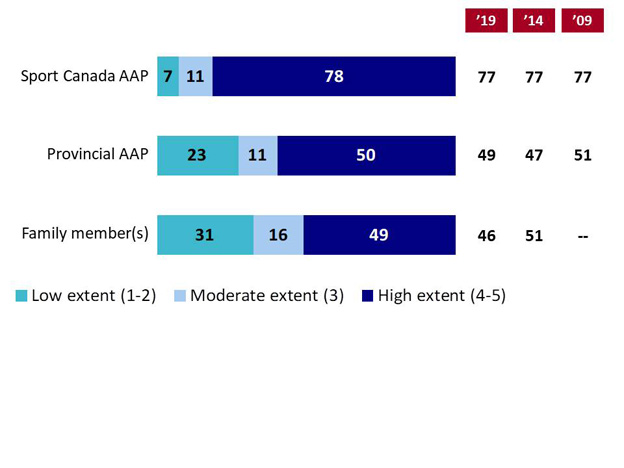
In 2023, three in four athletes reported that they rely heavily on Sport Canada's AAP as the most prevalent source of financial support. This is followed by a reliance on family and/or Provincial AAP; key sources for half of athletes in each case.
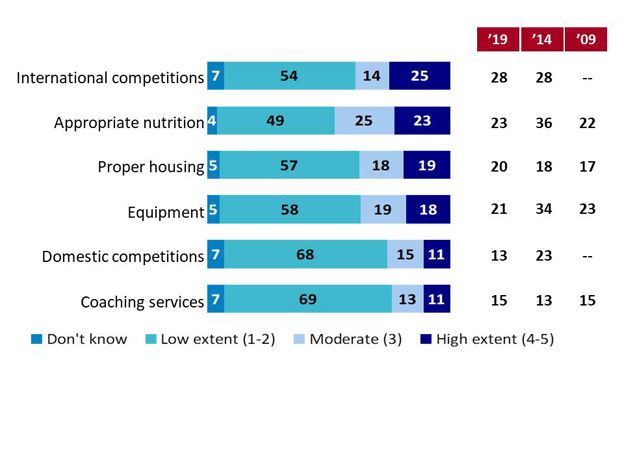
Money is a significant barrier to attending international competitions and appropriate nutrition according to about one in four athletes. This is followed by barriers to proper housing and equipment according to one in five athletes.
Views about AAP Support
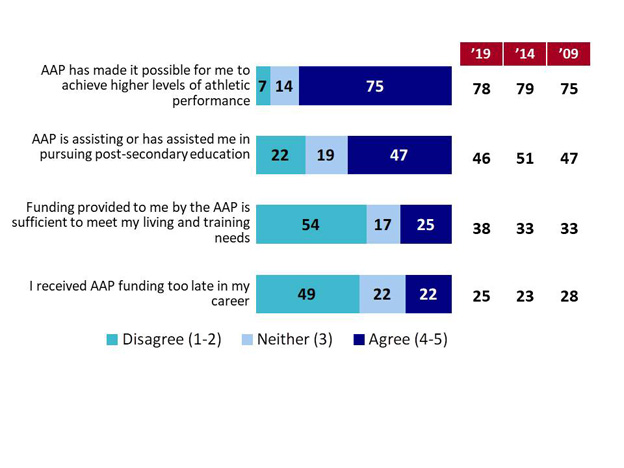
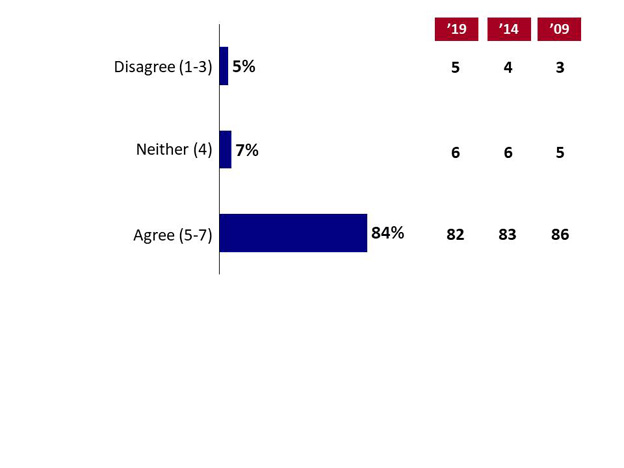
Three in four athletes agree that the AAP has made it possible to achieve higher levels of athletic performance. Fewer than half of athletes report that the AAP is assisting (or has assisted) them in pursuing post-secondary education. Only one in four athletes agree that the funding by AAP is sufficient to meet living and training needs. Half of athletes view the Canadian Sport System as supportive.
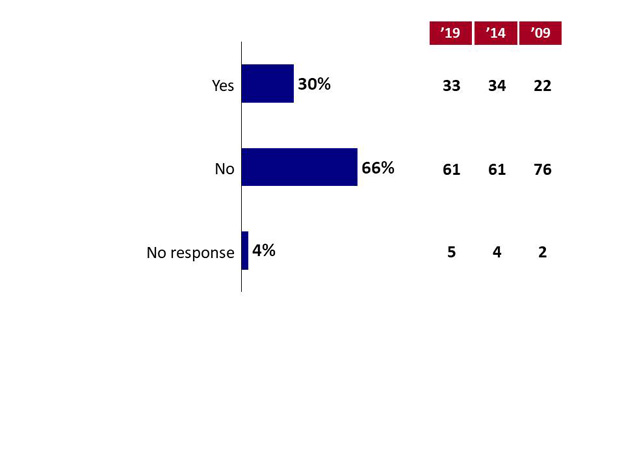
Just under one in three athletes have contacted this program at Sport Canada in the past 12 months. Satisfaction with service is very high among athletes that have contacted Sport Canada's AAP staff in the recent past. Virtually all athletes indicated that they were satisfied or very satisfied with the overall quality of service they received when contacting Sport Canada.
D. Contract Value
The contract value for the POR project is $80,184.80 (including HST).
Supplier Name:
Ekos Research Associates
PWGSC Contract Number:
CW2268682
Contract Award Date:
January 19, 2023
To obtain more information on this study, please e-mail por-rop@pch.gc.ca
E. Political Neutrality Certification
I hereby certify as Senior Officer of Ekos Research Associates Inc. that the deliverables fully comply with the Government of Canada political neutrality requirements outlined in the Policy on Communications and Federal Identity and the Directive on the Management of Communications. Specifically, the deliverables do not include information on electoral voting intentions, political party preferences, standings with the electorate, or ratings of the performance of a political party or its leaders.
Signed by Susan Galley (Vice President)
Detailed Findings
A. Profile of Athletes
The following table provides details on the sample of athletes surveyed in this report. The sample is weighted to restore it to population proportions in terms of gender, type of sport (individual/team), class (Olympic, Paralympic and Non-Olympic), season (winter/summer), card level, as well as region. That is, where the number of athletes responding to the survey in a certain category was higher or lower than expected given the number in the full universe of carded athletes, a weight was applied to the cases so that across the entire sample, they accounted for the expected proportion of respondents. The table illustrates the comparison of previous samples taken from 2019 and 2014.
There are more summer athletes in the current population and sample relative to 2019 and 2014. There are also slightly fewer athletes who are between the ages of 20 and 24 compared with the 2014 sample, although on par with 2019.
Table 1: Population profile of 2023 surveyed athletes
Variable
2023 Population (n=1,971)
2023 Unweighted Sample (n=857)
2019 Population (n=1,955)
2019 Unweighted Sample (n=846)
2014 Population (n=1,973)
2014 Unweighted Sample (n=967)
Season
Summer
72%
68%
70%
69%
77%
75%
Winter
28%
32%
30%
31%
24%
25%
Sport Type
Individual
59%
67%
62%
64%
60%
64%
Team
40%
31%
38%
36%
40%
36%
Sport Class
Olympic
84%
81%
84%
82%
80%
79%
Paralympic
15%
17%
15%
16%
15%
16%
Non-Olympic
1%
2%
1%
1%
5%
5%
Carding Level
D
42%
38%
45%
44%
45%
40%
C1
7%
8%
8%
8%
9%
10%
SR
29%
31%
28%
29%
24%
25%
SR1/2
19%
23%
19%
19%
22%
25%
Sex
Male
49%
45%
50%
45%
52%
49%
Female
51%
55%
50%
55%
48%
51%
Language
English
85%
88%
85%
87%
85%
83%
French
15%
12%
15%
13%
15%
16%
Age
<20
15%
14%
18%
19%
--
14%
20-24
33%
31%
35%
31%
--
38%
25-29
28%
27%
27%
25%
--
27%
30+
24%
27%
21%
24%
--
21%
The concentration of individual sport athletes is higher for winter sports.
British Columbia has a high concentration of summer sport athletes, while Alberta has the highest concentration of winter sport athletes. Quebec has a higher concentration of individual sport athletes compared with all other regions.
The Prairies have the highest concentration of older athletes (35+) (26%).
Paralympic athletes are more often represented by males (63% vs. 37% females) and 32% of all athletes over 30 in the sample are Paralympic athletes. There is also a higher concentration of SR1 carded athletes among Paralympic athletes. Summer sport athletes also have a higher concentration of SR cards, while winter sport athletes have a higher concentration of SR1 cards.
The youngest athletes are mostly found among those with D cards athletes (83% of those under 20 have a D card). 72% of those 30 to 34 have SR and SR1 cards.
Among the 132 coaches participating in the study, half (51%) describe themselves as a National Team coach. Of these, 70% are employed by a NSO, 14% by a club and 12% are self-employed. They each coach or work with an average of nine athletes with 75% having worked with athletes who have achieved Olympic, Paralympic or World Championship medals (29% in 2023, 33% in 2022 and the rest in 2021 or earlier).
Among the 15 CSI representatives who participated in the study, 8 are athlete service managers and seven are Presidents/CEOs of a CSI. Most representatives described hundreds of carded athletes being serviced by their CSC/CSI.
B. Overall Views
Satisfaction with Athletic Career
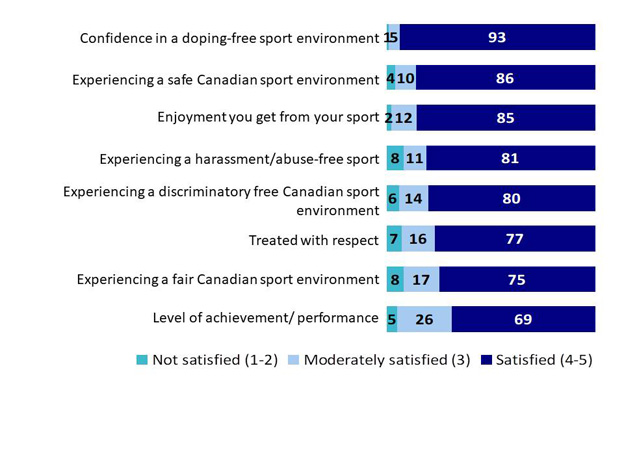
High-performance athletes exhibit high levels of satisfaction with their athletic career. Almost all athletes (93%) expressed satisfaction in terms of their confidence in experiencing a sport that is free of performance enhancing drugs. Similarly, 86% said they are satisfied that they experience a safe sport environment, and 85% are satisfied with the enjoyment they get from their sport. Eighty-one percent are also satisfied that they are experiencing a harassment or abuse-free and discriminatory-free sport environment. Slightly fewer are satisfied that they are treated with respect within the Canadian sport environment (77%) and that it is a fair environment (75%). Sixty-nine percent are satisfied with their level of achievement or performance, while 26% are moderately satisfied, but only 5% are not satisfied. Overall, 5% or fewer athletes indicated that they are not very satisfied with the exception of experiencing a sport environment that is free from discrimination (6%), respectful (7%), fair (8%), and harassment or abuse-free (8%).
Comparison over time is difficult because, in addition to the move to a five-point scale, rather than the previous seven-point scale the direction of the scale also changed in order to be consistent with other scales in the questionnaire. Overall, results seem similar to previous measurements with regard to a safe, and harassment-free and doping-free sport environment, as well as in terms of fairness and respect, although perhaps marginally lower in 2023. Athletes seem less positive in 2023 than they were in the past when it comes to their enjoyment of the sport and their level of achievement.
Chart 1: Satisfaction with Athletic Career
Chart 1: Satisfaction with Athletic Career - Text Version
This stacked chart shows the percentage of results for responses to eight statements across three categories: not satisfied, moderately satisfied, and satisfied.
Respondents were asked: "To what extent are you satisfied with the following aspects of your experience in high-performance sport?"
Respondents selected:
Confidence in a doping-free sport environment:
Category "Not satisfied (1-2)": 1%
Category "Moderately satisfied (3)": 5%
Category "Satisfied (4-5)": 93%
Experiencing a safe Canadian sport environment:
Category "Not satisfied (1-2)": 4%
Category "Moderately satisfied (3)": 10%
Category "Satisfied (4-5)": 86%
Enjoyment you get from your sport:
Category "Not satisfied (1-2)": 2%
Category "Moderately satisfied (3)": 12%
Category "Satisfied (4-5)": 85%
Experiencing a harassment/abuse-free sport:
Category "Not satisfied (1-2)": 8%
Category "Moderately satisfied (3)": 11%
Category "Satisfied (4-5)": 81%
Experiencing a discriminatory free Canadian sport environment:
Category "Not satisfied (1-2)": 6%
Category "Moderately satisfied (3)": 14%
Category "Satisfied (4-5)": 80%
Treated with respect:
Category "Not satisfied (1-2)": 7%
Category "Moderately satisfied (3)": 16%
Category "Satisfied (4-5)": 77%
Experiencing a fair Canadian sport environment:
Category "Not satisfied (1-2)": 8%
Category "Moderately satisfied (3)": 17%
Category "Satisfied (4-5)": 75%
Level of achievement/ performance:
Category "Not satisfied (1-2)": 5%
Category "Moderately satisfied (3)": 26%
Category "Satisfied (4-5)": 69%
Base: n=857
Q2a-j. To what extent are you satisfied with the following aspects of your experience in high-performance sport?
Base: n=857
There are consistent patterns of higher satisfaction across most of the satisfactory dimensions among athletes with D, and in some cases C1 cards, as well as among those pursuing team sports, males, and those coached by the National Team Coach.
There are also consistent patterns of dissatisfaction, more often found among SR carded athletes, females, those in individual sports, athletes in British Columbia and those with a personal coach. Similarly, athletes between the ages of 25 and 29 are typically less satisfied than other athletes, while those under 20 are the most positive.
Following are some specifics:
Athletes in team sports are more likely to be satisfied that they are experiencing a doping, harassment and discrimination-free sport environment that is safe, fair and respectful, compared with those pursuing individual sports.
Athletes with D cards follow the same pattern, although they are no more likely to be satisfied than other athletes when it comes to a doping-free sport environment. They are also more likely than other athletes to say they enjoy their sport, which is also the case among athletes with a C1 card.
Those athletes with a SR or SR2 card are less likely to say they enjoy their sport, are in a respectful and harassment-free environment. Those with a SR2 card are least likely to say they are satisfied they are experiencing a doping or discriminatory-free or fair environment. Those with an SR card are least satisfied with their level of achievement, while those with an SR1 card are the most positive in this regard.
Athletes who are between 25 and 29 are the least likely to be satisfied with their level of achievement and enjoyment of their sport. They are also less satisfied with the extent to which they see the sport environment as respectful, safe, fair and free from harassment and discrimination. Athletes who are between 30 and 34 are the least likely age cohort to express satisfaction with their sport environment in terms of harassment and discrimination. Across each of the seven dimensions described, it is the youngest athletes (under 20) who are the most satisfied.
Males are generally more satisfied than females that the environment is safe, fair, as well as harassment and discrimination-free.
Athletes with a national team coach are more positive than other athletes that the sport environment is discrimination, doping and harassment-free, safe and respectful.
Athletes in British Columbia are less likely to be satisfied compared with other athletes across the country in all areas tested. Those in Ontario are more apt to express satisfaction with their enjoyment with their sport and their achievement. Those in the Prairies are most likely across the country to rate themselves as satisfied with the respectful nature of the environment.
Coaches were also asked about their satisfaction with these aspects of high-performance sport. Their responses are similar to athletes. Perception of the Canadian sport environment with regard to doping is strongest (93% satisfaction that it is doping-free). Most indicated satisfaction with regard to the safety (86%), as well as harassment and discrimination-free environment (80% - 81%). Slightly fewer rated themselves as satisfied with the extent to which the environment is respectful (77%) and fair (75%).
Among CSI representatives who were also asked this question, 14 of the 15 rated themselves as satisfied (i.e., four or five out of five) in terms of their confidence in a doping-free Canadian sport environment. Relatively few, however, indicated satisfaction with the Canadian sport environment in terms of respect (7), fairness (5), safety (4), or free from harassment and discrimination (3 in each case). In most cases, 4 to 7 rated themselves as moderately satisfied, however, 3 to 5 rated themselves as not satisfied in all areas except seeing the environment as doping-free. In particular, 5 of the 15 representatives are not satisfied with regard to the harassment, discrimination and fairness of the environment.
Awareness of Universal Code of Conduct to Prevent and Address Maltreatment in Sport (UCCMS)
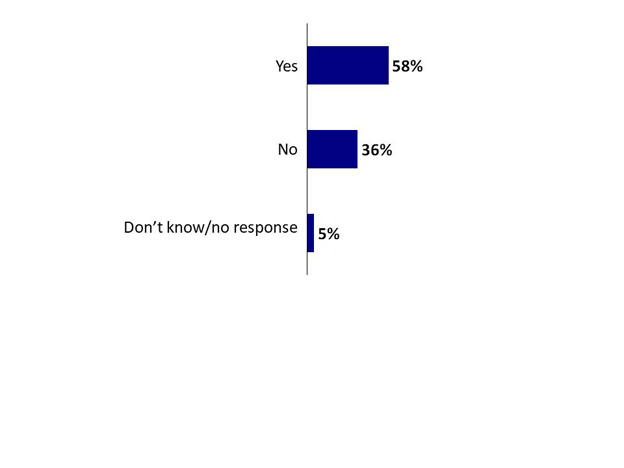
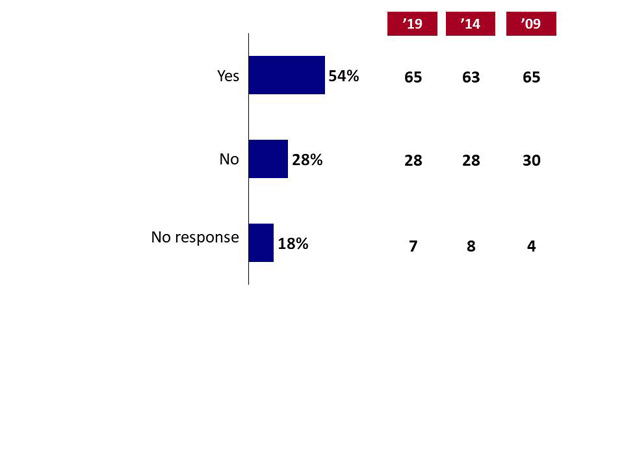
When asked whether they were aware of the Universal Code of Conduct to Prevent and Address Maltreatment in Sports (UCCMS), 58% of all athletes indicated awareness, 36% said they were not aware, and 5% did not provide a response.
Awareness of the UCCMS is 93% among coaches and 100% among CSI representatives.
Chart 2: Awareness of UCCMS
Chart 2: Awareness of UCCMS - Text Version
This chart of single bars shows the percentage of results for responses to three statements: yes, no, and don't know/no response.
Respondents were asked: "Are you aware of the Universal Code of Conduct to Prevent and Address Maltreatment in Sport (UCCMS)"
Respondents selected:
Yes: 58%
No: 36%
Don't know/no response: 5%
Base: n=857
Q2l. Are you aware of the Universal Code of Conduct to Prevent and Address Maltreatment in Sport (UCCMS)
Base: n=857
Athletes most likely to be aware of UCCMS are those with SR2 cards (74%), and paralympic athletes (66%). This is also the case among those who are 35 or older (74%). Awareness is also higher in Ontario (66%) and lowest in Quebec (49%).
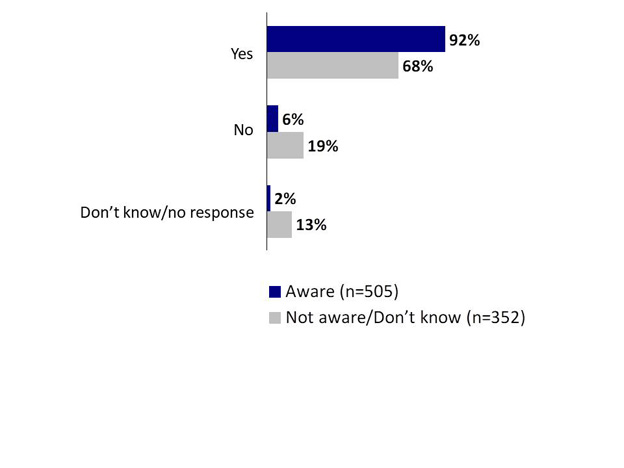
Of the 58% of athletes who were aware of the UCCMS, 92% indicated that they have taken some type of safe sport training in the last two years. Among the athletes who were not aware of the UCCMS or were unsure, 68% nonetheless said that they have taken some type of safe sport training at some point during the two years and another 13% were unsure. This suggests that either the name of the training (related directly to the UCCMS) may not have been clear to some athletes, or they had mis-remembered or confused it with another type of training taken.
Even among coaches, a few individuals indicating a lack of awareness of the UCCMS said that they had taken safe sport training in the previous two years.
Chart 3: Incidence of Safe Sport Training
Chart 3: Incidence of Safe Sport Training - Text Version
This chart with double single bars shows the percentage of results for responses to three statements across two groups: aware (n=505) and not aware/don't know (n=352).
Respondents were asked: "Have you taken safe sport training, including information about the UCCMS, in the last two years?"
Respondents selected:
Yes
Group "Aware": 92%
Group "Not aware/don't know:" 68%
No
Group "Aware": 6%
Group "Not aware/don't know:" 19%
Don't know/no response
Group "Aware": 2%
Group "Not aware/don't know:" 13%
Base: n=857
Q2m. Have you taken safe sport training, including information about the UCCMS, in the last two years?
Base: n=857
Likelihood of taking safe sport training is higher among athletes with SR2 cards (95%), males (87%) and NCAA athletes (96%). It is also highest among athletes who are between 20 and 24 (86%) and lowest among those under 20 (69%). The likelihood of taking safe sport training is also highest in Ontario (87%) and lowest in Quebec (67%).
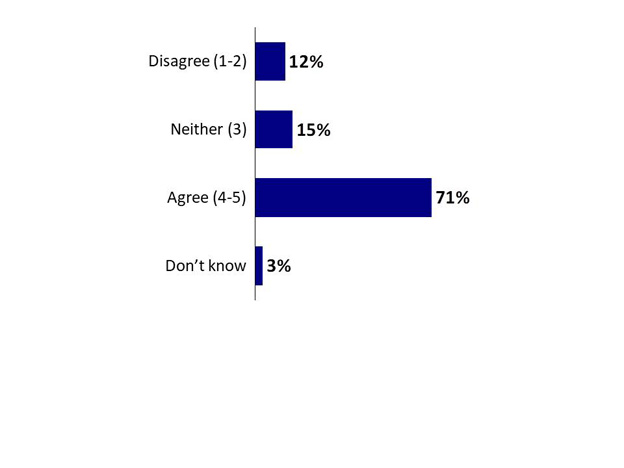
Athletes were also asked if they were in a situation where they experienced harassment, abuse or discrimination, if they knew how to access the services of the independent third-party mechanism affiliated to their National Sport Organization to receive and manage maltreatment complaints. Although 71% agreed that they know how to access these services, 27% did not agree (15% indicating "neither" and 12% disagreeing).
Among coaches, 84% agreed that they would know how to access these services, and only 6% disagreed. All but one of the 15 CSI representatives also agreed.
Chart 4: Awareness of How to Access Assistance
Chart 4: Awareness of How to Access Assistance - Text Version
This chart of single bars shows the percentage of results for responses to three statements: disagree, neither, agree, and don't know.
Respondents were asked: "To what extent do you agree or disagree with the statement? If I were in a situation where I experienced harassment, abuse or discrimination, I would know how to access the services of the independent third-party mechanism affiliated to my National Sport Organization to receive and manage maltreatment complaints"
Respondents selected:
Disagree (1-2): 12%
Neither (3): 15%
Agree: (4-5) 71%
Don't know: 3%
Base: n=857
Q2n. To what extent do you agree or disagree with the statement? If I were in a situation where I experienced harassment, abuse or discrimination, I would know how to access the services of the independent third-party mechanism affiliated to my National Sport Organization to receive and manage maltreatment complaints.
Base: n=857
Females are more likely to disagree (15% compared with only 8% among males). Athletes with a NSO coach are more likely to agree (74%) compared with athletes who have a personal coach (64%).
C. Training and Competition
Annual Training & Competition Plan
Findings show that 54% of athletes have a written annual training and competition plan that is tailored to them specifically. This is lower than the consistent 63% to 65% measured across the last 14 years, however, it is a result of a higher proportion of athletes (18%) who are unsure or did not provide a response. As in previous years, 28% do not have a written annual plan that is tailored to them specifically.
Chart 5: Annual Training and Competition Plan
Chart 5: Annual Training and Competition Plan - Text Version
This chart of single bars shows the percentage of results for responses to three statements: yes, no, and no response. Three columns on the side show the percentage of results for 2019, 2014, and 2009.
Respondents were asked: "Do you have a written annual training and competition plan that is tailored to you specifically?"
Respondents selected:
Yes: 54%; 2019: 65%; 2014: 63%; 2009: 65%
No: 28%;2019: 28%; 2014: 28%; 2009: 30%
No response: 18%; 2019: 7%; 2014: 8%; 2009: 4%
Base: n=857
Q3. Do you have a written annual training and competition plan that is tailored to you specifically?
Base: n=857
There is a large difference between athletes in individual and team sport settings. Although 62% of athletes in individual sports have plans, only 43% of those in most team sports report specifically tailored plans. On the other hand, this is not the case with all team sports (men's and women's curling, beach volleyball, paralympic hockey, where 58% to 74% have a training plan).
Training plans are somewhat more common in winter sports than in summer sports (61% vs. 51%).
Paralympic athletes are considerably more likely to have a training plan (73%) compared to Olympic athletes (50%).
Those who have a personal coach (65%) are more likely to have a tailored training plan.
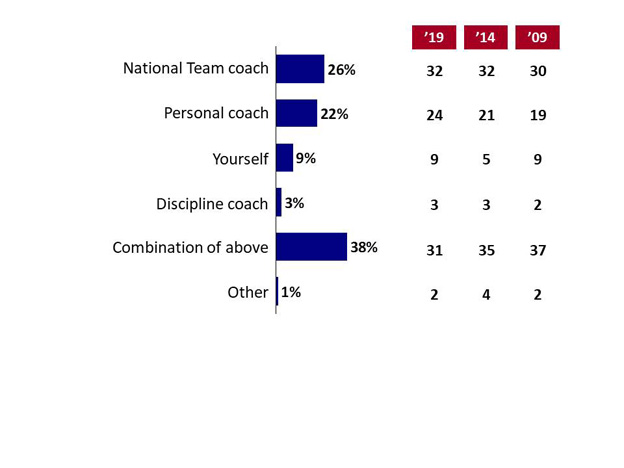
Of the respondents who have a written plan, 26% had those plans created by their national team coach, which is lower than the 32% reported between 2014 and 2019. It was also lower than the 30% reported in 2009, likely because of increased collaboration. In 22% of cases, the plan is created by their personal coach. Nine percent of these respondents developed their own plan and 3% follow a plan written by a discipline coach. The training and competition plan was a collaborative effort in 38% of cases, which is on par with 2009 but higher than reported in 2014 or 2019.
Chart 6: Primary Responsibility for Plan
Chart 6: Primary Responsibility for Plan - Text Version
This chart of single bars shows the percentage of results for responses to six statements. Three columns on the side show the percentage of results for 2019, 2014, and 2009.
Respondents were asked: "Who is primarily responsible for developing your annual training and competition plan?"
Respondents selected:
National Team coach: 26%; 2019: 32%; 2014: 32%; 2009: 30%
Personal coach: 22%; 2019: 24%; 2014: 21%; 2009: 19%
Combination of above: 38%; 2019: 31%; 2014: 35%; 2009: 37%
Other: 1%; 2019: 2%; 2014: 4%; 2009: 2%
Base: n=482 (Have a written training plan)
Q4. Who is primarily responsible for developing your annual training and competition plan?
Base: n=482 (Have a written training plan)
Participants in individual sports are more likely to rely on a personal coach for the creation of a written plan (31% compared to 4% for team sports) while participants in team sports are more likely to have a plan created collaboratively (51%) or that they created on their own (15%).
Athletes who compete in summer sports are more likely to rely on a personal coach (28% compared to 9% among their winter counterparts). Athletes in winter sports are comparatively more likely to have a plan created through collaborative efforts (45%) or through their own efforts (14%).
While only 9% of athletes rely on themselves, this rises to 27% among those 35 or older.
Satisfaction with Input
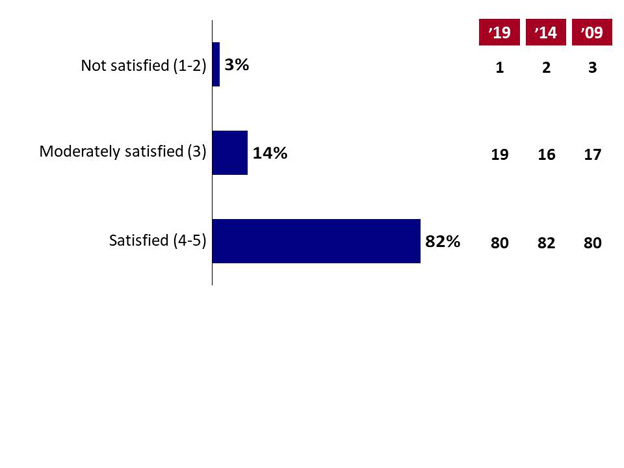
Athletes were asked to rate their satisfaction with the amount of input they had in the development of their training plans. Survey results indicate that the large majority of athletes are satisfied with the amount of input they had, with 82% rating themselves as satisfied or very satisfied (i.e., four or a five on the five-point scale). This appears to suggest increased satisfaction levels compared with results obtained in 2019 and in 2009, although relatively similar to that measured in 2014. An additional 13% indicated moderate satisfaction. Very few (3%) indicated a low level of satisfaction.
Chart 7: Satisfaction with Input into Plan
Chart 7: Satisfaction with Input into Plan - Text Version
This chart of single bars shows the percentage of results for responses to three statements. Three columns on the side show the percentage of results for 2019, 2014, and 2009.
Respondents were asked: "How satisfied are you with the extent of input that you had into the development of your training and competition plan?"
Respondents selected:
Not satisfied (1-2): 3%; 2019: 2%; 2014: 3%; 2009: 6%
Base: n=440 (Athletes with primary input from NSO/personal coaches)
Q5. How satisfied are you with the extent of input that you had into the development of your training and competition plan?
Base: n=440 (Athletes with primary input from NSO/personal coaches)
Athletes in Ontario (90%) are the most likely across the country to be satisfied, while those in British Columbia (69%) are least likely to be satisfied.
Seventy-six percent of coaches indicated satisfaction with the input they have into the development of the training and competition plans of athletes they work with. This is an increase from 2019 when only 66% said the same, but on par with satisfaction levels from 2014 and 2009. Only 5% indicated a low level of satisfaction.
Satisfaction with Training Plan
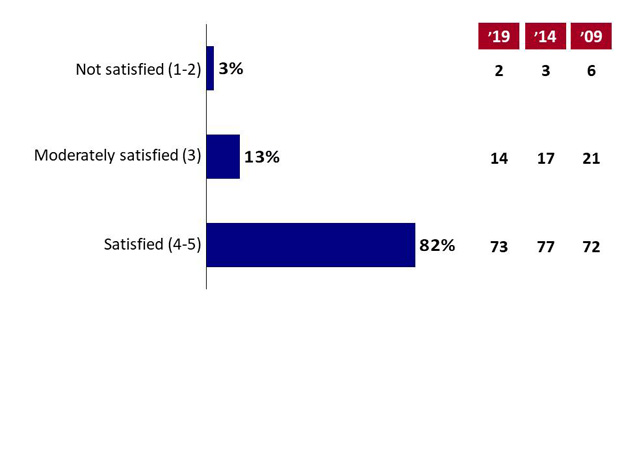
Given the high levels of satisfaction athletes have with the amount of input they put into their training and competition plans, it is not surprising to see strong satisfaction also registered with these plans overall. Most athletes (82%) rated themselves as satisfied or highly satisfied with their plan, which is on par with previous results. Another 14% are moderately satisfied, and only 3% expressed any dissatisfaction with their current plan.
Chart 8: Satisfaction with Plan
Chart 8: Satisfaction with Plan - Text Version
This chart of single bars shows the percentage of results for responses to three statements. Three columns on the side show the percentage of results for 2019, 2014, and 2009.
Respondents were asked: "How satisfied are you with your training and competition plan overall?"
Respondents selected:
Not satisfied (1-2): 3%; 2019: 1%; 2014: 2%; 2009: 3%
Q6. How satisfied are you with your training and competition plan overall?
Base: n=482 (Those who have written plan)
SR1 card athletes are the most likely to be satisfied (93%) compared with those with other cards. Athletes between the ages of 30 and 34 are less likely to be satisfied (71%).
Athletes in Alberta (90%) are also more likely to be satisfied than others across the country, which is least likely in British Columbia (73%). Athletes with a plan created primarily by their personal coach are also more likely to be satisfied (92%) compared with other athletes.
Principal Coach & Hours Spent Per Week
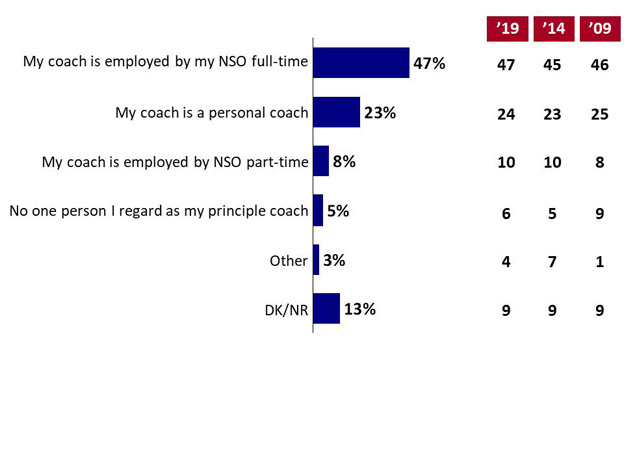
As in previous measurement periods, 47% of athletes have a principal coach who is employed by their National Sport Organization (NSO) on a full-time basis. In contrast, 23% follow the direction of a personal coach who is not employed or contracted by their NSO. An additional 8% of athletes are managed by a coach who is employed by their NSO on a part-time basis (10%) and 5% are not trained under a person they consider to be their coach. All figures are very similar to those found in previous years.
Chart 9: Principal Coach
Chart 9: Principal Coach - Text Version
This chart of single bars shows the percentage of results for responses to six statements. Three columns on the side show the percentage of results for 2019, 2014, and 2009.
Respondents were asked: "Which of these best describes your sport-specific principal coach?"
Respondents selected:
My coach is employed by my NSO full-time: 47%; 2019: 47%; 2014: 45%; 2009: 46%
My coach is a personal coach: 23%; 2019: 24%; 2014: 23%; 2009: 25%
My coach is employed by NSO part-time: 8%; 2019: 10%; 2014: 10%; 2009: 8%
No one person I regard as my principle coach: 5%; 2019: 6%; 2014: 5%; 2009: 9%
Q7. Which of these best describes your sport-specific principal coach?
Base: n=857
Paralympic athletes (60%) and those with SR1 cards (57%) are more likely to rely on a coach employed by their NSO on a full-time basis.
Athletes participating in individual sports are more likely (30%) to have a personal coach. This is also more often the case with females (27%) compared with males (18%).
Athletes who are 35 or older are most likely to have a personal coach (35%).
Athletes training in Quebec (58%) and British Columbia (54%) are more likely than those in other regions to report working with coaches employed by their NSO on a full-time basis.
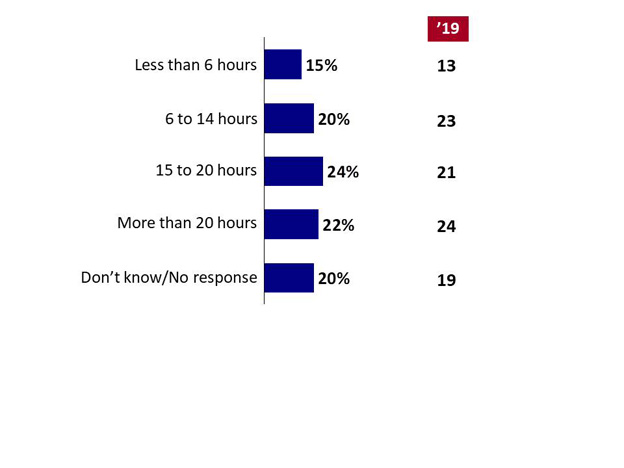
Athletes with coaches spend many hours with them during training and competition periods. Reflecting the proportions reported in previous years, only 15% report spending less than six hours per week with their coach. Forty-four percent of athletes report spending 6-20 hours with their coaches on a weekly basis. Specifically, 20% spend 6-14 hours while another 24% spend 15-20. Twenty-two percent spend more than 20 hours a week with their coaches. Overall, athletes spend an average of 18 hours per week training with their coaches, which is on par with the 19 hours measured in 2019.
Chart 10: Hours Per Week with Coach
Chart 10: Hours Per Week with Coach - Text Version
This chart of single bars shows the percentage of results for responses to five statements. One column on the side shows the percentage of results for 2019.
Respondents were asked: "On average, how many hours per week do you have contact with your principal coach during training and competition periods?"
Respondents selected:
Less than 6 hours: 15%; 2019: 13%
6 to 14 hours: 20% 2019: 23%
15 to 20 hours: 24% 2019: 21%
More than 20 hours: 22% 2019: 24%
Don't know/no response: 20% 2019: 19%
Base: n=819 (Those who consider someone to be their coach)
QAQ8. On average, how many hours per week do you have contact with your principal coach during training and competition periods?
Base: n=819 (Those who consider someone to be their coach)
Olympic athletes spend significantly more time with their coaches. Olympic athletes spend an average of 19 hours per week training with their coaches compared with 12 hours among Paralympic athletes.
Females report an average of 20 hours per week compared with 16 hours per week among males.
Athletes who are 35 or older report an average of 10 hours per week with their coach, with 45% reporting fewer than 6 hours per week. Similarly, athletes between the ages of 30 and 34 report an average of 14 hours per week with their coach. This is in contrast to those under 20 who spend 23 hours per week and those 20 to 24 who spend 21 hours per week of contact with their coach.
Average Annual or Coaching Services
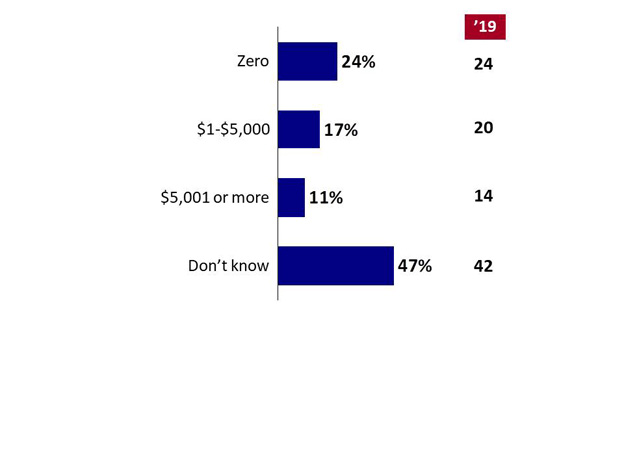
Athletes with coaches were asked how much they spend annually for the service provided by their principal coach. As in 2019, 24% do not spend anything in coaching services and 47% said they do not know (42% in 2019). Among those who know, the average annual expenditure is $5,100 (similar to $5,500 in 2019), although there is considerable variation on this figure. Excluding those who do not pay anything, the average rises to $9,400 per year.
Chart 11: Average Annual Expenditure for Coaching Services
Chart 11: Average Annual Expenditure for Coaching Services - Text Version
This chart of single bars shows the percentage of results for responses to four statements. One column on the side shows the percentage of results for 2019.
Respondents were asked: "How much do you pay annually, on average for the services provided by principal coach?"
Respondents selected:
Zero: 24%; 2019: 24%
$1-$5,000: 17%; 2019: 20%
$5,001 or more: 11%; 2019: 14%
Don't know: 47%; 2019: 42%
Base: n=819
AQ8A. How much do you pay annually, on average for the services provided by principal coach?
Base: n=819
The annual expenditure is much higher among athletes in winter sports ($9,100 compared with only $3,500 for those in summer sports).
It is also higher among Olympic athletes ($5,700 compared with $1,800 reported by Paralympians).
Those in individual sports pay more ($6,000) compared with those in team sports ($3,400).
Athletes with a personal coach also report considerably higher expenditure ($11,000 annually compared with only $2,800 for those with a NSO coach). Similarly, those athletes who are 35 or older (and most likely to have a personal coach) spend an average of $12,000).
Satisfaction with Principal Coach
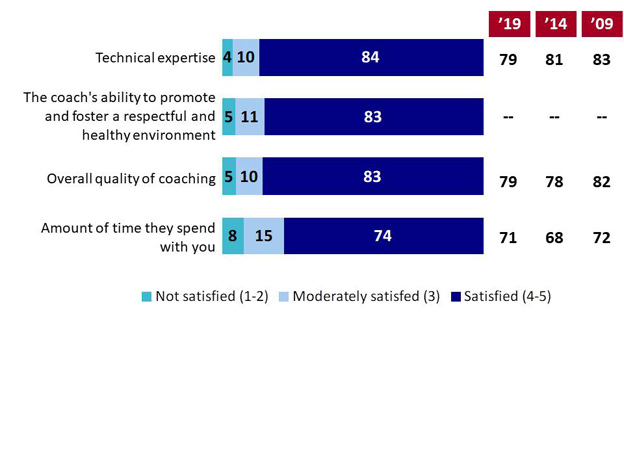
Findings indicate that athletes are largely satisfied with their principal coaches, although less satisfied with the amount of time coaches spend with them. Most athletes (84%, down slightly over time from 79% in 2019 but on par with 2009 and 2014) said that they are very satisfied with the technical expertise demonstrated by their principal coaches. A similar proportion (83%) are satisfied with the overall quality of coaching, which is on par with 2009, but an increase from 2014 (78%). The same proportion are also satisfied (83%) with the coach's ability to promote and foster a respectful and healthy environment. Compared to ratings on quality, expertise and ability to foster a respectful and healthy environment, relatively fewer athletes, although still three in four (74%), are satisfied with the amount of time they spend with principal coaches. This is in line with previous measurements, although an increase in satisfaction from 2014 when only 68% were satisfied.
Chart 12: Satisfaction with Principal Coach
Chart 12: Satisfaction with Principal Coach - Text Version
This stacked chart shows the percentage of results for responses to three statements across three categories: not satisfied, moderately satisfied, and satisfied. Three columns on the side show the percentage of results (satisfied) for 2019, 2014, and 2009.
Respondents were asked: "How would you describe your level of awareness when it comes to the role of the following areas in the Criminal Justice System?"
Q9a-c. How satisfied are you with the following about your principal coach? Base: n=819 (Those with a principal coach)
Those working with a personal coach are more satisfied with the quality (90%), technical expertise (92%), and ability to promote and foster a respectful and healthy environment (90%), as well as the amount of time they spend with their coach (82%).
Athletes with a D card (87%) are more likely to be satisfied with the technical expertise of their principal coach, while those with a SR card (79%) are less likely to be satisfied.
Similarly, athletes who are under 20 (85%) and those between 20 ad 24 (80%) are more apt to report satisfaction with the time spent with their coaches, compared with those who are 25 or older (67% to 71%). Those under 20 are also more often satisfied with the technical expertise (94%), their ability to promote and foster a respectful and healthy environment (89%) and the overall quality of coaching (92%).
Athletes in Quebec are typically more satisfied with the quality (90%) and amount of time spent with their coach (86%) compared with other athletes across the country. Those in British Columbia are less satisfied than others in each of these areas (78% and 68%, respectively).
Males are more likely than females to be satisfied with the coach's ability to promote and foster a respectful and healthy environment (86% compared with 80%).
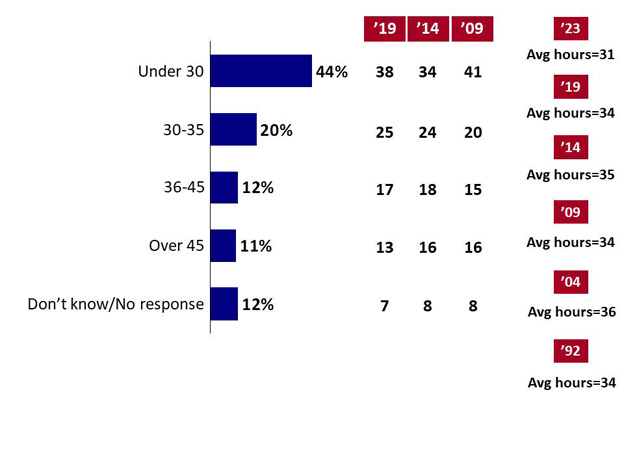
Time Devoted in Past Year to Sport
The amount of time athletes devote to their sport has remained relatively unchanged over the last two decades. Overall, the average number of hours allotted by athletes in any given week is 31, which is down marginally from 34 to 36 hours per week in past measurements. Forty-four percent of athletes spend less than 30 hours per week training and competing, which is higher than found in the past at 38% in 2019 and 34% in 2014 (closer to the 41% reported in 2009). Twenty percent devote between 30 and 35 hours to their weekly training schedule. Another 12% spend between 36 and 45 hours per week, while 11% spend in excess of 45 hours per week training.
Chart 13: Time Devoted in Past Year to Sport
Chart 13: Time Devoted in Past Year to Sport - Text Version
This chart of single bars shows the percentage of results for responses to five statements. Three columns on the side show the percentage of results for 2019, 2014, and 2009. Another column shows the average hours for 2023, 2019, 2014, 2009, 2004, and 1992.
Respondents were asked: "What was the average number of hours per week you devoted to your sport during the training and competitive period in the past year?"
AQ10. What was the average number of hours per week you devoted to your sport during the training and competitive period in the past year?
Base: n=857
Winter and individual sports athletes each spend an average of 32 hours per week compared with 30 and 28 hours, respectively spent by summer and team sports athletes.
Olympic competitors spend an average of 32 hours per week while paralympic athletes allocate 24 hours per week.
Females spend an average of 32 hours per week compared with 29 hours spent by males.
D. Athlete Support Services
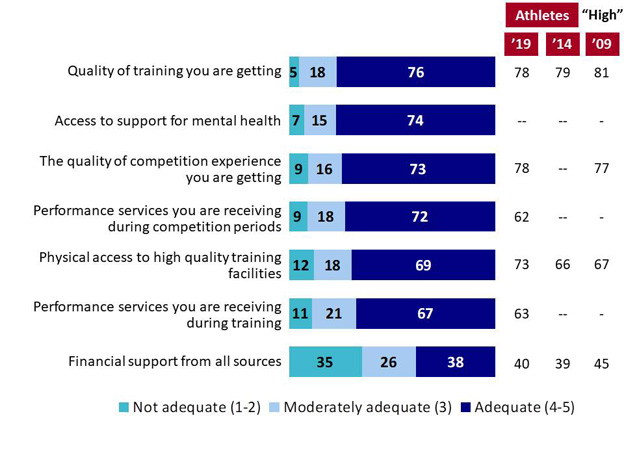
Adequacy of Supports for Athletes
In this section, athletes rated the adequacy of the support they receive for their Olympic/ Paralympic/World Championship aspirations in the way of training, competitions, facilities, access to health support, and financial needs. Athletes believe that the quality of training they are getting is adequate (76%), which is on par with previous results. Responding to a new question in 2023, 74% also believe their access to support for mental health is adequate. The same proportion (73%) believes the amount of competition experience they are getting is adequate, which is fairly similar to previous measurements. The same proportion (72%) also feels they are receiving adequate performance services during competitions, which appears higher than found in 2019. Slightly fewer (67%) feel they have adequate performance services during training, although largely on par with 2019 results. Sixty-nine percent feel their physical access to high quality facilities is adequate, which is also on par with 2019 results.
As in past years, the lowest rated type of support is the level of financial support. Thirty-eight percent believe that they receive adequate monetary support, while 26% rate it as moderate and another 35% rate it as inadequate.
Chart 14: Adequacy of Supports for Athletes (Athletes' Perspective)
Chart 14: Adequacy of Supports for Athletes (Athletes' Perspective) - Text Version
This stacked chart shows the percentage of results for responses to seven statements across three categories: not adequate, moderately adequate, and adequate. Three columns on the side show the percentage of results (Athletes "adequate") for 2019, 2014, and 2009.
Respondents were asked: "How adequate or inadequate are each of the following to support your Olympic/Paralympic/ World Championship aspiration?"
Q11a-h. How adequate or inadequate are each of the following to support your Olympic/Paralympic/ World Championship aspiration?
Base: n=857
Winter sport athletes are more positive about the adequacy of the quality of competition they are getting (82%), as well as the performance services they receive during training (73%). Summer sport athletes are less positive than winter sport athletes with regard to the performance services they receive during training (64%).
SR card athletes are least positive about the adequacy of their financial support (32%) and the performance services they receive during training (58%) compared with other athletes. SR1 card athletes are more positive than others about the quality of the competitions experience they are receiving (82%). Athletes with D cards are more positive than other athletes with regard to the quality of training (83%) and performance services they are receiving during training (73%).
Athletes under 20, and to some extent 20 to 24 years of age, are more positive than older athletes in all areas with the exception of access to mental health services, where they are on par. In particular, those under 20 are more positive about the quality of the training (86%) and competition experience (88%) they are getting. Athletes who are 20 to 24 are only slightly less likely to say the same. Those who are between the ages of 25 and 29 are least positive about the quality of their training (68%) the competition experience they are getting (67%), the performance services they receive during training (60%), and financial support (29%). Athletes who are between 30 and 34 are also less positive than others with the services their receive during competition (63%), and during training (56%), as well as financial support (26%). The oldest athletes (35 or older) are the least positive about their physical access to facilities (55%).
Athletes in British Columbia are less positive about the adequacy of each of the areas questioned. Athletes in Alberta are also less positive than other athletes about the performance services they are receiving during training (59%). Quebec and Francophone athletes are more positive than others about the quality of their training (85%), the performance services they receive during training (83%), and their physical access to high quality training facilities (78%). Ontario athletes are also more likely than others across the country to be positive about the quality of the competition experience they get (80%).
Paralympic athletes are more positive than Olympic athletes regarding the adequacy of the performance services they are getting during competition (82%) and access to mental health services (83%).
Athletes with a personal coach are less positive than other athletes about their access to mental health services (64%), the performance services they receive during competition (65%), and physical access to facilities (63%). Those with a NSO coach stand out in their positive assessment of their access to mental health services (78%), but the least positive about financial support (33%).
NCAA athletes are more positive than other athletes about the performance services they receive during competition (85%).
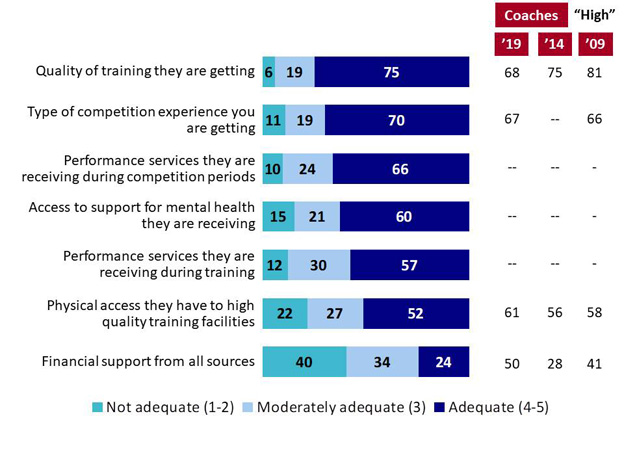
Coaches provided similar ratings to those of athletes related to the quality of training athletes receive (75% indicated adequate support; an increase from 68% noted by coaches in 2019, but on par with results from 2014), and the quality of competition experience they are getting (70%). Slightly fewer (66%) believe the performance services athletes receive during competition periods is adequate (also slightly lower than the 72% of athletes who believe the same). Six in ten coaches feel athletes' access to mental health supports is adequate, which is considerably lower than the 74% of athletes believing this to be the case. Performance services athletes receive during training and competitions are also rated as adequate by lower proportions of coaches (57% and 52%, respectively) compared with the same rating provided by athletes (67% and 69%, respectively). Financial support is also seen as adequate by a lower proportion of coaches compared with athletes (24% of coaches compared with 38% of athletes).
Chart 15: Adequacy of Supports for Athletes (Coaches' Perspective)
Chart 15: Adequacy of Supports for Athletes (Coaches' Perspective) - Text Version
This stacked chart shows the percentage of results for responses to seven statements across three categories: not adequate, moderately adequate, and adequate. Three columns on the side show the percentage of results (Coaches "high") for 2019, 2014, and 2009.
Respondents were asked: "How adequate or inadequate are each of the following to support the Olympic/Paralympic/World Championship aspirations of the athletes you work with?"
Q7A. How adequate or inadequate are each of the following to support the Olympic/Paralympic/World Championship aspirations of the athletes you work with?
Base: n=132
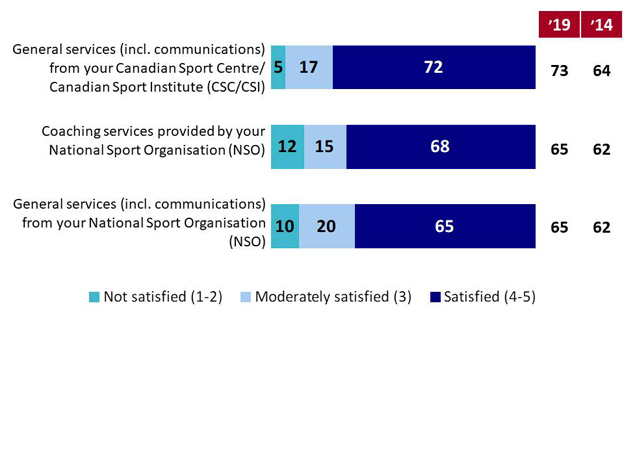
Satisfaction with Services in Language of Choice
As in previous years, there are reasonably high levels of satisfaction with athletes' access to services in their language of choice. Most athletes (72%) rated themselves as satisfied or highly satisfied with the services that they receive from their Canadian Sport Centre/Canadian Sport Institute (CSC/CSI) in the language of their choice. This is on par with 2019 but an increase from 64% in 2014. Sixty-eight percent rated themselves as satisfied or highly satisfied with the coaching services in their preferred language that they receive from their National Sport Organization (NSO) also with general services provided by their NSO (65%). About one in six is moderately satisfied and only 5% to 12% indicated dissatisfaction.
Chart 16: Satisfaction with Access to Services in Preferred Language
Chart 16: Satisfaction with Access to Services in Preferred Language - Text Version
This stacked chart shows the percentage of results for responses to three statements across three categories: not satisfied, moderately satisfied, and satisfied. Two columns on the side show the percentage of results ("satisfied") for 2019, and 2014.
Respondents were asked: "Thinking about the last 12 months, how satisfied or dissatisfied have you been with your access to the following services in the official language of your choice?"
Respondents selected:
General services (incl. communications) from your Canadian Sport Centre/ Canadian Sport Institute (CSC/CSI):
Q12a-c. Thinking about the last 12 months, how satisfied or dissatisfied have you been with your access to the following services in the official language of your choice?
Base: n=857
Francophone athletes (86%), as well as athletes in Quebec (79%) are the most satisfied with communications about general CSI services in the language of their choice, as are athletes pursuing a team sport (77%), younger athletes (under 20) (81%), compared with other athletes. Athletes with a coach with the NSO are also more satisfied (76%) than athletes with other coaching arrangements.
Athletes with a national team (82%) and NSO coach (76%) are more satisfied with communications from the coaching services provided by the NSO compared with other athletes. This is also more often among athletes in the Prairies (87%) and Alberta (76%), those under 20 (81%), athletes pursuing a team sport (74%), and paralympic athletes (76%).
Younger athletes (under 20) are more likely than older athletes to be satisfied with general services from NSOs (81%), which is also the case among team sport athletes (71%), athletes in the Prairies (84%), and Francophones (80%). Athletes with a personal coach are more likely than other athletes to be dissatisfied (19%), which is also more often the case in British Columbia (18%).
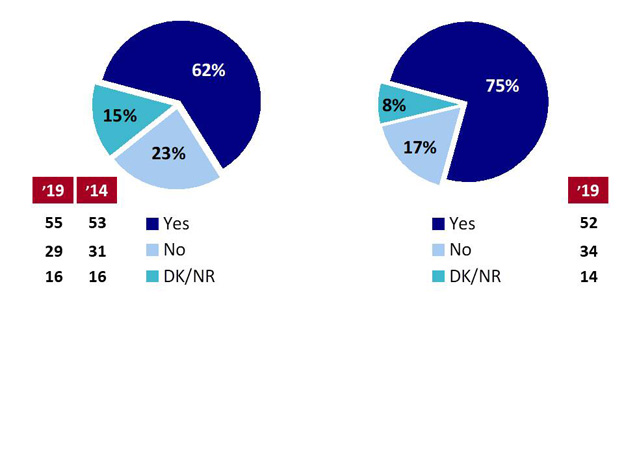
Accessibility of Services Required from CSC/CSI
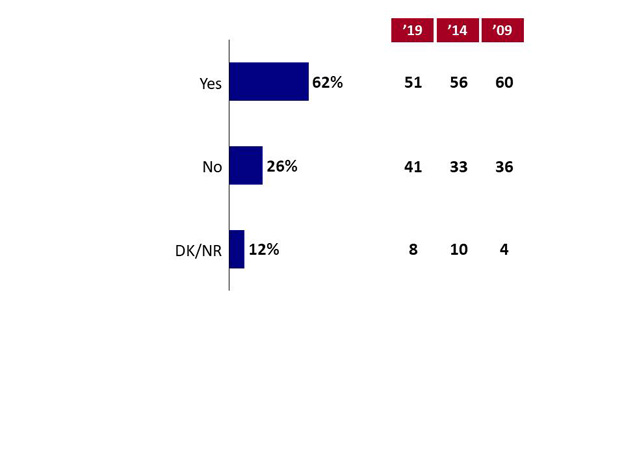
Sixty-two percent of athletes indicated they were able to access all of the sport science and sport medicine services that they needed from their CSI over the last twelve months. This is an increase from 55% in 2019 and 53% in 2014 who said the same.
Among all athletes, 75% said they have enough information about the types of services available, although 17% believe they need more information and 8% are unsure. This is a significant increase from 52% who felt they had the information they needed in 2019.
Chart 17: Accessibility of Services Required from CSC/CSI
Chart 17: Accessibility of Services Required from CSC/CSI - Text Version
These pie charts show the percentage of results for responses to two questions across three categories: yes, no, and DK/NR. Two columns on the left side show the percentage of results for 2019 and 2014. One column on the right side shows the percentage of results for 2019.
Respondents were asked two questions: Left: "Were you able to access all the sport science and sport medicine services you needed over the last 12 months from your CSC/CSI?"; Right: "Do you feel there is sufficient information available about the type of sport science and sport medicine services available from your Canadian Sport Institute (CSI)?"
Respondents selected:
Left:
Category "Yes": 62%; 2019: 55%; 2014: 53%
Category "No": 23%; 2019: 29%; 2014: 31%
Category "DK/NR": 15%; 2019: 16%; 2014: 16%
Right:
Category "Yes": 75%; 2019: 52%
Category "No": 17%; 2019: 34%
Category "DK/NR": 8%; 2019: 14%
Base: n=857
Q13. Were you able to access all the sport science and sport medicine services you needed over the last 12 months from your CSC/CSI? Base: n=857
Q13b. Do you feel there is sufficient information available about the type of sport science and sport medicine services available from your Canadian Sport Institute (CSI)? Base: n=857
Males (66%) and athletes between 20 and 24 (68%) are more likely to report access to CSC/CSI services, compared with females (58%) and other age cohorts, particularly those over 34 (50%). This is also true of athletes with a coach from their NSO (69%) and those in the Prairies (89%).
Athletes with SR, SR1 andSR2 cards more often feel they have sufficient information (80% to 88%) compared with those with D or C1 cards (67%). This is also more prominent among athletes who are between 25 and 34 (83 through 88%), whereas those under 20 are the least likely to say this (63%). Those athletes with the national team (e.g., have an NSO coach) are the most likely to say they have enough information about these services (80%).
Game Plan
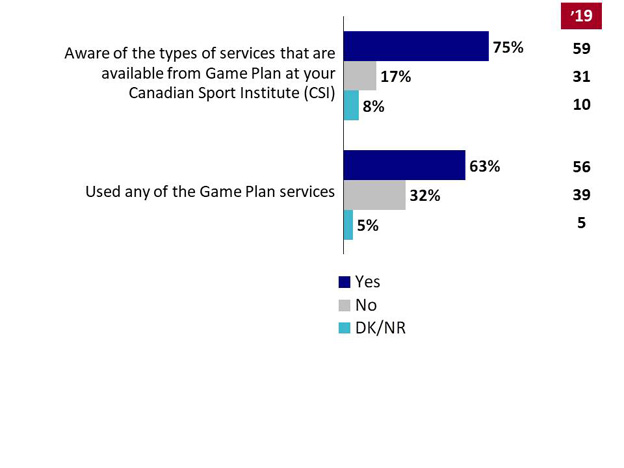
Game Plan is Canada's athlete wellness program that supports athletes on and off the field of play, and equips them to stay in sport longer, perform better and retire healthier knowing they have the tools to prepare for all stages of their career. These services are offered through the CSIs. Seventy-five percent indicated that they are aware of this program service, although 17% are not and a further 8% said they don't know. This is a significant increase from 59% who were aware of the recently revamped and enhanced service in 2019. Of athletes aware of the service, 63% said they have used Game Plan (32% have not and 5% said they don't know), which is also an increase from 56% in 2019.
Chart 18: Awareness and Use of Game Plan
Chart 18: Awareness and Use of Game Plan - Text Version
This chart with triple single bars shows the percentage of results for responses to two statements across three categories: yes, no, and DK/NR. One column on the side shows the percentage of results for 2019.
Respondents were asked two questions: "Are you aware of the types of services that are available from Game Plan at your Sport Institute (CSI)?" and "Have you used any of the Game Plan services?"
Respondents selected:
Aware of the types of services that are available from Game Plan at your Canadian Sport Institute (CSI):
Category "Yes": 75%; 2019: 59%
Category "No": 17%; 2019: 31%
Category "DK/NR": 8%; 2019: 10%
Used any of the Game Plan services:
Category "Yes": 63%; 2019: 56%
Category "No": 32%; 2019: 39%
Category "DK/NR": 5%; 2019: 5%
Top statement: Base: n=857
Bottom statement: Base: n=648 (Those who have used CSI services)
Q14. Are you aware of the types of services that are available from Game Plan at your Sport Institute (CSI)? Base: n=857
Q14b. Have you used any of the Game Plan services?
Base: n=648 (Those who have used CSI services)
SR, SR1 and SR2 card athletes are considerably more likely to be aware of Game Plan (80% to 88%) compared with athletes with D and C1 cards (67%), or younger athletes in general (63%).
Awareness is highest among athletes with a NSO coach (80%).
It is not surprising given awareness levels that athletes with SR cards (71% to 73%), those who are 25 to 29 (71%), and athletes with a national team (68%) are more likely to have used Game Plan.
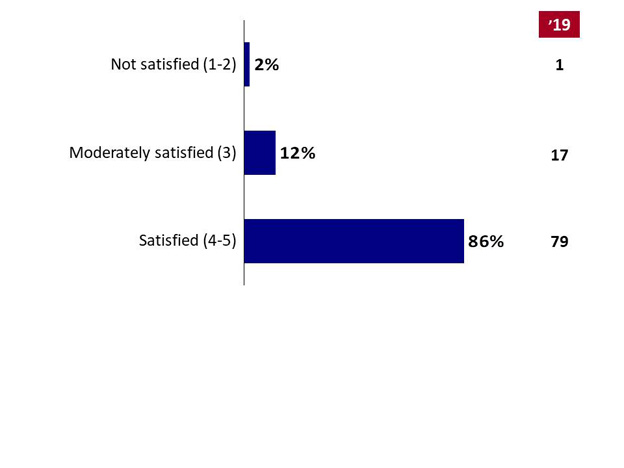
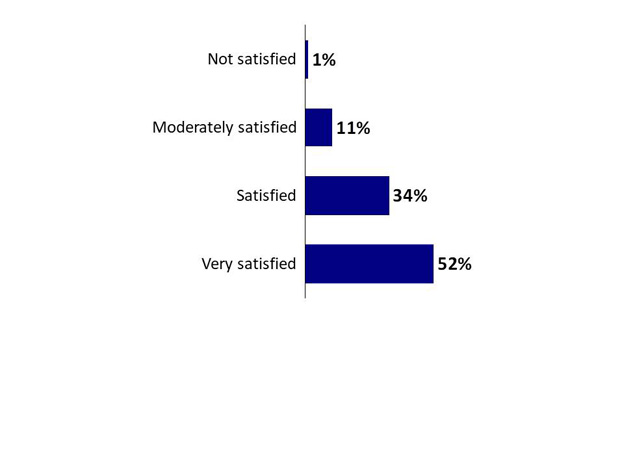
Among those who have used Game Plan, satisfaction is high at 86% (increased somewhat from 79% in 2019), although 37% indicated only moderate satisfaction (but only 2% said they are dissatisfied).
Chart 19: Satisfaction with Game Plan
Chart 19: Satisfaction with Game Plan - Text Version
This chart of single bars shows the percentage of results for responses to three statements. One column on the side shows the percentage of results for 2019.
Respondents were asked: "How satisfied would you say you are with the Game Plan services you have received?"
Respondents selected:
Not satisfied (1-2): 2%; 2019: 1%
Moderately satisfied: 12%; 2019: 17%
Satisfied: 86%; 2019: 79%
Base: n=412 (Those who have used CSI services)
Q14c. How satisfied would you say you are with the Game Plan services you have received?
Base: n=412 (Those who have used CSI services)
Athletes in British Columbia are somewhat less likely to be satisfied with Game Plan (75%) compared with other athletes. Those marginally more likely to be satisfied are training in Quebec (92%).
Importance of Sport Science Services
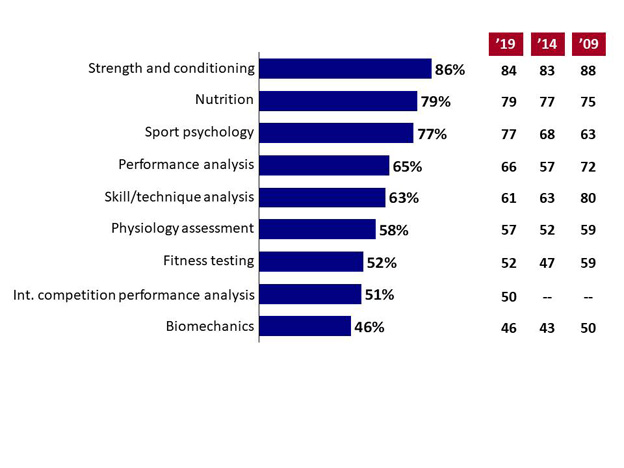
Athletes were asked about the relative level of importance of various sport science services provided by the CSCs/CSIs, as well as the quality of each of the same services. At the top of the list is strength and conditioning, with 86% of respondents rating it highly important, followed closely by 79% of athletes who feel that nutrition and 77% who feel sports psychology are crucial services. In a second tier of importance are performance analysis (65%), skill and technique analysis (63%), and physiology assessment and monitoring (58%). In a third tier, 52% to 46% find fitness testing (52%), international competition performance analysis (51%) and biomechanics (46%) to be important. Results are almost exactly the same as found in 2019. Note that, compared with results from 2014, the importance of sport psychology and performance analysis seem to have seen the largest increase in perceived importance over time, with some modest increase also found in fitness testing.
Chart 20: Important Sport Science Services
Chart 20: Important Sport Science Services - Text Version
This chart of single bars shows the percentage of results for responses to nine statements. Three columns on the side show the percentage of results for 2019, 2014, and 2009.
Respondents were asked: "Which of the following sport science services would you consider to be important to you in terms of the positive impact that they can have on your performance?*"
Respondents selected:
Strength and conditioning: 86%; 2019: 84%; 2014: 83%; 2009: 88%
Nutrition: 79%; 2019: 79%; 2014: 77%; 2009: 75%
Sport psychology: 77%; 2019: 77%; 2014: 68%; 2009: 63%
Q15. Which of the following sport science services would you consider to be important to you in terms of the positive impact that they can have on your performance?*
Base: n=857
Note change in approach to question since 2009
Biomechanics are considered more important among individual sport athletes compared with team sport athletes (49% versus 40%).
Sport psychology (93%), physiology assessment and monitoring (76%), and biomechanics (65%) are more often considered important among athletes with an SR2 card compared with other athletes. Fitness testing is more likely to be seen as important among D card athletes (58%) compared with other athletes.
Winter sport athletes are more likely to place importance on individual athlete performance (70%) and skill analysis (71%) than summer sport athletes (63% and 60% respectively).
Sports psychology is considered more important among females (81%) compared with males (73%).
Sports psychology is more apt to be considered important among Quebec (86%) and Francophone (91%) athletes compared with other athletes.
Athletes with a NSO coach are more likely than others to consider strength and conditioning (89%), physiology assessment and monitoring (62%), and fitness testing (55%) to be important.
While everyone agrees that strength and conditioning are the most important services for athletes to receive, compared with athletes, coaches are even more likely to put sport psychology near the top of the list (95%), along with skill/technique analysis (82%), performance analysis (83%), physiology assessment (83%) and international competition performance analysis (76%). In fact, nutrition falls to the seventh place on the list among coaches, after international competition performance analysis. Compared with 2019, coaches place more importance on physiology assessment than they did four years earlier. There has also been a modest increase in the proportion of coaches who find strength and conditioning, sport psychology, performance analysis and nutrition to be important.
Table 2: Important Sport Science Services – Coaches' Perspective
Response
Athletes (2023)
Coaches (2023)
Coaches (2019)
Coaches (2014)
Coaches (2009)
Strength and conditioning
86%
92%
96%
91%
80%
Nutrition
79%
86%
80%
75%
66%
Sport psychology
77%
95%
94%
89%
69%
Performance analysis
65%
83%
83%
78%
66%
Skill/technique analysis
63%
82%
85%
83%
78%
Physiology assessment
58%
83%
83%
71%
60%
Fitness testing
52%
74%
68%
65%
61%
Int. competition performance analysis
51%
76%
82%
--
--
Biomechanics
46%
63%
63%
69%
50%
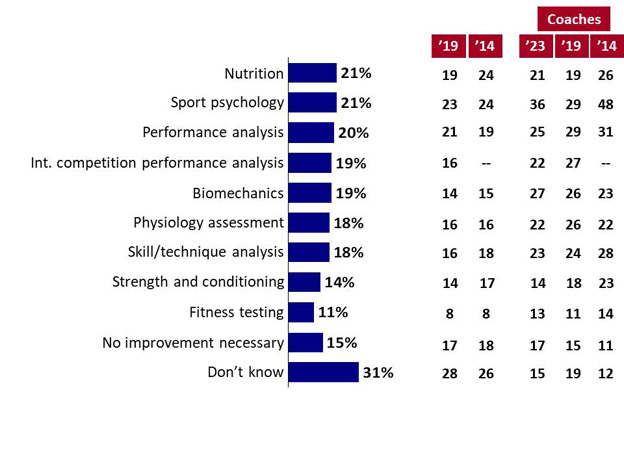
Based on their experience of the previous 12 months, athletes were asked the need for improvement in the quality of sport science services. A total of 46% said that they either did not know (31%) or did not see the need for improvement (15%). Fifty-four percent, however, suggested one or more sport sciences where improvements are needed. Nutrition (21%), sport psychology (21%), and performance analysis (20%) services sit at the top of the list. Between 14% and 19% see the need for improvements in the areas of international competition performance analysis, biomechanics, physiology assessment, skill/technique analysis, and strength and conditioning. Only 11% see a need for improvements in fitness testing.
Results are largely similar among coaches, however, compared with athletes there is a more compelling argument made by coaches for improvements in sports psychology (36%), and biomechanics (27%) compared with the views of athletes. Compared with 2019, coaches' views are similar, although the need for improvements in sport psychology has increased, although still considerably lower than found in 2014.
Chart 21: Need for Improvements in Sport Science Services
Chart 21: Need for Improvements in Sport Science Services - Text Version
This chart of single bars shows the percentage of results for responses to eleven statements. Five columns on the side show: 1) the percentage of results for 2019 and 2014; 2) three columns show the percentage of results for coaches for 2023, 2019, and 2014.
Respondents were asked: "Thinking about the quality of the sport science services you have received from the CSC/CSI over the last 12 months, which ones, if any, would you say are in need of improvement?"
Respondents selected:
Nutrition: 21%; 2019: 19%; 2014: 24%
Coaches: 2023: 21%; 2019: 19%; 2014: 26%
Sport psychology: 21%; 2019: 23%; 2014: 24%
Coaches: 2023: 36%; 2019: 29%; 2014: 48%
Performance analysis: 20%; 2019: 21%; 2014: 19%
Coaches: 2023: 25%; 2019: 29%; 2014: 31%
International competition performance analysis: 19%; 2019: 16%; 2014: --
Strength and conditioning: 14%; 2019: 14%; 2014: 17%
Coaches: 2023: 14%; 2019: 18%; 2014: 23%
Fitness testing: 11%; 2019: 8%; 2014: 8%
Coaches: 2023: 13%; 2019: 11%; 2014: 14%
No improvement necessary: 15%; 2019: 17%; 2014: 18%
Coaches: 2023: 17%; 2019: 15%; 2014: 11%
Don't know: 31%; 2019: 28%; 2014: 26%
Coaches: 2023: 15%; 2019: 19%; 2014: 12%
Base: n=837
Q16. Thinking about the quality of the sport science services you have received from the CSC/CSI over the last 12 months, which ones, if any, would you say are in need of improvement?
Base: n=837
There are limited differences in the views of athletes with regard to areas for improvements although a slightly higher proportion of summer sport athletes who argue for improvements in the area of biomechanics (21%) compared with winter sport athletes (14%).
C1 card athletes are more likely than other athletes to point to individual athlete performance as an area for improvement (30%).
Athletes who under 20 or older are slightly more likely than older athletes to see a need for improvement in sport psychology (28%).
Athletes with a NSO coach are more likely that other athletes to see a need for improvements in the area of international competition analysis (23%) and skill technique/ analysis (20%).
When asked about additional sport science services that coaches would like to see their athletes receive, sport psychology/mental health education and supports were noted by more than 10 of the 50 coaches responding to the question. More or better access to physiotherapy was also mentioned by a few. Better or additional services related to biomechanics and also nutrition was mentioned by two or three coaches each.
Impact of Sport Medicine Services
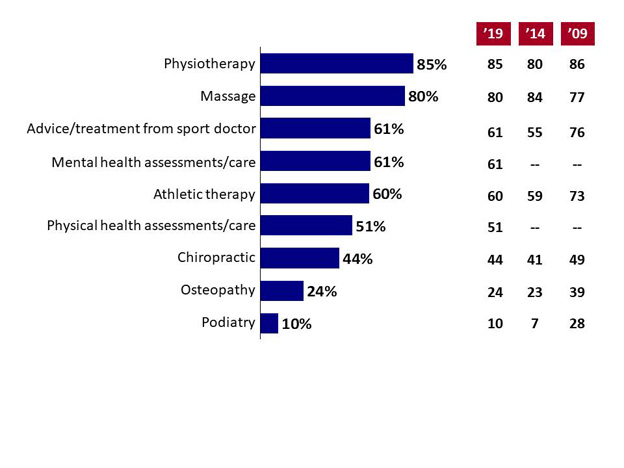
Athletes were similarly asked to rate the importance and need for improvement of various sport medicine services provided by CSCs/CSIs. In terms of importance to performance, physiotherapy (85%) and massage (80%) are perceived as the most important services. Fewer people value advice and treatment from a sport doctor (61%), mental health assessments and care (61%), and athletic therapy (60%) as key services. This is followed by physical health assessments and care (51%) and chiropractic services (44%). Other medical services garnered lower importance ratings including osteopathy (24%), and podiatry (10%). These results are very similar to the results found in 2019, and to those found in 2014 where comparisons are possible, with perhaps slightly greater emphasis in 2023 on advice and treatment from a sport doctor. The administration of this question changed after 2009 making comparison difficult, however, results suggest that massage has become more important over time, while athletic therapy and advice and treatment from a sport doctor have become less so over time.
Chart 22: Important Sport Medicine Services
Chart 22: Important Sport Medicine Services - Text Version
This chart of single bars shows the percentage of results for responses to nine statements. Three columns on the side show the percentage of results for 2019, 2014, and 2009.
Respondents were asked: "Which of the following sport medicine services would you consider to be important to you in terms of the positive impact that they can have on your performance?*"
Q17. Which of the following sport medicine services would you consider to be important to you in terms of the positive impact that they can have on your performance?*
Base: n=857
Note change in approach to Question since 2009
Chiropractic (33%) and osteopathy (15%) are less likely to be seen as important among Paralympic athletes.
Chiropractic is most often considered important among SR2 card athletes (59%).
Athletes pursuing team sports are more likely to view athletic therapy as important (70% compared with 53% of individual sport athletes).
Advice and treatment from a sport doctor is more likely to be considered important by athletes who are 25 to 29 years of age (69%), as is also the case for osteopathy (29%).
Females are more likely than males to point to the importance of massage (84% compared with 76% among men), mental health assessments and care (70% compared with 50%), and to a lesser extent, osteopathy (28% compared with 19%).
Quebec (32%), and Francophone athletes (36%) are more likely than their counterparts to point to osteopathy as important sport medicine services. Massage (87%) and chiropractic care (57%) are seen as a more important service among athletes in Alberta.
Massage is also more often seen as important among athletes with a personal coach (87%).
Coaches are largely in agreement with athletes on the ranking of these services in terms of their relative importance, although advice from a sport doctor, and mental and physical health assessments and care are given considerably greater weight than accorded by athletes.
Table 3: Important Sport Medicine Services – Coaches' Perspective
Response
Athletes (2023)
Coaches (2023)
Coaches (2019)
Coaches (2014)
Coaches (2009)
Physiotherapy
85%
92%
93%
86%
90%
Massage
80%
82%
85%
90%
79%
Advice/treatment from sport doctor
61%
80%
85%
70%
76%
Mental health assessments/ care
61%
84%
85%
--
--
Athletic therapy
60%
59%
63%
64%
75%
Physical health assessments/ care
51%
67%
71%
--
--
Chiropractic
44%
42%
38%
48%
34%
Osteopathy
24%
27%
23%
30%
41%
Podiatry
10%
15%
11%
6%
18%
Compared with the need for improvements in sport sciences, fewer athletes put forward areas of sport medicine where improvements are required. Twenty-one percent indicated no areas for improvement and 39% said they did not know. Among the 40% suggesting areas for improvement, about a third pointed to massage, physiotherapy, advice or treatment from a sport doctor, and mental health assessments (14% overall in each case). Also, chiropractic services, physical health assessments and athletic therapy were selected by 11% to 13%.
Results are similar among coaches although mental health assessments and care, and massage seem to be noticeably more in need of improvements among coaches than perceived to be the case among athletes. Compared with 2019 a larger proportion now see a need for improvement in massage, and a smaller proportion feel the need for improvements in advice and treatment from a sports doctor. Overall, a higher proportion now say there is no need for improvements compared with 2019, closer to results seen in 2014.
Chart 23: Need for Improvement in Sport Medicine Services
Chart 23: Need for Improvement in Sport Medicine Services - Text Version
This chart of single bars shows the percentage of results for responses to eleven statements. Five columns on the side show: 1) the percentage of results for 2019 and 2014; 2) three columns show the percentage of results for coaches for 2023, 2019, and 2014.
Respondents were asked: "Thinking about the quality of the sport medicine services you have received from the CSC/CSI over the last 12 months, which ones, if any, would you say are in need of improvement?"
Respondents selected:
Massage: 14%; 2019: 17%; 2014: 26%
Coaches: 2023: 21%; 2019: 14%; 2014: 26%
Physiotherapy: 14%; 2019: 14%; 2014: 17%
Coaches: 2023: 18%; 2019: 18%; 2014: 27%
Advice/treatment from sport doctor: 14%; 2019: 13%; 2014: 16%
Coaches: 2023: 17%; 2019: 27%; 2014: 18%
Mental health assessments/care: 14%; 2019: 22%; 2014: --
Coaches: 2023: 32%; 2019: 37%; 2014: --
Chiropractic: 13%; 2019: 9%; 2014: 11%
Coaches: 2023: 11%; 2019: 11%; 2014: 17%
Physical health assessments/care: 12%; 2019: 10%; 2014: --
Coaches: 2023: 15%; 2019: 13%; 2014: --
Athletic therapy: 11%; 2019: 10%; 2014: 13%
Coaches: 2023: 15%; 2019: 10%; 2014: 17%
Osteopathy: 7%; 2019: 5%; 2014: 6%
Coaches: 2023: 8%; 2019: 10%; 2014: 6%
Podiatry: 5%; 2019: 3%; 2014: 3%
Coaches: 2023: 8%; 2019: 1%; 2014: 0%
No improvement necessary: 21%; 2019: 25%; 2014: 31%
Coaches: 2023: 25%; 2019: 19%; 2014: 29%
Don't know: 39%; 2019: 32%; 2014: 27%
Coaches: 2023: 22%; 2019: 24%; 2014: 18%
Base: n=837
Q18. Thinking about the quality of the sport medicine services you have received from the CSC/CSI over the last 12 months, which ones, if any, would you say are in need of improvement?
Base: n=837
Mental health assessments and care are more often seen as an area for improvement among females (17%) than males (11%).
Francophone athletes (33%) are less likely to feel that improvements are needed in sport medicine services.
Physiotherapy (22%) and massage (19%) are areas where athletes from British Columbia are more likely than others across the country to suggest a need for improvement. The same is true for athletes between 30 and 34 with regard to physiotherapy (20%).
In addition to the evidence of athletes and coaches regarding importance of the various sport science and sport medicine services, CSI Presidents and Service Managers were also asked about the level of demand that they see for these same services that they offer at their CSI's. At the top of the list are strength and conditioning (15 out of 15 respondents), followed by sport psychology (13 out of 15), and nutrition (12 of 15). In a second tier, CSI representatives pointed to fitness testing (9), massage (9), advice from a sports doctor (9), and physiotherapy (9). The lowest demand reported is for podiatry and osteopathy and chiropractic services. In other services offered, the demand is highest for career planning (8), education support services (8) and other Game Plan services (10).
Over the past several years CSCs have received additional funds to provide sport science/sport medicine services to athletes and targeted sports - Summer and Winter. A few CSC representatives stated that the additional funds have helped and enable the CSC's/CSIs to provide a holistic approach for athletes to better achieve their potential. Nonetheless, several also say that more funding is needed.
CSI representatives suggested areas that would enhance these services over what is currently offered. Areas where representatives believe services could be enhanced include nutrition (12), sport psychology (11), physiotherapy (11), strength training (10), physical health assessments (10), education of Game Plan support services (10) and accommodation assistance (9). CSI representatives pointed to funding (15) and adequately trained personal to provide the services (13) as the keys to growing capacity in these areas.
Most of the CSC representatives (12 out of 15) said that athletes need services that they are not getting, although responses were varied in terms of what those services were. Several representatives mentioned health and dental benefits, mental health support or family planning as needed services. The benefit of offering these services, according to 9 to 11 CSI respondents, includes decreased stress on athletes, faster recovery time and increased number of training days.
When asked about additional services that should be considered by AAP under the Supplemental Support category, a number of coaches continued instead to argue for increased financial support for increasing shelter and living costs, or for coverage of expenses related to competitions, even though not part of the Supplemental Support category of AAP. A few talked about additional mental health education and support. A few others talked about coverage for dentistry and other health-related expenses. Several spoke of the need to fund more younger (i.e., Next Gen) athletes, and a few others argued for a complete rethink or overhaul of the system.
E. Financial Picture
Annual Income
As shown in Table 4a, carded athletes reported an average annual income of $34,945[3] for 2022, which is only marginally higher than reported in 2018 once adjusted for inflation ($33,784). Consistent with the previous studies, the largest proportion of this income is derived from government assistance; half of athletes' average income is from either Federal and/or Provincial/ Territorial athlete assistance, which is down marginally from about 56% in 2018 and 2012. Of this government assistance, the majority is from the Federal level ($13,744 annually on average) while Provincial athlete assistance is less prominent ($3,730 annually on average). While these are similar figures to actual figures reported in 2018, they are lower once the 2018 figures are adjusted to 2022 dollars. Smaller proportions of athletes' incomes are derived from actual employment income (34% or $11,990 annually among all athletes although half do not report employment income), which is on par with 2018 once adjusted to 2022 dollars ($11,162). Sport-related sources (such as professional salaries, endorsements/sponsorships or appearance fees/prize money makes up 17% of reported income, at an average of $5,884 across all athletes, although nearly two in three athletes do not report sport-related income. This is on par with 2018 when $5,777 was reported (in constant 2022 dollars); making up 17% of annual income across all athletes. Only a very small proportion is derived from other sources ($1,318 annually), sports awards ($1,381), and the NSO's ($942) which is similar to figures reported in 2018 once adjusted for inflation, although a slightly higher figure is reported for other income in 2022.
Table 4b provides the average annual income reported in each category across all athletes. Note that bold text indicates statistically significant differences from the overall pooled results for all athletes in the sample. Figures indicate that winter sport athletes are commanding higher incomes than summer sport athletes, largely driven by much higher sport-related income. Athletes in team sports also report significantly higher employment and sport-related income than individual sport athletes who report relatively higher income from government sources.
Paralympians are also making considerably more income, largely from higher employment income, which is perhaps not surprising given that employment income rises with age and Paralympians are typically much older and have a higher incidence of being employed. The amount indicated under "other" is also higher. They also receive a higher amount in AAP which could be due to the proportion of SR vs. D cards allocated to the Para-sport athletes through nominations by their NSOs, as well as provincial support, which may be necessitated by the fact that Olympic athletes have a sport-related income that is much higher than that of Paralympic athletes.
Income increases by card level was contributed to mostly by higher employment income and from higher government assistance. Sport-related income is significantly lower among D card athletes, as is awards. Income goes up similarly with age rising sharply in employment, sport-related and NSO income at 30 years of age, and AAP assistance at 20 years of age.
There is very little difference based on gender, although males report a somewhat higher income from employment income, while females report higher income for provincial/territorial as well as NSO assistance.
Table 4b: Average Personal Income by Athlete Characteristic
Looking at monthly expenses in Table 5a, athletes reported an average of $3,294[8] and about $500 per month more than reported in 2018 when accounting for inflation (i.e., in 2022 dollars). This represents more than a 20% increase in monthly expenses, with the sharpest increase reported in housing costs since 2018.
As shown in Table 5b, athletes pursuing individual sports report higher sport-related expenses while team sport athletes report slightly higher shelter expenses. Note that bold text indicates statistically significant differences from the overall pooled results for all athletes. Winter sports also have higher sport-related costs. Paralympic athletes report the highest shelter costs as do SR1 card athletes and those who are 30 or older.
Table 5b: Average Monthly Expenses by Athlete Characteristic
Considering the average income of $34,945 per year and the expenses of $3,294 a month or $39,528 per year, athletes are facing a monthly shortage of $382 per month or $4,583 a year. The deficit is largest among athletes who are between 20 and 24 ($7,700), those holding SR2 cards ($6,900) and athletes pursuing individual sports ($6,300). Athletes with the lowest annual deficit are involved in team sports ($1,600), as well as athletes under 20 years of age ($1,500), and those holding SR ($1,700) or D cards ($1,100), as well as those with employment income ($600).
Personal Debt and Sources of Support
In terms of personal debt, 14% of athletes said that they have incurred some level of repayable debt in the pursuit of their athletic career. This shows a trend since 2004, where levels of debt have consistently lowered: in 2004, 45% said that they had debt, in 2009 24% had incurred debt, 20% in 2014 and 18% in 2019.
The average gap between income and expenses is significantly higher among those reporting loans ($8,600 for those reporting loans versus $2,200 among those without loans). The gap is not very different, however, based on type of loan, in part because of the lack of cases to detect a statistically significant difference.
Chart 24: Financial Loans
Chart 24: Financial Loans - Text Version
This chart of single bars shows the percentage of results for responses to three statements. Four columns on the side show the percentage of results for 2019, 2014, 2009, and 2004.
Respondents were asked: "Have you incurred any loans to assist you to pursue your athletic career?"
Q22a. Have you incurred any loans to assist you to pursue your athletic career?
Base: n=857
Athletes who are 35 or older are the most likely to have incurred loans (24%), followed by those who are between 20 and 24 (20%), compared with other athletes.
The incidence of loans is also higher than average in Alberta (19%).
With regard to the types of repayable loans, credit card debt is the most frequently cited source of debt among athletes with loans (56%; 8% of all athletes), which is higher than the 44% measured in 2019, and 44% in 2014, but on par with 55% in 2009. Loans from family (including parents, spouse, and friends) is also high on the list at 47% of those who have taken loans (7% of all athletes). This is significantly lower than found in 2019 at 65%, and 56% in 2014, but on par with 49% measures in 2009. Thirty-six percent of athletes with loans (5% of all athletes), received loans from financial institutions for something other than a mortgage which is an increase from 25% in 2019, but on par with 2014 (35%). Student loans, with much better loan conditions, have also risen to 34% (5% of all athletes) compared with previous years. Overall, results suggest that fewer athletes are able to rely on loans from families and therefore higher proportions are having to rely not only on student loans, but on higher interest sources.
When loan amounts are added together they amount to an average of $2,900 in repayable debt across all athletes. Including only the 14% of athletes with loans, however, the amount is closer to $26,300.
Table 6: Type of Financial Loans
Q22b. Which of the following type of loans do you have currently?
2023 Athletes with Loans
2023 All Athletes
2019 Athletes with Loans
2019 All Athletes
2014 Athletes with Loans
2014 All Athletes
2009 Athletes with Loans
2009 All Athletes
Credit cards
56%
8%
44%
8%
49%
10%
55%
10%
Loans from family
47%
7%
65%
12%
56%
11%
49%
12%
Loans from a financial institution
36%
5%
26%
5%
35%
7%
45%
11%
Student loans
34%
5%
25%
5%
29%
6%
25%
6%
(Those who have incurred loans)
Athletes with a D card are more likely than other athletes with loans to have government student loans (47%).
Similarly, athletes who are 30 or older have the highest overall amount of debt than other athletes with loans, at just $40,000 on average.
Loan amounts are highest among those borrowing from a financial institution ($35,500).
Athletes were also asked to indicate the extent to which they are dependent on various sources for financial or material support that they are not required to pay back. As in previous years, Sport Canada's AAP is by far the most prevalent source of financial support; 78% rely on the AAP to a great extent. Family and Provincial/Territorial AAP are both rated as strong sources for 49% and 50%, respectively. Reliance on family and on Provincial/Territorial AAP has also remained about the same since 2014 or 2009.
Chart 25: Source of Financial Support
Chart 25: Source of Financial Support - Text Version
This stacked chart shows the percentage of results for responses to three statements across three categories: low extent, moderate extent, and high extent. Three columns on the side show the percentage of results ("high extent") for 2019, 2014, and 2009.
Respondents were asked: "To what extent do you depend on each of the following sources for financial or material support that you are not required to pay back?"
Q24a-c. To what extent do you depend on each of the following sources for financial or material support that you are not required to pay back?
Base: n=857
Significant dependency on Sport Canada's AAP is more often the case among SR (88%), and SR2 (97%) carded athletes, along with those who are 25 to 29 (88%), as well as those who train with their NSO/National Team coach (85%). It is also more often true of winter (85%), and individual sport (82%) athletes compared with their counterparts.
This is least likely to be the case among athletes under 20 years of age (58%) and D card athletes (68%).
Dependency on family is more likely to be significant among the youngest athletes (under 20; 75% and 20 to 24; 57%), and at the D card level (66%), whereas it is least likely among SR (37%), SR1&2 (28%-29%) card athletes and Paralympic athletes (30%).
Reliance on Provincial/Territorial AAP is more often significant among athletes in Quebec (73%) (and Francophones; 72%), Ontario (59%), and individual sport athletes (55%) as well as those at the SR1 (61%) and SR2 (67%) card levels, and athletes with an NSO coach (57%). It is also the case most often among athletes between 25 and 29 (60%).
This is least often the case among athletes in British Columbia (22%) and D card (41%), as well as the youngest (35%) athletes.
Financial Barriers
Athletes were asked to indicate the extent to which money has been a barrier to accessing a variety of resources. Perceptions of money as a barrier to a high extent are roughly on par with 2019 and also fairly similar to 2014 and 2009; the highest number is 25% of athletes believing that money has been a significant barrier to international competitions. Note that in 2009 athletes were asked about "competitions" without the specification of international vs. domestic. After international competitions, money is seen as a significant barrier to appropriate nutrition for 23%, followed by proper housing for 19% of athletes and equipment for 18%. Money also presents a barrier in accessing coaching services, and domestic competitions for one in ten athletes (11%).
Chart 26: Financial Barriers
Chart 26: Financial Barriers - Text Version
This stacked chart shows the percentage of results for responses to six statements across four categories: don't know; low extent, moderate extent, and high extent. Three columns on the side show the percentage of results ("high extent") for 2019, 2014, and 2009.
Respondents were asked: "Thinking about the last 12 months, how much has money been a barrier to your accessing each of the following?
Q26a-h. Thinking about the last 12 months, how much has money been a barrier to your accessing each of the following?
Base: n=857
The youngest athletes (under 20) are least likely to rate several of these as areas where they experience financial barriers, including nutrition (66% do not experience this barrier), proper housing (72% do not), and equipment (63% do not, as is also the case with those who are between 20 and 24). Athletes who are between 20 and 24 also do not typically report a financial barrier to accessing coaching services (76% do not).
Athletes who are 35 or older are the most likely to note financial barriers to equipment (27%), and international competitions (44%), although they along with those under 20 are the least likely to note financial barriers to housing (71% of those 35 or older do not note this). It is athletes who are between 25 and 29 who most often see money as a barrier to housing (26%).
Males are somewhat more likely than females to note equipment (21% versus 15%) as an area where they experience limitations due to money.
Athletes in winter sports are somewhat more likely to see equipment as cost prohibitive compared with summer athletes (22% versus 16%). Summer sport athletes, on the other hand are less apt to experience financial barriers with coaching services (73% do not) compared with athletes in winter sports where 60% do not.
Those in individual sports are also more likely than team sport athletes to report that money holds them back from international competitions (30% versus 19%) and accessing the equipment they need (22% versus 12%). Team sport athletes are considerably less likely, however, to experience barriers to international competitions (64% do not compared with 47% of those in individual sports).
Paralympic athletes are more likely to experience financial barriers to equipment (30%), compared with Olympic athletes (16%). Olympic athletes are considerably less likely to face financial barriers to domestic competitions (70% do not) compared with paralympic athletes (55%).
There are few differences based on card level, although SR card athletes are the most likely group to report financial barriers to international competitions (31%) and proper housing (24%).
International competitions is the only area where there are sizable regional differences, with athletes in western Canada more often noting financial barriers. In particular, 42% of athletes Manitoba and Saskatchewan, along with 33% of those training in Alberta and 32% of those in British Columbia say that finances make it difficult to compete internationally. Athletes in British Columbia are also more likely than others across the country to point to financial barriers to nutrition (28%) and domestic competitions (16%).
Athletes training with the national team coach are, naturally, less likely to experience financial barriers to coaching services (73% do not) compared with 67% of those with a personal coach. They are somewhat more likely, however, to experience barriers to proper housing (23% compared with only 12% of those with a personal coach). Athletes with a personal coach are more likely to find it difficult to pay for international competitions (33%).
Compared with athletes, coaches see money as a greater barrier for athletes for most of the aspects of sport tested – international competitions in particular, followed by proper housing, domestic competitions, equipment and coaching services. Coaches are also more likely in 2023 to see money as a barrier to proper housing and domestic competitions.
Table 7: Financial Barriers
High extent (4-5)
Athletes
Coaches (2023)
Coaches (2019)
Coaches (2014)
Coaches (2009)
International competitions
25%
57%
62%
57%
49%
Appropriate nutrition
23%
33%
33%
18%
19%
Proper housing
19%
42%
33%
23%
24%
Equipment
18%
35%
36%
26%
23%
Domestic competitions
11%
39%
24%
21%
--
Coaching services
11%
27%
36%
36%
24%
As a follow-up question, athletes were asked about the minimum necessary amount they would need to support themselves and train full-time. Forty-four percent of athletes forecast that they require between $30,000 and $59,999 to not have to rely on AAP funding. This has also been the case for 47% to 50% of athletes reporting this since 2004. Only 12% said they could get along with less than $30,000, which has decreased consistently as a proportion of carded athletes since 2004 when it was 35%. Seventeen percent would need $60,000 to 79,999, and 14% would need $80,000 or more, both of which have increased from previous years.
Table 8: Required Income Levels
Q27. What level of total annual personal income would be the minimum necessary to support yourself to enable you to train on a full-time basis? (Base: n=857)
2023
2019
2014
2009
2004
$0,000-$19,999
4%
3%
4%
6%
10%
$20,000-$29,999
8%
14%
20%
18%
25%
$30,000-$39,999
16%
17%
22%
23%
23%
$40,000-$49,999
15%
18%
16%
13%
16%
$50,000-$59,999
13%
13%
12%
11%
8%
$60,000-$69,999
8%
10%
7%
7%
7%
$70,000-$79,999
9%
5%
4%
5%
3%
$80,000 +
14%
10%
8%
6%
3%
The level of gross annual income required by athletes to support a full-time training regime increases with the age of the athlete.
This corresponds to the pattern by card level (with D's reporting the least income requirements and SR1/2s reporting the highest requirement). Athletes in winter sports tend to have higher income needs than those in summer sports.
F. AAP Policy
Support to Changes to AAP Criteria
Athletes were asked to provide their opinion on a number of statements relating to the Athlete Assistance Program (AAP). Most athletes agree (75%) that the AAP has made it possible to achieve higher levels of athletic performance. Only a small number (7%) disagrees that this is the case. These results are consistent across coaches and athletes for previous measurement periods.
Forty-seven percent of athletes agree that the AAP is assisting or has assisted them in pursuing post-secondary education. This is on par with 46% in 2019, a slight decrease from 2014 (51%), but consistent with 2009 results (47%). Almost 20% disagree with this statement. Agreement rises to 69% among those currently attending post-secondary education most likely because they are aware of and are accessing the financial benefits from tuition from the AAP. Coaches are considerably more positive than the athletes in this area with 70% agreeing that AAP has assisted with post-secondary education. Agreement among coaches is has gone down, however, from 75% in 2019 and 81% in 2014.
Although athletes tend to agree that the AAP has helped make their training possible, relatively few (25%) feel the AAP funding is sufficient to meet their living and training needs. Fifty-four percent disagrees with this statement. Agreement that the AAP has helped make their training possible has decreased since 2019 when 38% agreed, and to a lesser extent since 2009 and 2014 when 33% agreed. This opinion is even less apt to be supported by coaches where only 14% believe that funding is sufficient, which is lower than 21% in 2019 and 2014, and 31% in 2009.
In terms of timing of AAP funding, 22% of athletes agree that funding came too late in their career, which is roughly on par with results from 2019 (25%) and 2014 (23%, although decreased from 2009 at 28%). However, 49% of athletes disagree that the funding came too late. Coaches are more likely than athletes to view AAP funding as being received too late in the athletes' careers (35%), which is higher than 28% in 2019, but somewhat less than the agreement found in 2014 (40%), and lower still than 49% in 2009.
Chart 27: AAP Positive/Negative Aspects
Chart 27: AAP Positive/Negative Aspects - Text Version
This stacked chart shows the percentage of results for responses to four statements across three categories: disagree, neither, and agree. Three columns on the side show the percentage of results ("agree") for 2019, 2014, and 2009.
Respondents were asked: ". To what extent do you agree or disagree with each of the following statements?"
Respondents selected:
AAP has made it possible for me to achieve higher levels of athletic performance:
Q29a-d. To what extent do you agree or disagree with each of the following statements?
Base: n=857
Athletes who are between 25 and 29 (81%) and those with SR (81%) or SR1 (82%) cards are more likely to agree that AAP made it possible to achieve a higher level of performance. Those least likely to agree are those with D cards (60%).
Athletes between the ages of 20 and 24 (55%) and 25 to 29 (54%) are more apt to agree that funding helped them pursue a post-secondary education. Those who are 35 or older are least likely to agree (35%).
Athletes who are under 20 (41%) are more likely to agree that AAP funding is sufficient to meet living and training needs. Those who are 25 to 29 (18%) or 30 to 34 (14%) are least likely to agree, as are athletes in British Columbia (16%).
Athletes with a SR1 card are most likely to believe that funding did not come too late in their career. That is 58% disagreed with this statement.
Coaches who do not feel that AAP assistance is adequate to meet the living and training needs of athletes cite a variety of reasons. Most common is that the level of support has not increased proportionally with the cost of living, particularly due to rising shelter costs in major Canadian cities (e.g., Vancouver, Toronto). Some also that it is not high enough for the cost of the sport and associated travel and training, and that this is more expensive for some sports than others. A few highlighted the increasing disparity between senior card athletes and NEXT Gen athletes who receive limited support, contributing to the need to work and in some cases, premature retirement from their sport.
As noted, 35% of coaches feel that athletes receive AAP funding too late in their career. Through open end responses, some of these coaches said that the current funding model supports athletes who have already achieved success. Several emphasized that the funding should be available earlier, often in teenage years, to aid in developing athletes to reach their potential and avoid elite athletes leaving the sport, before they have achieved a level where they receive adequate compensation. A few pointed specifically to costly international competitions, training facilities and services, which are needed in order to get to a level where there is financial support.
G. AAP Client Satisfaction
Contact with AAP
The main contact for athletes receiving AAP support is their NSO, however, from time to time athletes contact AAP staff for information about the Program or questions regarding the benefits of the Program. The study explored athletes' and coaches' levels of satisfaction with AAP staff. As in 2014 and 2019, 30% have contacted Sport Canada AAP in the previous 12 months compared with only 22% in 2009.
Athletes were asked if they felt they were served in the official language of their choice, receiving a unanimous response, where 100% said they were served in their language of choice.
Coaches reported a higher incidence of contacting Sport Canada, with 37% indicating they have contacted the organization in the past year. Nine of the 15 CSC representatives indicated contact with AAP staff.
Chart 28: AAP Contact in Past Year
Chart 28: AAP Contact in Past Year - Text Version
This chart of single bars shows the percentage of results for responses to three statements. Three columns on the side show the percentage of results for 2019, 2014, and 2009.
Respondents were asked: "Have you contacted Sport Canada AAP staff in the past 12 months?"
Respondents selected:
Yes: 30%; 2019: 33%; 2014: 34%; 2009: 22%
No: 66%; 2019: 61%; 2014: 61%; 2009: 76%
No response: 4%; 2019: 5%; 2014: 4%; 2009: 2%
Base: n=857
Q36. Have you contacted Sport Canada AAP staff in the past 12 months?
Base: n=857
Athletes with a SR1 card were more likely to have contacted Sport Canada AAP staff in the last year (38%), as were those with personal coaches (36%).
Satisfaction with AAP
The large majority of athletes who contacted AAP in the previous year were satisfied (88%; 52% extremely satisfied and 34% satisfied) with the overall quality of service they received. The proportion of those who are very satisfied has increased from 43% in 2019 and 39% in 2014, although marginally lower than the 57% who were very satisfied in 2009[11].
Among coaches, 92% were satisfied or very satisfied with the overall quality of service from AAP staff; with 37% being satisfied and 55% very satisfied. Each of the eight CSC representatives contacting AAP also said that they were satisfied or very satisfied. Each CSC representative also felt that they were provided service in the language of their choice, as was also the case among coaches.
Chart 29: Satisfaction of Overall Quality of Service Received
Chart 29: Satisfaction of Overall Quality of Service Received - Text Version
This chart of single bars shows the percentage of results for responses to four statements.
Respondents were asked: "How satisfied were you with the overall quality of service you received?"
Respondents selected:
Not satisfied: 1%
Moderately satisfied: 11%
Satisfied: 34%
Very satisfied: 52%
Base: n=261 (Those who contacted Sport Canada AAP staff)
Q39. How satisfied were you with the overall quality of service you received?
Base: n=261 (Those who contacted Sport Canada AAP staff)
These levels of satisfaction do not vary significantly across most subgroups, although satisfaction is higher among athletes at the SR1 level (95%) and those in Quebec (95%).
H. Athlete Representation
Relationship with National Sport Organization
Athletes were asked about their satisfaction with their NSO athlete representative. Thirty-one percent said that they did not know who their athlete representative is or indicated that the question was not applicable. Of the 69% who are familiar with their athlete representative, 49% said that they are satisfied with the communication they have had with their NSO athlete representative, although 26% are neither satisfied nor dissatisfied, and 18% athletes expressed dissatisfaction with their NSO representative.
Chart 30: Satisfaction with Athlete Representative
Chart 30: Satisfaction with Athlete Representative - Text Version
This chart of single bars shows the percentage of results for responses to three statements.
Respondents were asked: "How satisfied are you that your NSO athlete representative for your sport solicits and shares your concerns with your NSO?"
Respondents selected:
Not satisfied (1-2): 18%
Moderately satisfied (3): 26%
Satisfied (4-5): 49%
Base: n=607 (Excludes those indicating "don't know)
Q32. How satisfied are you that your NSO athlete representative for your sport solicits and shares your concerns with your NSO?
Base: n=607 (Excludes those indicating "don't know)
Satisfaction is higher among younger athletes (under 20) (61%), and least so among those 35 or older (34%).
NCAA athletes (70%) are more apt to be satisfied than other athletes.
The 18% of athletes indicating dissatisfaction were asked what could be improved. Among the 44% providing a response, the primary theme relates to increase or more regular communications, and engagement with or listening to athletes. A few others spoke about attention to qualification criteria and selection process and potential bias, while a few others talked about attention to or increased resources to support athletes from abuses.
Athletes were also asked if they feel that athletes' voices have an impact in decision-making at their NSO, to which 42% agreed, although 39% said they do not feel this is the case and 19% said they do not know. The proportion agreeing is higher among Paralympians (52%). Athletes were also asked if they know where to go to get answers or seek support if they had concerns or required clarifications about sections of their Athlete NSO Agreement. Sixty percent agreed that they are aware of where to get answers or support. This is also highest among Paralympians (73%), followed by athletes with an SR1 card (63%), and those 30 years of age or older (65%).
AthletesCAN
Survey results point to a fairly high level of awareness of AthletesCAN, with 62% of athletes claiming that they know its purpose, which is higher than found in 2019 and 2014 when 51% and 56% of athletes were aware. Twenty-six percent said they are not familiar with this organization.
Chart 31: Awareness of Purpose of AthletesCAN
Chart 31: Awareness of Purpose of AthletesCAN - Text Version
This chart of single bars shows the percentage of results for responses to three statements. Three columns on the side show the percentage of results for 2019, 2014, and 2009.
Respondents were asked: "Do you know what the purpose of AthletesCAN is?"
Q34. Do you know what the purpose of AthletesCAN is?
Base: n=850
Awareness of the purpose of AthletesCAN is higher among paralympic athletes (76%) and those with SR1 (70%), SR2 cards (80%), and athletes in Ontario (69%).
Even among those familiar, 16% of athletes were not able to rate their satisfaction with the representation of AthletesCAN on issues relevant to their sport. Among those aware of its purpose, 52% indicated satisfaction with the organization's representation on issues relevant to their sport. Another 23% rated themselves as moderately satisfied.
Chart 32: Satisfaction with Representation by AthletesCAN
Chart 32: Satisfaction with Representation by AthletesCAN - Text Version
This chart of single bars shows the percentage of results for responses to three statements.
Respondents were asked: "How satisfied are you with the athlete representation that you think AthletesCAN provides on issues relevant to your sport?"
Respondents selected:
Not satisfied (1-2): 7%
Moderately satisfied (3): 23%
Satisfied (4-5): 52%
Don't know: 16%
Base: n=532 (Those aware)
Q35. How satisfied are you with the athlete representation that you think AthletesCAN provides on issues relevant to your sport?
Base: n=532 (Those aware)
Satisfaction is slightly higher among athletes with D cards (59%), but lowest among those with SR1/2 cards (34%). Athletes under 20 (64%) are most likely to be satisfied, while those between the ages of 25 and 29 (46%) are least likely to be.
Satisfaction is also higher in Quebec (64%).
I. Perceptions of Overall Supportiveness of the Canadian Sport System
Athletes were asked about their overall perceptions of the supportiveness of the Canadian sport system. Forty-eight percent rated the system as supportive or very supportive. Another 37% said that it is moderately supportive, although 14% gave it a lower rating. Perception of the supportiveness of the system has decreased from 55% in 2019 and 2014, along with 60% in 2009.
Chart 33: Perceived Supportiveness of Canadian Sport System
Chart 33: Perceived Supportiveness of Canadian Sport System - Text Version
This chart of single bars shows the percentage of results for responses to three statements. Three columns on the side show the percentage of results for 2019, 2014, and 2009.
Respondents were asked: "Thinking about what you need to reach your potential, how supportive would you say the Canadian sport system has been overall?"
Respondents selected:
Low support (1-2): 14%; 2019: 11%; 2014: 11%; 2009: 10%
Moderate support (3-5): 37%; 2019: 33%; 2014: 33%; 2009: 29%
High support (6-7): 48%; 2019: 55%; 2014: 55%; 2009: 60%
Base: n=846
Q47. Thinking about what you need to reach your potential, how supportive would you say the Canadian sport system has been overall?
Base: n=846
Paralympic athletes were more positive, with 57% rating the system as supportive. This is also the case among athletes with an SR1 card (57%). The youngest athletes (under 20) are also most likely to perceive the system as supportive (61%), while those who are 25 to 29 (41%) and 30 to 34 (39%) are least likely to believe this.
Athletes in the Prairies (65%) and Quebec (60%) were also more positive than others across the country. Athletes in British Columbia were least likely to be positive (37%).
Coaches are similarly tepid in their view of the supportiveness of the Canada sport system, with 47% rating it a four or a five and another 36% indicating moderately supportive. This is lower than found in 2019 (57%) and 2009 (59%), but on par with 2014 (49%). Sixteen percent said that the system does a poor job in the area of supporting athletes reach their potential. Similarly, about half of CSC representatives (8 of the 15) rated it as supportive.
Nonetheless, most (84%) carded athletes said that, if faced with the same decision again, they would still choose to become a high-performance athlete. Only 5% disagree and 7% said neither. Again, results are on par with previous years.
Chart 34: Satisfaction with Decision
Chart 34: Satisfaction with Decision - Text Version
This chart of single bars shows the percentage of results for responses to three statements. Three columns on the side show the percentage of results for 2019, 2014, and 2009.
Respondents were asked: "To what extent would you say you agree or disagree with the statement: If faced with the same decision again, I would still choose to become a high-performance athlete?"
Respondents selected:
Disagree (1-3): 5%; 2019: 5%; 2014: 4%; 2009: 3%
Neither (4): 7%; 2019: 6%; 2014: 6%; 2009: 5%
Agree (5-7): 84%; 2019: 82%; 2014: 83%; 2009: 86%
Base: n=846 (Don't know – 2%)
Q48. To what extent would you say you agree or disagree with the statement: If faced with the same decision again, I would still choose to become a high-performance athlete?
Base: n=846 (Don't know – 2%)
Athletes with a C1 card (97%) and those pursuing team sports (88%) are more apt to agree that they would choose again to become a high-performance athlete. Those who are 25 to 29 are somewhat less likely than other athletes to agree (79%).
Perceived Trends in Premature Retirement
The results indicate that premature retirement is a significant concern among coaches. Seventy-three percent of coaches indicated they are aware of high-performance athletes in their sport who have retired before reaching their full potential; on par with 74% in 2019, but higher than the 50% who believed this in 2014 although the question changed from more of a belief to an actual awareness in 2019. Twelve of the 15 CSI representatives also believe that athletes retire prematurely.
These 73% of coaches aware of athletes in their sport retiring too early were asked to identify what they believe to be the primary factors that motivate athletes to leave their sport. As in previous years, the results point to financial issues and outside career goals as the perceived leading causes of premature retirement. Fully eight in ten of these respondents rated the impact of insufficient income as important. Similarly, 63% pointed to full-time career pursuits and 61% noted injury. Conflicts with non-sports career goals were noted by 56%, and 55% indicated education goals (55%). Fewer said family commitments (41%) and their own performance (44%) or reaching their goals (40%) are important. Among those coaches responding to a question about additional reasons for leaving prematurely, the most predominant response was to expand on the lack of financial support, most often emphasizing the need for greater AAP support, and to a lesser degree, support from families, and support from NSOs. A few others spoke of inequities or unfair treatment of some athletes, a lack of respect for athletes and an unhealthy sport environment. A few spoke of failure to progress or meet carding criteria. A few identified mental health challenges for athletes leaving their sport.
According to CSC representatives, athletes often leave for a wide variety of reasons, but place injury (11 of the 15) and insufficient income to support family (10 of the 15) at the top of the list. This is followed by 6 or 7 of the 15 pointing to conflict with coaches, conflict with educational goals, family commitments (6) and dissatisfaction with performance.
Appendices
A. Athlete Questionnaire
Online Introduction
Welcome to the 2022-23 Status of the High Performance Athletes survey! Ekos Research Associates has been commissioned by Sport Canada to conduct a survey of high performance athletes. The purpose of this research is to provide up-to-date information on the needs of Canada's high performance athletes.
The survey will take approximately 20 minutes to complete and your name will be entered into a lottery-style draw for a chance of winning 1 of 6 prizes of $250 of an Amazon or grocery gift card of your choice.
Your participation is voluntary and completely confidential. Any information you provide will be administered in accordance with the Privacy Act and other applicable privacy laws.
If you leave the survey before completing it, you can return to the survey URL later, and you will be returned to the page where you left off. Your answers up to that point in the survey will be saved.
If you have any questions about how to complete the survey, please call Ekos Research Associates at 1-800-388-2873 or send an email to athletes@ekos.com.
Thank you in advance for your participation.
Continue: 1
PQ2
Following is a list of factors that can influence how satisfied you are with your career as a high performance athlete. Using the scale provided, to what extent are you satisfied with the following aspects of your experience in high performance sport?
Q2A
Your level of achievement/performance
Not at all satisfied 1: 1
2: 2
Moderately satisfied 3: 3
4: 4
Extremely satisfied 5: 5
Don't know: 99
Q2C
Enjoyment you get from your sport
Not at all satisfied 1: 1
2: 2
Moderately satisfied 3: 3
4: 4
Extremely satisfied 5: 5
Don't know: 99
Q2E
Confidence in a doping-free Canadian sport environment
Not at all satisfied 1: 1
2: 2
Moderately satisfied 3: 3
4: 4
Extremely satisfied 5: 5
Don't know: 99
Q2G
Treated with respect within your Canadian sport environment
Not at all satisfied 1: 1
2: 2
Moderately satisfied 3: 3
4: 4
Extremely satisfied 5: 5
Don't know: 99
Q2H
Experiencing a harassment/abuse-free Canadian sport environment
Not at all satisfied 1: 1
2: 2
Moderately satisfied 3: 3
4: 4
Extremely satisfied 5: 5
Don't know: 99
Q2I
Experiencing a safe Canadian sport environment
Not at all satisfied 1: 1
2: 2
Moderately satisfied 3: 3
4: 4
Extremely satisfied 5: 5
Don't know: 99
Q2J
Experiencing a fair Canadian sport environment
Not at all satisfied 1: 1
2: 2
Moderately satisfied 3: 3
4: 4
Extremely satisfied 5: 5
Don't know: 99
Q2K
Experiencing a discriminatory free Canadian sport environment
Not at all satisfied 1: 1
2: 2
Moderately satisfied 3: 3
4: 4
Extremely satisfied 5: 5
Don't know: 99
Q2L
In recent years, there has been considerable focus on measures to foster safe and inclusive sport environments for all participants. This is a new section in the survey to help better understand your current experience related to some of the initiatives that have been put in place to support safe sport at the national level and to inform the Government of Canada's work in this area.
Are you aware of the Universal Code of Conduct to Prevent and Address Maltreatment in Sport (UCCMS)?
Yes: 1
No: 2
No response: 99
Q2M
Have you taken safe sport training, including information about the UCCMS, in the last two years?
Yes: 1
No: 2
No response: 99
Q2N
To what extent do you agree or disagree with the statement:
If I were in a situation where I experienced harassment, abuse or discrimination, I would know how to access the services of the independent third-party mechanism affiliated to my National Sport Organization to receive and manage maltreatment complaints.
Strongly disagree 1: 1
2: 2
Neither 3: 3
4: 4
Strongly agree 5: 5
Don't know: 99
Q3
Do you have an annual individual performance plan (IPP) that is tailored to you specifically?
Yes: 1
No: 2
Don't know/No response: 99
Q4
Who is primarily responsible for developing your annual individual performance plan?
National Team Coach: 1
Discipline Coach: 2
Personal Coach: 3
Yourself: 4
Combination of above: 5
Other (please specify): 77
Don't know/No response: 99
Q5
How satisfied are you with the extent of input that you had into the development of your annual individual performance plan?
Not at all satisfied 1: 1
2: 2
Moderately satisfied 3: 3
4: 4
Extremely satisfied 5: 5
Not applicable: 98
Don't know: 99
Q6
How satisfied are you with your annual individual performance plan overall?
Not at all satisfied 1: 1
2: 2
Moderately satisfied 3: 3
4: 4
Extremely satisfied 5: 5
Not applicable: 98
Don't know: 99
Q7
Which of these best describes your sport-specific principal coach?
My coach is employed by my National Sport Organization (NSO) on a full-time basis: 1
My coach is employed or contracted by my NSO on a part-time basis: 2
My coach is my personal coach (i.e. not employed or contracted by my NSO): 3
There is no one person whom I regard as my principal coach: 4
Other (please specify): 77
Don't know/No response: 99
Q8P
The next few questions are referring to this same "principal coach".
Q8
On average, how many hours per week do you have contact with your principal coach during training and competition periods?
Hours per week: 1
Don't know/No response: 99
Q8A
How much do you pay annually, on average for the services provided by principal coach?
Fee per year: 1
Don't know/No response: 99
PQ9
How satisfied are you with the following about your principal coach?
Q9A
Amount of time they spend with you
Not at all satisfied 1: 1
2: 2
Moderately satisfied 3: 3
4: 4
Extremely satisfied 5: 5
Not applicable: 98
Don't know: 99
Q9B
Technical expertise
Not at all satisfied 1: 1
2: 2
Moderately satisfied 3: 3
4: 4
Extremely satisfied 5: 5
Not applicable: 98
Don't know: 99
Q9D
The coach's ability to promote and foster a respectful and healthy environment
Not at all satisfied 1: 1
2: 2
Moderately satisfied 3: 3
4: 4
Extremely satisfied 5: 5
Not applicable: 98
Don't know: 99
Q9C
Overall quality of coaching
Not at all satisfied 1: 1
2: 2
Moderately satisfied 3: 3
4: 4
Extremely satisfied 5: 5
Not applicable: 98
Don't know: 99
Q10
What was the average number of hours per week you devoted to your sport during the training and competitive period in the past year? Please include the time you devoted to training, meetings with coaches and performance scientists, competitions, travel, recovery activities, etc.
Hours per week: 1
Don't know/No response: 99
PQ11
How adequate or inadequate are each of the following to support your Olympic/ Paralympic/World Championship aspiration?
Q11A
The quality of competition experience you are getting
Not at all adequate 1: 1
2: 2
Moderately adequate 3: 3
4: 4
Completely adequate 5: 5
Not applicable: 98
Don't know: 99
Q11C
The quality of training you are getting
Not at all adequate 1: 1
2: 2
Moderately adequate 3: 3
4: 4
Completely adequate 5: 5
Not applicable: 98
Don't know: 99
Q11E
The performance services you are receiving during training
Not at all adequate 1: 1
2: 2
Moderately adequate 3: 3
4: 4
Completely adequate 5: 5
Not applicable: 98
Don't know: 99
Q11F
The performance services you are receiving during competition periods
Not at all adequate 1: 1
2: 2
Moderately adequate 3: 3
4: 4
Completely adequate 5: 5
Not applicable: 98
Don't know: 99
Q11I
The access to support for mental health.
Not at all adequate 1: 1
2: 2
Moderately adequate 3: 3
4: 4
Completely adequate 5: 5
Not applicable: 98
Don't know: 99
Q11G
The physical access you have to high quality training facilities
Not at all adequate 1: 1
2: 2
Moderately adequate 3: 3
4: 4
Completely adequate 5: 5
Not applicable: 98
Don't know: 99
Q11H
Financial support from all sources
Not at all adequate 1: 1
2: 2
Moderately adequate 3: 3
4: 4
Completely adequate 5: 5
Not applicable: 98
Don't know: 99
PQ12
Thinking about the last 12 months, how satisfied or dissatisfied have you been with your access to the following services in the official language of your choice?
Q12A
Coaching services provided by your National Sport Organisation (NSO)
Not at all satisfied 1: 1
2: 2
Moderately satisfied 3: 3
4: 4
Extremely satisfied 5: 5
Not applicable: 98
Don't know: 99
Q12B
General services (including communications) from your National Sport Organisation (NSO)
Not at all satisfied 1: 1
2: 2
Moderately satisfied 3: 3
4: 4
Extremely satisfied 5: 5
Not applicable: 98
Don't know: 99
Q12C
General services (including communications) from your Canadian Sport Institute (CSI)
Not at all satisfied 1: 1
2: 2
Moderately satisfied 3: 3
4: 4
Extremely satisfied 5: 5
Not applicable: 98
Don't know: 99
Q13
Were you able to access all the sport science and sport medicine services you needed over the last 12 months from your Canadian Sport Institute (CSI)?
Yes: 1
No: 2
Don't know/No response: 99
Q14
Are you aware of the types of services that are available from Game Plan at your Canadian Sport Institute (CSI)?
Yes: 1
No: 2
Don't know/No response: 99
Q14B
Have you used any of the Game Plan services?
Yes: 1
No: 2
Don't know/No response: 99
Q14C
How satisfied would you say you are with the Game Plan services you have received?
Not at all satisfied 1: 1
2: 2
Moderately satisfied 3: 3
4: 4
Extremely satisfied 5: 5
Not applicable: 98
Don't know: 99
Q15 [1,9]
Which of the following sport science services would you consider to be important to you in terms of the positive impact that they can have on your performance?
Select all that apply
Biomechanics: 1
Fitness testing: 2
Nutrition: 3
Individual athlete performance analysis [Hover definition=measurement and analysis of an individual athlete's performance over time to determine progression toward specific performance goals in the annual training plan.]: 4
International competition performance analysis [Hover definition=collection of athlete performance in international competition over time to understand: Canadian athlete standing relative to world performance. Establish performance pathways and gold medal profiles over Olympic/Paralympic cycles. Understand ranking of Canadians athletes in the world to establish short and long term performance goals and requisite training and competitive programs.]: 5
Physiology assessment and monitoring: 6
Sport psychology: 7
Skill/technique analysis: 8
Strength and conditioning: 9
None: 98
Don't know: 99
Q16 [1,9]
Thinking about the quality of the sport science services you have received from the CSI over the last 12 months, which ones, if any, would you say are in need of improvement?
Select all that apply
Biomechanics: 1
Fitness testing: 2
Nutrition: 3
Individual athlete performance analysis [Hover definition=measurement and analysis of an individual athlete's performance over time to determine progression toward specific performance goals in the annual training plan.]: 4
International competition performance analysis [Hover definition=collection of athlete performance in international competition over time to understand: Canadian athlete standing relative to world performance. Establish performance pathways and gold medal profiles over Olympic/Paralympic cycles. Understand ranking of Canadians athletes in the world to establish short and long term performance goals and requisite training and competitive programs.]: 5
Physiology assessment and monitoring: 6
Sport psychology: 7
Skill/technique analysis: 8
Strength and conditioning: 9
No improvement necessary: 98
Don't know: 99
Q17 [1,9]
Which of the following sport medicine services would you consider to be important to you in terms of the positive impact that they can have on your performance?
Select all that apply
Chiropractic: 1
Massage: 2
Osteopathy: 3
Physiotherapy: 4
Podiatry: 5
Advice/treatment from a sport doctor (e.g. team doctor, CSI-based doctor): 6
Athletic therapy: 7
Physical health assessments and care: 8
Mental health assessments and care: 9
None: 98
Don't know: 99
Q18 [1,9]
Thinking about the quality of the sport medicine services you have received from the CSI over the last 12 months, which ones, if any, would you say are in need of improvement?
Select all that apply
Chiropractic: 1
Massage: 2
Osteopathy: 3
Physiotherapy: 4
Podiatry: 5
Advice/treatment from a sport doctor (e.g. team doctor, CSI-based doctor): 6
Athletic therapy: 7
Physical health assessments and care: 8
Mental health assessments and care: 9
No improvement necessary: 98
Don't know: 99
PQ19A
The following section will help to profile the current economic situation for carded athletes and the potential need for assistance. Please be assured that all responses will be seen only by the research team at Ekos Research and will be kept completely confidential. No data sent back to Sport Canada will enable the identification of individual athletes.
Q19A
Are you an NCAA supported athlete?
Yes - full scholarship: 1
Yes - partial scholarship: 2
No: 3
Prefer not to say: 99
PQ20
What was the approximate amount you received in 2022 for the following sources:
Please enter numbers without commas and enter zero if no income is received from a specific source on an annual basis.
Q20G
Athlete Assistance Program (AAP)
Gross annual income: 1
Don't know/ No response: 99
Q20F
Employment income (full or part-time)
Gross annual income: 1
Don't know/ No response: 99
Q20A
Provincial/Territorial government athlete assistance
Gross annual income: 1
Don't know/ No response: 99
Q20B
NSO direct support - performance bonus, living and training subsidy etc.
Gross annual income: 1
Don't know/ No response: 99
Q20C
Sport-related income - pro-salary, prize money, sponsorship, endorsements, athletic scholarship etc.
Gross annual income: 1
Don't know/ No response: 99
Q20D
Sport awards - RONA, HBC, Petro Canada, Bell, Investors Group, RBC, VISA, CAN Fund, Fast Canada, COC Athlete Excellence Fund, Fondation de l'athlète d'excellence du Québec (ALEO), Fondation
Nordiques etc.
Gross annual income: 1
Don't know/ No response: 99
Q20E
Other - donations, employment insurance or social assistance, interest or dividends, etc.
Gross annual income: 1
Don't know/ No response: 99
Q21
Please confirm that $[total Q20 income[ was your approximate total gross annual income (before taxes are deducted) for 2022 from all sources?
Yes: 1
No: 2
Don't know/No response: 99
Q22A
Have you incurred any loans to assist you to pursue your athletic career?
Yes: 1
No: 2
Don't know/No response: 99
Q22B [1,5]
Which of the following type of loans do you have currently?
Select all that apply
Government student loans: 1
Loans from parents, spouse, friend: 2
Loans from financial institutions (excluding mortgages): 3
Credit cards: 4
Other (please specify): 77
Don't know/No response: 99
Q23
Approximately how much would you say that you owe in loans where there is an expectation that they will be paid back?
Amount owed: 1
Don't know / No response: 99
PQ24
To what extent do you depend on each of the following sources for financial or material support that you are not required to pay back?
Q24A
Family member(s) (Parents, spouse/partner, sister, friends, etc...)
Not at all 1: 1
2: 2
Moderately 3: 3
4: 4
To a great extent 5: 5
Not applicable: 98
Don't know/ Not applicable: 99
Q24B
Sport Canada AAP
Not at all 1: 1
2: 2
Moderately 3: 3
4: 4
To a great extent 5: 5
Not applicable: 98
Don't know/ Not applicable: 99
Q24C
Provincial/Territorial AAP
Not at all 1: 1
2: 2
Moderately 3: 3
4: 4
To a great extent 5: 5
Not applicable: 98
Don't know/ Not applicable: 99
PQ25
What are the approximate average monthly expenses you incur in each of the following areas?
Please enter numbers without commas and enter zero if no expenses are incurred on a monthly basis.
Q25A
Housing (including mortgage/rent, utilities and all housing related expenses)
Amount: 1
Don't know/ No response: 99
Q25B
Living expenses - food, clothing, transportation, etc.
Amount: 1
Don't know/ No response: 99
Q25C
Sport expenses - equipment, competition entry fees, coaching fees, travel, facility user fees, etc.
(If your sport-related expenses are annual or seasonal, add these together for the year and divide by 12 for a monthly average.)
Amount: 1
Don't know/ No response: 99
Q25D
Other (any other monthly expenses not accounted for above)
Amount: 1
Don't know/ No response: 99
PQ26
Thinking about the last 12 months, how much has money been a barrier to your accessing each of the following:
Q26A
Appropriate nutrition
Not at all 1: 1
2: 2
Moderately 3: 3
4: 4
To a great extent 5: 5
Don't know/ Not applicable: 99
Q26B
Coaching services
Not at all 1: 1
2: 2
Moderately 3: 3
4: 4
To a great extent 5: 5
Don't know/ Not applicable: 99
Q26C
Domestic Competitions
Not at all 1: 1
2: 2
Moderately 3: 3
4: 4
To a great extent 5: 5
Don't know/ Not applicable: 99
Q26D
International Competitions
Not at all 1: 1
2: 2
Moderately 3: 3
4: 4
To a great extent 5: 5
Don't know/ Not applicable: 99
Q26E
Equipment
Not at all 1: 1
2: 2
Moderately 3: 3
4: 4
To a great extent 5: 5
Don't know/ Not applicable: 99
Q26F
Proper housing
Not at all 1: 1
2: 2
Moderately 3: 3
4: 4
To a great extent 5: 5
Don't know/ Not applicable: 99
Q26G
Sport medicine services
Not at all 1: 1
2: 2
Moderately 3: 3
4: 4
To a great extent 5: 5
Don't know/ Not applicable: 99
Q26H
Training facilities
Not at all 1: 1
2: 2
Moderately 3: 3
4: 4
To a great extent 5: 5
Don't know/ Not applicable: 99
Q27
Approximately what level of total gross annual personal income (before taxes are deducted) would be the minimum necessary to support yourself and enable you to train on a full-time basis?
Less than $20,000: 1
$20,000-$29,999: 2
$30,000-$39,999: 3
$40,000-$49,999: 4
$50,000-$59,999: 5
$60,000-$69,999: 6
$70,000-$79,999: 7
$80,000-$99,999: 8
$100,000-$119,999: 9
$120,000 or more: 10
Don't know/No response: 99
PQ29
The following reflect various views on Sport Canada financial support for athletes.
Please indicate the extent to which you agree or disagree with each of the following statements.
Q29A
The AAP has made it possible for me to achieve higher levels of athletic performance
Strongly disagree 1: 1
2: 2
Neither 3: 3
4: 4
Strongly agree 5: 5
Don't know: 99
Q29B
The funding provided to me by the AAP is sufficient to meet my living and training needs
Strongly disagree 1: 1
2: 2
Neither 3: 3
4: 4
Strongly agree 5: 5
Don't know: 99
Q29C
I received AAP funding too late in my career
Strongly disagree 1: 1
2: 2
Neither 3: 3
4: 4
Strongly agree 5: 5
Don't know: 99
Q29D
AAP is assisting or has assisted me in pursuing post-secondary education
Strongly disagree 1: 1
2: 2
Neither 3: 3
4: 4
Strongly agree 5: 5
Don't know: 99
Q32
How satisfied are you that your NSO athlete representative for your sport solicits and shares your concerns within your NSO?
Not at all satisfied 1: 1
2: 2
Moderately satisfied 3: 3
4: 4
Extremely satisfied 5: 5
Not applicable: 98
Don't know: 99
Q32B [1,3]
What could be improved?
Please specify: 77
Don't know/No answer: 99
Q37A
Do you feel that athlete voices have an impact in decision-making at your National Sport Organization (NSO)?
Yes: 1
No: 2
No response: 99
Q37C
If you had concerns or required clarifications about sections of your Athlete-NSO Agreement, do you know where to get answers or seek support?
Yes: 1
No: 2
Don't know/No response: 99
Q34
Do you know the purpose of AthletesCAN?
Yes: 1
No: 2
Don't know/No response: 99
Q35
How satisfied are you with the athlete representation provided by AthletesCAN on issues relevant to your sport?
Not at all satisfied 1: 1
2: 2
Moderately satisfied 3: 3
4: 4
Extremely satisfied 5: 5
Not applicable: 98
Don't know: 99
Q36
The main contact for athletes receiving AAP support is their NSO, however from time to time athletes contact AAP staff for information about the Program or questions regarding the benefits of the Program. The following section is designed to ascertain your satisfaction as an athlete with the service provided by AAP staff.
Have you contacted Sport Canada AAP staff in the past 12 months?
Yes: 1
No: 2
No response: 99
Q37B
Did you feel that you were being served in the language of your choice by the AAP (i.e., English or French)?
Yes: 1
No: 2
No response: 99
Q39
How satisfied were you with the overall quality of service you received?
Not at all satisfied 1: 1
2: 2
Moderately satisfied 3: 3
4: 4
Extremely satisfied 5: 5
Not applicable: 98
Don't know: 99
Q40P
In this final section, you are being asked a series of questions about your background, including your education and family status. This information is being gathered in order to better understand the groups of athletes that have provided specific types of responses and your responses will be kept strictly confidential.
Q40
Are you currently attending school?
Yes - part time: 1
Yes - full time: 2
No: 3
No response: 99
Q42
Do you attend:
High school: 1
College/CEGEP: 2
Vocational school: 3
University: 4
Other (please specify): 77
No response: 99
Q43
What is the highest level of formal education that you have completed?
Primary School: 1
High School: 2
College/CEGEP: 3
University Undergraduate: 4
University Graduate or post graduate: 5
Other (please specify): 77
No response: 99
PQ45
Do you have any dependents? A dependent is a person who you provide material support for (e.g., living expenses, shelter).
Q45A
Number of dependents
Yes, specify number: 1
No: 98
No response: 99
Q47
Thinking about what you need to reach your potential, how supportive would you say the Canadian sport system has been overall?
Not at all supportive 1: 1
2: 2
Moderately supportive 3: 3
4: 4
Very supportive 5: 5
Don't know/ No response: 99
Q48
To what extent would you say you agree or disagree with the statement:
If faced with the same decision again, I would still choose to become a high performance athlete.
Strongly disagree 1: 1
2: 2
Neither 3: 3
4: 4
Strongly agree 5: 5
Don't know: 99
Q49 [1,3]
Finally, do you have any comments on topics not addressed in the questionnaire that you wish to bring to the attention of AAP management?
Yes (please specify): 77
No other comments: 98
Don't know/No response: 99
Thank You
Thank you very much for taking the time to complete this survey.
B. Coach Questionnaire
Online Introduction
Welcome to the survey! Ekos Research Associates has been commissioned by Sport Canada to conduct a survey of coaches and high performance directors of high performance athletes.
The purpose of this research is to provide up-to-date information on the needs of Canada's high performance athletes. This study looks at training, economic, social, education, work, and other areas of athletes' lives, as well as the environment of Canadian high performance sport. This research is aimed at updating information collected regularly since the 1990's up to and including 2019-2020, designed to help develop policies and programs that are responsive to the needs of Canadian athletes and reflect the realities of international sport.
Your participation is voluntary and completely confidential. Any information you provide will be administered in accordance with the Privacy Act and other applicable privacy laws. The survey will take about 15 minutes to complete.
If you leave the survey before completing it, you can return to the survey URL later, and you will be returned to the page where you left off. Your answers up to that point in the survey will be saved.
If you have any questions about how to complete the survey, please call Ekos Research Associates at 1-800-388-2873 or send an email to athletes@ekos.com.
Thank you in advance for your participation.
Continue: 1
Q1
Would you describe your position as:
High Performance Director: 1
National Team Coach: 2
Other (please specify): 77
Q2 [1,6]
Are you employed by a:
National Sport Organization: 1
Provincial Sport Organization: 2
Club: 3
University: 4
Self-employed: 5
Any other sport-related organization or group: 77
No response: 99
Q3
How many nationally carded athletes do you currently coach or work with?
Total: 1
Don't know/No response: 99
Q4
Have you coached/worked with any athletes to Olympic, Paralympic or World Championship medals?
Yes: 1
No: 2
Don't know/No response: 99
Q4B
In which year was the most recent medal won?
Year: 1
Never: 98
Don't know/No response: 99
Q5P
In a number of the questions throughout the questionnaire you will be asked to respond on the basis of all athletes you work with on a regular basis. The purpose of these questions is to ask coaches and High Performance Directors to provide an overall perspective across all of the athletes that you are in contact with.
Q6
How satisfied are you with the extent of input that you have into the development of the training and competition plans of the athletes you work with?
Not at all satisfied 1: 1
2: 2
Moderately satisfied 3: 3
4: 4
Extremely satisfied 5: 5
Don't know: 99
Q7P
How adequate or inadequate are each of the following to support the Olympic/Paralympic/ World Championship aspirations of the athletes you work with?
Q7A
The type of competition experience they are getting
Not at all adequate 1: 1
2: 2
Moderately adequate 3: 3
4: 4
Completely adequate 5: 5
Not applicable: 98
Don't know: 99
Q7C
The quality of training they are getting
Not at all adequate 1: 1
2: 2
Moderately adequate 3: 3
4: 4
Completely adequate 5: 5
Not applicable: 98
Don't know: 99
Q7E
The performance services they are receiving during training
Not at all adequate 1: 1
2: 2
Moderately adequate 3: 3
4: 4
Completely adequate 5: 5
Not applicable: 98
Don't know: 99
Q7H
The performance services they are receiving during competition periods
Not at all adequate 1: 1
2: 2
Moderately adequate 3: 3
4: 4
Completely adequate 5: 5
Not applicable: 98
Don't know: 99
Q7I
The access to support for mental health they are receiving
Not at all adequate 1: 1
2: 2
Moderately adequate 3: 3
4: 4
Completely adequate 5: 5
Not applicable: 98
Don't know: 99
Q7F
The physical access they have to high quality training facilities
Not at all adequate 1: 1
2: 2
Moderately adequate 3: 3
4: 4
Completely adequate 5: 5
Not applicable: 98
Don't know: 99
Q7G
Financial support they have from all sources
Not at all adequate 1: 1
2: 2
Moderately adequate 3: 3
4: 4
Completely adequate 5: 5
Not applicable: 98
Don't know: 99
PQ7B
Following is a list of factors that can influence how satisfied athletes are with their career. Using the scale provided, to what extent are you satisfied with the following aspects of your experience in high performance sport?
Q7BA
Confidence in a doping-free Canadian sport environment
Not at all satisfied 1: 1
2: 2
Moderately satisfied 3: 3
4: 4
Extremely satisfied 5: 5
Not applicable: 98
Don't know: 99
Q7BB
Treated with respect within the Canadian sport environment
Not at all satisfied 1: 1
2: 2
Moderately satisfied 3: 3
4: 4
Extremely satisfied 5: 5
Not applicable: 98
Don't know: 99
Q7BC
Experiencing a harassment/abuse-free Canadian sport environment
Not at all satisfied 1: 1
2: 2
Moderately satisfied 3: 3
4: 4
Extremely satisfied 5: 5
Not applicable: 98
Don't know: 99
Q7BD
Experiencing a safe Canadian sport environment
Not at all satisfied 1: 1
2: 2
Moderately satisfied 3: 3
4: 4
Extremely satisfied 5: 5
Not applicable: 98
Don't know: 99
Q7BE
Experiencing a fair Canadian sport environment
Not at all satisfied 1: 1
2: 2
Moderately satisfied 3: 3
4: 4
Extremely satisfied 5: 5
Not applicable: 98
Don't know: 99
Q7BK
Experiencing a discriminatory free Canadian sport environment
Not at all satisfied 1: 1
2: 2
Moderately satisfied 3: 3
4: 4
Extremely satisfied 5: 5
Not applicable: 98
Don't know: 99
Q7L
In recent years, there has been considerable focus on measures to foster safe and inclusive sport environments for all participants. This is a new section in the survey to help better understand your current experience related to some of the initiatives that have been put in place to support safe sport at the national level and to inform the Government of Canada's work in this area.
Are you aware of the Universal Code of Conduct to Prevent and Address Maltreatment in Sport (UCCMS)?
Yes: 1
No: 2
No response: 99
Q7M
Have you taken safe sport training, including information about the UCCMS, in the last two years?
Yes: 1
No: 2
No response: 99
Q7N
To what extent do you agree or disagree with the statement:
If I were in a situation where I experienced harassment, abuse or discrimination, I would know how to access the services of the independent third-party mechanism affiliated to my National Sport Organization to receive and manage maltreatment complaints.
Strongly disagree 1: 1
2: 2
Neither 3: 3
4: 4
Strongly agree 5: 5
Don't know: 99
Q7O
To what extent do you agree or disagree with the statement:
I have the knowledge and awareness to support our athletes in fostering safer, more inclusive environments free of harassment, abuse or discrimination at the national level.
Strongly disagree 1: 1
2: 2
Neither 3: 3
4: 4
Strongly agree 5: 5
Don't know: 99
Q8
Are you aware of high performance athletes in your sport who have retired prematurely from the national team; that is before they reach their full potential?
Yes: 1
No: 2
Don't know/No response: 99
Q9P
Relatively speaking, how important do you think each of the following reasons are for why high performance athletes in your sport retire prematurely?
Q9A
Dissatisfaction with their own performance
Not at all important 1: 1
2: 2
Moderately important 3: 3
4: 4
Very important 5: 5
Don't know: 99
Q9B
Insufficient income to support family (that is, income from all sources)
Not at all important 1: 1
2: 2
Moderately important 3: 3
4: 4
Very important 5: 5
Don't know: 99
Q9C
Family commitments (i.e., time constraints)
Not at all important 1: 1
2: 2
Moderately important 3: 3
4: 4
Very important 5: 5
Don't know: 99
Q9D
Conflict with non-sport career goals
Not at all important 1: 1
2: 2
Moderately important 3: 3
4: 4
Very important 5: 5
Don't know: 99
Q9E
Conflict with educational goals
Not at all important 1: 1
2: 2
Moderately important 3: 3
4: 4
Very important 5: 5
Don't know: 99
Q9F
Inadequate technical support (e.g., coaches and facilities)
Not at all important 1: 1
2: 2
Moderately important 3: 3
4: 4
Very important 5: 5
Don't know: 99
Q9G
Injury
Not at all important 1: 1
2: 2
Moderately important 3: 3
4: 4
Very important 5: 5
Don't know: 99
Q9H
Conflict with coaches
Not at all important 1: 1
2: 2
Moderately important 3: 3
4: 4
Very important 5: 5
Don't know: 99
Q9I
Reached personal objectives
Not at all important 1: 1
2: 2
Moderately important 3: 3
4: 4
Very important 5: 5
Don't know: 99
Q9J
Unwillingness to relocate
Not at all important 1: 1
2: 2
Moderately important 3: 3
4: 4
Very important 5: 5
Don't know: 99
Q9K
Pursued professional sport opportunities
Not at all important 1: 1
2: 2
Moderately important 3: 3
4: 4
Very important 5: 5
Don't know: 99
Q9L
Pursued a full-time career
Not at all important 1: 1
2: 2
Moderately important 3: 3
4: 4
Very important 5: 5
Don't know: 99
Q9M [1,3]
Is there any other reason why athletes retire prematurely that has not already been covered here?
Response: 77
No other reason: 98
Don't know/No response: 99
Q10P [1,9]
Which of the following sport science services would you consider to be important to you in terms of the positive impact that they can have on the performance of your athlete(s)?
Select all that apply
Biomechanics: 1
Fitness testing: 2
Nutrition: 3
Individual athlete performance analysis [Hover definition=measurement and analysis of an individual athlete's performance over time to determine progression toward specific performance goals in the annual training plan.]: 4
International competition performance analysis [Hover definition=collection of athlete performance in international competition over time to understand: Canadian athlete standing relative to world performance. Establish performance pathways and gold medal profiles over Olympic/Paralympic cycles. Understand ranking of Canadians athletes in the world to establish short and long term performance goals and requisite training and competitive programs.]: 5
Physiology assessment and monitoring: 6
Sport psychology: 7
Skill/technique analysis: 8
Strength and conditioning: 9
None: 98
Don't know: 99
Q11P [1,9]
Thinking about the quality of the sport science services your athlete(s) has/have received from the CSI over the last 12 months, which ones, if any, would you say are in need of improvement?
Select all that apply
Biomechanics: 1
Fitness testing: 2
Nutrition: 3
Individual athlete performance analysis [Hover definition=measurement and analysis of an individual athlete's performance over time to determine progression toward specific performance goals in the annual training plan.]: 4
International competition performance analysis [Hover definition=collection of athlete performance in international competition over time to understand: Canadian athlete standing relative to world performance. Establish performance pathways and gold medal profiles over Olympic/Paralympic cycles. Understand ranking of Canadians athletes in the world to establish short and long term performance goals and requisite training and competitive programs.]: 5
Physiology assessment and monitoring: 6
Sport psychology: 7
Skill/technique analysis: 8
Strength and conditioning: 9
No improvement necessary: 98
Don't know: 99
Q12P [1,9]
Which of the following sport medicine services would you consider to be important to your athlete(s) in terms of the positive impact that they can have on their performance?
Select all that apply
Chiropractic: 1
Massage: 2
Osteopathy: 3
Physiotherapy: 4
Podiatry: 5
Advice/treatment from a sport doctor (e.g. team doctor, CSC-based doctor): 6
Athletic therapy: 7
Physical health assessments and care: 8
Mental health assessments and care: 9
None: 98
Don't know: 99
Q13P [1,9]
Thinking about the quality of the sport medicine services your athlete(s) has/have received from the CSI over the last 12 months, which ones, if any, would you say are in need of improvement?
Select all that apply
Chiropractic: 1
Massage: 2
Osteopathy: 3
Physiotherapy: 4
Podiatry: 5
Advice/treatment from a sport doctor (e.g. team doctor, CSI-based doctor): 6
Athletic therapy: 7
Physical health assessments and care: 8
Mental health assessments and care: 9
No improvement necessary: 98
Don't know: 99
Q14 [1,3]
Given what you have seen from the athlete(s) that you work with, what additional sport science and/or sport medicine services would you like them to receive?
Response: 77
Don't know/No response: 99
Q15P
Thinking about the last 12 months, how much has money been a barrier to your athletes accessing each of the following?
Q15A
Appropriate nutrition
Not at all 1: 1
2: 2
Moderately 3: 3
4: 4
To a great extent 5: 5
Don't know: 99
Q15B
Coaching
Not at all 1: 1
2: 2
Moderately 3: 3
4: 4
To a great extent 5: 5
Don't know: 99
Q15D
Domestic Competitions
Not at all 1: 1
2: 2
Moderately 3: 3
4: 4
To a great extent 5: 5
Don't know: 99
Q15E
International Competitions
Not at all 1: 1
2: 2
Moderately 3: 3
4: 4
To a great extent 5: 5
Don't know: 99
Q15F
Equipment
Not at all 1: 1
2: 2
Moderately 3: 3
4: 4
To a great extent 5: 5
Don't know: 99
Q15G
Proper housing
Not at all 1: 1
2: 2
Moderately 3: 3
4: 4
To a great extent 5: 5
Don't know: 99
Q15H
Sport medicine services
Not at all 1: 1
2: 2
Moderately 3: 3
4: 4
To a great extent 5: 5
Don't know: 99
Q15I
Training facilities
Not at all 1: 1
2: 2
Moderately 3: 3
4: 4
To a great extent 5: 5
Don't know: 99
Q16P
The following reflect various views on Sport Canada financial support for athletes via the Athlete Assistance Program (AAP).
Please indicate the extent to which you agree or disagree with each of the following statements.
Q16A
The AAP has made it possible for athletes to achieve higher levels of athletic performance
Strongly disagree 1: 1
2: 2
Neither 3: 3
4: 4
Strongly agree 5: 5
Don't know: 99
Q16B
The funding provided to athletes by the AAP is sufficient to meet their living and training needs
Strongly disagree 1: 1
2: 2
Neither 3: 3
4: 4
Strongly agree 5: 5
Don't know: 99
Q16C
Athletes receive AAP funding too late in their career
Strongly disagree 1: 1
2: 2
Neither 3: 3
4: 4
Strongly agree 5: 5
Don't know: 99
Q16D
AAP assists athletes to pursue post-secondary education
Strongly disagree 1: 1
2: 2
Neither 3: 3
4: 4
Strongly agree 5: 5
Don't know: 99
Q16E2 [1,3]
Why don't you feel that the AAP assistance is adequate to meet the living and training needs of athletes?
Response: 77
Don't know/No response: 99
Q16F2 [1,3]
Why do you think that athletes receive AAP assistance too late in their career?
Response: 77
Don't know/No response: 99
Q20 [1,3]
Are there additional areas that you believe Sport Canada should consider under the AAP Supplemental Support category for carded athletes?
Yes (please specify): 77
No: 2
Don't know/No response: 99
Q21
The main contact for athletes receiving AAP support is their National Sport Organization (NSO), however from time to time coaches or High Performance Directors contact AAP staff for information about the Program or questions regarding the benefits of the Program. The following questions have been designed to ascertain your satisfaction as a coach or High Performance Director with the service provided by AAP staff.
Have you contacted Sport Canada AAP staff in the past 12 months?
Yes: 1
No: 2
No response: 99
Q22
Did you feel that you were being served in the language of your choice (i.e., English or French)?
Yes: 1
No: 2
No response: 99
Q24
How satisfied were you with the overall quality of service you received?
Not at all satisfied 1: 1
2: 2
Moderately satisfied 3: 3
4: 4
Extremely satisfied 5: 5
Not applicable: 98
Don't know: 99
Q25
Thinking about the needs of the athletes that you work with to reach their potential, how supportive would you say the Canadian sport system has been overall?
Not at all supportive 1: 1
2: 2
Moderately supportive 3: 3
4: 4
Very supportive 5: 5
Don't know/ No response: 99
Q26 [1,3]
Finally, do you have any comments on topics not addressed in the questionnaire that you wish to bring to the attention of AAP management?
Yes (please specify): 77
No other comments: 98
Don't know/No response: 99
Thank You
Thank you very much for taking the time to complete this survey.
C. CSC Presidents' Questionnaire
Online Introduction
Welcome to the survey! Ekos Research Associates has been commissioned by Sport Canada to conduct a survey of CSI Presidents and Athlete Service Managers regarding high performance athletes.
The purpose of this research is to provide up-to-date information on the needs of Canada's high performance athletes. This study looks at training, economic, social, education, work, and other areas of athletes' lives, as well as the environment of Canadian high performance sport. This research is aimed at updating information collected regularly since the 1990's up to and including 2019-2020, designed to help develop policies and programs that are responsive to the needs of Canadian athletes and reflect the realities of international sport.
Your participation is voluntary and completely confidential. Any information you provide will be administered in accordance with the Privacy Act and other applicable privacy laws. The survey will likely take between 10 and 15 minutes to complete.
If you leave the survey before completing it, you can return to the survey URL later, and you will be returned to the page where you left off. Your answers up to that point in the survey will be saved.
If you have any questions about how to complete the survey, please call Ekos Research Associates at 1-800-388-2873 or send an email to athletes@ekos.com.
Thank you in advance for your participation.
Continue: 1
Q1
Are you a CSC/CSI...?
President/CEO: 1
Athlete Services Manager: 2
Q2
How many Sport Canada carded athletes receive services from your Centre or Institute?
Total: 1
Don't know/No response: 99
PQ3
Please rate the level of demand for the sport science services that are offered at your Centre or Institute on a scale where 1 is a very low demand and 5 is a very high demand. Use "Not Applicable" to indicate that a service is not offered at your Institute.
Q3A2
Biomechanics
Very low demand 1: 1
2: 2
Moderate demand 3: 3
4: 4
Very high demand 5: 5
Not applicable: 98
Don't know/ No response: 99
Q3B2
Fitness testing
Very low demand 1: 1
2: 2
Moderate demand 3: 3
4: 4
Very high demand 5: 5
Not applicable: 98
Don't know/ No response: 99
Q3A
Nutrition
Very low demand 1: 1
2: 2
Moderate demand 3: 3
4: 4
Very high demand 5: 5
Not applicable: 98
Don't know/ No response: 99
Q3B
Individual athlete performance analysis [Hover definition=measurement and analysis of an individual athlete's performance over time to determine progression toward specific performance goals in the annual training plan.]
Very low demand 1: 1
2: 2
Moderate demand 3: 3
4: 4
Very high demand 5: 5
Not applicable: 98
Don't know/ No response: 99
Q3C
International competition performance analysis [Hover definition=collection of athlete performance in international competition over time to understand: Canadian athlete standing relative to world performance. Establish performance pathways and gold medal profiles over Olympic/Paralympic cycles. Understand ranking of Canadians athletes in the world to establish short and long term performance goals and requisite training and competitive programs.]
Very low demand 1: 1
2: 2
Moderate demand 3: 3
4: 4
Very high demand 5: 5
Not applicable: 98
Don't know/ No response: 99
Q3D
Physiology assessment and monitoring
Very low demand 1: 1
2: 2
Moderate demand 3: 3
4: 4
Very high demand 5: 5
Not applicable: 98
Don't know/ No response: 99
Q3E
Sport psychology
Very low demand 1: 1
2: 2
Moderate demand 3: 3
4: 4
Very high demand 5: 5
Not applicable: 98
Don't know/ No response: 99
Q3F
Skill/technique analysis
Very low demand 1: 1
2: 2
Moderate demand 3: 3
4: 4
Very high demand 5: 5
Not applicable: 98
Don't know/ No response: 99
Q3G
Strength and conditioning
Very low demand 1: 1
2: 2
Moderate demand 3: 3
4: 4
Very high demand 5: 5
Not applicable: 98
Don't know/ No response: 99
Q3H [0,1]
Other - please specify
Very low demand 1: 1
2: 2
Moderate demand 3: 3
4: 4
Very high demand 5: 5
Not applicable: 98
Don't know/ No response: 99
PQ3I
Please rate the level of demand for the sport medicine services that are offered at your Centre or Institute on a scale where 1 is a very low demand and 5 is a very high demand. Use "Not Applicable" to indicate that a service is not offered at your Institute.
Q3I
Chiropractic
Very low demand 1: 1
2: 2
Moderate demand 3: 3
4: 4
Very high demand 5: 5
Not applicable: 98
Don't know/ No response: 99
Q3J
Massage
Very low demand 1: 1
2: 2
Moderate demand 3: 3
4: 4
Very high demand 5: 5
Not applicable: 98
Don't know/ No response: 99
Q3K
Osteopathy
Very low demand 1: 1
2: 2
Moderate demand 3: 3
4: 4
Very high demand 5: 5
Not applicable: 98
Don't know/ No response: 99
Q3L
Physiotherapy
Very low demand 1: 1
2: 2
Moderate demand 3: 3
4: 4
Very high demand 5: 5
Not applicable: 98
Don't know/ No response: 99
Q3M
Podiatry
Very low demand 1: 1
2: 2
Moderate demand 3: 3
4: 4
Very high demand 5: 5
Not applicable: 98
Don't know/ No response: 99
Q3N
Advice/treatment from a sport doctor
(e.g. team doctor, CSI-based doctor)
Very low demand 1: 1
2: 2
Moderate demand 3: 3
4: 4
Very high demand 5: 5
Not applicable: 98
Don't know/ No response: 99
Q3O
Athletic therapy
Very low demand 1: 1
2: 2
Moderate demand 3: 3
4: 4
Very high demand 5: 5
Not applicable: 98
Don't know/ No response: 99
Q3P2
Physical Health assessments and care
Very low demand 1: 1
2: 2
Moderate demand 3: 3
4: 4
Very high demand 5: 5
Not applicable: 98
Don't know/ No response: 99
Q3Q2
Mental health assessments and care
Very low demand 1: 1
2: 2
Moderate demand 3: 3
4: 4
Very high demand 5: 5
Not applicable: 98
Don't know/ No response: 99
Q3O2 [0,1]
Other - please specify
Very low demand 1: 1
2: 2
Moderate demand 3: 3
4: 4
Very high demand 5: 5
Not applicable: 98
Don't know/ No response: 99
PQ3P
Please rate the level of demand for the following services that are offered at your Centre or Institute on a scale where 1 is a very low demand and 5 is a very high demand. Use "Not Applicable" to indicate that a service is not offered at your Institute.
Q3P
Career planning services
Very low demand 1: 1
2: 2
Moderate demand 3: 3
4: 4
Very high demand 5: 5
Not applicable: 98
Don't know/ No response: 99
Q3Q
Employment assistance
Very low demand 1: 1
2: 2
Moderate demand 3: 3
4: 4
Very high demand 5: 5
Not applicable: 98
Don't know/ No response: 99
Q3R
Accommodation assistance
Very low demand 1: 1
2: 2
Moderate demand 3: 3
4: 4
Very high demand 5: 5
Not applicable: 98
Don't know/ No response: 99
Q3S
Education support services
(e.g., counseling, courses, tuition support)
Very low demand 1: 1
2: 2
Moderate demand 3: 3
4: 4
Very high demand 5: 5
Not applicable: 98
Don't know/ No response: 99
Q3T
Other Game Plan services
Very low demand 1: 1
2: 2
Moderate demand 3: 3
4: 4
Very high demand 5: 5
Not applicable: 98
Don't know/ No response: 99
Q4
CSCs/CSIs/NSOs receive funds to provide sport science/sport medicine services to athletes and targeted sports - Summer and Winter. Do you feel that the additional funds have been beneficial, to athletes and high performance sports in Canada? Please explain why this is?
Yes, please explain: 1
No, please explain: 2
Don't know/No response: 99
Q5
Are there services that your CSC/CSI currently provides to high performance athletes, but which could be enhanced by increasing the availability, nature or quality of the service?
Yes: 1
No: 2
Don't know/No response: 99
Q6 [1,21]
What services could be enhanced?
Select all that apply
Biomechanics: 21
Fitness testing: 22
Nutrition: 1
Individual athlete performance analysis [Hover definition=measurement and analysis of an individual athlete's performance over time to determine progression toward specific performance goals in the annual training plan.]: 2
International competition performance analysis [Hover definition=collection of athlete performance in international competition over time to understand: Canadian athlete standing relative to world performance. Establish performance pathways and gold medal profiles over Olympic/Paralympic cycles. Understand ranking of Canadians athletes in the world to establish short and long term performance goals and requisite training and competitive programs.]: 3
Physiology assessment and monitoring: 4
Sport psychology: 5
Skill/technique analysis: 6
Strength and conditioning: 7
Chiropractic: 8
Massage: 9
Osteopathy: 10
Physiotherapy: 11
Podiatry: 12
Advice/treatment from a sport doctor (e.g. team doctor, CSI-based doctor): 13
Athletic therapy: 14
Physical health assessments and care: 15
Mental health assessments and care: 16
Career planning services: 17
Employment assistance: 18
Accommodation assistance: 19
Education and/or Game Plan support services: 20
Other please list services: 77
Don't know/No response: 99
Q7 [1,5]
What would it take to enhance these services over what is currently offered?
Select all that apply
Funding: 1
Available equipment: 2
Available space: 3
Adequate trained personnel to provide them: 4
Other (please specify): 77
Don't know/No response: 99
Q8
Are there services that you think high-performance athletes need but that are not currently being provided by your CSC/CSI?
Yes: 1
No: 2
Don't know: 99
Q9
What are the top 3 services that are not currently provided for which there is a need?
Please specify: 77
Don't know/No response: 99
Q10 [1,5]
What benefits, if any, would result from these services being offered?
Select all that apply
Fewer injuries: 1
Faster recovery time: 2
Increased number of training days: 3
Decreased stress on athletes: 4
Other (specify): 77
Don't know/No response: 99
Q10B
What evidence is there, if any, that these services would have an impact on athlete performance?
Please specify: 77
Don't know/No response: 99
PQ10B
Following is a list of factors that can influence how satisfied athletes are with their career. Using the scale provided, to what extent are you satisfied with the following aspects of your experience in high performance sport?
Q10BA
Confidence in a doping-free Canadian sport environment
Not at all satisfied 1: 1
2: 2
Moderately satisfied 3: 3
4: 4
Extremely satisfied 5: 5
Not applicable: 98
Don't know: 99
Q10BB
Treated with respect within the Canadian sport environment
Not at all satisfied 1: 1
2: 2
Moderately satisfied 3: 3
4: 4
Extremely satisfied 5: 5
Not applicable: 98
Don't know: 99
Q10BC
Experiencing a harassment/abuse-free Canadian sport environment
Not at all satisfied 1: 1
2: 2
Moderately satisfied 3: 3
4: 4
Extremely satisfied 5: 5
Not applicable: 98
Don't know: 99
Q10BD
Experiencing a safe Canadian sport environment
Not at all satisfied 1: 1
2: 2
Moderately satisfied 3: 3
4: 4
Extremely satisfied 5: 5
Not applicable: 98
Don't know: 99
Q10BE
Experiencing a fair Canadian sport environment
Not at all satisfied 1: 1
2: 2
Moderately satisfied 3: 3
4: 4
Extremely satisfied 5: 5
Not applicable: 98
Don't know: 99
Q10BK
Experiencing a discriminatory free Canadian sport environment
Not at all satisfied 1: 1
2: 2
Moderately satisfied 3: 3
4: 4
Extremely satisfied 5: 5
Not applicable: 98
Don't know: 99
Q10L
In recent years, there has been considerable focus on measures to foster safe and inclusive sport environments for all participants. This is a new section in the survey to help better understand your current experience related to some of the initiatives that have been put in place to support safe sport at the national level and to inform the Government of Canada's work in this area.
Are you aware of the Universal Code of Conduct to Prevent and Address Maltreatment in Sport (UCCMS)?
Yes: 1
No: 2
No response: 99
Q10M
Have you taken safe sport training, including information about the UCCMS, in the last two years?
Yes: 1
No: 2
No response: 99
Q10N
To what extent do you agree or disagree with the statement:
If I were in a situation where I experienced harassment, abuse or discrimination, I would know how to access the services of the independent third-party mechanism affiliated to my CSC/CSI to receive and manage maltreatment complaints.
Strongly disagree 1: 1
2: 2
Neither 3: 3
4: 4
Strongly agree 5: 5
Don't know: 99
Q10O
To what extent do you agree or disagree with the statement:
I have the knowledge and awareness to support our athletes in fostering safer, more inclusive environments free of harassment, abuse or discrimination at the national level.
Strongly disagree 1: 1
2: 2
Neither 3: 3
4: 4
Strongly agree 5: 5
Don't know: 99
Q11
Are you aware of high performance athletes in sport who you feel have retired prematurely from the national team; that is before they reach their full potential?
Yes: 1
No: 2
Don't know/No response: 99
PQ12
Relatively speaking, how important do you think each of the following reasons are for why high performance athletes at your institute retire prematurely?
Q12A
Dissatisfaction with their own performance
Not at all important 1: 1
2: 2
Moderately important 3: 3
4: 4
Very important 5: 5
Don't know: 99
Q12B
Insufficient income to support family (that is, income from all sources)
Not at all important 1: 1
2: 2
Moderately important 3: 3
4: 4
Very important 5: 5
Don't know: 99
Q12C
Family commitments (i.e., time constraints)
Not at all important 1: 1
2: 2
Moderately important 3: 3
4: 4
Very important 5: 5
Don't know: 99
Q12D
Conflict with non-sport career goals
Not at all important 1: 1
2: 2
Moderately important 3: 3
4: 4
Very important 5: 5
Don't know: 99
Q12E
Conflict with educational goals
Not at all important 1: 1
2: 2
Moderately important 3: 3
4: 4
Very important 5: 5
Don't know: 99
Q12F
Inadequate technical support (e.g., coaches and facilities)
Not at all important 1: 1
2: 2
Moderately important 3: 3
4: 4
Very important 5: 5
Don't know: 99
Q12G
Injury
Not at all important 1: 1
2: 2
Moderately important 3: 3
4: 4
Very important 5: 5
Don't know: 99
Q12H
Conflict with coaches
Not at all important 1: 1
2: 2
Moderately important 3: 3
4: 4
Very important 5: 5
Don't know: 99
Q12I
Reached personal objectives
Not at all important 1: 1
2: 2
Moderately important 3: 3
4: 4
Very important 5: 5
Don't know: 99
Q12J
Unwillingness to relocate
Not at all important 1: 1
2: 2
Moderately important 3: 3
4: 4
Very important 5: 5
Don't know: 99
Q12K
Pursued professional sport opportunities
Not at all important 1: 1
2: 2
Moderately important 3: 3
4: 4
Very important 5: 5
Don't know: 99
Q12L
Pursued a full-time career
Not at all important 1: 1
2: 2
Moderately important 3: 3
4: 4
Very important 5: 5
Don't know: 99
Q12M
Is there any other reason why athletes retire prematurely that has not already been covered here?
Please specify: 77
No other reason: 98
Don't know/No response: 99
Q15
Are there additional areas that you believe Sport Canada should consider under the supplemental support category for carded athletes?
Yes (please specify): 77
No: 2
Don't know/No response: 99
PQ16
The main contact for athletes receiving AAP support is their National Sport Organization, however from time to time CSC/CSI staff contact AAP staff for information about the Program or questions regarding the benefits of the Program. The following questions have been designed to ascertain your satisfaction as a CSI President or Athlete Services Manager with the service provided by AAP staff.
Q16
Have you contacted Sport Canada AAP staff in the past 12 months?
Yes: 1
No: 2
No response: 99
Q17
Did you feel that you were being served in the language of your choice (i.e., English or French)?
Yes: 1
No: 2
No response: 99
Q19
How satisfied were you with the overall quality of service you received?
Not at all satisfied 1: 1
2: 2
Moderately satisfied 3: 3
4: 4
Extremely satisfied 5: 5
Not applicable: 98
Don't know: 99
Q20
Thinking about the needs of the athletes that you work with, how supportive would you say the Canadian sport system has been overall?
Not at all supportive 1: 1
2: 2
Moderately supportive 3: 3
4: 4
Very supportive 5: 5
Don't know/ No response: 99
Q21
Finally, do you have any comments on topics not addressed in the questionnaire that you wish to bring to the attention of AAP management?
Yes (please specify): 77
No other comments: 98
Don't know/No response: 99
Thank You
Thank you very much for taking the time to complete this survey.