POR #: POR 044-14
Contract Number: 82082-150018/001/CY
Contract Award Date: February 4, 2015
Report Date: March 31, 2015
Download this report in PDF.
Ce rapport est aussi disponible en français sur demande.
Any material or information provided by the CRTC and all data collected by Harris/Decima will be treated as confidential by Harris/Decima and will be stored securely while on Harris/Decima's premise (adhering to industry standards and applicable laws).
OTTAWA
1800-160 Elgin St.
Ottawa, Ontario, Canada K2P 2P7
Tel: (613) 230-2200 Fax: (613) 230-3793
MONTRÉAL
400-1080 Beaver Hall Hill
Montréal, Québec, Canada H2Z 1S8
Tel: (514) 288-0037 Fax: (514) 288-0138
TORONTO
405-2345 Yonge St.
Toronto, Ontario, Canada M4P 2E5
Tel: (416) 962-2013 Fax: (416) 962-0505
Harris/Decima is pleased to present this report to the Canadian Radio-Television and Telecommunications Commission (CRTC) highlighting the findings from the second annual “Wireless Code” research study.
The Commission established the Wireless Code, a mandatory code of conduct for wireless service providers, in The Wireless Code, Telecom Regulatory Policy CRTC 2013-271, June 3, 2013 (the Wireless Code Decision). The Wireless Code applies to all retail mobile wireless voice and data services (wireless services) provided to individual and small business consumers in Canada.
In the Wireless Code Decision, the Commission indicated that it will develop an evaluation plan to evaluate the effectiveness of the Wireless Code; the results of this evaluation will form part of a formal review of the Wireless Code following its implementation; and it intends to initiate a formal review of the Wireless Code within three years of its implementation.
To ensure the effectiveness of the formal review, the Commission needed reliable data on how consumers’ understanding of their wireless service contracts and related rights is changing between the implementation of the Wireless Code and the formal review. The review of the Wireless Code over time assesses whether it is meeting its objective: empowering consumers to make informed decisions about wireless services.
In order to measure this, telephone surveys were conducted with Canadian cell phone users in each of the last two years. The sample included both landline interviews and cell phone interviews. We aimed to complete at least 35% of the interviews by calling cell phone numbers in order to ensure that those people who primarily use their cell-phone (or live in a cell phone only household) were included in the sample pool. The final 2015 sample of 1,005 Canadian adults is made up of 35% cell phone interviews and 65% landline interviews.
To properly track this data over time and be able to compare trends, the same approach and questions were used as for the Wireless Code research study conducted in 2014, with three additional questions this year.
Surveys were conducted between February 23rd and March 11th, 2015 (in English and French) and took an average of 9 minutes to complete. The sample was a probability sample and as such can be extrapolated to the Canadian population with a margin of error of +/-3.1%, 19 times out of 20.
The key findings based on the survey results are presented below.
Research Firm: Harris/Decima Inc.
Contract Number: 82082-150018/001/CY
Contract Award Date: February 4, 2015
Contract Value: $49,892.99 (Incl. HST)
I hereby certify as Senior Officer of Harris/Decima Inc that the deliverables fully comply with the Government of Canada political neutrality requirements outlined in the Communications Policy of the Government of Canada and Procedures for Planning and Contracting Public Opinion Research. Specifically, the deliverables do not include information on electoral voting intentions, political party preferences, standings with the electorate or ratings of the performance of apolitical party or its leaders.

Danielle Armengaud, Research Director
Harris/Decima Inc.
Harris/Decima is pleased to present this report to the Canadian Radio-Television and Telecommunications Commission (CRTC) highlighting the findings from the second annual “Wireless Code” research study.
The Commission established the Wireless Code on June 3, 2013 (the Wireless Code Decision). It establishes new requirements for wireless service providers (service providers) that ensure that consumers are empowered to make informed decisions about wireless services, and contribute to a more dynamic marketplace by making it easier for consumers to take advantage of competitive offers.
The Wireless Code came into effect on December 2, 2013 and applies to all new contracts signed as of that date, and all existing contracts that are amended, renewed, or extended on or after that date. The Wireless Code will apply to all wireless contracts as of June 3, 2015.
In the Wireless Code Decision, the Commission indicated that it will develop an evaluation plan to evaluate the effectiveness of the Wireless Code; the results of this evaluation will form part of a formal review of the Wireless Code following its implementation; and it intends to initiate a formal review of the Wireless Code within three years of its implementation.
To ensure the effectiveness of the formal review, the Commission needed reliable data on how consumers’ understanding of their wireless service contracts and related rights is changing between the implementation of the Wireless Code and the formal review.
More specifically, the objectives of this research were:
Tracking this data over time will allow the CRTC to compare trends and see how public opinion evolves over this time period. In order to be able to make direct comparisons, the same approach was used as for the Wireless Code research study conducted in 2014. For the most part, the questionnaire remained unchanged.
Telephone surveys were conducted with Canadian cell phone users in each of the last two years. The sample included both landline interviews and cell phone interviews in order to ensure that those people who primarily use their cell-phone (or live in a cell phone only household) were included in the sample pool. The final 2015 sample of 1,005 Canadian adults is made up of 35% cell phone interviews and 65% landline interviews.
The results will help inform the actions the Commission should take to ensure that Canadians have the tools they need to understand their wireless service contracts and related rights.
The 2015 surveys were conducted between February 23rd and March 11th, 2015 (in English and French) and took an average of 9 minutes to complete. The sample was a probability sample and as such can be extrapolated to the Canadian population with a margin of error of +/-3.1%, 19 times out of 20.
The 2014 research aimed to gather a representative sample, included people who only had a landline, so that opinions about the CRTC could be measured and compared to older research. The 2015 research did not have this requirement, so where applicable throughout the report, comparisons are made only to the n=1,016 cell phone owners from last year’s survey (n=1,289 people were interviewed in total between February 5 and March 4, 2014).
The detailed findings from this research are presented in subsequent chapters of this report. Appended to this report are the survey instruments (English and French) and detailed tabular tables (presented under separate cover).
Danielle Armengaud, Research Director
Harris/Decima Inc.
The numbers presented throughout this report are rounded. In some cases due to this, it may appear that ratings collapsed together are different by a percentage point from when they are presented individually and totals may not add up to 100%.
Differences that are statistically significant are highlighted in this report. These findings are denoted by a ○ circle for the significantly different subgroups within the 2015 results. Findings which are significantly different when compared to the 2014 results are denoted by a □ square.
Generally speaking, cell owners are more likely to have an individual plan than a family plan, are much more likely to be on a postpaid plan than a prepaid one, most commonly have all three services (voice/text/data) and are unlikely to be on an employee plan. Respondents were more likely to have a family plan than a prepaid plan.
| Plan Type | % Yes |
|---|---|
| Individual Plan | 73% |
| Family Plan | 25% |
| Other | 2% |
| Postpaid/Monthly | 85% |
| Prepaid/Pay-As-You-Go | 13% |
| % With Calling | 87% |
| % With Text | 90% |
| % With Data | 70% |
| % With Employee Plans | 5% |
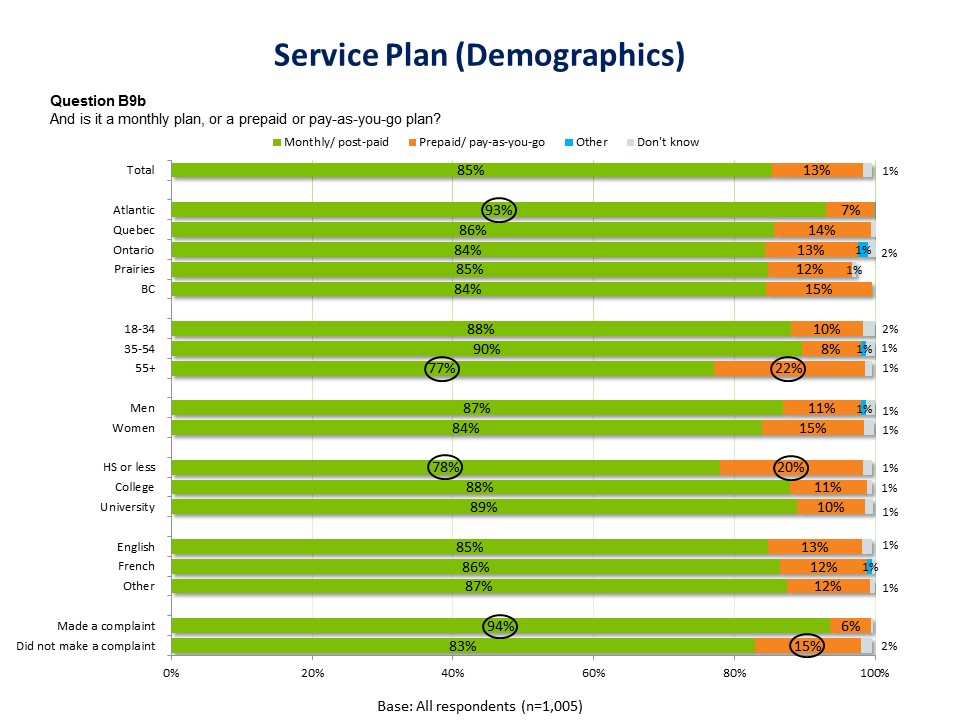
More Canadian cell phone owners have a monthly/post-paid plan than a prepaid/pay-as-you-go plan; older Canadians are most likely to have a prepaid plan.
Four in five Canadians (85%) have a monthly plan, while 13% have a pre-paid plan, and 1% are unsure. Nationally, monthly plans are more likely than prepaid plans; the Atlantic provinces (93%) are significantly more likely to have a monthly plan. Older Canadians (55+) are significantly more likely to have prepaid plans (22%) than those 18 to 34 or 35 to 54 (10% and 8% respectively).
Respondents with a high school education or less are significantly more likely to have a prepaid plan (20%) than those with a college (11%) or a university education (10%).
Those who did not make complaints were significantly more likely (15%) than those who did complain to have a prepaid plan (6%). Of those who made a complaint, greater than nine out of ten (94%) reported having a monthly plan, compared to those who did not make a complaint (83%).
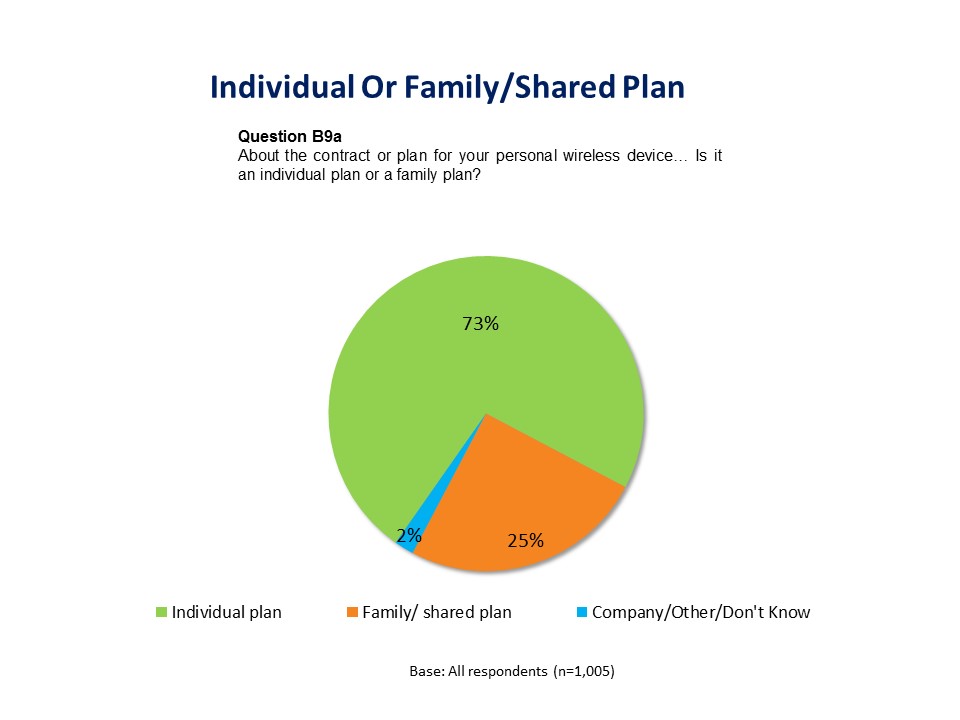
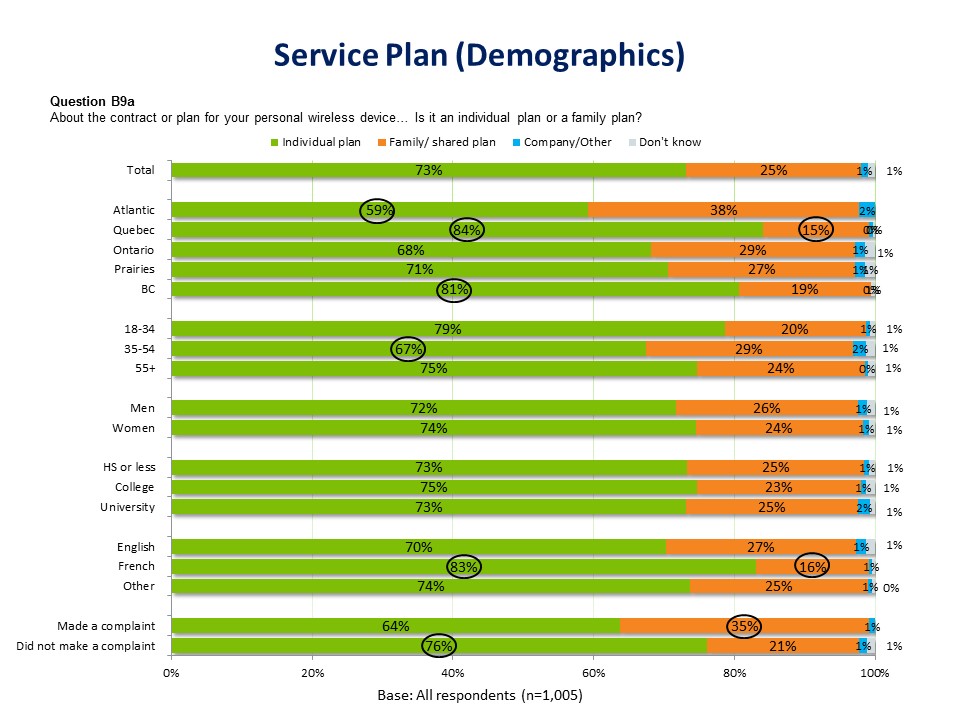
Three in four Canadians have an individual plan for their personal wireless device.
Three quarters of Canadian cell owners have an individual plan for their personal wireless device (73%), while 25% have a family or shared plan, and 2% have a company/corporate plan or are unsure. Given that shared/family plans are a relatively recent addition, there is reason to believe that this proportion represents a growing segment of cell phone users.
Regionally, Quebec (84%) and BC (81%) are significantly more likely to have individual plans while Atlantic Canadians are the most likely to have family/shared plans (38%).
Canadians 35-54 years of age are the most likely to have a shared plan (29%) than both older (55+) and younger (18-34) Canadians (24% and 20% respectively). Francophones are significantly more likely to have an individual plan (83%), compared to allophones (74%) and Anglophones (70%).
Among those who did not make a complaint, three in four (76%) have an individual plan, significantly higher than those who did make a complaint (64%). Likewise, of those who made a complaint, more than one in three (35%) have a family or shared plan, significantly higher than those who did not (21%).
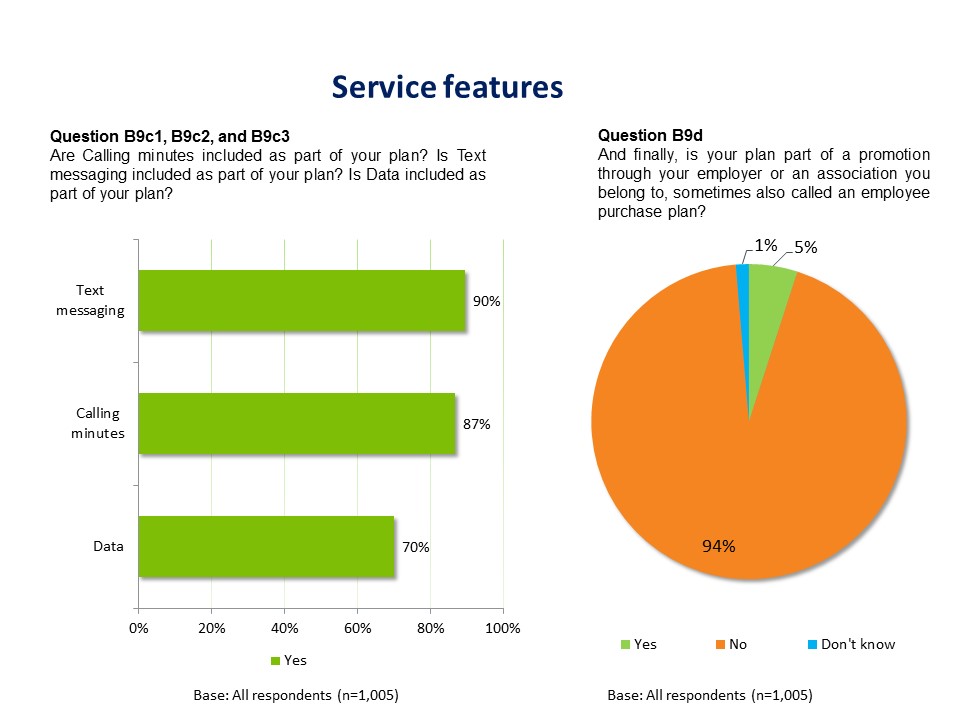
Text messaging and calling minutes are the features most likely to be included in the plans of most users.
Nine in ten cell owners (90%) say they have text messaging included as part of their plan, while 87% have calling minutes included, and 70% have data included.
Most plans are not part of a promotion through an employer or association (94%), compared to 5% who say their plan is, and 1% who are unsure.
Perhaps unsurprisingly, there is a large difference between those who are on a monthly plan and those who are pre-paid with regard to the service features which are part of their plan. In each case, a significantly higher proportion of monthly subscribers have each service feature but the difference is the most striking when looking at data services where monthly subscribers are more than twice as likely to have this service.
| Mobile Service | Monthly | Prepaid | |
|---|---|---|---|
| % With This Service | Text Messaging | 93% | 67% |
| Calling Minutes | 89% | 73% | |
| Data | 76% | 33% |
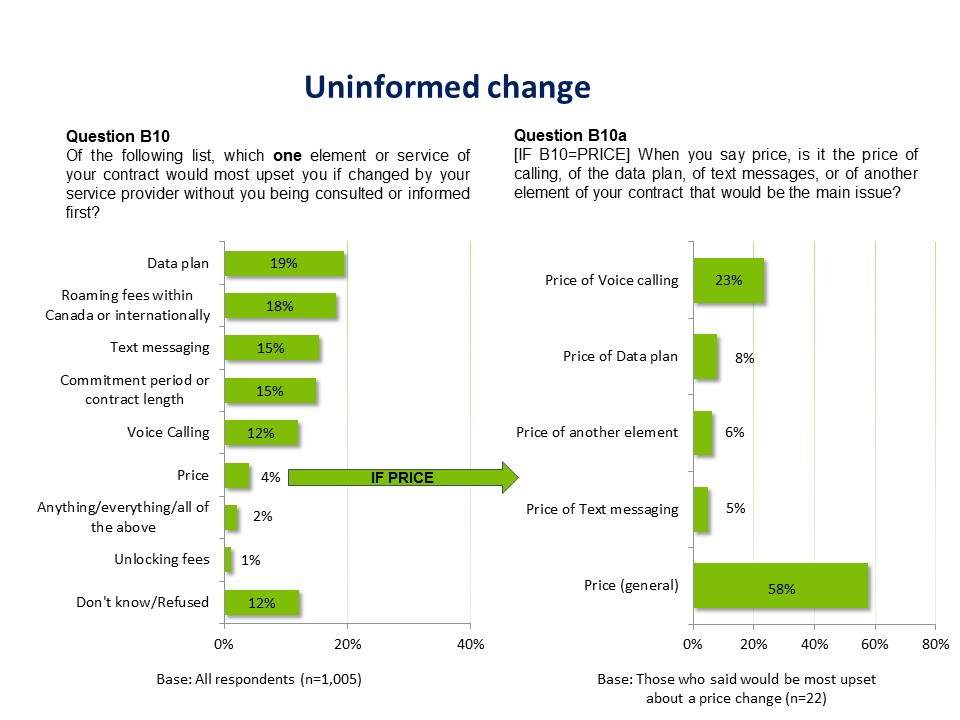
Uninformed changes to data plans and roaming fees would most upset cell phone users.
When asked which element or service would upset them the most if changed, by their service provider, first mentions include data plan and roaming fees (19% and 18% respectively). Other services mentioned include text messaging or contract length (15%), voice calling (12%), price (4%) and unlocking fees (1%). Two percent say all of the above and 12% are unsure.
Of those who would be most upset about price change, more than half (58%) say that the main issue is the price of their service in general. Around a quarter said that they were referring to the voice calling (23%) while fewer mentioned the price of their data plan (8%), text messaging (5%) or other elements (6%).
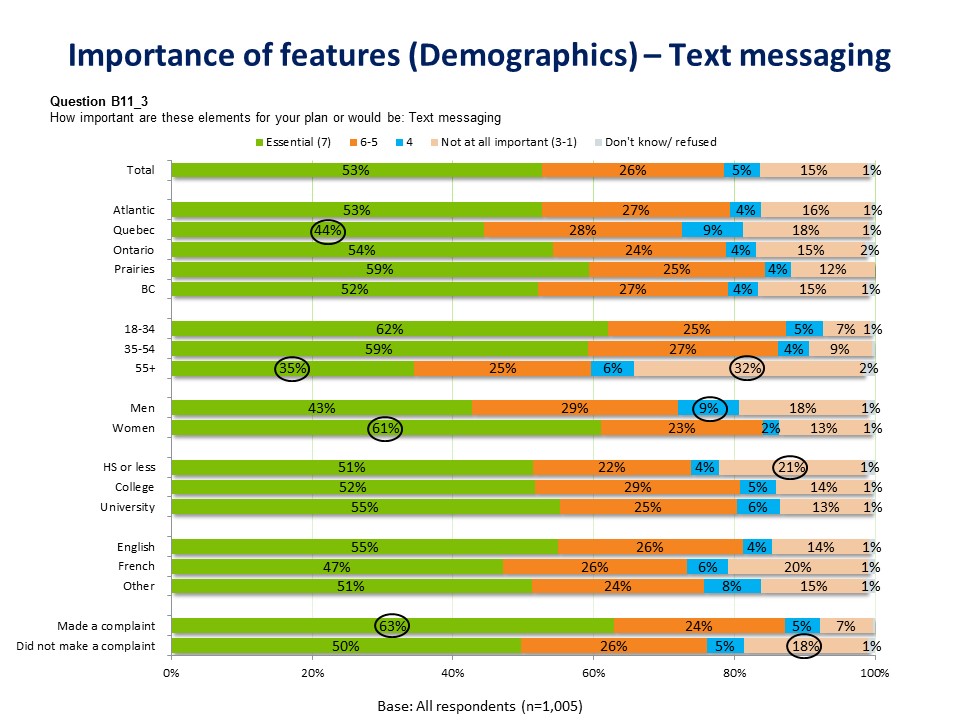
Half of Canadian cell phone owners say text messaging and calling minutes are essential when considering a plan.
| Service | % Saying ‘Essential’ | % Saying ‘Unimportant’ |
|---|---|---|
| Text Messaging | 53% | 15% |
| Calling Minutes | 50% | 9% |
| Data | 40% | 27% |
A majority of respondents (53%) say text messaging is essential when considering a plan. Regionally, text messaging is significantly less important in Quebec (44%). Older Canadians (55+) are less likely to say text messaging is essential (35%) compared to those aged 35-54 (59%) and 18-34 (62%). In fact, 32% of the older cohort said text messaging is not at all important.
Women (61%) are significantly more likely than men (43%) to say text messaging is essential. Those who made a complaint are significantly more likely to say that text messaging is essential with almost two in three (63%) giving it the highest mark on a 7-point scale.
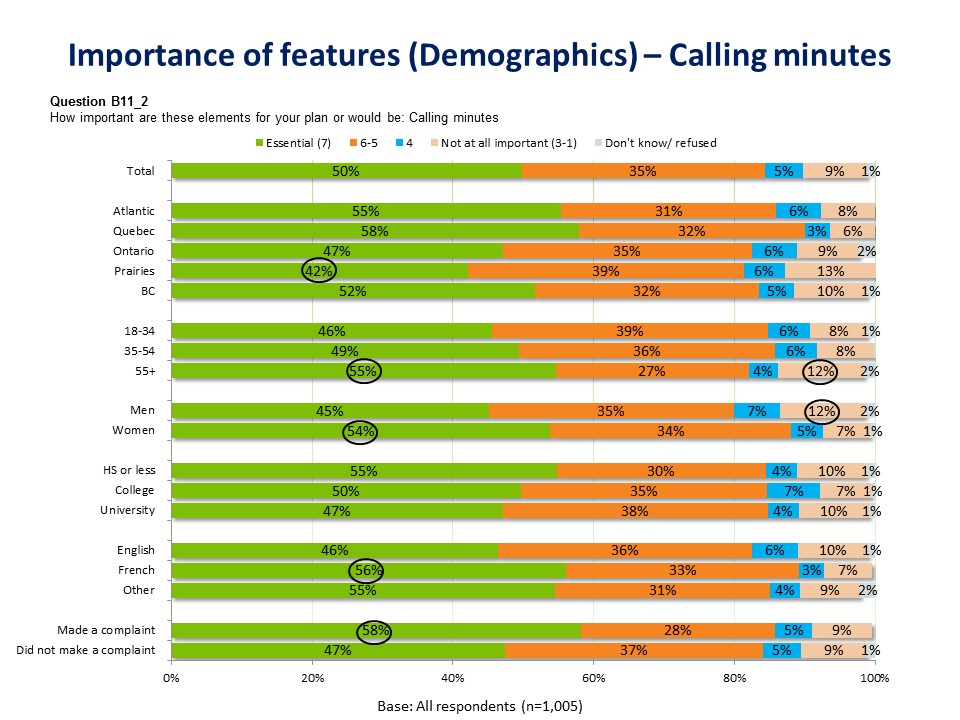
Half of cell owners (50%) say calling minutes are essential when considering a plan. Regionally, calling minutes are significantly less likely to be deemed essential in the Prairies (42%). Women (54%) are significantly more likely than men (45%) to say calling minutes are essential.
Francophones are more likely to view calling minutes as essential than Anglophones (56% vs. 46%). Those who made a complaint are more likely to say that calling minutes are essential: three in five (58%) gave it the highest mark on a 7-point scale, significantly higher than those who did not make a complaint (47%).
Looking at it the other way around, those who feel that each of the individual service types are essential are more likely to have made a complaint in the last 12 months than average.
| Data Essential | Calling Minutes Essential | Text Messaging Essential | Overall | |
|---|---|---|---|---|
| % Who Made A Complaint | 33% | 27% | 27% | 23% |
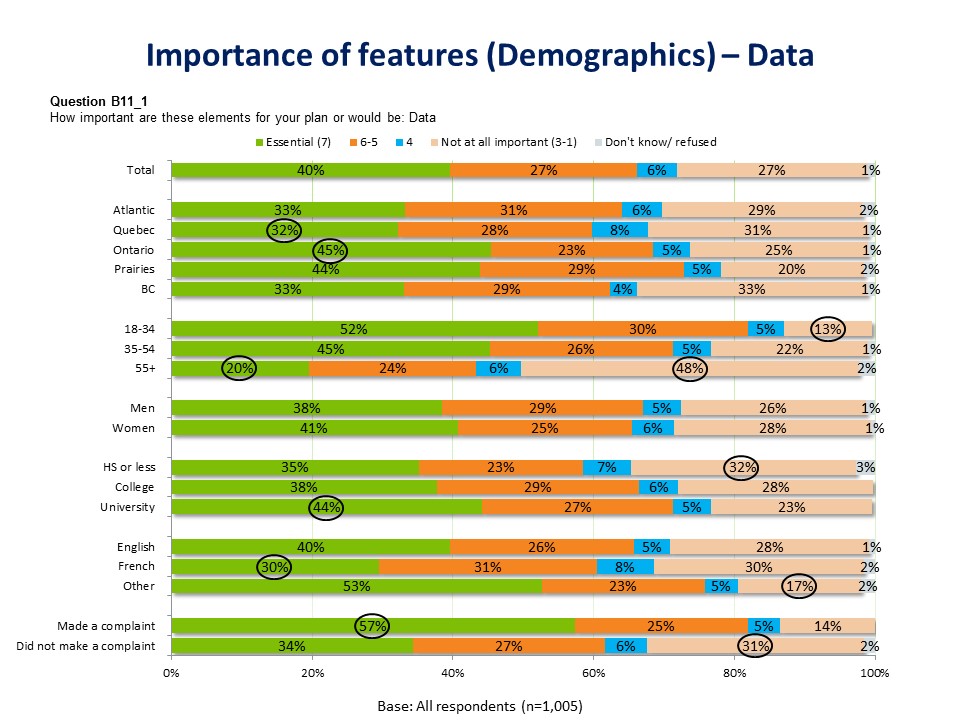
Two in five cell owners (40%) say data is essential when considering a plan. Regionally, data is significantly more likely to be seen as important in Ontario (45%) than in Quebec (32%). Older Canadians (55+) are the least likely to say data is essential (20%) compared to those aged 35-54 (45%) and 18-34 (52%). Similarly, Francohphones (30%) are less likely to say data is essential when considering a plan, compared to Anglophones (40%) and allophones (53%).
Those with a university education are significantly more likely (44%) to say data is essential when considering a plan then those with a high school education or less (35%).
Those who made a complaint are more likely to say that data is essential: three in five (57%) rated it as essential, significantly higher than those who did not make a complaint (34%).
There is not a great deal of variability in the type of service plans that people have with the large majority having a postpaid, individual plan with at least voice and text. Canadians who are 55+ or are less educated are more likely to have a prepaid plan and those people in the middle age group (35-54) are the most likely to have a family, and therefore a family mobile plan. Shared plans are more common in Quebec and among Francophones.
Regarding the services that people have on their plan, and how essential those services are considered to be, age is a very important factor. There is a fairly clear distinction between how people in each of the three age groups view the cell services available in terms of usage and importance. Generally speaking, Canadians over 55+ are far less likely to have text services and to value them as highly, while those under 55 report being more likely to be upset with a change to the data portion of their plan and to say that data is an essential part of a plan for them.
| Mobile Service | 18-35 | 35-54 | 55+ | |
|---|---|---|---|---|
| % With This Service | Text Messaging | 95% | 93% | 79% |
| Calling Minutes | 85% | 91% | 85% | |
| Data | 83% | 74% | 51% | |
| Change To Service | % Upset By Change To Data | 30% | 22% | 5% |
| % Essential For Plan | Text Messaging | 62% | 59% | 35% |
| Calling Minutes | 46% | 49% | 55% | |
| Data | 52% | 45% | 20% |
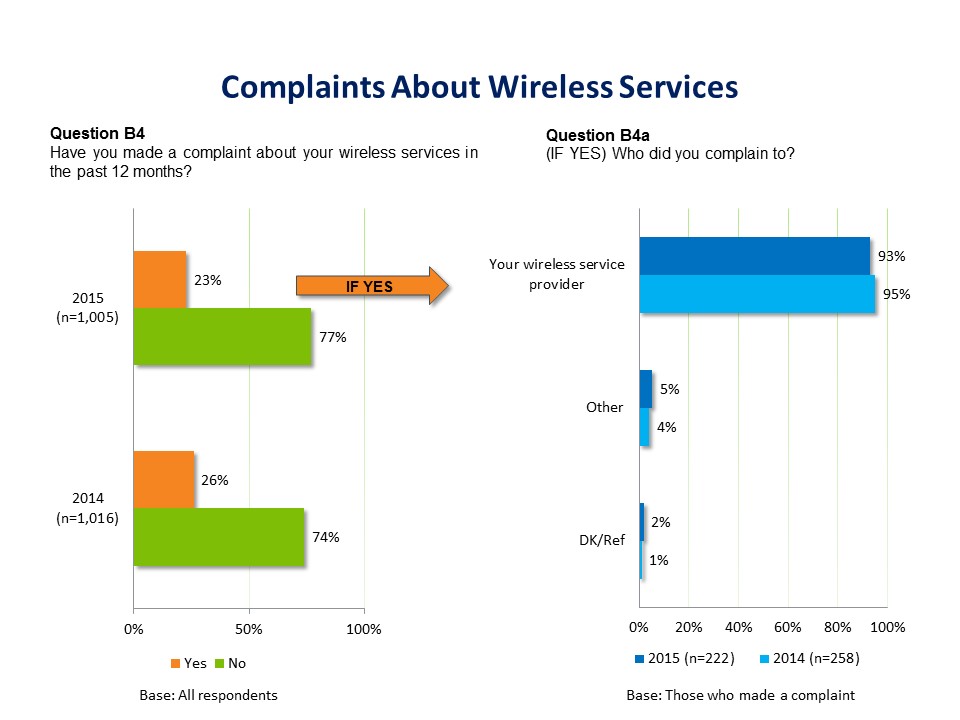
Almost a quarter of Canadian cell phone owners have made a complaint about their wireless service in the past year. For most wireless customers, this meant calling their service provider.
Complaints about wireless services as well as direction of complaints were similar in 2014 and 2015. When asked whether they made a complaint about their services in the past 12 months, 23% say they had, compared to 26% in 2014. Of those, 93% had done so by complaining to their wireless service provider, largely unchanged from last year. Small numbers complained somewhere else (5%) or were unsure (2%).
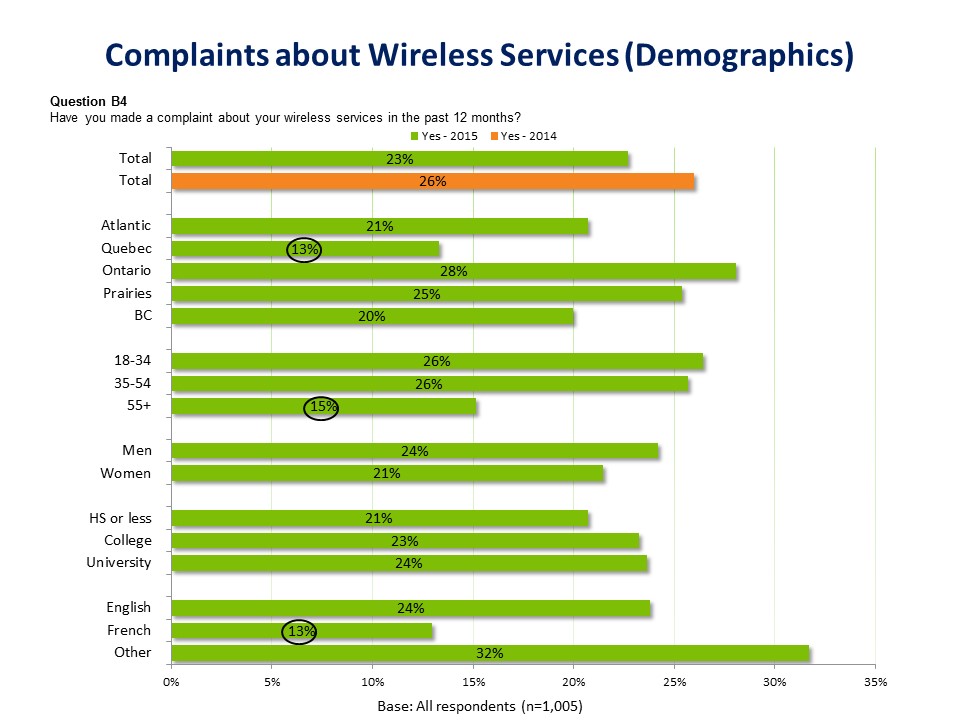
Although largely unchanged from 2014, some regional and demographic differences are seen for the number of complaints:
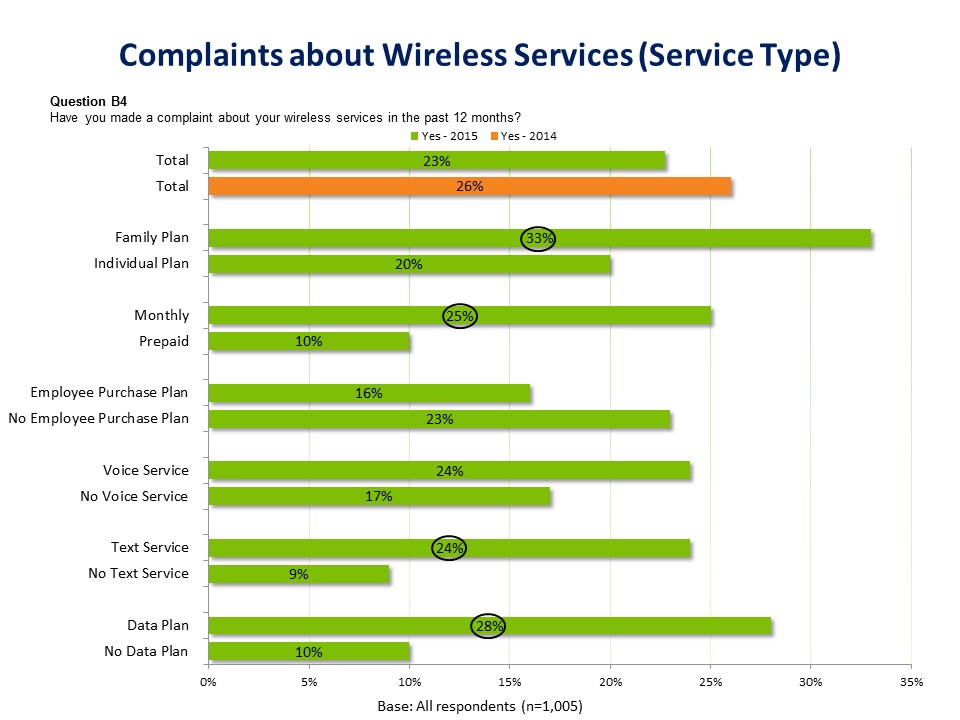
Those who have a family plan are more likely to have complained in the past 12 months than those who have an individual plan. Similarly, those on a monthly plan are significantly more likely to have complained than those on a prepaid plan (this could be due to there being fewer contractual obligations and the relative ease with which the relationship could be ended compared to those with a monthly contract). Those with text and data services were also more likely to have complained than those who do not have those services.
As mentioned, those who have made a complaint are significantly more likely to have text and data services as part of their plan and are also significantly more likely to say that each of the three services features are essential to their plan.
| Mobile Service | Made a Complaint | Did not Make a Complaint | |
|---|---|---|---|
| % With This Service | Text Messaging | 95% | 88% |
| Calling Minutes | 90% | 86% | |
| Data | 86% | 66% | |
| % Essential For Plan | Text Messaging | 63% | 50% |
| Calling Minutes | 58% | 47% | |
| Data | 57% | 34% |
This implies that those who have had any sort of dispute with their provider are more likely to view their plan and provider with a more skeptical eye in general.
When asked which element changing would upset them the most, there were no striking differences except that those who had made a complaint were generally more concerned about data services and less about text and voice services than those who did not.
| Mobile Service | Made a Complaint | Did Not Make a Complaint | |
|---|---|---|---|
| % Upset By Change To This Element | Data plan | 25% | 18% |
| Roaming fees within Canada/Intl | 18% | 18% | |
| Text messaging | 11% | 17% | |
| Commitment Period/Contract Length | 18% | 14% | |
| Voice Calling | 8% | 13% | |
| Price | 4% | 4% | |
| Don't know/Refused | 10% | 13% |
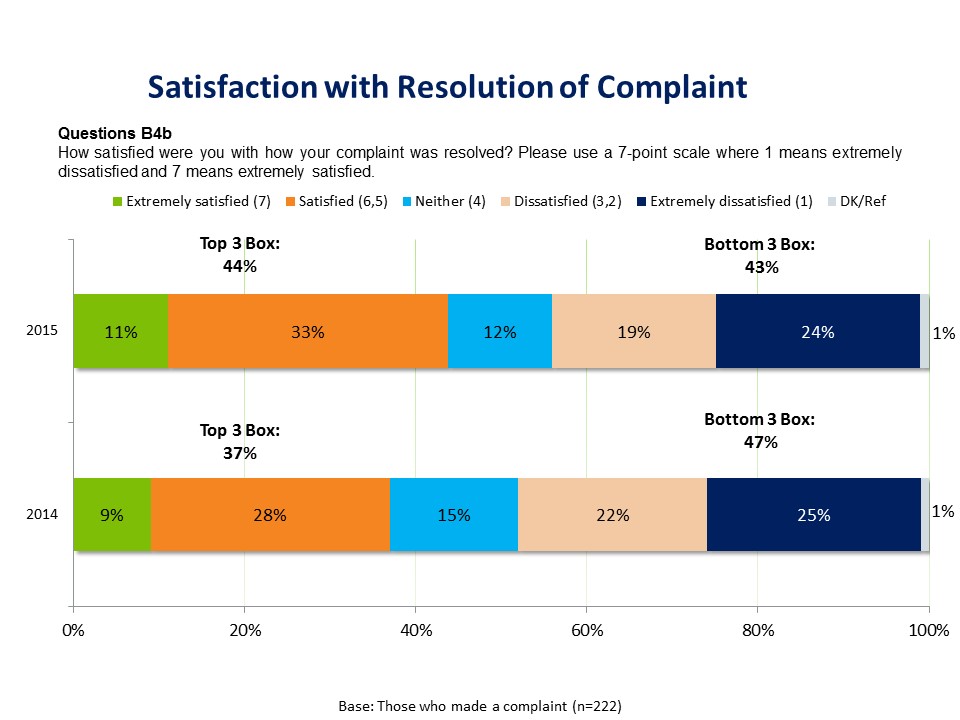
Although complaints were not always resolved, satisfaction with the resolution of complaints has grown slightly (but not significantly) since 2014.
Customers who made a complaint about their wireless services were about as likely to be satisfied with how their complaint was resolved (44%) as to be dissatisfied (43%).Almost half of those who complained (43%) feel dissatisfied with how their complaint was resolved (giving a score of 1, 2 or 3 on a 7-point scale), with one quarter (24%) saying they were extremely dissatisfied. On the other hand, one in ten (11%) were extremely satisfied with the outcome and another 33% were somewhat satisfied. Although this is an improvement over last year, the difference between 2014 and 2015 is not significant.
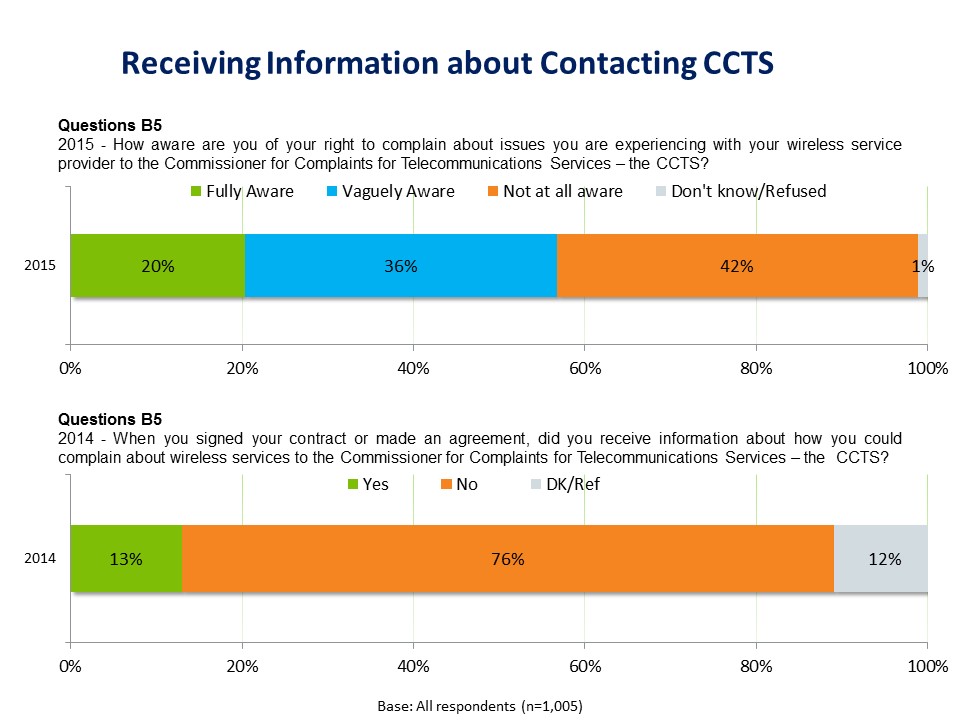
More than half of Canadian cell phone owners are aware of their right to complain about wireless service provider issues to the Commissioner for Complaints for Telecommunications Services (CCTS).
While two in ten (20%) say they are fully aware, 36% are vaguely aware and slightly less than half (42%) are not at all aware. This question was asked differently in 2015 than it was in 2014 where respondents were only asked if they received information about how they could complain about wireless services to the CCTS when they signed their contract. As a result, it is not possible to compare the 2014 and 2015 responses in a direct way.
In 2014, 76% did not recall receiving information about how to make a complaint when they signed their contract, while only 13% did, and 12% were unsure.
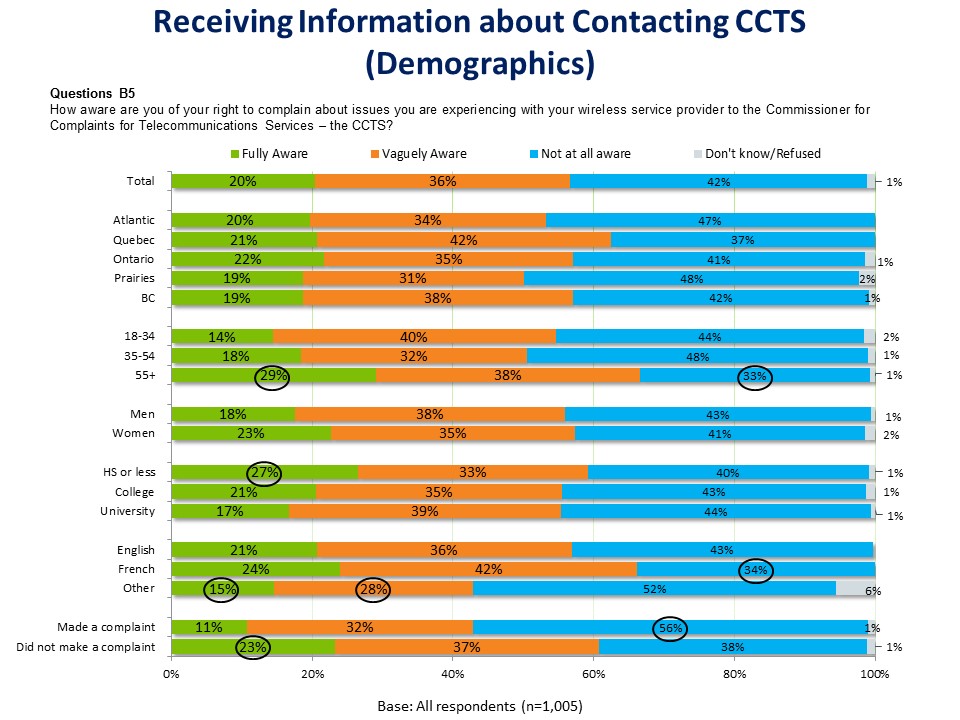
Those with the highest levels of awareness are generally those with less education (27% saying yes among those with high school or less, significantly higher than the 21% of college educated and 17% of university educated cell phone owners). Around a third of older Canadians (29% of those 55+) have significantly higher levels of awareness, compared to those 35-54 (18%) and 18-34 (14%). Those whose mother tongue is something other than English or French (15%) were the significantly less likely to be aware of the CCTS compared to those whose native language is English (21%) or French (24%).
Although virtually everyone who complained did so with their wireless provider, and not the CCTS, it is important to note that a customer must complain first to their provider and not be satisfied with the result before they can submit their case to the CCTS. Among the people who did complain, though, it is worth noting that more than half (56%) say they were not at all aware about their right to complain about wireless service provider issues to the CCTS (compared to 38% among those who did not make a complaint).
Although the sample sizes are fairly small, the more aware people are of the right to complain to CCTS, the more satisfied they are with how their complaint was resolved (if they had made one).
| Satisfaction with complaint resolution | Fully Aware | Vaguely Aware | Not at all aware |
|---|---|---|---|
| Extremely Satisfied (7) | 17% | 14% | 7% |
| Satisfied (6, 5) | 47% | 37% | 28% |
| Neither (4) | 10% | 20% | 9% |
| Dissatisfied (2,3) | 16% | 9% | 25% |
| Extremely dissatisfied (1) | 10% | 18% | 31% |
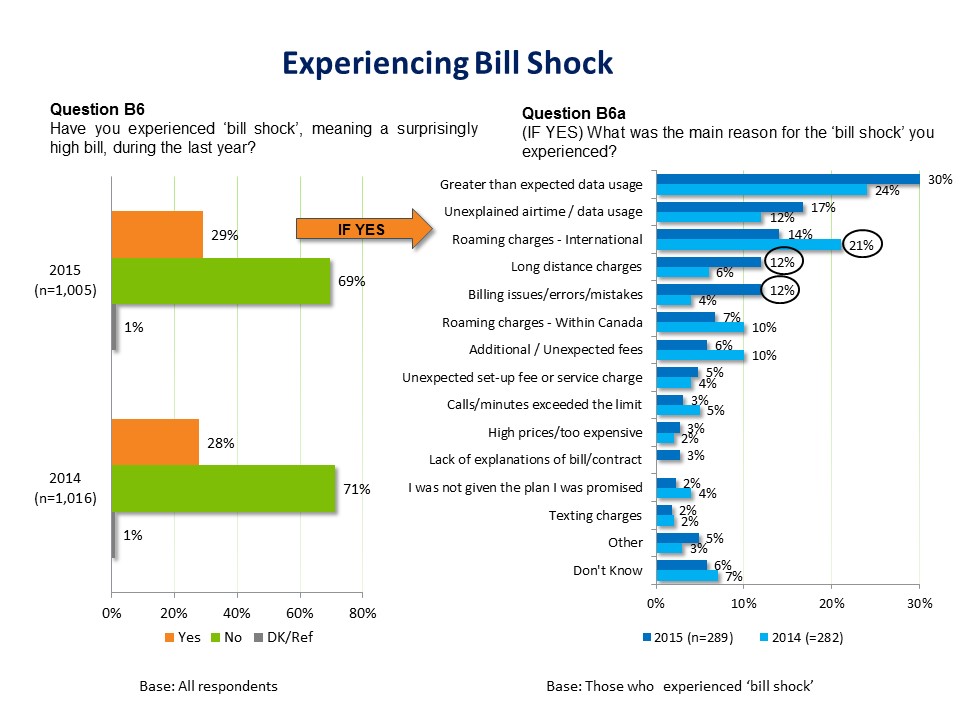
A sizeable number of cell phone owners have experienced some form of bill shock in the past year, related to everything from high data usage to long distance charges and billing issues.
Three in ten (29%) say they have had a surprisingly high bill in the past 12 months, largely unchanged from 28% in 2014. The top causes for this bill shock are high data usage (30%) and unexplained airtime or data usage (17%), followed by international roaming charges (14%), long distance charges and billing issues (12% respectively). Additional or unexpected fees (6%) and set-up or service charges (5%) were also mentioned.
In comparison to 2014, international roaming charges significantly decreased from 21% (to 14%); there is reason to think that this is the result of the changes made by the Wireless Code. While long distance charges and billing issues increased significantly from 6% and 4% (to 12% respectively), this may be partially explained by the decrease in roaming charges making other causes appear to be relatively more common.
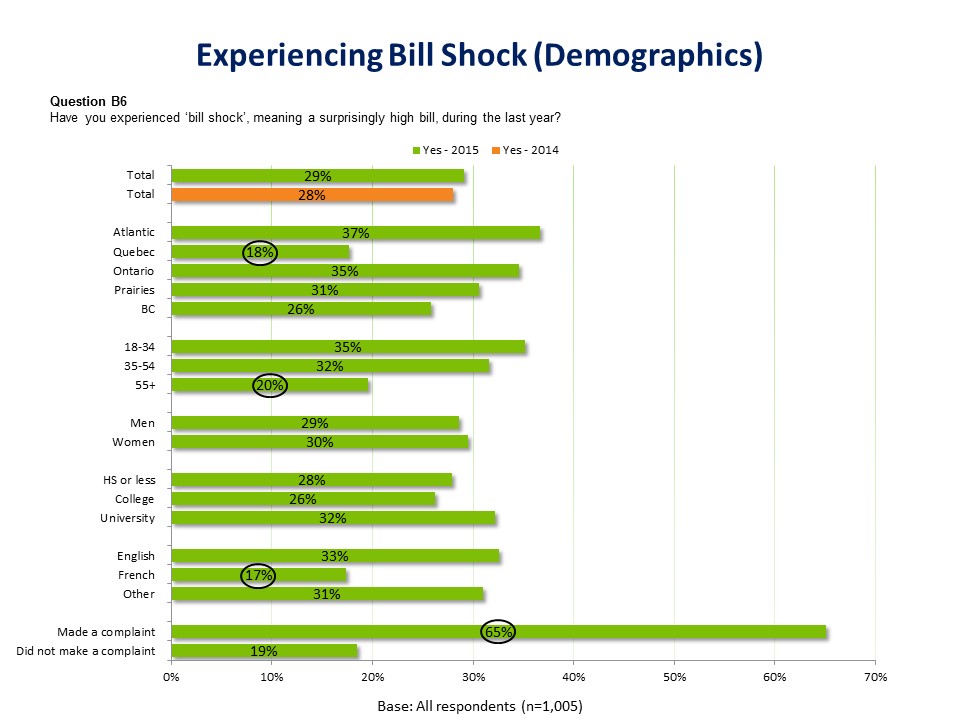
Regionally, bill shock is significantly less common in Quebec (18%). Older Canadians (55+) were significantly less likely than younger Canadians to say they were surprised by their charges in the last year, with only 20% saying this was the case, compared to 35% among those 18-34 and 32% among those 35-54 (likely due to lower levels of data usage).
When looking at the link between making a complaint and experiencing bill shock, the results show that among those who made a complaint, 65% experienced bill shock, suggesting that many of the complaints would have been about a billing issue. This is statistically significant.
There is also a significant difference between those who have a family plan and those who have an individual plan with regard to whether they have experienced bill shock. This is not surprising as with more people on a plan, there is a greater chance that limits will use more data/calling minutes than expected or to incur roaming fees.
| Individual Plan | Family Plan | |
|---|---|---|
| % Experienced Bill Shock | 26% | 40% |
Much like in 2014, most Canadian cell phone owners find their contract or service agreement1 clear and easy to understand.
More than two thirds (68%) say that their contract is clear and easy to understand, giving a score of 5, 6 or 7 on a 7-point scale – around a quarter (24%) gave it the highest mark, indicating it is extremely clear. Only 15% describe their contract as unclear or difficult to understand (1, 2 or 3 on the 7-point scale), while 9% were neutral. The remainder either say they do not have a contract (4%), aren’t sure (3%) or admit to never reading the agreement (1%).
Not surprisingly, the clarity of one’s contract is correlated with the propensity to make a complaint about wireless services. Those who made a complaint were more likely to feel their contact was unclear and difficult to understand (27%) and another 17% were neutral. Both of these numbers are significantly higher than those who did not make a complaint. At the same time, seven in ten (73%) of those who did not make a complaint found their contract clear, with 27% saying it is extremely clear (giving the highest score of 7 out of 7).
There are some demographic differences of note. This includes regional divergence, which could be linked to the availability and popularity of certain telecommunications providers who have different contracts for their clients:
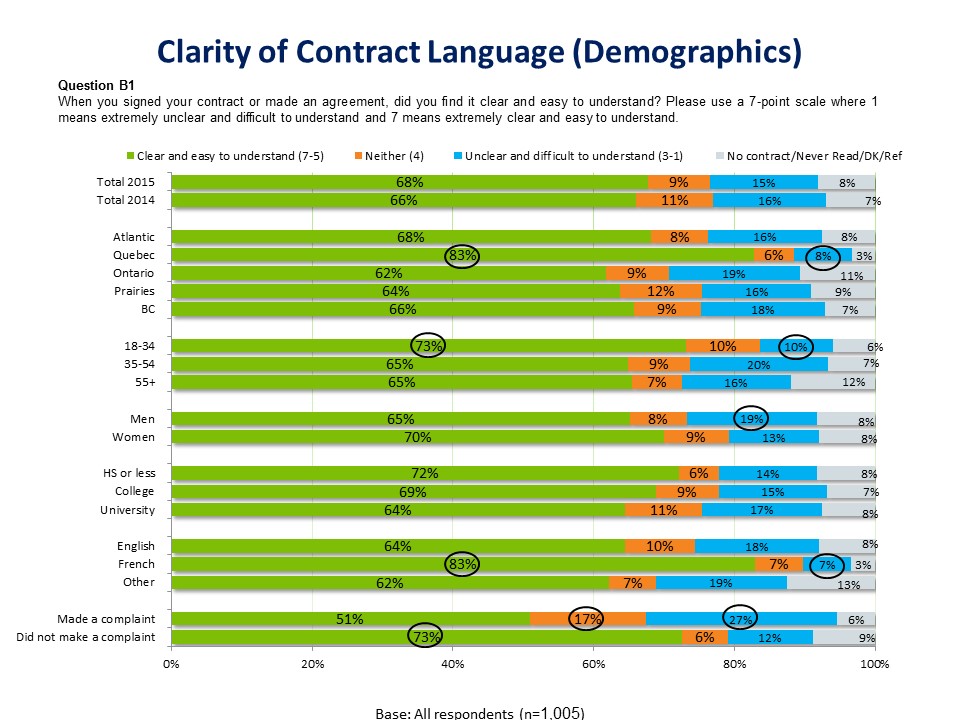
Related to the clarity of the contract, respondents were also asked about the explanation their service provider gave them about fees that would be incurred if cancelling a contract early.
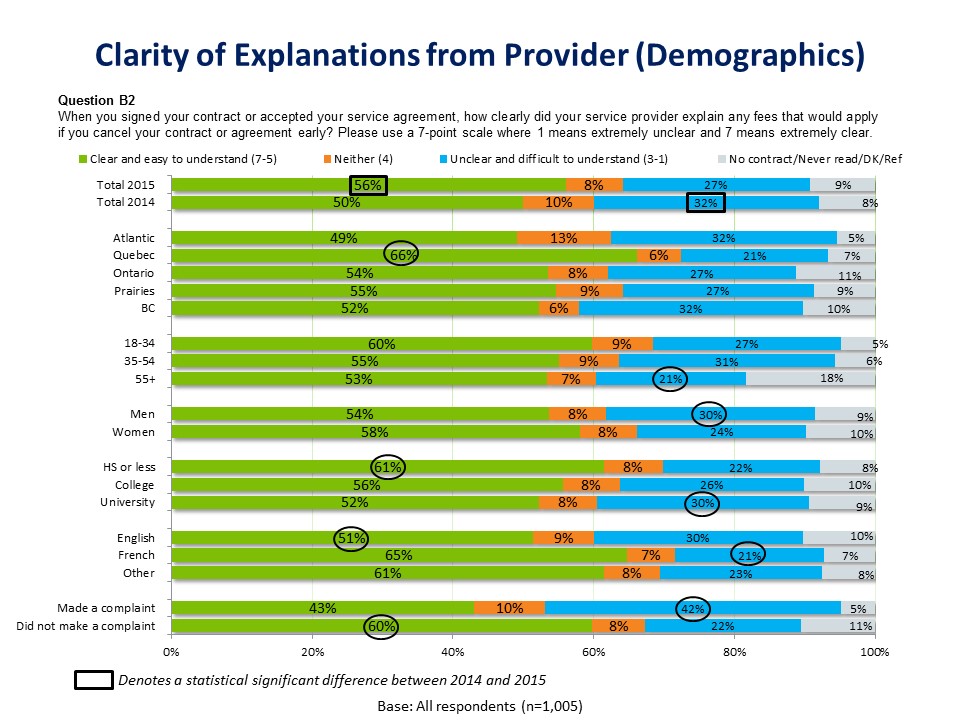
More than half of Canadian cell phone owners say their service provider gave a clear explanation of fees that would apply if they canceled their agreement early.
One quarter (26%) say this was done in an extremely clear manner, and gave it the highest mark on a 7-point scale. Conversely, about half that many (11%) gave their provider the lowest grade (1 out of 7), saying it was extremely unclear. Overall, more than a quarter of respondents (27%) gave their service provider a failing grade (1-3) for explaining cancellation fees. The remainder are either neutral (8%), say they don’t have a contract (4%), never read the agreement (1%) or aren’t sure (5%). There was also a statistically significant increase over time with the proportion of those saying they clearly understood moving from 50% in 2014 to 56% in 2015.
Once again, the correlation can be seen with making complaints: Among those who made a complaint, two-in-five (42%) indicate that this element of their contract is unclear and difficult to understand, including one in five (21%) who say it is extremely unclear (giving it 1 out of 7). This is significantly higher than those who found this element of their contract unclear and did not make a complaint (22%). Among those who did not complain, there is a significantly higher clarity and understanding (60%) compared to those who made a complaint (43%).
When looking regionally across the country, it appears that information about cancellation fees is clearest (and significantly higher) for residents of Quebec (66%). This may be due to a similar law governing cancellation fees which was enacted in Quebec which came into effect in June 2010. It is possible that the difference could arise because people and service providers in Quebec have had more time to adapt to these more rigorous rules.
Canadians with a high school education or less (61%) are significantly more likely to find information about cancellation fees clear than those with a college education (56%) or university education (52%).
Information about cancellation fees are the least clear among younger Canadians (31% of those aged 35-54 and 27% of those aged 18-34) compared to older Canadians (55+) (21%). Men (30%) similarly find this information less clear than women (24%).
Those whose mother tongue is English (51%) are significantly less likely to find information about cancellation fees clear, compared to Francophones (65%) and those whose mother tongue is something else (61%).
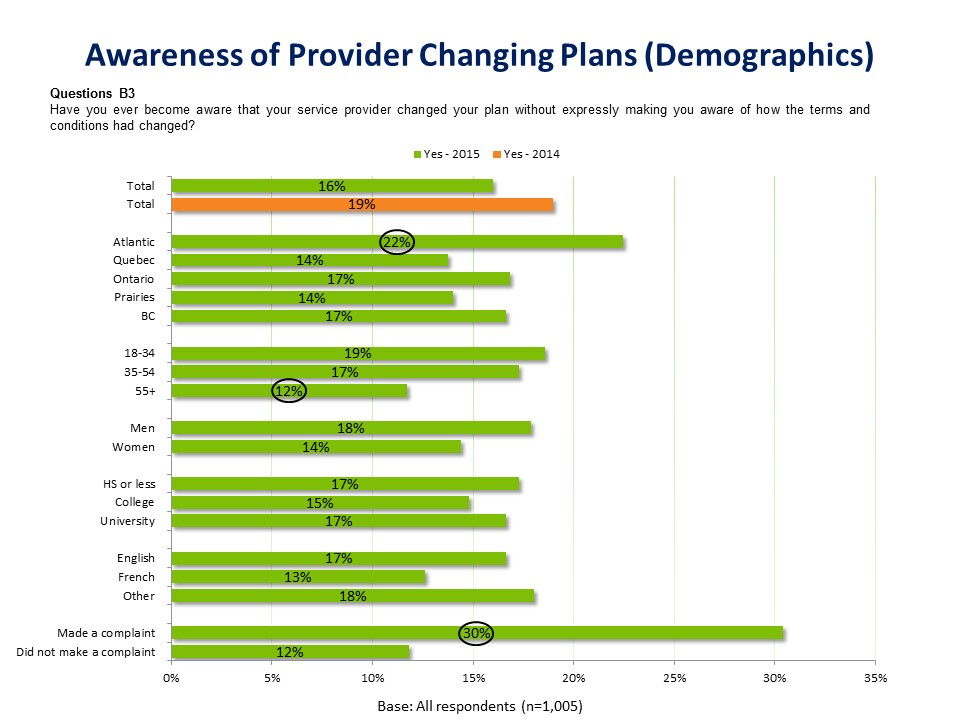
One in six Canadian cell phone owners have become aware that their service provider changed their plans without informing them.
While nationally, 16% say they have experienced this, that number is significantly higher in the Atlantic provinces (22%) than in Ontario and BC (17%) as well as the Prairies and Quebec (14%). Among older Canadians (55+), only 12% reported this, significantly fewer than 18-34-year olds (19%) and those 35-55 (17%).
A big difference can be seen among those who made a complaint: among those, three in ten (30%) say they are aware of their provider changing their plan without them being made aware, compared to only 12% among those who have not made a complaint. This is a statistically significant difference. It is not clear, however, whether this is in fact the reason for the complaint that was made or if these respondents are just more likely to be monitoring changes to their service more closely.
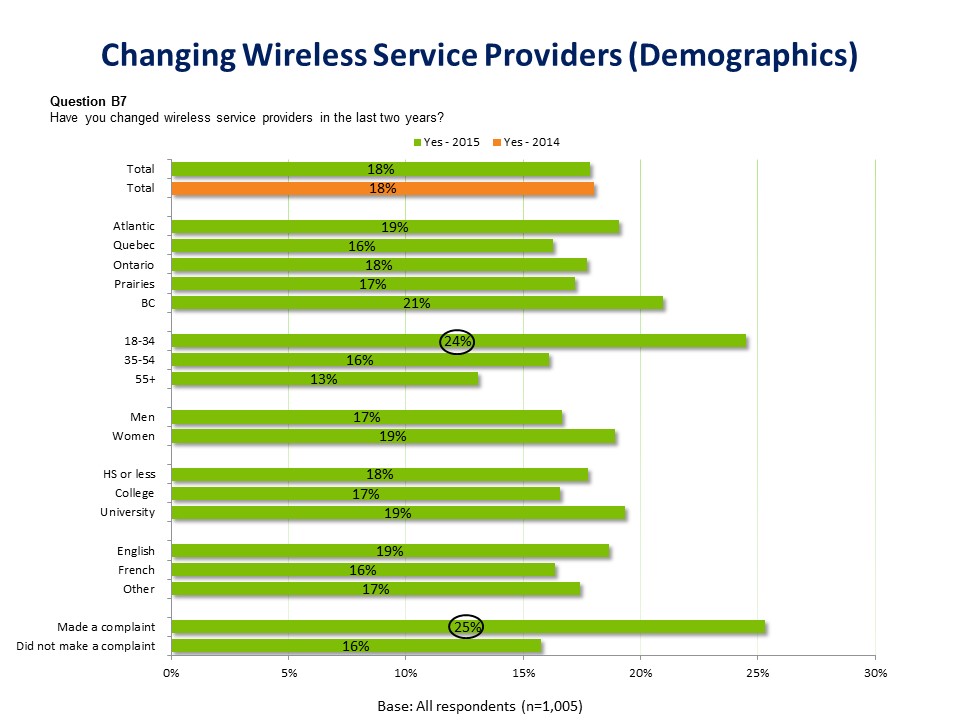
Almost one in five Canadian cell phone owners have changed providers in the past two years; price was often a factor in this decision.
The number of Canadians who switched providers in the last two years, along with reasons they had for switching, is consistent with the findings from 2014.
Getting a better deal with another provider (42%) and the service generally being too expensive (13%) together were mentioned by more than half of all respondents among their reasons for switching. Also ranking high as a reason is general dissatisfaction with a provider at 33%. Hardware upgrades are a reason for 10% of switchers. Service issues such as poor network coverage (3%) and poor reception (3%) are also reasons to look elsewhere.
While there is a significant difference in the number who switched because of a move (from 2% to 11%), it is worth noting that the sample size for this question is small and caution should be exercised when considering reasons for this shift.
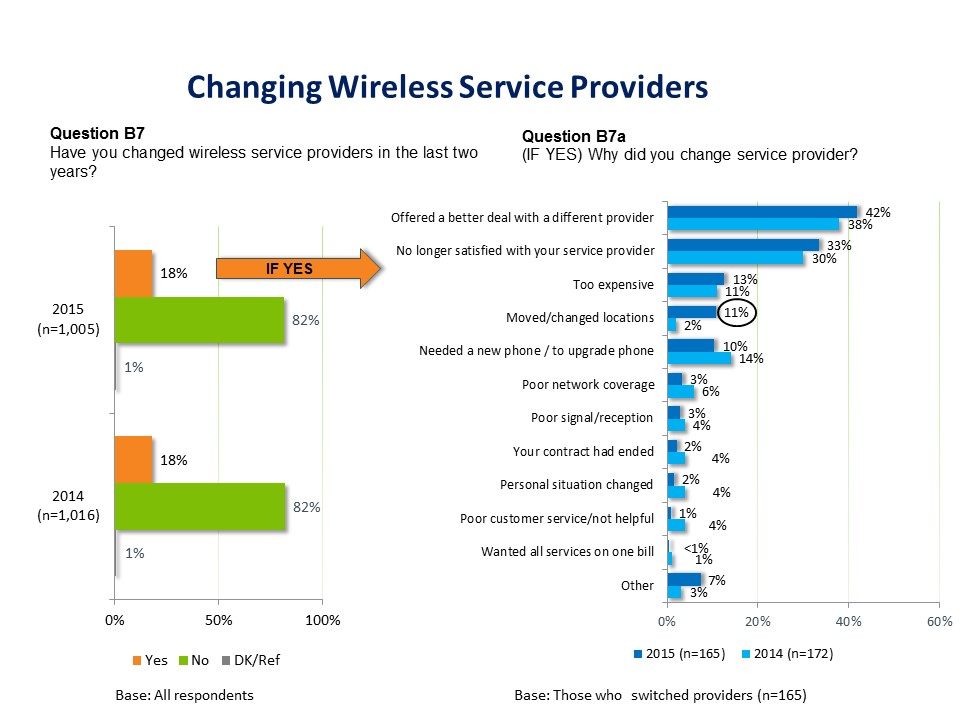
Nationally, 18% switched providers in the last two years, unchanged from 2014 (18%).
However, older Canadians (55+) are more likely to be content to stay with their provider. Among this group, only 13% switched, compared to 16% of those 35-54 and a quarter (24%) of those 18-34. Younger Canadians (18-34) are significantly more likely to change service providers.
Among those who made a complaint, one quarter (25%) ended up switching, significantly higher than among those who did not complain (16%).
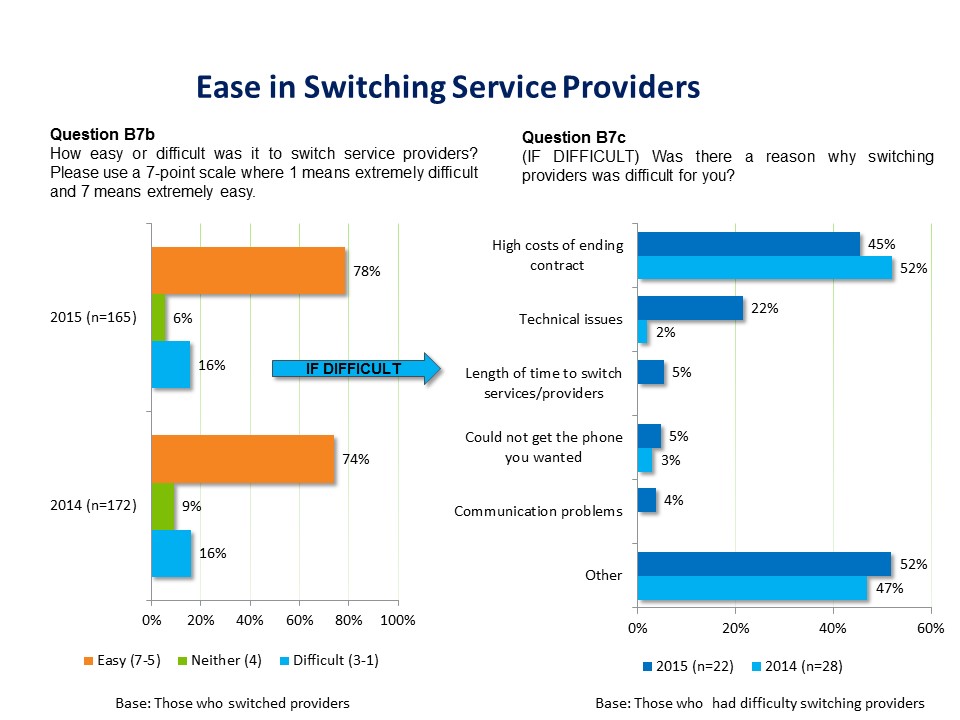
For the most part (as was the case for last year), it was easy to switch providers. Almost half (47%) say it was extremely easy, giving a score of 7 on a 7-point scale, while another 32% say it was somewhat easy (5 or 6 on the 7-point scale). Only 16% say it was difficult (1, 2 or 3 on the 7-point scale). Among this group, the high cost of ending their contract was usually the barrier - similar to results from last year. While there was an increase in technical issues being mentioned, it was not a statistically significant increase from 2014 due to small sample sizes.
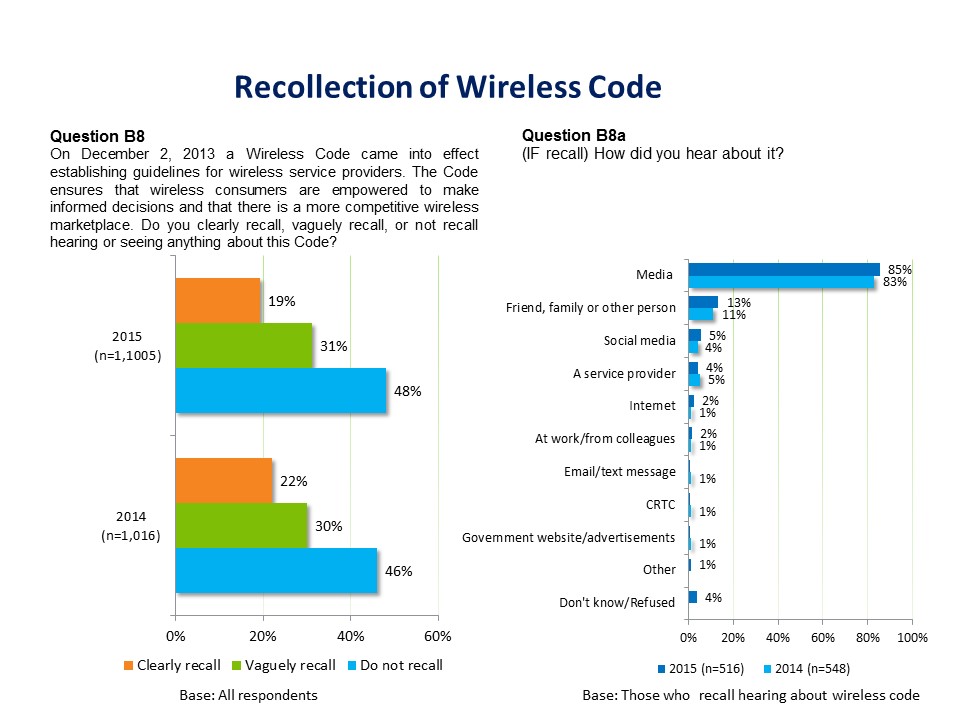
On December 2, 2013 a Wireless Code came into effect establishing guidelines for wireless service providers. The Code ensures that wireless consumers are empowered to make informed decisions and that there is a more competitive wireless marketplace.
After hearing this explanation of the Code, 19% of cell phone owners say they clearly recall haring or seeing something about it. Another 31% vaguely recall it, while the remaining 48% did not hear about the Code (largely unchanged compared to 2014, where these numbers were 22%, 30% and 46% respectively). Almost all awareness came from media announcements (85%), while hearing from friends/family accounted for 13% of recall. Other areas of recall include social media (5%), service provider (4%) and from the internet or a colleague (2% respectively).
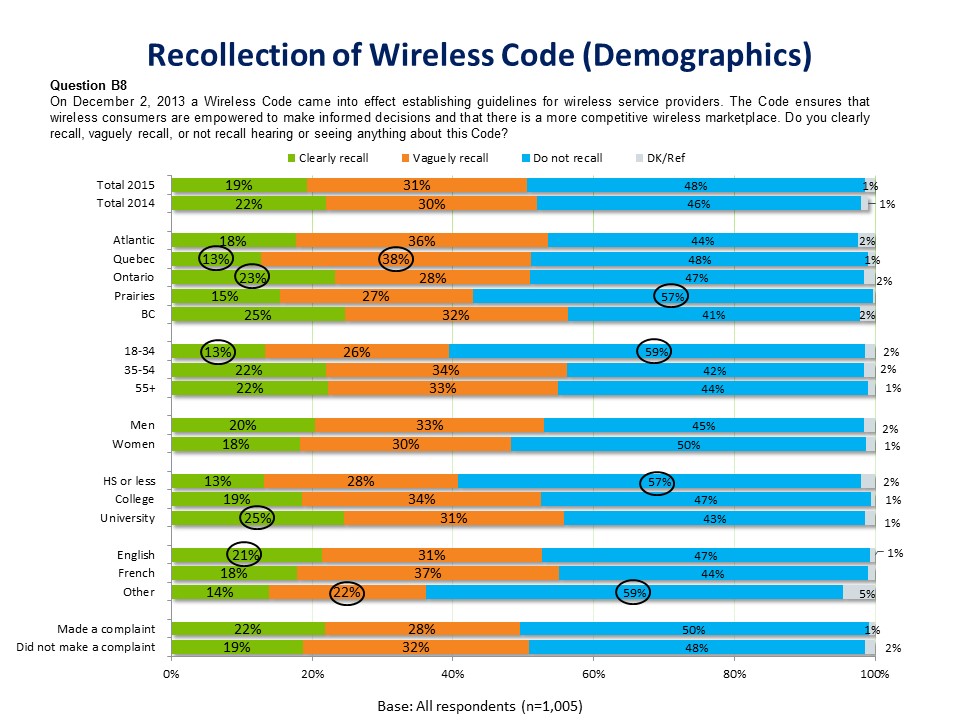
Across the country, recall is significantly lower in Quebec (13%) than in any other region, while Ontario (23%) has a significantly higher recall; the Prairies (57%) are significantly more likely to have no recollection. Younger cell owners (18-34) are much less likely to have heard of it than older respondents; among this group, 13% recall news of the Code clearly and 26% vaguely, while these numbers are 22% and 34% among 35-54-year-olds, and 22% and 33% among the oldest cohort (55+).
The recall of those with a university education (25%) is significantly higher compared to college education (19%) or high school or less (13%). Similarly, the recall of those whose mother tongue is English (21%) is significantly higher than Francophones (18%) or something else (14%).
Harris/Decima undertook a telephone survey with Canadian adults.
This research consisted of a telephone survey with Canadian adults aged 18 years and older who owned their own cell phones. Specifically, 1,005 Canadians were interviewed by telephone using both random cell and landing sample sources. A sample of this size drawn from the Canadian population would be expected to provide results accurate to within +/-3.1%, 19 times out of 20 samples.
We aimed to complete roughly the same proportion of interviews from the comparable sample of cell phone owners in 2014. This provides consistency and also ensures that those people who primarily use their cell-phone (or live in a cell phone only household) were included in the sample pool. The final sample of 1,005 Canadian adults is made up of 35% cell phone interviews and 65% landline interviews. Surveys were conducted between February 23rd and March 11th, 2015 (in English and French) and took an average of 9 minutes to complete.
In 2014, a representative sample of Canadians including those who only have a landline phone was conducted in order to get a completely representative sample of the Canadian general population which would allow for consistent tracking results for the CRTC knowledge/attitudes questions. This was no longer required the current wave of research so only respondents who own a cell phone were interviewed. A total of n=1,005 qualified cell phone owners were contacted in 2015 and their responses are compared to the n=1,016 respondents identified as cell phone owners from 2014.
The sampling plan aimed to ensure a representative sample of cell phone owners in Canada so minimum regional and demographic quotas were set:
| Spec | Minimum Quota | Total |
|---|---|---|
| Region | ||
| Atlantic Canada | 100 | 1,000 |
| Quebec | 200 | |
| Ontario | 385 | |
| Prairies | 200 | |
| British Columbia/Territories | 115 | |
| Gender | ||
| Male | 500 | 1,000 |
| Female | 500 | |
| Age | ||
| 18-34 | 220 | 1,000 |
| 35-54 | 415 | |
| 55 and over | 365 | |
| Sample | ||
| Landline Sample | 650 | 1,000 |
| Cell Phone Sample | 350 | |
The survey data were weighted using the 2011 Census and Statistics Canada telephone ownership statistics to reflect the general population according to variables gender, age, region and cell phone penetration.
Further details regarding the approach used for completing this research are outlined below.
Harris/Decima reviewed the questionnaire provided by the CRTC to ensure all questions were appropriately worded and new questions were added to meet the CRTC’s objectives. The overall length of the survey was around 9 minutes.
Prior to being finalized, the telephone survey was pre-tested on February 23rd, 2015 in both official languages to ensure it elicited the required information. In total, 10 interviews were conducted in English and 10 interviews were conducted in French. On average, the study took 9 minutes to complete during the pre-tests, and minor changes were made to a few of the questions which were designed to capture respondent responses in the most efficient manner. Interviewing notes and instructions were provided to interviewers before launching full field.
Following the pretest, the data was reviewed by checking frequencies and skip logic to ensure the survey instrument was programmed properly. The pre-test completes are included in the final dataset as no substantive changes to the questionnaire were made.
The sample for this survey was designed to complete a minimum of 1,000 interviews with Canadian adults who own their own cell phone. The sample was stratified by region, age and gender to allow for meaningful sub-group analysis and to minimize the magnitude of weighting factors used.
The landline telephone sample was drawn using Survey Sampler technology, which ensures that all residential listings in Canadian provinces have an opportunity to be selected for inclusion in the survey. Within those households selected, respondents were screened to ensure they were eligible for the study.
Survey Sampler also provided cell phone sample. Cell phone numbers are not provided from directories, but are randomly generated with known cell-phone prefixes. The person answering the cell phone was selected for the study if they were 18 years of age or over, not driving a vehicle at the time of the survey, and owned their own cell phone (not paid for by their employer).
The telephone survey was conducted with a total of 1,005 respondents in English or French using computer-assisted-telephone-interviewing (CATI) technology, from Harris/Decima's facilities in Ottawa and Montreal. The survey was completed between February 23rd and March 11th, 2015. The average length of time required to complete the survey was approximately 9 minutes. All interviewing was conducted by fully trained and supervised interviewers, and a minimum of 5 percent of all completed interviews were independently monitored and validated in real time, with 75 percent of the survey needing to be monitored to count towards the 5 percent.
Harris/Decima informed all survey participants of the general purpose of the research, identified both the sponsor (Government of Canada) and the research supplier, and informed participants that their responses would be kept confidential. Furthermore, the survey was registered with the National Survey Registration System.
Harris/Decima used Confirmit’s Horizons CATI program for data collection. The software provided complete control over entry flow, including skips, valid ranges, and logical error-trapping. The system imported sample directly from databases – no need for re-entry and no entry errors. Moreover, the system automated all scheduling and call-back tasks, ensuring that every appointment was set within project time limitations and that an interviewer was available for every call-back.
A sample of 1,005 drawn from the Canadian adult population would be expected to provide results accurate to within plus or minus 3.1 percent in 95 out of 100 samples. Sub-groups have larger margins of error, as presented below:
| Spec | Completes (Unweighted) | Margin of Error2 |
|---|---|---|
| Region | ||
| Atlantic Canada | 100 | +/-9.8 |
| Quebec | 200 | +/-6.9 |
| Ontario | 385 | +/-5.0 |
| Prairies | 205 | +/-6.8 |
| British Columbia/Territories | 115 | +/-9.1 |
| Gender | ||
| Male | 483 | +/-4.5 |
| Female | 522 | +/-4.3 |
| Age | ||
| 18-34 | 241 | +/-6.3 |
| 35-54 | 399 | +/-4.9 |
| 55 and over | 365 | +/-5.1 |
| Sample | ||
| Landline | 649 | +/-3.8 |
| Cell phone | 356 | +/-5.2 |
| Total | 1,289 | +/-2.7 |
Data were then weighted by region, age, gender and cell phone penetration to match the best available estimates of the cell phone owning Canadian population using 2011 Census data and demographic results from the 2014 wave of this research:
| Spec | Completes (Unweighted) | Completes (Weighted) |
|---|---|---|
| Region | ||
| Atlantic Canada | 100 | 69 |
| Quebec | 200 | 221 |
| Ontario | 385 | 392 |
| Prairies | 205 | 183 |
| British Columbia/Territories | 115 | 140 |
| Gender | ||
| Male | 483 | 465 |
| Female | 522 | 540 |
| Age | ||
| 18-34 | 241 | 321 |
| 35-54 | 399 | 380 |
| 55 and over | 365 | 304 |
| Cell Phone Penetration | ||
| Both Cell and Landline | 830 | 747 |
| Cell Only | 175 | 258 |
| Total | 1,289 | 1,289 |
A total of 49,901 Canadian phone numbers were dialed for this study, of which n=1,005 completed the survey (adult Canadians 18 years and older). The overall response rate achieved for the telephone study was 5.07%. The following report on sample disposition and response rate follows MRIA guidelines, which are set up to establish consistency in reporting across the market research industry.
| A (1-14) | Total Attempted | 49,901 |
| 1 | Not in service (Confirmit Dispo 6,10,11,26) | 13,626 |
| 2 | Fax (Confirmit Disp 8,9) | 129 |
| 3 | Invalid #/Wrong# (Confirmit Disp 29,30,35,36,44,45,38) | 223 |
| B (4-14) | Total Eligible | 35,923 |
| 4 | Busy (Confirmit Dispo 2) | 660 |
| 5 | Answering machine (Confirmit Dispo 7,33,27) | 3,350 |
| 6 | No answer (Confirmit Dispo 3,12,15,25) | 23,174 |
| 7 | Language barrier (Confirmit Dispo 34) | 676 |
| 8 | Ill/Incapable (Confirmit Dispo 37) | 264 |
| 9 | Eligible not available/Callback (Confirmit Dispo 1,31,32,43) | 1373 |
| C (10-14) | Total Asked | 6,426 |
| 10 | Household/Company Refusal (Confirmit Dispo 5,39) | 440 |
| 11 | Respondent Refusal (Confirmit Dispo 17,40,41,46) | 4,093 |
| 12 | Qualified Termination (Confirmit Dispo 42) | 70 |
| D (13-14) | Co-operative Contact | 1,823 |
| 13 | Not Qualified (Confirmit Dispo 4,14) | 818 |
| 14 | Completed Interview (Confirmit Dispo 13) | 1,005 |
| REFUSAL RATE | 71.65% | |
| (10+11+12) / C | ||
| RESPONSE RATE | 5.07% | |
| D (13-14) / B (4-14) |
The calculated response rate of this survey was 5.07%. The expected response rate for a telephone survey of this type with a similar field length is between 5% and 10%. The following steps were taken in order to maximize the response rate while undertaking the study given the constraints of field time, sample size and budget, the following steps were taken:
Upon completion of data collection, Harris/Decima cleaned, coded, and weighted the data. As requested by the CRTC, a weighted data file (in SPSS) and set of cross-tabulation banners were provided. Our data analysis procedures are outlined below:
Data Validity and Integrity Checks: Our custom system immediately identifies cases where the interview length is unrealistically short, contradicts established facts or presents patterns of response deserving attention. As a result, we can determine whether a case should be excluded from the final sample if necessary. All of these checks are performed manually and cleaned out of the data in the back end of the project. Harris/Decima uses a checklist to ensure all data that is delivered to the client has gone through a rigorous quality control process.
Data Cleaning: Harris/Decima analysts have considerable experience in cleaning data files, conducting statistical routines, producing tabular output, and weighting data to provide an accurate measure of the population as a whole.
The following are the basic steps taken when cleaning data files:
In addition to these generic rules, project specific requirements are also taken into account. It is also noteworthy that because the CATI software controls the questionnaire flow and data entry, data are typically quite clean from the outset.
Coding Procedures: The following details our coding procedures, which were performed on this study. The coding department takes the verbatim responses and creates a numeric code list of common answers. Our head coder, in close conjunction with the consulting team, collapses lists of responses to open-ended variables into categories (which are maintained from wave to wave as applicable). A single coder is used to maximize consistency on this task. The rough frequencies obtained from this exercise are used to develop a code list. Once final approval is granted, the code list is annotated with specific examples so that accurate coding is assured.
The annotated code list is provided to our coding team, which attaches codes directly to the electronic coding file. This exercise can also be performed in a two-pass format, by two different coders. The head coder reconciles inconsistencies, guaranteeing consistent and accurate reporting of open-ended responses. In general, Harris/Decima aims for less than 10% of responses remaining under an ‘other specify’ code category, creating codes for any mentions that add up to 1% or more of total responses. The resulting data file is exported to the statistical package to quantify the responses for statistical analysis.
Weighting: At the conclusion of the data collection and cleaning, Harris/Decima weighted the data by each stratum (in this case, region, age, gender and cell phone penetration) to match the known universe of cell phone owners in Canada. The targets used for this universe are derived from Statistics Canada data from the Residential Telephone Service Survey (RTSS) conducted in 2013 (region and cell phone penetration). For the age/gender targets, the general population portion of the 2014 wave of this study (weighted to be representative of the general population using data from the 2011 Census) was used. The age/gender distribution among those who reported owning a cell phone was used as this was the best estimation that was available to us for the universe of cell phone owning Canadians.
Using these targets Harris/Decima uses a standard procedure for calculating weighting factors, based on established methodological standards and extensive experience in sample weighting over literally hundreds of projects (including many for the Government of Canada).
This procedure involves calculating the actual population within each segment and the true percentage of the sample that would fall into each segment if the survey were conducted on strictly a random basis. Into this number is divided the actual segment sub-sample to produce a weighting factor that is then used to “weight” the data for that segment. While there are various ways of accomplishing this task, this procedure is the most straightforward and effective.
The stratums selected for the project were as follows:
The following tables outline the weighting scheme targets used for this study.
| Province/Region | Age | Gender | Number in Population (N) | Percentage in Population (%) |
|---|---|---|---|---|
| Atlantic | 18-34 | Male | 160,221 | 0.72% |
| Female | 270,821 | 1.22% | ||
| 35-54 | Male | 297,583 | 1.34% | |
| Female | 307,288 | 1.38% | ||
| 55+ | Male | 211,465 | 0.95% | |
| Female | 282,250 | 1.27% | ||
| Quebec | 18-34 | Male | 823,498 | 3.71% |
| Female | 819,405 | 3.69% | ||
| 35-54 | Male | 869,800 | 3.92% | |
| Female | 952,579 | 4.29% | ||
| 55+ | Male | 578,676 | 2.61% | |
| Female | 831,489 | 3.75% | ||
| Ontario | 18-34 | Male | 1,365,297 | 6.15% |
| Female | 1,343,245 | 6.05% | ||
| 35-54 | Male | 1,557,875 | 7.02% | |
| Female | 1,730,185 | 7.79% | ||
| 55+ | Male | 1,155,521 | 5.20% | |
| Female | 1,512,596 | 6.81% | ||
| Prairies | 18-34 | Male | 719,398 | 3.24% |
| Female | 715,553 | 3.22% | ||
| 35-54 | Male | 663,437 | 2.99% | |
| Female | 817,925 | 3.68% | ||
| 55+ | Male | 551,387 | 2.48% | |
| Female | 575,980 | 2.59% | ||
| B.C. & Territories | 18-34 | Male | 356,970 | 1.61% |
| Female | 520,962 | 2.35% | ||
| 35-54 | Male | 507,914 | 2.29% | |
| Female | 680,023 | 3.06% | ||
| 55+ | Male | 456,029 | 2.05% | |
| Female | 567,050 | 2.55% | ||
| Total 18+ Cell Owners | 22,202,420 | 100.00% | ||
| Province/Region | Cell Penetration | Number in Population (N) | Percentage in Population (%) |
|---|---|---|---|
| Atlantic | Cell Only | 326,241 | 1.47% |
| Both | 1,203,387 | 5.42% | |
| Quebec | Cell Only | 1,055,181 | 4.75% |
| Both | 3,820,266 | 17.21% | |
| Ontario | Cell Only | 2,244,904 | 10.11% |
| Both | 6,419,815 | 28.91% | |
| Prairies | Cell Only | 1,142,210 | 5.14% |
| Both | 2,901,470 | 13.07% | |
| B.C. + Territories | Cell Only | 935,937 | 4.22% |
| Both | 2,153,010 | 9.70% | |
| Total 18+ | 22,202,420 | 100.00% | |
Data Analysis: Harris/Decima prepared an analysis plan that included key banner breaks as required. Once the survey data had been collected and cleaned Harris/Decima ran a series of data tables that provided results for all questions in the survey, both overall and broken down by selected “banners.” This permitted the comparison of results from various sub-group segments of interest; statistical significance testing was shown between all banner points in the data tables. Independent T-Tests were conducted for means (equal variances) and Independent Z-Tests for percentages. The analysis plan included two banners for the key segments, outlined as follows:
Wireless Code Public Opinion Research 2015
February 2015
Hello/Bonjour. My name is _______________ and I am calling from Harris Decima on behalf of the Government of Canada. We are conducting a survey with Canadians to get their attitudes and opinions towards issues of importance to Canadians. Would you prefer that I continue in English or French? Préférez-vous continuer en français ou en anglais?
Your participation in this survey is voluntary. Please be assured that your responses are confidential and will not be reported individually nor attributed to you personally. The survey will take about 7 minutes to complete. May I continue?
| Yes | CONTINUE |
| No, other time | SCHEDULE CALLBACK |
| No/Refused | THANK AND TERMINATE |
[IF ASKED: Harris Decima is a professional research company hired by the Government of Canada to conduct this survey]
A1. And, just to confirm, have I reached you on a landline phone or a cell phone?
| Landline | CONTINUE to A1b |
| Cell phone | CONTINUE |
| Don't know/Refused | THANK AND TERMINATE |
[IF CELL PHONE AT A1] A1a. For your safety, are you currently driving?
| Yes | SCHEDULE CALLBACK |
| No | CONTINUE |
| Don't know/Refused | THANK AND TERMINATE |
[ASK ALL] A1b. Do you have your own cell phone, smartphone or other wireless device? In other words, a phone that is not paid for by your employer?
| YES | CONTINUE |
| NO | THANK AND TERMINATE |
A1c. [IF CELL PHONE AT A1] Does your household have a landline?
| Yes | 1 |
| No | 2 |
| DK/NR (VOLUNTEERED) | 9 |
A2. Are you or is any member of your household or immediate family employed in any of the following businesses? [READ LIST]
| Market Research | 1 | [THANK AND TERMINATE] |
| Public or media relations or advertising | 2 | [THANK AND TERMINATE] |
| Any media company such as print, radio, TV | 3 | [THANK AND TERMINATE] |
| Media monitoring | 4 | [THANK AND TERMINATE] |
| Any telecommunications company | 5 | [THANK AND TERMINATE] |
| No | 6 | [CONTINUE] |
A3. Record gender [DO NOT ASK]
| Male | 1 |
| Female | 2 |
A4. Can you tell me, in what year were you born?
_____________[RECORD YEAR TO CALCULATE AGE]
DK/refused
A4.1 [IF QA = DK/refused]
For classification purposes, could you tell me whether your age is: [READ LIST]
| between 18 and 34 | 1 |
| between 35 and 54 | 2 |
| or 55 or older | 3 |
[ASK ALL]
A5. Before we begin, can you please confirm that you live in [PROVINCE FROM SAMPLE]? [IF NECESSARY, INTERVIEWER SAYS:] This information will be used for classification purposes only.
| Yes | 1 |
| No | 2 |
A51. [IF A5=2] In which province or territory do you live?
| Alberta | 1 |
| British Columbia | 2 |
| Manitoba | 3 |
| New Brunswick | 4 |
| Newfoundland | 5 |
| Nova Scotia | 6 |
| Ontario | 7 |
| Prince Edward Island | 8 |
| Quebec | 9 |
| Saskatchewan | 10 |
| Yukon | 11 |
| Nunavut | 12 |
| Northwest Territories | 13 |
IF QUALIFIED (if CELL OWNER - A1B=1): Thank you, you have qualified for the survey. The questions are about your cell or wireless phone service. Specifically, the questions are about your contract or service agreement, regardless of whether you have signed a contract for a specific time period, are month-to-month or use pre-paid cards. [CONTINUE TO B1]
IF NOT QUALIFIED: Thank you very much for your time, unfortunately you are not selected to participate in this study, Have a good evening! [TERMINATE]
[ASK ALL]
B1. When you signed your contract or made an agreement, did you find it clear and easy to understand? Please use a 7-point scale where 1 means extremely unclear and difficult to understand and 7 means extremely clear and easy to understand.
| 7 – Extremely clear and easy to understand | 07 |
| 6 | 06 |
| 5 | 05 |
| 4 | 04 |
| 3 | 03 |
| 2 | 02 |
| 1 – Extremely unclear and difficult to understand | 01 |
| DO NOT READ: Do not have a contract | 08 |
| DO NOT READ: Never read the agreement | 09 |
| DO NOT READ: Don’t Know | 99 |
B2. When you signed your contract or accepted your service agreement, how clearly did your service provider explain any fees that would apply if you cancel your contract or agreement early? Please use a 7-point scale where 1 means extremely unclear and 7 means extremely clear.
| 7 – Extremely clear | 07 |
| 6 | 06 |
| 5 | 05 |
| 4 | 04 |
| 3 | 03 |
| 2 | 02 |
| 1 – Extremely unclear | 01 |
| DO NOT READ: Do not have a contract | 08 |
| DO NOT READ: Never read the agreement | 09 |
| DO NOT READ: Don’t Know | 99 |
B3. Have you ever become aware that your service provider changed your plan without expressly making you aware of how the terms and conditions had changed?
| Yes | 1 |
| No | 2 |
| DK | 99 |
B4. Have you made a complaint about your wireless services in the past 12 months?
| Yes | 1 |
| No | 2 |
| DK | 99 |
B4a. [If answered “Yes” to B4] Who did you complain to? DO NOT READ LIST
| Commissioner for Complaints for Telecommunications Services (CCTS) | 1 |
| Canadian Radio-television and Telecommunications Commission (CRTC) | 2 |
| Your wireless service provider | 3 |
| Other [open ended] | 77 |
| DK | 99 |
B4b.[If answered “Yes” to B4] How satisfied were you with how your complaint was resolved? Please use a 7-point scale where 1 means extremely dissatisfied and 7 means extremely satisfied.
| 7 – Extremely satisfied | 07 |
| 6 | 06 |
| 5 | 05 |
| 4 | 04 |
| 3 | 03 |
| 2 | 02 |
| 1 – Extremely dissatisfied | 01 |
| DO NOT READ: Still in process | 08 |
| DO NOT READ: Don’t Know | 99 |
[ASK ALL]
B5. How aware are you of your right to complain about issues you are experiencing with your wireless service provider to the Commissioner for Complaints for Telecommunications Services – the CCTS? Would you say you were fully aware, vaguely aware, or not at all aware of this right?
| Fully Aware | 3 |
| Vaguely Aware | 2 |
| Not at all aware | 1 |
| DK | 99 |
B6. Have you experienced ‘bill shock’, meaning a surprisingly high bill, during the last year?
| Yes | 1 |
| No | 2 |
| DK | 99 |
B6a. [If answered “Yes” to B6] What was the main reason for the ‘bill shock’ you experienced? DO NOT READ LIST – SELECT ALL THAT APPLY
INTERVIEWER NOTE: IF RESPONDENT SAYS ‘ROAMING/ROAMING FEES, CLARIFY WHETHER THIS WAS WITHIN CANADA OR IN ANOTHER COUNTRY
| Roaming charges – Within Canada | 01 |
| Roaming charges – International | 02 |
| Additional / Unexpected fees (Network access fee/911, etc.) | 03 |
| Greater than expected data usage | 04 |
| Unexplained airtime / data usage | 05 |
| Unexpected set-up fee or service charge | 06 |
| Billing issues/errors/mistakes | 21 |
| Calls/minutes exceeded the limit | 22 |
| Long distance charges | 23 |
| I was not given the plan/deal I was promised | 26 |
| Other (Specify) | 77 |
| Don’t Know | 99 |
[ASK ALL]
B7. Have you changed wireless service providers in the last two years?
| Yes | 1 |
| No | 2 |
| DK | 99 |
B7a. [If answered “Yes” to B7] Why did you change service provider? (DO NOT READ LIST - SELECT ALL THAT APPLY)
| Your contract had ended | 1 |
| You were no longer satisfied with your service provider | 2 |
| Offered a better deal with a different provider | 3 |
| Needed a new phone / to upgrade phone | 4 |
| Other [open ended] | 77 |
| DK | 99 |
B7b[If answered “Yes” to B7a ] How easy or difficult was it to switch service providers? Please use a 7-point scale where 1 means extremely difficult and 7 means extremely easy.
| 7 – Extremely easy | 07 |
| 6 | 06 |
| 5 | 05 |
| 4 | 04 |
| 3 | 03 |
| 2 | 02 |
| 1 – Extremely difficult | 01 |
| DO NOT READ: Don’t Know | 99 |
B7c. [If answered “Somewhat/Very Difficult” to B7b (B7b = 3, 2 or 1)] Was there a reason why switching providers was difficult for you? (DO NOT READ LIST – SELECT ALL THAT APPLY)
| Technical issues | 01 |
| Difficulty retaining phone number | 02 |
| High costs of ending contract | 03 |
| Could not get the phone you wanted | 04 |
| Other [open ended] | 77 |
| Don’t Know | 99 |
[ASK ALL]
B8. On December 2, 2013 a Wireless Code came into effect establishing guidelines for wireless service providers. The Code ensures that wireless consumers are empowered to make informed decisions and that there is a more competitive wireless marketplace. Do you clearly recall, vaguely recall, or not recall hearing or seeing anything about this Code?
| Clearly Recall | 3 |
| Vaguely Recall | 2 |
| Do not recall | 1 |
| DK | 99 |
B8a. [If answered “Clearly recall or vaguely recall” to B8] how did you hear about it? (DO NOT READ – SELECT ALL THAT APPLY)
| Media (newspaper, online news, tv news, radio) | 1 |
| Social media (twitter, facebook) | 2 |
| Friend, family or other person | 3 |
| A service provider | 4 |
| The Commissioner for Complaints for Telecommunications Services (CCTS) | 5 |
| The Canadian Radio-television and Telecommunications Commission (CRTC) | 6 |
| Other [open ended] | 77 |
| DK | 99 |
[ASK ALL] About the contract or plan for your personal wireless device…
[Interviewer note: If say “I don’t have a plan/I have pay-as-you-go/month-to-month,” say: “this question is about your service agreement or plan, regardless of whether you have signed a contract for a specific time period, are month-to-month or use pre-paid cards.”]
B9a. Is it an individual plan or a family plan?
[Interviewer note: If unsure about the difference, say “Do you pay only for one person (which is an individual plan) or do you share a plan with your family and pay together (which is a family plan)?”]
| Individual plan | 1 |
| Family/shared plan | 2 |
| [DO NOT READ] Other [SPECIFY] | 77 |
| DK | 99 |
B9b. And is it a monthly plan, or a prepaid or pay-as-you-go plan?
[Interviewer note: If unsure about the difference, say “If you pay your bill after you use your wireless service, it’s a monthly or post-paid plan. If you pay before you use your wireless service, it’s a prepaid or pay-as-you-go plan.“]
| Monthly/post-paid (paying after) | 1 |
| Prepaid/pay-as-you-go (paying before) | 2 |
| [DO NOT READ] Other [SPECIFY] | 77 |
| DK | 99 |
B9c1. Are Calling minutes included as part of your plan? [Interviewer note: If unsure about the meaning, say “This is what you need to make or receive phone calls.”]
B9c2. Is Text messaging included as part of your plan
B9c3.Is Data included as part of your plan? [Interviewer note: If unsure about the meaning of data, say “This is what you need to browse the Internet, access applications or your emails with your wireless device.”]
| Yes | 1 |
| No | 2 |
| DK | 99 |
B9d. And finally, is your plan part of a promotion through your employer or an association you belong to, sometimes also called an employee purchase plan?
| Yes | 1 |
| No | 2 |
| DK | 99 |
B10. Of the following list, which one element or service of your contract would most upset you if changed by your service provider without you being consulted or informed first? [READ LIST, SELECT ONE ONLY]
INTERVIEWER NOTE: DO NOT READ “PRICE” – SELECT ONLY IF OFFERED UNPROMPTED/VOLUNTEERED BY RESPONDENT
| Voice calling (IF ASKED: for example, number of minutes or cost per minute) | 1 |
| Data plan (IF ASKED: for example, amount of data or price for data) | 2 |
| Text messaging (IF ASKED: for example, number included in the plan or cost per text) | 3 |
| Roaming fees within Canada or internationally | 4 |
| Unlocking fees | 5 |
| Commitment period or contract length | 6 |
| Some other element of your contract [If Chosen: “What would that element be?”] | 7 |
| DO NOT READ: Price | 8 |
| DK | 99 |
IF B10=8:
B10a. When you say price, is it the price of calling, of the data plan, of text messages, or of another element of your contract that would be the main issue?
| Price of Voice calling | 1 |
| Price of Data plan | 2 |
| Price of Text messaging | 3 |
| Price of another element | 4 |
| DO NOT READ: Price (General/Unspecified) | 7 |
| Other [SPECIFY] | 77 |
| DK | 99 |
ASK ALL
B11. Now I have a short list of elements you may have as part of your plan or that you could consider when shopping for a plan. For each, I’d like you to tell me how important they are or would be for you. Please use a 7-point scale where 1 means not at all important and 7 means essential. How about…[READ AND RANDOMIZE]
[Interviewer note: If say “I don’t have a plan/I have pay-as-you-go/month-to-month,” say: “this question is about your service agreement or plan, regardless of whether you have signed a contract for a specific time period, are month-to-month or use pre-paid cards.”
Interviewer note: If say “This is not part of my plan,” offer: “How important do you think it would be to you if it were part of your plan?”]
| 7 – Essential | 07 |
| 6 | 06 |
| 5 | 05 |
| 4 | 04 |
| 3 | 03 |
| 2 | 02 |
| 1 – Not at all important | 01 |
| DO NOT READ: Don’t Know | 99 |
Thank you, we now just have a couple of other questions about you and your household. Please be assured that your responses will remain confidential.
D3. What is the highest level of formal education that you have completed? [READ IF NECESSARY - CODE ONE ONLY]
| Grade 8 or less | 1 |
| Some high school | 2 |
| High School diploma or equivalent | 3 |
| Registered Apprenticeship or other trades certificate or diploma | 4 |
| College, CEGEP or other non-university certificate or diploma | 5 |
| University certificate or diploma below bachelor’s level | 6 |
| Bachelor’s degree | 7 |
| Post graduate degree above bachelor’s level | 8 |
| [DO NOT READ] Prefer not to answer | 99 |
D4. What is your mother tongue, that is, the language you first learned at home? [CODE ONE ONLY]
| English | 1 |
| French | 2 |
| Other (SPECIFY____________) | 8 |
| DK/NR (VOLUNTEERED) | 99 |
D5. Which of the following categories best describes your total household income? That is, the total income of all persons in your household combined, before taxes? [READ - CODE ONE ONLY]
| Under $20,000 | 1 |
| $20,000 to just under $40,000 | 2 |
| $40,000 to just under $60,000 | 3 |
| $60,000 to just under $80,000 | 5 |
| $80,000 to just under $100,000 | 6 |
| $100,000 to just under $150,000 | 7 |
| $150,000 and above | 8 |
| [DO NOT READ] Refused | 99 |
Those are all the questions I have for you today. Thanks, and have a great evening!
Recherche sur l’opinion publique sur le Code sur les services sans fil
Février 2015
Hello / Bonjour. Je suis _______________ de Harris/Décima et j’appelle au nom du gouvernement du Canada. Nous réalisons un sondage auprès des Canadiens pour déterminer vos attitudes et vos opinions sur relatives à des questions d’importance pour les Canadiens. Préférez-vous continuer en français ou en anglais? Would you prefer that I continue in English or French?
La participation à ce sondage est volontaire. Soyez assurés que vos réponses seront traitées en toute confidentialité et ne seront utilisées que de façon regroupée et anonyme. Le sondage prendra environ sept minutes. Voulez-vous continuer?
| Oui | CONTINUER |
| Non – pas maintenant | PRÉVOIR UN RAPPEL |
| Non – refus | REMERCIER ET METTRE FIN À L’APPEL |
[SI L’INTERLOCUTEUR LE DEMANDE : Harris-Décima est une firme de recherche professionnelle engagée par le gouvernement du Canada pour effectuer le sondage.]
A1. Pouvez-vous me dire si je vous ai rejoint sur un téléphone fixe ou un téléphone cellulaire?
| Téléphone fixe | PASSER À A1b |
| Téléphone cellulaire | CONTINUER |
| Ne sait pas ou refus | REMERCIER ET METTRE FIN À L’APPEL |
[Si A1 = TÉLÉPHONE CELLULAIRE] A1a. Pour assurer votre sécurité, êtes-vous au volant?
| Oui | PRÉVOIR UN RAPPEL |
| Non | CONTINUER |
| Ne sait pas ou refus | REMERCIER ET METTRE FIN À L’APPEL |
[SI A1 = TÉLÉPHONE FIXE] A1B.Avez-vous votre propre téléphone cellulaire, téléphone intelligent ou autre appareil sans fil? C’est-à-dire, un téléphone qui n’est pas payé par votre employeur?
| Oui | CONTINUER |
| Non | REMERCIER ET METTRE FIN À L’APPEL |
A1c. [SI A1 = TÉLÉPHONE CELLULAIRE] Avez-vous une ligne téléphonique terrestre à la maison?
Oui 1
Non 2
Ne sait pas ou pas de réponse (DIT SPONTANÉMENT) 9
A2. Est-ce que vous ou un membre de votre ménage ou de votre famille immédiate travaillez dans un des domaines suivants? [LIRE LA LISTE]
| Études de marché | 1 | [REMERCIER ET METTRE FIN À L’APPEL] |
| Relations publiques ou avec les médias, ou publicité | 2 | [REMERCIER ET METTRE FIN À L’APPEL] |
| Entreprise médiatique (impression, radio, télévision) | 3 | [REMERCIER ET METTRE FIN À L’APPEL] |
| Surveillance des médias | 4 | [REMERCIER ET METTRE FIN À L’APPEL] |
| Toute entreprise de télécommunications | 5 | [REMERCIER ET METTRE FIN À L’APPEL] |
| Non | 6 | [CONTINUE] |
A3. Consigner le sexe de l’interlocuteur [NE PAS LE DEMANDER]
| Homme | 1 |
| Femme | 2 |
A4. Pouvez-vous m’indiquer votre année de naissance?
_____________ [CONSIGNER L’ANNÉE POUR PERMETTRE LE CALCUL DE L’ÂGE]
Ne sait pas ou refus
A4.1 [Si A4 = Ne sait pas ou refus]
Aux fins de classement, pouvez-vous m’indiquer votre tranche d’âge? [LIRE LA LISTE]
| de 18 à 34 | 1 |
| de 35 à 54 | 2 |
| 55 ou plus | 3 |
[POSER À TOUS]
A5. Avant de commencer, pouvez-vous confirmer que vous habitez au/en/à [PROVINCE DE L’ÉCHANTILLON]? [AU BESOIN, INDIQUER QUE : ] Ce renseignement sera utilisé uniquement aux fins de classement.
| Oui | 1 |
| Non | 2 |
A5.1. [Si A5=2] Dans quelle province ou quel territoire habitez-vous?
| Alberta | 1 |
| Colombie-Britannique | 2 |
| Manitoba | 3 |
| Nouveau-Brunswick | 4 |
| Terre-Neuve-et-Labrador | 5 |
| Nouvelle-Écosse | 6 |
| Ontario | 7 |
| Île-du-Prince-Édouard | 8 |
| Québec | 9 |
| Saskatchewan | 10 |
| Yukon | 11 |
| Nunavut | 12 |
| Territoires du Nord-Ouest | 13 |
SI ADMISSIBLE [A1B = 1] : Merci beaucoup, vous répondez aux critères du sondage. Les questions portent sur votre service cellulaire ou sans fil. Plus particulièrement, les questions sont sur votre contrat ou entente de service, qu’il s’agisse d’un contrat à durée déterminée, d’un service mensuel ou de cartes prépayées. [PASSER À B1]
[SI NON ADMISSIBLE] Merci d’avoir pris le temps de répondre à mes questions. Malheureusement, vous ne répondez pas aux critères du sondage. Bonsoir. [METTRE FIN À L’APPEL]
[POSER À TOUS]
B1. Lorsque vous avez conclu un contrat ou une entente, est-ce que c’était clair et facile à comprendre? Veuillez utiliser une échelle à sept points, 1 étant pas clair du tout et difficile à comprendre et 7 étant très clair et facile à comprendre.
| 7 – Très clair et facile à comprendre | 07 |
| 6 | 06 |
| 5 | 05 |
| 4 | 04 |
| 3 | 03 |
| 2 | 02 |
| 1 – Pas clair du tout et difficile à comprendre | 01 |
| NE PAS LIRE : N’a pas de contrat | 08 |
| NE PAS LIRE : N’a pas lu le contrat | 09 |
| NE PAS LIRE : Ne sait pas | 99 |
B2. Lorsque vous avez signé votre contrat ou accepté votre entente de service, le fournisseur de services a-t-il expliqué clairement les frais qui s’appliquent si vous annulez prématurément le contrat ou l’entente? Veuillez utiliser une échelle à sept points, 1 étant pas clair du tout et 7 étant très clair.
| 7 – Très clair | 07 |
| 6 | 06 |
| 5 | 05 |
| 4 | 04 |
| 3 | 03 |
| 2 | 02 |
| 1 – Pas clair du tout | 01 |
| NE PAS LIRE : N’a pas de contrat | 08 |
| NE PAS LIRE : N’a pas lu le contrat | 09 |
| NE PAS LIRE : Ne sait pas | 99 |
B3. Vous êtes-vous déjà aperçu que votre fournisseur de service avait modifié votre forfait sans vous aviser directement des modifications apportées aux modalités?
| Oui | 1 |
| Non | 2 |
| Ne sait pas | 99 |
B4. Au cours des 12 derniers mois, avez-vous porté plainte au sujet de vos services sans fil?
| Oui | 1 |
| Non | 2 |
| Ne sait pas | 99 |
B4a. [Si B4 = Oui] Auprès de qui avez-vous déposé votre plainte? [NE PAS LIRE LA LISTE]
| Commissaire aux plaintes relatives aux services de télécommunications (CPRST) | 1 |
| Conseil de la radiodiffusion et des télécommunications canadiennes (CRTC) | 2 |
| Votre fournisseur de services sans fil | 3 |
| Autre [ouvert] | 77 |
| Ne sait pas | 99 |
B4b.[B4 = Oui] Êtes-vous satisfait de la manière dont votre plainte a été traitée? Veuillez utiliser une échelle à sept points, 1 étant pas du tout satisfait et 7 étant très satisfait.
| 7 – Très satisfait | 07 |
| 6 | 06 |
| 5 | 05 |
| 4 | 04 |
| 3 | 03 |
| 2 | 02 |
| 1 – Pas du tout satisfait | 01 |
| NE PAS LIRE : Plainte encore en cours | 08 |
| NE PAS LIRE : Ne sait pas | 99 |
[POSER À TOUS]
B5. Dans quelle mesure êtes-vous au courant que vous avez le droit de déposer une plainte au sujet de vos problèmes de services sans fil auprès du Commissaire aux plaintes relatives aux services de télécommunications (CPRST)? Diriez-vous que vous êtes parfaitement au courant, vaguement au courant ou pas du tout au courant de ce droit?
| Parfaitement au courant | 3 |
| Vaguement au courant | 2 |
| Pas du tout au courant | 1 |
| Ne sait pas | 99 |
B6. Au cours de la dernière année, avez-vous reçu une facture-surprise, c’est-à-dire une facture étonnamment très élevée?
| Oui | 1 |
| Non | 2 |
| Ne sait pas | 99 |
B6a. [Si B6 = Oui] Quelle était la principale raison des frais élevés de la facture-surprise que vous avez reçue? NE PAS LIRE LA LISTE. SÉLECTIONNER TOUTES LES RÉPONSES QUI S’APPLIQUENT.
NOTE À L’INTERVIEWEUR : SI LE RÉPONDANT INDIQUE LES FRAIS D’ITINÉRANCE, DÉTERMINER S’IL S’AGIT D’ITINÉRANCE AU CANADA OU À L’ÉTRANGER.
| Frais d’itinérance - Au Canada | 01 |
| Frais d’itinérance – À l’étranger | 02 |
| Autres frais non prévus (frais d’accès au réseau, service 911, etc.) | 03 |
| Utilisation de données supérieure aux attentes | 04 |
| Temps d’antenne ou utilisation de données non expliqué | 05 |
| Frais de configuration ou de service non prévus | 06 |
| Problème/erreur/faute de facturation | 21 |
| Nombre d’appels/minutes supérieurs à la limite | 22 |
| Frais interurbains | 23 |
| On ne m’a pas donné le plan/le forfait qu’on m’avait promis | 26 |
| Autre (préciser) | 77 |
| Ne sait pas | 99 |
[POSER À TOUS]
B7. Avez-vous changé de fournisseur de services sans fil au cours des deux dernières années?
| Oui | 1 |
| Non | 2 |
| Ne sait pas | 99 |
B7a. [Si B7 = Oui] Pourquoi avez-vous changé de fournisseur de services? [NE PAS LIRE LA LISTE. SÉLECTIONNER TOUTES LES RÉPONSES QUI S’APPLIQUENT.]
| Fin du contrat | 1 |
| Non satisfait du fournisseur de services | 2 |
| Un autre fournisseur a présenté une meilleure offre | 3 |
| Besoin de remplacer le téléphone | 4 |
| Autre [ouvert] | 77 |
| Ne sait pas | 99 |
B7b.[Si B7 = Oui] A-t-il été facile de changer de fournisseur de services? Veuillez utiliser une échelle à sept points, 1 étant très difficile et 7 étant très facile.
| 7 – Très facile | 07 |
| 6 | 06 |
| 5 | 05 |
| 4 | 04 |
| 3 | 03 |
| 2 | 02 |
| 1 – Très difficile | 01 |
| NE PAS LIRE : Ne sait pas | 99 |
B7c. [Si réponse B7b = « Quelque peu ou très difficile » (B7b =03, 02 ou 01)] Pourquoi vous a-t-il été difficile de changer de fournisseur de services? [NE PAS LIRE LA LISTE. SÉLECTIONNER TOUTES LES RÉPONSES QUI S’APPLIQUENT.]
| Problèmes techniques | 01 |
| Problème pour garder le numéro de téléphone | 02 |
| Coût de résiliation de contrat élevé | 03 |
| Ne pouvait obtenir le téléphone voulu | 04 |
| Autre [ouvert] | 77 |
| Ne sait pas | 99 |
[POSER À TOUS]
B8. Le 2 décembre 2013, le Code sur les services sans fil est entré en vigueur et a établi des lignes directrices à l’intention des fournisseurs de services. Ce Code aide les consommateurs à prendre des décisions éclairées et à assurer un marché des services sans fil concurrentiel. Vous rappelez-vous clairement, vaguement, ou pas du tout si vous avez entendu ou lu quelque chose au sujet de ce Code?
| S’en rappelle clairement | 3 |
| S’en rappelle vaguement | 2 |
| Ne s’en rappelle pas | 1 |
| Ne sait pas | 99 |
B8a. [Si réponse B8 : « S’en rappelle clairement ou vaguement »] Comment en avez-vous entendu parler? [NE PAS LIRE LA LISTE. SÉLECTIONNER TOUTES LES RÉPONSES QUI S’APPLIQUENT.]
| Médias (journaux, nouvelles en ligne, télévision, radio) | 1 |
| Médias sociaux (Twitter, Facebook) | 2 |
| Un ami, parent ou autre connaissance | 3 |
| Un fournisseur de services | 4 |
| Commissaire aux plaintes relatives aux services de télécommunications (CPRST) | 5 |
| Conseil de la radiodiffusion et des télécommunications canadiennes (CRTC) | 6 |
| Autre [ouvert] | 77 |
| Ne sait pas | 99 |
[POSER À TOUS] En ce qui concerne votre contrat ou votre forfait pour votre appareil sans fil personnel…
[Note à l’intervieweur : Si le répondant dit « Je n’ai pas de forfait, je paie à la carte/de mois en mois, veuillez dire : « cette question porte sur votre entente de service ou votre forfait, peu importe que vous ayez signé un contrat pour une période de temps déterminée, que vous renouveliez de mois en mois ou que vous utilisiez des cartes prépayées. »]
B9a. S’agit-il d’un forfait individuel ou d’un forfait familial?
[Note à l’intervieweur : Si le répondant est incertain de la différence, dit « Payez-vous seulement pour vous-même, ce qui est un forfait individuel, ou partagez-vous un plan avec votre famille et payez ensemble, ce qui est forfait familial? »]
| Forfait individuel | 1 |
| Forfait familial/partagé | 2 |
| [NE PAS LIRE] Autre [PRÉCISER] | 77 |
| Ne sait pas | 99 |
B9b. Et s’agit-il d’un forfait mensuel ou d’un forfait prépayé ou à la carte?
[Note à l’intervieweur : Si le répondant est incertain de la différence, dit « Si vous payez votre facture après avoir utilisé votre service sans fil, c’est un forfait mensuel ou postpayé. Si vous payez avant avoir utilisé votre service, c’est un forfait prépayé ou à la carte. »]
| Mensuel/postpayé (paye après) | 1 |
| Prépayé/à la carte (paye avant) | 2 |
| [NE PAS LIRE] Autre [PRÉCISER] | 77 |
| Ne sait pas | 99 |
B9c1, Est-ce que des minutes pour appeler sont incluses dans votre forfait? [Note à l’intervieweur : Si nécessaire, clarifier en disant « C’est ce dont vous avez besoin pour faire ou recevoir des appels vocaux. »]
B9c2. Et, est-ce que votre forfait comprend des messages texte?
B9c3. Est-ce que votre forfait inclus des données? [Note à l’intervieweur : Si nécessaire, clarifier en disant « C’est ce dont vous avez besoin pour aller sur Internet, utiliser des applications ou vérifier vos courriels avec votre appareil sans fil. »]
| Oui | 1 |
| Non | 2 |
| Ne sait pas | 99 |
B9d. Et finalement, votre forfait est-il offert dans le cadre d’une promotion de votre employeur ou d’une association dont vous êtes membre, ce qu’on désigne souvent sous le nom de programme d’achat des employés?
| Oui | 1 |
| Non | 2 |
| Ne sait pas | 99 |
B10. Dans la liste suivante, quelest l’élément ou le service de votre contrat qui vous fâcherait le plus si votre fournisseur de service le changeait sans d’abord vous en informer ou vous consulter? [LIRE LA LISTE, SÉLECTIONNER SEULEMENT UNE RÉPONSE.]
[NOTE À L’INTERVIEWER : NE PAS LIRE « PRIX » - SÉLECTIONNER SEULEMENT SI DIT SPONTANÉMENT PAR LE RÉPONDANT]
| Les appels vocaux (SI DEMANDÉ : par exemple, le nombre de minutes ou le coût par minute) | 1 |
| Vos données (SI DEMANDÉ : par exemple, la quantité de données ou le coût des données) | 2 |
| Les messages texte (SI DEMANDÉ : par exemple, le nombre de messages texte inclus dans le plan ou le coût par message texte) | 3 |
| Les frais d’itinérance au Canada ou à l’étranger | 4 |
| Les frais de déverrouillage | 5 |
| La période d’engagement/durée du contrat | 6 |
| Un autre élément de votre contrat [Si choisi : « Quel serait cet élément? »] | 7 |
| NE PAS LIRE : Prix | 8 |
| Ne sait pas | 9 |
SI B10=8:
B10a. Quand vous dites prix, est-ce que c’est le prix des appels, des données, des messages texte ou d’un autre élément de votre contrat qui vous dérangerait le plus?
| Prix des appels vocaux |
| Prix des données |
| Prix des messages texte |
| Prix d’un autre élément |
| NE PAS LIRE : Prix (Général/Non spécifié) |
| Autre [PRÉCISER] |
| Ne sait pas |
[POSER À TOUS]
B11. J’ai maintenant une courte liste d’éléments que vous avez peut-être dans votre forfait ou que vous pourriez prendre en considération lorsque vous magasinez pour un forfait. Veuillez me dire dans quelle mesure chacun de ces éléments est important ou serait important pour vous. Veuillez utiliser une échelle à sept points, 1 étant pas du tout important et 7 étant essentiel. Qu’en est-il… [LIRE ET PRÉSENTER DE FAÇON ALÉATOIRE]
[Note à l’intervieweur : Si le répondant dit « Je n’ai pas de forfait, je paie à la carte/de mois en mois, veuillez dire : « cette question porte sur votre entente de service ou votre forfait, peu importe que vous ayez signé un contrat pour une période de temps déterminée, que vous renouveliez de mois en mois ou que vous utilisiez des cartes prépayées. »]
Note à l’intervieweur : Si le répondant dit « Ceci n’est pas inclus dans mon forfait », veuillez répondre : « À votre avis, dans quelle mesure serait-il important pour vous que ce soit inclus dans votre forfait? »]
| 7 – Essentiel | 07 |
| 6 | 06 |
| 5 | 05 |
| 4 | 04 |
| 3 | 03 |
| 2 | 02 |
| 1 – Pas du tout important | 01 |
| NE PAS LIRE : Ne sait pas | 99 |
Merci beaucoup. Voici quelques dernières questions à votre sujet et au sujet de votre ménage. Soyez assuré que vos réponses demeureront confidentielles.
D3. Quel niveau de scolarité avez-vous atteint? [LIRE LA LISTE AU BESOIN – N’INSCRIRE QU’UNE RÉPONSE]
| École primaire | 1 |
| Secondaire, sans obtenir de diplôme | 2 |
| Diplôme d’études secondaires ou l’équivalent | 3 |
| Permis d’apprentissage ou autre diplôme ou certificat de métier manuel | 4 |
| Collège, CÉGEP ou autre certificat ou diplôme non universitaire | 5 |
| Diplôme ou certificat universitaire inférieur au baccalauréat | 6 |
| Baccalauréat | 7 |
| Diplôme d’études supérieures | 8 |
| [NE PAS LIRE] Préfère ne pas répondre | 99 |
D4. Quelle est votre langue maternelle, c’est-à-dire la première langue que vous avez apprise à la maison? [Inscrire une seule réponse]
| Anglais | 1 |
| Français | 2 |
| Autre (PRÉCISER : ____________) | 8 |
| Ne sait pas ou pas de réponse | 99 |
D5. Le revenu total de votre ménage appartient à laquelle des catégories suivantes? Il s’agit du revenu combiné de tous les membres de votre ménage, avant les impôts. [LIRE LA LISTE – INSCRIRE UNE SEULE RÉPONSE]
| Moins de 20 000 $ | 1 |
| de 20 000 $ à moins de 40 000 $ | 2 |
| de 40 000 $ à moins de 60 000 $ | 3 |
| de 60 000 $ à moins de 80 000 $ | 4 |
| de 80 000 $ à moins de 100 000 $ | 5 |
| de 100 000 $ à moins de 150 000 $ | 6 |
| 150 000 $ ou plus | 7 |
| [NE PAS LIRE] Refusé | 99 |
Je n’ai plus d’autres questions pour vous. Je vous remercie de votre collaboration et du temps que vous nous avez accordé. Bonne journée!
1 For the purpose of this research, respondents were told that they were being asked about their service agreement, regardless of whether they signed a contract for a specific time period, are month-to-month or use pre-paid cards.
2 In percentage points, nineteen times out of 20