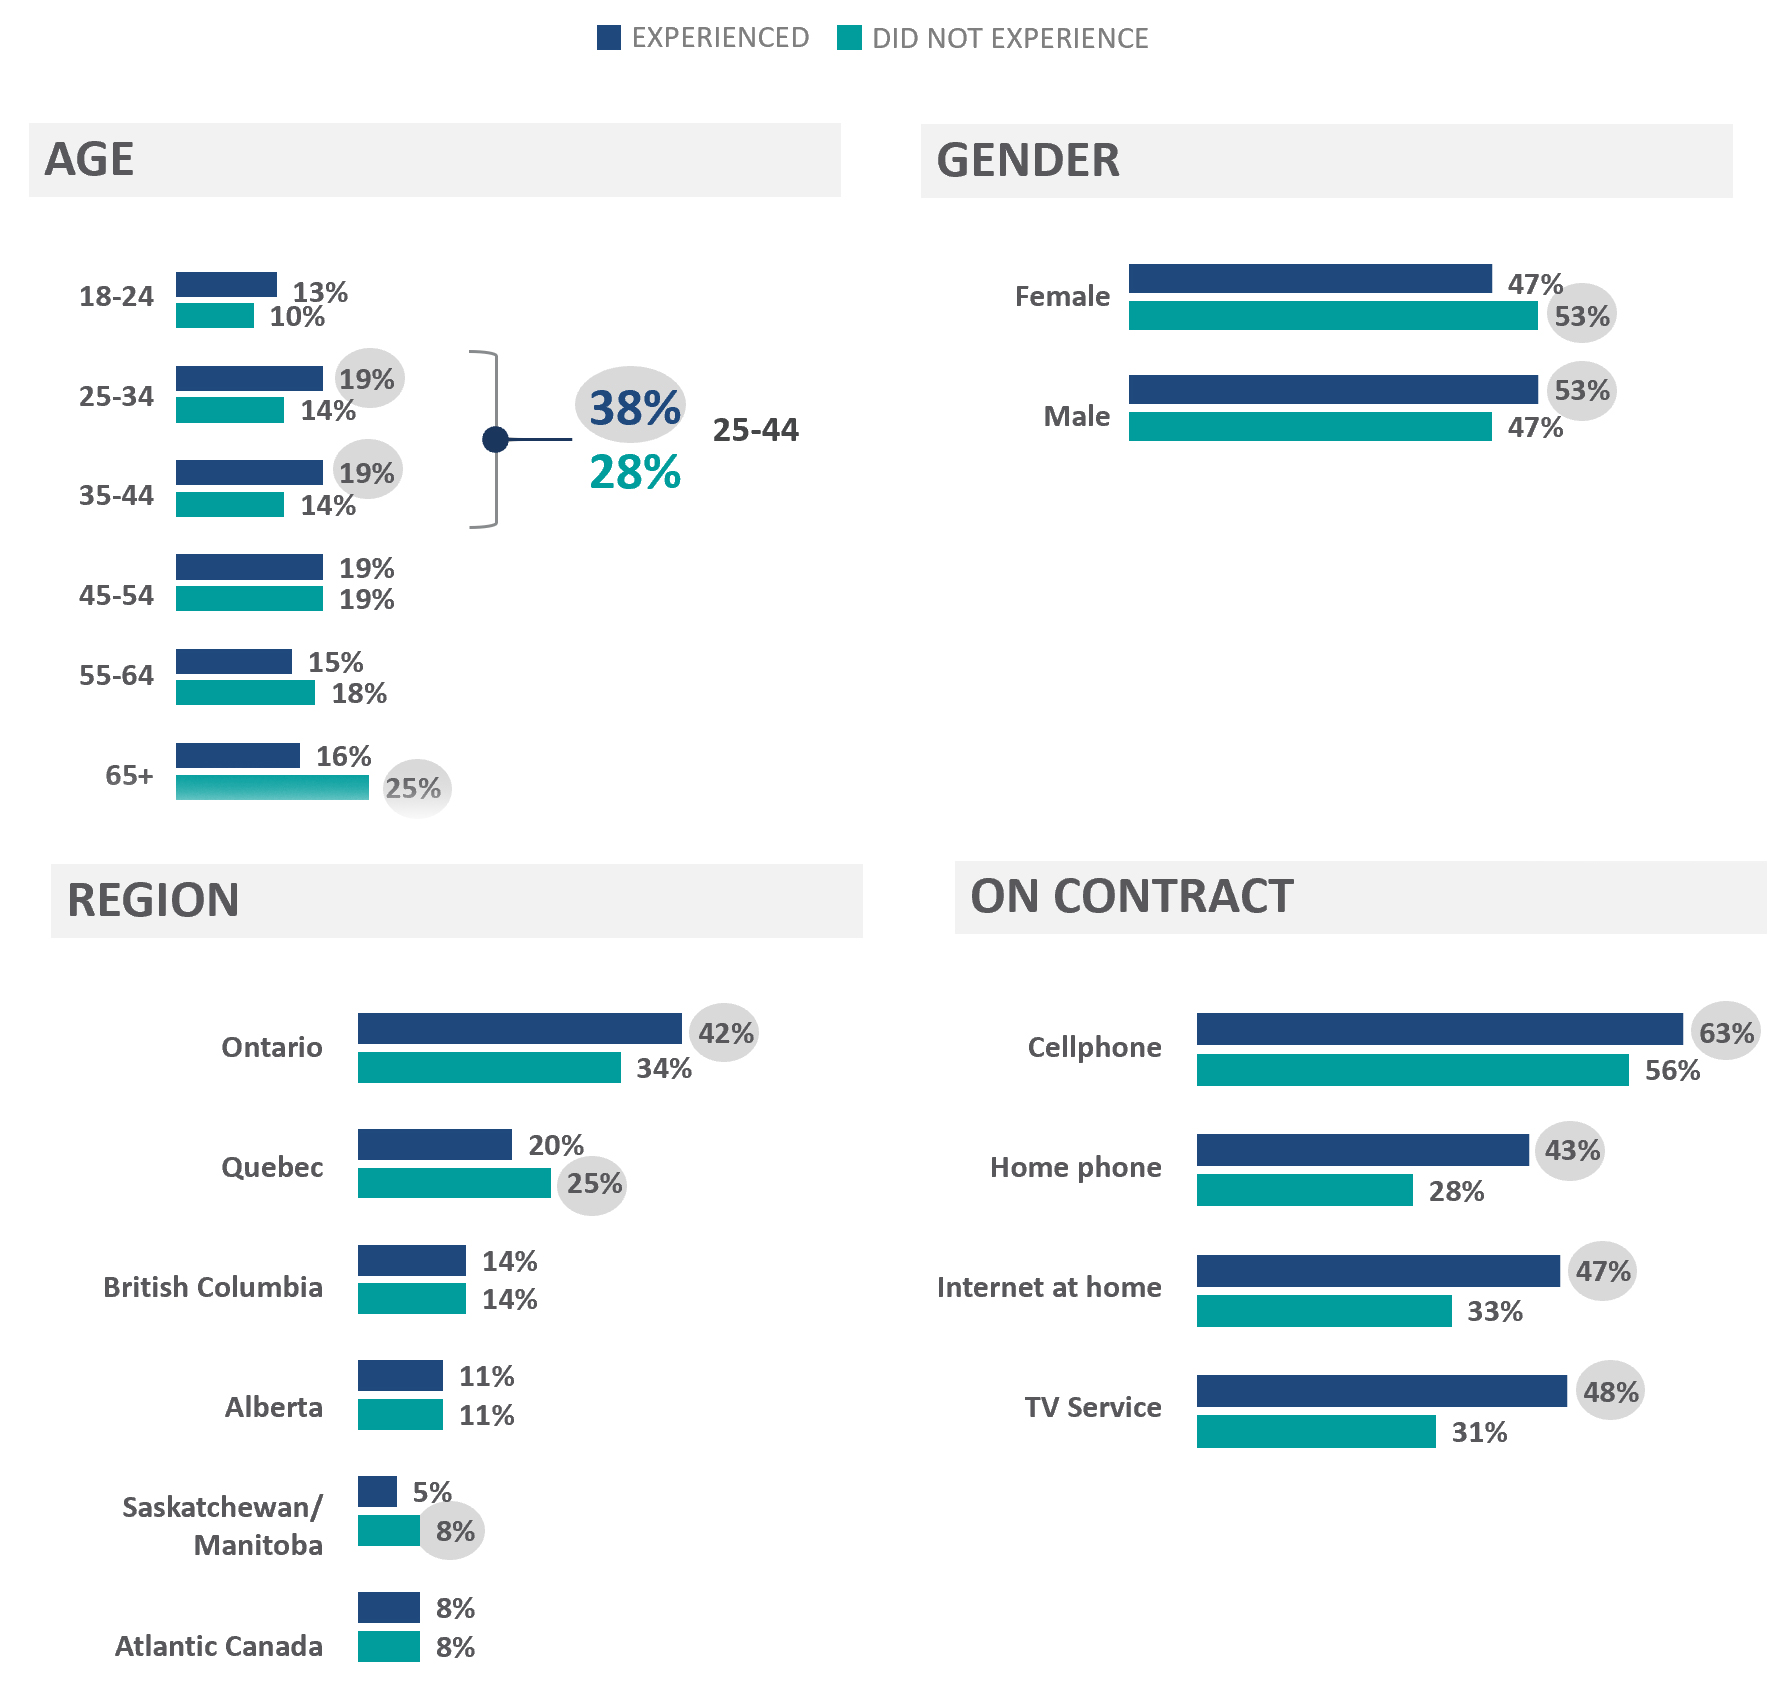
Base: Experienced aggressive or misleading sales practices (n=711), Did not experience aggressive or misleading sales practices (n=1098)
There are 4 horizontal bar charts on this figure comparing the proportion of respondents who experienced aggressive or misleading sales practices and the proportion respondents who did not experience aggressive or misleading sales practices by age, gender, region of residence and those who are on contract for the telecommunications services they currently receive. The first chart titled ‘Age’ shows comparisons by age cohorts. The proportions of the 711 respondents who experienced aggressive or misleading sales practices and the 1098 respondents who did not experience aggressive or misleading sales practices are as follows:
The second chart titled ‘Gender’ shows comparisons by gender. The proportions of the 711 respondents who experienced aggressive or misleading sales practices and the 1098 respondents who did not experience aggressive or misleading sales practices are as follows:
The third chart titled ‘Region’ shows comparisons by region of the country. The proportions of the 711 respondents who experienced aggressive or misleading sales practices and the 1098 respondents who did not experience aggressive or misleading sales practices are as follows:
The forth chart titled ‘On Contract’ shows comparisons by those who are on contract for the telecommunications services they currently receive. The proportions of the 711 respondents who experienced aggressive or misleading sales practices and the 1098 respondents who did not experience aggressive or misleading sales practices are as follows: