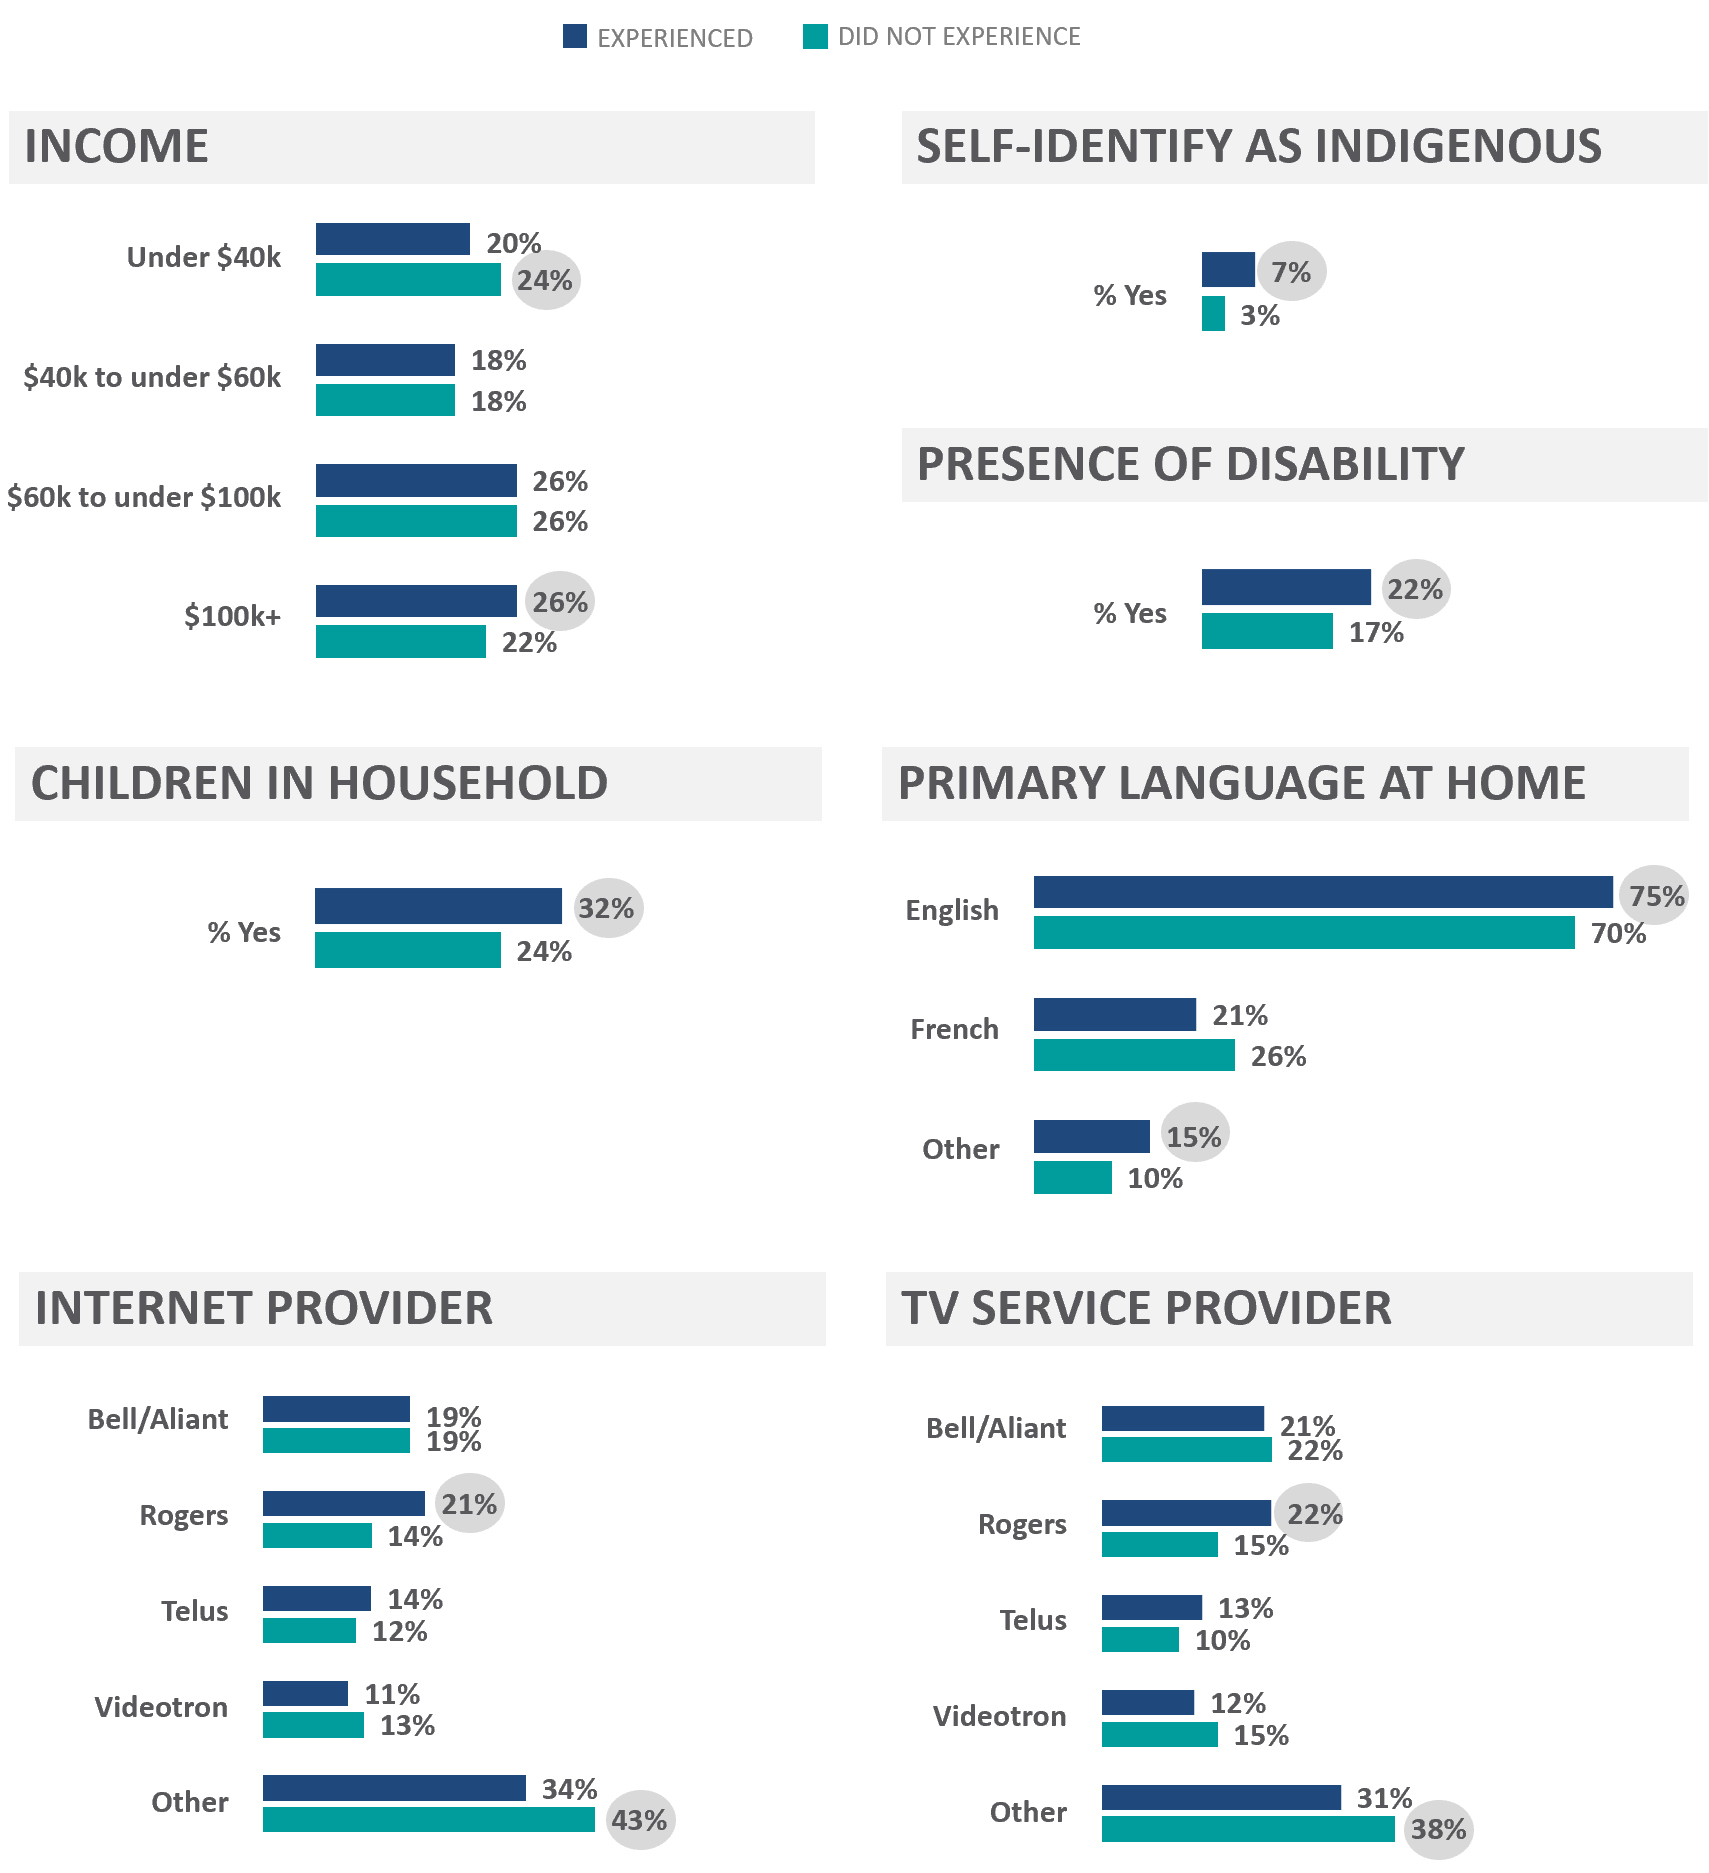
Base: Experienced aggressive or misleading sales practices (n=711), Did not experience aggressive or misleading sales practices (n=1098)
There are 7 horizontal bar charts on this figure comparing the proportion of respondents who experienced aggressive or misleading sales practices and the proportion of respondents who did not experience aggressive or misleading sales practices by income, indigenous status, presence of disability, children in household, primary language spoken at home and current internet at home and TV service provider. The first chart titled ‘Income’ shows comparisons by annual household income categories. The proportions of the 711 respondents who experienced aggressive or misleading sales practices and the 1098 respondents who did not experience aggressive or misleading sales practices are as follows:
The second chart titled ‘Self-Identify as Indigenous’ shows comparisons by those who self-identify as Indigenous. The proportions of the 711 respondents who experienced aggressive or misleading sales practices and the 1098 respondents who did not experience aggressive or misleading sales practices are as follows:
The third chart titled ‘Presence of disability’ shows comparisons by those who self-identify as having a disability. The proportions of the 711 respondents who experienced aggressive or misleading sales practices and the 1098 respondents who did not experience aggressive or misleading sales practices are as follows:
The forth chart titled ‘Children at home’ shows comparisons by those with children in the household. The proportions of the 711 respondents who experienced aggressive or misleading sales practices and the 1098 respondents who did not experience aggressive or misleading sales practices are as follows:
The fifth chart titled ‘Primary language at home’ shows comparisons by the language spoken most often in the household. The proportions of the 711 respondents who experienced aggressive or misleading sales practices and the 1098 respondents who did not experience aggressive or misleading sales practices are as follows:
The sixth chart titled ‘Internet Provider’ shows comparisons by telecommunications providers for internet at home. The proportions of the 711 respondents who experienced aggressive or misleading sales practices and the 1098 respondents who did not experience aggressive or misleading sales practices are as follows:
The seventh chart titled ‘TV Service Provider’ shows comparisons by telecommunications providers for TV service. The proportions of the 711 respondents who experienced aggressive or misleading sales practices and the 1098 respondents who did not experience aggressive or misleading sales practices are as follows: