Figure 13: Attitudes and Opinions towards aggressive or misleading sales practices - text version
Base: All Respondents (n=1809)
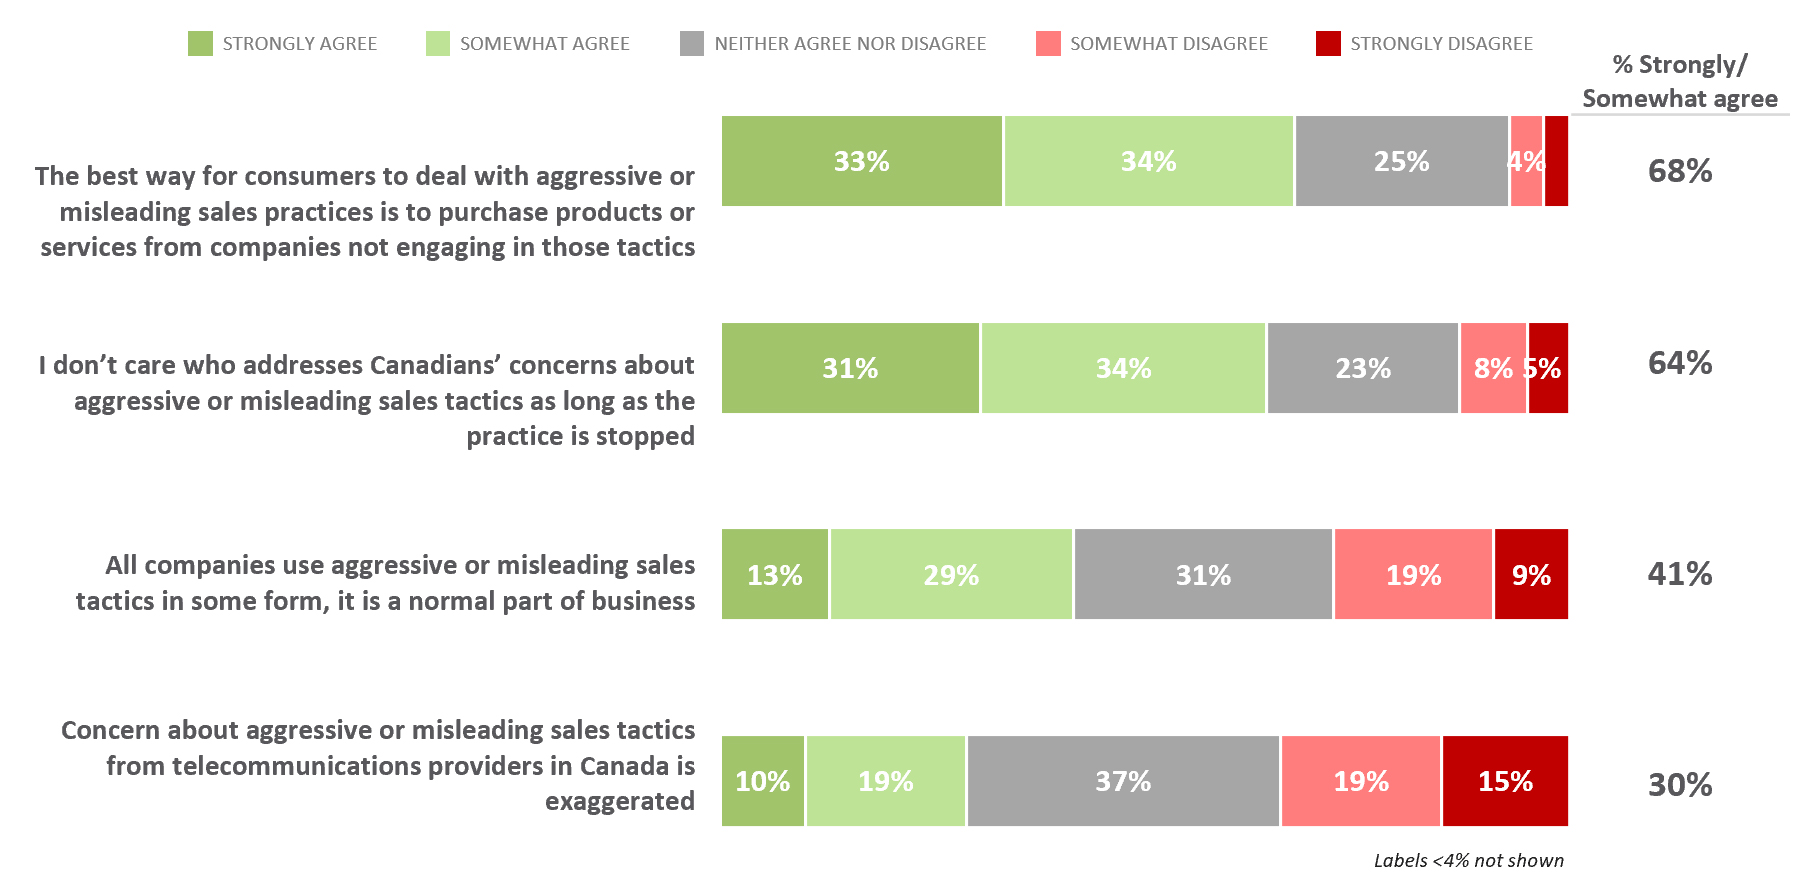
Q22. Please indicate how much you agree or disagree with the following statements.
This horizontal bar chart shows respondents level of agreement to a series of statements about attitudes and opinions towards aggressive or misleading sales practices by telecommunications providers in Canada. The chart highlights the statements with the lowest level of agreement among the list of statements asked. All 1809 respondents answered as follows:
- The best way for consumers to deal with aggressive or misleading sales practices is to purchase products or services from companies not engaging in those tactics, 33% strongly agree, 34% somewhat agree, 25% neither agree nor disagree, 4% somewhat disagree, 3% strongly disagree, 68% strongly or somewhat agree
- I don't care who addresses Canadians' concerns about aggressive or misleading sales tactics as long as the practice is stopped, 31% strongly agree, 34% somewhat agree, 23% neither agree nor disagree, 8% somewhat disagree, 5% strongly disagree, 64% strongly or somewhat agree
- All companies use aggressive or misleading sales tactics in some form and that it is a normal part of business, 13% strongly agree, 29% somewhat agree, 31% neither agree nor disagree, 19% somewhat disagree, 9% strongly disagree, 41% strongly or somewhat agree
- Concern about aggressive or misleading sales tactics from telecommunications providers in Canada is exaggerated, 10% strongly agree, 19% somewhat agree, 37% neither agree nor disagree, 19% somewhat disagree, 15% strongly disagree, 30% strongly or somewhat agree
Back to the report