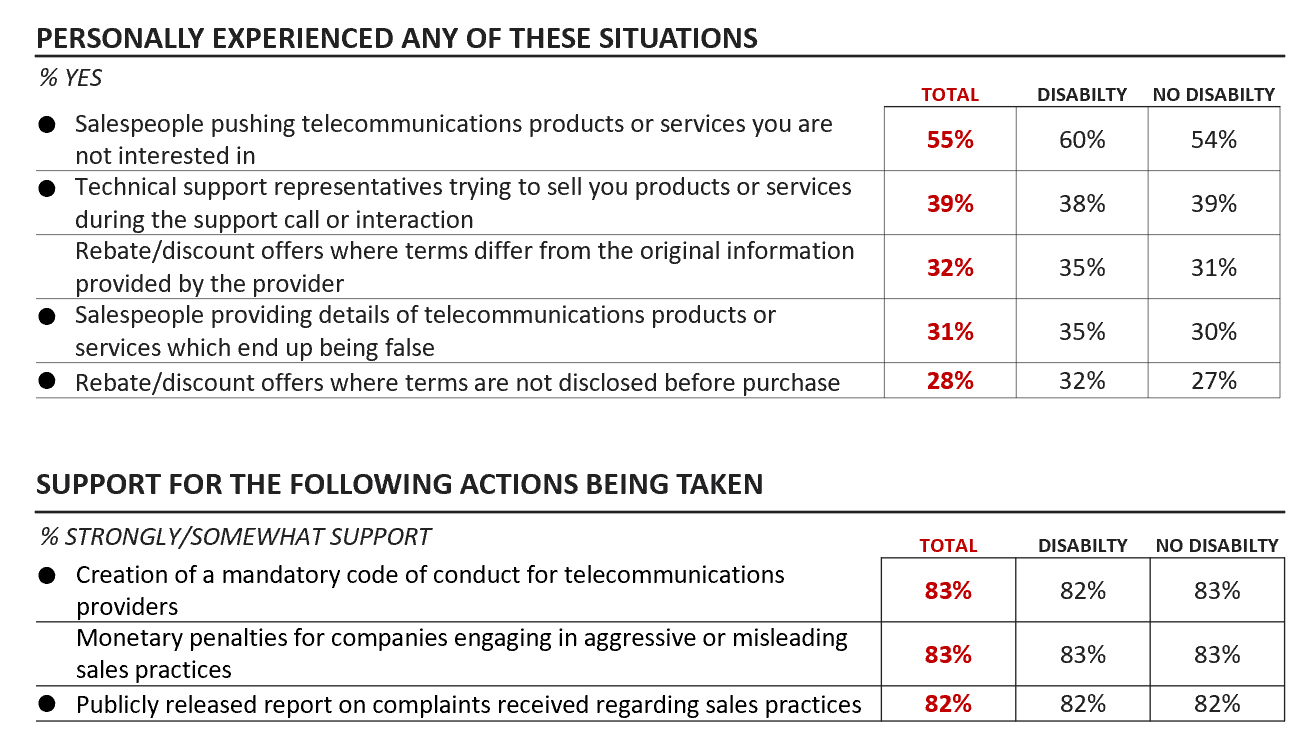
There are 2 tables in this figure comparing responses between all respondents, those who have a disability and those who do not have a disability by those who have experienced a specific set of sales practices and the level of support for a series of potential actions to address aggressive or misleading sales practices. The first table titled ‘Personally experienced any of these situations’ shows the proportions who said yes to a series of five types of sales practices. All 1809 respondents, the 338 who have a disability and 1416 who do not have a disability answered as follows:
- Salespeople pushing telecommunications products or services you are not interested in, 55% Total, 60% those with a disability, 54% those without a disability
- Technical support representatives trying to sell you products or services during the support call or interaction, 39% Total, 38% those with a disability, 39% those without a disability
- Rebate/discount offers where terms differ from the original information provided by the providers, 32% Total, 35% those with a disability, 31% those without a disability
- Salespeople providing details of telecommunications products or services which end up being false, 31% Total, 35% those with a disability, 30% those without a disability
- Rebate/discount offers where terms are not disclosed before purchase, 28% Total, 32% those with a disability, 27% those without a disability
The second table titled ‘Support for the following actions being taken’ shows the proportion who said they strongly or somewhat support each potential action presented. All 1809 respondents, the 338 who have a disability and 1416 who do not have a disability answered as follows:
- Creation of a mandatory code of conduct for telecommunications providers, 83% Total, 82% those with a disability, 83% those without a disability
- Monetary penalties for companies engaging in aggressive or misleading sales practices, 83% Total, 83% those with a disability, 83% those without a disability
- Publicly released report on complaints received regarding sales practices, 82% Total, 82% those with a disability, 82% those without a disability