Figure 27: Differences in support for action by age cohort - text version
Base: All Respondents (n=1809), 18-34 (n=469), 35-54 (n=621), 55+ (n=719)
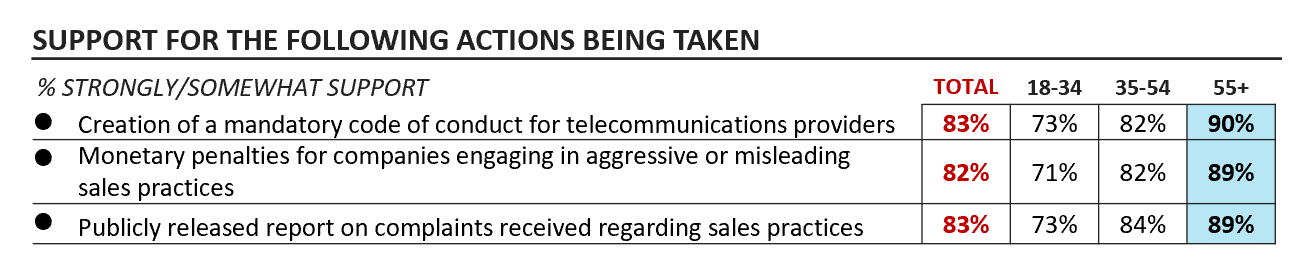
This table shows the proportion who said they strongly or somewhat support each potential action presented by all respondents and different age cohorts (18-34, 35-54, 55+). All 1809 respondents, 469 18-34 year olds, 621 35-54 year olds and 719 respondents 55 years of age or older answered as follows:
- Creation of a mandatory code of conduct for telecommunications providers, 83% Total, 73% 18-34, 82% 35-54, 90% 55+
- Monetary penalties for companies engaging in aggressive or misleading sales practices, 83% Total, 71% 18-34, 82% 35-54, 89% 55+
- Publicly released report on complaints received regarding sales practices, 82% Total, 73% 18-34, 84% 35-54, 89% 55+
Back to the report