Base: Respondents Born in Canada (n=1478), Indigenous (n=58), Non Indigenous (n=1420)
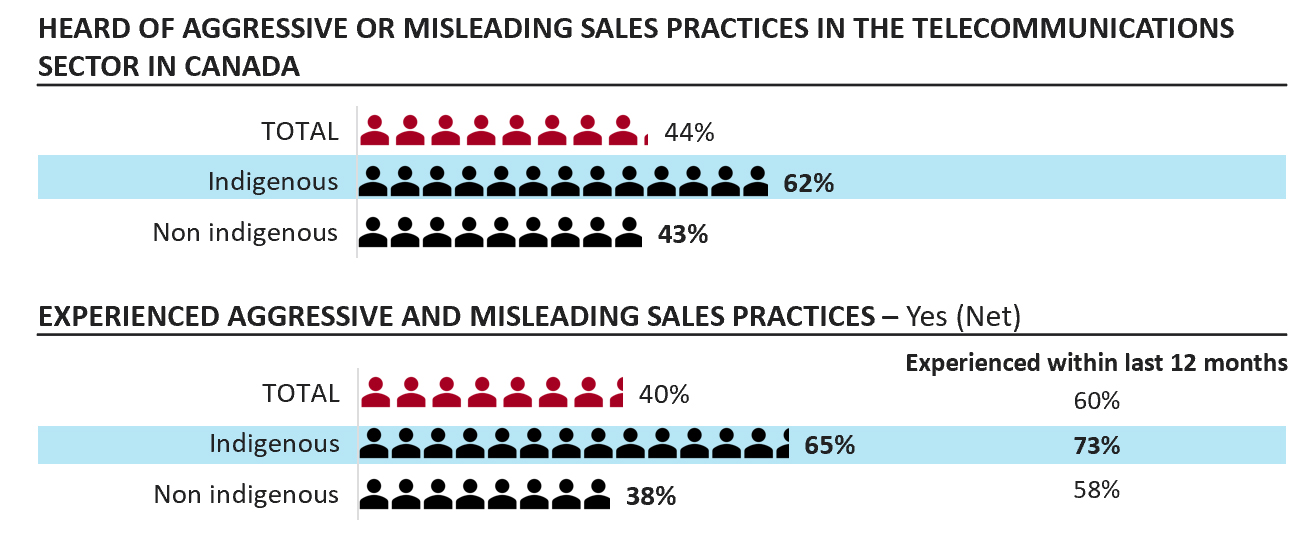
There are two icon charts in this figure comparing responses between all respondents, those who identify as Indigenous and those who do not identify as Indigenous by awareness of aggressive or misleading sales practices and those who experienced sales practices they consider aggressive or misleading. The first icon chart titled ‘Heard of aggressive or misleading sales practices in the telecommunications sector in Canada’ shows the proportion who said yes they have heard of the issue. All 1809 respondents, 58 Indigenous respondents and 1420 respondents who do not identify as Indigenous answered as follows:
The second icon chart titled ‘Experienced aggressive or misleading sales practices’ shows the proportion who said yes they experienced sales practices they consider aggressive or misleading and among those who have experienced such sales practices the proportion who indicate it took place within the last 12 months. All 1809 respondents, 58 Indigenous respondents and 1420 respondents who do not identify as Indigenous answered as follows: