Base: Respondents Born in Canada (n=1478), Indigenous (n=58), Non Indigenous (n=1420)
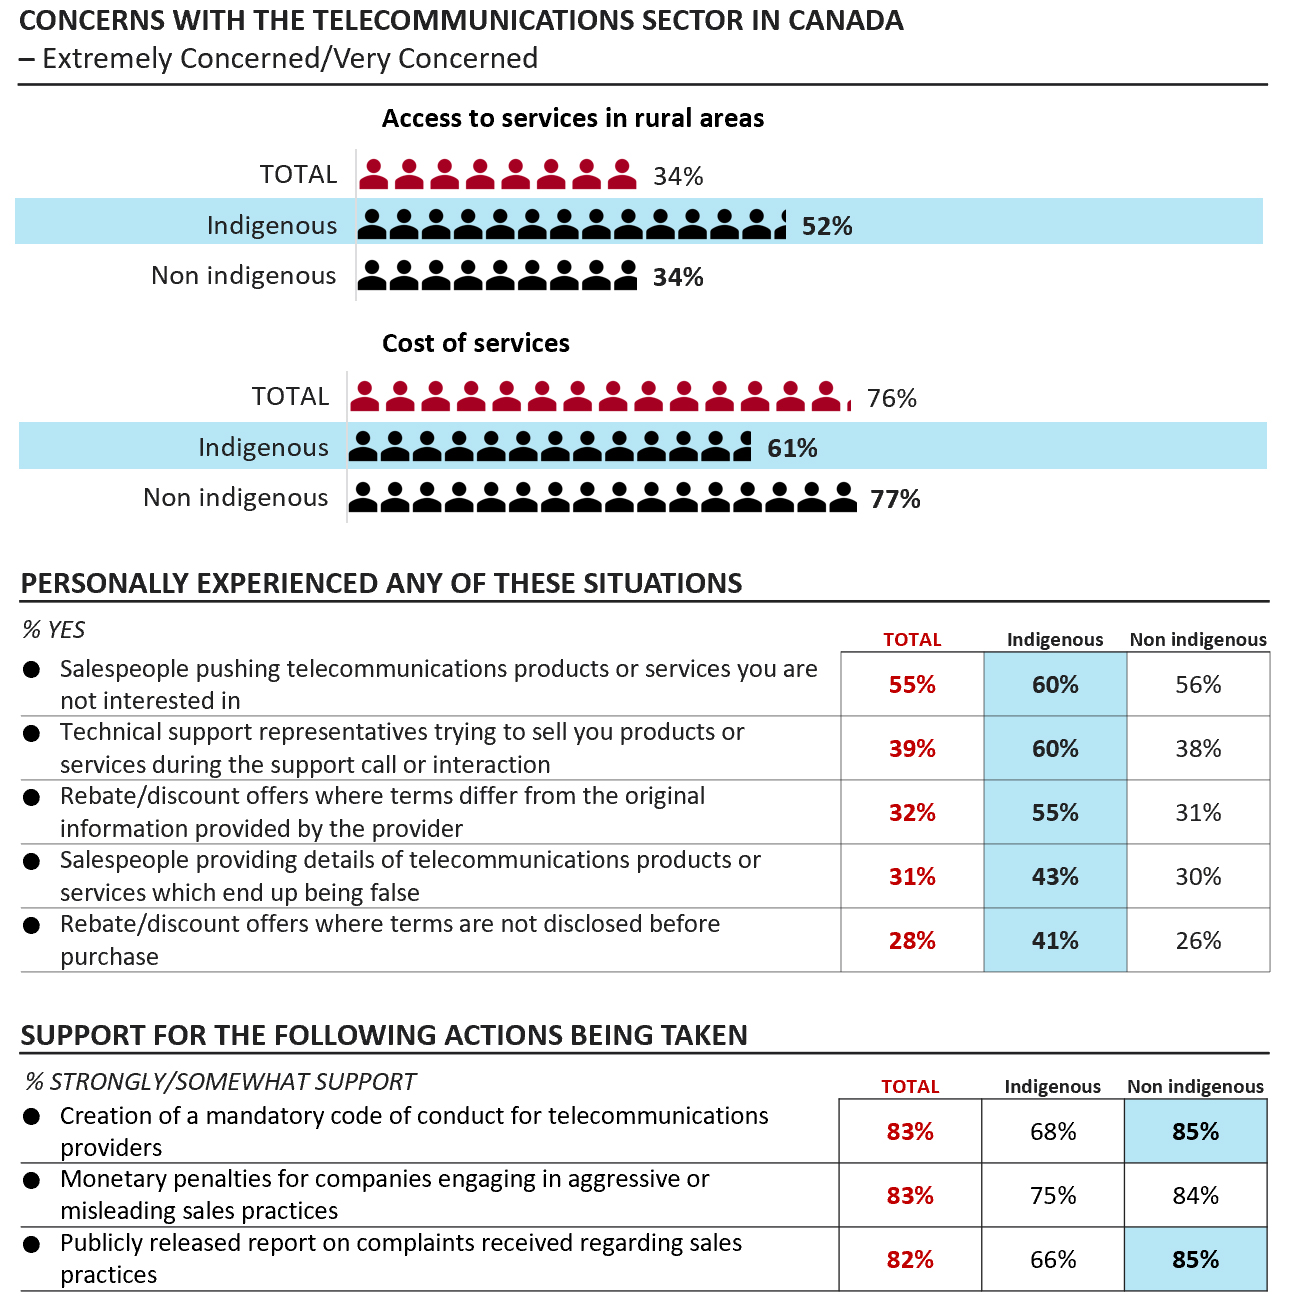
There is one icon chart and two tables in this figure comparing responses between all respondents, those who identify as Indigenous and those who do not identify as Indigenous by level of concern with aspects of the telecommunications sector, those who experienced a specific set of sales practices and support for a series of potential actions to address aggressive or misleading sales practices. The icon chart titled ‘Concerns with the telecommunications sector in Canada’ shows the proportion who said they are extremely or very concerned with access to services in rural areas and cost of services. All 1809 respondents, 58 Indigenous respondents and 1420 respondents who do not identify as Indigenous answered as follows:
The first table titled ‘Personally experienced any of these situations’ shows the proportions who said yes they experienced a series of five types of sales practices. All 1809 respondents, 58 Indigenous respondents and 1420 respondents who do not identify as Indigenous answered as follows:
The second table titled ‘Support for the following actions being taken’ shows the proportion who said they strongly or somewhat support each potential action presented. All 1809 respondents, 58 Indigenous respondents and 1420 respondents who do not identify as Indigenous answered as follows: