Final Report
Prepared for Canadian Radio-television and Telecommunications
January 2020
Supplier name: Phoenix Strategic Perspectives Inc.
Contract Number: 82082-200063/001/CY
Contract Value: $83,043.36 (including HST)
Award Date: 2019-06-07
Delivery Date: 2020-01-20
Registration Number: POR 020-19
For more information on this report, please contact the Canadian Radio-television and Telecommunications at: communications@crtc.gc.ca.
Ce rapport est aussi disponible en français.
The Canadian Radio-television and Telecommunications Commission (CRTC) commissioned Phoenix Strategic Perspectives Inc. (Phoenix SPI) to conduct research to better understand the needs, behaviours and habits of Canadians when it comes to wireless services.
In recent years, Canadians have come to rely on mobile wireless services in many aspects of their lives: to communicate with each other, for entertainment, to conduct business, to interact with all levels of government, and to further their education. At the same time, mobile wireless services are enabling Canadian businesses to increase efficiency and productivity, which in turn enables them to remain competitive in the global marketplace.
The retail mobile wireless service market continues to be the largest and fastest-growing telecommunications market sector in Canada. In 2018, retail mobile wireless services generated revenues of $27.1 billion, representing an increase of $2.6 billion, or 10.7%, over 2017 revenues. The number of Canadian subscribers continues to grow, with total subscribers reaching 33.2 million in 2018, an increase of 4.8% from the previous year.
In Telecom Notice of Consultation 2019-57, issued on February 28, 2019, the CRTC began a proceeding to review the wireless market with a focus on: (1) competition in the retail market, (2) wholesale regulation, and (3) the future of mobile wireless services in Canada. Interested parties will make written submissions on each of these issues and will also make oral representations at a public hearing. Parties’ submissions will be considered by the Commission, and ultimately the Commission will determine if any changes to the regulatory regime are required to ensure: (1) the regulatory regime remains relevant, (2) the needs of Canadians continue to be met, and (3) the policy objectives set out in the Telecommunications Act are being achieved.
The CRTC engaged the services of Phoenix SPI to conduct a study designed to help the Commission better understand the needs, behaviours and habits of Canadians when it comes to mobile wireless services. This resulted in two reports, both on the public record of the proceeding: (1) A public opinion research (POR) report; and (2) a consultation report.
This study involved two initiatives: POR and a consultation. The POR involved a representative telephone survey to understand the views of Canadians on related issues. The results of that survey are presented under separate cover. In addition to the representative telephone sample, the questionnaire was made available online for completion on a voluntary basis by all Canadians. This consultation offered Canadians who have an interest in the subject an opportunity to provide feedback to the CRTC. In total, 28,705 Canadians who indicated that they have a personal cell phone completed the online questionnaire between December 3 and 31, 2019. The results of this consultation are not representative of the Canadian population.
Rogers, Telus and Bell top list of cell phone providers
When asked which cell phone provider participants use, most mentioned Rogers (19%), Telus (18%) and Bell Mobility (16%). The full range of cell phone providers identified by respondents can be found in figure 1.
Figure 1: Cell phone provider
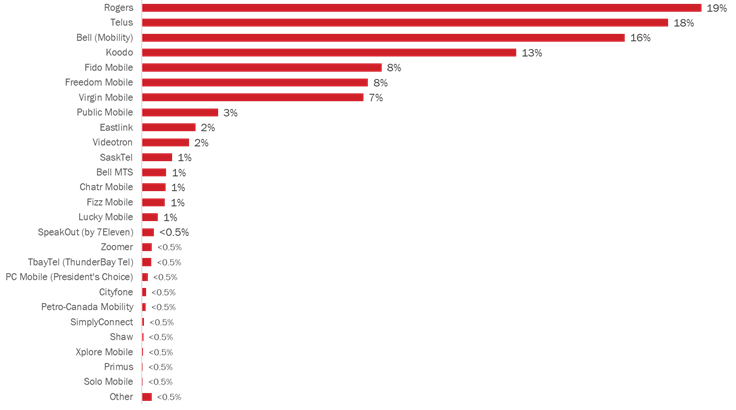
Figure 1: Cell phone provider
Q2. Who is your cell phone provider?
|
Answer |
Percent of respondents |
|---|---|
|
Rogers |
19% |
|
Telus |
18% |
|
Bell (Mobility) |
16% |
|
Koodo |
13% |
|
Fido Mobile |
8% |
|
Freedom Mobile |
8% |
|
Virgin Mobile |
7% |
|
Public Mobile |
3% |
|
Videotron |
2% |
|
Eastlink |
2% |
|
SaskTel |
1% |
|
Chatr Mobile |
1% |
|
Bell MTS |
1% |
|
Fizz Mobile |
1% |
|
Lucky Mobile |
1% |
|
Zoomer |
<0.5% |
|
SimplyConnect |
<0.5% |
|
Iristel |
<0.5% |
|
Cityfone |
<0.5% |
|
Sogetel |
<0.5% |
|
Shaw |
<0.5% |
|
TbayTel (ThunderBay Tel) |
<0.5% |
|
Other |
<1% |
Base: n=28,705; all respondents
Q2. Who is your cell phone provider?
Base: n=28,705; all respondents
Almost all participants have data included in their cell phone plans
Ninety-four percent say they have data included in their cell phone plans. As presented in figure 2, the amount of data included in plans varies from under 1 GB (4%) to unlimited (7%). Additionally, 5% say they do not have data included in their cell phone plans, while very few (1%) have a “pre-paid” or “pay as you go” plan which includes no data.
Figure 2: Data included in cell phone plan
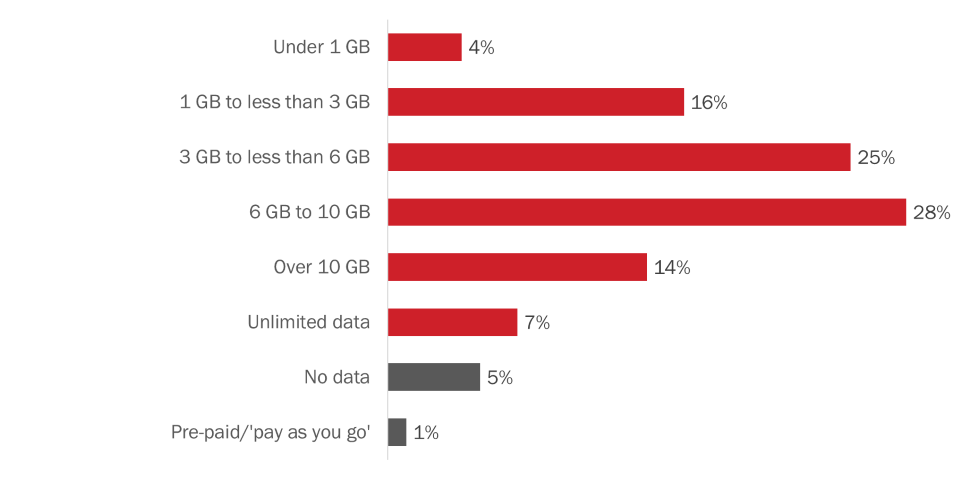
Figure 2: Data included in cell phone plan
Q3. How much data is included in your cell phone plan?
|
Answer |
Percent of respondents |
|---|---|
|
Under 1 GB |
4% |
|
1 GB to less than 3 GB |
16% |
|
3 GB to less than 6 GB |
25% |
|
6 GB to 10 GB |
28% |
|
Over 10 GB |
14% |
|
Unlimited data |
7% |
|
No data |
5% |
|
Pre-paid/'pay as you go' |
1% |
Base: n=28, 705; all respondents.
Q3. How much data is included in your cell phone plan?
Base: n=28, 705; all respondents.
One in six say they bundle cell phone service with other services
Sixteen percent of respondents who subscribe to a wireless plan bundle their cell phone service with other services from their provider. The majority (84%) do not.
Figure 3: Bundling cell phone services
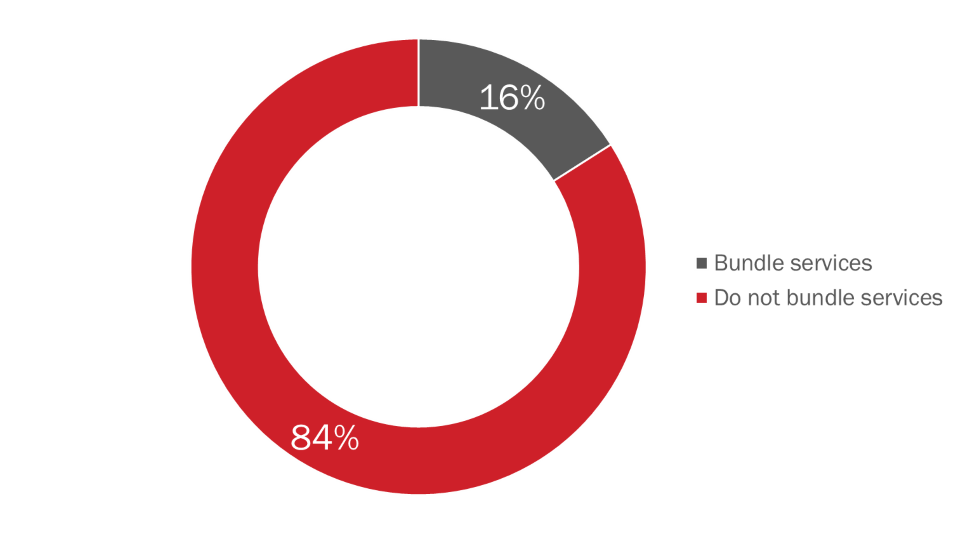
Figure 3: Bundling cell phone services
Q4. Do you bundle your cell phone service with other services from your provider?
|
Answer |
Percent of respondents |
|---|---|
|
Bundle services |
16% |
|
Do not bundle services |
84% |
Base: n=28,304; all respondents who subscribe to a wireless plan.
Q4. Do you bundle your cell phone service with other services from your provider?
Base: n=28,304; all respondents who subscribe to a wireless plan.
Half are satisfied with their cell phone provider
Half (55%) say they are satisfied with their current cell phone provider, although satisfaction is more likely to be moderate than high.
Figure 4: Satisfaction with current cell phone provider
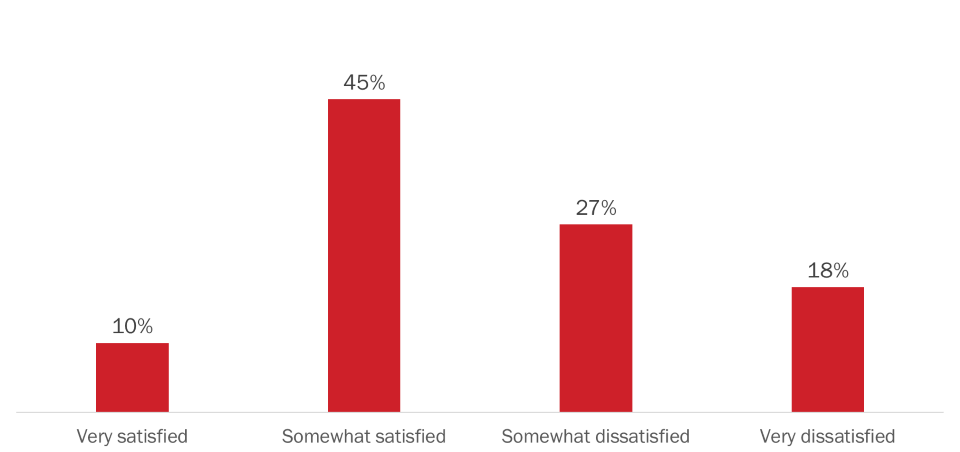
Figure 4: Satisfaction with current cell phone provider
Q5. Are you very satisfied, somewhat satisfied, somewhat dissatisfied, or very dissatisfied with your current cell phone provider?
|
Answer |
Percent of respondents |
|---|---|
|
Very satisfied |
10% |
|
Somewhat satisfied |
45% |
|
Somewhat dissatisfied |
27% |
|
Very dissatisfied |
18% |
Base: n= 28,705; all respondents.
Q5. Are you very satisfied, somewhat satisfied, somewhat dissatisfied, or very dissatisfied with your current cell phone provider?
Base: n= 28,705; all respondents.
Cost is main reason for dissatisfaction with cell phone providers
Participants who are dissatisfied with their current cell phone provider (n=12,873) attribute their dissatisfaction to the cost—specifically: the cost of their cell phone service (87%), the data (86%), and overage charges (53%). The full range of reasons are depicted in figure 5.
Figure 5: Reasons for dissatisfaction with current cell phone provider
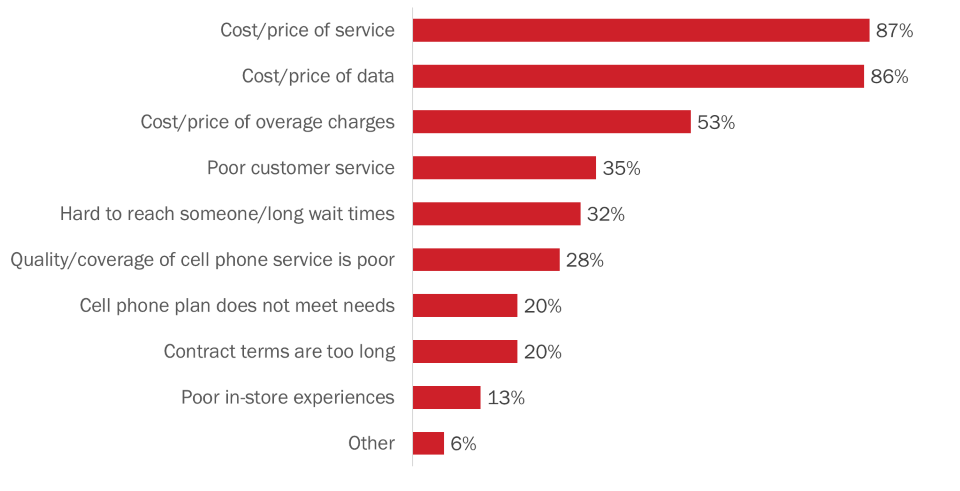
Figure 5: Reasons for dissatisfaction with current cell phone provider
Q6. Why are you dissatisfied with your current cell phone provider? [multiple responses accepted]
|
Answer |
Percent of respondents |
|---|---|
|
Cost/price of service |
87% |
|
Cost/price of data |
86% |
|
Cost/price of overage charges |
53% |
|
Poor customer service |
35% |
|
Hard to reach someone/long wait times |
32% |
|
Quality/coverage of cell phone service is poor |
28% |
|
Cell phone plan does not meet needs |
20% |
|
Contract terms are too long |
20% |
|
Poor in-store experiences |
13% |
|
Other |
6% |
Base: n= 12,873; respondents who were dissatisfied with their current cell phone providers.
Q6. Why are you dissatisfied with your current cell phone provider? [multiple responses accepted]
Base: n= 12,873; respondents who were dissatisfied with their current cell phone providers.
Three in four have switched providers; 74% did so within the last 5 years
Three-quarters of participants with a cell phone say they have switched cell phone providers. Among those who switched providers (n=21,361), 74% did so within the last five years. In contrast, one in four say they last switched cell phone providers five or more years ago.
Figure 6: Switching cell phone providers
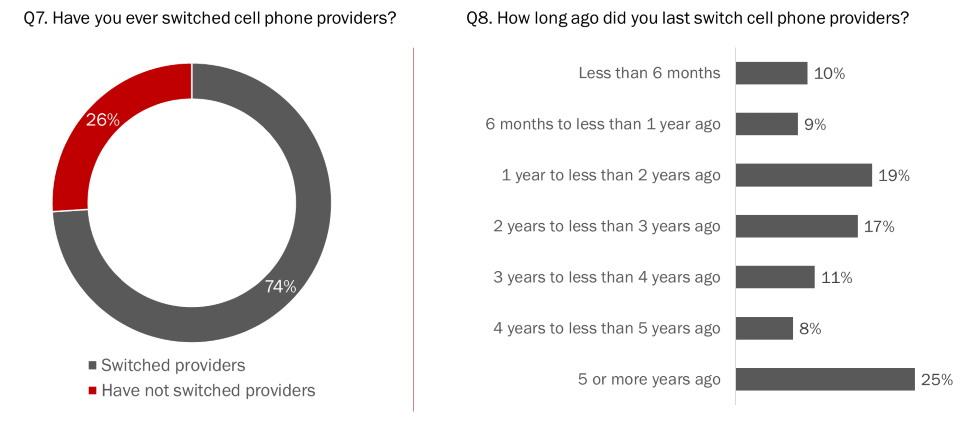
Figure 6: Switching cell phone providers
Q7. Have you ever switched cell phone providers?
|
Answer |
Percent of respondents |
|---|---|
|
Switched providers |
74% |
|
Have not switched providers |
26% |
Base: n=28,705; all respondents.
Q8. How long ago did you last switch cell phone providers?
|
Answer |
Percent of respondents |
|---|---|
|
Less than 6 months |
10% |
|
6 months to less than 1 year ago |
9% |
|
1 year to less than 2 years ago |
19% |
|
2 years to less than 3 years ago |
17% |
|
3 years to less than 4 years ago |
11% |
|
4 years to less than 5 years ago |
8% |
|
5 or more years ago |
25% |
Base: n=21,361; respondents who switched providers.
[LEFT] Q7. Have you ever switched cell phone providers? [RIGHT] Q8. How long ago did you last switch cell phone providers?
Base: n=28,705; all respondents. Base: n=21,361; respondents who switched providers.
Respondents stayed with current provider because it would be too much hassle to switch
Participants who have not switched cell phone providers (n=7,344) were asked why they have chosen to stay with their current provider. The main reason respondents stayed with their current provider was because they think it would be too much effort or hassle to switch (mentioned by 39% of those who provided feedback). The full range of reasons are depicted in figure 7.
Figure 7: Reasons for staying with current cell phone provider
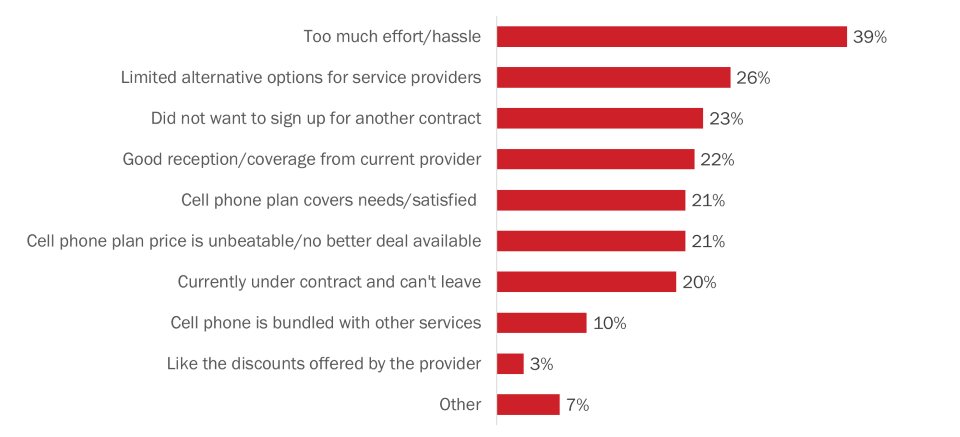
Figure 7: Reasons for staying with current cell phone provider
Q9. What is the main reason you have stayed with your current cell phone provider? [multiple responses accepted]
|
Answer |
Percent of respondents |
|---|---|
|
Too much effort/hassle |
39% |
|
Limited alternative options for service providers |
26% |
|
Did not want to sign up for another contract |
23% |
|
Good reception/coverage from current provider |
22% |
|
Cell phone plan covers needs/satisfied |
21% |
|
Cell phone plan price is unbeatable/no better deal available |
21% |
|
Currently under contract and can't leave |
20% |
|
Cell phone is bundled with other services |
10% |
|
Like the discounts offered by the provider |
3% |
|
Other |
7% |
Base: n=7,344; respondents who stayed with their current cell phone providers.
Q9. What is the main reason you have stayed with your current cell phone provider? [multiple responses accepted]
Base: n=7,344; respondents who stayed with their current cell phone providers.
Experience and perceptions of switching cell phone providers do not align
Just over two-thirds (68%) of those who switched cell phone providers (n=21,361) say it was somewhat or very easy to do. In contrast, only 34% of those who have not switched cell phone providers (n=7,344) think it would be easy to do, while two-thirds (66%) say it would be difficult to switch providers.
Figure 8: Ease of switching cell phone provider: Experience + Perceptions
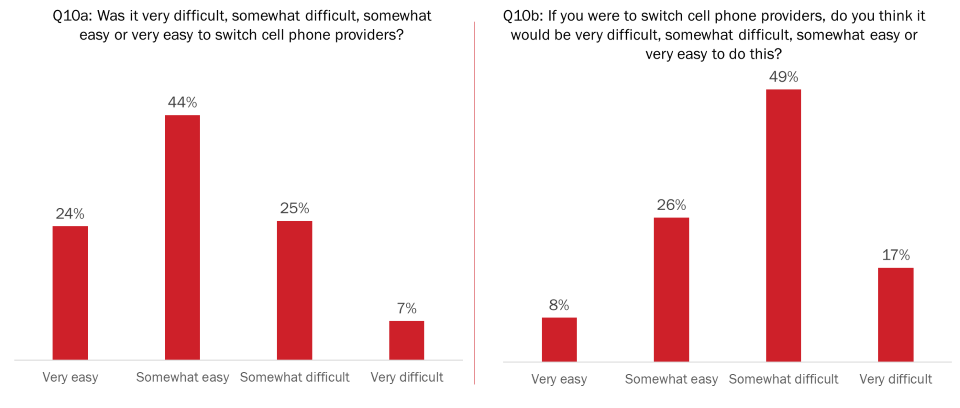
Figure 8: Ease of switching cell phone provider: Experience + Perceptions
Q10a: Was it very difficult, somewhat difficult, somewhat easy or very easy to switch cell phone providers?
|
Answer |
Percent of respondents |
|---|---|
|
Very easy |
24% |
|
Somewhat easy |
44% |
|
Somewhat difficult |
25% |
|
Very difficult |
7% |
Base: n= 21,361; respondents who switched cell phone providers.
Q10b: If you were to switch cell phone providers, do you think it would be very difficult, somewhat difficult, somewhat easy or very easy to do this?
|
Answer |
Percent of respondents |
|---|---|
|
Very easy |
8% |
|
Somewhat easy |
26% |
|
Somewhat difficult |
49% |
|
Very difficult |
17% |
Base: n= 7,344; respondents who haven’t switched cell phone providers.
[LEFT] Q10a: Was it very difficult, somewhat difficult, somewhat easy or very easy to switch cell phone providers?
Base: n= 21,361; respondents who switched cell phone providers.
[RIGHT] Q10b: If you were to switch cell phone providers, do you think it would be very difficult, somewhat difficult, somewhat easy or very easy to do this?
Base: n= 7,344; respondents who haven’t switched cell phone providers.
More than half the participants are not likely to switch cell phone providers
Nearly six in 10 (57%) participants say they are not likely to switch cell phone providers at the end of their contract.
Figure 9: Likelihood of switching cell phone providers
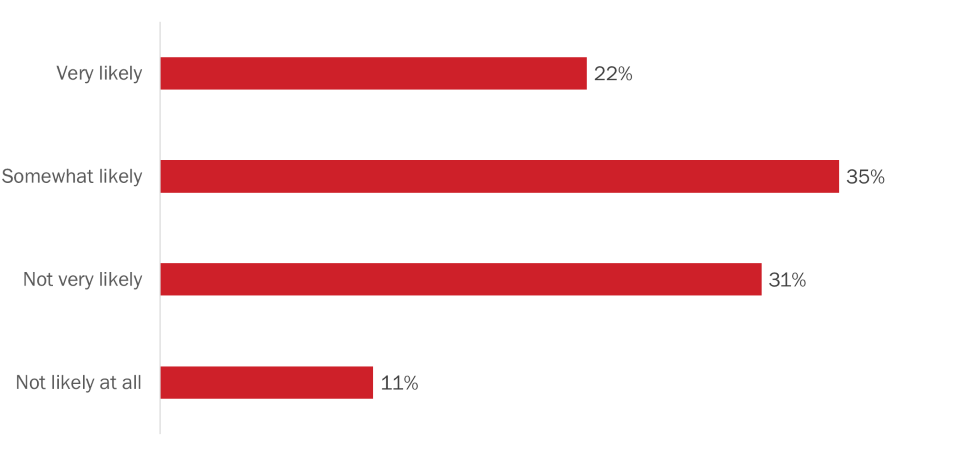
Figure 9: Likelihood of switching cell phone providers
Q11. At the end of your contract with your current cell phone provider, will you be very likely, somewhat likely, not very likely or not at all likely to consider switching to another provider?
|
Answer |
Percent of respondents |
|---|---|
|
Very likely |
22% |
|
Somewhat likely |
35% |
|
Not very likely |
31% |
|
Not likely at all |
11% |
Base: n= 28,705; all respondents.
Q11. At the end of your contract with your current cell phone provider, will you be very likely, somewhat likely, not very likely or not at all likely to consider switching to another provider?
Base: n= 28,705; all respondents.
Half of those who told their provider they planned to switch were rewarded
Fifty-four percent of participants say they told their cell phone provider they plan to switch to another provider in order to lower their bill. Additionally, of those who have done so (n=15,477), half say their provider offered them a better cell phone package or the same package at a lower price to stay.
Figure 10: Negotiating with cell phone providers
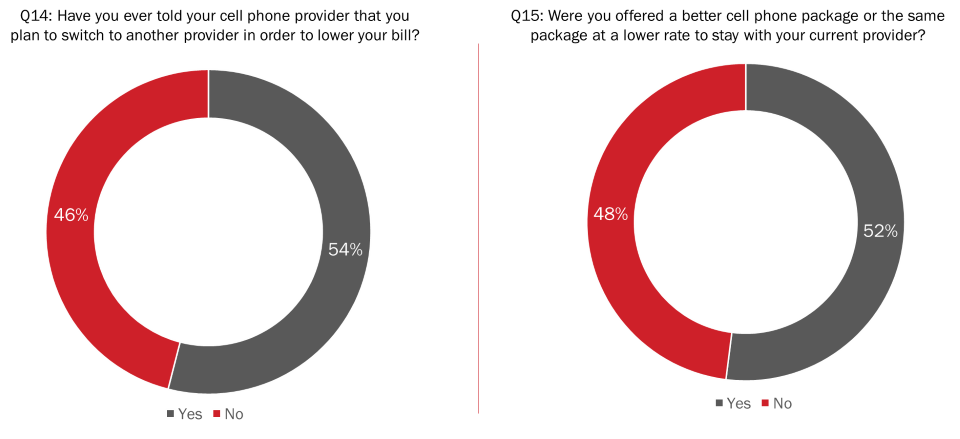
Figure 10: Negotiating with cell phone provider
Q14: Have you ever told your cell phone provider that you plan to switch to another provider in order to lower your bill?
|
Answer |
Percent of respondents |
|---|---|
|
Yes |
54% |
|
No |
46% |
Base: n= 28,705; all respondents.
Q15: Were you offered a better cell phone package or the same package at a lower rate to stay with your current provider?
|
Answer |
Percent of respondents |
|---|---|
|
Yes |
52% |
|
No |
48% |
Base: n= 15,477; those who told their provider they’re leaving to lower their bill.
[LEFT] Q14: Have you ever told your cell phone provider that you plan to switch to another provider in order to lower your bill?
Base: n= 28,705; all respondents.
[RIGHT] Q15: Were you offered a better cell phone package or the same package at a lower rate to stay with your current provider?
Base: n= 15,477; those who told their provider they’re leaving to lower their bill.
Half would consider switching to a flanker brand
Nearly six in 10 of those who provided feedback do not use a flanker brand for their cell phone services. When these respondents (n=16,766) were asked if they would ever consider switching to a flanker brand, 54% say they would consider it.
Participants were provided with the following description of a flanker brand:
“A flanker brand is a brand used by a large cell phone provider to offer services and plans under a different name and often at a lower price. For example, Virgin mobile, FIDO, and Koodo are flanker brands.”
Figure 11: Switching to a Flanker Brand
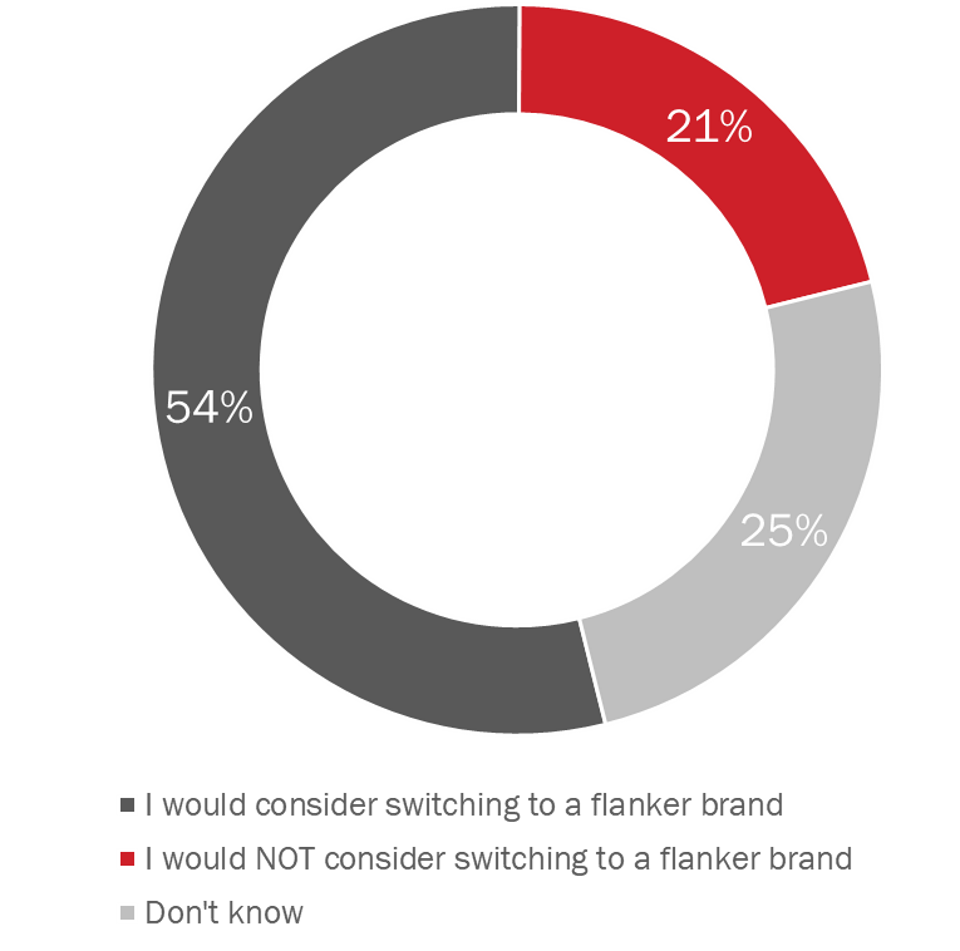
Figure 11: Switching to a Flanker Brand
Q12: Would you ever consider switching to a flanker brand?
|
Answer |
Percent of respondents |
|---|---|
|
Yes |
54% |
|
No |
21% |
|
I don't know |
25% |
Base: n= 16,765; respondents who do not use a flanker brand.
Q12: Would you ever consider switching to a flanker brand?
Base: n= 16,765; respondents who do not use a flanker brand.
Concerns about quality/coverage is the main reason for not considering a flanker brand
When asked why they would not switch to a flanker brand, nearly two-thirds (64%) pointed to concerns about the quality or coverage of flanker brands. The full range of reasons are depicted in figure 12.
Figure 12: Reasons for not switching to a Flanker Brand
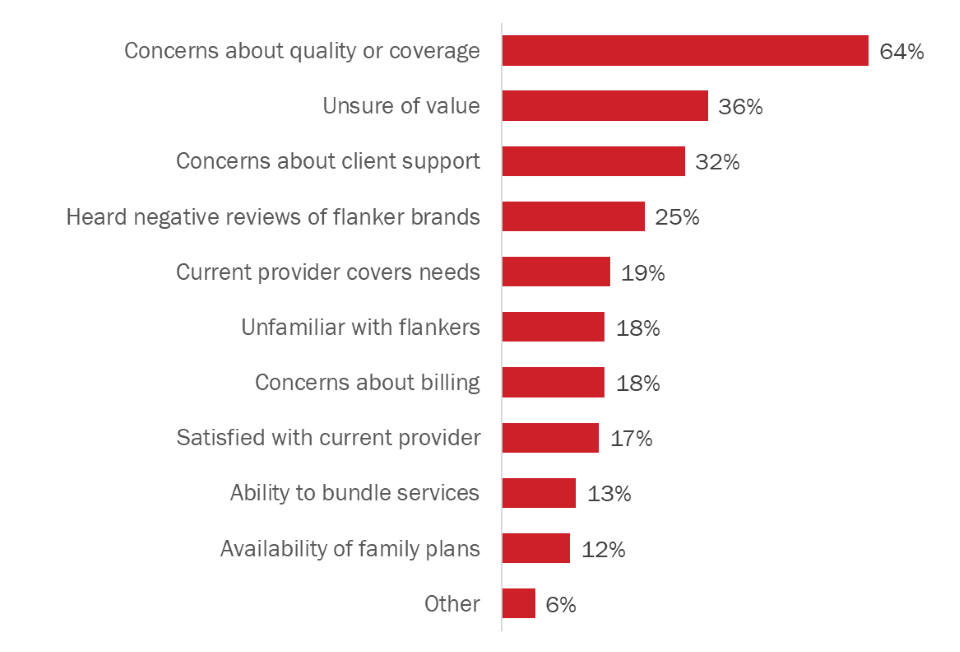
Figure 12: Reasons for not switching to a Flanker Brand
Q13: Why would you not consider switching to a flanker brand?
|
Answer |
Percent of respondents |
|---|---|
|
Concerns about quality or coverage |
64% |
|
Unsure of value |
36% |
|
Concerns about client support |
32% |
|
Heard negative reviews of flanker brands |
25% |
|
Current provider covers needs |
19% |
|
Unfamiliar with flankers |
18% |
|
Concerns about billing |
18% |
|
Satisfied with current provider |
17% |
|
Ability to bundle services |
13% |
|
Availability of family plans |
12% |
|
Other |
6% |
Base: n= 3,480; respondents who wouldn’t switch to a flanker brand. [multiple responses accepted]
Q13: Why would you not consider switching to a flanker brand?
Base: n= 3,480; respondents who wouldn’t switch to a flanker brand
[Multiple responses accepted]
Varying perceptions of Canada’s cell phone services
Participants were asked to rate their level of agreement with the following statements:
The majority agree that their cell phone calls are almost never dropped (58%, with 29% saying they strongly agree). Forty-four percent are happy with the upload and download speeds they get with their cell phone provider, and four in 10 agree that they rarely experience dead zones with their provider. One in three say they have a good selection of providers in their region (the majority-51%-disagree that this is the case). Fewer agree that they get good value for money from their cell phone provider (15%) and that the cost of cell phone plans have decreased in the last three years (8%). In fact, most participants disagree that they get good value (74%) and that the cost of plans have decreased (83%).
Figure 13: Perceptions of cell phone services in Canada
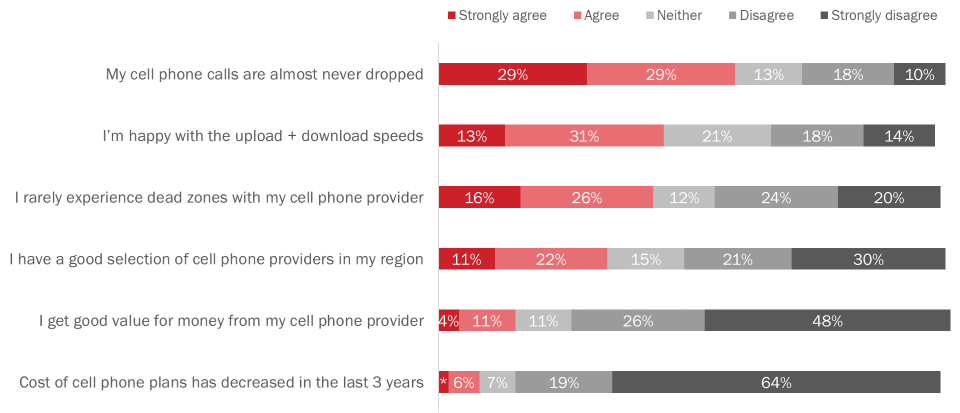
Figure 13: Perceptions of cell phone services in Canada
Q16. Please tell me how much you agree or disagree with each of the following statements using a scale of one to five.
|
Statements |
Strongly agree |
Agree |
Neither |
Disagree |
Strongly disagree |
|---|---|---|---|---|---|
|
My cell phone calls are almost never dropped |
29% |
29% |
13% |
18% |
10% |
|
I’m happy with the upload + download speeds |
13% |
31% |
21% |
18% |
14% |
|
I rarely experience dead zones with my cell phone provider |
16% |
26% |
12% |
24% |
20% |
|
I have a good selection of cell phone providers in my region |
11% |
22% |
15% |
21% |
30% |
|
I get good value for money from my cell phone provider |
4% |
11% |
11% |
26% |
48% |
|
Cost of cell phone plans has decreased in the last 3 years |
2% |
6% |
7% |
19% |
64% |
Base: n=28,705; all respondents. Don’t know/refused: ranged from 0% to 4%.
Q16. Please tell me how much you agree or disagree with each of the following statements using a scale of one to five.
Base: n=28,705; all respondents. Don’t know/refused: ranged from 0% to 4%.
*Values of 2% of less are not depicted in graph
More than nine in 10 say Canada’s cell phone prices are worse compared to other countries
More than nine in 10 (95%) of those who provided feedback think Canada’s cell phone prices are worse than prices compared to other countries. The rest think Canada’s cell phone prices are about the same (1%) or do not know how prices compare (4%).
Figure 14: Views on cell phone prices in Canada
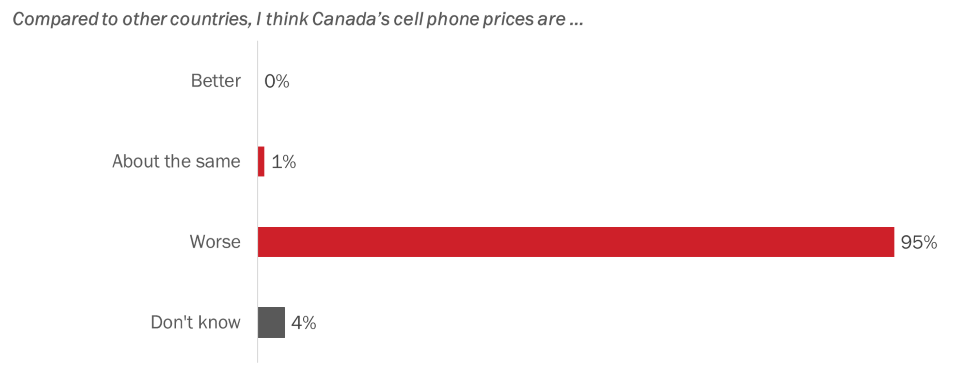
Figure 14: Views on cell phone prices in Canada
Q17. In your view, are Canada’s cell phone prices better, worse or about the same as what you would find in other countries?
|
Answer |
Percent of respondents |
|---|---|
|
Better |
0% |
|
About the same |
1% |
|
Worse |
95% |
|
Don't know |
4% |
Base: n= 28,705; all respondents.
Q17. In your view, are Canada’s cell phone prices better, worse or about the same as what you would find in other countries?
Base: n= 28,705; all respondents.
The following tables present the demographic characteristics of Canadians who participated in the consultation.
|
Age |
n |
% |
|---|---|---|
|
Under 18 |
86 |
<0.5 |
|
18 to 24 |
1,652 |
6 |
|
25 to 34 |
7,261 |
25 |
|
35 to 54 |
10,189 |
35 |
|
55 to 64 |
2,935 |
10 |
|
65 or older |
2,211 |
8 |
|
Prefer not to answer |
4,371 |
15 |
|
Gender |
n |
% |
|---|---|---|
|
Male |
20,569 |
72 |
|
Female |
7,341 |
26 |
|
Self identify (using another term) |
158 |
1 |
|
Prefer not to answer |
637 |
2 |
|
Region |
n |
% |
|---|---|---|
|
Atlantic Canada |
4,383 |
15 |
|
Quebec |
2,304 |
8 |
|
Ontario |
11,922 |
42 |
|
Saskatchewan and Manitoba |
1,497 |
5 |
|
Alberta |
3,490 |
12 |
|
British Columbia |
4,971 |
17 |
|
North |
97 |
<0.5% |
|
Prefer not to answer |
41 |
<0.5% |
|
Education |
n |
% |
|---|---|---|
|
Grade 8 or less |
72 |
<0.5% |
|
Some high school |
652 |
2 |
|
High school diploma or equivalent |
4,228 |
15 |
|
Registered Apprenticeship / trades certificate or diploma |
1,990 |
7 |
|
College, CEGEP or other non-university certificate or diploma |
6,789 |
24 |
|
University certificate or diploma below bachelor’s level |
2,649 |
9 |
|
Bachelor’s degree |
7,310 |
25 |
|
Post-graduate degree above bachelor’s level |
3,937 |
14 |
|
Prefer not to answer |
1,078 |
4 |
|
Household Income |
n |
% |
|---|---|---|
|
Under $20,000 |
1,287 |
4 |
|
$20,000 to just under $40,000 |
3,075 |
11 |
|
$40,000 to just under $60,000 |
3,942 |
14 |
|
$60,000 to just under $80,000 |
4,140 |
14 |
|
$80,000 to just under $100,000 |
4,233 |
15 |
|
$100,000 to just under $150,000 |
5,360 |
19 |
|
$150,000 and above |
3,357 |
12 |
|
Prefer not to answer |
3,311 |
12 |
Thank you very much for your willingness to take part in this Canadian Radio-television and Telecommunications Commission (CRTC) survey on Wireless Services in Canada. Your feedback will help the Commission better understand the needs, behaviours and habits of Canadians when it comes to wireless services.
The online survey forms part of the CRTC’s review of mobile wireless services that began in February 2019. The information obtained from the online survey will help determine whether the needs of Canadians are being met.
The research is being conducted by Phoenix Strategic Perspectives, an independent research firm. The survey should take no more than 5 minutes to complete, and your responses will be treated in confidence.
If you have any questions about the survey, please contact Philippe Azzie of Phoenix SPI by telephone at 613‑260‑1700, ext. 222 or by email at research@phoenixspi.ca.
[EVERYONE]
Record year:
Prefer not to say
TERMINATE IF “DON’T KNOW” OR “REFUSED”
[DO NOT ASK IF Q3 = 08]
[ASK IF Q5 = 03 or 04]
[ASK IF Q7 = 01]
[ASK IF Q7 = 02]
[DO NOT ASK IF Q3 = 08]
[ASK IF Q3 = 08 OR Q11 = 05]
[ASK IF Q2 ≠ A FLANKER BRAND]
These final questions are for statistical classification purposes. Be assured that your responses will be held in strict confidence.
Thank you. Those are all the questions we have for you today. We greatly appreciate your participation in this research.
To consult the CRTC’s Notice of Consultation on the review of mobile wireless services, please click here.
[CLOSING LINK: https://crtc.gc.ca/eng/archive/2019/2019-57-1.htm]