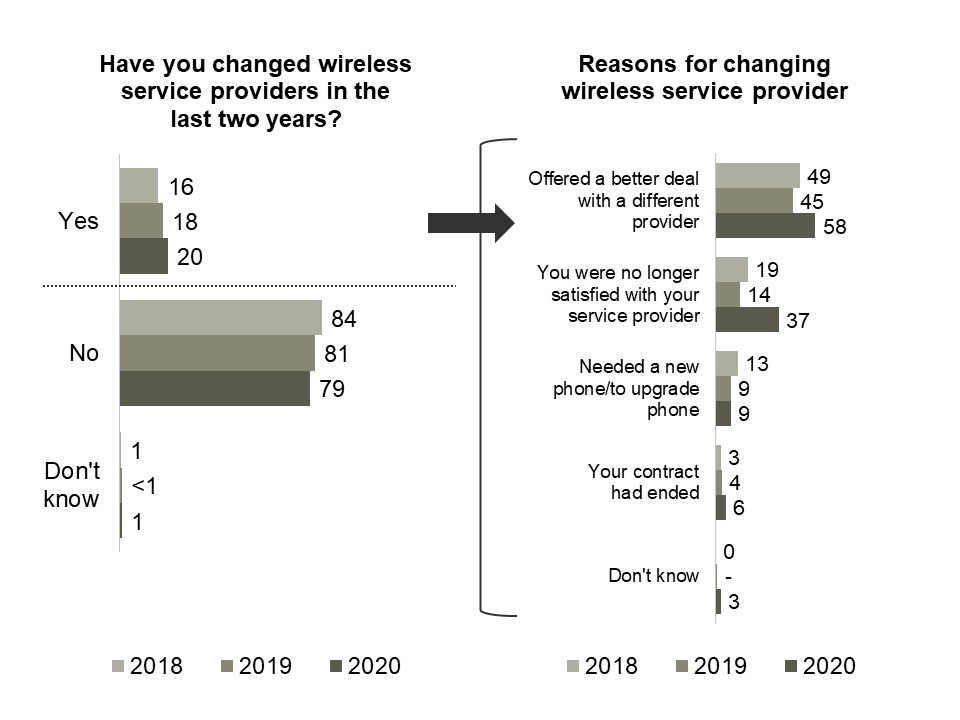
There are two graphs on this figure, the first titled “Have you changed wireless service providers in the last two years?” is a horizontal bar graph showing the proportion of people who have changed their service provider and those who have not. The 1306 respondents in the 2020 survey answered as follows:
The 1322 respondents in the 2019 survey answered as follows:
The 1111 respondents in the 2018 survey answered as follows:
The second graph, titled “Reasons for changing wireless service providers” is also a horizontal bar graph showing the extent to which each reason was applicable to the respondents. The 233 respondents in the 2020 survey who did change service providers in the last two years answered as follows:
The 231 respondents in the 2019 survey who did change service providers in the last two years answered as follows:
The 152 respondents in the 2018 survey who did change service providers in the last two years answered as follows: