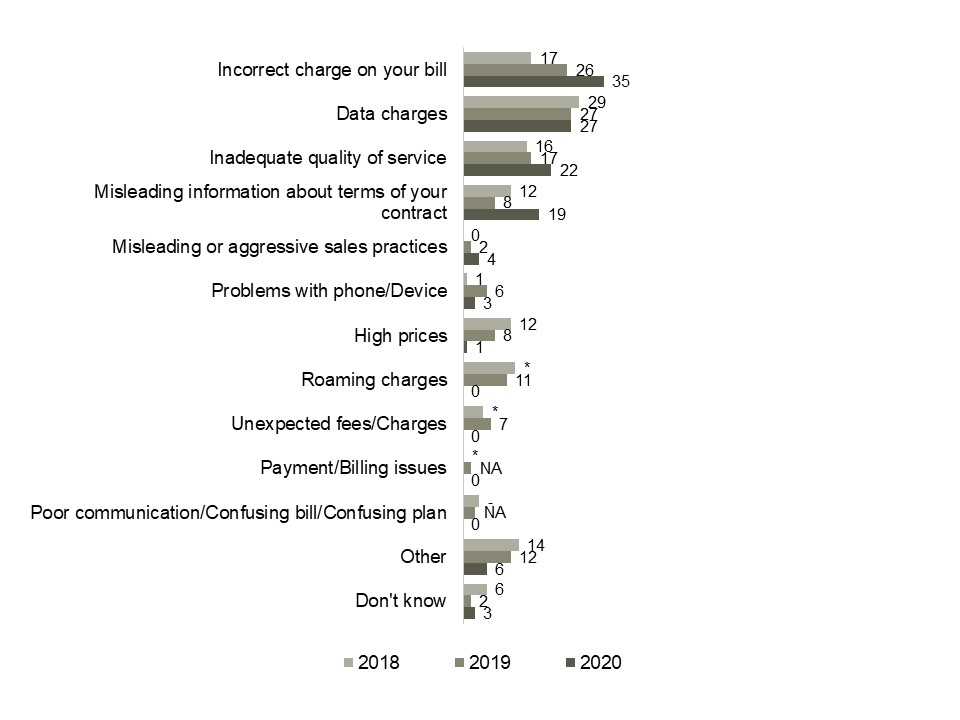
This horizontal bar graph shows the reasons for respondents complaining in the past 12 months. The 222 respondents in the 2020 survey answered as follows:
- Incorrect charges on bill, 35%
- Data charges, 27%
- Inadequate quality of service, 22%
- Misleading contract information, 19%
- Misleading or aggressive sales practices, 4%
- Problems with phone, 3%
- High prices, 1%
- Roaming charges, 0%
- Unexpected fees, 0%
- Poor communication/confusing plan, 0%
- Payment/billing issues, 0%
- Other, 6%
- Don’t know, 3%
The 255 respondents in the 2019 survey answered as follows:
- Data charges, 27%
- Incorrect charges on bill, 26%
- Inadequate quality of service, 17%
- Roaming charges, 11%
- Misleading contract information, 8%
- High prices, 8%
- Unexpected fees, 7%
- Problems with phone, 6%
- Poor communication/confusing plan, 3%
- Misleading or aggressive sales practices, 2%
- Payment/billing issues, 2%
- Other, 12%
- Don’t know, 2%
The 183 respondents in the 2018 survey answered as follows:
- Data charges, 29%
- Incorrect charges on bill, 17%
- Inadequate quality of service, 16%
- Roaming charges, 13%
- Misleading contract information, 12%
- High prices, 12%
- Unexpected fees, 5%
- Problems with phone, 1%
- Poor communication/confusing plan, 4%
- Misleading or aggressive sales practices, N/A
- Payment/billing issues, N/A
- Other, 14%
- Don’t know, 6%