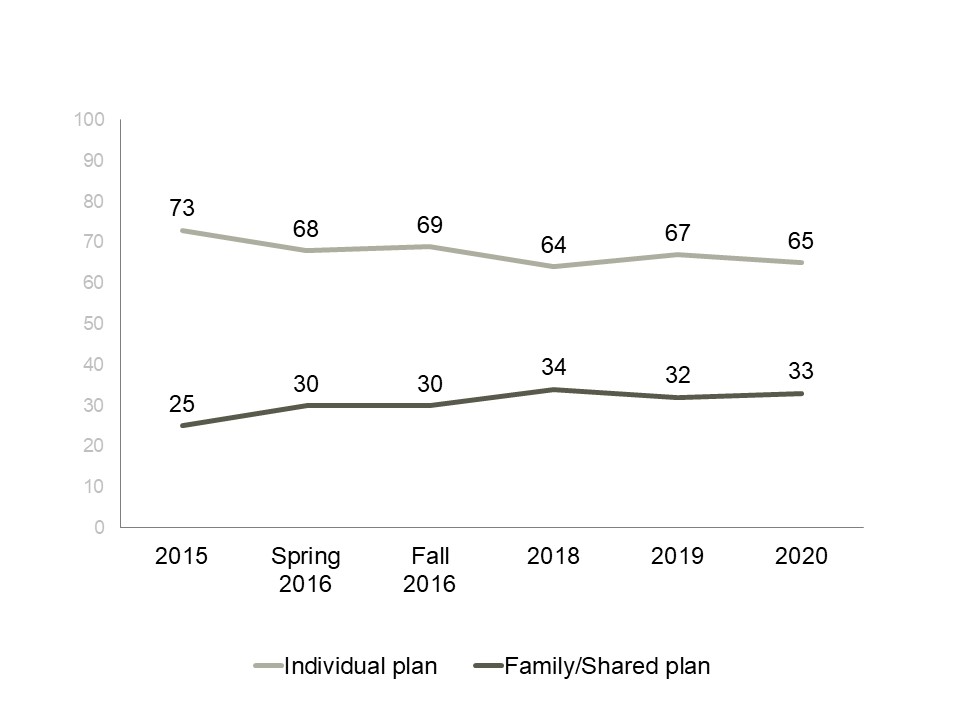
This line graph shows the proportion of people who have an individual plan or a family/shared plan over time. The 1306 respondents in the 2020 survey answered as follows:
The 1322 respondents in the 2019 survey answered as follows:
The 1277 respondents in the fall 2016 survey answered as follows:
The 925 respondents in the spring 2016 survey answered as follows:
The 1005 respondents in the 2015 survey answered as follows: