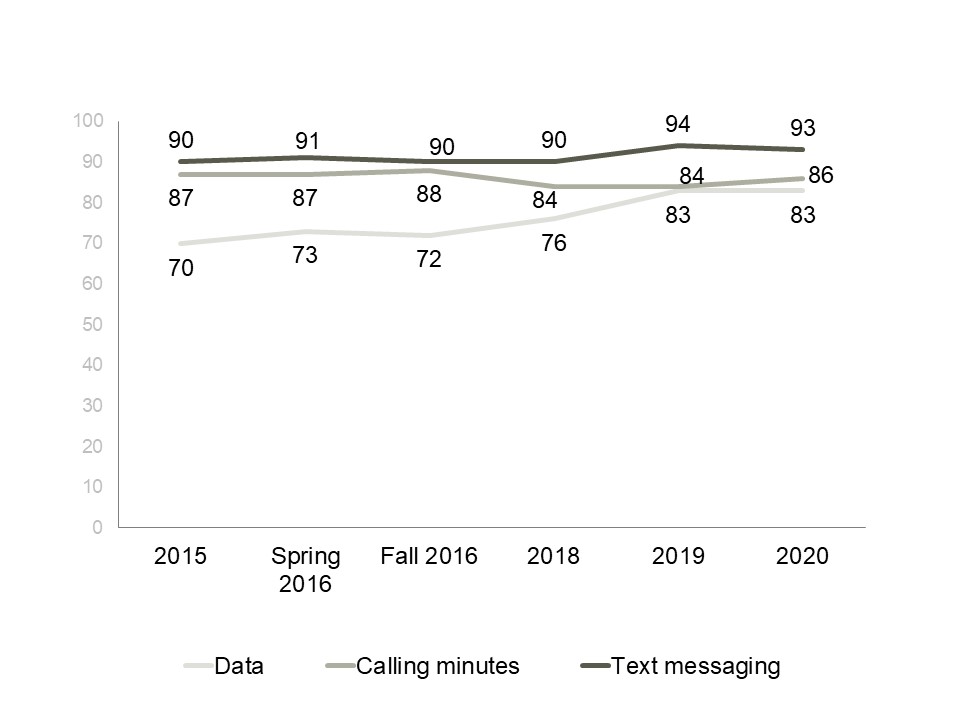
This line graph shows the proportion of people who have data, calling minutes and text messaging included in their wireless plan over time. The 1306 respondents in the 2020 survey answered as follows:
The 1322 respondents in the 2019 survey answered as follows:
The 1111 respondents in the 2018 survey answered as follows:
The 1277 respondents in the fall 2016 survey answered as follows:
The 925 respondents in the spring 2016 survey answered as follows:
The 1005 respondents in the 2015 survey answered as follows: