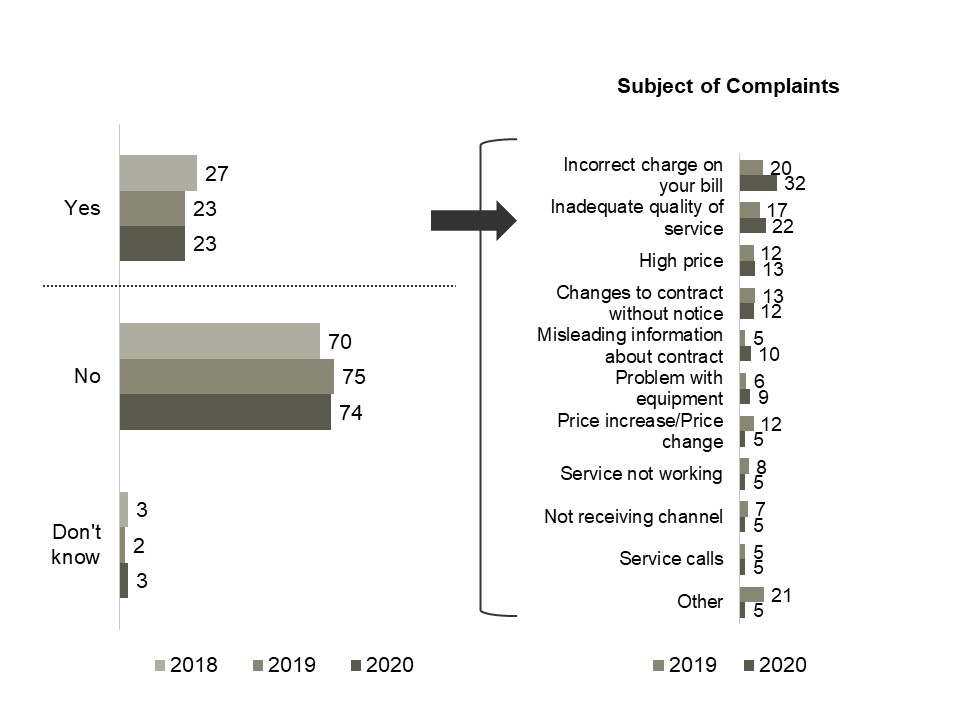
There are two graphs on this figure, the first titled “Have you made a complaint about your TV services within the last 12 months?” is a horizontal bar graph showing the proportion of people who have made a complaint about their TV services in the last 12 months. The 1060 respondents who subscribe to a TV service in the 2020 survey answered as follows:
The 1107 respondents who subscribe to a TV service in the 2019 survey answered as follows:
The 1096 respondents who subscribe to a TV service in the 2018 survey answered as follows:
The second graph, titled “Subjects of complaints” is also a horizontal bar graph and shows a breakdown of the reason for complaints about TV service in the last 12 months. The 255 respondents in the 2020 survey that have made a complaint about their TV services in the past 12 months answered as follows:
The 303 respondents in the 2019 survey that have made a complaint about their TV services in the past 12 months answered as follows: