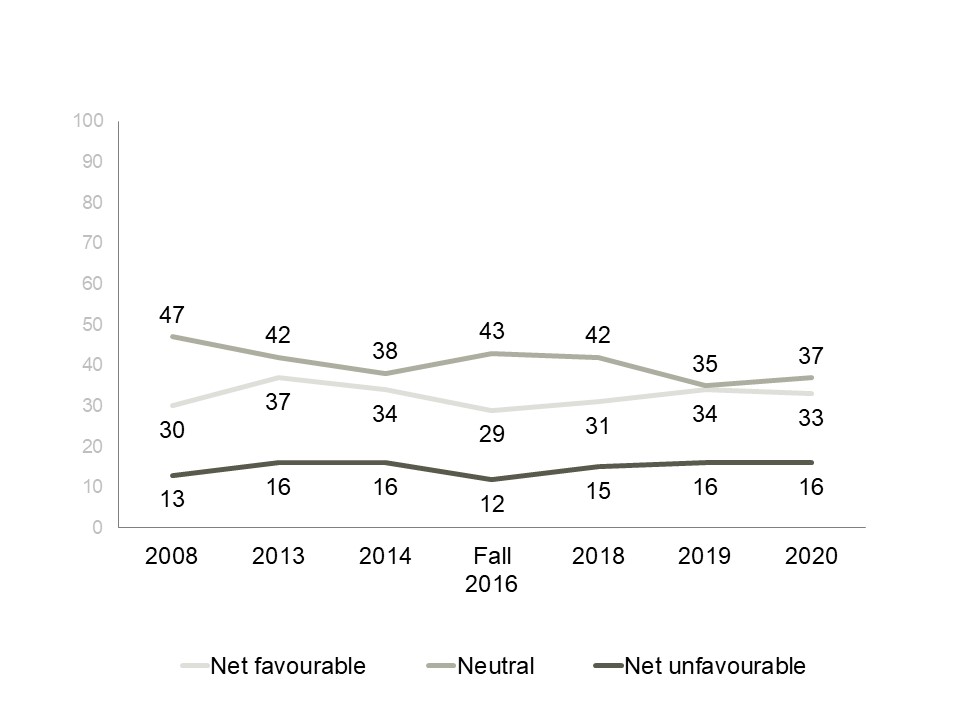
This line graph shows the proportion of people who have a favourable, neutral or unfavourable impression of the CRTC. The 1510 respondents in the 2020 survey answered as follows:
The 1524 respondents in the 2019 survey answered as follows:
The 1345 respondents in the 2018 survey answered as follows:
The 1483 respondents in the fall 2016 survey answered as follows:
The 1289 respondents in the 2014 survey answered as follows:
The respondents in the 2013 survey answered as follows:
The respondents in the 2008 survey answered as follows:
*Note: base sizes are unknown for the 2013 and 2008 survey.