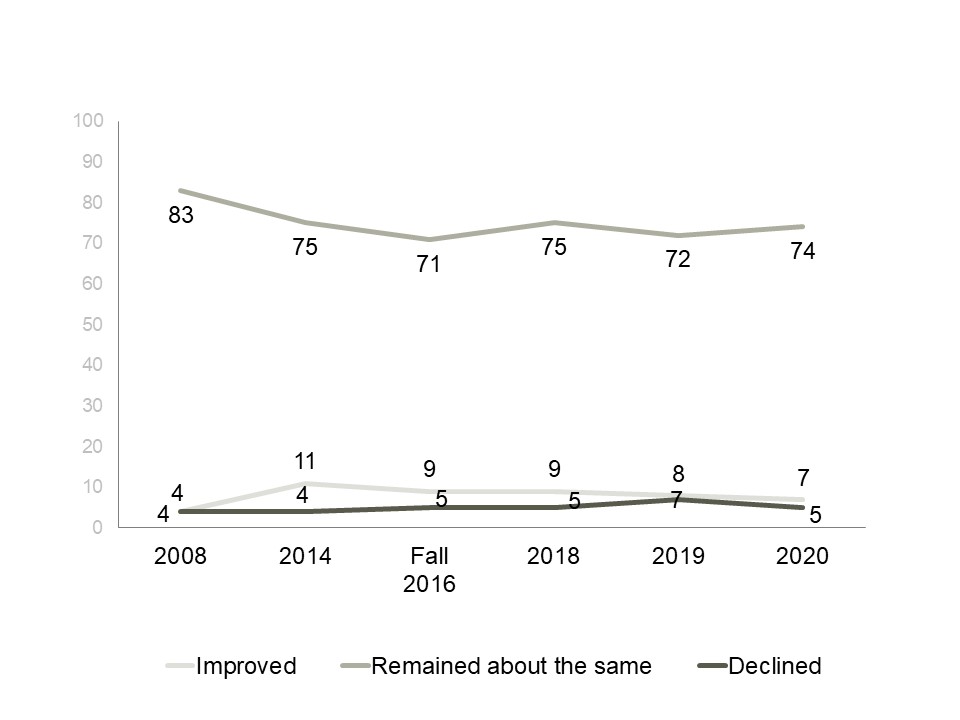
This line graph shows the proportion of people whose impression of the CRTC improved, remained about the same or declined over time. The 1510 respondents in the 2020 survey answered as follows:
The 1524 respondents in the 2019 survey answered as follows:
The 1345 respondents in the 2018 survey answered as follows:
The 1483 respondents in the fall 2016 survey answered as follows:
The 1289 respondents in the 2014 survey answered as follows:
The respondents in the 2008 survey answered as follows:
*Note: base sizes are unknown for the 2008 survey.