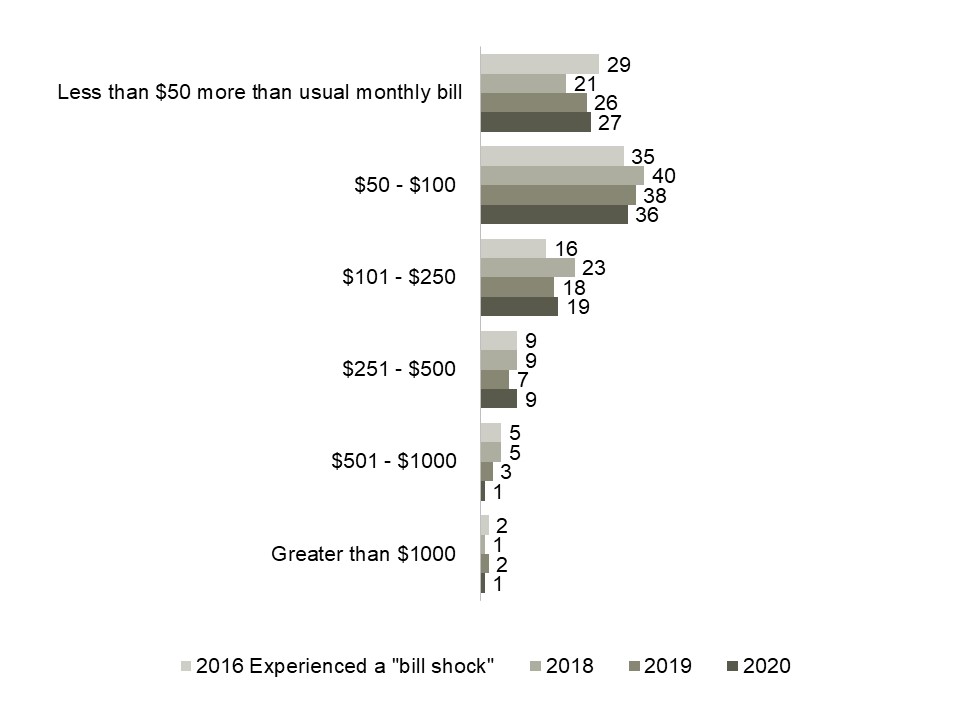
This horizontal bar graph shows the amount of unexpected charges on a bill among those who have experienced “bill shock”. The 261 respondents who have experienced bill shock in the 2020 survey answered as follows:
- Less than $50 more than usual monthly bill, 27%
- $50-$100, 36%
- $101-$250, 19%
- $251-$500, 9%
- $501-$1000, 1%
- Greater than $1000, 1%
The 320 respondents who have experienced bill shock in the 2019 survey answered as follows:
- Less than $50 more than usual monthly bill, 26%
- $50-$100, 38%
- $101-$250, 18%
- $251-$500, 7%
- $501-$1000, 3%
- Greater than $1000, 2%
The 211 respondents who have experienced bill shock in the 2018 survey answered as follows:
- Less than $50 more than usual monthly bill, 21%
- $50-$100, 40%
- $101-$250, 23%
- $251-$500, 9%
- $501-$1000, 5%
- Greater than $1000, 1%
The 250 respondents who have experienced bill shock in the 2016 survey answered as follows:
- Less than $50 more than usual monthly bill, 29%
- $50-$100, 35%
- $101-$250, 16%
- $251-$500, 9%
- $501-$1000, 5%
- Greater than $1000, 2%