Public opinion research tracker: Baseline survey
Report of findings
Prepared for the Canadian Radio-television and Telecommunications Commission (CRTC)
Supplier: Ipsos Limited Partnership
Contract Number: CW2291885
Contract Value: $114,713.98 (including HST)
Award Date: 2023-02-27
Delivery Date: October 23, 2023
Registration Number: POR 131-22
For more information on this report, please contact ROP-POR@crtc.gc.ca
Ce rapport est aussi disponible en français
This public opinion research report presents the results of an online survey conducted by Ipsos Limited Partnership on behalf of the Canadian Radio-television and Telecommunications Commission (CRTC). The research study was conducted with 2,561 Canadians between June 8 to August 4, 2023.
Cette publication est aussi disponible en français sous le titre : Suivi de recherche sur l'opinion publique : Sondage de référence
This publication may be reproduced for non-commercial purposes only. Prior written permission must be obtained from the CRTC. For more information on this report, please contact CRTC at: ROPPOR@crtc.gc.ca or at:
Canadian Radio-television and Telecommunications Commission (CRTC)
1 Promenade du Portage
Gatineau, Quebec J8X 4B1
The Canadian Radio-television and Telecommunications Commission (CRTC)
Ottawa, Ontario
Canada
K1A ON2
Tel: 819-997-0313
Toll-free: 1-877-249-2782 (in Canada only)
Catalogue Number: BC92-129/2024E-PDF
International Standard Book Number (ISBN): 978-0-660-68992-0
© His Majesty the King in Right of Canada, 2023 © His Majesty the King in Right of Canada, as represented by the Canadian Radio-television and Telecommunications Commission, 2023.
Executive Summary
Introduction
Ipsos was commissioned by the Canadian Radio-television and Telecommunications Commission (CRTC) to conduct a baseline wave of public opinion research on Canadians views with respect to their broadcasting, online and telecommunications services.
Background
The CRTC regulates the communications industry in the public interest in a time of significant socio-cultural, economic and technological change and is looking to increase its capacity to measure and track Canadian public opinion. The importance of this grows when considering that the CRTC is implanting new legislation (Online Stream Act) and policy directions (Telecom and Broadcasting) that will require the CRTC to develop new regulatory approaches that consider the views of all Canadians to ensure the system includes and reflects fully the diversity of Canada. In light of these developments, the public opinion research is intended to support the CRTC's efforts to gather the views of all Canadians.
In 2021, the CRTC commissioned Ipsos to develop strategic options for Public Opinion Research. After considering the recommendations and resulting strategy that was presented in September 2022, the CRTC decided to implement a pilot project of the POR strategy and conduct a baseline wave of research. Moving forward, the study will evolve into a bi-annual tracking study.
Research Objectives
The primary objective of the POR is to gain a better understanding of the views of Canadians with respect to their broadcasting, online and telecommunications services and other matters of strategic importance for the CRTC. An essential component of the POR is to ensure the inclusion and representation of all Canadians. Specific focus is placed on ensuring sufficient participation from Anglophones, Francophones, Indigenous Peoples, Official Minority Language Communities (OLMC), Racialized Canadians, TSLGBTQ+ and those living in the North.
In developing the questionnaire, Ipsos worked with CRTC staff to synthesize and incorporate input from all relevant sectors. This included conducting a series of meetings with staff in the Broadcasting, Telecommunications, Compliance and Enforcement (C&E), and Consumer, Research and Communications (CRC) units.
The questionnaire included a core section of key tracking measures and sections to address more topical information needs that would be custom to each wave of research or rotated in future waves.
The baseline POR survey addressed the following areas:
- Consumers' satisfaction with their telecommunications and/or broadcasting services;
- Primary source(s) of media content and satisfaction with the quality of content;
- Broader attitudes, including affordability, quality of service, satisfaction, importance of local media, trust in media and cybersecurity;
- Classification questions to ensure the inclusion of diverse groups regarding Indigenous peoples, ethnicity, people born in or outside Canada, language spoken, sexual orientation, gender identity, household income, and persons with a disability;
- Ad-hoc issues- perceptions of international roaming.
Methodology
The POR was conducted through a quantitative survey executed through a mixed methodology approach including online and telephone interviews among a national sample of 2,561 Canadians aged 18 years and older (1,561 online, 1,000 telephone). Fieldwork was conducted from June 8 to August 4, 2023. Average survey length was 18 minutes (15 minutes online, 22 minutes by telephone).
Quotas and weighting were employed by gender, age and region to reflect the composition of the Canadian general population based on the latest Census. Results were accurate to within + 2.2 percentage points of what the results would have been had every Canadian been polled.
Minimum sample sizes (of at least 100) were achieved among key audiences including Anglophones (n=1842), Francophones (n-529), Indigenous peoples (n=121), Official Minority Language Communities (n=142), racialized Canadians (n=323), and 2SLGBTQI+ (n=214). Oversamples of TSLGBTQ+ Canadians and those residing in the North were required and notably, fieldwork in the North proved more challenging than anticipated and the target of n=100 could not be achieved in the fieldwork period (n=82 was achieved).
Notes to Readers
- All results in the report are expressed as a percentage, unless otherwise noted.
- Throughout the report, percentages may not always add to 100 due to rounding.
- When reporting sub-group variations, only differences that are significant at the 95% confidence level, indicative of a pattern and pertaining to a sub-group sample size of more than n=30 are discussed.
- For open-ended measures, results have been coded into thematic category and expressed as individual codes that align most closely to respondents answers and broader themes (NETs) for comparison purposes.
Expenditure
The contract value for the POR survey was $114,713.98 (including HST)
Key Findings
Virtually all adult Canadians report they currently receive one or more telecommunications, broadcast, or audio or video streaming services for personal use, and a strong majority of those who receive each type of service are satisfied with their provider.
- More than ninety percent report they have internet service at home (93%) or cellphone service (91%), three-quarters subscribe or have access to at least one video streaming service (74%) and roughly half at least one audio streaming service (52%) or cable TV service (51%). Relatively few in comparison have satellite TV service (14%) or use free television services (10%).
- Satisfaction is highest for audio streaming services (73%), followed by two-thirds for internet (65%), video streaming (64%), or cellphone service (64%), and six in ten for cable TV (61%) or satellite TV service (59%).
- Reliability is the most common factor driving satisfaction with internet service in particular, and to a lesser extent cellphone and cable TV service, and is mentioned more often as a positive reason than as a negative. Broader impressions of reliability are reasonably strong and the majority of Canadians feel that they count on reliable high-speed internet (60%) and mobile networks (57%) where they live.
- Affordability, while mentioned less often as a reason for satisfaction with the service in general, is cited more often among cellphone or cable TV customers as a reason for lower satisfaction. Most Canadians feel that telecommunications (51%), television (49%), and streaming video services (47%) have become less affordable in the past year, and only one-third that agree they have enough choice of telecommunications providers (34%).
- Quality and variety of content is by far the biggest reason for satisfaction with audio and video streaming services. Notably, nearly half of French-speakers (47%) feel that the content on these types of platforms should be regulated like traditional broadcasting compared to three in ten English-speakers (29%).
The majority of Canadians (66%) are confident in their ability to pay for the telecommunications, broadcast or streaming services they receive in the immediate future, however roughly one-quarter (27%) report they have had to make changes to their services recently to improve affordability.
- Two in ten (19%) made changes to make their services more affordable in the past month, while one in ten planned on cancelling their service but were convinced to stay with a better price (10%), cancelled and switched providers (9%) or cancelled entirely their services (8%).
- Those who made changes to improve affordability are most likely to have adjusted the services they receive or changed providers for their cellphone service, followed by home internet or video steaming services.
Canadians' use of international calling or text products or services is limited and relatively few have a strong understanding of the rate plans or options available. Affordability is the primary factor driving usage, however impressions of the reasonableness of the rates or cost of purchase are relatively weak.
- A sizeable minority of Canadians (34% to 44%) report they have never used each type of international calling or text product or service. Canadians are most likely to report having used international roaming through a flat-rate-per-day option before (31%), followed by domestic SIM/eSIM (25%), international roaming through a pay-per-text/call/MB option (24%) and international SIM/eSIM (21%). Few report using any product or service on a frequent basis with the largest proportion having used each once or twice a year (7% to 14%).
- The most common reason for using the product or service they did is because it was the most cost-effective option (45%), followed by the one they were most familiar with (39%), and the easiest, most convenient option to set up (26%).
- Nearly four in ten who used a domestic SIM/eSIM found the cost reasonable (36%), followed by international SIM/eSIM (32%), international roaming through a flat-rate-per-day option (21%) and international roaming through a pay-per-text/call/MB option (19%).
- Around one in ten (14%) of all Canadians agree that the rates they pay to use their cellphone while travelling outside of the country are reasonable and one third (32%) of those with a cellphone for personal use feel they have a good understanding of the rate plans/ options for using their cellphone outside of the country.
When asked about their primary sources for 'news and information' and 'entertainment', the vast majority of Canadians rely on video content for 'entertainment' and to a lesser extent for 'news and information', half use audio sources for either, while online media and print and are more common for 'news and information'. Nearly two-thirds (62%) are satisfied with the quality of the 'entertainment' content and just over half (54%) for 'news and information'.
- The most common sources of media content for 'news and information' are regular television (46%), followed by online media (36%), AM/FM radio (34%), online social media (25%) and print media (20%). For 'entertainment', the primary sources are online video streaming (45%) and regular television (43%), followed by online social media (34%).
- Satisfaction with 'entertainment' is highest for audio podcasts (70%) and generally consistent for all other sources (ranging from 61% to 65%), while satisfaction with 'news and info' is more varied and is highest for TV (60%) and print (59%), and lower for online social media (48%), social networking sites (51%), and online music streaming (50%).
Attitudes towards Canadian content specifically are generally positive but soft. While most feel it is at least somewhat important to have access to Canadian-made programming and that they rely on Canadian news media to understand the world, Canadian's impressions of the quality, variety and depth of content as well as trust in media are relatively weak and most do not feel reflected in the types of programming available or that it is relevant to their lives.
- Roughly four in ten agree that it is important for them to have access to Canadian-made television programs (41%) and music (38%), and are satisfied with the quality and variety of Canadian music available today (39% each). Closer to one-third are satisfied with the quality (35%) and variety (34%) of Canadian television programs, agree that the types of news, music, and television programming are relevant to their lives (36%) or that they see themselves reflected in the programming available (32%).
- Nearly half rely on Canadian news media to help them understand what's going on in the world (45%), and that news programming covers a diverse range of topics and issues (41%). Fewer agree that they trust the information provided by news media in Canada (36%), that the types of news programming offers a variety of perspectives (36%), and that they are satisfied the quality of information and analysis offered by Canadian news media (37%).
Differences by Demographics
Age cohort: Older Canadians (in particular 65 or older) are more likely to report they receive cellphone and cable TV service and to a lesser extent home internet than younger Canadians. They are more likely than younger Canadians to feel confident in their ability to pay for all their services in the immediate future and are less likely to have had to make changes in past month to improve affordability.
Older Canadians are more likely than younger Canadians to rely on regular television as their primary source of 'news and information' and 'entertainment' and AM/FM radio or print media sources for 'news and information'. They are more likely to be satisfied with the 'news and information' content they receive, to rely on and trust Canadians news media, and to be satisfied with the variety of opinions, quality, and depth of coverage. They are also more likely to feel it is important for them to have access to Canadian-made TV programs and music and to agree that the content of online streaming platforms should be regulated like traditional broadcasting.
Older Canadians are more likely than younger Canadians to report that they often receive unsolicited phone calls or emails trying to trick them into sharing personal information or clicking a malicious link and to feel that the amount has increased in the past year.
Younger Canadians are more likely than older Canadians to rely on online social media, online video streaming services, audio podcasts, and social networking sites for 'news and information' or 'entertainment' content, as well as online music streaming services for 'entertainment' content.
Region of residence: Residents of Quebec are more likely than those from other regions to rely on regular television as their primary source of 'news and information' and to be satisfied with both the 'entertainment' and 'news and information' content they receive. They are more likely to agree it is important for them to have access to Canadian-made TV programs and music, to be satisfied with the quality and variety of Canadian television programs and music available today, and to see themselves reflected in the programming available. They are also more likely to rely on Canadian news media and to be satisfied with the variety of opinions, quality, and depth of coverage.
They are also more likely to agree that they can count on reliable high-speed internet and mobile networks where they live and that they have enough choice of telecommunications providers.
Official Language: Differences by official language are virtually identical to those observed among residents of Quebec compared to those from other regions. French-speakers are more likely to report that their primary source of 'news and information' or 'entertainment' content is regular television, while English-speakers are more likely to rely on online video streaming services, online music streaming services, audio podcasts and social networking sites for both types of content. French-speakers are also more likely than English-speakers to be satisfied with both the 'entertainment' and 'news and information' content they receive.
They are more likely to agree it is important for them to have access to Canadian-made TV programs and music, to be satisfied with the quality and variety of Canadian television programs and music available today, and to see themselves reflected in the programming available, and that content available through online video or streaming platforms should be regulated similar to traditional broadcasting. They are also more likely to rely on Canadian news media, trust the information provided by news media in Canada to be accurate and impartial, and to be satisfied with the variety of opinions, quality, and depth of coverage.
French-speakers are also more likely than English-speakers to agree that they can count on reliable high-speed internet and mobile networks where they live and that they have enough choice of telecommunications providers.
English-speakers are more likely than French-speakers to agree that they or someone they know has experienced a scam attempt in the past month.
Household income: Lower income households (in particular with annual incomes of $40k or less) are less likely than higher income households to report they currently have cellphone or internet service. They are less likely to feel confident in their ability to pay for the services they have and are more likely to have had to make changes recently to improve affordability or to have cancelled a service entirely.
Higher income households are more likely than lower income households to rely on online video streaming services as their primary source of 'entertainment' content. They are also more likely to agree that they often receive unsolicited emails trying to trick them into clicking malicious links, and that they or someone they know have experienced a scam attempt.
Indigenous status: Those who identify as Indigenous are less likely than those who do not identify as Indigenous to report they receive internet or cable TV service and are more likely to report they currently have satellite TV service. They are less likely to feel confident in their ability to pay for the services they have and are more likely to have had to make changes recently to improve affordability, switched to a different provider or to have cancelled a service entirely. They are also less likely to agree that they can count on reliable high-speed internet or mobile networks where they live, and that they have enough choice of telecommunications providers.
Ethnicity: Racialized Canadians are more likely than those who are not racialized to report they currently receive cellphone service and less likely to report they receive internet or cable TV service. They are more likely to have had to make changes to their services recently to improve affordability, switched to a different provider, were convinced to stay with a better price or to have cancelled a service entirely. They are also less likely to agree that they can count on reliable high-speed internet where they live.
Racialized Canadians are more likely than those who are not racialized to rely on online video streaming services and online social media as their primary sources of 'news and information' and 'entertainment' content and are also more likely to rely on online music streaming services for 'entertainment'.
Political Neutrality Statement
I hereby certify as Senior Officer of Ipsos that the deliverables fully comply with the Government of Canada political neutrality requirements outlined in the Communications Policy of the Government of Canada and Procedures for Planning and Contracting Public Opinion Research. Specifically, the deliverables do not include information on electoral voting intentions, political party preferences, standings with the electorate or ratings of the performance of a political party or its leaders.

Mike Colledge
President
Ipsos Public Affairs
Detailed Findings
Satisfaction with service(s) overall
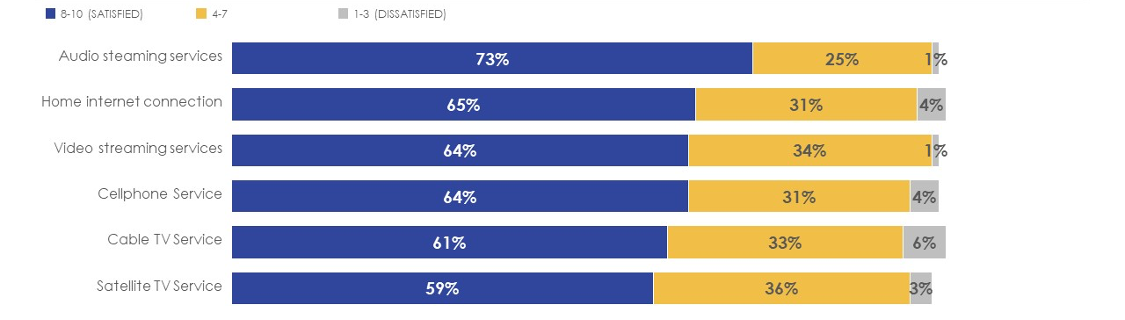
Among those who report they currently have each type of service, nearly three-quarters (73%) are satisfied with the audio streaming service they receive, followed by roughly two-thirds for their home internet (65%), video streaming (64%), and cellphone service (64%). Six in ten are satisfied with their cable TV (61%) or satellite TV service (59%).
- Canadians 65 or older and residents of Quebec are more likely to be satisfied with nearly all the services they receive than younger Canadians and those from other regions respectively.
Figure 1: Satisfaction with providers by service
Base: Those who have cable TV, satellite TV, internet, cellphone, video streaming and/ or audio streaming services (n=2529)
Q8. Overall, how satisfied are you with the [SERVICE] you receive from [PROVIDER]?
This horizontal bar chart shows responses to a question about satisfaction with providers by each type of service. Respondents were asked to provide ratings on a 10-pt scale and results were grouped by those who provided a rating of 8 to 10 as satisfied, 4 to 7 as neither satisfied nor dissatisfied and 1 to 3 as dissatisfied. A total of 2529 who have cable TV, satellite TV, internet, cellphone, video streaming and/ or audio streaming services answered this question as follows:
- Audio streaming services: 73% satisfied, 25% neither satisfied nor dissatisfied , 1% dissatisfied.
- Home internet connection: 65% satisfied, 31% neither satisfied nor dissatisfied , 4% dissatisfied.
- Video streaming services: 64% satisfied, 34% neither satisfied nor dissatisfied , 1% dissatisfied.
- Cellphone Service: 64% satisfied, 31% neither satisfied nor dissatisfied , 4% dissatisfied.
- Cable TV Service: 61% satisfied, 33% neither satisfied nor dissatisfied , 6% dissatisfied.
- Satellite TV Service: 59% satisfied, 36% neither satisfied nor dissatisfied , 3% dissatisfied.
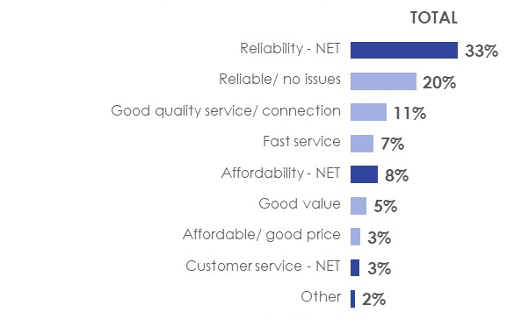
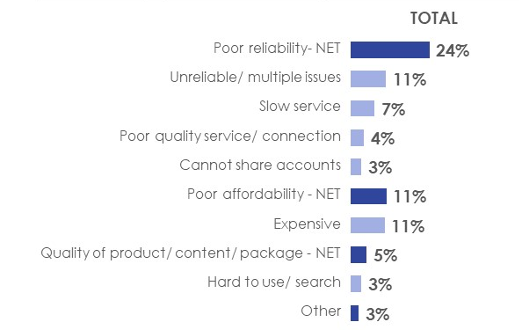
When asked to explain their satisfaction with the internet service they receive, nearly four in ten provide a positive reason (39%) while slightly fewer provide a negative reason (36%). The most common positive comments relate to reliability (33%), and specifically not having issues (20%), a good connection (11%) and fast service (7%), followed by mentions of affordability (8%). The most common negative comments include poor reliability (24%), and specifically having multiple issues (11%), and slow service (7%), while one in ten (11%) mention poor affordability.
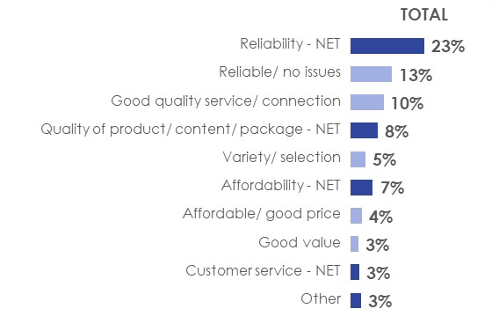
Figure 2: Positive reason(s) for satisfaction with service by internet provider
Base: Those who have internet services (n=2390)
Q9. You provided a rating of [RATING] out of 10 for the [SERVICE] you receive from [PROVIDER]. Why do you say that? Please be as detailed in your response as possible.
This horizontal bar chart shows the positive reasons for satisfaction with the internet service received. Respondents were asked to explain the reasons for the satisfaction rating provided for their internet service provider. A total of 2390 internet service customers answered as follows:
- Reliability (NET): 33%.
- Reliable/ no issues: 20%.
- Good quality service/ connection: 11%.
- Fast service: 7%.
- Affordability (NET): 8%.
- Good value: 5%.
- Affordable/ good price: 3%.
- Customer service (NET): 3%.
- Other: 2%.
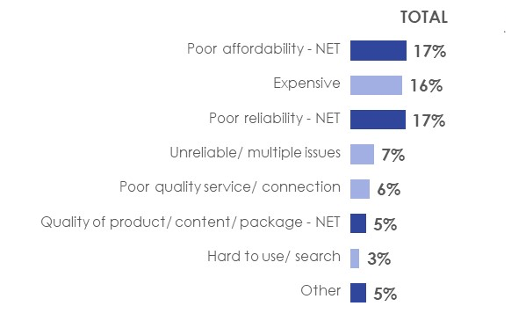
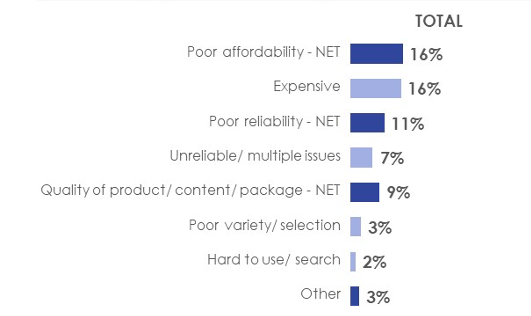
Figure 3: Negative reason(s) for satisfaction with service by internet provider
Base: Those who have internet services (n=2390)
Q9. You provided a rating of [RATING] out of 10 for the [SERVICE] you receive from [PROVIDER]. Why do you say that? Please be as detailed in your response as possible.
This horizontal bar chart shows the negative reasons for satisfaction with the internet service received. Respondents were asked to explain the reasons for the satisfaction rating provided for their internet service provider. A total of 2390 internet service customers answered as follows:
- Poor reliability (NET): 24%.
- Unreliable/ multiple issues: 11%.
- Slow service: 7%.
- Poor quality service/ connection: 4%.
- Cannot share accounts: 3%
- Poor affordability (NET): 11%.
- Expensive: 11%.
- Quality of product/ content/ package (NET): 5%.
- Hard to use/ search: 3%.
- Other: 3%.
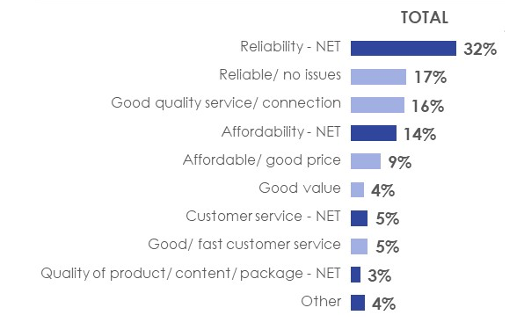
When asked to explain their satisfaction with the cellphone service they receive, nearly half provide a positive reason (47%) and four in ten a negative reason (38%). The most common positive comments relate to reliability (32%), and specifically not having issues (17%) or good connection (16%), followed by affordability (14%). The most common negative comments include poor affordability (17%) and poor reliability (17%).
Figure 4: Positive reason(s) for satisfaction with service by cellphone provider
Base: Those who have cellphone services (n=2318)
Q9. You provided a rating of [RATING] out of 10 for the [SERVICE] you receive from [PROVIDER]. Why do you say that? Please be as detailed in your response as possible.
This horizontal bar chart shows the positive reasons for satisfaction with the cellphone service received. Respondents were asked to explain the reasons for the satisfaction rating provided for their cellphone service provider. A total of 2318 cellphone service customers answered as follows:
- Reliability (NET): 32%.
- Reliable/ no issues: 17%.
- Good quality service/ connection: 16%.
- Affordability (NET): 14%.
- Affordable/ good price: 9%.
- Good value: 4%.
- Customer service (NET): 5%.
- Good/ fast customer service: 5%.
- Quality of product/ content/ package (NET): 3%.
- Other: 4%.
Figure 5: Negative reason(s) for satisfaction with service by cellphone provider
Base: Those who have cellphone services (n=2318)
Q9. You provided a rating of [RATING] out of 10 for the [SERVICE] you receive from [PROVIDER]. Why do you say that? Please be as detailed in your response as possible.
This horizontal bar chart shows the negative reasons for satisfaction with the cellphone service received. Respondents were asked to explain the reasons for the satisfaction rating provided for their cellphone service provider. A total of 2318 cellphone service customers answered as follows:
- Poor affordability (NET): 17%.
- Expensive: 16%.
- Poor reliability (NET): 17%.
- Unreliable/ multiple issues: 7%.
- Poor quality service/ connection: 6%.
- Quality of product/ content/ package (NET): 5%.
- Hard to use/ search: 3%.
- Other: 5%.
When asked to explain their satisfaction with the cable TV service they receive, nearly four in ten (39%) provide a positive reason while slightly fewer provide a negative reason (37%). The most common positive comments relate to reliability (23%), and specifically having no issues (13%) and good quality connection (10%), followed by quality of the content (8%) and affordability (7%). The most common negative comments include poor affordability (14%), poor quality of the content/packages (13%) and poor reliability (12%).
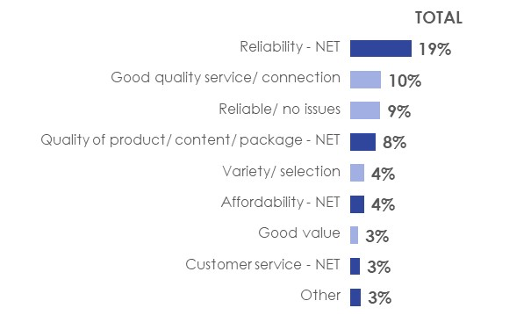
Figure 6: Positive reason(s) for satisfaction with service by cable TV provider
Base: Those who have cable TV services (n=1324)
Q9. You provided a rating of [RATING] out of 10 for the [SERVICE] you receive from [PROVIDER]. Why do you say that? Please be as detailed in your response as possible.
This horizontal bar chart shows the positive reasons for satisfaction with the cable TV service received. Respondents were asked to explain the reasons for the satisfaction rating provided for their cable TV service provider. A total of 1324 cable TV service customers answered as follows:
- Reliability (NET): 23%.
- Reliable/ no issues: 13%.
- Good quality service/ connection: 10%.
- Quality of product/ content/ package (NET): 8%.
- Variety/ selection: 5%.
- Affordability (NET): 7%.
- Affordable/ good price: 4%.
- Good value: 3%.
- Customer service (NET): 3%.
- Other: 3%.
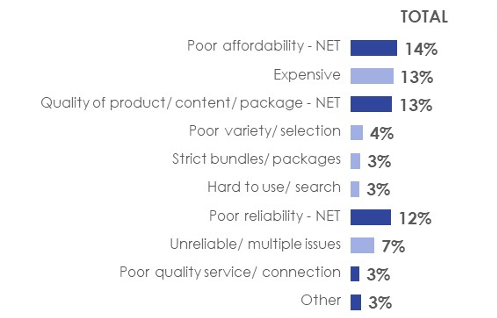
Figure 7: Negative reason(s) for satisfaction with service by cable TV provider
Base: Those who have cable TV services (n=1324)
Q9. You provided a rating of [RATING] out of 10 for the [SERVICE] you receive from [PROVIDER]. Why do you say that? Please be as detailed in your response as possible.
This horizontal bar chart shows the negative reasons for satisfaction with the cable TV service received. Respondents were asked to explain the reasons for the satisfaction rating provided for their cable TV service provider. A total of 1324 cable TV service customers answered as follows:
- Poor affordability (NET): 14%.
- Expensive: 13%.
- Quality of product/ content/ package (NET): 13%.
- Poor variety/ selection: 4%.
- Strict bundles/ packages: 3%.
- Hard to use/ search: 3%.
- Poor reliability (NET): 12%.
- Unreliable/ multiple issues: 7%.
- Poor quality service/ connection: 3%.
- Other: 3%.
When asked to explain their satisfaction with the satellite TV service they receive, roughly one-third provide either a positive (35%) or negative reason (34%). The most common positive comments relate to reliability (19%), and specifically good quality connection (10%) and no issues (9%), followed by the quality of product/ content or package (8%). The most common negative comments include poor affordability (16%), followed by poor reliability (11%) and quality of content /packages (9%).
Figure 8: Positive reason(s) for satisfaction with service by satellite TV provider
Base: Those who have satellite TV services (n=345)
Q9. You provided a rating of [RATING] out of 10 for the [SERVICE] you receive from [PROVIDER]. Why do you say that? Please be as detailed in your response as possible.
This horizontal bar chart shows the positive reasons for satisfaction with the satellite TV service received. Respondents were asked to explain the reasons for the satisfaction rating provided for their satellite TV service provider. A total of 345 satellite TV service customers answered as follows:
- Reliability (NET): 19%.
- Good quality service/ connection: 10%.
- Reliable/ no issues: 9%.
- Quality of product/ content/ package (NET): 8%.
- Variety/ selection: 4%.
- Affordability (NET): 4%.
- Good value: 3%.
- Customer service (NET): 3%.
- Other: 3%.
Figure 9: Negative reason(s) for satisfaction with service by satellite TV provider
Base: Those who have satellite TV services (n=345)
Q9. You provided a rating of [RATING] out of 10 for the [SERVICE] you receive from [PROVIDER]. Why do you say that? Please be as detailed in your response as possible.
This horizontal bar chart shows the negative reasons for satisfaction with the satellite TV service received. Respondents were asked to explain the reasons for the satisfaction rating provided for their satellite TV service provider. A total of 345 satellite TV service customers answered as follows:
- Poor affordability (NET): 16%.
- Expensive: 16%.
- Poor reliability (NET): 11%.
- Unreliable/ multiple issues: 7%.
- Quality of product/ content/ package (NET): 9%.
- Poor variety/ selection: 3%.
- Hard to use/ search: 2%.
- Other: 3%.
When asked to explain their satisfaction with the video streaming service(s) they receive, more than six in ten provide a positive reason (62%) while nearly half provide a negative reason (48%). The most common positive comments relate to quality of product/ content (42%), including variety (26%) and good content (18%), followed by reliability (21%) and affordability (14%). The most common negative comments include quality of the content (32%), and specifically poor variety (19%), followed by poor affordability (15%) and poor reliability (11%).
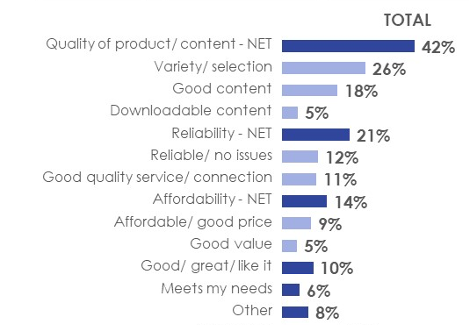
Figure 10: Positive reason(s) for satisfaction with service by video streaming services provider
Base: Those who have video Streaming services (n=1875)
Q9. You provided a rating of [RATING] out of 10 for the [SERVICE] you receive from [PROVIDER]. Why do you say that? Please be as detailed in your response as possible.
This horizontal bar chart shows the positive reasons for satisfaction with the video streaming service received. Respondents were asked to explain the reasons for the satisfaction rating provided for their video streaming service provider. A total of 1875 video streaming service customers answered as follows:
- Quality of product/ content/ package (NET): 42%.
- Variety/ selection: 26%.
- Good content: 18%.
- Downloadable content: 5%.
- Reliability (NET): 21%.
- Reliable/ no issues: 12%.
- Good quality service/ connection: 11%.
- Affordability (NET): 14%.
- Affordable/ good price: 9%.
- Good value: 5%.
- Good/ great/ like it: 10%.
- Meets my needs: 6%.
- Other: 8%.
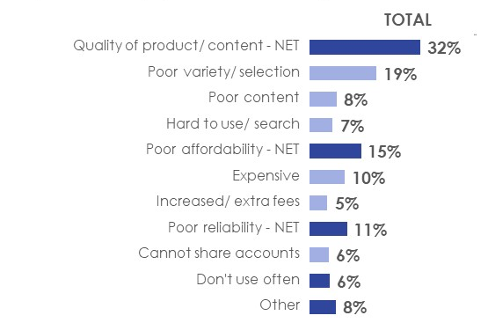
Figure 11: Negative reason(s) for satisfaction with service by video streaming services provider
Base: Those who have video Streaming services (n=1875)
Q9. You provided a rating of [RATING] out of 10 for the [SERVICE] you receive from [PROVIDER]. Why do you say that? Please be as detailed in your response as possible.
This horizontal bar chart shows the negative reasons for satisfaction with the video streaming service received. Respondents were asked to explain the reasons for the satisfaction rating provided for their video streaming service provider. A total of 1875 video streaming service customers answered as follows:
- Quality of product/ content (NET): 32%.
- Poor variety/ selection: 19%.
- Poor content: 8%.
- Hard to use/ search: 7%.
- Poor affordability (NET): 15%.
- Expensive: 10%.
- Increased/ extra fees: 5%.
- Poor reliability (NET): 11%.
- Cannot share accounts: 6%.
- Don't use often: 6%.
- Other: 8%.
When asked to explain their satisfaction with the audio streaming service(s) they receive, six in ten provide a positive reason (61%) while nearly three in ten provide a negative reason (28%). The most common positive comments relate to quality of content (38%), and specifically variety (23%), followed by reliability (19%) and affordability (11%). The most common negative comments include poor quality of the content (11%) and poor affordability (8%).
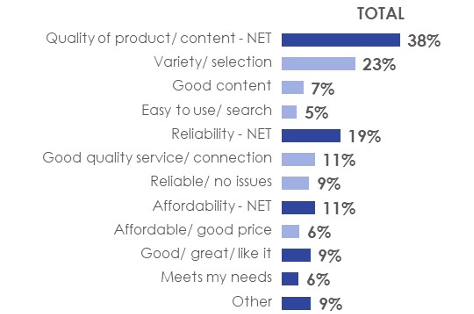
Figure 12: Positive reason(s) for satisfaction with service by audio streaming services provider
Base: Those who have Audio Streaming services (n=1313)
Q9. You provided a rating of [RATING] out of 10 for the [SERVICE] you receive from [PROVIDER]. Why do you say that? Please be as detailed in your response as possible.
This horizontal bar chart shows the positive reasons for satisfaction with the audio streaming service received. Respondents were asked to explain the reasons for the satisfaction rating provided for their audio streaming service provider. A total of 1313 audio streaming service customers answered as follows:
- Quality of product/ content (NET): 38%.
- Variety/ selection: 23%.
- Good content: 7%.
- Easy to use/ search: 5%.
- Reliability (NET): 19%.
- Good quality service/ connection: 11%.
- Reliable/ no issues: 9%.
- Affordability (NET): 11%.
- Affordable/ good price: 6%.
- Good/ great/ like it: 9%.
- Meets my needs: 6%.
- Other: 9%.
Figure 13: Negative reason(s) for satisfaction with service by audio streaming services provider
Base: Those who have Audio Streaming services (n=1313)
Q9. You provided a rating of [RATING] out of 10 for the [SERVICE] you receive from [PROVIDER]. Why do you say that? Please be as detailed in your response as possible.
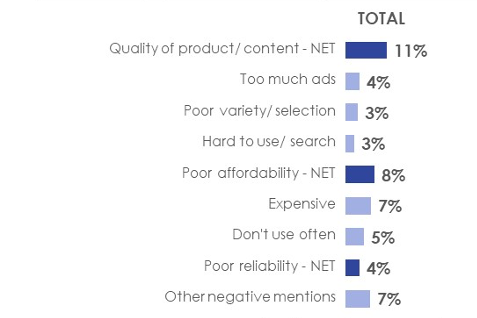
This horizontal bar chart shows the negative reasons for satisfaction with the audio streaming service received. Respondents were asked to explain the reasons for the satisfaction rating provided for their audio streaming service provider. A total of 1313 audio streaming service customers answered as follows:
- Quality of product/ content (NET): 11%.
- Too much ads: 4%.
- Poor variety/ selection: 3%.
- Hard to use/ search: 3%.
- Poor affordability (NET): 8%.
- Expensive: 7%.
- Don't use often: 5%.
- Poor reliability (NET): 4%.
- Other: 7%.
Changes to Services in Past Month
Among those who receive telecommunications, TV, audio and/or video subscription services, roughly one-quarter (27%) made some type of change to their services to improve the affordability in the past month. Nearly two in ten (19%) made changes in the past month to make their services more affordable, while one in ten planned on cancelling their service but were convinced to stay with a better price (10%), cancelled and switched providers (9%) or cancelled entirely their services (8%).
- Younger Canadians (in particular those under 35) are more likely than older Canadians to have made changes to their services to make them more affordable, planned on cancelling but were convinced to stay with a better price, cancelled service entirely or cancelled and switched to a different provider.
- Households with income of less than $40,000 are more likely to have made changes to make their services more affordable (25%) or were convinced to stay with a better price (15%) than higher income households.
- Those who identify as Indigenous and racialized Canadians are more likely than those who are not Indigenous or racialized to have made changes to their services to make them more affordable (27% and 22% respectively) or cancelled and switched to a different provider (11% and 12%). Racialized Canadians are also more likely than those who are not racialized to have been convinced to stay with a better price (16%).
Figure 14: Changes made to services to make them more affordable (in past month)

Base: Those who have cable TV, satellite TV, internet, cellphone, video streaming and/ or audio streaming services (n=2529)
Q10. Thinking about the last month, have you or anyone in your household made changes to any of your telecommunications, television, audio and/or video subscription services (e.g., changed package) in order to make them more affordable, planned on cancelling but was convinced to stay with a better price or cancelled any services (and/or switched to a different provider) because you could no longer afford them?
This horizontal bar chart shows the type of changes made to telecommunications, television, audio and/or video subscription services in the past month to make them more affordable. Those who have cable TV, satellite TV, internet, cellphone, video streaming and/ or audio streaming services were asked this question. A total of 2529 answered as follows:
- Made changes to make services more affordable: 19%.
- Planned on cancelling but was convinced to stay with a better price: 10%.
- Cancelled service entirely: 9%.
- Cancelled and switch to a different provider: 8%.
Among the 19% who made changes to make services more affordable, four in ten made changes to their cellphone service (41%), followed by home internet (33%) or video streaming services (32%), cable TV service (26%), audio streaming services (20%), and satellite TV service (5%).
Among the 10% who were convinced to stay with a better price, just over three in ten mention this was for video streaming services (32%) or home internet (31%), followed by cellphone (28%), cable TV (26%), audio steaming services (22%), and satellite TV service (3%).
Among the 8% who cancelled and switched to a different provider, one-third report this was for their cellphone service (32%), followed by home internet (25%), video streaming services (24%), audio streaming services (20%), cable TV (15%), and satellite TV service (7%).
- Younger Canadians are more likely to have made changes to their cellphone, video streaming or audio streaming services than older Canadians, while those 45 or older (in particular over 55) are more likely to have made changes to their cable TV service than those under 45 years old.
Figure 15: Changes made by type of service(s)
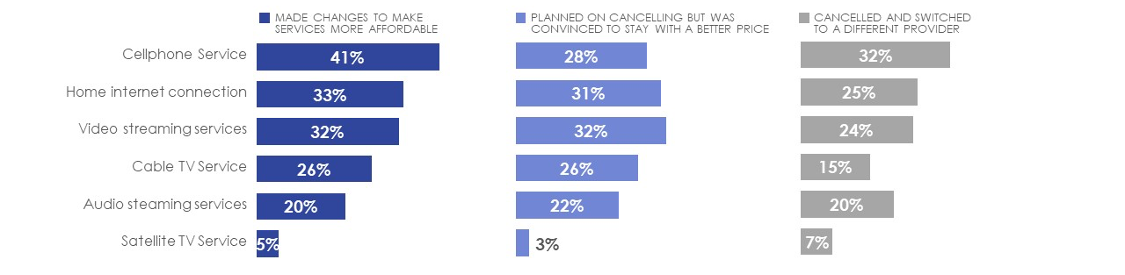
Base: Those who made changes (n=474); planned on cancelling but convinced to stay (n=255); cancelled and switched (n=196)
Q11. Which of these services did you, or someone in your household, ['make changes to'/'plan on cancelling but were convinced to stay with a better price instead'/'cancel and switch to a different provider'] in the last month?
This horizontal bar chart shows the type of changes made by each service in the past month to make them more affordable. Sample size varies by type of change, 474 made changes; 255 planned on cancelling but convinced to stay and 196 cancelled and switched.
- Made changes to make services more affordable: 41% Cellphone service, 33% Home internet connection, 32% Video streaming services, 26% Cable TV service, 20% Audio streaming services, 5% Satellite TV service
- Planned on cancelling but was convinced to stay with a better price: 28% Cellphone service, 31% Home internet connection, 32% Video streaming services, 25% Cable TV service, 22% Audio streaming services, 3% Satellite TV service
- Cancelled and switched to a different provider: 32% Cellphone service, 25% Home internet connection, 24% Video streaming services, 24% Cable TV service, 20% Audio streaming services, 7% Satellite TV service
Among those who planned on cancelling but were convinced to stay with a better price, the main reasons why are because they were able to make their services more affordable (33%), and specifically provided a better price (22%) and received a better deal (11%), followed by switched to better plans or packages (8%).
Figure 16: Reason(s) why for those who planned on cancelling but were convinced to stay with a better price

Base: Those who planned on cancelling but were convinced to stay with a better price (n=255)
Q13. You indicated you had planned on cancelling a service but were convinced to stay with a better price. Please provide more detail on your experience and why you ended up adjusting your services instead of cancelling.
This horizontal bar chart shows the reasons why those who planned on cancelling their services but were convinced to stay with a better price ended up adjusting them instead of cancelling. A total of 255 customers who planned on cancelling their service but were convinced to stay with a better price gave the following reasons:
- More affordable (NET): 33%.
- Provided better price/ saving money: 22%.
- Better deal: 11%.
- Switched to a better plan/ package: 8%.
- Only considering cancelling service: 6%.
- Price is too high for the services offered: 5%.
- Reduced services: 4%.
- Good service: 1%.
- No available options: 1%.
- Poor/ slow connection: 1%.
- Other: 17%.
- Nothing: 4%.
- Don't know: 2%.
- No comment: 27%.
One in ten (9%) Canadians report having cancelled their cable TV service in the past month, 5% home internet, cellphone or satellite TV service, 4% video streaming services and 2% audio streaming services.
- Older Canadians (in particular those 55 or older) are less likely to have cancelled any of the services they receive in the past month than younger Canadians.
- Households with income less than $40k are more likely than higher income households to have cancelled their home internet service (9%) than higher income households.
- Racialized Canadians are more likely than those who are not racialized to have cancelled their cable TV (12%), home internet (8%), cable TV (8%) or satellite TV service (7%), while those who identify as Indigenous are more likely to have cancelled their home internet service (9%) than those who do not.
Figure 17: Cancellation of service entirely
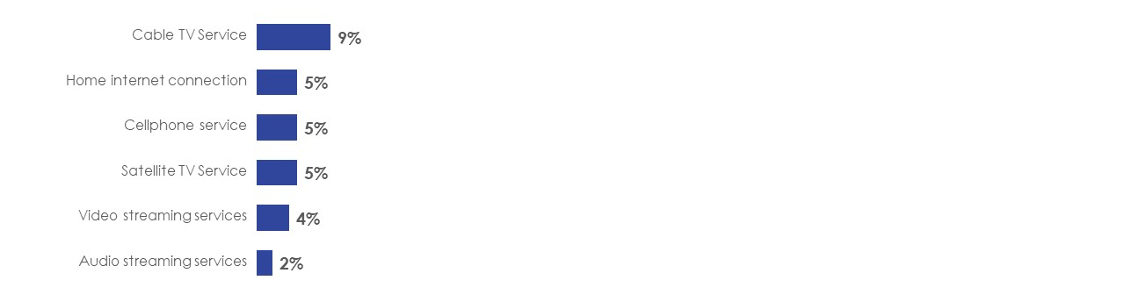
Base: All respondents (n=2561)
Q12. And, which of these services did you, or someone in your household, cancel entirely?
This horizontal bar chart shows the services that were cancelled entirely. A total of 2561 respondents were asked which services they or someone in their household cancelled entirely:
- Cable TV service: 9%.
- Home internet connection: 5%.
- Cellphone service: 5%.
- Satellite TV service: 5%.
- Video streaming service: 4%.
- Audio streaming service: 2%.
Confidence in ability to pay for services
Two-thirds (66%) of Canadians are confident that they will be able to pay for their telecommunications, television, audio and/or video subscription services without making any changes in the next three months. Roughly one-quarter (23%) express more moderate confidence, while 7% are not confident in their ability to pay for their services without making adjustments.
- Canadians 65 or older (70%), men (69%), and residents of Quebec (71%) are more likely to feel confident in their ability to pay for their services, while those who identify as Indigenous (52%), persons with a disability (54%), those with lower household income (in particular less than $40,000, 55%), residents of Atlantic Canada (58%), those who identify as TSLGBTQ+ (59%), and women (63%) are less likely.
Figure 18: Confidence in ability to pay for service(s)
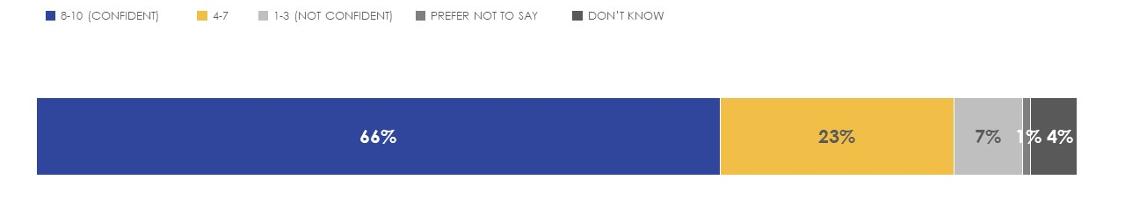
Base: Those who have cable TV, satellite TV, internet, cellphone, video streaming and/ or audio streaming services (n=2529)
Q14. How confident or not are you that you and your household will be able to pay for your telecommunications, television, audio and/or video subscription services without making any changes in the next three months?
This horizontal bar chart shows responses to a question about the confidence customers have in the ability to pay for their services in the next three months. Respondents were asked to provide ratings on a 10-pt scale and results were grouped by those who provided a rating of 8 to 10 as confident, 4 to 7 as neither confident nor not confident and 1 to 3 as not confident. A total of 2529 respondents answered as follows:
- 66% confident, 23% neither confident nor not confident, 7% not confident, 1% prefer not to say and 4% don't know.
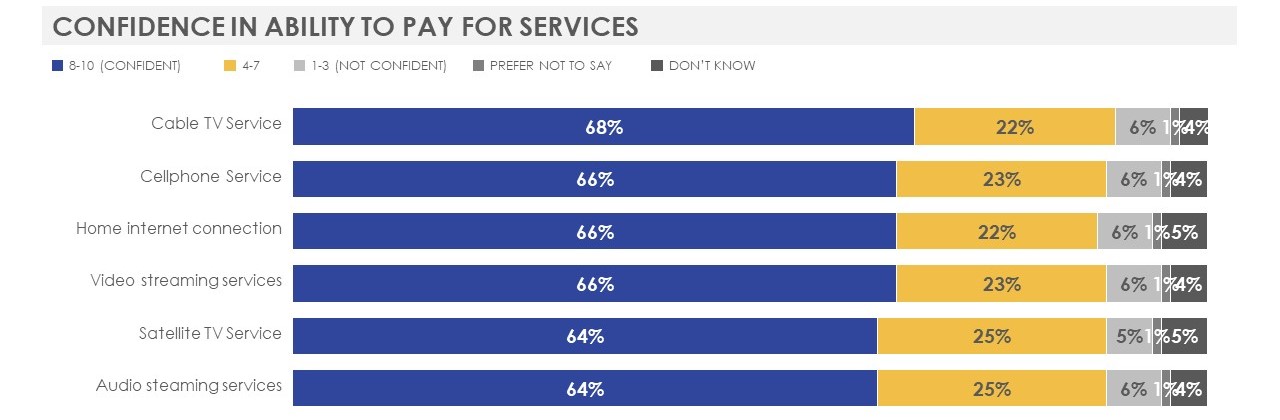
Among those who report they currently have each service, confidence in ability to pay for their services without making any changes in the next three month is consistent by type of service. Roughly two-thirds of those who receive cable TV service are confident in their ability to pay (68%), followed closely by those who have cellphone, internet service or video streaming services (66% each), and those who have satellite TV or audio streaming services (64%).
Figure 19: Confidence in ability to pay by type of service
Base: Those who have Cellphone, Home Internet, Cable TV, Satellite TV, audio or video streaming services (n=varies)
Q14. How confident or not are you that you and your household will be able to pay for your telecommunications, television, audio and/or video subscription services without making any changes in the next three months?
This horizontal bar chart shows responses to a question about the confidence customers have in the ability to pay for their services in the next three months by each type of service. Respondents were asked to provide ratings on a 10-pt scale and results were grouped by those who provided a rating of 8 to 10 as confident, 4 to 7 as neither confident nor not confident and 1 to 3 as not confident. Sample sizes vary.
- Cable TV service: 68% confident, 22% neither confident nor not confident l, 6% not confident, 1% prefer not to say and 4% don't know.
- Cellphone service: 66% confident, 23% neither confident nor not confident, 6% not confident, 1% prefer not to say and 4% don't know.
- Home internet connection: 66% confident, 22% neither confident nor not confident, 6% not confident, 1% prefer not to say and 5% don't know.
- Video streaming services: 66% confident, 23% neither confident nor not confident, 6% not confident, 1% prefer not to say and 4% don't know.
- Satellite TV service: 64% confident, 25% neither confident nor not confident, 5% not confident, 1% prefer not to say and 5% don't know.
- Audio streaming services: 64% confident, 25% neither confident nor not confident, 6% not confident, 1% prefer not to say and 4% don't know.
Usage and Attitudes towards international roaming
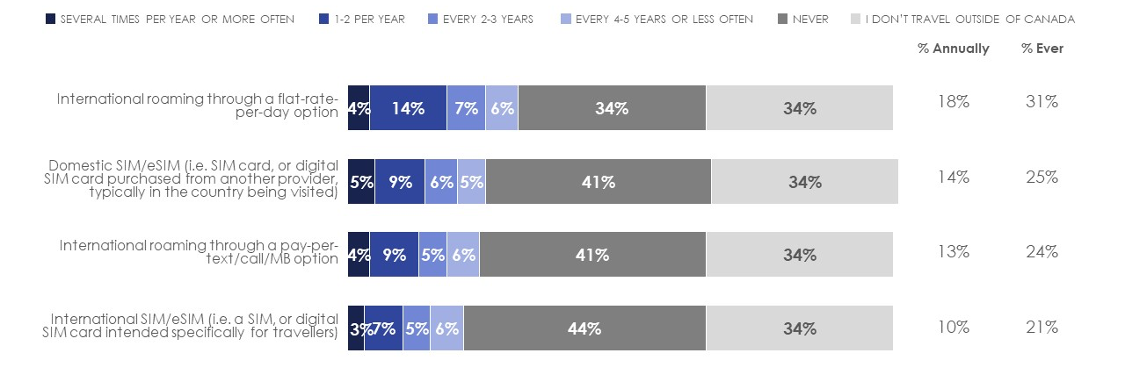
Usage and attitudes towards international roaming were assessed as an ad-hoc issue in the survey. Canadians' use of international calling and texting services are limited with between one-third to more than four in ten (34% to 44%) who have never used any of these products or services. Canadians who have a cellphone for personal use are most likely to report having used international roaming through a flat-rate-per-day option before (31%), followed by domestic SIM/eSIM (25%), international roaming through a pay-per-text/call/MB option (24%) and international SIM/eSIM (21%). Few report using any international calling or text product or service on a frequent basis with the largest proportion (7% to 14%) having used each once or twice a year.
Figure 20: Frequency of use of international calling or text product or service
Base: Those who have cellphone services (n=2318)
Q15. Thinking about when using your personal cellphone while travelling outside of Canada, how often do you use you each of the following types of products or services?
This horizontal bar chart shows responses to a question about the frequency of international roaming use. Respondents were asked how often they use different types of roaming products and services. A total of 2318 cellphone customers answered as follows.
- International roaming through a flat-rate-per-day option: 4% several times per year or more often, 14% once or twice per year, 7% every two to three years, 6% every four to five years or less often, 34% never and 34% don't travel outside of Canada.
- Domestic SIM/eSIM (i.e. SIM card or digital SIM card purchased from another provider, typically in the country being visited): 5% several times per year or more often, 9% once or twice per year, 6% every two to three years, 5% every four to five years or less often, 41% never and 34% don't travel outside of Canada.
- International roaming through a pay-per-text/call/MB option: 4% several times per year or more often, 9% once or twice per year, 5% every two to three years, 6% every four to five years or less often, 41% never and 34% don't travel outside of Canada.
- International SIM/eSIM (i.e. SIM card or digital SIM card intended specifically for travelers): 3% several times per year or more often, 7% once or twice per year, 5% every two to three years, 6% every four to five years or less often, 44% never and 34% don't travel outside of Canada.
Figure 21: Profile of users of international calling or text product or service
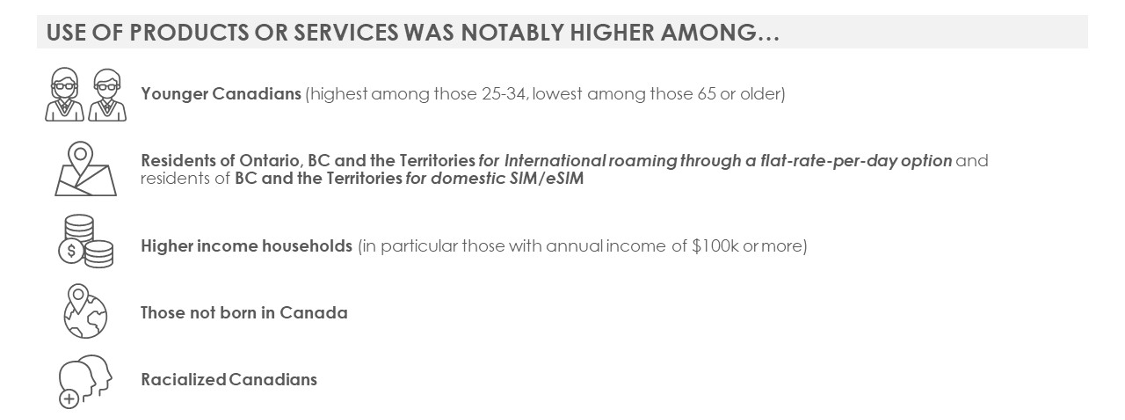
This image shows a profile of users of international calling or text product or service and highlights notable differences in demographics. Use of international calling or text products was notably higher among younger Canadians (highest among those 25-34, lowest among those 65 or older), residents of Ontario, BC and the Territories for International roaming through a flat-rate-per-day option and residents of BC and the Territories for domestic SIM/eSIM, higher income households (in particular those with annual income of $100k or more), those not born in Canada, and racialized Canadians.
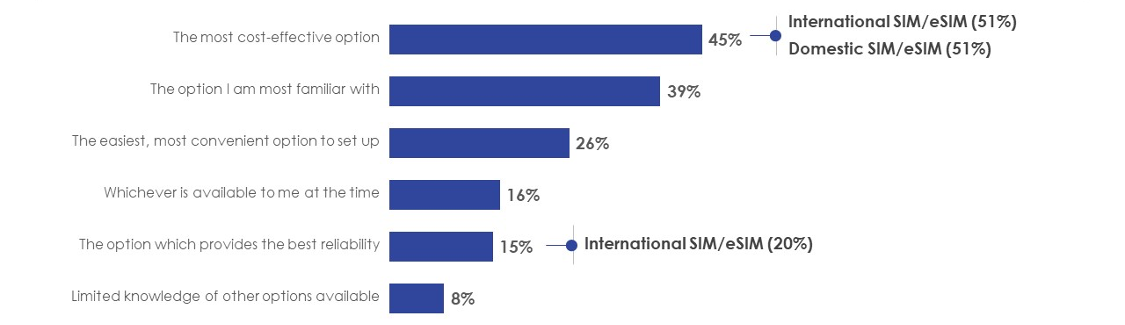
The most common reason for customers using the international calling or text product or service they did is because it was the most cost-effective option (45%), followed by the option they were most familiar with (39%) and the easiest, most convenient option to set up (26%).
- Those who reported having used an international or domestic SIM/eSIM before are more likely to say it was the most cost-effective option, while those who have used an international SIM/eSIM are also more likely to cite that it is the option which provided the best reliability.
- Younger Canadians and those in lower income households are more likely to say it is because it was the most cost-effective option than older Canadians and higher income households respectively.
Figure 22: Reason(s) for using international calling or text product or service
Base: Those who used personal cellphone while travelling outside of Canada (n=1073)
Q16. Generally speaking, what informs your decision about which type of international calling or text product or service to use when travelling outside of Canada? Please select all that apply.
This horizontal bar chart shows the reasons for using international calling or text products or services. Respondents were asked to explain what informs their decision on which type of international roaming product or service to use when travelling outside of Canada. Those who used personal cellphone while travelling outside of Canada. A total of 1073 users answered as follows:
- The most cost-effective option: 45%.
- The option I am more familiar with: 39%.
- The easiest, most convenient option to set up: 26%.
- Whichever is available to me at the time: 16%.
- The option which provides the best reliability: 15%.
- Limited knowledge of other options available: 8%.
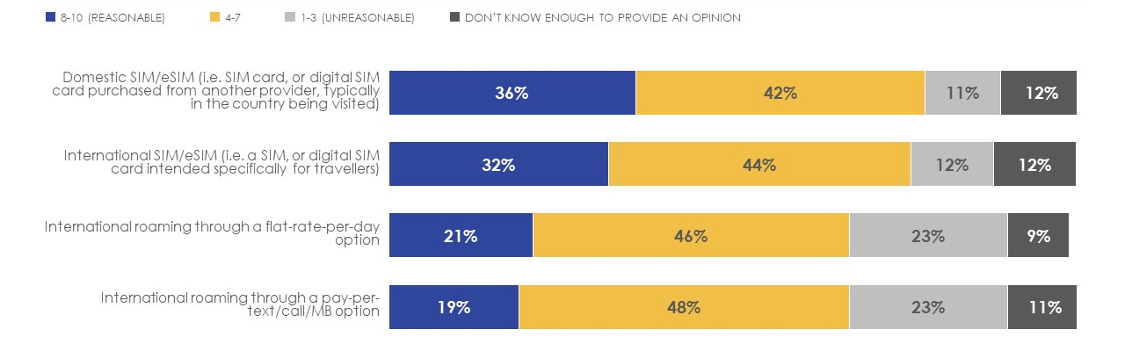
Among those who have used each international calling or text product or service before, relatively few felt the rates and /or cost of purchase were reasonable and most had softer, more moderate impressions. Nearly four in ten who used a domestic SIM/eSIM found the cost reasonable (36%), followed by international SIM/eSIM (32%), international roaming through a flat-rate-per-day option (21%) and international roaming through a pay-per-text/call/MB option (19%).
- Older Canadians are more likely to say that the rates and /or cost of purchase were unreasonable.
Figure 23: Reasonableness of rates and/ or cost of purchase
Base: Those who used for each product/ service while travelling outside of Canada (n=varies)
Q17. Based on your own experience, how reasonable do you feel the rates and/or cost of purchase are for each of the following products or services?
This horizontal bar chart shows responses to a question about the reasonableness of rates and/ or cost of purchase an international roaming products or services. Respondents were asked to provide ratings on a 10-pt scale and results were grouped by those who provided a rating of 8 to 10 as reasonable, 4 to 7 as neither reasonable nor unreasonable and 1 to 3 as unreasonable. Sample sizes vary.
- Domestic SIM/eSIM (i.e. SIM card or digital SIM card purchased from another provider, typically in the country being visited): 36% reasonable, 42% neither reasonable nor unreasonable, 11% unreasonable, 12% don't know enough to provide an opinion.
- International SIM/eSIM (i.e. SIM card or digital SIM card intended specifically for travelers): 32% reasonable, 44% neither reasonable nor unreasonable, 12% unreasonable, 12% don't know enough to provide an opinion.
- International roaming through a flat-rate-per-day option: 21% reasonable, 46% neither reasonable nor unreasonable, 23% unreasonable, 9% don't know enough to provide an opinion.
- International roaming through a pay-per-text/call/MB option: 19% reasonable, 48% neither reasonable nor unreasonable, 23% unreasonable, 11% don't know enough to provide an opinion.
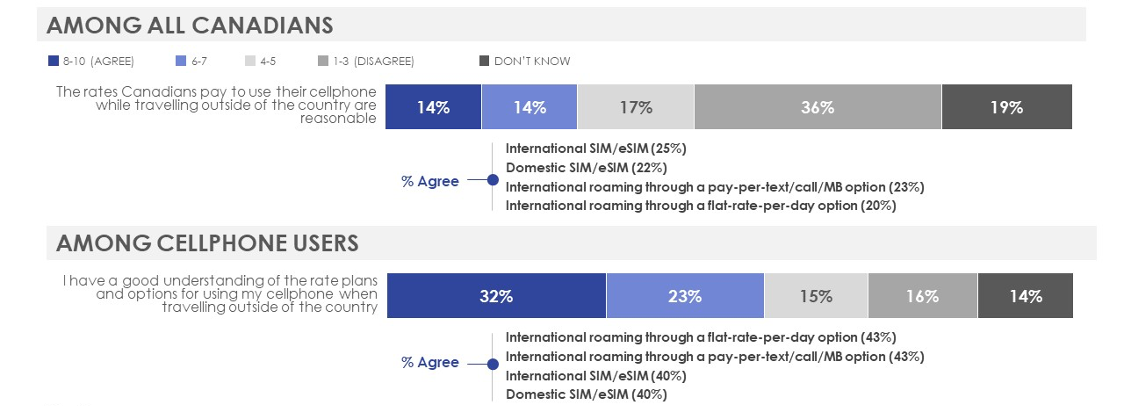
Around one in ten (14%) Canadians agreed that the rates they pay to use their cellphone while travelling outside of the country are reasonable and one third (32%) of those with a cellphone for personal use agree that they have a good understanding of the rate plans/ options for using their cellphone outside of the country. Those who reported having used an international calling or text product or service before are more likely to agree to either statements.
- Older Canadians are more likely than younger Canadians to disagree that the rates and /or cost of purchase are reasonable and that they have a good understanding of the rate plans/ options for using their cellphone outside of the country.
Figure 24: Attitudes towards international calling or text products and services
Base: varies by statement
Q20. Please indicate the extent to which you agree or disagree with each of the following statements.
This horizontal bar charts show responses to a question about the attitudes towards international calling or text products and services. Respondents were asked to state their level of agreement with two statements regarding international roaming on a 10-pt scale and results were grouped by those who provided a rating of 8 to 10 as agree, 6 and 7 as somewhat agree, 4 and 5 as somewhat disagree and 1 to 3 as disagree. Sample sizes vary per statement.
- The rates Canadians pay to use their cellphone while travelling outside of the county are reasonable: 14% agree, 14% somewhat agree, 17% somewhat disagree, 36% disagree and 19% don't know.
- I have a good understanding of the rate plans and options for using my cellphone when travelling outside of the country: 32% agree, 23% somewhat agree, 15% somewhat disagree, 16% disagree and 14% don't know.
Primary source(s) and satisfaction with programming
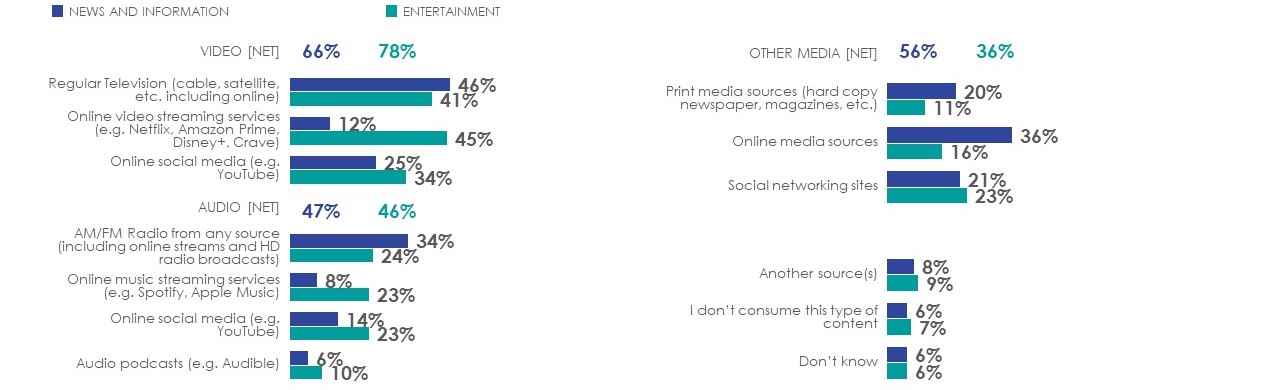
Canadians' primary sources of media content for both 'entertainment' and 'news and information' are video (78% and 66% respectively). Roughly half report their primary sources for either type of content are audio (47% and 46%) and nearly six in ten (56%) use other media sources for 'news and information' compared to roughly four in ten (36%) for 'entertainment' content.
The most common sources of media content for 'news and information' are regular television (46%), followed by online media (36%), AM/FM radio (34%) and online social media (25%). For 'entertainment', the primary sources are online video streaming (45%) and regular television (43%), followed by online social media (34%).
- Older Canadians (in particular those 55 or older) are more likely than younger Canadians to report that their primary sources of 'news and information' content are regular television, AM/FM radio or print media sources and that their primary source of 'entertainment' content is regular television.
- Younger Canadians are more likely than older Canadians to report that their primary sources of 'news and information' or 'entertainment' content are online social media, online video streaming services, audio podcasts, and social networking sites, as well as online music streaming services for 'entertainment' content.
- Residents of Quebec are more likely than those from other regions to report that their primary sources of 'news and information' content are regular television, while residents of BC are more likely to use online or print media sources.
- French-speakers are more likely than English-speakers to report that their primary source of 'news and information' or 'entertainment' content is regular television, while English-speakers are more likely to rely on online video streaming services, online music streaming services, audio podcasts and social networking sites for both types of content.
- Those who identify as Indigenous and racialized Canadians are more likely than those who are not to report that their primary sources of 'news and information' content are online video streaming services and online social media. Racialized Canadians are also more likely than those who are not racialized to report that their primary source of 'entertainment' content are online video streaming services, online social media and online music streaming services.
- Higher income households are more likely than lower income households to report that their primary source of 'entertainment' content are online video streaming services.
Figure 25: Primary source(s) for 'news and information' and 'entertainment' content
Base: All respondents (n=2561)
Q18. What are your primary source(s) of media content for 'news and information' and 'entertainment'? Please select the most common source(s) you use for each.
This horizontal bar chart shows the primary source(s) for 'news and information' and 'entertainment' content. Respondents were asked to indicate which types of media content are their primary sources for each of 'news and information' and 'entertainment'. A total of 2561 respondents answered as follows:
- Regular television (cable, satellite, etc. including online): 46% news and information and 41% entertainment.
- Online video streaming (e.g. Netflix, Amazon Prime, Disney+, Crave): 12% news and information and 45% entertainment.
- Online social media (e.g. YouTube): 25% news and information and 34% entertainment.
- AM/FM Radio from any source (including online streams and HD radio broadcasts): 34% news and information and 24% entertainment.
- Online music streaming services (e.g. Spotify, Apple Music): 8% news and information and 23% entertainment.
- Online social media (e.g. YouTube): 14% news and information and 23% entertainment.
- Audio podcasts (e.g. Audible): 6% news and information and 10% entertainment.
- Print media sources (hard copy newspaper, magazines, etc.): 20% news and information and 11% entertainment.
- Online media sources: 36% news and information and 16% entertainment.
- Social networking sites: 21% news and information and 23% entertainment.
- Another source(s): 8% news and information and 9% entertainment.
- I don't consume this type of content: 6% news and information and 7% entertainment.
- Don't know: 6% news and information and 6% entertainment.
Satisfaction with programming by type of content
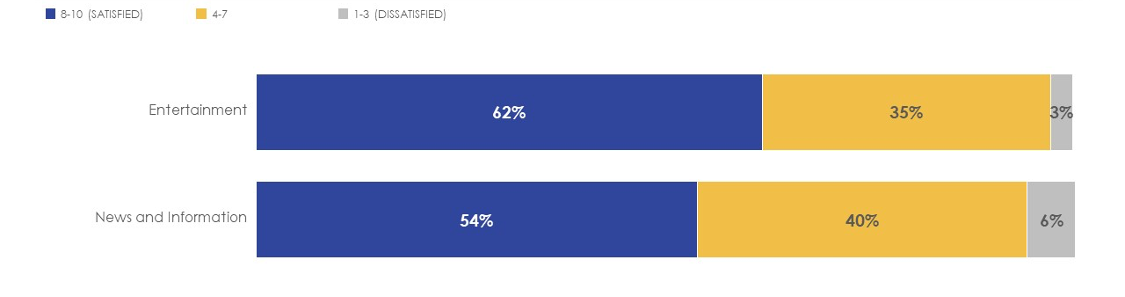
Among those who report they consume each type of programming, six in ten (62%) are satisfied with the 'entertainment' content they receive, while slightly more than half (54%) are satisfied with the 'news and information' content. Between one-third to four in ten express softer levels of satisfaction with either, while few are dissatisfied.
- Canadians 65 or older are more likely than younger Canadians to be satisfied with the 'news and information' content they receive (64%).
- Residents of Quebec are more likely than those from other regions to be satisfied with both the 'entertainment' (69%) and 'news and information' content they receive (64%).
- French-speakers are more likely than English-speakers to be satisfied with both the 'entertainment' (69% vs. 60%) and 'news and information' content they receive (66% vs. 50%).
Figure 26: Satisfaction with quality of content for 'news and information' and 'entertainment'
Base: Those who consume 'entertainment' (n=2239) and/or 'news and information' (n=2274) content
Q19. Overall, how satisfied are you with the quality of content you receive for…?
This horizontal bar chart shows responses to a question about satisfaction with the quality of content received for 'entertainment' and 'news and information'. Respondents were asked to provide ratings on a 10-pt scale and results were grouped by those who provided a rating of 8 to 10 as satisfied, 4 to 7 as neither satisfied nor dissatisfied and 1 to 3 as dissatisfied. Sample size vary by type of content.
- Entertainment: 62% satisfied, 35% neither satisfied nor dissatisfied, 3% dissatisfied. A total of 2239 respondents answered this question.
- News and information: 54% satisfied, 40% neither satisfied nor dissatisfied, 6% dissatisfied. A total of 2274 respondents answered this question.
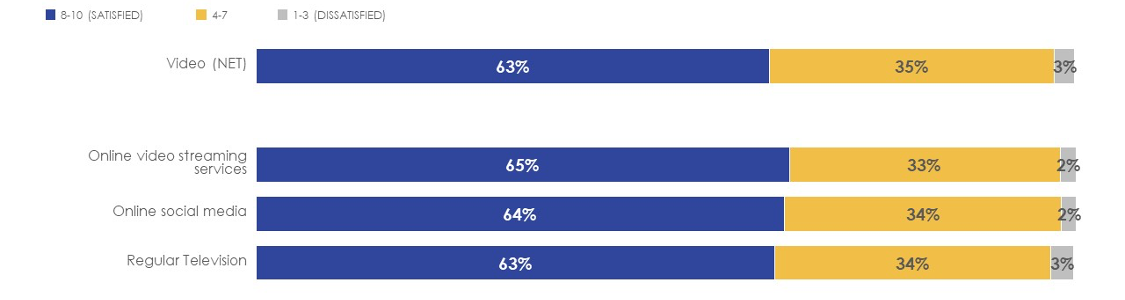
More than six in ten (63%) are satisfied with the quality of 'entertainment' content they receive from video sources, followed by six in ten (60%) for content from audio sources and other types of media sources (61%).
Satisfaction is consistent by the type of video content they receive and more than six in ten are satisfied with the content from online video streaming services (65%), online social media (64%) and regular television (63%).
Figure 27: Satisfaction with quality of content for 'entertainment' by video source(s)
Base: Those who consume 'entertainment' (n=2239) content, base varies by source
Q19. Overall, how satisfied are you with the quality of content you receive for…?
This horizontal bar chart shows responses to a question about satisfaction with quality of content for 'entertainment' by video source(s). Respondents were asked to provide ratings on a 10-pt scale and results were grouped by those who provided a rating of 8 to 10 as satisfied, 4 to 7 as neither satisfied nor dissatisfied and 1 to 3 as dissatisfied. A total of 2239 respondents answered this question as follows:
- Video (NET): 63% satisfied, 35% neither satisfied nor dissatisfied, 3% dissatisfied.
- Online video streaming services: 65% satisfied, 33% neither satisfied nor dissatisfied, 2% dissatisfied.
- Online social media: 64% satisfied, 34% neither satisfied nor dissatisfied, 2% dissatisfied.
- Regular television: 63% satisfied, 34% neither satisfied nor dissatisfied, 3% dissatisfied.
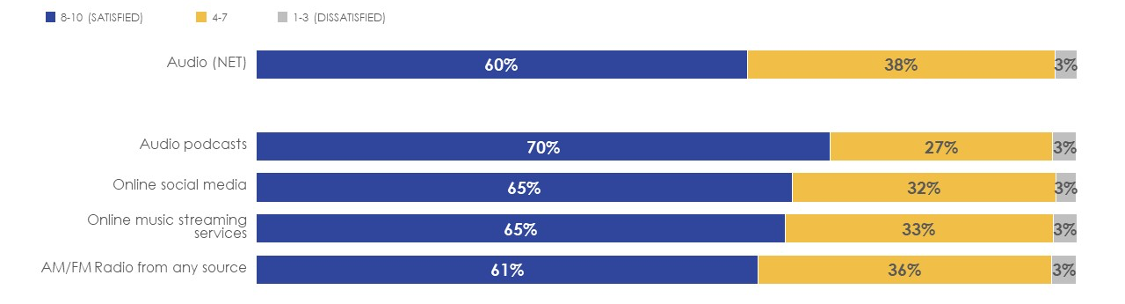
Seven in ten are satisfied with the content from audio podcasts (70%), followed by two-thirds for online social media and online music streaming (65% each), and six in ten for AM/FM radio (61%).
Figure 28: Satisfaction with quality of content for 'entertainment' by audio source(s)
Base: Those who consume 'entertainment' (n=2239) content, base varies by source
Q19. Overall, how satisfied are you with the quality of content you receive for…?
This horizontal bar chart shows responses to a question about satisfaction with quality of content for 'entertainment' by audio source(s). Respondents were asked to provide ratings on a 10-pt scale and results were grouped by those who provided a rating of 8 to 10 as satisfied, 4 to 7 as neither satisfied nor dissatisfied and 1 to 3 as dissatisfied. A total of 2239 respondents answered this question as follows:
- Audio (NET): 60% satisfied, 38% neither satisfied nor dissatisfied, 3% dissatisfied.
- Audio podcasts: 70% satisfied, 27% neither satisfied nor dissatisfied, 3% dissatisfied.
- Online social media: 65% satisfied, 32% neither satisfied nor dissatisfied, 3% dissatisfied.
- Online music streaming services: 65% satisfied, 33% neither satisfied nor dissatisfied, 3% dissatisfied.
- AM/FM radio from any source: 61% satisfied, 36% neither satisfied nor dissatisfied, 3% dissatisfied.
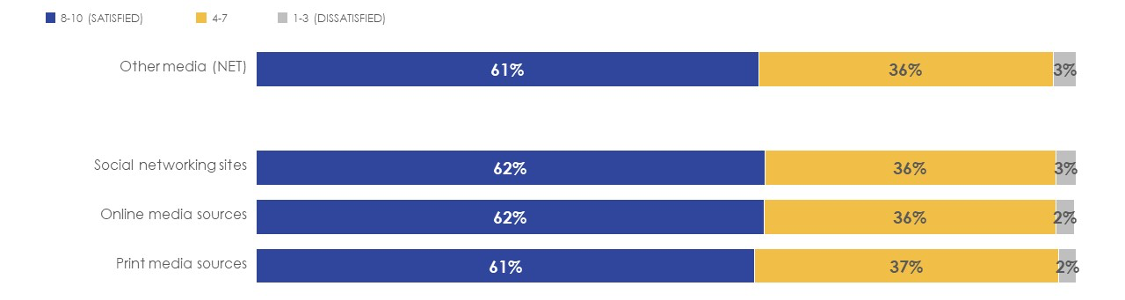
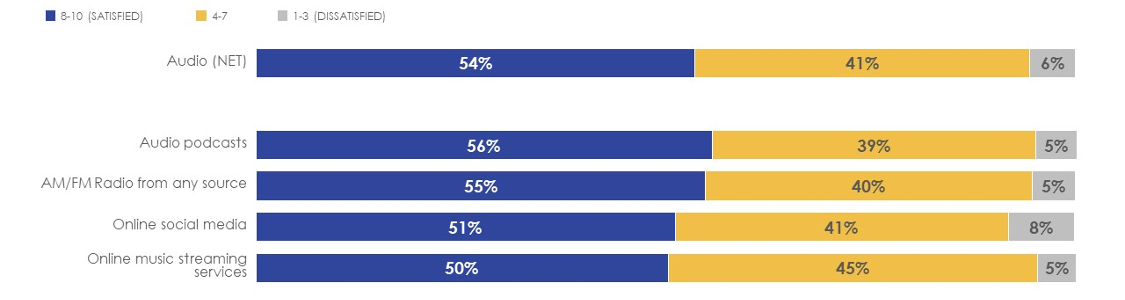
Satisfaction is consistent by the type of other media content and just over six in ten are satisfied with the content from social networking sites and online media (62% each) and print media (61%).
Figure 29: Satisfaction with quality of content for 'entertainment' by other media source(s)
Base: Those who consume 'entertainment' (n=2239) content, base varies by source
Q19. Overall, how satisfied are you with the quality of content you receive for…?
This horizontal bar chart shows responses to a question about satisfaction with quality of content for 'entertainment' by other media source(s). Respondents were asked to provide ratings on a 10-pt scale and results were grouped by those who provided a rating of 8 to 10 as satisfied, 4 to 7 as neither satisfied nor dissatisfied and 1 to 3 as dissatisfied. A total of 2239 respondents answered this question as follows:
- Other media (NET): 61% satisfied, 36% neither satisfied nor dissatisfied, 3% dissatisfied.
- Social networking sites: 62% satisfied, 36% neither satisfied nor dissatisfied, 3% dissatisfied.
- Online media sources: 62% satisfied, 36% neither satisfied nor dissatisfied, 2% dissatisfied.
- Print media sources: 61% satisfied, 37% neither satisfied nor dissatisfied, 2% dissatisfied.
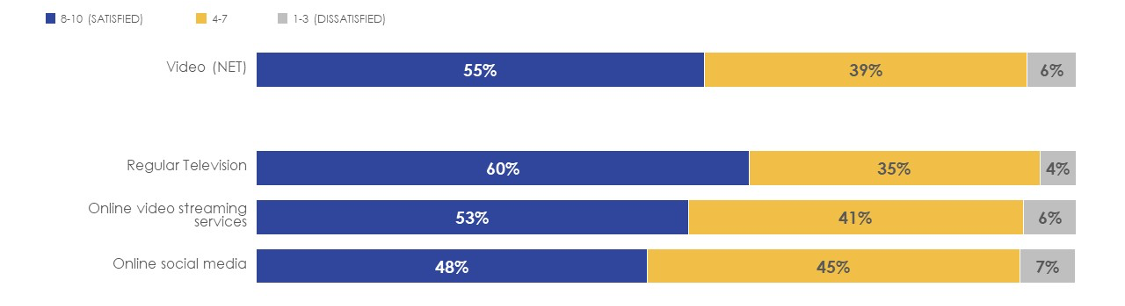
Just over half (55%) are satisfied with the quality of 'news and information' content they receive from video sources, audio sources (54%) or other types of media sources (52%).
Six in ten are satisfied with the video content from regular television (60%), followed by just over half for online video streaming (53%) and roughly half for online social media (48%).
Figure 30: Satisfaction with quality of content for 'news and information' by video source(s)
Base: Those who consume 'news and information' (n=2274) content
Q19. Overall, how satisfied are you with the quality of content you receive for…?
This horizontal bar chart shows responses to a question about satisfaction with quality of content for 'news and information' by video source(s). Respondents were asked to provide ratings on a 10-pt scale and results were grouped by those who provided a rating of 8 to 10 as satisfied, 4 to 7 as neither satisfied nor dissatisfied and 1 to 3 as dissatisfied. A total of 2274 respondents answered this question as follows:
- Video (NET): 55% satisfied, 39% neither satisfied nor dissatisfied, 6% dissatisfied.
- Regular television: 60% satisfied, 35% neither satisfied nor dissatisfied, 4% dissatisfied.
- Online video streaming services: 53% satisfied, 41% neither satisfied nor dissatisfied, 6% dissatisfied.
- Online social media: 48% satisfied, 45% neither satisfied nor dissatisfied, 7% dissatisfied.
Nearly six in ten are satisfied with the content from audio podcasts (56%) and AM/FM radio (55%), followed by closer to half for online social media (51%) and online music streaming services (50%).
Figure 31: Satisfaction with quality of content for 'news and information' by audio source(s)
Base: Those who consume 'news and information' (n=2274) content, base varies by source
Q19. Overall, how satisfied are you with the quality of content you receive for…?
This horizontal bar chart shows responses to a question about satisfaction with quality of content for 'news and information' by audio source(s). Respondents were asked to provide ratings on a 10-pt scale and results were grouped by those who provided a rating of 8 to 10 as satisfied, 4 to 7 as neither satisfied nor dissatisfied and 1 to 3 as dissatisfied. A total of 2274 users answered this question as follows:
- Audio (NET): 54% satisfied, 41% neither satisfied nor dissatisfied, 6% dissatisfied.
- Audio podcasts: 56% satisfied, 39% neither satisfied nor dissatisfied, 5% dissatisfied.
- AM/FM radio from any source: 55% satisfied, 40% neither satisfied nor dissatisfied, 5% dissatisfied.
- Online social media: 51% satisfied, 41% neither satisfied nor dissatisfied, 8% dissatisfied.
- Online music streaming services: 50% satisfied, 45% neither satisfied nor dissatisfied, 5% dissatisfied.
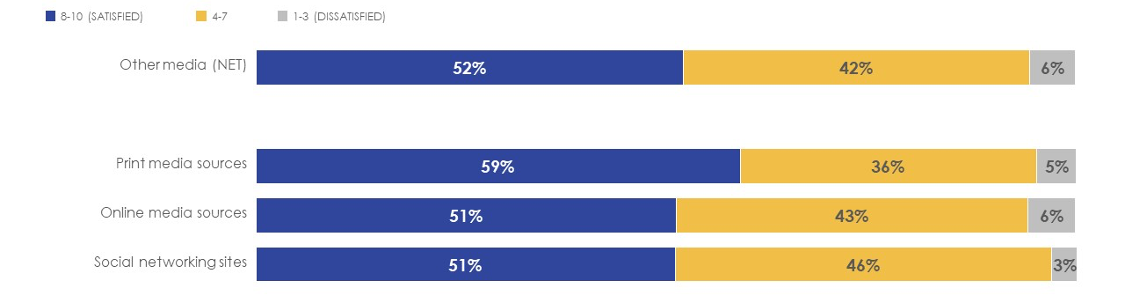
Six in ten are satisfied with the content from print media (59%), followed by roughly half for online media sources and social network sites (51% each).
Figure 32: Satisfaction with quality of content for 'news and information' by other media source(s)
Base: Those who consume 'news and information' (n=2274) content, base varies by source
Q19. Overall, how satisfied are you with the quality of content you receive for…?
This horizontal bar chart shows responses to a question about satisfaction with quality of content for 'news and information' by other media source(s). Respondents were asked to provide ratings on a 10-pt scale and results were grouped by those who provided a rating of 8 to 10 as satisfied, 4 to 7 as neither satisfied nor dissatisfied and 1 to 3 as dissatisfied. A total of 2274 respondents answered this question as follows:
- Other media (NET): 52% satisfied, 42% neither satisfied nor dissatisfied, 6% dissatisfied.
- Print media sources: 59% satisfied, 36% neither satisfied nor dissatisfied, 5% dissatisfied.
- Online media sources: 51% satisfied, 43% neither satisfied nor dissatisfied, 6% dissatisfied.
- Social networking sites: 51% satisfied, 46% neither satisfied nor dissatisfied, 3% dissatisfied.
Broader Attitudes
Attitudes towards broadcasting
At just over half (53%), the majority of Canadians agree that they listen to radio because it is free.
Around four in ten agree that they rely on Canadian news media to help them understand what's going on in the world (45%), and that it's important for them to have access to Canadian-made television programs (41%) and music (38%). Nearly four in ten agree that they trust the information provided by news media in Canada (36%), that the types of news programming offers a variety of perspectives (36%) and that the types of news, music, and television programming is relevant to their life (36%).
Roughly four in ten are satisfied with the quality and variety of Canadian music available today (39% each), the quality of information and analysis offered by Canadian news media (37%) and that news programming covers a diverse range of topics and issues (41%). One-third agree they are satisfied with the quality (35%) and variety (34%) of Canadian television programs, and that they see themselves reflected in the programming available (32%).
Roughly half of Canadians agree that television (49%) and streaming video services (47%) have become less affordable in the past year. One-third agree that the content of streaming platforms should be regulated like traditional broadcasting (34%).
- Canadians 65 and older are more likely than those under 65 to agree that the types of news programming available in Canada offer a variety of opinions and perspectives, that they trust the information provided by news media in Canada to be accurate and impartial, that they rely on Canadian news media to understand what's going on, that it is important to have access to Canadian-made TV programs and music, that programming covers diverse topics and issues, that they are satisfied with the quality and depth of analysis of Canadian news media, and that the content of streaming platforms should be regulated like traditional broadcasting.
- Canadians 45 and older are more likely than those under 45 to agree that TV services have become less affordable in the past year, while those 34-45 are more likely to agree that streaming video services have become less affordable.
- Canadians 45-54 years old are more likely to listen to the radio because it's free than other age groups.
- Residents of Quebec are more likely than those from other regions to agree that they rely on Canadian news media to understand what's going on, that the types of news programming available in Canada offers a variety of opinions and perspectives, that it's important to have access to Canadian-made TV programs and music, that they are satisfied with the quality and variety of Canadian televisions programs and music available today, and the quality and depth of analysis of Canadian news media, and that they see themselves reflected in the programming available.
- French-speakers are more likely than English-speakers to agree that they rely on Canadian news media to understand what's going on, that the types of news programming available in Canada offers a variety of opinions and perspectives, and that they trust the information provided by news media in Canada to be accurate and impartial. They are also more likely to agree that it's important to have access to Canadian-made TV programs and music, that they are satisfied with the quality and variety of Canadian televisions programs and music available today, and the quality and depth of analysis of Canadian news media, that they see themselves reflected in the programming available, and that content available through online video or streaming platforms should be regulated similar to traditional broadcasting.
- Persons with a disability are more likely than those who do not have a disability to agree that television services have become less affordable in the past year, that they rely on Canadian news media to understand what's going on, and that the types of news programming available in Canada offers a variety of opinions and perspectives.
Figure 33: Attitudes towards broadcasting (1/2)
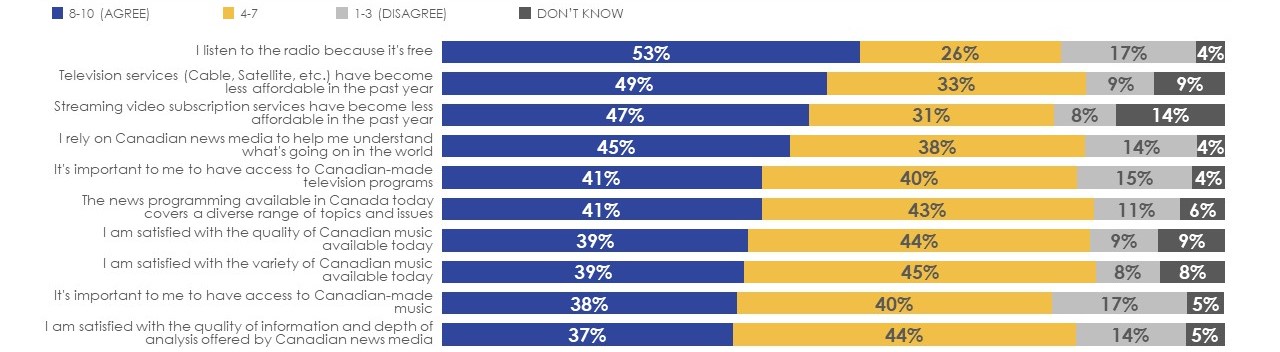
Base: All respondents (n=2561)
Q20. Please indicate the extent to which you agree or disagree with each of the following statements.
This horizontal bar chart shows responses to a question about attitudes towards broadcasting. Respondents were asked to provide their level of agreement with a series of statements regarding broadcasting on a 10-pt scale and results were grouped by those who provided a rating of 8 to 10 as agree, 4 to 7 as neither agree nor disagree and 1 to 3 as disagree. A total of 2561 consumers answered as follows:
- I listen to the radio because it's free: 53% agree, 26% neither agree nor disagree, 17% disagree and 4% don't know.
- Television services (Cable, Satellite, etc.) have become less affordable in the past year: 49% agree, 33% neither agree nor disagree, 9% disagree and 9% don't know.
- Streaming video subscription services have become less affordable in the past year: 47% agree, 31% neither agree nor disagree, 8% disagree and 14% don't know.
- I rely on Canadian news media to help me understand what's going on in the world: 45% agree, 38% neither agree nor disagree, 14% disagree and 4% don't know.
- It's important to me to have access to Canadian-made television programs: 41% agree, 40% neither agree nor disagree, 15% disagree and 4% don't know.
- The news programming available in Canada today covers a diverse range of topics and issues: 41% agree, 43% neither agree nor disagree, 11% disagree and 6% don't know.
- I am satisfied with the quality of Canadian music available today: 39% agree, 44% neither agree nor disagree, 9% disagree and 9% don't know.
- I am satisfied with the variety of Canadian music available today: 39% agree, 45% neither agree nor disagree, 8% disagree and 8% don't know.
- It's important to me to have access to Canadian-made music: 38% agree, 40% neither agree nor disagree, 17% disagree and 5% don't know.
- I am satisfied with the quality of information and depth of analysis offered by Canadian news media: 37% agree, 44% neither agree nor disagree, 14% disagree and 5% don't know.
Figure 34: Attitudes towards broadcasting (2/2)
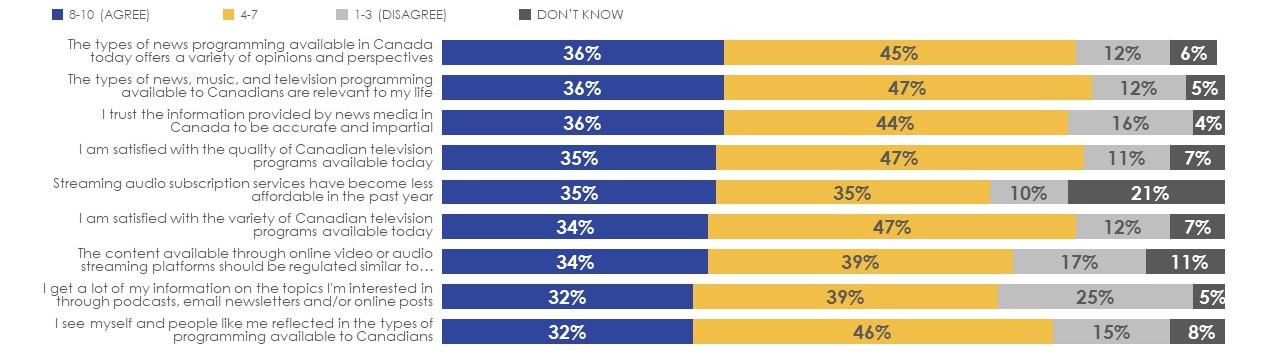
Base: All respondents (n=2561)
Q20. Please indicate the extent to which you agree or disagree with each of the following statements.
This horizontal bar chart shows responses to a question about attitudes towards broadcasting. Respondents were asked to provide their level of agreement with a series of statements regarding broadcasting on a 10-pt scale and results were grouped by those who provided a rating of 8 to 10 as agree, 4 to 7 as neither agree nor disagree and 1 to 3 as disagree. A total of 2561 consumers answered as follows:
- The types of news programming available in Canada today offers a variety of opinions and perspectives: 36% agree, 45% neither agree nor disagree, 12% disagree and 6% don't know.
- The types of news, music, and television programming available to Canadians are relevant to my life: 36% agree, 47% neither agree nor disagree, 12% disagree and 5% don't know.
- I trust the information provided by news media in Canada to be accurate and impartial: 36% agree, 44% neither agree nor disagree, 16% disagree and 4% don't know.
- I am satisfied with the quality of Canadian television programs available today: 35% agree, 47% neither agree nor disagree, 11% disagree and 7% don't know.
- Streaming audio subscription services have become less affordable in the past year: 35% agree, 35% neither agree nor disagree, 10% disagree and 21% don't know.
- I am satisfied with the variety of Canadian television programs available today: 34% agree, 47% neither agree nor disagree, 12% disagree and 7% don't know.
- The content available through online video or audio streaming platforms should be regulated similar to other forms of traditional broadcasting (i.e. television and radio): 34% agree, 39% neither agree nor disagree, 17% disagree and 11% don't know.
- I get a lot of my information on the topics I'm interested in through podcasts, email newsletters and/or online posts: 32% agree, 39% neither agree nor disagree, 25% disagree and 5% don't know.
- I see myself and people like me reflected in the types of programming available to Canadians: 32% agree, 46% neither agree nor disagree, 15% disagree and 8% don't know.
Attitudes towards spam and nuisance
Six in ten Canadians agree that the amount of unsolicited phone calls, emails and text messages has increased in the past year (59%), and roughly half that they often receive unsolicited emails, texts and calls trying to trick them into clicking malicious links or sharing personal information (55%), that they or someone they know have experienced a scam attempt (51%) and that they often receive unsolicited phone calls where they feel they are being tricked into sharing personal information (48%).
- Canadians 55 and older are more likely than those under 55 to agree that the amount of unsolicited phone calls or spam emails and text messages they've received has increased in the past year and that they often receive unsolicited phone calls where they feel they are being tricked into sharing personal information.
- Canadians over 35 years old are more likely than those under 35 to agree that they often receive unsolicited emails trying to trick them into clicking malicious links.
- Higher income households are more likely than lower income households to agree that they often receive unsolicited emails trying to trick them into clicking malicious links, and that they or someone they know have experienced a scam attempt.
- English-speakers are more likely than French-speakers to agree that they or someone they know has experienced a scam attempt in the past month.
Figure 35: Attitudes towards spam and nuisance
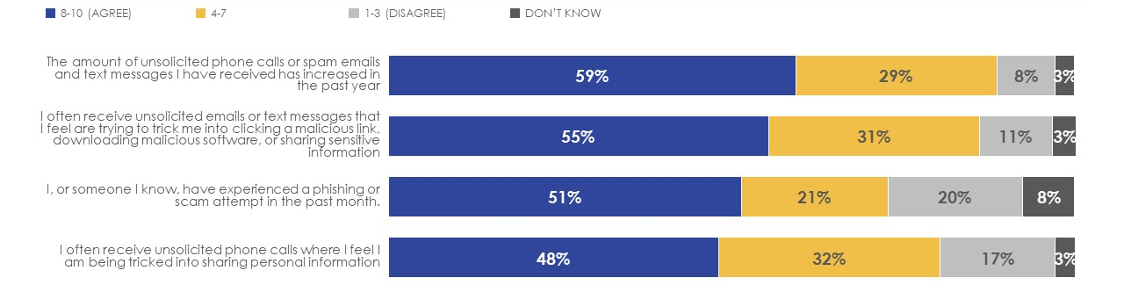
Base: All respondents (n=2561)
Q20. Please indicate the extent to which you agree or disagree with each of the following statements.
This horizontal bar chart shows responses to a question about attitudes towards spam and nuisance. Respondents were asked to provide their level of agreement with a series of statements regarding spam and nuisance on a 10-pt scale and results were grouped by those who provided a rating of 8 to 10 as agree, 4 to 7 as neither agree nor disagree and 1 to 3 as disagree. A total of 2561 consumers answered as follows:
- The amount of unsolicited phone calls or spam emails and text messages I have received has increased in the past year: 59% agree, 29% neither agree nor disagree, 8% disagree and 3% don't know.
- I often receive unsolicited emails or text messages that I feel are trying to trick me into clicking a malicious link, downloading malicious software, or sharing sensitive information: 55% agree, 31% neither agree nor disagree, 11% disagree and 3% don't know.
- I, or someone I know, have experienced a phishing or scam attempt in the past month: 51% agree, 21% neither agree nor disagree, 20% disagree and 8% don't know.
- I often receive unsolicited phone calls where I feel I am being tricked into sharing personal information: 48% agree, 32% neither agree nor disagree, 17% disagree and 3% don't know.
Attitudes towards telecommunications
Six in ten Canadians agree that they can count on reliable high-speed internet (60%) and mobile networks (57%) where they live. Half of Canadians (51%) agree that telecommunications services have become less affordable in the past year. One-third agree that they have enough choice of telecommunications providers (34%).
- Residents of Quebec are more likely than those from other regions to agree that they count on reliable high-speed internet and mobile networks where they live and that they have enough choice of telecommunications providers.
- French-speakers are more likely than English-speakers to agree that they count on reliable high-speed internet and mobile networks where they live and that they have enough choice of telecommunications providers.
- Those who identify as Indigenous and racialized Canadians are less likely than those who are not to agree that they can count on reliable high-speed internet where they live, while those who identify as Indigenous are also less likely to agree that they can count on reliable mobile networks where they live and that they feel they have enough choice of telecommunications providers.
Figure 36: Attitudes towards telecommunications
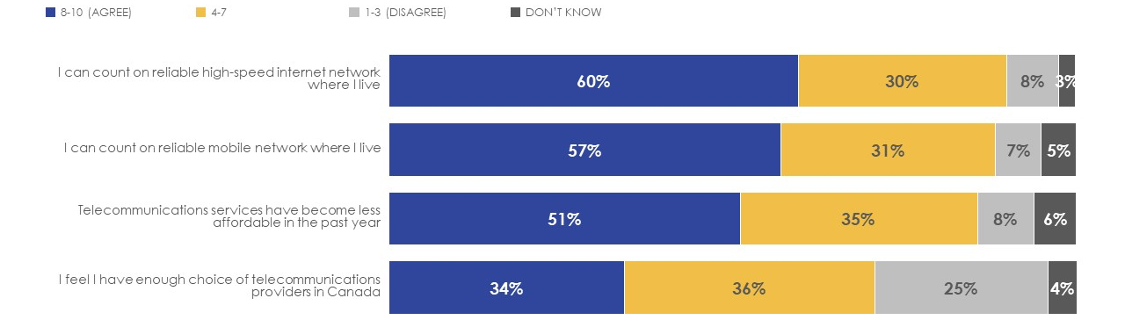
Base: All respondents (n=2561)
Q20. Please indicate the extent to which you agree or disagree with each of the following statements.
This horizontal bar chart shows responses to a question about attitudes towards telecommunications. Respondents were asked to provide their level of agreement with a series of statements regarding telecommunications on a 10-pt scale and results were grouped by those who provided a rating of 8 to 10 as agree, 4 to 7 as neither agree nor disagree and 1 to 3 as disagree. A total of 2561 consumers answered as follows:
- I can count on reliable high-speed internet network where I live: 60% agree, 30% neither agree nor disagree, 8% disagree and 3% don't know.
- I can count on reliable mobile network where I live: 57% agree, 31% neither agree nor disagree, 7% disagree and 5% don't know.
- Telecommunications services have become less affordable in the past year: 51% agree, 35% neither agree nor disagree, 8% disagree and 6% don't know.
- I feel I have enough choice of telecommunications providers in Canada: 34% agree, 36% neither agree nor disagree, 25% disagree and 4% don't know.
Classification Questions
More than nine in ten Canadians report they currently have internet (93%) or cellphone service (91%), while half said they receive cable TV service (51%). Roughly one in ten report they currently have satellite TV (14%) or free television services (10%).
- Canadians 45-64 are most likely to report they currently have internet at home, while those under 25 are least likely. Those 65 or older are less likely to say they receive cellphone service (81%) compared to those who are younger than 65. Canadians over the age of 45 (in particular 65 or older, 68%) are more likely to report they currently have cable TV service than those under the age of 45.
- Households with income less than $60k are less likely to report they currently have cellphone (87%) or internet service (90%) for personal use than those with higher household income.
- Canadians who identify as TSLGBTQ+ are less likely to report they currently have cable TV service (37%) than those who identify as heterosexual (52%).
- Racialized Canadians and those who identify as Indigenous are less likely to report they receive internet at home (92% and 88% respectively) or cable TV services (45% and 40%) than those who are not (95% and 55%). Racialized Canadians are more likely to report they currently have cellphone service (95%) than those who are Indigenous (86%) or not racialized (91%). Those who identify as Indigenous are more likely to report they currently have satellite TV service (26%) than those who are not (13%).
Figure 37: Service(s) received
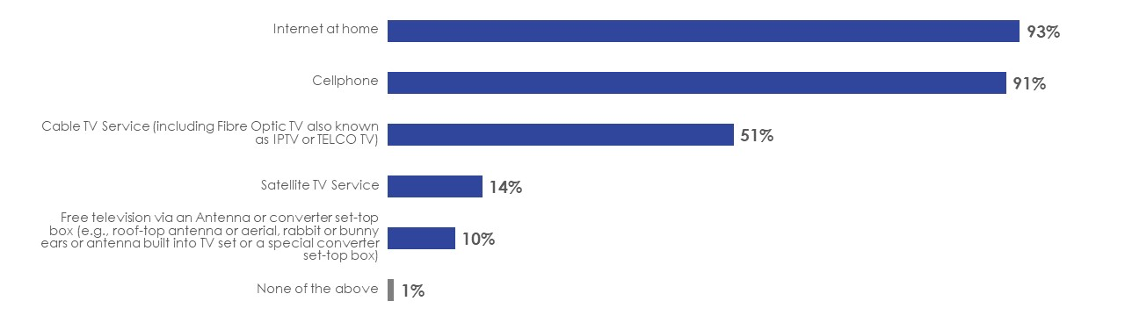
Base: All respondents (n=2561)
Q1. Which of the following telecommunications and television services do you currently have for your personal use? Please select all that apply.
This horizontal bar chart shows the telecommunications and broadcast services that respondents currently have for personal use. A total of 2561 respondents answered as follows:
- Internet at home: 93%.
- Cellphone: 91%.
- Cable TV service (including Fibre Optic TV also known as IPTV or TELCO TV): 51%.
- Satellite TV service: 14%.
- Free television via an Antenna or converter set-top box (e.g., rooftop antenna or aerial, rabbit or bunny ears or antenna built into TV set or a special converter set-top box): 10%.
- None: 1%.
Among those who currently have internet at home, the most common service provider is Bell Canada (20%), followed by Rogers and Telus (both at 13%), Shaw at 11% and Videotron at 9%.
Figure 38: Internet service provider
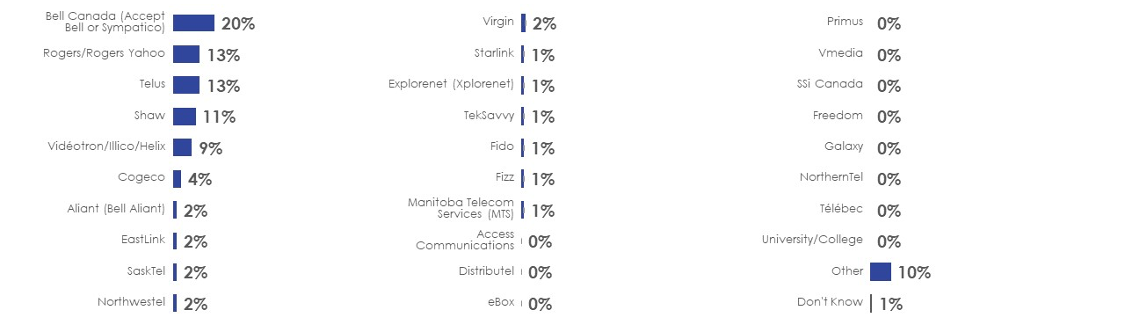
Base: Those who have internet services (n=2390)
Q4. Which company provides your home Internet connection?
This horizontal bar chart shows the internet service provider distribution among internet service customers. A total of 2390 answered as follows:
- Bell Canada (Accept Bell or Sympatico): 20%
- Rogers/Rogers Yahoo: 13%
- Telus: 13%
- Shaw: 11%
- Vidéotron/Illico/Helix: 9%
- Cogeco: 4%
- Aliant (Bell Aliant): 2%
- EastLink: 2%
- SaskTel: 2%
- Northwestel: 2%
- Virgin: 2%
- Starlink: 1%
- Explorenet (Xplorenet): 1%
- TekSavvy: 1%
- Fido: 1%
- Fizz: 1%
- Manitoba Telecom Services (MTS): 1%
- Access Communications : 0%
- Distributel: 0%
- eBox: 0%
- Primus: 0%
- Vmedia: 0%
- SSi Canada: 0%
- Freedom: 0%
- Galaxy: 0%
- NorthernTel: 0%
- Télébec: 0%
- University/College: 0%
- Other: 10%
- Don't know: 1%
Among those who currently have cellphone service, the most common service provider is Bell Mobility (19%), followed closely by Telus Mobility (17%) and Roger Wireless (16%). Other more common service providers include Fido (10%), Virgin Mobile (8%), Koodo Mobile (7%) and Videotron (5%).
Figure 39: Cellphone service provider
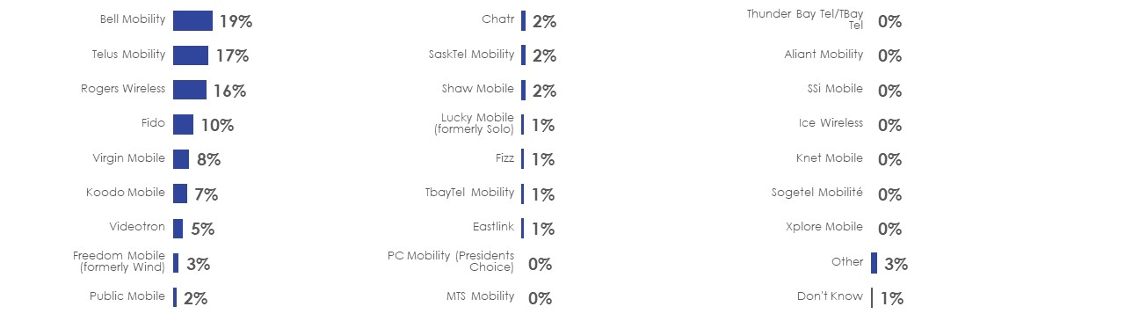
Base: Those who have cellphone services (n=2318)
Q5. Which company provides your cellphone service?
This horizontal bar chart shows the internet service provider distribution among cellphone service customers. A total of 2318 answered as follows:
- Bell Mobility: 19%
- Telus Mobility: 17%
- Rogers Wireless: 16%
- Fido: 10%
- Virgin Mobile: 8%
- Koodo Mobile: 7%
- Videotron: 5%
- Freedom Mobile (formerly Wind): 3%
- Public Mobile: 2%
- Chatr: 2%
- SaskTel Mobility: 2%
- Shaw Mobile: 2%
- Lucky Mobile (formerly Solo): 1%
- Fizz: 1%
- TbayTel Mobility: 1%
- Eastlink: 1%
- PC Mobility (Presidents Choice): 0%
- MTS Mobility: 0%
- Thunder Bay Tel/TBay Tel: 0%
- Aliant Mobility: 0%
- SSi Mobile: 0%
- Ice Wireless: 0%
- Knet Mobile: 0%
- Sogetel Mobilité: 0%
- Xplore Mobile: 0%
- Other: 3%
- Don't know: 1%
Among those who currently have cable TV service, the most common service provider is Bell Fibe TV (19%), followed by Shaw Cable, Telus and Vidéotron (all at 12%). Other more common providers include Rogers Ignite TV and Rogers Cable (8% each), and Cogeco (6%).
Figure 40: Cable TV service provider
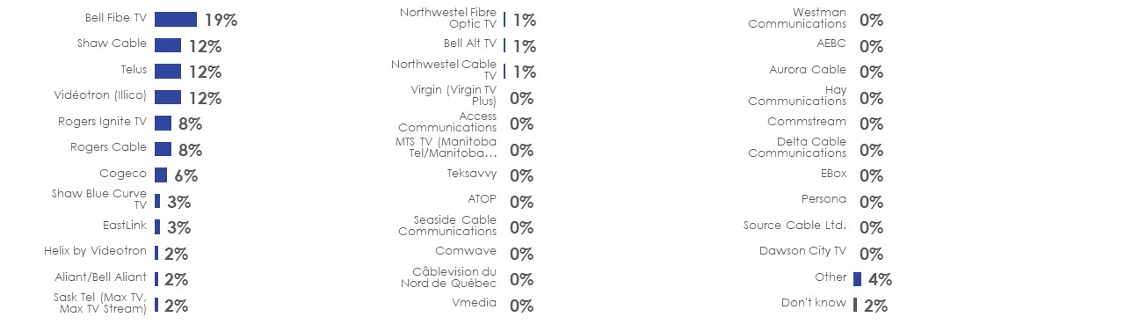
Base: Those who have cable TV service (n=1324)
Q2. Which company provides your Cable TV Service?
This horizontal bar chart shows the internet service provider distribution among cable TV service customers. A total of 1324 answered as follows:
- Bell Fibe TV: 19%
- Shaw Cable: 12%
- Telus: 12%
- Vidéotron (Illico): 12%
- Rogers Ignite TV: 8%
- Rogers Cable: 8%
- Cogeco: 6%
- Shaw Blue Curve TV: 3%
- EastLink: 3%
- Helix by Videotron: 2%
- Aliant/Bell Aliant: 2%
- Sask Tel (Max TV, Max TV Stream): 2%
- Northwestel Fibre Optic TV: 1%
- Bell Alt TV: 1%
- Northwestel Cable TV: 1%
- Virgin (Virgin TV Plus): 0%
- Access Communications: 0%
- MTS TV (Manitoba Tel/Manitoba Telecom Service): 0%
- Teksavvy: 0%
- ATOP: 0%
- Seaside Cable Communications: 0%
- Comwave: 0%
- Câblevision du Nord de Québec: 0%
- Vmedia: 0%
- Westman Communications: 0%
- AEBC: 0%
- Aurora Cable: 0%
- Hay Communications: 0%
- Commstream: 0%
- Delta Cable Communications: 0%
- EBox: 0%
- Persona: 0%
- Source Cable Ltd.: 0%
- Dawson City TV: 0%
- Other: 4%
- Don't know: 2%
Among those who currently have satellite TV service, the most common service provider is Bell Satellite TV (50%), followed by Shaw Direct/Shaw Satellite TV (24%), and Telus (7%).
Figure 41: Satellite TV service provider

Base: Those who have satellite TV service (n=345)
Q3. Which company provides your Satellite TV Service?
This horizontal bar chart shows the internet service provider distribution among satellite TV service customers. A total of 345 answered as follows:
- Bell Satellite TV/(formerly Bell ExpressVu): 50%
- Shaw Direct/Shaw Satellite TV: 24%
- Telus Satellite TV: 7%
- ExpressVu: 1%
- Star Choice (now called Shaw Direct): 1%
- DirecTV (U.S.): 1%
- EchoStar (Dish Network) (U.S.): 0%
- Other: 10%
- Don't know: 6%
Nearly three-quarters (74%) of Canadians report they currently subscribe (or have access to) at least one type of video streaming service. The most common service received is Netflix (54%), followed by Amazon Prime Video (41%), and Disney+ (26%). Other more common services include CRAVE (13%), YouTube Premium (7%), Roku (6%) and Paramount+ Canada (5%).
Figure 42: Video steaming services provider(s)

Base: All respondents (n=2561)
Q6. Do you currently subscribe (or have access) to any of the following video streaming services?
This horizontal bar chart shows the internet service provider distribution among video streaming services customers. A total of 2561 answered as follows:
- Netflix: 54%
- Amazon Prime Video: 41%
- Disney+: 26%
- CRAVE (with or without Movies, +HBO, Starz, or Super Ecran add-ons): 13%
- Apple TV+: 9%
- YouTube Premium: 7%
- Roku: 6%
- Paramount+ Canada: 5%
- CBC Gem: 4%
- Pluto: 3%
- Sportsnet Now: 3%
- TSN+ / RDS: 3%
- Club Illico: 2%
- BritBox: 2%
- tou.tv Extra: 2%
- DAZN: 1%
- None of the above: 26%
Just over half (52%) of Canadians report they currently subscribe (or have access to) at least one type of audio streaming service. The most common service received is Spotify (31%), followed by Amazon Music (12%), Apple Music (11%), YouTube Music (10%), and Sirius XM (7%).
Figure 43: Audio steaming services provider(s)

Base: All respondents (n=2561)
Q7. Do you currently subscribe (or have access) to any of the following audio streaming services?
This horizontal bar chart shows the internet service provider distribution among audio streaming services customers. A total of 2561 answered as follows:
- Spotify: 31%
- Amazon Music: 12%
- Apple Music: 11%
- YouTube Premium / YouTube Music: 10%
- SiriusXM: 7%
- Shazam: 3%
- Audible: 3%
- Soundcloud Go+: 1%
- Deezer: 1%
- Tidal: 1%
- None of the above: 48%
Profile of Respondents
The demographic characteristics of the surveyed populations are presented below. Data presented are weighted proportions.
Figure 44: Profile of respondents (1/5)
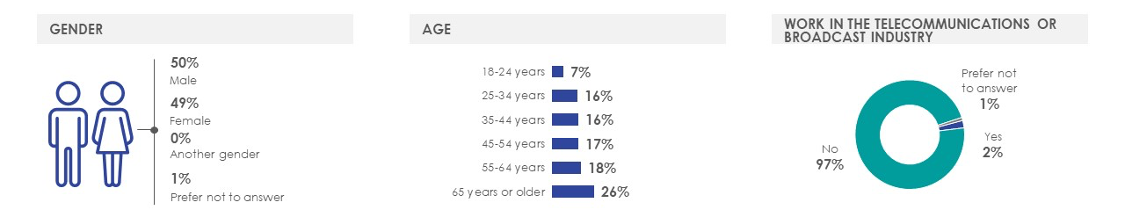
This image details a demographic profile of respondents. The first graphic shows the proportion by gender, the horizontal bar chart shows the age distribution of respondents and the pie chart shows responses to a question about if they work in the telecommunications or broadcast industry or not. A total of 2561 answered as follows:
Gender:
- Male: 50%
- Female: 49%
- Another gender: 0%
- Prefer not to answer: 1%
Age:
- 18-24 years: 7%.
- 25-34 years: 16%.
- 35-44 years: 16%.
- 45-54 years: 17%.
- 55-64 years: 18%.
- 65 years or older: 26%.
Work in the telecommunications or broadcast industry:
- No: 97%
- Yes: 2%
- Prefer not to answer: 1%
Figure 45: Profile of respondents (2/5)
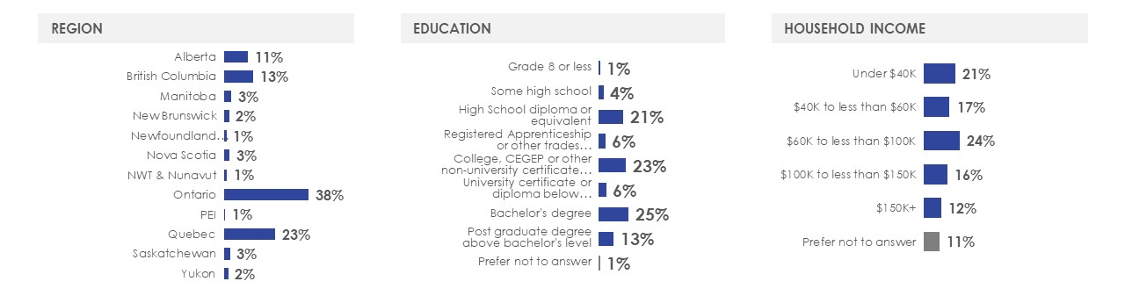
This image details a demographic profile of respondents. Three horizontal bar charts shows the region, education and household income distribution of the respondents. A total of 2561 answered as follows:
Region:
- Alberta: 11%
- British Columbia: 13%
- Manitoba: 3%
- New Brunswick: 2%
- Newfoundland/Labrador: 1%
- Nova Scotia: 3%
- Northwest Territories & Nunavut: 1%
- Ontario: 38%
- Prince Edward Island: 1%
- Quebec: 23%
- Saskatchewan: 3%
- Yukon: 2%
Education:
- Grade 8 or less: 1%
- Some high school: 4%
- High School diploma or equivalent: 21%
- Registered Apprenticeship or other trades certificate or diploma: 6%
- College, CEGEP or other non-university certificate or diploma: 23%
- University certificate or diploma below bachelor's level: 6%
- Bachelor's degree: 25%
- Post graduate degree above bachelor's level: 13%
- Prefer not to answer: 1%
Household income:
- Under $40K: 21%
- $40K to less than $60K: 17%
- $60K to less than $100K: 24%
- $100K to less than $150K: 16%
- $150K+: 12%
- Prefer not to answer: 11%
Figure 46: Profile of respondents (3/5)

This image details a demographic profile of respondents. The pie chart shows if there are children under 18 years old in the household and the horizontal bar chart shows indigenous status of the respondents. A total of 2561 answered as follows:
Household with children under 18:
- Yes: 23%
- No: 76%
- Refused to answer: 1%
Indigenous people:
- No, not an Indigenous person: 93%
- Yes, First Nations (North American Indian): 2%
- Yes, Métis: 2%
- Yes, Inuk (Inuit): 1%
- Prefer not to answer: 3%
Figure 47: Profile of respondents (4/5)
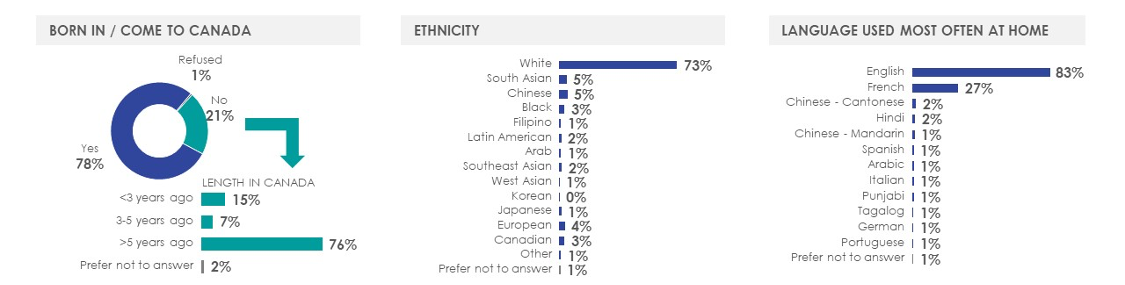
This image details a demographic profile of respondents. The pie chart shows the responses to a question about if respondents were born in Canada, the horizontal bar charts shows the length they've been living in Canada, the ethnicity and the language used most often at home. A total of 2561 answered as follows:
Born in Canada:
- Yes: 78%
- No: 21%
- Refused to answer: 1%
Length in Canada:
- Less than 3 years ago: 15%
- Three to five years ago: 7%
- More than five years ago: 76%
- Prefer not to answer: 2%
Ethnicity:
- White: 73%
- South Asian: 5%
- Chinese: 5%
- Black: 3%
- Filipino: 1%
- Latin American: 2%
- Arab: 1%
- Southeast Asian: 2%
- West Asian: 1%
- Korean: 0%
- Japanese: 1%
- European: 4%
- Canadian: 3%
- Other: 1%
- Prefer not to answer: 1%
Language used most often at home:
- English: 83%
- French: 27%
- Chinese - Cantonese: 2%
- Hindi: 2%
- Chinese - Mandarin: 1%
- Spanish: 1%
- Arabic: 1%
- Italian: 1%
- Punjabi: 1%
- Tagalog: 1%
- German: 1%
- Portuguese: 1%
- Prefer not to answer: 1%
Figure 48: Profile of respondents (5/5)
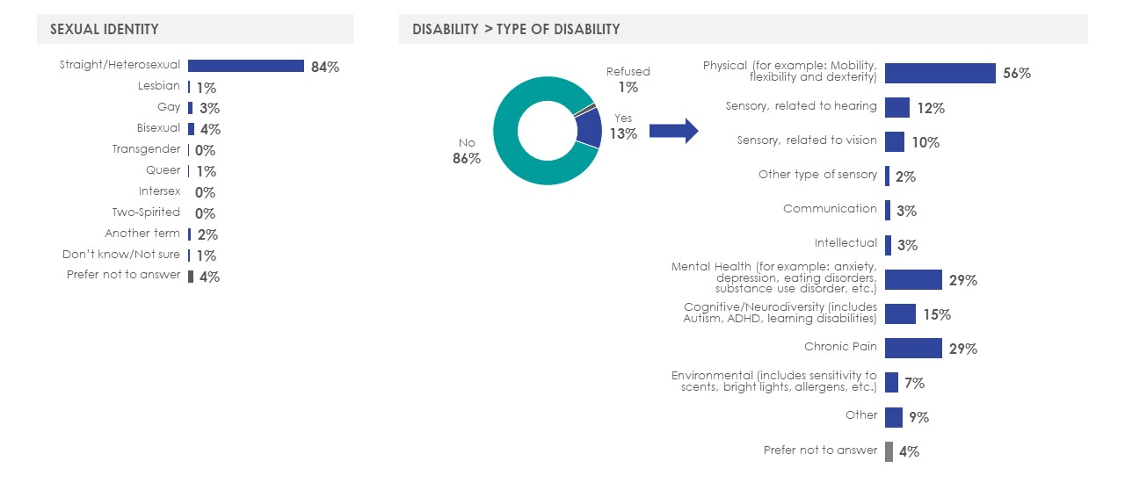
This image details a demographic profile of respondents. The horizontal bar charts shows the responses to a question about the sexual identity of the respondents, the pie chart shows if the respondents have a disability and if yes, the horizontal bar chart shows the type of disability. A total of 2561 answered as follows:
Sexual identity:
- Straight/Heterosexual: 84%
- Lesbian: 1%
- Gay: 3%
- Bisexual: 4%
- Transgender: 0%
- Queer: 1%
- Intersex: 0%
- Two-Spirited: 0%
- Another term: 2%
- Don't know/Not sure: 1%
- Prefer not to answer: 4%
Disability:
- Yes: 13%
- No: 86%
- Refused to answer: 1%
Type of disability:
- Physical (for example: Mobility, flexibility and dexterity): 56%
- Sensory, related to hearing: 12%
- Sensory, related to vision: 10%
- Other type of sensory: 2%
- Communication: 3%
- Intellectual: 3%
- Mental Health (for example: anxiety, depression, eating disorders, substance use disorder, etc.): 29%
- Cognitive/Neurodiversity (includes Autism, ADHD, learning disabilities): 15%
- Chronic Pain: 29%
- Environmental (includes sensitivity to scents, bright lights, allergens, etc.): 7%
- Other: 9%
Prefer not to answer: 4%
Appendix
Detailed Methodology
Ipsos conducted a quantitative survey through a mixed methodology approach including online and telephone interviews among a national sample of 2,561 Canadians aged 18 years and older (1,561 online, 1,000 telephone) stratified to the actual proportion of the Canadian population based on the 2021 Census by age, gender and region. Results were accurate to within + 2.2 percentage points of what the results would have been had every Canadian been polled. Fieldwork was conducted from June 8 to August 4, 2023. Average survey length was 18 minutes (15 minutes online, 22 minutes by telephone) and the survey was offered in English and French.
Minimum sample sizes (of at least 100) were achieved among key audiences including Anglophones (n=1842), Francophones (n-529), Indigenous peoples (n=121), Official Minority Language Communities (n=142), racialized Canadians (n=323), and 2SLGBTQI+ (n=214). Oversamples of TSLGBTQ+ Canadians and those residing in the North were required and notably, fieldwork in the North proved more challenging than anticipated and the target could not be achieved in the fieldwork period (n=82 was achieved).
The online survey was administered using Computer Assisted Web Interviewing (CAWI) and the sample was sourced from the online panel from Ipsos' partner Canadian Viewpoint Inc. The survey platform will be Accessibility for Ontarians with Disabilities Act (AODA) compliant according to Web Content Accessibility Guidelines (WCAG2.0AA). Incentives are not used for recruitment purposes to ensure quality, but respondents are incentivized for completing survey directly proportionate to the amount of time taken to complete the survey and with comparable incentives offered by other online panel sources.
The telephone survey was administered through Computer Assisted Telephone Interviewing (CATI) and included a sampling of Canadians by landline and cell phone. Respondents will be selected at random utilizing a random digit dialing (RDD) approach. In order to help ensure the inclusion of people with disabilities TTY will be offered so that those respondents with hearing or speech impairment can readily participate.
The survey was registered with the Canadian Research Insights Council (CRIC) and a survey registration number made available so that survey respondents had the ability to verify the legitimacy of the survey as a research initiative sponsored by the Government of Canada.
Sample composition and weighting
The table below indicates the unweighted (counts and proportions) and weighted demographic distribution (proportions) of the sample. Weighting was applied to the responses to ensure that the final data reflects the adult population of Canada, as per Statistics Canada Census 2021, by age, gender, and region.
Figure 49: Sample frame
| Age | Unweighted Sample Size | Unweighted Sample Proportions | Weighted Sample Proportions (Based on 2021 Census) |
|---|---|---|---|
| 18-24 | 183 | 7% | 10% |
| 25-34 | 406 | 16% | 17% |
| 35-44 | 412 | 16% | 17% |
| 45-54 | 422 | 17% | 16% |
| 55-64 | 462 | 18% | 18% |
| 65+ | 676 | 26% | 24% |
| Gender | |||
| Men | 1287 | 50% | 49% |
| Women | 1249 | 49% | 51% |
| Other/ Prefer not to answer | 25 | 1% | <1% |
| Region | |||
| BC | 335 | 13% | 14% |
| AB | 270 | 11% | 11% |
| MB/SK | 154 | 6% | 7% |
| ON | 965 | 38% | 38% |
| QC | 585 | 23% | 23% |
| ATLANTIC | 170 | 7% | 7% |
| NORTH | 82 | 3% | <1% |
Non-response Bias
If there is no systematic bias in responding to the survey, the unweighted profile of the survey participants would be very similar to the profile of the Canadian population according to the Statistics Canada Census 2021 (within the sampling error). The tables above demonstrate that, in most cases, the survey sample was very similar to the representative distribution of the Canadian population with respect to age, gender, and region. With respect to region, since disproportionate sampling was employed to provide larger sample sizes among those who reside in the North it was expected that the unweighted proportions for those regions would be higher than the actual proportion of the Canadian population. Aside from this, the unweighted profile of survey participants and the profile of the Canadian population are consistent, indicating that non-response bias was likely not an important factor in this research.
Response Rate
For the online survey, since a non-probability sample was used a response rate cannot be calculated. The following table provides the participation rate for this online survey. The participation rate for this survey was 5%, and it is calculated as follows:
Figure 50: Participation rate calculation
Disposition |
Survey |
|---|---|
Invalid Cases |
0 |
Unresolved (U) |
0 |
In-scope non-responding (IS) |
36,198 |
Responding units (R) |
1,890 |
Participation Rate=R/(R+IS+U) |
5% |
Online survey cases can be broken down into four broad categories:
Invalid Cases
These can include only clearly invalid cases (for example, invitations mistakenly sent to people who did not qualify for the study, or incomplete or missing email addresses in a client-supplied list).
Unresolved (U)
These include all the cases where it cannot be established whether the invitation was sent to an eligible or an ineligible respondent or unit (for example, when email invitations bounce back or remain without an answer before the candidate could be qualified).
In-scope non-responding (IS)
These include all refusals, either implicit or explicit, all non-contacts and early break-offs of known eligible cases, and other eligible non-respondents (due to illness, leave of absence, vacation or other).
Responding units (R)
These include cases who have participated but who were disqualified afterwards (for example, when admissible quotas have been reached). It also includes all completed surveys or partially completed surveys that meet the criteria set by the researcher to be included in the analysis of the data.
Unresolved (U), in-scope (IS), and responding units (R) are all included in the broad category of "potentially eligible" cases. However, invalid cases are not included in the calculation of outcome rates.
For this survey, a router was used to screen potential respondents and assign them to one of the surveys from the router. The router is a platform used to distribute and manage surveys. This means that individuals who were not eligible to participate in this study because they did not meet the screening criteria would be sent to participate in other surveys that might have been available in the router at that point.
The router assignment precedes the actual survey, and given this, it is not possible to estimate the number of cases "invited" to participate and whether they were eligible or not. Therefore, it is not possible to estimate the "unresolved" cases. For this survey, responding units are broken out as follows.
Figure 51: Completions
Disposition |
Survey |
|---|---|
Over quota |
329 |
Qualified Completes |
1561 |
Responding units (R) |
1,890 |
For the telephone survey, the following table provides the response dispositions and response rate calculation. A minimum of five calls were placed in an effort to reach a selected respondent. The overall response rate achieved was 12% and was calculated as follows:
Figure 52: Call Disposition
Call outcome |
Count of disposition |
|---|---|
Call backs |
302 |
Completed Interviews |
1002 |
Disqualified |
484 |
Language Barriers |
285 |
No Answers |
16021 |
Not In Service (Out of Scope) |
59251 |
Over quota |
9 |
Refusals |
11265 |
Terminations |
86 |
TOTAL IN SCOPE |
29454 |
TOTAL RESPONDING |
1486 |
OVERALL RESPONSE RATE |
5% |
Questionnaires
Online Questionnaire
Introduction
Thank you for your interest in taking this survey. The Canadian Radio-television and Telecommunications Commission (CRTC) has commissioned Ipsos, a market research firm, to conduct a public opinion survey. The CRTC is interested in learning your views on a variety of topics related to the telecommunications and broadcast services you use, the impressions of the service you receive and your general attitudes towards the communications sectors in Canada (i.e. cellphone, home phone, TV, radio, online services, etc.).
Your participation is voluntary and completely confidential. Your answers will remain anonymous. The information you provide will be used for research purposes only and will be administered according to the requirements of the Privacy Act, the Access to Information Act, and any other pertinent legislation.
The survey will take about 15 minutes to complete depending on your responses.
Should you wish to verify the credibility of this survey, you can utilize the Canadian Research Insights Council (CRIC) Research Verification Service by clicking here and entering the following project code [insert URL address (not active link) and reference number for research registration system.]
If you have any questions about how to complete the survey or encountered any technical issues, please email Daniel.Kunasingam@ipsos.com.
Thank you in advance for your participation.
Screeners
S1. What is your date of birth?
[DROPDOWN YEAR] 1910 – 2015
[DROPDOWN MONTH] January - December
[IF LESS THAN 18 YEARS OLD, THANK YOU AND TERMINATE]
HIDDEN VARIABLE- AGE QUOTAS
18-24 years
25-34 years
35-44 years
45-54 years
55-64 years
65 years or older
S2. What is your gender?
Male
Female
Non-binary person
Or, please specify:
Prefer not to say
S3. What is your postal code?
Please note: This question may be considered personal. We would like to remind you that your participation is strictly voluntary and that your responses are used for research purposes only. The answers that you provide will be presented in aggregate form and none of them will be linked back to you in any way. All data will be collected and processed in accordance with applicable data protection legislation.
Please enter your 6 digit postal code with no spaces.
Please specify:
Don't know / Prefer not to say
[IF S3 = Don't know/ Prefer not to say ASK S4, OTHERWISE SKIP]
QS4. In which province or territory do you live?
Alberta
British Columbia
Manitoba
New Brunswick
Newfoundland and Labrador
Nova Scotia
Northwest Territories
Nunavut
Ontario
Prince Edward Island
Quebec
Saskatchewan
Yukon
Provider Classification
1. Which of the following telecommunications and television services do you currently have for your personal use? Please select all that apply.
Cellphone
Internet at home
Cable TV Service (including Fibre Optic TV also known as IPTV or TELCO TV)
Satellite TV Service
Free television via an Antenna or converter set-top box (e.g.: Roof-top antenna or aerial, rabbit or bunny ears or antenna built into TV set or a special converter set-top box)
None of the above [MUTUALLY EXCLUSIVE]
[IF SELECTED 'Cable TV Service' AT Q1 ASK Q2, OTHERWISE SKIP]
2. Which company provides your Cable TV Service?
Access Communications
AEBC
Aliant/ Bell Aliant
ATOP
Aurora Cable
Bell Fibe TV
Bell Alt TV
Hay Communications
Câblevision du Nord de Québec
Commstream
Comwave
Cogeco
Delta Cable Communications
EastLink
EBox
Helix by Videotron
MTS TV (Manitoba Tel/Manitoba Telecom Service)
Northwestel Fibre Optic TV
Persona
Rogers Cable
Rogers Ignite TV
Sask Tel (Max TV, Max TV Stream)
Seaside Cable Communications
Shaw Cable
Shaw Blue Curve TV
Source Cable Ltd.
Teksavvy
Telus
Vidéotron (Illico)
Westman Communications
Vmedia
Virgin (Virgin TV Plus)
Dawson City TV
Northwestel Cable TV
Other
Don't know
[IF SELECTED 'Satellite TV Service' AT Q1 ASK Q3, OTHERWISE SKIP]
3. Which company provides your Satellite TV Service?
Bell Satellite TV/ (formerly Bell ExpressVu)
DirecTV (U.S.)
EchoStar (Dish Network) (U.S.)
ExpressVu
Shaw Direct / Shaw Satellite TV
Star Choice (now called Shaw Direct)
Telus Satellite TV
Other
Don't know
[IF SELECTED 'Internet at home' AT Q1 ASK Q4, OTHERWISE SKIP]
4. Which company provides your home Internet connection?
Access Communications
Aliant (Bell Aliant)
Bell Canada (Accept Bell or Sympatico)
Cogeco
Distributel
EastLink
Manitoba Telecom Services (MTS)
NorthernTel
Primus
Rogers /Rogers Yahoo
SaskTel
Shaw
Starlink
TekSavvy
Telus
University/College
Vidéotron/Illico/Helix
Explorenet (Xplorenet)
Télébec
Fido
Virgin
eBox
Fizz
Freedom
Northwestel
Galaxy
SSi Canada
Vmedia
Other
Don't Know
[IF SELECTED 'Cellphone' AT Q1 ASK Q5, OTHERWISE SKIP]
5. Which company provides your cellphone service?
Aliant Mobility
Bell Mobility
Fido
Koodo Mobile
MTS Mobility
PC Mobility (Presidents Choice)
Public Mobile
Rogers Wireless
SaskTel Mobility
Telus Mobility
Videotron
Virgin Mobile
Freedom Mobile (formerly Wind)
Eastlink
Chatr
Lucky Mobile (formerly Solo)
Thunder Bay Tel/TBay Tel
Fizz
Shaw Mobile
Ice Wireless
Knet Mobile
Sogetel Mobilité
SSi Mobile
TbayTel Mobilit
Xplore Mobile
Other
Don't Know
6. Do you currently subscribe (or have access) to any of the following video streaming
services?
[RANDOMIZE]
Netflix
Amazon Prime Video
CRAVE (with or without Movies, +HBO, Starz, or Super Ecran add-ons)
Apple TV+
Disney+
YouTube Premium
Club Illico
Pluto
Roku
Paramount+ Canada
tou.tv Extra
BritBox
CBC Gem
Sportsnet Now
DAZN
TSN+/ RDS
None of the above [MUTUALLY EXCLUSIVE]
7. Do you currently subscribe (or have access) to any of the following audio streaming services?
[RANDOMIZE]
Spotify
Apple Music
YouTube Premium/YouTube Music
Soundcloud Go+
Amazon Music
SiriusXM
Tidal
Deezer
Audible
Shazam
None of the above [MUTUALLY EXCLUSIVE]
Sentiment towards Provider(s)
[LOOP THROUGH Q8 AND Q9 FOR EACH SERVICE INDICATED AT Q1 AND Q6, Q7].
[IF SELECTED 'NONE OF THE ABOVE' OR ONLY 'Free television via an Antenna or converter set-top box' AT Q1 SKIP][PIPE IN SERVICE SELECTED AT Q1 AND PROVIDER SELECTED AT RELEVANT QUESTION DETAILED BELOW][IF RESPONDENT SELECTS 'Other' OR 'Don't Know' AT PROVIDER QUESTION DO NOT INCLUDE SERVICE IN LIST][IF RESPONDENT SELECTS ONLY 'Any sports video streaming services (e.g. Sportsnet Now, DAZN)' OR 'NONE OF THE ABOVE' AT Q6 SKIP]
- Cellphone service [INSERT PROVIDER SELECTED AT Q5]
- Home internet connection [INSERT PROVIDER SELECTED AT Q4]
- Cable TV Service [INSERT PROVIDER SELECTED AT Q2]
- Satellite TV Service [INSERT PROVIDER SELECTED AT Q3]
- Video streaming services [INSERT SERVICES SELECTED AT Q6]
- Audio steaming services [INSERT SERVICES SELECTED AT Q7]
8. Overall, how satisfied are you with the [INSERT SERVICE] you receive from [INSERT PROVIDER]?
SCALE 1- 10: 1 'Very dissatisfied', 10 'Very satisfied'
9. You provided a rating of [INSERT RATING FROM Q8] out of 10 for the [INSERT SERVICE] you receive from [INSERT PROVIDER]. Why do you say that? Please be as detailed in your response as possible.
[OPEN END]
No comment
[ASK Q10 IF Q1 EQUAL ANY OF CELLPHONE, HOME INTERNET, CABLE TV, SATELLITE TV, OTHERWISE SKIP TO Q12 THEN SKIP TO Q18]
10. Thinking about the last month, have you or anyone in your household made changes to any of your telecommunications, television, audio and/or video subscription services (e.g. changed package) in order to make them more affordable, planned on cancelling but was convinced to stay with a better price or cancelled any services (and/or switched to a different provider) because you could no longer afford them?
[ROWS]
Made changes to make services more affordable
Planned on cancelling but was convinced to stay with a better price
Cancelled and switched to a different provider
Cancelled service entirely
[COLUMNS]
Yes
No
[IF SELECTED YES TO EITHER 'Made changes', 'Planned on cancelling' OR 'Cancelled and switched to a different provider' AT Q10 ASK Q11, OTHERWISE SKIP]
11. Which of these services did you, or someone in your household, [IF SELECTED 'Made changes' at Q10 INSERT 'make changes to'],[IF SELECTED 'Planned on cancelling' at Q10 INSERT 'plan on cancelling but were convinced to stay with a better price instead'],[IF SELECTED 'Cancelled' INSERT 'cancel and switch to a different provider'] in the last month?
[ROWS]
[INSERT SERVICE(S) ASKED AT Q8]
[COLUMNS]
Made changes to make services more affordable
Planned on cancelling but was convinced to stay with a better price
Cancelled and switched to a different provider
12. And, which of these services did you, or someone in your household, cancel entirely?
Cellphone service
Home internet connection
Cable TV Service
Satellite TV Service
[IF NONE OF THE ABOVE IS SELECTED AT Q6 INSERT 'Video streaming services']
[IF NONE OF THE ABOVE IS SELECTED AT Q7 INSERT 'Audio steaming services']
[IF SELECTED 'Planned on cancelling but was convinced to stay with a better price' AT Q10 ASK Q13, OTHERWISE SKIP]
13. You indicated you had planned on cancelling a service but were convinced to stay with a better price. Please provide more detail on your experience and why you ended up adjusting your services instead of cancelling.
[INSERT TEXT BOX]
No comment
14. How confident or not are you that you and your household will be able to pay for your telecommunications, television, audio and/or video subscription services without making any changes in the next three months?
SCALE 1- 10: 1 'Not at all confident', 10 'Very confident'
Prefer not to say
Don't know
Usage and attitudes towards international roaming
[IF SELECTED 'Cellphone' AT Q1 ASK SECTION, OTHERWISE SKIP]
15. Thinking about when using your personal cellphone while travelling outside of Canada, how often do you use you each of the following types of products or services?
[ROWS][RANDOMIZE]
International roaming through a flat-rate-per-day option
International roaming through a pay-per-text/call/MB option
International SIM/eSIM (i.e. a SIM, or digital SIM card intended specifically for travellers)
Domestic SIM/eSIM (i.e. SIM card, or digital SIM card purchased from another provider, typically in the country being visited)
[COLUMNS]
Several times per year or more often
Once or twice per year
Every two to three years
Every four to five years or less often
Never
I don't travel outside of Canada
[IF NEVER OR I DON'T TRAVEL OUTSIDE OF CANADA TO ALL OPTIONS AT Q15 SKIP Q16, OTHERWISE CONTINUE]
16. Generally speaking, what informs your decision about which type of international calling or text product or service to use when travelling outside of Canada? Please select all that apply.
The most cost-effective option
Whichever is available to me at the time
The easiest, most convenient option to set up
The option I am most familiar with
The option which provides the best reliability
Limited knowledge of other options available
Other – Please specify [INSERT TEXT BOX]
17. Based on your own experience, how reasonable do you feel the rates and/or cost of purchase are for each of the following products or services?
[ROWS]
INSERT OPTIONS FROM Q15 WHERE RESPONSE IS NOT 'NEVER'
[COLUMNS][SCALE]
1- 10: 1 'Very unreasonable', 10 'Very reasonable', Don't know enough to provide an opinion
Primary source(s) and satisfaction with programming
18. What are your primary source(s) of media content for 'news and information' and 'entertainment'? Please select the most common source(s) you use for each.
[ROWS]
News and information
Entertainment
[COLUMNS]Video [HEADER]
Regular Television (cable, satellite, etc. including online)
Online video streaming services (e.g. Netflix, Amazon Prime, Disney+, Crave)
Online social media (e.g. YouTube)
Audio [HEADER]
AM/FM Radio from any source (including online streams and HD radio broadcasts)
Online music streaming services (e.g. Spotify, Apple Music)
Online social media (e.g. YouTube)
Audio podcasts (e.g. Audible)
Other Media [HEADER]
Print media sources (hard copy newspaper, magazines, etc.)
Online media sources
Social networking sites
Another source(s)
I don't consume this type of content [MUTUALLY EXCLUSIVE]
Don't know [MUTUALLY EXCLUSIVE]
[IF SELECTED 'I don't consume this type of programming' OR 'Don't know' FOR ALL ITEMS AT Q18 SKIP, OTHERWISE CONTINUE]
19. Overall, how satisfied are you with the quality of content you receive for…?
[ROWS][RANDOMIZE]
[INSERT ITEMS FROM Q18 WHERE RESPONSE IS NOT 'I don't consume this type of programming' OR 'Don't know']
News and information
Entertainment
[COLUMNS]
SCALE 1- 10: 1 'Very dissatisfied', 10 'Very satisfied'
Broader Attitudes
20. Please indicate the extent to which you agree or disagree with each of the following statements.
[ROWS][RANDOMIZE]
BROADCASTING [HEADER, DO NOT PROGRAM]
I trust the information provided by news media in Canada to be accurate and impartial
The types of news programming available in Canada today offers a variety of opinions and perspectives
The news programming available in Canada today covers a diverse range of topics and issues
I rely on Canadian news media to help me understand what's going on in the world
I am satisfied with the quality of information and depth of analysis offered by Canadian news media
It's important to me to have access to Canadian-made music
It's important to me to have access to Canadian-made television programs
I am satisfied with the variety of Canadian music available today
I am satisfied with the variety of Canadian television programs available today
I am satisfied with the quality of Canadian music available today
I am satisfied with the quality of Canadian television programs available today
I see myself and people like me reflected in the types of programming available to Canadians
The types of news, music, and television programming available to Canadians are relevant to my life
I get a lot of my information on the topics I'm interested in through podcasts, emails newsletters and/or online posts
Television services (Cable, Satellite, etc.) have become less affordable in the past year
Streaming video subscription services have become less affordable in the past year
Streaming audio subscription services have become less affordable in the past year
I listen to the radio because it's free
The content available through online video or audio steaming platforms should be regulated similar to other forms of traditional broadcasting (i.e. television and radio)
SPAM AND NUISANCE [HEADER, DO NOT PROGRAM]
I, or someone I know, have experienced a phishing or scam attempt in the past month.
I often receive unsolicited phone calls where I feel I am being tricked into sharing personal information
I often receive unsolicited emails or text messages that I feel are trying to trick me into clicking a malicious link, downloading malicious software, or sharing sensitive information
The amount of unsolicited phone calls or spam emails and text messages I have received has increased in the past year
TELECOMMUNICATIONS [HEADER, DO NOT PROGRAM]
Telecommunications services have become less affordable in the past year
I can count on reliable high-speed internet network where I live
I can count on reliable mobile network where I live
I feel I have enough choice of telecommunications providers in Canada
The rates Canadians pay to use their cellphone while travelling outside of the country are reasonable
[IF SELECTED 'Cellphone' AT Q1 ASK] I have a good understanding of the rate plans and options for using my cellphone when travelling outside of the country
[COLUMNS][SCALE]
1- 10: 1 'Strongly disagree', 10 'Strongly agree', Don't know
Classification questions
We have a couple final questions for statistical classification purposes. Please indicate the answer that best describes you. Be assured that your responses will be held in strict confidence.
21. On average, how much per month, does your household spend on each of the following services?
[INSERT SERVICE(S) INDICATED AT Q1. IF SELECTED 'NONE OF THE ABOVE' OR ONLY 'Free television via an Antenna or converter set-top box' AT Q1 SKIP][PIPE IN SERVICE SELECTED AT Q1]
Cellphone service $[INSERT PRICE RANGE]
Home internet connection $[INSERT PRICE RANGE]
TV Service (Cable, Satellite or Fibre Optic) $[INSERT PRICE RANGE]
[INSERT STREAMING TV SERVICES SELECTED AT Q6] $[INSERT PRICE RANGE]
[INSERT STREAMING AUDIO SERVICES SELECTED AT Q7] $[INSERT PRICE RANGE]
22. Do you work in the telecommunications or broadcast industry?
Yes
No
Prefer not to answer
23. Please indicate your annual household income before taxes.
Less than $5,000
$5,000-$9,999
$10,000-$14,999
$15,000-$19,999
$20,000-$24,999
$25,000-$29,999
$30,000-$34,999
$35,000-$39,999
$40,000-$44,999
$45,000-$49,999
$50,000-$54,999
$55,000-$59,999
$60,000-$64,999
$65,000-$69,999
$70,000-$74,999
$75,000-$79,999
$80,000-$84,999
$85,000-$89,999
$90,000-$94,999
$95,000-$99,999
$100,000-$124,999
$125,000-$149,999
$150,000-$199,999
$200,000-$249,999
$250,000 or more
Prefer not to answer
24. What is the highest degree or level of school you have completed?
Grade 8 or less
Some high school
High School diploma or equivalent
Registered Apprenticeship or other trades certificate or diploma
College, CEGEP or other non-university certificate or diploma
University certificate or diploma below bachelor's level
Bachelor's degree
Post graduate degree above bachelor's level
Prefer not to answer
25. Are there any children under 18 years old living or staying at your current address?
Yes
No
Prefer Not to Answer
26. Were you born in Canada?
Yes
No
Prefer not to answer
[IF NO AT Q26 ASK Q27, OTHERWISE SKIP]
27. How long have you lived in Canada?
Less than three years
Three to five years
More than five years
Prefer not to answer
28. Are you an Indigenous person, that is, First Nations (North American Indian), Métis or Inuk (Inuit)? If "Yes", choose the option(s) that best describe(s) you. First Nations (North American Indian) includes both Status and Non-Status Indians.
No, not an Indigenous person [EXCLUSIVE]
Yes, First Nations (North American Indian)
Yes, Métis
Yes, Inuk (Inuit)
Prefer not to answer [EXCLUSIVE]
[IF NO AT Q28 ASK Q29, OTHERWISE SKIP]
29. Are you? Mark more than one option or specify, if applicable.
White
South Asian (e.g., East Indian, Pakistani, Sri Lankan, etc.)
Chinese
Black
Filipino
Latin American
Arab
Southeast Asian (e.g., Vietnamese, Cambodian, Laotian, Thai, etc.)
West Asian (e.g., Iranian, Afghan, etc.)
Korean
Japanese
Other — specify
Prefer not to answer
30. What is the language you use most often at home? If you use more than one language at home, please rank the two most used languages.[RANKING QUESTION, MUST RANK AT LEAST 'FIRST']
French
English
American Sign Language (ASL)
Arabic
Bengali
Chinese - Cantonese
Chinese - Mandarin
Chinese - other
Cree
Farsi
German
Greek
Gujurati
Hindi
Inuktitut
Italian
Japanese
Korean
Ojibwe
Portuguese
Punjabi
Quebec Sign Language (LSQ)
Russian
Spanish
Tagalog
Tamil
Urdu
Vietnamese
Other
Prefer not to answer
31. Do you consider yourself to be: [MULTIPUNCH]
Straight/Heterosexual
Lesbian
Gay
Bisexual
Transgender
Queer
Intersex
Two-Spirited
Another term
Don't know/Not sure [MUTUALLY EXCLUSIVE][ANCHOR]
Prefer not to answer [MUTUALLY EXCLUSIVE][ANCHOR]
32. Do you identify as a person with a disability?
Yes
No
Prefer not to answer
[IF YES AT Q32 ASK Q33, OTHERWISE SKIP]
33. What type of disability do you have?
Physical (for example: Mobility, flexibility and dexterity)
Sensory, related to hearing
Sensory, related to vision
Other type of sensory
Communication
Intellectual
Mental Health (for example: anxiety, depression, eating disorders, substance use disorder, etc.)
Cognitive/Neurodiversity (includes Autism, ADHD, learning disabilities)
Chronic Pain
Environmental (includes sensitivity to scents, bright lights, allergens, etc.)
Other
Prefer not to answer
Telephone Questionnaire
Introduction
Hello, my name is (FULL NAME), AND I'm calling from Ipsos, an independent research company. We're conducting a survey for the CRTC (IF NEEDED: Canadian Radio-television and Telecommunications Commission) to ask your opinions on a variety of topics related to the telecommunications and broadcast services you use, the impressions of the service you receive and your general attitudes towards the communications sectors in Canada.
This survey will only take around 15 minutes. Just to confirm are you 18 years of age or older?
Would you prefer to continue in English or French?
Bonjour, je m'appelle (NOM COMPLET) et j'appelle de la part d'Ipsos, une société indépendante d'études de marché. Nous menons un sondage pour le CRTC (SI NÉCESSAIRE : Conseil de la radiodiffusion et des télécommunications canadiennes) pour vous demander votre avis à propos de divers sujets liés aux services de télécommunications et de diffusion que vous utilisez, vos impressions sur le service que vous recevez et vos attitudes générales envers les secteurs des communications au Canada.
Il ne vous faudra que 15 minutes environ pour répondre au sondage. Seulement pour confirmer, avez-vous 18 ans ou plus ?
Préférez-vous continuer en français ou en anglais?
1 – Continue (English or French)
1 – Continuer (en français ou en anglais)
2 – French Callback
2 – Appel ultérieur en français
3 – English Callback
3 – Appel ultérieur en anglais
Your participation is voluntary and completely confidential. Your answers will remain anonymous. The information you provide will be used for research purposes only and will be administered according to the requirements of the Privacy Act, the Access to Information Act, and any other pertinent legislation.
(IF NEEDED: Should you wish to verify the credibility of this survey, you can utilize the Canadian Research Insights Council (CRIC) Research Verification Service by clicking here and entering the following project code [insert URL address (not active link) and reference number for research registration system.] If you have any questions about how to complete the survey or encountered any technical issues, please email Daniel.Kunasingam@ipsos.com)
Votre participation est volontaire et entièrement confidentielle. Vos réponses demeureront anonymes. Les informations que vous fournissez seront utilisées à des fins de recherche uniquement et gérées conformément aux exigences de la Loi sur la protection des renseignements personnels, de la Loi sur l'accès à l'information et de toute autre législation pertinente.
(SI NÉCESSAIRE : Si vous souhaitez vérifier la crédibilité de ce sondage, vous pouvez utiliser le service de vérification de recherche du Conseil de recherche et d'intelligence marketing canadien [CRIC] en cliquant ici et en entrant le code de projet suivant : [insert URL address (not active link) and reference number for research registration system.] Si vous avez des questions concernant la manière de répondre au sondage ou si vous éprouvez des problèmes techniques, veuillez faire parvenir un courriel à Daniel.Kunasingam@ipsos.com)
Screeners
S1. As we are looking to speak to a broad cross-section of the public could you please let me know in which month and year were born.
S1. Étant donné que nous cherchons à parler à un large éventail de publics, pourriez-vous s'il vous plaît me dire votre mois et votre année de naissance?
January – December
Janvier à décembre
1910 – 2015
[IF LESS THAN 18 YEARS OLD, THANK YOU AND TERMINATE]
[IF S1 = DK/ REF ASK S1A, OTHERWISE SKIP TO S4]
S1a. Which of the following age ranges do you fall into? (INTERVIEWER: READ LIST UNTIL INTERUPTED. )
S1a. À laquelle des tranches d'âge suivantes appartenez-vous? (INTERVIEWEUR : LIRE LA LISTE JUSQU'À INTERRUPTION. )
18-24
18 à 24 ans
25-34
25 à 34 ans
35-44
35 à 44 ans
45-54
45 à 54 ans
55-64
55 à 64 ans
65 years or older
65 ans ou plus
[HIDDEN VARIABLE- AGE QUOTAS]
- 18-24 years
- 25-34 years
- 35-44 years
- 45-54 years
- 55-64 years
- 65 years or older
S4. In which province or territory do you live? (DO NOT READ LIST, ACCEPT ONE RESPONSE)
S4. Dans quelle province ou quel territoire habitez-vous? (NE PAS LIRE LA LISTE, ACCEPTER UNE SEULE RÉPONSE)
[SINGLE PUNCH]
Alberta
Alberta
British Columbia
Colombie-Britannique
Manitoba
Manitoba
New Brunswick
Nouveau-Brunswick
Newfoundland and Labrador
Terre-Neuve-et-Labrador
Nova Scotia
Nouvelle-Écosse
Northwest Territories
Territoires du Nord-Ouest
Nunavut
Nunavut
Ontario
Ontario
Prince Edward Island
Île-du-Prince-Édouard
Quebec
Québec
Saskatchewan
Saskatchewan
Yukon
Yukon
[PROGAMMER: SET REGIONAL QUOTA FROM S4, IF DK/REF SET BASED ON SAMPLE VALUE]
Provider Classification
1. Which of the following telecommunications and television services do you currently have for your personal use? (READ LIST, ACCEPT ALL THAT APPLY)
Parmi les services de télécommunication et de télévision suivants, lesquels utilisez-vous actuellement à des fins personnelles? (LIRE LA LISTE, ACCEPTER TOUTES LES RÉPONSES QUI S'APPLIQUENT)
[MULTIPUNCH]
Cellphone
Téléphone cellulaire
Internet at home
Internet à la maison
Cable TV Service (IF NECESSARY: including Fibre Optic TV also known as IPTV or TELCO TV)
Service de télévision par câble (SI NÉCESSAIRE : y compris la télévision par fibre optique, également appelée télé IP ou télé TELCO)
Satellite TV Service
Service de télévision par satellite
Free television via an Antenna or converter set-top box (IF NECESSARY: e.g.: Roof-top antenna or aerial, rabbit or bunny ears or antenna built into TV set or a special converter set-top box)
Télévision gratuite avec une antenne ou un boîtier décodeur numérique (SI NÉCESSAIRE : p. ex. : antenne ou antenne de toit, antenne lapin ou oreilles de lapin, ou antenne intégrée au téléviseur ou un boîtier décodeur numérique particulier)
None of the above [MUTUALLY EXCLUSIVE][DO NOT READ]
Aucune de ces réponses [MUTUALLY EXCLUSIVE][DO NOT READ]
[IF SELECTED 'Cable TV Service' AT Q1 ASK Q2, OTHERWISE SKIP]
2. Which company provides your Cable TV Service? (DO NOT READ, ACCEPT ONE RESPONSE)
Quelle entreprise vous fournit un service de télévision par câble? (NE PAS LIRE, ACCEPTER UNE SEULE RÉPONSE)
Access Communications
Access Communications
AEBC
AEBC
Aliant/ Bell Aliant
Aliant/ Bell Aliant
ATOP
ATOP
Aurora Cable
Aurora Cable
Bell Fibe TV
Bell Fibe TV
Bell Alt TV
Alt Télé de Bell
Hay Communications
Hay Communications
Câblevision du Nord de Québec
Câblevision du Nord de Québec
Commstream
Commstream
Comwave
Comwave
Cogeco
Cogeco
Delta Cable Communications
Delta Cable Communications
EastLink
EastLink
EBox
EBox
Helix by Videotron
Helix de Vidéotron
MTS TV (Manitoba Tel/Manitoba Telecom Service)
MTS TV (Manitoba Tel/Manitoba Telecom Service)
Northwestel Fibre Optic TV
Télévision à fibre optique de Northwestel
Persona
Persona
Rogers Cable
Télévision par câble de Rogers
Rogers Ignite TV
Rogers Ignite TV
Sask Tel (Max TV, Max TV Stream)
Sask Tel (Max TV, Max TV Stream)
Seaside Cable Communications
Seaside Cable Communications
Shaw Cable
Shaw Cable
Shaw Blue Curve TV
Shaw Blue Curve TV
Source Cable Ltd.
Source Cable Ltd.
Teksavvy
Teksavvy
Telus
Telus
Vidéotron (Illico)
Vidéotron (Illico)
Westman Communications
Westman Communications
Vmedia
Vmedia
Virgin (Virgin TV Plus)
Virgin (Virgin TV Plus)
Dawson City TV
Dawson City TV
Northwestel Cable TV
Télévision par câble de Northwestel
Other
Autre
[IF SELECTED 'Satellite TV Service' AT Q1 ASK Q3, OTHERWISE SKIP]
3. Which company provides your Satellite TV Service? (DO NOT READ LIST, ACCEPT ONE RESPONSE)
Quelle entreprise vous fournit un service de télévision par satellite? (NE PAS LIRE LA LISTE, ACCEPTER UNE SEULE RÉPONSE)
Bell Satellite TV/ (formerly Bell ExpressVu)
Bell Télé Satellite (anciennement Bell ExpressVu)
DirecTV (U.S.)
DirecTV (É.-U.)
EchoStar (Dish Network) (U.S.)
EchoStar (Dish Network) (É.-U.)
ExpressVu
ExpressVu
Shaw Direct / Shaw Satellite TV
Shaw Direct/Shaw Satellite TV
Star Choice (now called Shaw Direct)
Star Choice (maintenant appelée Shaw Direct)
Telus Satellite TV
Telus Satellite TV
Other
Autre
[IF SELECTED 'Internet at home' AT Q1 ASK Q4, OTHERWISE SKIP]
4. Which company provides your home Internet connection? (DO NOT READ LIST, ACCEPT ONE RESPONSE)
Quelle entreprise fournit votre connexion Internet à domicile? (NE PAS LIRE LA LISTE, ACCEPTER UNE SEULE RÉPONSE)
Access Communications
Access Communications
Aliant (Bell Aliant)
Aliant (Bell Aliant)
Bell Canada (Accept Bell or Sympatico)
Bell Canada (accepter Bell ou Sympatico)
Cogeco
Cogeco
Distributel
Distributel
EastLink
EastLink
Manitoba Telecom Services (MTS)
Manitoba Telecom Services (MTS)
NorthernTel
NorthernTel
Primus
Primus
Rogers /Rogers Yahoo
Rogers /Rogers Yahoo
SaskTel
SaskTel
Shaw
Shaw
Starlink
Starlink
TekSavvy
TekSavvy
Telus
Telus
University/College
Université/cégep
Vidéotron/Illico/Helix
Vidéotron/Illico/Helix
Explorenet (Xplorenet)
Explorenet (Xplorenet)
Télébec
Télébec
Fido
Fido
Virgin
Virgin
eBox
eBox
Fizz
Fizz
Freedom
Freedom
Northwestel
Northwestel
Galaxy
Galaxy
SSi Canada
SSi Canada
Vmedia
Vmedia
Other
Autre
[IF SELECTED 'Cellphone' AT Q1 ASK Q5, OTHERWISE SKIP]
5. Which company provides your cellphone service? (DO NOT READ LIST, ACCEPT ONE RESPONSE)
Quelle entreprise vous fournit vos services de téléphonie mobile? (NE PAS LIRE LA LISTE, ACCEPTER UNE SEULE RÉPONSE)
Aliant Mobility
Aliant Mobility
Bell Mobility
Bell Mobilité
Fido
Fido
Koodo Mobile
Koodo Mobile
MTS Mobility
MTS Mobility
PC Mobility (Presidents Choice)
PC Mobile (Le Choix du Président)
Public Mobile
Public Mobile
Rogers Wireless
Rogers Sans-fil
SaskTel Mobility
SaskTel Mobility
Telus Mobility
Telus Mobilité
Videotron
Vidéotron
Virgin Mobile
Virgin Mobile
Freedom Mobile (formerly Wind)
Freedom Mobile (anciennement Wind)
Eastlink
Eastlink
Chatr
Chatr
Lucky Mobile (formerly Solo)
Lucky Mobile (anciennement Solo)
Thunder Bay Tel/TBay Tel
Thunder Bay Tel/TBay Tel
Fizz
Fizz
Shaw Mobile
Shaw Mobile
Ice Wireless
Ice Wireless
Knet Mobile
Knet Mobile
Sogetel Mobilité
Sogetel Mobilité
SSi Mobile
SSi Mobile
TbayTel Mobilit
TbayTel Mobility
Xplore Mobile
Xplore Mobile
Other
Autre
6. What video streaming services do you currently subscribe or have access to? (DO NOT READ LIST, CLARIFY FROM LIST IF NEEDED)
À quels services de diffusion vidéo en continu êtes-vous actuellement abonné(e) ou auxquels avez-vous accès? (NE PAS LIRE LA LISTE, CLARIFIER À PARTIR DE LA LISTE SI NÉCESSAIRE)
[MULTIPUNCH]
[RANDOMIZE]
Netflix
Netflix
Amazon Prime Video
Amazon Prime Video
CRAVE (with or without Movies, +HBO, Starz, or Super Ecran add-ons)
CRAVE (avec ou sans extensions Films, +HBO, Starz ou Super Écran)
Apple TV+
Apple TV+
Disney+
Disney+
YouTube Premium
YouTube Premium
Club Illico
Club Illico
Pluto
Pluto
Roku
Roku
Paramount+ Canada
Paramount+ Canada
tou.tv Extra
tou.tv Extra
BritBox
BritBox
CBC Gem
CBC Gem
Sportsnet Now
Sportsnet Now
DAZN
DAZN
TSN+/ RDS
TSN+/ RDS
None of the above [MUTUALLY EXCLUSIVE]
Aucune de ces réponses [MUTUALLY EXCLUSIVE]
7. What audio streaming services do you currently subscribe or have access to(DO NOT READ LIST, CLARIFY FROM LIST IF NEEDED)
À quels services de diffusion audio en continu êtes-vous actuellement abonné(e) ou auxquels avez-vous accès? (NE PAS LIRE LA LISTE, CLARIFIER À PARTIR DE LA LISTE SI NÉCESSAIRE)
[MULTIPUNCH]
Spotify
Spotify
Apple Music
Apple Music
YouTube Premium/YouTube Music
YouTube Premium/YouTube Music
Soundcloud Go+
Soundcloud Go+
Amazon Music
Amazon Music
SiriusXM
SiriusXM
Tidal
Tidal
Deezer
Deezer
Audible
Audible
Shazam
Shazam
None of the above [MUTUALLY EXCLUSIVE]
Aucune de ces réponses [MUTUALLY EXCLUSIVE]
Sentiment towards Provider(s)
[LOOP THROUGH Q8 AND Q9 FOR EACH SERVICE INDICATED AT Q1 AND Q6, Q7].
[IF SELECTED 'NONE OF THE ABOVE' OR ONLY 'Free television via an Antenna or converter set-top box' AT Q1 SKIP][PIPE IN SERVICE SELECTED AT Q1 AND PROVIDER SELECTED AT RELEVANT QUESTION DETAILED BELOW][IF RESPONDENT SELECTS 'Other' OR 'Don't Know/REF' AT PROVIDER QUESTION DO NOT INCLUDE SERVICE IN LIST][IF RESPONDENT ONLY 'NONE OF THE ABOVE' AT Q6 SKIP]
[IF RESPONDENT SELECTS ONLY NONE OF THE ABOVE' AT Q7 SKIP]
- Cellphone service [INSERT PROVIDER SELECTED AT Q5]
- Service de téléphonie mobile [INSERT PROVIDER SELECTED AT Q5]
- Home internet connection [INSERT PROVIDER SELECTED AT Q4]
- Connexion Internet à domicile [INSERT PROVIDER SELECTED AT Q4]
- Cable TV Service [INSERT PROVIDER SELECTED AT Q2]
- Service de télévision par câble [INSERT PROVIDER SELECTED AT Q2]
- Satellite TV Service [INSERT PROVIDER SELECTED AT Q3]
- Service de télévision par satellite [INSERT PROVIDER SELECTED AT Q3]
- Video streaming services [INSERT SERVICES SELECTED AT Q6]
- Services de diffusion vidéo en continu [INSERT SERVICES SELECTED AT Q6]
- Audio streaming services [INSERT SERVICES SELECTED AT Q7]
- Services de diffusion audio en continu [INSERT SERVICES SELECTED AT Q7]
8. [FIRST ITEM] Overall, how satisfied are you with the [INSERT SERVICE] you receive from [INSERT PROVIDER]? Using a scale from 1 to 10, where 1 is very dissatisfied and 10 is very satisfied. [NEXT ITEM] And using the same scale, overall how satisfied are you with the [INSERT SERVICE] you receive from [INSERT PROVIDER]?
[FIRST ITEM] De manière générale, dans quelle mesure êtes-vous satisfait(e) du/de la/des [INSERT SERVICE] que vous recevez de [INSERT PROVIDER]? Utilisez une échelle de 1 à 10, où 1 signifie « Très insatisfait(e) » et 10, « Très satisfait(e) ». [NEXT ITEM] En utilisant la même échelle, de manière générale, dans quelle mesure êtes-vous satisfait(e) du/de la/des [INSERT SERVICE] que vous recevez de [INSERT PROVIDER]?
[SCALE 1- 10: 1 'Very dissatisfied', 10 'Very satisfied']
9. Why do you say that?
Pourquoi?
[OPEN END]
No comment
Aucun commentaire
[ASK Q10 IF Q1 EQUAL ANY OF CELLPHONE, HOME INTERNET, CABLE TV, SATELLITE TV, OTHERWISE SKIP TO Q12, THEN SKIP TO Q18]
10. Thinking about your telecommunications, television, audio and/or video subscription services, have you or anyone in your household [INSERT ITEM] in the last month because you could no longer afford them? (IF YES PROMPT FOR SERVICE BELOW, IF NO, CODE AS NONE) How about [INSERT NEXT ITEM]?
En songeant à vos services de télécommunications, de télévision, d'abonnement à des services audio et/ou vidéo, avez-vous ou un membre de votre foyer a-t-il [INSERT ITEM] au cours du dernier mois parce que vos finances ne vous le permettaient plus? SI OUI, DEMANDER POUR LE SERVICE CI-DESSOUS, SI NON, CODEZ COMME AUCUN). Et avez-vous [INSERT NEXT ITEM]?
[ROWS]
Made changes to make services more affordable
apporté des modifications pour rendre les services plus abordables
Planned on cancelling but was convinced to stay with a better price
prévu d'annuler un service, mais été convaincu de ne pas le faire en raison d'un meilleur prix
Cancelled and switched to a different provider
annulé un service et changé de fournisseur
Cancelled service entirely
entièrement annulé le service
[MULTIPUNCH]
Telecommunications
Television
Audio subscription services
Video subscription services
(DO NOT READ) None [SINGLE PUNCH]
[MULTIPUNCH]
Télécommunications
Télévision
Services de diffusion audio en continu
Services de diffusion vidéo en continu
Video subscription services
(NE PAS LIRE ) AUCUN [SINGLE PUNCH]
[[IF SELECTED SERVICES TO EITHER 'Made changes', 'Planned on cancelling' OR 'Cancelled and switched to a different provider' AT Q10 ASK Q11, OTHERWISE SKIP][ROTATE THROUGH Q11 FOR EACH ITEM SELECTED YES TO AT Q10]
11. Which specific services did you, or someone in your household, [INSERT FIRST ITEM] in the last month? How about [INSERT NEXT ITEM]? (DO NOT READ LIST)
Quels services spécifiques avez-vous, ou quelqu'un de votre foyer a-t-il [INSERT FIRST ITEM] au cours du dernier mois? Et avez-vous [INSERT NEXT ITEM]? (NE PAS LIRE LA LISTE)
[MULTIPUNCH PER ITEM]
Make changes to
modifiés
Planned on cancelling but was convinced to stay with a better price
prévu d'annuler un service, mais été convaincu de ne pas le faire en raison d'un meilleur prix
Cancelled and switched to a different provider
annulé un service et changé de fournisseur
[OPEN END]
12. And, which if any of the following services did you, or someone in your household, cancel entirely? (READ LIST, ACCEPT ALL THAT APPLY)
Parmi les services suivants, lesquels, le cas échéant, avez-vous, ou quelqu'un de votre foyer a-t-il annulés entièrement? (LIRE LA LISTE, ACCEPTER TOUTES LES RÉPONSES QUI S'APPLIQUENT)
[MULTIPUNCH]
Cellphone service
Service de téléphonie mobile
Home internet connection
Connexion Internet à domicile
Cable TV Service
Service de télévision par câble
Satellite TV Service
Service de télévision par satellite
Video streaming services
Services de diffusion vidéo en continu
Audio streaming services
Services de diffusion audio en continu
None [SINGLE PUNCH]
Aucune SINGLE PUNCH]
[IF SELECTED 'Planned on cancelling but was convinced to stay with a better price' AT Q10 ASK Q13, OTHERWISE SKIP]
13. You indicated you had planned on cancelling a service but were convinced to stay with a better price. Please provide more detail on your experience and why you ended up adjusting your services instead of cancelling. (PROBE ONCE)
Vous avez indiqué que vous aviez prévu d'annuler un service, mais que vous avez été persuadé(e) de ne pas le faire en raison d'un meilleur prix. Veuillez nous donner davantage de détails au sujet de votre expérience et de la raison pour laquelle vous avez choisi de modifier vos services au lieu de les annuler. (DEMANDER DES PRÉCISIONS UNE SEULE FOIS)
[INSERT TEXT BOX]
No comment
Aucun commentaire
14. How confident or not are you that you and your household will be able to pay for your telecommunications, television, audio and/or video subscription services without making any changes in the next three months? Using a scale from 1 to 10, where 1 is not at all confident and 10 is very confident.
Dans quelle mesure êtes-vous certain(e) que vous et votre foyer serez en mesure de payer vos services de télécommunications, de télévision, de diffusion audio et/ou vidéo en continu sans apporter de modifications au cours des trois prochains mois? Utilisez une échelle de 1 à 10, où 1 signifie « Pas du tout confiant(e) » et 10, « Très confiant(e) ».
[SCALE 1- 10: 1 'Not at all confident', 10 'Very confident']
Usage and attitudes towards international roaming
[IF SELECTED 'Cellphone' AT Q1 ASK SECTION, OTHERWISE SKIP TO Q18]
15. Thinking about when using your personal cellphone while travelling outside of Canada, how often do you use you each of the following types of products or services? How about…[INSERT ITEM] (READ LIST, AND REPEAT AS NEEDED)
En songeant à l'utilisation de votre téléphone cellulaire personnel lorsque vous voyagez à l'extérieur du Canada, à quelle fréquence utilisez-vous chacun des types de produits ou services suivants? Qu'en est-il de…[INSERT ITEM] (LIRE LA LISTE ET RÉPÉTER AU BESOIN)
[ROWS][RANDOMIZE]
International roaming through a flat-rate-per-day option
l'itinérance internationale avec un tarif forfaitaire par jour
International roaming through a pay-per-text/call/MB option
l'itinérance internationale avec une option payer par texto/appel/Mo
International SIM/eSIM (i.e. a SIM, or digital SIM card intended specifically for travellers)
la carte SIM/eSIM internationale (c.-à-d. une carte SIM ou une carte SIM numérique spécialement réservée aux voyageurs)
Domestic SIM/eSIM (i.e. SIM card, or digital SIM card purchased from another provider, typically in the country being visited)
la carte SIM/eSIM nationale (c.-à-d. carte SIM ou carte SIM numérique achetée auprès d'un autre fournisseur, généralement dans le pays visité)
[COLUMNS]
Several times per year or more often
Plusieurs fois par année ou plus souvent
Once or twice per year
Une ou deux fois par année
Every two to three years
Tous les deux à trois ans
Every four to five years or less often
Tous les quatre à cinq ans ou moins souvent
Never
Jamais
I don't travel outside of Canada [IF SELECTED SKIP TO Q18]
Je ne voyage pas à l'extérieur du Canada [IF SELECTED SKIP TO Q18]
[IF NEVER TO ALL OPTIONS OR I DON'T TRAVEL OUTSIDE OF CANADA AT Q15 SKIP TO Q18, OTHERWISE CONTINUE]
16. Generally speaking, what informs your decision about which type of international calling or text product or service to use when travelling outside of Canada? (READ LIST, ACCEPT ALL THAT APPLY)
De manière générale, qu'est-ce qui motive le choix du type de produit ou de service d'appels ou de messages texte internationaux que vous utilisez lorsque vous voyagez à l'extérieur du Canada? (LIRE LA LISTE, ACCEPTER TOUTES LES RÉPONSES QUI S'APPLIQUENT)
[MULTIPUNCH]
[RANDOMIZE]
The most cost-effective option
L'option la plus rentable
Whichever is available to me at the time
L'option qui m'est offerte à ce moment-là
The easiest, most convenient option to set up
L'option la plus simple et la plus commode à configurer
The option I am most familiar with
L'option que je connais le mieux
The option which provides the best reliability
L'option qui offre la meilleure fiabilité
Limited knowledge of other options available
Une connaissance limitée des autres options offertes
Other – Please specify [INSERT TEXT BOX]
Autre (veuillez préciser) [INSERT TEXT BOX] [ANCHOR]
17. Based on your own experience, how reasonable do you feel the rates and/or cost of purchase are for each of the following products or services? Using a scale from 1 to 10, where 1 is very unreasonable and 10 is very reasonable. How about [INSERT ITEM]?
D'après votre propre expérience, dans quelle mesure pensez-vous que les tarifs et/ou le coût d'achat sont raisonnables pour chacun des produits ou services suivants? Utilisez une échelle de 1 à 10, où 1 signifie « Très déraisonnable » et 10, « Très raisonnable ». Qu'en est-il de [INSERT ITEM]?
[ROWS]
[INSERT OPTIONS FROM Q15 WHERE RESPONSE IS NOT 'NEVER/DK/REF' ]
[COLUMNS][SCALE]
[1- 10: 1 'Very unreasonable', 10 'Very reasonable', Don't know enough to provide an opinion ]
Primary source(s) and satisfaction with programming
18. What are your primary source(s) of media content for 'news and information'? And how about 'entertainment'? (DO NOT READ LIST, CLARIFY FROM LIST IF NEEDED)
Quelles sont vos principales sources de contenu médiatique pour les « actualités et information »? Et pour les « divertissements »? (NE PAS LIRE LA LISTE, CLARIFIER À PARTIR DE LA LISTE SI NÉCESSAIRE)
[MULTIPUNCH PER ITEM]
[ROWS]
News and information
Actualités et information
Entertainment
Divertissements
[COLUMNS]Video [HEADER]
[COLUMNS]Vidéo [HEADER]
Regular Television (cable, satellite, etc. including online)
Télévision classique (câble, satellite, etc., y compris en ligne)
Online video streaming services (e.g. Netflix, Amazon Prime, Disney+, Crave)
Services de diffusion vidéo en ligne (p. ex., Netflix, Amazon Prime, Disney+, Crave)
Online social media (e.g. YouTube)
Réseaux sociaux en ligne (p. ex., YouTube)
Audio [HEADER]
Audio [HEADER]
AM/FM Radio from any source (including online streams and HD radio broadcasts)
Radio AM/FM à partir de n'importe quelle source (y compris la diffusion en continu en ligne et les émissions de radio HD)
Online music streaming services (e.g. Spotify, Apple Music)
Services de diffusion de musique en ligne (p. ex., Spotify, Apple Music)
Online social media (e.g. YouTube)
Réseaux sociaux en ligne (p. ex., YouTube)
Audio podcasts (e.g. Audible)
Baladodiffusions (p. ex., Audible)
Other Media [HEADER]
Autre média [HEADER]
Print media sources (hard copy newspaper, magazines, etc.)
Sources de médias imprimés (journaux papier, magazines, etc.)
Online media sources
Sources médiatiques en ligne
Social networking sites (e.g. Instagram, Facebook, Twitter, Tiktok, etc.)
Sites de réseautage social (p. ex., Instagram, Facebook, Twitter, TikTok, etc.)
Another source(s) (SPECIFY)
Autres sources (PRÉCISER)
I don't consume this type of content [MUTUALLY EXCLUSIVE]
Je ne consomme pas ce type de contenu [MUTUALLY EXCLUSIVE]
Don't know [MUTUALLY EXCLUSIVE]
Je ne sais pas [MUTUALLY EXCLUSIVE]
[IF SELECTED 'I don't consume this type of programming' OR 'Don't know' FOR ALL ITEMS AT Q18 SKIP, OTHERWISE CONTINUE]
19. Overall, how satisfied are you with the quality of [INSERT ITEM] content you receive? Using a scale from 1 to 10, where 1 is very dissatisfied and 10 is very satisfied. How about the [INSERT NEXT ITEM] content you receive?
De manière générale, dans quelle mesure êtes-vous satisfait(e) de la qualité du contenu de [INSERT ITEM] que vous recevez? Utilisez une échelle de 1 à 10, où 1 signifie « Très insatisfait(e) » et 10, « Très satisfait(e) ». Et qu'en est-il du contenu de [INSERT NEXT ITEM] que vous recevez?
[ROWS][RANDOMIZE]
[INSERT ITEMS FROM Q18 WHERE RESPONSE IS NOT 'I don't consume this type of programming' OR 'Don't know/REF']
News and information
Actualités et information
Entertainment
Divertissements
[COLUMNS]
[SCALE 1- 10: 1 'Very dissatisfied', 10 'Very satisfied']
Broader Attitudes
[INITIALLY SET ALL COMPLETES TO ASK ALL ITEMS, IF PRETEST LENGTH IS LONG UPDATE TO ASK 2 OF 3 GROUPS]
Q20quota. [QUOTA MARKER]
Ask all items
Demander pour tous les éléments
ASK GROUP 1 & 2 ONLY
DEMANDER POUR LES GROUPES 1 ET 2 SEULEMENT
ASK GROUP 1 & 3 ONLY
DEMANDER POUR LES GROUPES 1 ET 3 SEULEMENT
ASK GROUP 2 & 3 ONLY
DEMANDER POUR LES GROUPES 2 ET 3 SEULEMENT
20. Please indicate the extent to which you agree or disagree with each of the following statements. Using a scale from 1 to 10, where 1 is strongly disagree and 10 is strongly agree. How about [INSERT ITEM]? (READ LIST)
Veuillez indiquer dans quelle mesure vous êtes d'accord ou en désaccord avec chacun des énoncés suivants. Utilisez une échelle de 1 à 10, où 1 signifie « Tout à fait en désaccord » et 10, « Tout à fait d'accord ». Qu'en est-il de [INSERT ITEM]? (LIRE LA LISTE.)
[ROWS][RANDOMIZE WITHIN GROUPS]
BROADCASTING [HEADER, DO NOT PROGRAM, GROUP 1]
I trust the information provided by news media in Canada to be accurate and impartial
Je crois que l'information fournie par les médias d'information au Canada est exacte et impartiale
The types of news programming available in Canada today offers a variety of opinions and perspectives
Les types d'émissions de nouvelles offertes au Canada aujourd'hui donnent une variété d'opinions et de perspectives
The news programming available in Canada today covers a diverse range of topics and issues
La programmation de nouvelles offerte au Canada aujourd'hui couvre un large éventail de sujets et de questions
I rely on Canadian news media to help me understand what's going on in the world
Je compte sur les médias d'information canadiens pour m'aider à comprendre ce qui se passe dans le monde
I am satisfied with the quality of information and depth of analysis offered by Canadian news media
Je suis satisfait(e) de la qualité de l'information et de la profondeur de l'analyse offerte par les médias d'information canadiens
It's important to me to have access to Canadian-made music
C'est important pour moi d'avoir accès à de la musique canadienne
It's important to me to have access to Canadian-made television programs
C'est important pour moi d'avoir accès à des émissions télévisées canadiennes
I am satisfied with the variety of Canadian music available today
Je suis satisfait(e) de la variété de la musique canadienne offerte aujourd'hui
I am satisfied with the variety of Canadian television programs available today
Je suis satisfait(e) de la variété des émissions télévisées canadiennes offertes aujourd'hui
I am satisfied with the quality of Canadian music available today
Je suis satisfait(e) de la qualité de la musique canadienne offerte aujourd'hui
I am satisfied with the quality of Canadian television programs available today
Je suis satisfait(e) de la qualité des émissions télévisées canadiennes offertes aujourd'hui
I see myself and people like me reflected in the types of programming available to Canadians
Je me vois et des gens comme moi représentés dans les types d'émissions offertes aux Canadiens
The types of news, music, and television programming available to Canadians are relevant to my life
Les types d'émissions de nouvelles, de musique et de télévision accessibles à la population canadienne sont pertinents pour moi
I get a lot of my information on the topics I'm interested in through podcasts, email newsletters and/or online posts
Je reçois beaucoup de renseignements concernant les sujets qui m'intéressent au moyen de baladodiffusions, de bulletins d'information par courriel et/ou de publications en ligne
Television services (Cable, Satellite, etc.) have become less affordable in the past year
Les services de télévision (câble, satellite, etc.) sont devenus moins abordables au cours de la dernière année
Streaming video subscription services have become less affordable in the past year
Les services d'abonnement à la diffusion vidéo en continu sont devenus moins abordables au cours de la dernière année
Streaming audio subscription services have become less affordable in the past year
Les services d'abonnement à la diffusion audio en continu sont devenus moins abordables au cours de la dernière année
I listen to the radio because it's free
J'écoute la radio parce que c'est gratuit
The content available through online video or audio streaming platforms should be regulated similar to other forms of traditional broadcasting (i.e. television and radio)
Le contenu offert sur les plateformes vidéo ou audio en ligne devrait être réglementé de la même manière que les autres formes de diffusion classiques (c.-à-d. la télévision et la radio)
SPAM AND NUISANCE [HEADER, DO NOT PROGRAM, GROUP 2]
I, or someone I know, have experienced a phishing or scam attempt in the past month.
J'ai subi une tentative d'hameçonnage ou d'escroquerie au cours du dernier mois ou une personne que je connais en a subi une.
I often receive unsolicited phone calls where I feel I am being tricked into sharing personal information
Je reçois souvent des appels téléphoniques non sollicités où j'ai l'impression d'être incité(e) à donner des informations personnelles
I often receive unsolicited emails or text messages that I feel are trying to trick me into clicking a malicious link, downloading malicious software, or sharing sensitive information
Je reçois souvent des courriels ou des messages texte non sollicités qui, à mon avis, tentent de m'inciter à cliquer sur un lien malveillant, à télécharger un logiciel malveillant ou à donner des informations sensibles
The amount of unsolicited phone calls or spam emails and text messages I have received has increased in the past year
La quantité d'appels téléphoniques ou de pourriels et de messages texte non sollicités que j'ai reçus a augmenté au cours de la dernière année
TELECOMMUNICATIONS [HEADER, DO NOT PROGRAM, GROUP 3]
Telecommunications services have become less affordable in the past year
Les services de télécommunications sont devenus moins abordables au cours de la dernière année
I can count on reliable high-speed internet network where I live
Je peux compter sur un réseau Internet haut débit fiable là où je vis
I can count on reliable mobile network where I live
Je peux compter sur un réseau mobile fiable là où je vis
I feel I have enough choice of telecommunications providers in Canada
J'estime avoir suffisamment de choix de fournisseurs de télécommunications au Canada
The rates Canadians pay to use their cellphone while travelling outside of the country are reasonable
Les tarifs que les Canadiens paient pour utiliser leur téléphone cellulaire lorsqu'ils voyagent à l'étranger sont raisonnables
[IF SELECTED 'Cellphone' AT Q1 ASK] I have a good understanding of the rate plans and options for using my cellphone when travelling outside of the country
[IF SELECTED 'Cellphone' AT Q1 ASK] J'ai une bonne compréhension des plans tarifaires et des options d'utilisation de mon téléphone portable lorsque je voyage à l'étranger
[COLUMNS][SCALE]
[1- 10: 1 'Strongly disagree', 10 'Strongly agree' ]
Classification questions
We have some final questions for statistical classification purposes. Please indicate the answer that best describes you. Be assured that your responses will be held in strict confidence.
Nous avons quelques dernières questions à vous poser, aux fins de classification statistique seulement. Veuillez indiquer l'option qui décrit le mieux votre situation. Soyez assuré(e) que vos réponses demeureront strictement confidentielles.
21. On average, how much per month, does your household spend on each of the following services? How about [INSERT ITEM]?
En moyenne, combien votre foyer dépense-t-il par mois pour chacun des services suivants? Qu'en est-il de [INSERT ITEM]?
[INSERT SERVICE(S) INDICATED AT Q1. IF SELECTED 'NONE OF THE ABOVE' OR ONLY 'Free television via an Antenna or converter set-top box' AT Q1 SKIP TO Q22][PIPE IN SERVICE SELECTED AT Q1]
Cellphone service
Service de téléphonie mobile
Home internet connection
Connexion Internet à domicile
TV Service (Cable, Satellite or Fibre Optic)
Service de télévision (câble, satellite ou fibre optique)
[INSERT STREAMING TV SERVICES SELECTED AT Q6]
[INSERT STREAMING TV SERVICES SELECTED AT Q6]
[INSERT STREAMING AUDIO SERVICES SELECTED AT Q7]
[INSERT STREAMING AUDIO SERVICES SELECTED AT Q7]
[INSERT PRICE RANGE 0-500]
22. Do you work in the telecommunications or broadcast industry?
Travaillez-vous dans le secteur des télécommunications ou de la radiodiffusion?
Yes
Oui
No
Non
S3. What is your postal code? [READ IF NECESSARY: This question may be considered personal. We would like to remind you that your participation is strictly voluntary and that your responses are used for research purposes only. The answers that you provide will be presented in aggregate form and none of them will be linked back to you in any way. All data will be collected and processed in accordance with applicable data protection legislation.
Quel est votre code postal? [LIRE SI NÉCESSAIRE : Veuillez prendre note que cette question peut être considérée comme étant personnelle. Nous aimerions vous rappeler que votre participation est strictement volontaire et que vos réponses sont uniquement utilisées à des fins de recherche. Les réponses que vous fournissez seront présentées sous forme regroupée et aucune d'entre elles ne sera associée à vous. Toutes les données seront recueillies et traitées conformément aux lois applicables en matière de protection des données.
[OPEN END]
23. What is your annual household income before taxes? (READ LIST UNTIL INTERUPTED)
Quel est le revenu annuel brut de votre foyer? (LIRE LA LISTE JUSQU'À INTERRUPTION)
Less than $40,000
Moins de 40 000 $
$40,000 to less than $60,000
De 40 000 $ à moins de 60 000 $
$60,000 to less than $100,000
De 60 000 $ à moins de 100 000 $
$100,000 to less than $150,000
De 100 000 $ à moins de 150 000 $
$150,000 to less than $250,000
De 150 000 $ à moins de 250 000 $
$250,000 or more
250000 $ ou plus
24. What is the highest degree or level of school you have completed? (DO NOT READ)
Quel est le niveau d'éducation le plus élevé que vous avez atteint? (NE PAS LIRE)
Grade 8 or less
Études secondaires de premier cycle ou moins (Québec); 8e année ou moins (ailleurs au Canada)
Some high school
Études secondaires non terminées
High School diploma or equivalent
Diplôme d'études secondaires ou l'équivalent
Registered Apprenticeship or other trades certificate or diploma
Apprentissage enregistré ou diplôme ou certificat d'une école de métiers
College, CEGEP or other non-university certificate or diploma
Diplôme d'études collégiales, ou certificat ou diplôme non universitaire
University certificate or diploma below bachelor's level
Certificat universitaire ou diplôme inférieur au baccalauréat
Bachelor's degree
Baccalauréat
Post graduate degree above bachelor's level
Certificat universitaire supérieur au baccalauréat
25. Are there any children under 18 years old living or staying at your current address?
Y a-t-il des enfants de moins de 18 ans qui vivent ou séjournent à votre adresse actuelle?
Yes
Oui
No
Non
26. Were you born in Canada?
Êtes-vous né(e) au Canada?
Yes
Oui
No
Non
[IF NO AT Q26 ASK Q27, OTHERWISE SKIP]
27. How long have you lived in Canada? (DO NOT READ)
Depuis combien d'années vivez-vous au Canada? (NE PAS LIRE)
Less than three years
Depuis moins de trois ans
Three to five years
Depuis trois à cinq ans
More than five years
Depuis plus de cinq ans
28. Are you an Indigenous person, that is, First Nations (North American Indian), Métis or Inuk (Inuit)? (DO NOT READ)
Êtes-vous une personne autochtone, c'est-à-dire membre des Premières Nations (Indiens de l'Amérique du Nord), Métis ou Inuk (Inuit)? (NE PAS LIRE)
No, not an Indigenous person [EXCLUSIVE]
Non, je ne suis pas une personne autochtone [EXCLUSIVE]
Yes, First Nations (North American Indian)
Oui, je suis membre des Premières Nations (Indiens de l'Amérique du Nord)
Yes, Métis
Oui, je suis Métis
Yes, Inuk (Inuit)
Oui, je suis Inuk (Inuit)
[IF NO/DK/REF AT Q28 ASK Q29, OTHERWISE SKIP]
29. Thinking about your ethnicity or background, how would you describe yourself? (READ ONLY IF NEEDED TO CLARIFY INTENT OF QUESTION)
En songeant à votre origine ethnique ou à vos origines, comment vous décririez-vous? (LIRE UNIQUEMENT SI NÉCESSAIRE POUR CLARIFIER L'INTENTION DE LA QUESTION)
[MULTI PUNCH]
White
Blanc(he)
South Asian (e.g., East Indian, Pakistani, Sri Lankan, etc.)
Asiatique du Sud (Indien[ne] d'Asie, Pakistanais[e], Sri Lankais[e], etc.)
Chinese
Chinois(e)
Black
Noir(e)
Filipino
Philippin(e)
Latin American
Latino-Américain(e)
Arab
Arabe
Southeast Asian (e.g., Vietnamese, Cambodian, Laotian, Thai, etc.)
Asiatique du Sud-Est (Vietnamien[ne], Cambodgien[ne], Laotien[ne], Thaïlandais[e], etc.)
West Asian (e.g., Iranian, Afghan, etc.)
Asiatique de l'Ouest (Iranien[ne], Afghan[e], etc.)
Korean
Coréen(ne)
Japanese
Japonais(e)
Other — specify
Autre (veuillez préciser)
Prefer not to answer
Je préfère ne pas répondre
30. What is the language you use most often at home? If you use more than one language at home, please identify the two most used languages. (DO NOT READ LIST, ACCEPT UP TO TWO MENTIONS)
Quelle est la langue que vous utilisez le plus souvent chez vous? Si vous utilisez plus d'une langue chez vous, veuillez indiquer les deux langues que vous utilisez le plus. (NE PAS LIRE LA LISTE, ACCEPTER JUSQU'À DEUX RÉPONSES)
French
Français
English
Anglais
American Sign Language (ASL)
Langue des signes américaine (ASL)
Arabic
Arabe
Bengali
Bengali
Chinese - Cantonese
Chinois – cantonnais
Chinese - Mandarin
Chinois – mandarin
Chinese - other
Chinois – autre
Cree
Cri
Farsi
Persan
German
Allemand
Greek
Grec
Gujurati
Gujurati
Hindi
Hindi
Inuktitut
Inuktitut
Italian
Italien
Japanese
Japonais(e)
Korean
Coréen
Ojibwe
Ojibwé
Portuguese
Portugais
Punjabi
Pendjabi
Quebec Sign Language (LSQ)
Langue des signes québécoise (LSQ)
Russian
Russe
Spanish
Espagnol
Tagalog
Tagalog
Tamil
Tamoul
Urdu
Ourdou
Vietnamese
Vietnamien
Other
Autre
[IF TWO LANGUAGES SELECTED AT Q30 ASK Q30B, OTHERWISE SKIP]
30B. And, which of these languages do you use more often at home? (READ LIST IF NEEDED, ACCEPT ONE RESPONSE)
Et laquelle de ces langues utilisez-vous le plus souvent chez vous? (LIRE LA LISTE AU BESOIN, ACCEPTER UNE SEULE RÉPONSE)
[INSERT ITEMS SELECTED AT Q30]
S2. What is your gender? [DO NOT READ]
Quel est votre sexe? [DO NOT READ]
Male
Homme
Female
Femme
Non-binary person
Personne non binaire
Or, please specify:
Autre (veuillez préciser) :
Prefer not to say
Je préfère ne pas répondre
31. Which of the following do you consider yourself to be? Please stop me when I reach your category. Are you [INSERT ITEM]? (READ LIST, UNTIL INTERUPTED)
Auquel des groupes suivants vous identifiez-vous? Veuillez m'arrêter lorsque j'aurai mentionné la bonne catégorie. Êtes-vous [INSERT ITEM]? (LIRE LA LISTE JUSQU'À INTERRUPTION)
Straight/Heterosexual
Hétéro/Hétérosexuel(le)
Lesbian
Lesbienne
Gay
Gai
Bisexual
Bisexuel(le)
Transgender
Une personne transgenre
Queer
Queer
Intersex
Intersexué(e)
Two-Spirited
Bispirituel(le)
Another term
Un autre terme
32. Do you identify as a person with a disability?
Vous identifiez-vous comme une personne handicapée?
Yes
Oui
No
Non
[IF YES AT Q32 ASK Q33, OTHERWISE SKIP]
33. What type of disability do you have? (DO NOT READ, ACCEPT ALL THAT APPLY)
Quel type de handicap avez-vous? (NE PAS LIRE, ACCEPTER TOUTES LES RÉPONSES QUI S'APPLIQUENT)
Physical (for example: Mobility, flexibility and dexterity)
Physique (par exemple : mobilité, flexibilité et dextérité)
Sensory, related to hearing
Sensoriel, lié à l'ouïe
Sensory, related to vision
Sensoriel, lié à la vision
Other type of sensory
Autre type de handicap sensoriel
Communication
Communication
Intellectual
Intellectuel
Mental Health (for example: anxiety, depression, eating disorders, substance use disorder, etc.)
Santé mentale (par exemple : anxiété, dépression, troubles de l'alimentation, troubles liés à la consommation de substances, etc.)
Cognitive/Neurodiversity (includes Autism, ADHD, learning disabilities)
Cognitif/neurodiversité (comprend l'autisme, le TDAH et les troubles d'apprentissage)
Chronic Pain
Douleur chronique
Environmental (includes sensitivity to scents, bright lights, allergens, etc.)
Environnemental (comprend la sensibilité aux odeurs, aux lumières vives, aux allergènes, etc.)
Other
Autre
Thank you! Those are all the questions we have for you today. On behalf of Ipsos and the CRTC we appreciate you taking the time to share your opinions with us.
Merci. Nous n'avons plus de question à vous poser aujourd'hui. Au nom d'Ipsos et du CRTC, nous vous remercions d'avoir pris le temps de nous faire part de vos opinions.