Overall satisfaction with the administration of the 43rd general election was high among candidates at 74% (69% in 2015). Satisfaction with the overall quality of service received from Elections Canada increased from 74% in 2015 to 82% in 2019. Satisfaction with the way returning officers ran the election was high at 83%, compared to 78% in 2015. Satisfaction with interactions with returning officers was also high at 85% (84% in 2015). This includes 72% who were very satisfied (62% in 2015).
Most candidates perceived Elections Canada to have run the federal election fairly (81%), and have a high level of trust in the accuracy of the election results (86%).
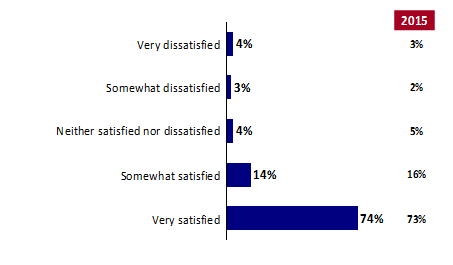
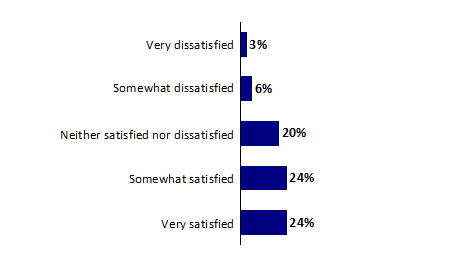
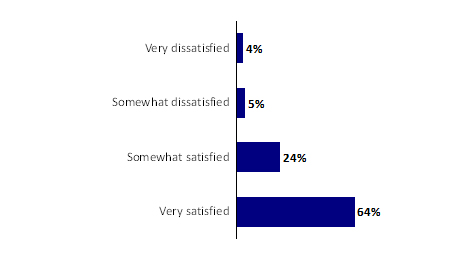
Overall satisfaction with the administration of the 43rd general election was high among candidates at 74%. In fact, 42% said they were very satisfied, and another 32% said they were somewhat satisfied. Only 11% expressed dissatisfaction, including 5% saying they were very dissatisfied. Results are similar; perhaps marginally more positive than in 2015 when 69% were satisfied.
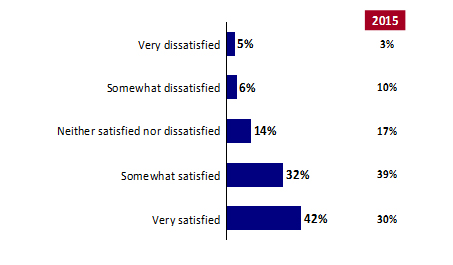
Text version of graph "Chart 1: Satisfaction with Administration of Election"
Q1ax. Overall, how satisfied were you with the way the federal election was administered by Elections Canada in your riding?
Base: n=561: all respondents (split sample). *Includes those respondents – 1% – who said “Don’t know”.
Satisfaction with overall quality of services received from EC was also very high at 82%, with half of candidates (48%) saying they were very satisfied. Only 6% indicated dissatisfaction, with only 2% saying they were very dissatisfied. Satisfaction increased from 74% in 2015.
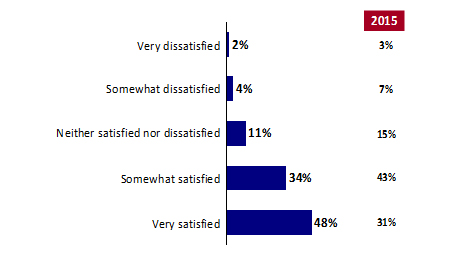
Text version of graph "Chart 2: Satisfaction with Quality of EC Services"
Q47ax. All things considered, how satisfied were you with the overall quality of service you received from Elections Canada in the most recent federal election?
Base: n=561: all respondents (split sample). *Includes those respondents – 1% – who said “Don’t know.”
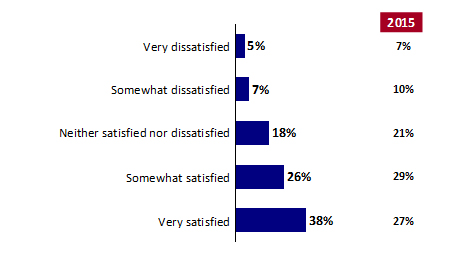
Satisfaction with the returning officers’ performance was high at 83%,1 including 59% who said they were very satisfied and another 23% who were somewhat satisfied. Only 8% expressed dissatisfaction. Satisfaction was similar, if not marginally higher than in 2015 when 78% expressed satisfaction.
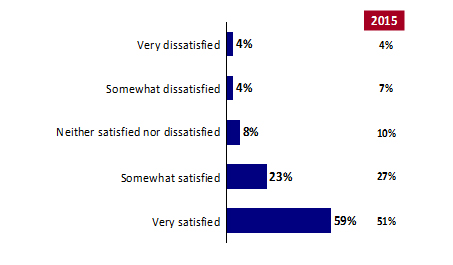
Text version of graph "Chart 3: Satisfaction with Returning Officers’ Performance"
Q2ax. How satisfied were you with the way the returning officer ran it in your riding?
Base: n=561: all respondents (split sample). *Includes those respondents – 2% – who said “Don’t know.”
Among the 8% dissatisfied with the way the returning officer ran the election, partisanship (27%) and access issues were noted as reasons, including difficulties getting questions answered (23%), general lack of access or support (22%), getting election materials (19%), or unfairness in the process (11%).
| Q3. Why were you dissatisfied with the way the returning officer ran the election in your riding? (Multiple responses accepted) | Total |
|---|---|
| n= (Candidates dissatisfied with the returning officer) | 90 |
| I felt that the returning officer/election staff/polling station was partisan | 27% |
| I had difficulties getting answers to my questions | 23% |
| Lack of access to/support | 22% |
| I had difficulties getting election materials or information from the returning officer | 19% |
| Unfairness in the process | 11% |
| Other | 9% |
| Do not know/No response | 20% |
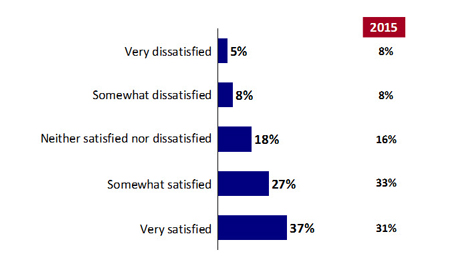
Satisfaction with interactions with the returning officer was very high at 85%, including 72% who were very satisfied. Only 6% indicated dissatisfaction, of which only half said they were very dissatisfied. The satisfaction rate is comparable to the one observed in 2015 (84%), but more candidates were very satisfied in 2019 (72% compared to 62% in 2015).
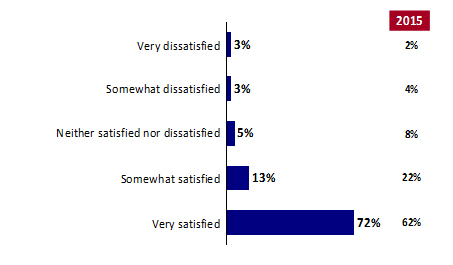
Text version of graph "Chart 4: Satisfaction with Interactions with the Returning Officer"
Q46ax. Overall, how satisfied were you with your interactions with the returning officer?
Base: n=561: all respondents (split sample). *Includes those respondents – 3% – who said “Does not apply” and those respondents – 1% -- who said “Don’t know.”
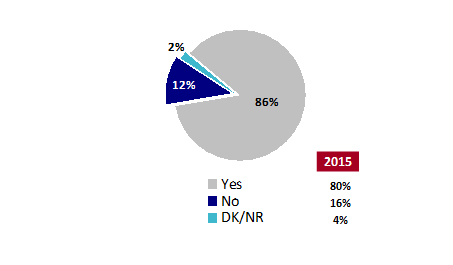
Most candidates (81%) perceived Elections Canada to have run the federal election fairly, with 29% indicating somewhat fairly, and 52% saying the election was run very fairly. Still, 13% said the election was run unfairly.2
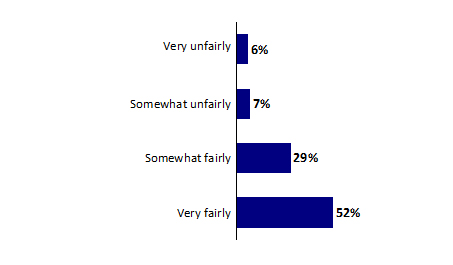
Text version of graph "Chart 5: Perceived Fairness"
Q44. Thinking about the October 21, federal election, would you say that Elections Canada ran the election...?
Base: n=1172: all respondents. *Includes those respondents – 6% – who said “Don’t know.”
Most candidates reported a high level of trust in the accuracy of the election results. One-third (32%) said they have somewhat high trust, and over half indicated they have very high trust in the accuracy of results. There were 10% of candidates who declared low trust in the results.3
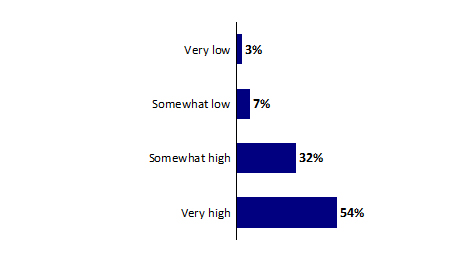
Text version of graph "Chart 6: Perceived Trust"
Q45. What level of trust do you have in the accuracy of the election results in your riding? Is it...?
Base: n=1172: all respondents. *Includes those respondents – 4% – who said “Don’t know.”
Four in five candidates (78%) felt it was easy to comply with the nomination requirements (80% in 2015). Main reasons cited for difficulties include issues with the requirement for a specific volume of signatures, the level of paperwork, its complexity, and that procedures were not clearly explained. Satisfaction with the timeliness of processing the nomination papers was at 88% (89% in 2015); including 74% who said they were very satisfied (73% in 2015). About one in six candidates reported difficulties in finding an official agent or auditor. Most candidates felt at least somewhat informed about Elections Canada’s nomination process; nearly half said they felt somewhat well informed and another 38% said they were very well informed.
As in 2015, nearly one-third (31%) of candidates felt it was very easy to comply with the nomination requirements. Almost half (47%) said it was somewhat easy, and 15% indicated that it was not very easy to comply with the nomination requirements.
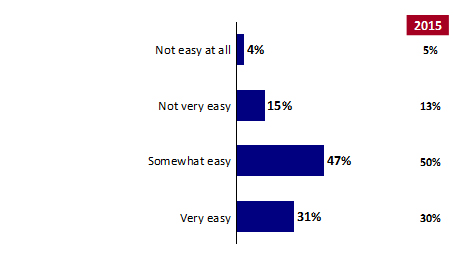
Text version of graph "Chart 7: Ease of Complying with Nomination Requirements"
Q4. How easy was it to comply with the nomination requirements? Would you say this was...?
Base: n=1172: all respondents. *Includes those respondents – 2% – who said “Don’t know.”
Reasons for difficulties include issues with obtaining the required number of signatures (39%), the level or complexity of the paperwork (24%) and that procedures were not clearly explained (20%). Others spoke of difficulties meeting deadlines (15%) or described a range of challenges faced by small parties and independent candidates (14%). A sentiment that obtaining signatures should not be a requirement (10%) and inconsistency or lack of clarity were also described (9%). Compared with 2015, there is less concern in 2019 about too much paperwork (32% in 2015), but increased difficulty meeting the deadline (3% in 2015).
| Q5. Why was this not easy? (Multiple responses accepted) | Total 2019 | Total 2015 |
|---|---|---|
| n= (Candidates finding it difficult to comply) | 223 | 174 |
| Difficult to get required number of signatures | 39% | 45% |
| Too much paperwork/bureaucracy/complexity | 24% | 32% |
| Procedures/requirements not explained | 20% | 16% |
| Difficult to meet the deadline | 15% | 3% |
| Difficulties as independent candidate/small party/new party | 14% | 17% |
| Signatures an unnecessary/unreasonable requirement | 10% | -- |
| Unclear/inconsistent information process | 9% | -- |
| Other | 3% | 5% |
| Do not know/No response | 4% | 2% |
Satisfaction with the timeliness of processing the nomination papers was at 88%, including 74% who said they were very satisfied and another 14% who were somewhat satisfied. Only 7% expressed dissatisfaction (3% somewhat and 4% very dissatisfied). Results are similar to those found in 2015 when 89% expressed satisfaction.
Text version of graph "Chart 8: Satisfaction with Timeliness of Processing Nomination Papers"
Q6ax. How satisfied were you with the returning officer's timeliness in processing your nomination?
Base: n=561: all respondents (split sample). *Includes those respondents – 1% – who said “Don’t know.”
Most candidates (87%) felt informed about Elections Canada’s nomination process. Nearly half (49%) said they felt somewhat well informed and another 38% said they were very well informed. Only 12% said they did not feel well informed.
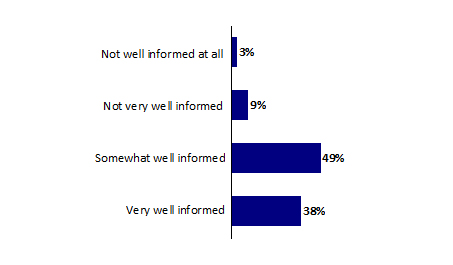
Text version of graph "Chart 9: How Informed Candidates Felt About EC Nomination Process"
Q9. Overall, how well informed did you feel about Elections Canada's nomination process? Would you say that you were...?
Base: n=1172: all respondents. *Includes those respondents – 2% – who said “Don’t know.”
Four in five (79%) respondents said they did not encounter any difficulties in finding an official agent. Of the one in five (19%) candidates who did, the difficulties included that it was hard to find someone willing and available (67%), or qualified to be an official agent (46%). About one quarter (26%) said it was difficult to find an official agent because it is a hard job with too many responsibilities. Incidence of difficulties is similar to the 17% reported in 2015. Difficulties finding someone qualified was reported more often in 2019 than in 2015 (46% vs. 27%).
| Q7a. Did you encounter any difficulties in finding an official agent? | Total 2019 | Total 2015 |
|---|---|---|
| n= (Randomly selected half of candidates in 2019; all candidates in 2015) | 561 | 916 |
| Yes | 19% | 17% |
| No | 79% | 80% |
| Do not know/No response | 2% | 3% |
| Q8a. What were they? (Multiple responses accepted) | Total 2019 | Total 2015 |
| n= (Candidates reporting a difficulty finding an agent) | 105 | 161 |
| Hard to find someone willing/available | 67% | 68% |
| Difficult to find someone qualified | 46% | 27% |
| Hard job/too many responsibilities | 26% | 24% |
| Don’t know/No response | 2% | 0% |
Among the candidates who said that they needed an auditor (61% of the candidates), 90% indicated they did not have any difficulties in finding one. Only 14% reported difficulties; these included that it was hard to find someone willing or available (47%), or qualified (38%). About one-third (32%) said the fees were too high to find an auditor. The incidence of difficulties is marginally higher than reported of candidates in 2015 (10%), and fewer in 2015 reported issues related to cost (13%).
| Q7b. Did you encounter any difficulties in finding an auditor? | Total 2019 | Total 2015* |
|---|---|---|
| n= (Those who said they needed an auditor in a randomly selected half of candidates in 2019; all candidates in 2015) | 370 | 879 |
| Yes | 14% | 10% |
| No | 86% | 90% |
| Q8b. What were they? (Multiple responses accepted) | Total 2019 | Total 2015 |
| n= (Candidates reporting a difficulty finding an auditor) | 50 | 91 |
| Hard to find someone willing/available | 47% | 51% |
| Difficult to find someone qualified | 38% | 39% |
| Fees were too high/could not afford it | 32% | 13% |
| Do not know/No response | 9% | 3% |
* The 2015 results presented in Table 4 may differ from those reported in the 2015 Survey of Candidates report because they have been recalculated for comparability with 2019 data.
Just over four in ten candidates (42%) said that they or someone else on their team used Elections Canada’s portal. Among those, two in three were satisfied with the portal. Over half of the candidates reported that they primarily used the portal to download election materials. Other uses included submitting nomination papers electronically, accessing post-election results or materials, or maintaining the account and contact profile. Most candidates (four in five) who said that they used the portal agreed that it made submitting the nomination papers convenient or contained useful information, or was easy to create an account. Three in four candidates agreed that the portal provided an easy access to documents.
In 2019, Elections Canada introduced the Political Entities Service Centre (PESC), commonly known as the portal, providing candidates the opportunity to file their nomination papers and financial reports electronically. The portal was reportedly used by 42% of candidates, including those who used it personally, or had someone on their team used it. One-third (33%) said that no one in their campaign used the portal. Nearly one in ten (9%) were not aware the portal existed or that they could access it, and 16% did not know if the portal was accessed or did not provide a response.
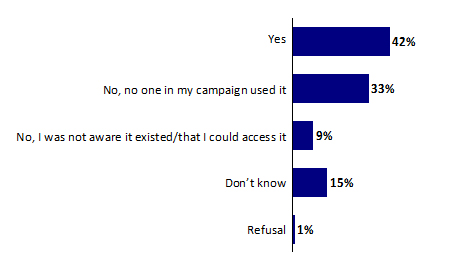
Text version of graph "Chart 10: Use of the Portal"
Q10. Did you, or any of your representative, use the portal?
Base: n=1172: all respondents
Candidates said they used the portal primarily to download election materials (56%). Other uses included submitting a nomination electronically (30%), accessing post-election results or materials (28%), or maintaining the account and contact profile (27%).
| Q11. What did you, or your representative, use the portal for? (Multiple responses accepted) | Total |
|---|---|
| n= (Candidates using the portal) | 478 |
| Download election materials | 56% |
| Submit nomination electronically | 30% |
| Access post-election results or materials | 28% |
| Maintain account and contact profile | 27% |
| General information | 4% |
| Comment on difficulties experienced | 4% |
| Submit expenses/finances | 3% |
| Other | 1% |
| Do not know/No response | 15% |
Of those who did not use the portal, nearly one in five said their campaign was limited (small budget), or there was no need to use it for some other reason (19%). About one in ten ended up not using it because they felt it was not easy to use (11%), preferred dealing with EC in person (10%), preferred working with paper (9%) or did not know about the portal or how to use it (9%).
| Q14. Why did you not use the portal? | Total |
|---|---|
| n= (Candidates not using the portal) | 584 |
| Limited campaign/no need | 19% |
| Not easy to use/complex | 11% |
| Prefer dealing face to face with EC | 10% |
| Prefer working with paper | 9% |
| Did not know about/Not told how to use it | 9% |
| No time, too busy | 7% |
| Advised there were problems with it | 2% |
| Technical issues/Not comfortable using technology | 5% |
| Other | 4% |
| Do not know/No response | 33% |
Most candidates who used the portal agreed that it contained useful information (87%), that it made submitting their nomination convenient (82%), or that it was very easy to create an account (82%). Three in four candidates agreed that the portal provided an easy access to documents (77%). Two in three candidates agreed that the portal was easy to navigate (69%), or felt that the portal ensures the protection of candidates and electors’ personal information (61%). One-quarter (24%) agreed that the portal was compatible with their mobile devices.
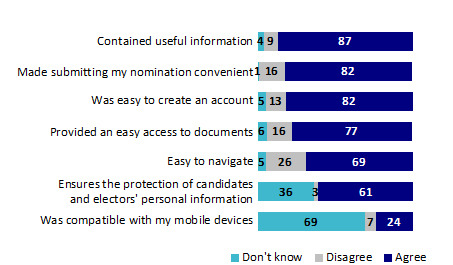
Text version of graph "Chart 11: Experiences with the Portal (%)"
Q12a-g. How strongly do you agree or disagree with the following statements?
Base: n=242; candidates who used the portal personally, *Includes those respondents – 1%-69%– who said “Don’t know.”
Among those who reported having used the portal, satisfaction was moderately high at 65%, although only 21% of them said they were very satisfied. The largest proportion indicated only moderate satisfaction. Seventeen percent said they were dissatisfied, although only 4% were very dissatisfied.
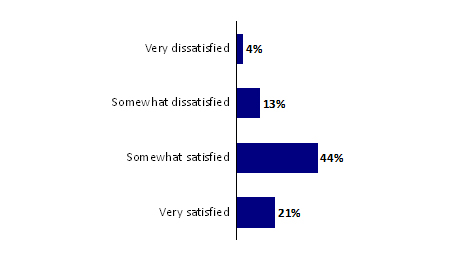
Text version of graph "Chart 12: Satisfaction with the Portal"
Q13. How satisfied were you, or your representative, with the overall user experience of the portal? Were you...?
Base: n=480: respondents who used the portal. *Includes those respondents – 18% – who said “Don’t know.”
Most candidates found Elections Canada’s products to be useful in running their campaign. Over half found the products somewhat useful, and three in ten found the products very useful. Of the products offered by Elections Canada, candidates primarily used the maps of polling place service areas, the lists of polling stations, and the Political Financing Handbook for Candidates and Official Agents. Almost half of the candidates stated that having both formats (paper and electronic) of the polling station lists was useful for them (up from 32% in 2015). In considering the quality of the list of electors, satisfaction was modest at 48% (down from 58% in 2015). Satisfaction with the Event Map Viewer was moderately high at 48%. Of the tools to communicate with electors, over two in five candidates found the Guide to the Federal Election (also known as the Booklet) most useful.
Returning officers organized an all candidates briefing in their riding before the 43rd general election. Three in four candidates attended the briefing or sent someone else to attend (up from 62% in 2015). Just less than half of candidates indicated that they personally attended the briefing, while others had a campaign delegate, manager, or official agent attend. Of those attending or represented at the briefing, four in five found it useful.
There was moderate use reported for the 1-800 support line for candidates, with 39% candidates reporting that they or their representatives contacted Elections Canada using this method (42% in 2015). Among those who used the support line, satisfaction was moderately high at 74%. Most candidates, or their representatives, contacted or visited their local Elections Canada office during the election (86% in 2019, up from 80% in 2015). Satisfaction was high at 88% when considering services provided by the local Elections Canada office.
Candidates used a number of Elections Canada products; most predominantly maps of polling place service areas (70%), lists of polling stations (68%), and the Political Financing Handbook for Candidates and Official Agents (64%). Over half (57%) used the Elections Canada lists of electors, including the preliminary lists, the revised lists and the official lists. The statement of electors who voted on polling day (also called a bingo sheet) was used by 41% of candidates, while Elections Canada’s tools to communicate with electors were used by 18% of them.
| Q15. Which of the following Elections Canada products did you use? Did you use...? (Multiple responses accepted) | Total |
|---|---|
| n= (All candidates) | 1172 |
| Maps of polling place service areas | 70% |
| Lists of polling stations | 68% |
| Political Financing Handbook for Candidates and Official Agents | 64% |
| Lists of electors, including the preliminary lists, the revised lists and the official lists | 57% |
| Statement of electors who voted on polling day, also called a bingo sheet | 41% |
| EC's tools to communicate with electors | 18% |
| Don't know/I did not use any of EC's products/No response | 13% |
Nearly half (48%) of candidates said the availability of both the paper and electronic formats of updated lists of polling stations was most useful. About one-quarter (26%) preferred the electronic format, while 17% said the paper format was most useful. Compared with 2015, preference for a single format seems to have decreased for both paper and electronic.
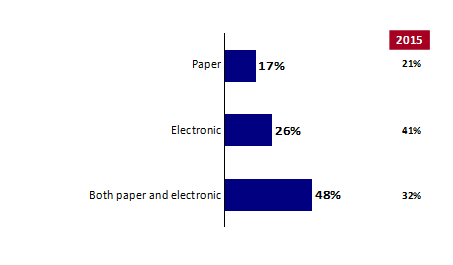
Text version of graph "Chart 13: Most Useful Format of Polling Station Lists"
Q16. In your opinion, which format of the updated lists of polling stations was most useful?
Base: n=790: respondents who used lists of polling stations. *Includes those respondents – 9% – who said “Don’t know.”
Satisfaction with the quality of the list of electors was modest at 48%, and only 21% were very satisfied. Fifteen percent indicated dissatisfaction, although only 5% said they were very dissatisfied. Results are less positive than in 2015 when 58% were satisfied, although a similar proportion were very satisfied (23%).
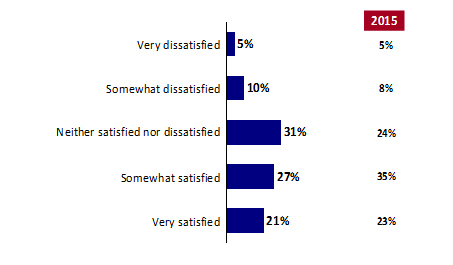
Text version of graph "Chart 14: Satisfaction with Quality of List of Electors"
Q17ax. How satisfied were you with the overall quality of the list of electors?
Base: n=300: respondents who used a list of electors (split sample). *Includes those respondents – 6% – who said “Don’t know.”
Over two in five (43%) candidates found the Guide to the Federal Election (also known as the Booklet) most useful to communicate with electors, followed by the infographics (21%), the videos (18%) and the banners for their website (15%).
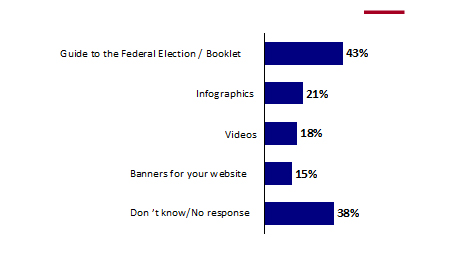
Text version of graph "Chart 15: Useful Communication Tools"
Q18. Which of the following EC's tools to communicate with electors were the most useful for your campaign?
Base: n=206: respondents who used Elections Canada’s tools to communicate with electors. Multiple responses accepted
Most candidates (82%) used the paper format of the maps of polling place services areas. Over one in three (35%) used the PDF format, while 17% used the Event Map Viewer. Use of paper has increased from 68% in 2015.
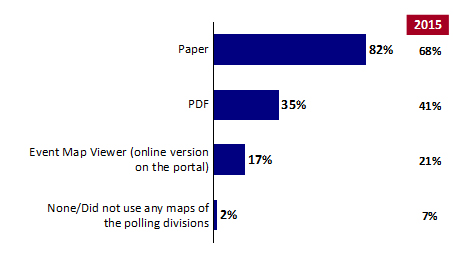
Text version of graph "Chart 16: Format of Polling Place Maps"
Q19. Which format of the maps of polling place service areas did you use? Did you use...?
Base: n=808: respondents who used maps of pilling place service areas. *Includes those respondents – 6% – who said “Don’t know.” (Multiple responses accepted)
Satisfaction with the Event Map Viewer was moderately high at 48% satisfied (24% very satisfied), although many candidates said that they do not know or did not provide a response (24%). Only 9% indicated dissatisfaction (6% somewhat and 23% very dissatisfied).
Text version of graph "Chart 17: Satisfaction with the Event Map Viewer"
Q20ax. How satisfied were you with the Event Map Viewer?
Base: n=60: respondents who used the Event Map Viewer (split sample). *Includes those respondents – 24% – who said “Don’t know.”
Most candidates (85%) found Elections Canada’s products to be useful in running their campaign. Over half (55%) found the products somewhat useful, and 30% found the products very useful. One in ten said the Elections Canada products were not useful.
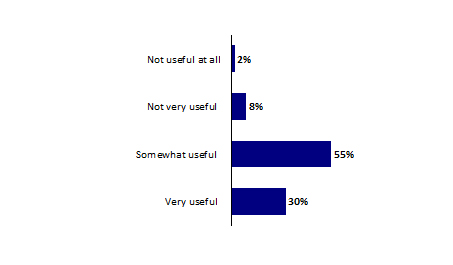
Text version of graph "Chart 18: Usefulness of Elections Canada Products in the Campaign"
Q22. Thinking about what you needed to run your campaign, how useful were Elections Canada's products? Were they...?
Base: n=1015: all respondents. *Includes those respondents – 4% – who said “Don’t know.”
Of those who did not find Elections Canada’s products useful (10% of the candidates), one-third of candidates listed as products that were not useful: bingo sheets (30%), tools to communicate with electors (30%), and lists of electors (29%). Other products mentioned to a lesser extent include polling place service area maps (16%) and lists of polling stations (12%). One in five provided a variety of responses with no central theme.
| Q23. Which Elections Canada's products did you think were not useful? (Multiple responses accepted) | Total |
|---|---|
| n= (Candidates not finding EC products useful) | 103 |
| Bingo sheets | 30% |
| Tools to communicate with electors | 30% |
| List of electors | 29% |
| Polling place service area maps | 16% |
| List of polling stations | 12% |
| Other | 22% |
| Do not know/No response | 27% |
In total, 75% of candidates attended the briefing or sent someone else to attend, up from 62% in 2015, although 22% said they did not know in 2015. Among the 75% where there was attendance, 47% of the time it was the candidate themselves who attended, from 40% attendance 2015. In 37% of the cases, candidates assigned their campaign manager to attend (either with them or on their own), down from 45% in 2015. The official agent attended (either with them or on their own) about one-fifth of the time (19%), up from 16% in 2015.
Of those who attended or had a representative attend, most found the briefing somewhat (45%) or very (35%) useful. Only 12% found the briefing not to be useful. Overall, the 80% indicating usefulness is on par with 81% in 2015, although more candidates found it very useful in 2019, compared with 28% in 2015.
| Q24. The returning officer in your riding organized an “all candidates briefing” for the general election. Could you tell us if…? (Multiple responses accepted) | Total 2019 | Total 2015 |
|---|---|---|
| n= (All candidates) | 1170 | 916 |
| You personally attended | 47% | 40% |
| Your campaign delegate/manager attended | 37% | 45% |
| Your official agent attended | 19% | 13% |
| No one attended | 21% | 16% |
| Do not know/No response | 4% | 22% |
| Q25. How useful was the briefing? Was it...? | Total 2019 | Total 2015 |
| n= (Candidates with some attendance at briefing) | 882 | 712 |
| Very useful | 35% | 28% |
| Somewhat useful | 45% | 53% |
| Not very useful | 9% | 10% |
| Not useful at all | 3% | 3% |
| Do not know/No response | 8% | 6% |
There was moderate use reported for the 1-800 support line for candidates. Nearly two in five (39%) candidates said that they or their representatives contacted Elections Canada with the 1 800 support line, while 43% did not and 18% said they were unsure. This compared with 42% indicating use in 2015.
Text version of graph "Chart 19: Use of 1-800 Support Line"
Q26a. During the election, did you, or any of your representatives, contact Elections Canada with the 1-800 support line for candidates?
Base: n=561: all respondents (split sample)
Satisfaction with services received from the 1-800 support line was moderately high at 74%, with 42% indicating they were very satisfied. Another 21%, however, indicated dissatisfaction (11% very dissatisfied).
Text version of graph "Chart 20: Satisfaction with the 1-800 Support Line"
Q27ax. How satisfied were you, or your representative, with the services you received from the 1-800 support line for candidates?
Base: n=185: respondents who said they used the 1-800 support line for candidates. *Includes those respondents – 5% – who said “Don’t know.”
Most (86%) candidates, or their representatives, contacted or visited their local Elections Canada office during the election. This compares to 80% in 2015.
Text version of graph "Chart 21: Contacted or Visited an Elections Canada Local Office"
Q26b. During the election, did you, or any of your representatives, contact or visit the local Elections Canada office?
Base: n=611: all respondents (split sample).
In terms of services provided by the local office, satisfaction was higher at 88% (64% very satisfied and 24% somewhat satisfied), compared with the services provided by the 1-800 line (74%). Only 9% said they were dissatisfied (4% very dissatisfied).
Text version of graph "Chart 22: Satisfaction with Local Office"
Q27dx. How satisfied were you, or your representative, with the services you received from the local Elections Canada office?
Base: n=522: respondents who said they contacted or visited the local EC office. *Includes those respondents – 2% – who said “Don’t know.”
One in five candidates reported that they provided the returning officer with a list of names of election staff to work at polling stations. Of those who reported that they used a voters list (72% of the candidates), 94% said that they took measures to ensure the protection of personal information contained in it.
Four in ten of candidates reported taking measures to ensure their campaign materials were accessible to electors with a disability.
The financial incentives provided by the Canada Elections Act were not well known, with just over one-third of candidates (36%) reporting awareness that the Act provides for partial reimbursement of elections expenses as well as some personal expenses like childcare costs and expenses related to a disability.
One in five (21%) candidates provided the returning officer with a list of names of election staff to work at polling stations. The majority (60%) did not, and a further 9% did not know they could provide one. Another 10% of the candidates did not know if they provided a list of election staff to the returning officer (or did not answer the question).
Of those who did not provide a list, nearly half (46%) said that they did not have anyone interested, available or competent to work at the polling stations. About one in ten said that there was not enough time to find people (10%), or that there were difficulties in finding someone because they were independent candidates or running for a small or new party (8%).
| Q28. Did you provide a list of names of election staff to work at the polling stations to the returning officer? | Total |
|---|---|
| n= (All candidates) | 1172 |
| Yes | 21% |
| No | 60% |
| Did not know I could provide one | 9% |
| Do not know/No response | 10% |
| Q29. Why did you not provide a list of names? | Total |
| n= (Candidates who did not provide a list) | 724 |
| Did not have anyone/unable to find people interested or available/unable to find competent people | 46% |
| Not enough time to find people | 10% |
| Difficulties as independent candidate/small party/new party | 8% |
| I did not want to provide a list | 5% |
| Elections Canada/returning officer should do this | 4% |
| Procedures not explained | 4% |
| Returning officers did not request such a list | 4% |
| No need to provide a list | 3% |
| Other | 2% |
| Do not know/no response | 22% |
One in five candidates reported not using the voters’ lists. Among those who did, 94% of candidates said they took measures to ensure the protection of personal information contained in the lists they received. Only 6% did not take any measures to protect personal information.
Of those who took measures to ensure the protection of personal information, almost two in five said they ensured limited access to lists to themselves or their campaign manager or agent (38%), or they kept lists in a secure or locked place (36%). One-quarter (24%) stated that they ensured the destruction of voters lists at the end of the election, while 14% ensured limited access in general.
| Q30. Did you take any measures to ensure the protection of personal information contained in the voters' lists that you received? | Total |
|---|---|
| n= (Candidates who used voters’ lists) | 848 |
| Yes | 94% |
| No | 6% |
| Q31. What measures did you take to ensure the protection of personal information? (Multiple responses accepted) | Total |
| n= (Candidates who took protection measures) | 789 |
| Ensured limited access to lists to self/campaign manager/agent | 38% |
| Kept lists in secure place/Kept locked away | 36% |
| Ensured the destruction of voters lists at end of the election | 24% |
| Ensured limited access in general | 14% |
| Issued instructions regarding use of voters lists | 8% |
| Encrypted the lists | 4% |
| Brought voters lists back to returning officer | 3% |
| Issued procedures to re-collect copies of voters lists after event | 2% |
| Kept at home/office | 2% |
| Do not know/no response | 15% |
Two in five (39%) candidates said they took measures to ensure that their campaign’s materials, events or website were accessible to electors with a disability. There were 27% who did not, and a further 33% did not provide a response or did not recall.
Wheelchair-accessible venues were provided by 27% of candidates who took some measures. About two in five had campaign offices that were accessible to those with mobility issues (22%) or developed websites that were accessible to electors using a screen reader (20%). Fifteen percent said they conducted personal outreach to those in need of options or those who are marginalized.
| Q32. Did you take any measures to ensure that your campaign's materials, events or website were accessible to electors with a disability? | Total |
|---|---|
| n= (All candidates) | 1172 |
| Yes | 39% |
| No | 27% |
| Do not know/no response | 33% |
| Q33. Which measures did you take to make your campaign accessible? (Multiple responses accepted) | Total |
| n= (Candidates who took measures) | 443 |
| Venues were wheelchair accessible | 27% |
| Campaign office was accessible to mobility issues | 22% |
| Website was accessible to electors with a screen reader | 20% |
| Personal outreach to those in need of access options/marginalized | 15% |
| General mention of accommodation | 9% |
| Social media content was accessible to electors with a screen reader | 7% |
| Large print materials were available | 6% |
| Videos/Audio with closed captioning | 5% |
| Asking electors with a disability about accessibility needs | 4% |
| Braille/ESL materials were available | 3% |
| Offered transport to the polling station | 4% |
| Other | 6% |
| Do not know/no response | 17% |
The financial incentives provided by the Canada Elections Act were not well known. Just over one-third (36%) of candidates said they were aware that the Act provides for partial reimbursement of elections expenses as well as some personal expenses like childcare costs and expenses related to a disability.
Among candidates aware of these incentives, most (74%) said they had no impact at all on their decision to run in the last federal general election. For those who were influenced by the incentives, 7% said it had a moderate impact, and 6% said it had a major impact on their decision to run.
| Q34. The Canada Elections Act provides for partial reimbursement of elections expenses as well as some personal expenses like childcare costs and expenses related to a disability. When deciding to run as a candidate, were you aware of these financial incentives? | Total |
|---|---|
| n= (All candidates) | 1172 |
| Yes | 36% |
| No | 61% |
| Do not know/no response | 2% |
| Q35. What impact, if any, did these financial incentives have on your decision to run in the last general election? Did they have a...? | Total |
| n= (Candidates aware of financial incentives) | 411 |
| Major impact | 6% |
| Moderate impact | 7% |
| Minor impact | 12% |
| No impact at all | 74% |
| Don’t know/no response | 2% |
Two in three candidates (64%) were satisfied with how the voting process went on advance polls or election day (up from 56% in 2015). One-quarter of those who said they were dissatisfied listed inadequately trained staff as the reason.
Candidates reported similar satisfaction with the location of polling sites (64%, the same proportion as 2015). Dissatisfaction with the sites included that the polling locations were too far, problems with accessibility, or insufficient space at the polling location. Among the candidates who were present or had staff present at the polling location, four in five didn’t witness any problem related to the voter identification requirements (up from 72% in 2015) or with the use of the voter information card (VIC) as a piece of identification.
Satisfaction with the way the voting process went on advance polls and election day was moderately high at 64%, with 38% who were very satisfied. Thirteen percent5 indicated dissatisfaction, although only 5% were very dissatisfied. Satisfaction with the way voting process went on advance polls and election day was lower in 2015 (56%).
Text version of graph "Chart 23: Satisfaction with Voting Process"
Q38ax. What was your level of satisfaction with the way the voting process went on advance polls and election day?
Base: n=561: all respondents (split sample). *Includes those respondents – 6% – who said “Don’t know.”
About one-quarter (24%) of candidates dissatisfied with the voting process mentioned that the staff was inadequately trained or prepared. Other reasons cited by more than one in ten include inappropriate handling or storage of ballots or staff not following procedures (20%), too few stations or long lineups (15%), and deliberate influencing of voters or mistrust in counting (15%).
| Q39. Why were you dissatisfied with the voting process? (Multiple responses accepted) | Total |
|---|---|
| n= (Candidates dissatisfied with the voting process) | 130 |
| Staff inadequately trained/prepared | 24% |
| Inappropriate handling/storage of ballots, irregularities, staff not following procedures | 20% |
| Too few stations/long line ups | 15% |
| Fraudulent/Deliberately influencing voters/Mistrust in counting | 15% |
| Delays/early closures at stations on certain polls did not open | 10% |
| Inadequate ID/voter requirements | 9% |
| Use of pencil, ballots susceptible to tampering | 9% |
| Other | 2% |
| Do not know/no response | 16% |
Satisfaction with the location of polling sites was moderately high at 64%, with 37% who were very satisfied. One in ten (12%6) indicated dissatisfaction, but only 5% were very dissatisfied. Results are similar to those in 2015.
Text version of graph "Chart 24: Satisfaction with Location of Polling Sites"
Q36ax. What was your level of satisfaction with the locations chosen as polling sites for advance polls and Election day?
Base: n=561 all respondents (split sample). *Includes those respondents – 5% – who said “Don’t know.”
Candidates who were dissatisfied with the location of the polling sites cited a variety of reasons, including: that polling stations were too far (33%), problems with accessibility of polling stations (20%) or insufficient space at the polling stations (19%). About one in ten said that the polling stations were inappropriate (12%), far from public transit or had insufficient parking (10%), that it was hard to find the polling stations (9%), or that there were not enough polling stations or outreach to marginalized individuals (9%).
| Q37. Why were you dissatisfied with the location of the polling sites? (Multiple responses accepted) | Total 2019 |
|---|---|
| n= (Candidates dissatisfied with polling site locations) | 111 |
| Polling stations on election day located too far/Advance polling stations located too far | 33% |
| Problems with accessibility of polling stations | 20% |
| Poor/insufficient space at polling stations | 19% |
| Inappropriate polling stations | 12% |
| Polling stations far from public transit/insufficient parking | 10% |
| Hard to find polling station | 9% |
| Lack of polling stations/outreach to marginalized | 9% |
| Other | 9% |
| Do not know/no response | 14% |
Among the candidates who said they were present or represented at the polling location, 20% said they witnessed problems related to the voter identification requirements, while 80% did not. This is lower than the 28% reporting problems in 2015.7 Problems related to the voter identification requirements were mostly attributed to inadequately trained staff, inconsistencies in identification requirements, and electors having problems proving their identity, with only small numbers of candidates reporting each type of issue.
| Q40a. Did you, or your representative, witness any problems related to the voter identification requirements? | Total |
|---|---|
| n= (Candidates who were or had a representative present at the polling location, on a randomly selected half of candidates) | 415 |
| Yes | 20% |
| No | 80% |
Among the 20% of candidates reporting problems with the voter identification requirements, 37% said this occurred very often, and another 19% said it occurred somewhat often, while 35% said it did not occur very often and 15% not often at all.
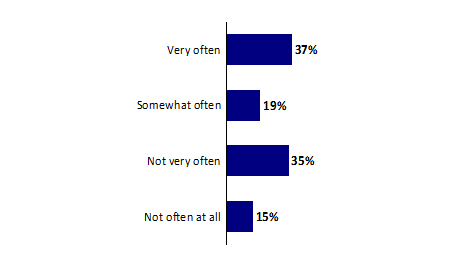
Text version of graph "Chart 25: Frequency of Problems with Voter Identification Requirements"
Q43. How often did you observe those problems?
Base: n=68: respondents who observed problems with voter identification requirements. *Includes 14% – who said “Don’t know.”
Among the candidates who said they were present or represented at the polling location, 16% witnessed a problem related to the use of the voter information card (VIC) as a piece of identification, although the majority (84%) did not witness any problems. The majority of the VIC-related problems reported are related to the management of the VIC. This included inappropriate receipt of VICs (non-eligibility), the VIC not being received, or electors having problems proving their identity. Each type of concern was reported by a small number of candidates.
| Q40b. Did you, or your representative, witness any problems related to the use of the voter information card (VIC) as a piece of identification? | Total |
|---|---|
| n= (Candidates who were or had a representative present at the polling location, on a randomly selected half of candidates) | 457 |
| Yes | 16% |
| No | 84% |
Among the 16% of candidates reporting problems with the use of the VIC as a piece of identification, 17% said this occurred very often and another 27% said it occurred somewhat often. Just under half said it did not occur very often (30%) or often at all (16%).
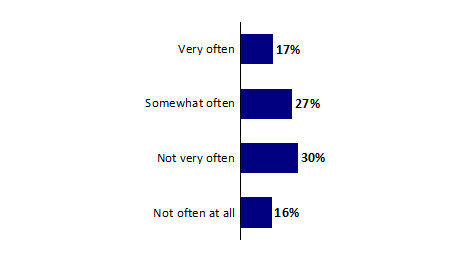
Text version of graph "Chart 26: Frequency of Problems with Voter Information Card"
Q43. How often did you observe those problems?
Base: n=146: respondents who reported observing problems with voter identification requirements. *Includes those respondents – 10% – who said “Don’t know.”
Candidates were asked for their suggestions on how to improve the services they received from Elections Canada. Although 46% did not provide a response, 54% provided one or more suggestions. As in 2015, top responses related to more timely or accessible information (12%), or more training for staff (10%). A general increase in the level of service (8%) was also suggested as well as improved access or user experience (e.g. better navigation) on the portal (7%). Increased accuracy of the voter lists was also noted (4%), as was less use of paper (3%) and equal treatment for independent candidates (3%). Results are generally similar for 2015.
Increasing voter turnout, while not a service provided to candidates, was also suggested as an important area for focus among six percent, and five percent spoke of better enforcement of the rules and regulations at polling stations. Better or timelier access to information for voters was also put forward (4%). Other suggestions, noted by 2% or fewer candidates, are indicated in the following table. Results are similar for 2015.
| Q48. Thinking about the services you received from Elections Canada during the election, what is your main suggestion, if anything, to improve those services? (Multiple responses accepted) | Total 2019 | Total 2019 |
|---|---|---|
| n= (All candidates) | 1172 | 916 |
| More timely/accessible information | 12% | 10% |
| More training for staff | 10% | 9% |
| Improve service levels | 8% | 7% |
| Better access/user experience on portal | 7% | -- |
| Increase voter turn out | 6% | 4% |
| Enforce rules and regulations | 5% | 3% |
| More accurate voter lists/boundaries/maps | 4% | 7% |
| Better access/more timely information for voters | 4% | 4% |
| Less paper waste (more use of electronics) | 3% | 2% |
| Equal treatment/rules for independents | 3% | -- |
| Better voting process | 2% | -- |
| Better prepared for advance voter turnouts | 2% | 4% |
| Simplify processing/qualification requirements for candidates | 2% | -- |
| Better access at/to polling stations | 1% | -- |
| Other | 7% | 5% |
| Do not know/No response | 46% | 24% |
*2% or higher shown in table
Based on what candidates had recently heard, nearly two in three felt that there was a problem in this election with the spread of false information online. Over two in five felt that foreign countries or groups were using social media and other means to influence the political opinions of Canadians. Relatively few (8%) perceived that there was hacking by foreign countries or groups into the computer systems that supported this election. Among those who perceived that the spread of false information was a problem during the election, 30% perceived that it had a major impact on the outcome of the election. The proportion was slightly lower (21%) among those who expressed concern about foreign countries or groups using social media and other means to influence the political opinions of Canadians.
Support for online voting among candidates was low, with just over one-third believing that electors should be able to vote by using the Internet (down from 54% in 2015); the majority of candidates felt that voting online is risky.
Based on what candidates had recently heard, nearly two in three (64%) felt that there was a problem in this election with the spread of false information online. Over two in five (44%), said that there was a problem with foreign countries or groups using social media and other means to influence the political opinions of Canadians. Relatively few (8%) perceived that there was a problem with hacking by foreign countries or groups into the computer systems that support the election.
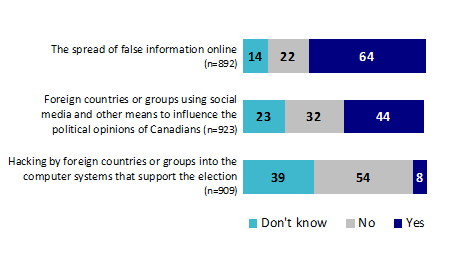
Q49a-c. Based on what you have heard recently, do you think.....was a problem in this election?
Base: All respondents (split sample).
Among the candidates who perceived that the spread of false information was a problem during the election (64%), 65% stated that it has had an impact on the outcome of the election (30% perceived a major impact).
Among the candidates who perceived that the use of social media by foreign countries or groups to influence political opinions was a problem during the election (44%), 56% stated that it had an impact on the outcome of the election (21% perceived a major impact).
Considering the small proportion of candidates who perceived that there was a problem with hacking by foreign countries or groups into the computer systems that support the election, it is not possible to report on the impact they think this might have had on the outcome of the election.
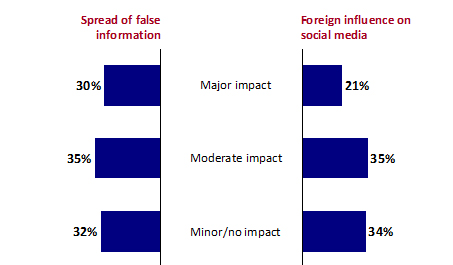
Q50. What impact, if any, do you think this had on the outcome of the election?
Base: Social Media: n=108, DK/NR - 4% / Foreign Influence n=275, DK/NR - 10%
When asked whether they prefer that poll workers use paper or computer lists to find a voter’s name and keep track of who voted, 41% of candidates indicated a preference for paper lists, with 33% preferring computer lists. One in five (21%) did not have a preference.
Regarding the ballot counting method, just less than half (46%) of candidates indicated a preference for hand counting and 31% preferred machine counting. Nearly one in five (16%) said they had no preference.
| Q51a. In a Canadian federal election, workers at the polls use paper lists to find a voter's name and keep track of who voted. In some provincial elections, poll workers use computers or tablets to do this electronically. Which method do you prefer? | Total |
|---|---|
| n= (Randomly selected half of candidates) | 561 |
| Paper lists | 41% |
| Computer lists | 33% |
| No preference | 21% |
| Do not know/no response | 5% |
| Q51b. In Canadian federal elections, each paper ballot is counted by hand. In some provincial elections, paper ballots are scanned into a machine that counts the votes. Which vote counting method do you prefer? | Total |
| n= (Randomly selected half of candidates) | 611 |
| Hand counting | 46% |
| Machine counting | 31% |
| No preference | 16% |
| Do not know/no response | 7% |
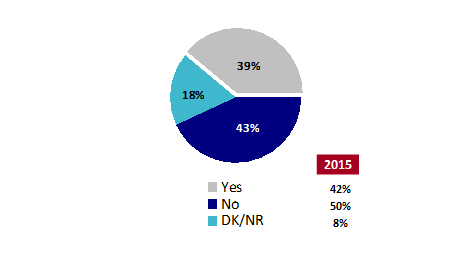
Over one-third (35%) of candidates think that electors should be able to vote using the Internet, down considerably from 54% in 2015. Six in ten (59%) do not, and another 6% were not sure or did not provide a response.
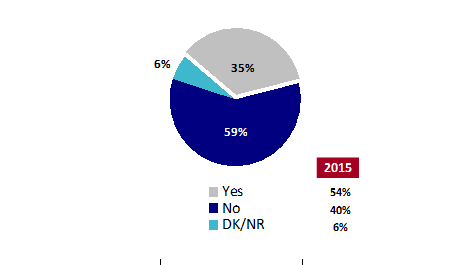
Text version of graph "Chart 29: Online Voting"
Q52a. Do you think that electors should be able to vote by using the Internet?
Base: n=561: all respondents (split sample).
The majority (67%) of candidates believe that voting online is risky, while just over one in five (22%) said that voting online is safe.
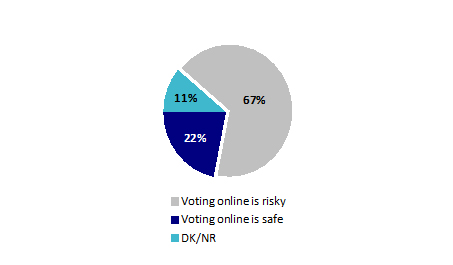
Text version of graph "Chart 30: Perceived Risk of Online Voting"
Q52b. Which statement comes closest to your own view?
Base: n=611: all respondents (split sample).
Half of candidates were satisfied with the way that democracy works in Canada. The two most frequently cited reasons for dissatisfaction in the way democracy works in Canada include the lack of proportional representation and that the first-past-the-post system does not reflect voters’ preferences.
Just under half of the candidates (46%) agreed that the voting age in the federal election should be lowered from 18 to 16 years old. Candidates’ opinions were divided on whether and how women’s participation in politics should be encouraged, with 47% agreeing that political parties should be required to have more women candidates and 36% thinking that political parties should receive a financial incentive for having more women candidates.
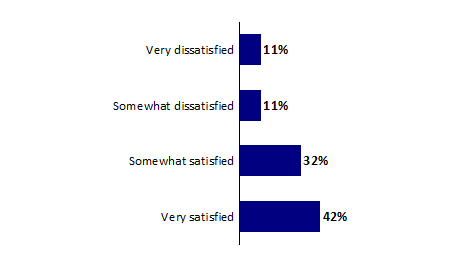
Fifty percent of the candidates said that they were satisfied with the way democracy works in Canada (16% were very satisfied). A proportion of 23% of the candidates said they were very dissatisfied with the way that democracy works in Canada.
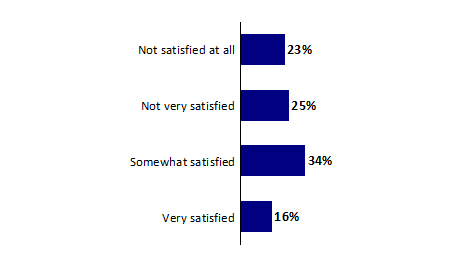
Text version of graph "Chart 31: Satisfaction with Democracy in Canada"
Q53. Overall, how satisfied are you with the way democracy works in Canada? Are you...?
Base: n=1172: all respondents. *Includes those respondents – 1% – who said “Don’t know.”
The two most frequently cited reasons for dissatisfaction in the way democracy works in Canada include the lack of proportional representation (36%) and that the first-past-the-post system does not reflect voters’ preferences (27%). Over one in ten (12%) were dissatisfied with the influence or bias of media on democracy.
| Q54. Is there a specific reason why you are dissatisfied with the way democracy works in Canada? (Multiple responses accepted) | Total |
|---|---|
| n= (Candidates dissatisfied with democracy in Canada) | 573 |
| Lack of proportional representation | 36% |
| First-past-the-post does not reflect voters' preferences | 27% |
| Media influence/bias | 12% |
| Needs electoral reform (general mention) | 6% |
| Difficulties as independent candidate/small party/new party | 4% |
| The role of money in politics is increasing | 4% |
| Two party focus/unfair bias toward large parties | 4% |
| Negative/toxic messaging/social media campaign | 3% |
| Foreign/corporate influence/meddling | 2% |
| Limitation on freedom of speech | 2% |
| Other | 7% |
| Do not know/no response | 5% |
Over half (52%) of candidates disagree (41% strongly disagree) that the voting age in the federal election should be lowered from 18 to 16 years old, while 46% agree (31% strongly agree).
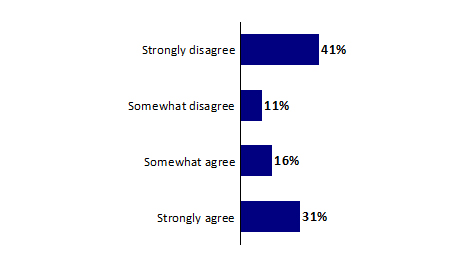
Text version of graph "Chart 32: Lowering the Voting Age"
Q55. How strongly do you agree or disagree that the voting age in the federal election should be lowered from 18 to 16?
Base: n=1172, *Includes those respondents – 1% – who said “Don’t know.”
Candidates were divided on whether and how the participation of women in elections should be encouraged with 47% of candidates agreeing that political parties should be required to have more women candidates, and 36% agreeing political parties should receive a financial incentive for having more women candidates.
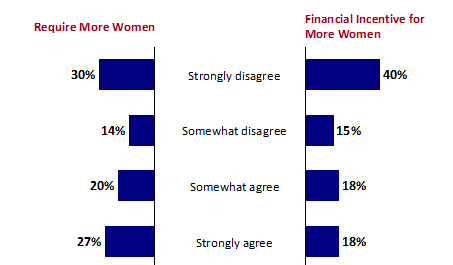
Text version of graph "Chart 33: Including More Women"
Q56a. How strongly do you agree or disagree that political parties should be required to have more women candidates?
Q56b. How strongly do you agree or disagree that political parties should receive a financial incentive for having more women candidates?
Base: n=561-611 split sample, *Includes those respondents – 9% – who said “Don’t know.”
Following are the characteristics of the sample of the 1,172 candidates included in the survey. Results are presented in terms of weighted percentage distributions, with the exception of results for age and whether they were an incumbent, and whether they were elected, for which unweighted distributions are presented in the table.
| Province | Total |
|---|---|
| n= (All candidates) | 1172 |
| Newfoundland and Labrador | 2% |
| Prince Edward Island | 1% |
| Nova Scotia | 3% |
| New Brunswick | 3% |
| Quebec | 27% |
| Ontario | 34% |
| Manitoba | 3% |
| Saskatchewan | 4% |
| Alberta | 10% |
| British Columbia | 13% |
| Nunavut/Northwest Territories/Yukon | 0% |
| Gender | Total |
| n= (All candidates) | 1172 |
| Male | 64% |
| Female | 36% |
| Age (unweighted results) | Total |
| n= (All candidates) | 1172 |
| 35 | 16% |
| 35-54 | 41% |
| 55-64 | 27% |
| 65+ | 16% |
| Language most spoken at home | Total |
| n= (All candidates) | 1172 |
| English | 72% |
| French | 23% |
| Other | 4% |
| Refusal | 1% |
| Disability | Total |
| n= (All candidates) | 1172 |
| Yes | 9% |
| No | 89% |
| Refusal | 1% |
| Do you have any of the following conditions? | Total |
| n= (Candidates reporting a disability) | 109 |
| Impaired mobility | 41% |
| Chronic pain/disease | 43% |
| Emotional/psychological/mental health condition | 27% |
| Impaired coordination or dexterity | 20% |
| Deaf or hard of hearing | 13% |
| Developmental or intellectual disability | 14% |
| Any other condition you would consider a disability | 8% |
| Refusal | 7% |
| Born in Canada | Total |
| n= (All candidates) | 1172 |
| Yes | 82% |
| No | 17% |
| Don’t know | 1% |
| Year of becoming a citizen of Canada | Total |
| n= (Candidates born outside of Canada) | 198 |
| 1980 | 18% |
| 1980 – 1989 | 14% |
| 1990 – 1999 | 18% |
| 2000 – 2009 | 15% |
| 2010 or later | 11% |
| I was born a Canadian citizen, but outside of the country | 8% |
| Do not know/Do not remember | 12% |
| Ethnic or cultural background | Total |
| n= (All candidates) | 1172 |
| White / Caucasian | 69% |
| Indigenous (First Nations, Métis, Inuit) | 4% |
| South Asian / East Indian | 3% |
| Canadian | 3% |
| European | 3% |
| Black (Africa, Caribbean) | 3% |
| West Asian / North African / Arab | 2% |
| Chinese (Chinese, Hong Kongese, Taiwanese) | 2% |
| South East Asian | 1% |
| Latin American (All Central and South American countries, Mexico, Cuba, Puerto Rico) | 1% |
| Do not know | 1% |
| Refusal | 6% |
| Highest level of education reached | Total |
| n= (All candidates) | 1172 |
| High school | 8% |
| Completed community college/vocational/trade school/commercial/CEGEP | 14% |
| Some university (No degree or diploma obtained) | 10% |
| Completed university (Diploma or Bachelor’s degree) | 33% |
| Post-graduate university/professional school (Master's, PhD, or any professional degree) | 33% |
| Refusal | 2% |
| Total annual income of household before taxes in 2018 | Total |
| n= (All candidates) | 1172 |
| Under $30,000 | 10% |
| $30,000 to just under $60,000 | 16% |
| $60,000 to just under $90,000 | 14% |
| $90,000 to just under $110,000 | 10% |
| $110,000 to just under $150,000 | 10% |
| $150,000 to just under $200,000 | 12% |
| $200,000 to just under $250,000 | 6% |
| $250,000 and above | 9% |
| Do not know | 2% |
| Refusal | 10% |
| Including the October 2019 election, how many times have you run as a candidate at the federal level? | Total |
| n= (All candidates) | 1172 |
| 1 | 69% |
| 2 | 18% |
| 3+ | 12% |
| Don’t know | 1% |
| Incumbent | Total |
| n= (All candidates) | 1172 |
| Yes | 11% |
| No | 89% |
| Elected | Total |
| n= (All candidates) | 1172 |
| Yes | 13% |
| No | 87% |
| Candidate from a party represented in the House of Commons | Total |
| n= (All candidates) | 1172 |
| Yes | 13% |
| No | 87% |
Return to source of Footnote 1 Satisfaction based on pooling of very and somewhat satisfied is 83% due to rounding.
Return to source of Footnote 2 This is the first time this question has been asked to candidates.
Return to source of Footnote 3 This is the first time this question has been asked to candidates.
Return to source of Footnote 4 Caution should be used in interpreting this result because of the small cell size of those born outside of Canada saying this (n=13).
Return to source of Footnote 5 Dissatisfaction is 13% due to rounding.
Return to source of Footnote 6 12% dissatisfaction is due to rounding.
Return to source of Footnote 7 The 2015 results may differ from those reported in the 2015 Survey of Candidates report because they have been recalculated for comparability with 2019 data.