National Electors Study on the 43rd Canadian Federal General Election: Report on the Voter Information Campaign and Elector Awareness
Part 1: Quantitative Findings
Part 1 presents survey results from the National Electors Study, with a focus on the voter information campaign and electors' awareness of the electoral process during the 43rd GE.
1. Awareness of the Federal Election
The election period survey began on September 3, 2019; the election period for the 43rd general election began officially on September 11, 2019. Through all phases of the election period survey, electors were asked whether they were aware that a federal election was scheduled to take place on October 21, 2019.
Virtually everyone was aware of the 43rd federal election; awareness increased over the campaign
Awareness of the October 21, 2019, federal election increased over the course of the election period, from 95% of respondents early in the election period survey to effectively 100% in the final week of the election period leading up to election day. This represents no difference from the 2015 Survey of Electors, when 99% were aware of the 42nd GE.
Figure 1: Awareness of the federal election during the election period
Q. Are you aware that a federal election is scheduled to take place on October 21, 2019? Base: all respondents (n=28,880). [Wave 2]
[Text version of] "Figure 1: Awareness of the federal election during the election period"
The vertical bar chart shows respondents' awareness of the federal election, comparing responses from the early election phase through to election day. The breakdown is as follows:
Early election phase: 95.3 percent
Registration phase: 98.2 percent
VIC phase: 99.1 percent
Early voting phase: 99.3 percent
Election day phase: 99.5 percent
Across the election period survey, those interested in politics (99%) were more likely than those not interested in politics (95%) to have been aware of the upcoming federal election.
2. Media Exposure
To provide context for respondents' recall of Elections Canada's advertising and communications during the election, respondents were asked whether they had engaged with any media or in any activities where they could have encountered EC advertising in the two weeks prior to being surveyed.
Electors potentially exposed to ads via various media/platforms
Throughout the election period and post-election surveys, over two-thirds of respondents reported watching television, reading or watching news online, listening to the radio, and using social media in the last two weeks. Over half reported reading a newspaper or magazine. Smaller proportions used public transit or watched a movie at a movie theatre.
Figure 2: Media used in the last two weeks
Q. In the last two weeks, have you done any of the following? [Multiple responses accepted.] [Wave 2, Wave 3]
[Text version of] "Figure 2: Media used in the last two weeks"
The horizontal bar chart shows what media was used by respondents in the last two weeks, comparing responses between the post-election (blue bar) and the election period (grey bar). The breakdown is as follows:
Watched television
Post-election: 77 percent
Election period: 74 percent
Read or watched news online
Post-election: 73 percent
Election period: 73 percent
Listened to radio
Post-election: 71 percent
Election period: 70 percent
Used social media
Post-election: 68 percent
Election period: 67 percent
Read a newspaper or magazine
Post-election: 56 percent
Election period: 53 percent
Used public transit
Post-election: 28 percent
Election period: 26 percent
Watched a movie at a movie theatre
Post-election: 18 percent
Election period: 16 percent
None of the above
Post-election: 2 percent
Election period: 2 percent
Among respondents to the post-election survey, notable subgroup differences included the following:
Electors with a severe/very severe disability were less likely than electors with no disability to have done any of these activities.
Indigenous electors were more likely than non-Indigenous electors to have reported using social media (71% versus 67%), and less likely to have read a newspaper or magazine (52% versus 56%) or to have watched television (69% versus 78%).
New Canadians were more likely than other Canadians to have used public transit (42% versus 28%), and less likely to have read a newspaper or magazine (43% versus 56%), watched television (62% versus 78%), and listened to the radio (54% versus 72%).
18- to 24-year-olds were more likely than Canadians aged 25 and older to have used social media (88% versus 65%), read or watched news online (78% versus 73%), used public transit (59% versus 24%), and watched a movie at a movie theatre (25% versus 17%).
3. Unaided Recall of EC Advertising and Communications
This section of the report presents recall, on an unaided basis, of advertising and communications that formed Elections Canada's national voter information campaign for the 43rd GE. The objective of the campaign was to provide electors with all the information they needed on when, where, and ways to register and vote in the election.
The voter information campaign consisted of a pre-election campaign delivered exclusively through digital platforms and a multimedia election period campaign conducted in four phases with distinct focuses: registration, voter information card (VIC) awareness, early voting options, and election day. Phases in the election period survey largely corresponded with the election period phases of the voter information campaign.footnote 1
Many had read, seen, or heard EC advertising or communications during the campaign period
Beginning in the election period survey, respondents were asked if they had seen, heard, or read any advertising or communications from Elections Canada about where, when, and the ways to register and vote in the Canadian federal election.
Unaided recall increased during the election period, from 21% of respondents early in the election up to 81% of respondents by the early voting phase and through to the end of the election day phase. Post-election, when ads were no longer being shown, unaided recall receded to 66% of surveyed electors.
Post-election ad recall was lower in 2019 than in 2015 (66% compared to 79% in the 2015 ERP Evaluation), although this is at least in part likely due to a longer post-election data collection period in 2019 compared to 2015.footnote 2 That said, ad recall in 2019 saw a larger increase between the baseline and post-election surveys (+45 percentage points in 2019 versus +41 percentage points in 2015). In addition, aided ad recall in 2019 was slightly higher at its peak in the early voting phase of the election period (81%, compared to 79% in the closest comparable period of the 2015 ERP Evaluation).footnote 3
Figure 3: Unaided recall of EC advertising
Q. Have you seen, heard, or read any advertising or communications from Elections Canada about where, when, and the ways to register and vote in the Canadian federal election? [Marketing filter applied.] Base: those aware of the election, Wave 2 (n=23,880), Wave 3 (n=18,554).
[Text version of] "Figure 3: Unaided recall of EC advertising"
This vertical bar chart shows the percentage of unaided recall of EC advertising, comparing responses from the early election phase through to the post-election period. The breakdown is as follows:
Early election phase: 21 percent
Registration phase: 36 percent
VIC phase: 75 percent
Early voting phase: 81 percent
Election day phase: 81 percent
Post-election: 66 percent
In the post-election survey, the likelihood of recalling EC advertising or communications about the federal election was higher among:
those interested in politics (70% versus 53% of those not interested in politics)
those who voted in the 2019 GE (68% versus 52% of non-voters)
those who received a voter information card (VIC) (67% versus 57% of those who had not)
those with no disability (67%) or a mild to moderate disability (66%) compared to electors with a severe or very severe disability (62%)
non-Indigenous electors (67%) compared to Indigenous electors (62%)
In addition, electors who said they recalled seeing an EC ad in the post-election survey were more likely to say they voted in the 2019 GE (93% compared to 87% of those who did not recall an EC ad).
Sponsorship and branding – main reasons ads or communications were identified as being from EC
Through the election period and post-election surveys, electors increasingly mentioned that they knew the advertising or communications they saw was from Elections Canada because it said Elections Canada (from 27% early in the election period up to 47% post-election) or they recognized the logo or branding (from 17% up to 25%). Inversely, the proportions of respondents who did not identify how they recognized the ads decreased: In the early election phase, 37% said they did not know how they recognized the ads, while 19% gave comments that did not indicate how the ad connected to EC; post-election, these responses had decreased to 19% and 2% respectively.
Figure 4: Sponsor recognition
Q. How did you know that it was an ad or communication from Elections Canada? [Multiple responses accepted.] [Marketing filter applied.] Base: those who recalled advertising or communications unaided.
Wave 2 (n=12,989): aside from DK/NR, results represent a random sample (n=1,484) of responses,
Wave 3 (n=12,316): aside from DK/NR, results represent a random sample (n=1,396) of responses.
[Text version of] "Figure 4: Sponsor recognition"
This horizontal line graph shows how respondents identified an ad or communication was sponsored by Elections Canada, comparing responses from the early election phase through to the post-election period. The breakdown is as follows:
It said Elections Canada
Early election phase: 27 percent
Registration phase: 33 percent
VIC phase: 34 percent
Early voting phase: 38 percent
Election day phase: 38 percent
Post-election: 47 percent
The logo/branding
Early election phase: 17 percent
Registration phase: 15 percent
VIC phase: 17 percent
Early voting phase: 27 percent
Election day phase: 21 percent
Post-election: 25 percent
Comments about type of ad (no mention of Elections Canada)
Early election phase: 13 percent
Registration phase: 14 percent
VIC phase: 11 percent
Early voting phase: 14 percent
Election day phase: 8 percent
Post-election: 2 percent
Don't know/no response
Early election phase: 37 percent
Registration phase: 29 percent
VIC phase: 23 percent
Early voting phase: 23 percent
Election day phase: 26 percent
Post-election: 19 percent
Other reasons were mentioned less frequently to explain how respondents knew advertising or communications were from Elections Canada. Notable reasons included:
The ad topic (e.g. it was about how and when to vote and register), mentioned by 6% of post-election respondents, with a high of 12% during the VIC phase of the election period.
Electors recognized the VIC, which peaked at 8% during the VIC phase of the information campaign compared to less than 1% post-election.
The ad mentioned EC's website and/or provided EC's contact information, mentioned by 2% of respondents for most of the election period, with a high of 6% in the registration phase, before ending at 4% post-election.
Electors mainly recalled seeing EC advertising or communications on television
Among post-election respondents who recalled seeing EC advertising or communications, the top sources of recall were television (56%) and a postcard or brochure in the mail (38%). These were followed by radio (34%), newspaper (25%), Facebook (21%), and internet websites in general (20%).
In the 2015 ERP Evaluation, television and direct mail were also the main sources of unaided recall of advertising about the voting process at 50% and 30%, respectively. However, recall of ads on radio, internet websites, and social media platforms was noticeably higher in 2019 compared to 2015, when 15% recalled ads from the radio, 14% from the internet, and only 7% from social media in general.
The full range of responses throughout the 2019 election period and post-election surveys can be found in figure 5.
Figure 5: Channel of unaided ad recall
Q. Where did you see or hear this advertising or communication? [Multiple responses accepted.] [Marketing filter applied.] Base: those who recalled EC ads or communications. [Wave 2, Wave 3]
Channels
Wave 2 (n=12,989)
Wave 3 (n=12,398)
Early election phase
Registration phase
VIC phase
Early voting phase
Election day phase
Post-election
Television
46%
46%
44%
46%
46%
56%
Postcard or brochure in the mail
13%
11%
45%
47%
42%
38%
Radio
27%
22%
21%
26%
29%
34%
Newspaper
24%
16%
15%
18%
18%
25%
Facebook
23%
28%
15%
16%
21%
21%
Internet website
21%
17%
12%
14%
19%
20%
Outdoor billboards
9%
9%
8%
9%
12%
11%
Public transit (bus or subway)
7%
5%
5%
6%
8%
11%
YouTube
10%
8%
5%
6%
9%
9%
Instagram
7%
5%
3%
4%
6%
5%
Twitter
6%
5%
3%
5%
7%
6%
Movie theatre
1%
1%
2%
2%
2%
3%
Snapchat
3%
2%
1%
2%
2%
2%
Spotify
1%
1%
1%
1%
2%
1%
Other
1%
2%
2%
2%
1%
3%
Don't know/don't remember
5%
3%
3%
3%
3%
3%
The following results during particular phases of the 2019 voter information campaign were notable:
As a proportion of those who recalled seeing EC ads or communications in a particular phase, those saying they recalled seeing ads on Facebook was highest in the registration phase (28%). During this period, Elections Canada partnered with Facebook to have a registration reminder placed in Facebook feeds that referred electors to EC's online registration service.
Unaided recall of a postcard or brochure in the mail was highest in the VIC phase (45%) and the early voting phase (47%). This coincides with the period when the VIC and Guide to the federal election were delivered to households.
Among respondents to the post-election survey, notable subgroup differences included the following:
Indigenous electors were more likely to report having seen or heard EC advertising or communications on: outdoor billboards (16% versus 11% of non-Indigenous electors), online, including Facebook (32% versus 20%), websites (27% versus 20%), YouTube (14% versus 9%), Instagram (8% versus 6%), and on the radio (38% versus 34%). Indigenous electors were less likely to have seen EC advertising or communications on television (51% versus 56% of non-Indigenous electors).
New Canadians were more likely to have seen ads on public transit (21% versus 11% of other Canadians), Facebook (27% versus 20%), websites (32% versus 20%), YouTube (17% versus 9%), and Twitter (11% versus 5%).
Youth 18 to 24 were more likely to report having seen or heard EC advertising or communications online, including: Facebook (40% versus 18% of electors aged 25 and older), websites (36% versus 19%), YouTube (31% versus 7%), Instagram (25% versus 4%), Twitter (14% versus 4%), and Spotify (5% versus 1%). They were less likely to recall EC advertising from television (32% versus 58%), a postcard or brochure in the mail (34% versus 39%), radio (28% versus 35%), and newspapers (16% versus 26%).
Half of those who saw EC ads thought "get out and vote" was the main message
Electors who recalled EC advertising or communications were asked in an open-ended manner what they thought was the main point of what they saw or heard. Through the election period and post-election survey, respondents most often provided general responses for what they considered to be the overall message of the ads they saw or heard: Half (50%) of post-election respondents said the main point of the ads was to "get out and vote"; 12% thought the main message was that "it's important to vote" (12%).
Among more specific ad messages, post-election respondents most often identified "you need to be registered to vote" (11%) as the main point, followed by "the federal election is on October 21" (8%), "the VIC tells you where and when to vote" (7%), and "check or update your registration" (6%). Five percent of post-election respondents indicated that the point of the ad was to provide general information on how, when, and where to vote–although significantly higher proportions mentioned this during the latter phases of the voter information campaign: 23% in the VIC phase, 26% in the early voting phase, and 23% in the election day phase.
Figure 6: Unaided recall of main ad message
Q. Thinking about the advertising and communications that you saw or heard, what do you think is the main point they were trying to get across? [Multiple responses accepted.] [Marketing filter applied.]
Base: those who recalled EC ads or communications unaided.
* Aside from DK/NR, results represent a random sample (n=1,466) of responses,
** Aside from DK/NR, results represent a random sample (n=1,229) of responses.
Messages
Wave 2 (n=12,989)*
Wave 3 (n=12,150)**
Early election phase
Registration phase
VIC phase
Early voting phase
Election day phase
Post-election
Get out and vote
24%
27%
28%
33%
30%
50%
It's important to vote
8%
9%
6%
8%
8%
12%
You need to be registered to vote
4%
9%
7%
4%
2%
11%
Federal election is scheduled in the fall/October 21
7%
7%
7%
6%
6%
8%
VIC tells you when and where to vote
0%
1%
3%
3%
4%
7%
Check or update your registration
4%
9%
7%
2%
3%
6%
General information on how, when, where to vote
9%
11%
23%
26%
23%
5%
It is easy to vote
4%
2%
3%
2%
8%
4%
There are ways to vote early/many ways to vote
3%
3%
5%
9%
7%
3%
The Elections Canada website has official information
1%
0%
1%
0%
1%
3%
You need to prove your identity and address to vote
1%
1%
2%
3%
4%
3%
Check the mail for your VIC
1%
1%
3%
2%
1%
2%
Comments about political parties
13%
6%
7%
3%
4%
1%
Who is eligible to vote
1%
1%
1%
1%
2%
1%
It's our vote
1%
0%
0%
0%
0%
1%
It is a right to vote
1%
2%
1%
1%
2%
0%
Other
8%
6%
3%
3%
2%
1%
Don't know/no response
30%
22%
20%
19%
19%
15%
Unaided recall of messages associated with specific phases of the voter information campaign was slightly higher during those phases:
Recall of "you need to be registered to vote" and "check or update your registration" was higher during the registration phase (9% each) than during other phases of the election period survey.
Recall of "there are ways to vote early/there are many ways to vote" was highest during the early voting phase (9%).
4. Aided Recall of Key EC Communications
This section of the report presents aided recall of key Elections Canada communications including the voter information campaign slogan and direct mail products sent to every registered elector and household in Canada: the voter information card (VIC) and the Guide to the federal election.
Aided recall of "It's Our Vote" slogan increased significantly during the campaign
Electors were asked directly if they had heard or seen the slogan "It's Our Vote" during the election period and post-election surveys. Recall of the slogan doubled from 12% of electors during the early election phase to 24% of electors in the week leading to election day. Post-election, recall of the slogan jumped to 42%.footnote 4
Figure 7: Aided recall of slogan
Q. Do you recall hearing or seeing the slogan "It's Our Vote"? [Marketing filter applied.] Base: those aware of the election, Wave 2 (n=22,345), Wave 3 (n=18,554).
[Text version of] "Figure 7: Aided recall of slogan"
This vertical bar chart shows the percentage of respondents' aided recall of "It's Our Vote" slogan, comparing responses from the early election phase through to the post-election period. The breakdown is as follows:
Early election phase: 12 percent
Registration phase: 14 percent
VIC phase: 18 percent
Early voting phase: 21 percent
Election day phase: 24 percent
Post-election: 42 percent
In the post-election survey, the likelihood of recalling the "It's Our Vote" slogan was higher among the following groups:
Indigenous electors (47% versus 42% of non-Indigenous electors)
new Canadians (50% versus 42% of other Canadians)
electors aged 18 to 24 years (64% versus 40% of those aged 25 and older)
youth attending school (61% versus 51% of those working full time and 49% of NEET youth
The vast majority recalled receiving a VIC and half recalled receiving the Guide to the federal election
A VIC was mailed to each registered elector beginning in the last week of September. A week after sending the VICs, Elections Canada also mailed a brochure titled Guide to the federal election to every household in Canada.
Post-election, approximately nine in 10 (93%) of those aware of the federal election said they received a VIC in the mail addressed to them personally telling them where and when to vote, compared to 80% who reported receiving a VIC during the VIC phase of the election period and the initial deliveries of the VIC.footnote 5 The same pattern is reflected in electors' recall of the brochure: 48% recalled receiving the brochure by the post-election survey, up from 23% who recalled the brochure during the VIC phase of the election period survey.
Figure 8: Recall of VIC and brochure
Q. During the campaign, did you receive a voter information card addressed to you personally and telling you where and when to vote?
Q. During the campaign, did you receive a brochure in the mail describing how to register and vote in the upcoming federal election? The brochure was titled "Guide to the Federal Election." Base: those aware of the election. [Wave 2, Wave 3]
[Text version of] "Figure 8: Recall of VIC and brochure"
This horizontal line graph shows respondents' recall of receiving a VIC and the "Guide to the Federal Election," comparing responses from the VIC phase through to the post-election period. The breakdown is as follows:
VIC phase
VIC: 80 percent
Brochure: 23 percent
Early voting phase
VIC: 90 percent
Brochure: 47 percent
Election day phase
VIC: 92 percent
Brochure: 43 percent
Post-election
VIC: 93 percent
Brochure: 48 percent
New Canadians (57%) were significantly more likely than other Canadians (48%) to say they remembered receiving the brochure. Electors between the ages of 18 and 24 years (38%) were less likely to recall the brochure compared to electors aged 25 and older (49%).
5. Aided Recall of Specific EC Advertising
This section of the report presents aided recall of specific Elections Canada advertising pieces selected as representative of the range of ad designs, formats, and messages used in each phase of the voter information campaign.
At each phase of the election period survey, online respondents were presented with an image, video, or audio clip for as many as three ads selected from the current phase of the voter information campaign. Respondents were then asked whether they had seen or heard these specific ads during the election. Ads in one format could be placed on different platforms at different times of the campaign. In particular, video ads presented in the early election phase of the survey were online-only ads from the pre-election advertising phase of the voter information campaign. In all other phases, videos represented ads that aired on television.footnote 6
Aided recall was highest for specific radio ads, followed by video ads
Aided recall of ads in all formats generally increased with each phase of the voter information campaign. Aided recall of radio ads was higher than other formats: Between one-quarter and one-half of surveyed electors recalled a radio ad about registration (25%), the VIC (42%), early voting options (41%), and election day (49%). This pattern is similar to the 2015 ERP Evaluation, when aided recall in all survey phases was higher for radio ads than for other formats, and was highest in the election day phase (38%)
.
Figure 9: Aided recall of specific ads by format and phase
Q. Have you seen or heard this ad in the past few weeks? [Marketing filter applied.] [Wave 2]
[Text version of] "Figure 9: Aided recall of specific ads by format and phase"
This vertical bar chart shows the percentage of respondents' aided recall of specific ads by format of ad, comparing responses from the early election phase through to election day. The breakdown is as follows:
Early voting phase
Social media: 6 percent
Video: 7 percent
Outdoor (billboard, transit): No data to report
Web banner: 9 percent
Radio: No data to report
Traditional print: No data to report
Registration phase
Social media: 10 percent
Video: 22 percent
Outdoor (billboard, transit): 17 percent
Web banner: 14 percent
Radio: 25 percent
Traditional print: 8 percent
VIC phase
Social media: 15 percent
Video: 32 percent
Outdoor (billboard, transit): 17 percent
Web banner: 13 percent
Radio: 42 percent
Traditional print: 11 percent
Early voting phase
Social media: 19 percent
Video: 37 percent
Outdoor (billboard, transit): 19 percent
Web banner: 19 percent
Radio: 41 percent
Traditional print: 16 percent
Election day phase
Social media: 22 percent
Video: 36 percent
Outdoor (billboard, transit): 27 percent
Web banner: 18 percent
Radio: 49 percent
Traditional print: 24 percent
Video ads had the second highest levels of aided recall overall, with 7% of electors recalling a video ad early in the election, 22% a registration ad, 32% a VIC ad, 37% an early voting options ad, and 36% an election day ad.
Across the election period survey, noteworthy subgroup variations included:
Aided recall of radio ads was higher among Indigenous electors (42% versus 37% of non-Indigenous electors) and electors aged 55 and older (39% versus 35% of those aged 18 to 54); and lower among 18- to 24-year-olds (33% versus 38% of those aged 25 and older).
Aided recall of video ads was higher among electors aged 55 and older (30% versus 22% of those aged 18 to 54 years).
Aided recall of outdoor billboard and public transit ads was higher among:
Indigenous electors (26% versus 19% of non-Indigenous electors)
new Canadians (22% versus 19% of other Canadians)
18- to 24-year-olds (27% versus 19% of Canadians aged 25 and older)
youth attending school (27% versus 19% of youth working full-time and 11% of Neet youth)
Aided recall of social media ads was higher among:
Indigenous electors (19% versus 14% of non-Indigenous electors)
18- to 24-year-olds (20% versus 13% of Canadians aged 25 and older)
youth attending school (21% versus 14% of youth working full-time and 9% of Neet youth)
Aided recall of traditional print ads was higher among electors aged 55 and older (17% versus 11% of electors aged 18 to 54 years).
6. Evaluation of Specific Ads
This section of the report presents respondents' evaluation of Elections Canada's advertising based on the ads presented to respondents during the survey.footnote 7
"Get out and vote" perceived to be the main point of EC advertising or communications
All respondents were asked to select from a list what they thought was the main point electors were intended to get from the ads they were shown. The list included a mix of specific messages taken from the ads, alongside more general messages that represent commonly volunteered responses from previous surveys of electors.
Similar to unaided recall, general messages were mentioned most often across most phases of the voter information campaign, namely "get out and vote" (with results ranging from 41% to 54%), and "it's important to vote" (41% to 53%). Compared to unaided recall, respondents more often identified specific ad messages when aided by the presentation of specific ads. In particular, messages found in ads across all phases were identified more often all throughout the election period survey, including: "the federal election is on October 21" (ranging from 31% to 54%), the campaign slogan "It's our vote" (25% to 33%), and "the Elections Canada website has official information" (24% to 29%).
Figure 10: Perception of main ad message
Q. What do you think is the main point these ads are trying to get across? Base: n=12,989; those aware of the election. [Wave 2]
Messages
Early election phase
Registration phase
VIC phase
Early voting phase
Election day phase
Get out and vote
50%
41%
48%
54%
54%
It's important to vote
48%
41%
49%
53%
49%
Federal election is scheduled in the fall/on October 21
31%
37%
53%
54%
49%
It is easy to vote
35%
30%
37%
47%
41%
VIC tells you when and where to vote
21%
17%
46%
35%
28%
There are ways to vote early
16%
15%
29%
50%
27%
It's our vote
29%
25%
32%
33%
26%
The Elections Canada website has official information
24%
28%
29%
28%
26%
You need to be registered to vote
30%
40%
39%
28%
23%
You need to prove your identity and address to vote
13%
16%
25%
23%
20%
Check or update your registration
26%
39%
36%
24%
19%
Check the mail for your voter information card
23%
16%
43%
27%
19%
Who is eligible to vote
14%
17%
20%
19%
19%
Other
<1%
<1%
<1%
<1%
1%
Don't know/don't remember
11%
6%
6%
5%
5%
Messages associated with specific phases of the voter information campaign were identified more often as the main point of ads presented during those phases:
Mentions of registration messages were highest at the registration phase: "you need to be registered to vote" (40%) and "check or update your registration" (39%).
Mentions of messages about the VIC peaked during the VIC phase: "VIC tells you when and where to vote" (46%) and "check the mail for your VIC" (43%).
Mentions of messages about the early voting options peaked during the early voting phase: "there are ways to vote early" (50%).
Ads received generally positive reviews
Election period respondents were asked to evaluate the ads they were presented in the survey against four measures. The vast majority of respondents somewhat or strongly agreed that the presented ads were clear (87%) and provided useful information (86%). Fewer than one in 10 (7%) disagreed that the ads were clear and provided useful information.
Smaller majorities agreed that the ads were relevant (71%) and attention-catching (67%). For both measures, respondents were more likely to agree somewhat rather than strongly, while one in four disagreed that the ads were relevant (23%) or attention-catching (25%).
Figure 11: Ad evaluation overall
Q. To what extent do you agree or disagree with the following statements about these ads? Base: n=22,273; all respondents. [Marketing filter applied.] DK/NR: 6 percent-9 percent. [Wave 2]
[Text version of] "Figure 11: Ad evaluation overall"
This horizontal bar chart shows respondents' agreement with various statements regarding Elections Canada's ads. The breakdown is as follows:
Ads are clear
Strongly agree: 43 percent
Somewhat agree: 44 percent
Somewhat disagree: 5 percent
Strongly disagree: 2 percent
Ads provide useful information
Strongly agree: 43 percent
Somewhat agree: 43 percent
Somewhat disagree: 5 percent
Strongly disagree: 2 percent
Ads are relevant
Strongly agree: 25 percent
Somewhat agree: 46 percent
Somewhat disagree: 16 percent
Strongly disagree: 7 percent
Ads catch attention
Strongly agree: 14 percent
Somewhat agree: 53 percent
Somewhat disagree: 18 percent
Strongly disagree: 7 percent
Values of 2 percent or less are not labelled on the chart.
The following subgroup differences are noteworthy:
Indigenous electors were less likely than non-Indigenous electors to agree that the ads are clear (82% versus 87%), provide useful information (81% versus 86%), are relevant personally (69% versus 72%), and are attention-catching (62% versus 67%).
New Canadians were more likely than other Canadians to agree that the ads are attention-catching (71% versus 67%) and personally relevant (76% versus 71%).
Canadians 18 to 24 years of age were more likely than Canadians aged 25 and older to agree that the ads are clear (90% versus 86%), provide useful information (89% versus 86%), and are relevant to them personally (82% versus 71%).
18- to 34-year-olds attending school were more likely than youth working full-time to agree that the ads provide useful information (89% versus 86%), are personally relevant (81% versus 76%), and are attention-catching (69% versus 63%).
7. Satisfaction with Electoral Information
This section reports how satisfied respondents were with the electoral information provided by Elections Canada for the 43rd GE and how informed they felt they were about where, when, and the ways to vote over the course of the voter information campaign.
Electors' satisfaction with EC information on voting increased over the campaign
Satisfaction with the information electors received from Elections Canada on the voting process increased over the course of the voter information campaign, from 68% who were satisfied (25% very satisfied) during the early election phase of the election period survey up to 95% who were satisfied (70% very satisfied) with the information they received on the voting process by the post-election survey. This outcome is consistent with the results of the 2015 ERP Evaluation (95% were satisfied in the post-election survey).footnote 8
Figure 12: Satisfaction with information on the voting process
Q. Overall, how satisfied are you with the information you have received from Elections Canada on the voting process [Wave 2: meaning where, when, and the ways to vote in the federal election]? Base: Wave 2 (n=22,633), Wave 3 (n=19,411).
[Text version of] "Figure 12: Satisfaction with information on the voting process"
This vertical bar chart shows respondents' satisfaction with the information they received on the voting process, comparing responses from the early election phase through to the post-election period. The breakdown is as follows:
Early election phase
Very satisfied: 25 percent
Somewhat satisfied: 43 percent
Somewhat dissatisfied: 13 percent
Very dissatisfied: 5 percent
Registration phase
Very satisfied: 28 percent
Somewhat satisfied: 43 percent
Somewhat dissatisfied: 14 percent
Very dissatisfied: 4 percent
VIC phase
Very satisfied: 53 percent
Somewhat satisfied: 35 percent
Somewhat dissatisfied: 5 percent
Very dissatisfied: 2 percent
Early voting phase
Very satisfied: 61 percent
Somewhat satisfied: 32 percent
Somewhat dissatisfied: 3 percent
Very dissatisfied: 1 percent
Election day phase
Very satisfied: 64 percent
Somewhat satisfied: 30 percent
Somewhat dissatisfied: 3 percent
Very dissatisfied: 1 percent
Post-election
Very satisfied: 70 percent
Somewhat satisfied: 25 percent
Somewhat dissatisfied: 2 percent
Very dissatisfied: 1 percent
In the post-election survey, the likelihood of being very satisfied with the information received about the voting process was lower among the following:
electors with a severe/very severe (60%) or mild/moderate disability (67%) compared to those with no disability (73%)
Indigenous electors (59%) compared to non-Indigenous electors (70%)
Canadians aged 18 to 24 (59%) compared to those 25 and older (71%)
Neet youth (56%) and youth attending school (60%) compared to youth working full-time (63%)
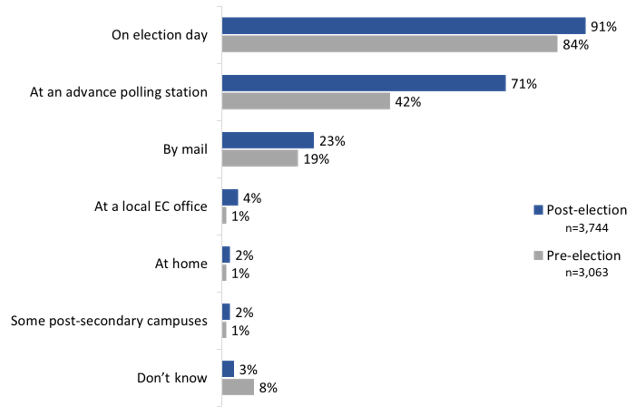
electors who voted at a poll on campus (52%) and by mail (59%) compared to those who voted on election day (72%), a local EC office (76%), or an advance poll (76%)
The likelihood of being very satisfied with the information received was higher among:
electors aged 55 or older (79% versus 64% of those aged 18 to 54)
those who recalled, unaided, seeing an EC ad (77% versus 58% of those who did not)
those who received a VIC (73% versus 35% of those who did not)
those who said they voted in the 2019 GE (73% versus 35% of non-voters)
Most felt at least somewhat informed in terms of where to vote
Over the course of the voter information campaign, electors increasingly reported that they felt informed about where to vote in the election. Early in the election period, most (81%) electors said they felt at least somewhat informed, including 41% who felt very informed. By the post-election survey, 96% of electors reported feeling informed, including 78% who said very informed. The 96% who felt informed about where to vote represents a slight increase from the 94% who felt informed in the post-election survey of the 2015 ERP Evaluation.footnote 8
Figure 13: How informed electors felt about where to vote
Q. Overall, how well informed do you feel about voting in the federal election in terms of where to vote? [DK/NR: 1 percent.] Base: Wave 2 (n=23,880), Wave 3 (n=21,435).
[Text version of] "Figure 13: How informed electors felt about where to vote"
This vertical bar chart shows how informed electors felt about where to vote, comparing responses from the early election phase through to post-election. The breakdown is as follows:
Early election phase
Very informed: 41 percent
Somewhat informed: 39 percent
Not very informed: 12 percent
Not at all informed: 6 percent
Registration phase
Very informed: 43 percent
Somewhat informed: 40 percent
Not very informed: 12 percent
Not at all informed: 4 percent
VIC phase
Very informed: 58 percent
Somewhat informed: 33 percent
Not very informed: 7 percent
Not at all informed: 2 percent
Early voting phase
Very informed: 65 percent
Somewhat informed: 28 percent
Not very informed: 5 percent
Not at all informed: 1 percent
Election day phase
Very informed: 73 percent
Somewhat informed: 23 percent
Not very informed: 4 percent
Not at all informed: 1 percent
Post-election
Very informed: 78 percent
Somewhat informed: 17 percent
Not very informed: 3 percent
Not at all informed: 1 percent
Post-election, the likelihood of respondents saying they felt very informed about where to vote was lower among the following:
electors with a severe/very severe (68%) or mild/moderate (76%) disability compared to electors with no disability (80%)
Indigenous electors (71%) compared to non-Indigenous electors (79%)
new Canadians (69%) compared to other Canadians (79%)
electors aged 18 to 24 (70%) compared to those aged 25 and older (79%)
18- to 34-year-olds attending school (71%) or working full-time (73%) compared to NEET youth (63%)
The likelihood of feeling very informed about where to vote was higher among:
electors aged 55 or older (86% versus 73% of those aged 18 to 54)
those who voted in the 2015 GE (82% versus 58% of those who were eligible but did not vote)
those who recalled seeing an EC ad in the 2019 GE (83% versus 69% of those who did not)
those who received a VIC (81% versus 42% of those who did not)
those who voted in the 2019 GE (82% versus 46% of non-voters)
those who voted at an advance poll (85%) compared to those who voted at a local EC office (82%), on election day (81%), or at a poll on campus (68%)
Strong majorities felt informed about when to vote
Throughout the election, strong majorities of electors felt at least somewhat informed about when to vote in the federal election, including half or more who felt very informed. The proportion of electors who felt informed steadily increased from a baseline of 88% early in the election period, including 58% who felt very informed, up to 98% who felt informed in the post-election survey, including 86% who felt very informed. The end result is similar to the 97% who felt informed in the post-election wave of the 2015 ERP Evaluation.footnote 8
Figure 14: How informed electors felt about when to vote
Q. Overall, how well informed do you feel about voting in the federal election in terms of when to vote? [DK/NR: 1 percent or less.]
Base: Wave 2 (n=23,880), Wave 3 (n=21,435).
[Text version of] "Figure 14: How informed electors felt about when to vote"
This vertical bar chart shows how informed electors felt about when to vote, comparing responses from the early election phase through to the post-election period. The breakdown is as follows:
Early election phase
Very informed: 58 percent
Somewhat informed: 30 percent
Not very informed: 8 percent
Not at all informed: 3 percent
Registration phase
Very informed: 64 percent
Somewhat informed: 27 percent
Not very informed: 7 percent
Not at all informed: 2 percent
VIC phase
Very informed: 80 percent
Somewhat informed: 16 percent
Not very informed: 2 percent
Not at all informed: 1 percent
Early voting phase
Very informed: 85 percent
Somewhat informed: 13 percent
Not very informed: 2 percent
Not at all informed: 1 percent
Election day phase
Very informed: 88 percent
Somewhat informed: 10 percent
Not very informed: 2 percent
Not at all informed: <0.5 percent
Post-election
Very informed: 86 percent
Somewhat informed: 11 percent
Not very informed: 1 percent
Not at all informed: 1 percent
In the post-election survey, the likelihood of saying they felt very informed about when to vote was lower among the following:
electors with a severe/very severe disability (77%) compared to those with a mild/moderate disability (85%) or no disability (88%)
Indigenous electors (81%) compared to non-Indigenous electors (87%)
new Canadians (77%) compared to other Canadians (87%)
electors aged 18 to 24 (82%) compared to those aged 25 and older (87%)
The likelihood of feeling very informed about when to vote was higher among:
electors aged 55 or older (92% versus 83% of those aged 18 to 54)
those who voted in the 2015 GE (89% versus 70% of those who were eligible but did not vote)
those who recalled seeing an EC ad in the 2019 GE (91% versus 79% of those who did not)
those who received a VIC (89% versus 64% of those who did not)
those who voted in the 2019 GE (89% versus 59% of non-voters)
those who voted at an advance poll (91%), election day poll (89%), or a local EC office (88%) compared to those who voted at a poll on campus (77%)
Most electors also felt informed about the ways to vote
Most surveyed electors also felt somewhat or very informed about the ways to vote in the federal election. During the election period, the proportion of electors who felt very informed increased significantly between the registration (57%) and voter information card (71%) phases, followed by a smaller increase at the early voting (75%) and election day (76%) phases. This receded in the post-election survey to two-thirds (65%) of electors feeling very informed, while more than a quarter (28%) reported feeling somewhat informed about the ways to vote in the federal election. Overall, 93% of post-election respondents said they felt informed about the ways to vote in the end, the same as in 2015 (93% according to the post-election survey of the ERP Evaluation).footnote 8
Figure 15: How informed electors felt about the ways to vote
Q. Overall, how well informed do you feel about voting in the federal election in terms of the ways to vote? [DK/NR: 1 percent or less.] Wave 2 (n=23,880), Wave 3 (n=21,435).
[Text version of] "Figure 15: How informed electors felt about the ways to vote"
This vertical bar chart shows how informed electors felt about the ways to vote, comparing their responses from the early election phase through to the post-election period. The breakdown is as follows:
Early election phase
Very informed: 56 percent
Somewhat informed: 33 percent
Not very informed: 8 percent
Not at all informed: 2 percent
Registration phase
Very informed: 57 percent
Somewhat informed: 32 percent
Not very informed: 8 percent
Not at all informed: 2 percent
VIC phase
Very informed: 71 percent
Somewhat informed: 23 percent
Not very informed: 4 percent
Not at all informed: 1 percent
Early voting phase
Very informed: 75 percent
Somewhat informed: 21 percent
Not very informed: 3 percent
Not at all informed: 1 percent
Election day phase
Very informed: 76 percent
Somewhat informed: 19 percent
Not very informed: 4 percent
Not at all informed: <0.5 percent
Post-election
Very informed: 65 percent
Somewhat informed: 28 percent
Not very informed: 5 percent
Not at all informed: 1 percent
Post-election, the likelihood of respondents saying they felt very informed about the ways to vote was lower among the following:
electors with a severe/very severe (56%) or mild/moderate (62%) disability compared to electors with no disability (66%)
Indigenous electors (57%) compared to non-Indigenous electors (65%)
electors aged 18 to 24 (51%) compared to those 25 and older (66%)
The likelihood of feeling very informed about the ways to vote was higher among:
youth working full-time (58%) compared to youth attending school (52%) and NEET youth (49%)
electors aged 55 or older (73% versus 59% of those aged 18 to 54)
those who voted in the 2015 GE (68% versus 47% of those who were eligible but did not vote)
those who recalled seeing an EC ad in the 2019 GE (70% versus 54% of those who did not)
those who received a VIC (67% versus 39% of those who did not)
those who voted in the 2019 GE (67% versus 39% of non-voters)
those who voted at an advance poll (71%) or a local EC office (73%) compared to those who voted on election day (65%), by mail (58%) or at a poll on campus (54%)
Nine in 10 found it easy to find the information they needed on the voting process
In the post-election survey, nine in 10 (92%) electors said it was easy to find the information they needed on the voting process, including over two-thirds (69%) who said it was very easy. For the remainder, electors more often said they did not look for information (5%) rather than saying information was difficult to find (3%).
Figure 16: Ease of finding information on the voting process
Q. For this election, how easy or difficult was it to find the information you needed on the voting process, meaning where, when and the ways to vote? [DK/NR: 1 percent.] Base: all respondents (n=19,364). [Wave 3]
[Text version of] "Figure 16: Ease of finding information on the voting process"
This vertical bar chart shows respondents' perception of the ease of finding information on the voting process. The breakdown is as follows:
Very easy: 69 percent
Somewhat easy: 23 percent
Somewhat difficult: 2 percent
Very difficult: 1 percent
Did not look for information: 5 percent
The following groups were less likely to say it was very easy to find the information they needed on voting:
electors with a severe/very severe (58%) or mild/moderate (64%) disability compared to electors with no disability (72%)
Indigenous electors (61% compared to 69% of non-Indigenous electors)
new Canadians (61% compared to 69% of other Canadians)
electors aged 18 to 24 (58% compared to 70% of electors aged 25 and older)
The following groups were more likely to say it was very easy to find information on voting:
youth working full-time (65%) compared to youth attending school (58%) and NEET youth (57%)
electors who recalled EC advertising (75% compared to 58% of those who did not)
electors who received a VIC (71% compared to 37% of those who did not)
8. Knowledge of and Interest in Employment Opportunities
One of the messages in the earliest phases of the voter information campaign was that paid positions were available for working at the polls.
This section reports findings related to electors' awareness of and interest in employment opportunities in the pre-election survey (June) and during the early election phase of the election period survey (the first half of September).
More are aware people from the general public can work at polls than know these are paid positions
More than eight in 10 electors surveyed responded, correctly, that people from the general public can be hired to work at the polls during a federal election. Only six in 10, however, were aware that people who work at the polls during a federal election are paid. In both cases, there was little change (+2 percentage points) between electors' baseline knowledge in the pre-election survey and the early election phase of the election period survey, conducted following initial Elections Canada advertising about employment opportunities.
Figure 17: Knowledge of employment opportunities
Q. Is this true or false? In a federal election, people from the general public can be hired to work at the polls. [SPLIT SAMPLE]
Q. Is this true or false? In a federal election, the people who work at the polls are paid. [SPLIT SAMPLE] Base: Pre-election (n=24,985), Early election phase (n=1,540). [Wave 1, Wave 2]
[Text version of] "Figure 17: Knowledge of employment opportunities"
This vertical bar chart shows respondents' knowledge of employment opportunities, comparing their knowledge before the election (grey bar) and in the early election phase (blue bar). The breakdown is as follows:
Percent aware people from the general public can be hired to work at the polls
Pre-election: 82 percent
Early election phase: 84 percent
Percent aware people who work at the polls are paid
Pre-election: 60 percent
Early election phase: 62 percent
The following early election respondents were more likely to be aware that people from the general public can be hired to work at the polls:
those who voted in the 2015 GE (87% versus 65% of those who did not but were eligible)
those who completed university (87% versus 77% of those who completed high school or less)
Canadians aged 55 to 74 (92%) compared to 81% of 35- to 54-year-olds, 79% of 25- to 34-year-olds, and 73% of 18- to 24-year-olds
In addition, the following early election respondents were more likely to be aware that people who work at the polls are paid:
those who voted in the 2015 GE (66% versus 45% of those who did not but were eligible)
those who completed university (69% versus 59% of those who completed post-secondary or college and 55% of those who completed high school or less)
Canadians aged 55 to 74 (76%) compared to 63% of 35- to 54-year-olds, 51% of 25- to 34-year-olds, and 38% of 18- to 24-year-olds
Approximately half would be interested in working at the polls during a federal election
A split sample was used to compare electors' interest in working at the polls during a federal election when framed as an opportunity for paid work versus an appeal to civic duty.footnote 9 Similar proportions expressed at least some interest in this employment opportunity following either appeal (52% and 50% in the pre-election survey); those saying they would be very interested was slightly higher using the appeal to paid work (26%) compared to the appeal to civic duty (22%). Regardless of the appeal used, interest in working at the polls waned slightly (−1 or −2 percentage points) in the early election phase, closer to the reality of election day.
Figure 18: Interest in employment opportunities
Q. How interested would you be in working at the polls in an election? Base: all respondents. [SPLIT SAMPLES] LEFT: Pre-election (n=12,648), early election phase (n=759). RIGHT: Pre-election (n=12,360), early election phase (n=813). [Wave 1, Wave 2]
[Text version of] "Figure 18: Interest in employment opportunities"
These horizontal bar charts show respondents' interest in working at the polls in an election, comparing interest between the pre-election (grey bar) and the early election phase (blue bar), as well as comparing responses using a split sample. On the left side shown is the responses from electors who heard the following preamble: "Elections Canada hires and pays local people to work at the polls in their area." On the right side depicts the responses for electors who heard the following preamble: "Elections Canada needs local people to work in their area; without them it would be impossible to hold an election." The breakdown is as follows:
Left side
Very interested
Pre-election: 26 percent
Early election phase: 25 percent
Somewhat interested
Pre-election: 27 percent
Early election phase: 26 percent
Not very interested
Pre-election: 21 percent
Early election phase: 20 percent
Not at all interested
Pre-election: 24 percent
Early election phase: 27 percent
Right side
Very interested
Pre-election: 22 percent
Early election phase: 23 percent
Somewhat interested
Pre-election: 28 percent
Early election phase: 25 percent
Not very interested
Pre-election: 21 percent
Early election phase: 24 percent
Not at all interested
Pre-election: 26 percent
Early election phase: 25 percent
Among early election respondents presented with the appeal to paid work, youth attending school (70%) compared to youth working full-time (46%) were more likely to express interest in the opportunity to work at the polls.
Among early election respondents presented with the appeal to civic duty, the following were more likely to be interested:
those with a severe/very severe disability (64%) compared to electors with no disability (46%)
those who voted in the 2015 GE (48%) compared to non-voters (33%)
9. Knowledge of Voter Registration
This section reports findings related to electors' knowledge of voter registration requirements and their awareness of the different ways they can register, update, or check their registration information.
Majority of electors knew they needed to be registered on the list of electors to vote in an election
Throughout the study, at least seven in 10 electors claimed to know that they need to be registered on the list of electors to vote in a Canadian federal election. Knowledge fluctuated only slightly over the course of the election campaign, from 74% of electors in the pre-election survey to 72% during the early election phase, 70% during the registration phase in the election period, and 73% post-election. This outcome represents a slight decrease compared to the 76% who knew of the need to be registered to vote in the post-election wave of the 2015 ERP Evaluation; however, knowledge levels remained more consistent across the 2019 GE (a 1 percentage point decrease from baseline to post-election) compared to 2015 (a 4 percentage point decrease from its 80% baseline).
Figure 19: Knowledge of need to be registered to vote
Q. To the best of your knowledge, do you need to be registered on the list of electors to vote in a Canadian federal election? Base: all respondents, Wave 1 (n=49,993), Wave 2 (n=10,351), Wave 3 (n=21,435).
[Text version of] "Figure 19: Knowledge of need to be registered to vote"
This vertical bar chart shows respondents' knowledge of the need to register to vote, comparing views from the pre-election period through to the post-election period. The breakdown is as follows:
Pre-election
Yes: 74 percent
No: 21 percent
Don't know: 5 percent
Early election phase
Yes: 72 percent
No: 22 percent
Don't know: 6 percent
Registration phase
Yes: 70 percent
No: 24 percent
Don't know: 6 percent
Post-election
Yes: 73 percent
No: 24 percent
Don't Know: 3 percent
Post-election, the following were more likely to know they need to be registered:
new Canadians (81%) compared to other Canadians (73%)
those who received a VIC (74% versus 65% of those who did not)
electors from Quebec (92%) compared to all other regions of Canada (ranging from 65% to 69%). A possible explanation for this is that provincial elections in Quebec do not allow electors to register at the polls before voting on election day, while elections in all other jurisdictions allow for this in some form
The following were less likely to know they need to be registered:
those who voted in the 2015 GE (73% versus 77% of those who were eligible but did not vote)
those who voted in the 2019 GE (73% versus 78% of non-voters)
those who voted at a local EC office (62%) compared to those who voted at a poll on campus (72%), at an advance poll (73%), on election day (74%), or by mail (80%)
Most electors also knew they needed to update their voter registration information
Higher proportions of electors knew of the need to update their voter registration if their information changes. This remained effectively stable throughout the research period, from a baseline of 87% in the pre-election survey to 82% and 84% during the early election and registration phases of the election period, and back up to 87% following the October 21, 2019, election.
Figure 20: Knowledge of need to update registration
Q. To the best of your knowledge, do you need to update your voter registration if your information changes – for example if you moved or changed your name? Base: all respondents Wave 1 (n=49,993), Wave 2 (n=10,351), Wave 3 (n=21,435).
[Text version of] "Figure 20: Knowledge of need to update registration"
This vertical bar chart shows respondents' knowledge of the need to update voter information, comparing views from the pre-election period through to the post-election period. The breakdown is as follows:
Pre-election
Yes: 87 percent
No: 9 percent
Don't know: 5 percent
Early election phase
Yes: 82 percent
No: 13 percent
Don't know: 5 percent
Registration phase
Yes: 84 percent
No: 12 percent
Don't know: 4 percent
Post-election
Yes: 87 percent
No: 11 percent
Don't know: 2 percent
Post-election, the following were more likely to know that electors need to update their voter registration when information changes:
electors with a mild/moderate (87%) or no (87%) disability compared to those with a severe/very severe disability (84%)
electors aged 25 and older (87%) compared to Canadians 18 to 24 years of age (91%)
those who voted in the 2015 GE (87% versus 84% of non-voters)
those who recalled seeing an EC ad in the 2019 GE (89% versus 86% of those who did not)
those who received a VIC (87% versus 85% of those who did not)
those who voted in the 2019 GE (88% versus 82% of non-voters)
Electors pointed to a variety of methods when asked how someone could register or update their voter registration information
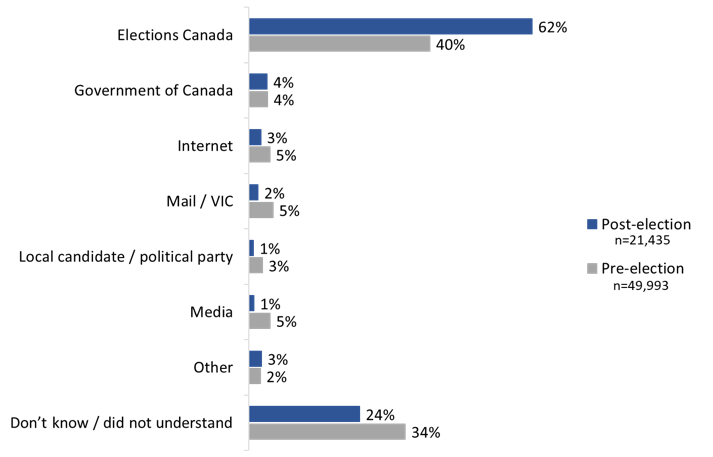
Post-election, the top methods mentioned by electors when asked how someone could register or update their voter registration information were by contacting Elections Canada through its website (22%), at the polling station before voting (14%), and online in general (12%). The full range of responses is detailed in figure 21.
Overall, there was an increase from the election period survey to the post-election survey of electors identifying Elections Canada channels specifically: that is, those saying through the EC website (from 13% to 22%), at the polls before voting (9% to 14%), at a local EC office (6% to 8%), and by phoning EC (5% to 11%).
The proportion of electors who did not know how someone can register or update their voter information declined over the course of the election period, from 38% during the early election phase to 34% during the registration phase and 21% post-election. This represents an improvement from the post-election wave of the 2015 ERP Evaluation, when 32% said they did not know any of the ways to register or update their voter information.footnote 10
Figure 21: Unaided knowledge of ways to register/update information
Q. If someone needed to register to vote or update their voter registration information, how can they do so? [Multiple responses accepted.]
Base: those who knew they needed to be registered to vote and/or keep their voter registration information up-to-date. [Wave 2, Wave 3]
* Aside from DK/NR, results represent a random sample (n=1,189) of responses.
**Aside from DK/NR, results represent a random sample (n=1,617) of responses.
Ways to register/update information
Wave 2 (n=4,588)*
Wave 3 (n=8,742)**
Early election Phase
Registration Phase
Post-election
Contact Elections Canada through its website
13%
13%
22%
At the poll before voting
9%
10%
14%
Online/website (non-specific)
17%
22%
12%
Contact Elections Canada by phone
5%
5%
11%
Contact Elections Canada (general)
15%
14%
10%
At a local Elections Canada office
6%
6%
8%
On income tax form/checking box to register on tax forms
2%
1%
5%
Provide/bring valid government-issued ID
1%
<1%
4%
Government department/agency (non-specific)
1%
2%
3%
Use Elections Canada's online voter registration system
1%
1%
3%
Phone (non-specific)
4%
5%
2%
In-person (non-specific)
2%
2%
1%
Mail (non-specific)
1%
1%
1%
Contact Elections Canada by mail
<1%
<1%
1%
Look for information on VIC
<1%
<1%
1%
By voting in a federal election
--
--
1%
Other
3%
2%
11%
Don't know/no response
38%
34%
21%
In the post-election survey, the following groups were more likely to say they did not know any of the ways to register or update their voter registration information:
electors with a severe/very severe disability (28% did not know a way to register, compared to 23% of electors with a mild/moderate disability and 20% of those with no disability)
Indigenous electors (26% compared to 21% of non-Indigenous electors)
electors with a high school education or less (29% compared to 23% of electors with some post-secondary or college and 17% of those with a university degree or higher)
The following were less likely to say they did not know any of the ways to register:
those who voted in the 2015 GE (19% versus 39% of those who were eligible but did not vote)
those who recalled seeing an EC during the 2019 GE (16% versus 31% of those who did not)
those who recalled receiving a VIC (21% versus 27% of those who did not)
those who voted in the 2019 GE (19% versus 39% of non-voters)
A majority were aware (when aided) that electors can use an online voter registration service to check/update/complete their voter registration
When asked directly, over two-thirds (68%) of post-election survey respondents had knowledge of Elections Canada's online voter registration service.footnote 11 This is a significant increase from the 2015 post-election Survey of Electors, when 51% had knowledge of the online voter registration service.footnote 12 Knowledge of online registration also increased significantly over the course of the election, measuring 60% in the registration phase versus 55% in the early election phase of the election period.
Figure 22: Aided knowledge of online registration
Q. To the best of your knowledge, [can electors use an online voter registration service on Elections Canada's website to check, update, or complete their voter registration during the election?/is it possible for Canadian electors to check, update, or complete their voter registration on Elections Canada's website?] Base: those who knew they needed to be registered to vote and/or keep their voter registration information up-to-date; Wave 2 (n=4,583), Wave 3 (n=10,951).
[Text version of] "Figure 22: Aided knowledge of online registration"
This vertical bar chart shows respondents' aided knowledge of online voter registration, comparing knowledge from the early election phase through to the post-election period. The breakdown is as follows:
Early election
Yes: 55 percent
No: 4 percent
Don't know: 41 percent
Registration phase
Yes: 60 percent
No: 5 percent
Don't know: 35 percent
Post-election
Yes: 68 percent
No: 5 percent
Don't know: 27 percent
Among post-election survey respondents, 18- to 24-year-olds (79%) were more likely than Canadians aged 25 and older (67%) to be aware that electors can use an online voter registration service to check, update, or complete their registration.
The following were less likely to be aware of the online voter registration service:
those who did not vote in the 2015 GE (64% versus 68% of those who did vote)
those who did not recall seeing an EC ad during the 2019 GE (62% versus 73% of those who did)
those who did not vote in the 2019 GE (62% versus 69% of voters)
those who voted on election day (68%) or at an advance poll (69%) compared to those who voted at a local EC office (77%) or on campus (78%)
Awareness of polling day registration increased to seven in 10 electors
In the early election and registration phases of the election period, six in 10 (59%) respondents said an elector can register at the polling place and then vote immediately after. Awareness of polling day registration was significantly higher following the October 21, 2019, election: seven in 10 (71%) respondents were aware that electors can register at the polling place on election day.
Figure 23: Aided knowledge of polling day registration
Q. If an elector is not registered on election day and wants to vote, can they register at the polling place and then vote immediately after? Base: those who knew they needed to be registered to vote and keep their voter registration information up-to-date; Wave 2 (n=4,583), Wave 3 (n=10,950).
[Text version of] "Figure 23: Aided knowledge of polling day registration "
This vertical bar chart shows respondents' aided knowledge of polling day registration, comparing knowledge from the early election phase through to the post-election period. The breakdown is as follows:
Early election
Yes: 59 percent
No: 12 percent
Don't know: 29 percent
Registration phase
Yes: 59 percent
No: 13 percent
Don't know: 28 percent
Post-election
Yes: 71 percent
No: 11 percent
Don't know: 18 percent
Among post-election survey respondents, Indigenous electors were more likely to say an elector can register at the polling place and then vote immediately after (76%, compared to 71% of non-Indigenous electors).
The following were less likely to say an elector can register and vote immediately after:
electors in Quebec (51%) compared to all other regions of Canada (ranging from 77% to 87%). This is significant considering that provincial elections in Quebec do not provide for polling day registration
those who did not vote in the 2015 GE (58% versus 72% of those who did vote)
those who did not recall seeing an EC ad during the 2019 GE (63% versus 75% of those who did)
those who recalled receiving their VIC (71% versus 76% of those who did not)
those who did not vote in the 2019 GE (56% versus 72% of voters)
those who voted on election day (71%) compared to those who voted at a local EC office (86%) or at an advance poll (74%)
10. Registration Action During the Election
In the post-election survey, six in 10 (61%) respondents said they made sure they were registered to vote in the 43rd general election: 50% said they checked and made sure that they were already registered to vote with the correct information; 7% said they updated their registration information; 3% said they registered to vote.
Through each phase of the voter information campaign to the post-election survey, the proportion of electors who said they registered to vote during the election period remained consistent (2% to 3%).
The proportions of electors who updated their voter registration information were highest during the early election and registration phases (9% each), when voter information campaign messages were focused on registration.
The proportion of electors who checked that they were already registered increased throughout the voter information campaign: 41% in the early election phase of the election period, a considerable increase up to 69% in the VIC phase, and as high as 72% during the early voting phase. The timing of this increase suggests that the delivery of the VIC prompted electors to check their registration. This is supported by the finding that 57% of electors who made sure they registered to vote in the election said they did so by checking that the information on their VIC was correct.footnote 13
Figure 24: Registration actions
Q. Have you checked/made sure you were registered to vote in this election?
Q. What, if anything, did you do to make sure you were registered to vote in this election? Did you...?
Base: those aware of the election. [Wave 2, Wave 2 + Wave 3]
Registration actions
Wave 2 (n=13,733)
Wave 3 (n=21,403)
Early election phase
Registration phase
VIC phase
Early voting phase
Election day phase
Post-election
Register to vote
2%
2%
2%
3%
3%
3%
Update registration information
9%
9%
6%
6%
7%
7%
Check that you were already registered
41%
43%
69%
72%
71%
50%
Did none of the above
48%
45%
22%
19%
18%
38%
Don't know
1%
1%
1%
1%
1%
1%
Post-election, the likelihood of checking to confirm one's registration was higher among those who recalled receiving their VIC (51% versus 31% of those who did not), as well as among those who recalled seeing an EC ad during the 2019 GE (55% versus 44% of those who did not).
11. Knowledge of Identification Requirements
This section of the report presents the findings of two approaches used to measure aided knowledge of identification requirements for voting in a Canadian federal election, conducted using split samples.
Widespread awareness of need to provide a proof of identity and address when asked separately
The first approach used to measure knowledge of voter identification requirements involved asking respondents first whether they need to present proof of identity to vote, and then separately whether they need to present proof of address.
The vast majority (97%) of electors in the post-election survey said they were aware that voters have to present a proof of identity in order to vote in a Canadian federal election. This is the same as the result from the 2015 Survey of Electors (97%). The proportion of electors who were aware of the proof of identity requirement increased over the election period from a baseline of 93% pre-election.
Figure 25: Knowledge of proof of identity requirements [formulation 1]
Q. To the best of your knowledge, do voters have to present a proof of identity in order to vote in a Canadian federal election? Base: split samples of all respondents; Wave 1 (n=24,978), Wave 2 (n=6,702), Wave 3 (n=10,699).
[Text version of] "Figure 25: Knowledge of proof of identity requirements [formulation 1]"
This vertical bar chart shows respondents' knowledge of the need to present a proof of identity in order to vote, comparing responses from the pre-election survey through the election period and post-election surveys. The breakdown is as follows:
Pre-election
Yes: 93 percent
No: 4 percent
Don't know: 3 percent
VIC phase
Yes: 94 percent
No: 3 percent
Don't know: 2 percent
Early voting phase
Yes: 95 percent
No: 3 percent
Don't know: 2 percent
Election day phase
Yes: 96 percent
No: 3 percent
Don't know: 1 percent
Post-election
Yes: 97 percent
No: 2 percent
Don't know: 1 percent
Among post-election survey respondents, Indigenous electors (95%) were less likely than non-Indigenous electors (97%) to say that electors have to present a proof of identity.
Electors' awareness of the need to provide a proof of address was slightly lower but still very high at 91% in the post-election survey – and a slight increase from the 2015 Survey of Electors (88%). Awareness of the need to provide proof of address in the 2019 GE generally increased throughout the research period, ending 8 percentage points higher than the baseline of 83% from the pre-election survey.
Figure 26: Knowledge of proof of residence [formulation 1]
Q. To the best of your knowledge, do voters have to present a proof of address in order to vote in a Canadian federal election? Base: split samples of all respondents; Wave 1 (n=24,978), Wave 2 (n=6,702), Wave 3 (n=10,699).
[Text version of] "Figure 26: Knowledge of proof of residence [formulation 1]"
This vertical bar chart shows respondents' knowledge of the need to present a proof of residence in order to vote, comparing responses from the pre-election survey through the election period and post-election surveys. The breakdown is as follows:
Pre-election
Yes: 83 percent
No: 10 percent
Don't know: 7 percent
VIC phase
Yes: 88 percent
No: 7 percent
Don't know: 5 percent
Early voting phase
Yes: 87 percent
No: 8 percent
Don't know: 5 percent
Election day phase
Yes: 88 percent
No: 8 percent
Don't know: 5 percent
Post-election
Yes: 91 percent
No: 6 percent
Don't know: 3 percent
Post-election, Indigenous electors (87% compared to 91% of non-Indigenous electors) and new Canadians (85% compared to 91% of other Canadians) were less likely to report knowing that electors have to present a proof of address in order to vote in a Canadian federal election.
Knowledge of proof of address requirement lower when asked alongside proof of identity
The second approach used to measure knowledge of identification requirements involved asking a single question about whether electors need to provide proof of identity, proof of address, both, or neither in order to vote in a federal election. Compared to the first approach, this resulted in lower overall knowledge of the proof of address requirement in particular: In the post-election survey, just over one-half (55%) correctly responded that both a proof of identity and address are required. Another 41% thought that only a proof of identity was required (meaning 96% in total were aware of at least this requirement). In comparison, only 2% said that only a proof of address was required (meaning only 57% in total were aware of at least this requirement).
The proportion of those who knew both requirements increased from a pre-election baseline of 48% up to 60% during the VIC phase, before peaking at 64% in the election day phase of the election period. As the proportion for "both" increased, the proportion who said only proof of identity decreased (45% pre-election versus 33% in the election day phase). This suggests that awareness of the proof of address requirement in particular increased during the election period.
Figure 27: Knowledge of identification requirement [formulation 2]
Q. In order to vote at a federal election, must electors provide...? [DK/NR: ranged from 1 percent–2 percent.] Base: split samples of all respondents; Wave 1 (n=20,880), Wave 2 (n=6,827), Wave 3 (n=10,736).
[Text version of] "Figure 27: Knowledge of identification requirement [formulation 2]"
This vertical bar chart shows respondents' knowledge of the identification requirements needed in order to vote, comparing responses from the pre-election survey through to the election period and post-election surveys. The breakdown is as follows:
Pre-election
Both proof of identity and address: 48 percent
Only proof of identity: 45 percent
Only proof of address: 3 percent
VIC phase
Both proof of identity and address: 60 percent
Only proof of identity: 36 percent
Only proof of address: 2 percent
Early voting phase
Both proof of identity and address: 62 percent
Only proof of identity: 34 percent
Only proof of address: 2 percent
Election day phase
Both proof of identity and address: 64 percent
Only proof of identity: 33 percent
Only proof of address: 2 percent
Post-election
Both proof of identity and address: 55 percent
Only proof of identity: 41 percent
Only proof of address: 2 percent
Among post-election survey respondents, the following were more likely to say that both a proof of identity and address are required to vote in a federal election:
electors with no disability (56% compared to 51% of electors with a severe/very severe disability)
18- to 24-year-olds (70% compared to 53% of Canadians aged 25 and older)
12. Knowledge of Voting Methods
Electors' knowledge of the voting methods available in a federal election was measured in both an unaided and aided manner. The results are presented in this section.
Majorities know unaided that electors can vote at election day and advance polls
In the pre-election and post-election surveys, those who responded by telephone were asked, in an open-ended manner, to identify the current ways that electors can vote in a federal election. Resulting unaided knowledge of the main voting methods was high post-election and increased from the pre-election survey: nine in 10 (91%) post-election respondents said electors can vote in person at a polling station on election day (up from 84% pre-election); 71% mentioned that electors can vote at an advance polling station (up considerably from 42%). Another 23% identified the option to vote by mail (up from 19%).
Compared to results from the 2015 Survey of Electors, there was no change in knowledge of voting on election day (90% in 2015), but there were significant increases in electors' knowledge of the option to vote at an advance poll (64%) and by mail (13%).
Figure 28: Unaided knowledge of different ways to vote
Q. To the best of your knowledge, what are the current ways that electors can vote in a federal election? [Multiple responses accepted.] Base: all respondents; pre-election (n=3,063), post-election (n=3,744). [Wave 1, Wave 3]
[Text version of] "Figure 28: Unaided knowledge of different ways to vote"
This horizontal bar chart shows respondents' unaided knowledge of the different ways to vote, comparing knowledge post-election (blue bar) and pre-election (grey bar). The breakdown is as follows:
On election day
Post-election: 91 percent
Pre-election: 84 percent
At an advance polling station
Post-election: 71 percent
Pre-election: 42 percent
By mail
Post-election: 23 percent
Pre-election: 19 percent
At a local EC office
Post-election: 4 percent
Pre-election: 1 percent
At home
Post-election: 2 percent
Pre-election: 1 percent
Some post-secondary campuses
Post-election: 2 percent
Pre-election: 1 percent
Don't know
Post-election: 3 percent
Pre-election: 8 percent
Among post-election survey respondents, the following were less likely to mention a polling station on election day and advance polls as ways to vote in a federal election:
electors with a severe or very severe disability (83% mentioned election day polls and 56% advance polls compared to 92% and 73% of electors without a disability, respectively)
Indigenous electors (81% and 52%, respectively, compared to 91% and 72% of non-Indigenous electors)
new Canadians (81% and 57%, respectively, compared to 91% and 72% of other Canadians)
Most electors recognized the main early voting options when aided
In the pre-election, election period, and post-election surveys, those who responded online were asked to identify from a list the ways it is possible to vote besides at the polling station on election day. Post-election, nearly all (92%) electors knew it is possible to vote at an advance polling station, followed by 50% who identified voting at a local Elections Canada office and another 39% who identified voting by mail. Aided knowledge of each of these main early voting options increased over the course of the 2019 study, and during the early voting phase of the voter information campaign in particular, where awareness nearly matched post-election levels. These results are largely in line with results from the post-election wave of the 2015 ERP Evaluation, when 91% had knowledge of advance voting, 55% knew about voting at a local Elections Canada office, and 42% knew about voting by mail.
One in ten (10%) post-election respondents thought it was possible to vote online in the federal election, although this decreased from 14% in the pre-election survey. Another 5% thought it was possible to vote by telephone, with little variation across the study. These methods have been offered in some Canadian jurisdictions (provincial, territorial, or municipal elections), but are not available in federal elections.
Figure 29: Aided knowledge of different ways to vote
Q. Besides voting in person at the polling station on election day, is it possible to vote in the following ways? [Multiple responses accepted]
Base: all respondents. [Wave 1-3]
Ways to vote
Wave 1 n=46,930
Wave 2 n=9,365
Wave 3 n=17,691
Pre-election
VIC phase
Early voting phase
Post-election
At an advance polling station
84%
89%
91%
92%
At a local EC office
34%
48%
49%
50%
By mail
31%
32%
35%
39%
Online (not available in a federal election)
14%
10%
9%
10%
By phone (not available in a federal election)
6%
5%
4%
5%
None of these ways
3%
1%
1%
1%
Don't know
7%
6%
5%
3%
Among post-election respondents, the notable subgroup differences included:
Electors with a severe/very severe disability were less likely than those with a mild/moderate disability or no disability to have mentioned advance polls (87% versus 92% and 93%, respectively) and by mail (36% versus 39% of those with no disability or a mild/moderate disability). Conversely, electors with a severe/very severe disability were more likely to have mentioned online as a way in which people can vote (14% versus 12% of electors with a mild/moderate disability and 9% of electors with no disability).
Indigenous electors were less likely than non-Indigenous electors to have mentioned advance polls (87% versus 93%) and a local Elections Canada office (45% versus 50%).
New Canadians were more likely than other Canadians to have said it is possible to vote online (14% versus 10%) and less likely than other Canadians to have mentioned advance polls (81% versus 93%).
18- to 24-year-olds were more likely than Canadians aged 25 and older to have said electors can vote the following ways: by mail (58% versus 37%), at an Elections Canada office (57% versus 49%), online (12% versus 10%), and by telephone (9% versus 5%).
13. Awareness and Perceptions of Elections Canada
This section presents results on electors' awareness of and trust in Elections Canada as a source for electoral information during the 2019 GE.
Top-of-mind awareness of EC as a source for electoral information increased during the campaign
When asked in an open-ended manner, approximately six in 10 (62%) post-election respondents identified Elections Canada as the organization that first comes to mind when they think about sources of information on when and where to vote or how to identify themselves at the polls. This represents a significant increase in Elections Canada as the top-of-mind source of electoral information from the pre-election baseline survey, when four in 10 (40%) said Elections Canada first comes to mind. It is also a significant increase from the 45% who first thought of Elections Canada in the post-election wave of the 2015 ERP Evaluation.
Notably, the proportion of electors who did not know or did not have a response to the question in 2019 decreased from a third (34%) down to a quarter (24%) in the post-election survey, which again is an improvement compared to just after the 2015 GE (when 36% did not know).
Other sources were mentioned by smaller proportions of respondents as represented in figure 30.
Figure 30: EC as top-of-mind organization for electoral information
Q. When you think about getting information about when and where to vote, or how to identify yourself at the polls, or any other information on the voting process, who or which organization first comes to mind? Base: all respondents; pre-election (n=49,993), post-election (n=21,435). [Wave 1, Wave 3]
[Text version of] "Figure 30: EC as top-of-mind organization for electoral information"
This horizontal bar chart shows the percentage of respondents who view various sources as a top-of-mind organization for electoral information, comparing responses post-election (blue bar) and pre-election (grey bar). The breakdown is as follows:
Elections Canada
Post-election: 62 percent
Pre-election: 40 percent
Government of Canada
Post-election: 4 percent
Pre-election: 4 percent
Internet
Post-election: 3 percent
Pre-election: 5 percent
Mail/VIC
Post-election: 2 percent
Pre-election: 5 percent
Local candidate/political party
Post-election: 1 percent
Pre-election: 3 percent
Some post-secondary campuses
Post-election: 1 percent
Pre-election: 5 percent
Other
Post-election: 3 percent
Pre-election: 2 percent
Don't know/did not understand
Post-election: 24 percent
Pre-election: 34 percent
Post-election, top-of-mind recognition of Elections Canada as a source of electoral information was higher among:
electors with no disability (65%) compared to those with a disability (59% of those with a mild/moderate disability and 48% of those with a severe/very severe disability)
non-Indigenous electors (63%) compared to Indigenous electors (53%)
youth attending school or those working full-time (62%) compared to Neet youth (54%)
Most electors are at least somewhat familiar with Elections Canada
The vast majority (85%) of electors in the post-election survey said they were at least somewhat familiar with Elections Canada, of which 18% said they were very familiar. Fifteen percent reported that they were just familiar with the name Elections Canada. Familiarity with Elections Canada remained virtually unchanged between the pre-election baseline survey and the post-election survey, as well as in comparison to the 2015 GE (86% were at least somewhat familiar by the end of the 2015 ERP Evaluation).
Figure 31: Familiarity with EC
Q. Overall, how familiar are you with Elections Canada? Base: all respondents; pre-election (n=49,993), post-election (n=19,435). [Wave 1, Wave 3]
[Text version of] "Figure 31: Familiarity with EC"
This horizontal bar chart shows respondents' familiarity with Elections Canada, comparing responses post-election and pre-election. The breakdown is as follows:
Post-election
Very familiar: 18 percent
Somewhat familiar: 67 percent
Just know the name: 15 percent
Never heard of Elections Canada: <0.5 percent
Pre-election
Very familiar: 19 percent
Somewhat familiar: 65 percent
Just know the name: 15 percent
Never heard of Elections Canada: 1 percent
Post-election, the likelihood of being familiar with Elections Canada was higher among:
electors with no disability (85%) compared to electors with a severe/very severe disability (81%)
Indigenous electors (88%) compared to non-Indigenous electors (85%)
18- to 24-year-olds (87%) compared to Canadians aged 25 and older (84%)
youth attending school (89%) compared to NEET youth (82%)
Widespread agreement that Elections Canada is the most trusted source of information about the electoral process
Nine in 10 (91%) electors in the post-election survey agreed with the view that Elections Canada is the most trusted source of information about the electoral process, including over half (57%) who strongly agreed. This represents a small increase in the proportion who agreed during the pre-election survey (up from 88%), and a significant increase in those who strongly agreed (up from 42%)footnote 14. Overall, the final results for the 2019 GE are similar to the post-election wave of the 2015 ERP Evaluation (91% agreed, 55% strongly agreed).footnote 15
Figure 32: Trust in EC as a source of information
Q. How strongly do you agree or disagree that Elections Canada is the most trusted source of information about the electoral process? Base: all respondents; post-election (n=19,402) [DK/NR: 4 percent], pre-election (n=46,960) [DK/NR: 5 percent]. [Wave 1, Wave 3]
[Text version of] "Figure 32: Trust in EC as a source of information"
This horizontal bar chart shows respondents' trust in Elections Canada as a source of information, comparing responses post-election and pre-election. The breakdown is as follows:
Post-election
Strongly agree: 57 percent
Somewhat agree: 35 percent
Somewhat disagree: 3 percent
Strongly disagree: 2 percent
Pre-election
Strongly agree: 42 percent
Somewhat agree: 45 percent
Somewhat disagree: 6 percent
Strongly disagree: 2 percent
Post-election, the likelihood of strongly agreeing that Elections Canada is the most trusted source of information about the electoral process was lower among the following:
electors with a severe/very severe (46%) or mild/moderate (54%) disability compared to those with no disability (59%)
Indigenous electors (51%) compared to non-Indigenous electors (57%)
NEET youth (45%) compared to youth attending school (60%) or working full-time (59%)
Footnotes
1
Survey phases tended to change one or two days after the start of a new advertising phase to allow time for the ads to be seen before measuring recall. The early election phase of the survey does not correspond to any particular phase of the voter information campaign, but instead refers to the two-week period prior to the registration phase. This amounts to one week of pre-election surveying and one week of election period surveying, because the election was called while the survey was in the field.
2
The 2019 NES post-election survey was conducted beginning the day after election day for seven weeks, with 99% of data collected within five weeks of election day. The 2015 ERP Evaluation post-election survey, in comparison, was conducted within two weeks of election day.
3
In addition to the post-election comparisons, all direct comparisons between results from the 2019 NES and the 2015 ERP Evaluation are presented with the caveat that some part of observable differences might be explained by differences in the measure used in each study and/or the timing of measurements in the different contexts of the 2019 and 2015 election periods. Unlike the 2019 NES, the 2015 ERP Evaluation measure did not mention Elections Canada when measuring unaided recall of advertising about the voting process, which likely led to higher recall of advertising from sources other than EC: Among the 38% of respondents who recalled seeing an ad in the 2015 benchmark survey, 44% indicated that a political party was the sponsor of the ad. In addition, the 2015 benchmark survey was conducted some weeks after the election period had already begun. This may have contributed to a higher baseline of election-related ad recall compared to the 2019 NES baseline, when the first measurements were taken prior to the start of the election period.
4
Among post-election respondents, recall of the slogan was higher among those who had also responded to the election period survey (47%) compared to those who did not (29%). The increase in recall post-election may therefore in part be due to respondents having recalled the slogan from being asked the question in the previous survey.
5
As a test, half of those who completed the survey online were presented with an image of a VIC and half were not. This had negligible impact on recall (94% among those who were presented the image versus 93% of those who did not).
6
With the exception of those who responded to the early election survey, each respondent was presented three ads: one image of an online web banner or social media ad; one image of a print or outdoor ad; and one 15-second video or radio ad. Those who responded to the early election survey were shown two ads only: one online ad and one video.
7
All respondents were asked to evaluate the ads, including those who said they did not recall having seen or heard any of the ads they were presented in the survey.
8
The 2015 ERP Evaluation used a 0 to 10 point scale to measure satisfaction with information and how informed electors felt they were about the voting process. The results were originally reported based on the proportion of responses ranging from 8 to 10 on that scale. The results for these measures cited in this report do not appear in the original report from 2015: instead, the proportions in this report have been calculated from the original data using a score of 5 to 10, having been found to be comparable with the top 2 points of the 4-point satisfaction scale used in the 2019 NES (i.e. representing "somewhat satisfied" or higher).
9
Half of the respondents received the preamble Election Canada hires and pays local people to work during federal elections before the question, and the other half the preamble Elections Canada needs local people to work at the polls in their area; without them it would be impossible to hold elections.
10
The result cited for 2015 is derived from the combined responses of unregistered electors who did not know any of the ways to register, plus registered electors who did not know any of the ways to update their voter information. In the original ERP Evaluation, these results were reported separately (62% did not know among unregistered electors, 30% among registered electors).
11
The results are based on a merger of split samples used to test awareness of online voter registration. Half the respondents were asked whether electors could use an "online voter registration service on Elections Canada's website," and the other half was asked whether electors could "check, update, or complete their voter registration on Elections Canada's website." While a majority of electors expressed awareness of this option regardless of the formulation of the question, the majority in the former formulation was 3 percentage points (57% versus 60%) lower in the election period survey and 4 percentage points (66% versus 70%) lower in the post-election survey.
12
The 2015 result was measured using the first formulation described in Footnote 11. The increase from 2019 to 2015 is still significant when comparing the exact same measures only (66% in 2019 versus 51% in 2015).
13
This finding along with additional survey results on voter registration in the 2019 GE are reported in detail in the National Electors Study Report on Voter Experience.
14
The results for this question are based on a merger of split samples used to test the impact of using a 4-point scale versus an 11-point (0 to 10) scale to measure the level of agreement: It proved possible to produce comparable distributions between the 4-point and 11-point scale results when scores of 9 to 10 on the 11-point scale represented strongly agree and 5 to 8 represented somewhat agree.
15
The 2015 ERP Evaluation used a 0 to 10 point scale to measure trust in EC as a source of electoral information. The results were originally reported based on the proportion of responses ranging from 8 to 10 on that scale (resulting in 70% agreed in the post-election survey). The 2015 results for this measure cited in this report do not appear in the original report from 2015: instead, the proportions in this report have been calculated from the original data into a 4-point scale using the method described at footnote 14.
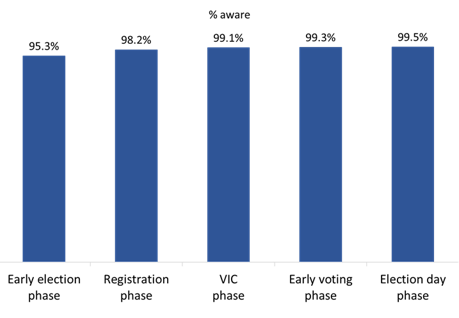
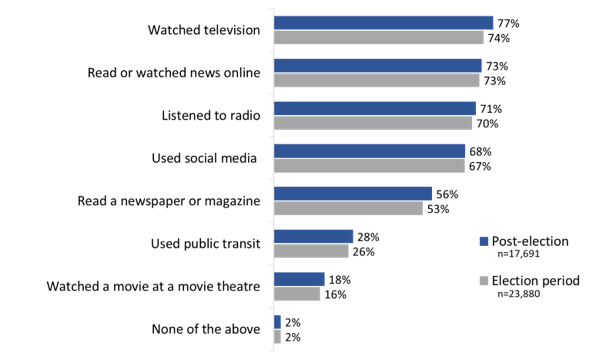
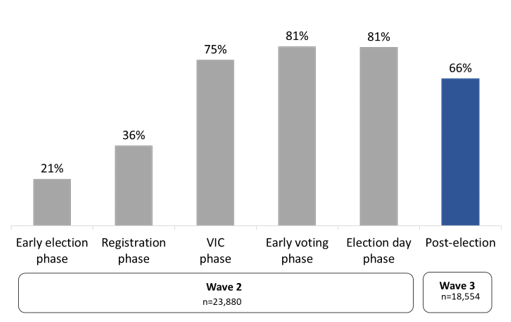
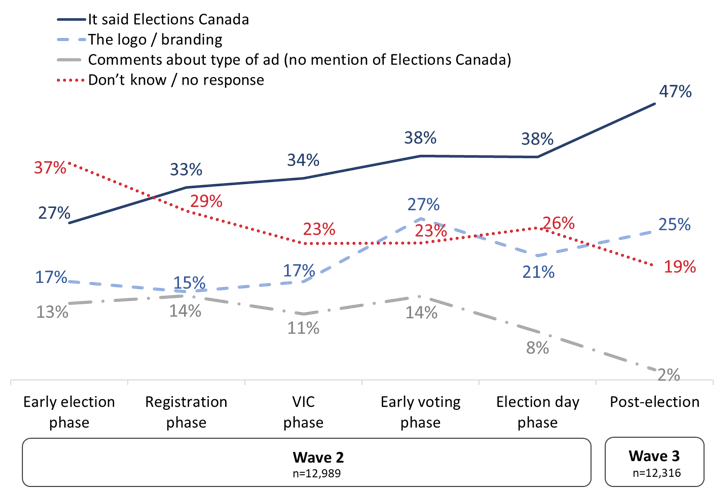
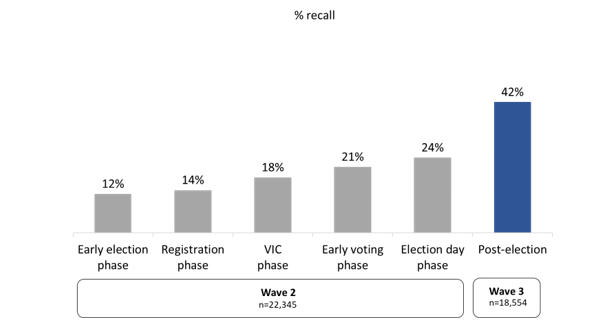
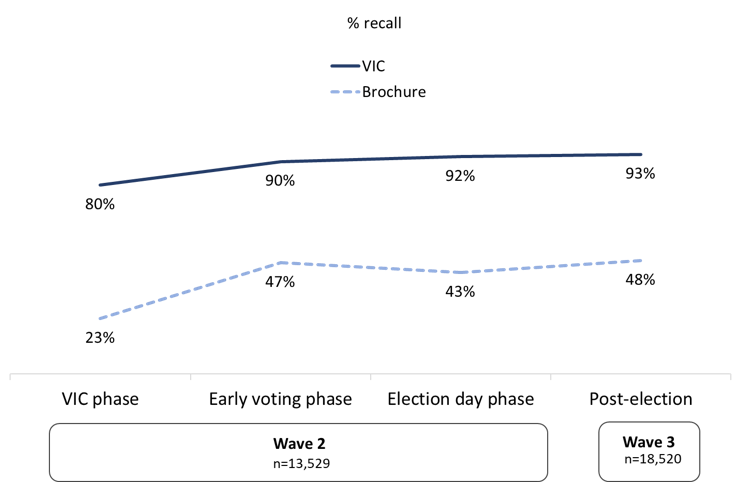
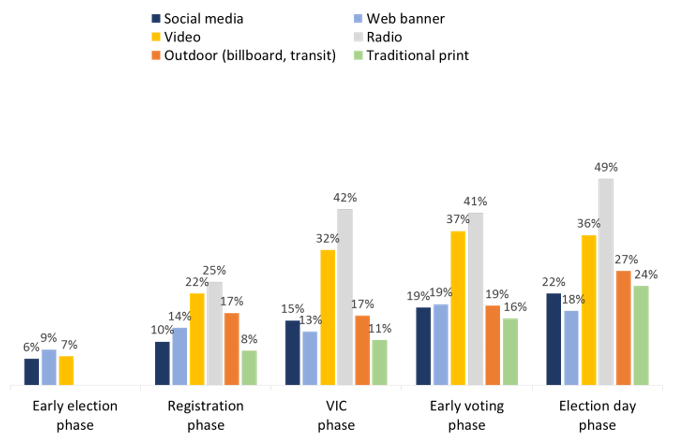
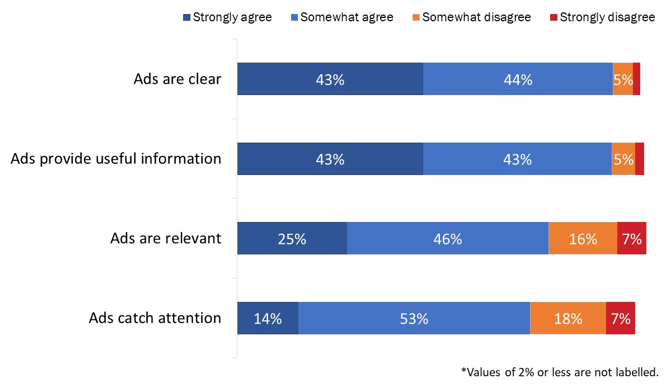
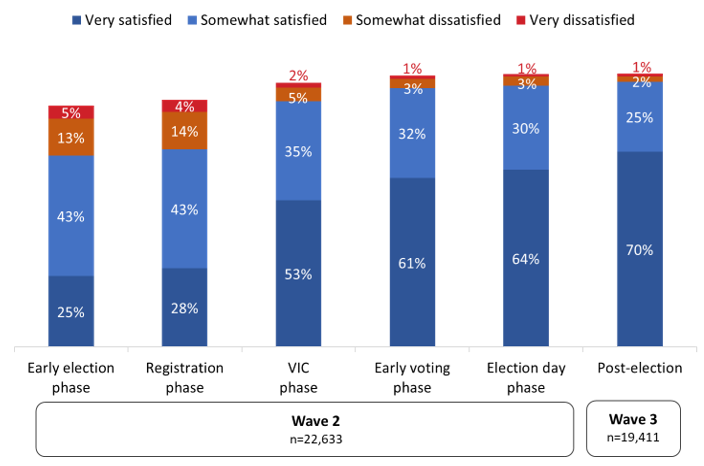
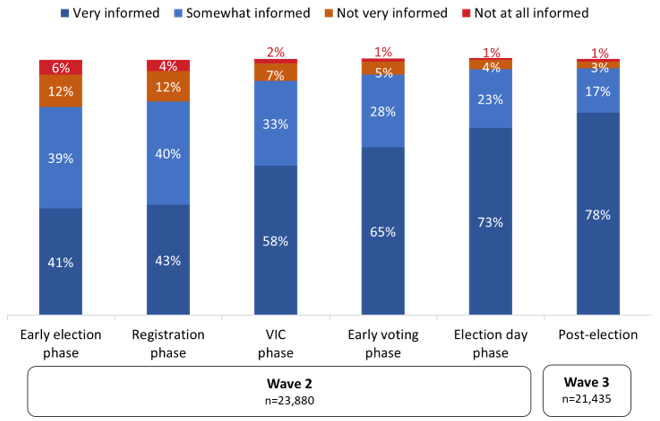
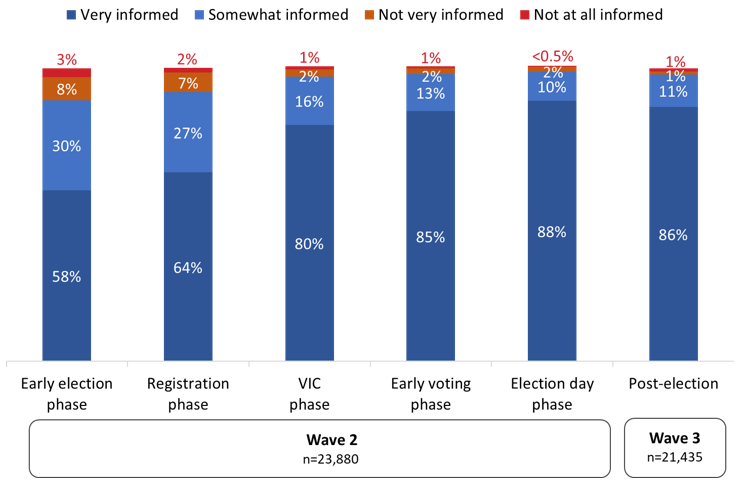
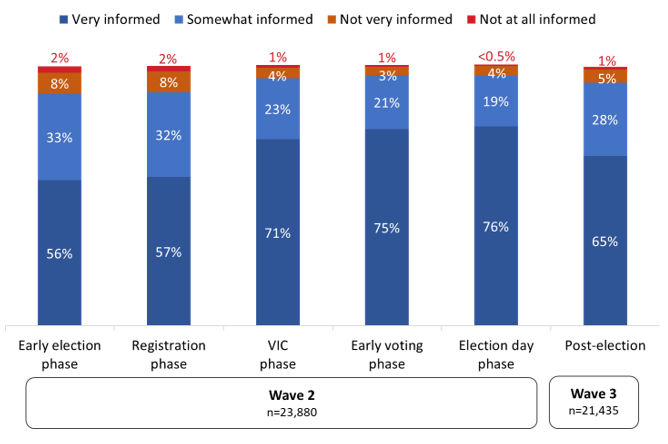
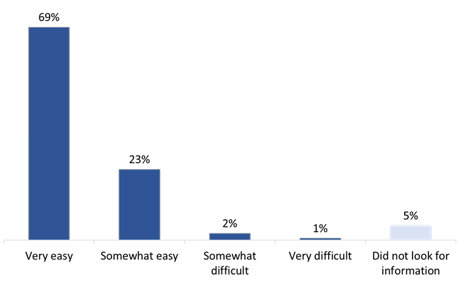
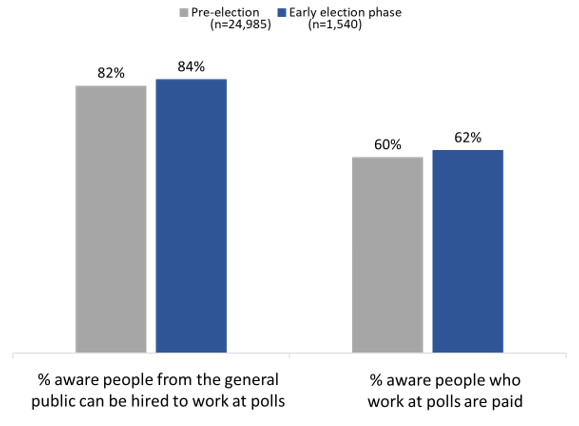
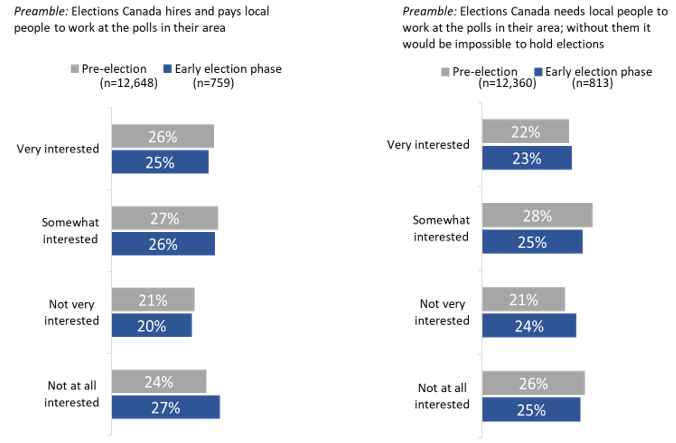
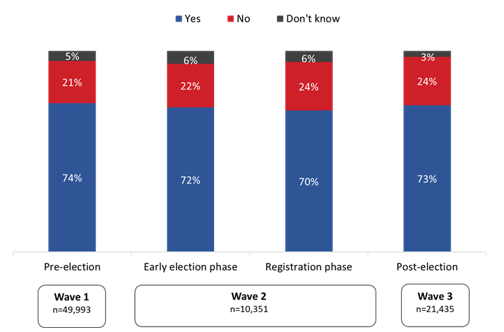
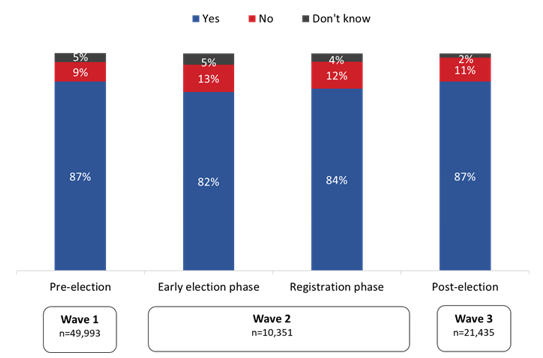
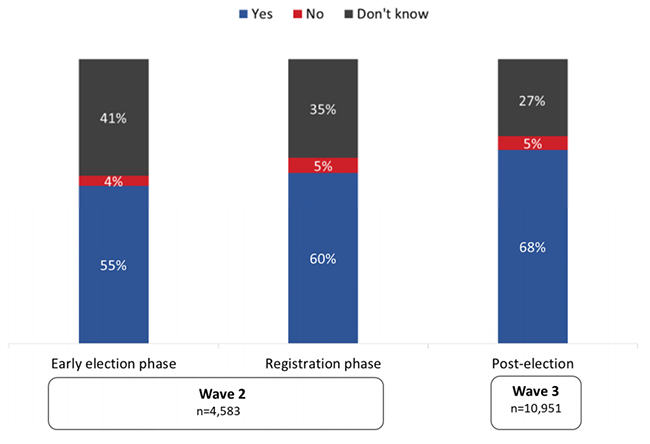
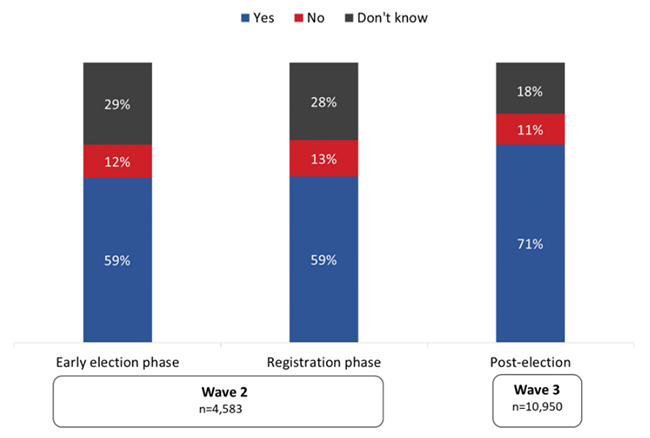
![Figure 25: Knowledge of proof of identity requirements [formulation 1]](images/fig25.png)
![Figure 26: Knowledge of proof of residence [formulation 1]](images/fig26.png)
![Figure 27: Knowledge of identification requirement [formulation 2]](images/fig27.png)