Detailed Findings – National Electors Study on the 43rd Canadian Federal General Election: Report on Policy and Civic Engagement Issues
1. Political Financing and Government Advertising
This section of the report presents electors' views on political financing and government advertising.
Majority aware of limits on individual donations to federal political parties and candidates
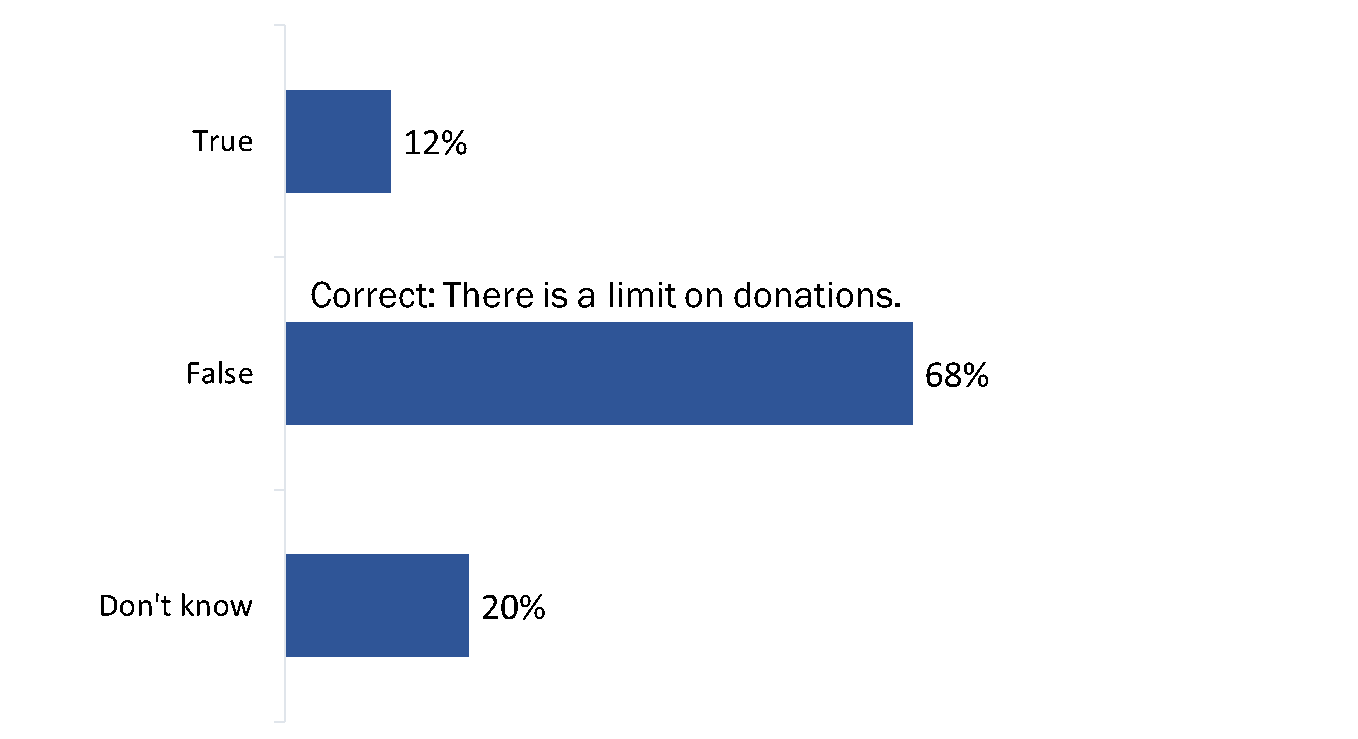
More than two thirds (68%) of respondents in the pre-election survey indicated, correctly, that there is a limit on the amount of money an individual may donate to a federal political party or candidate. Just over 1 in 10 (12%) thought that there is no such limit, while one in five (20%) said they do not know. Knowledge of political contribution limits was higher in 2019 than after the 2015 GE, based on the CES, when 59% knew that there is a limit on contributions.
Figure 1: Knowledge of political contribution limits
Q. Is this true or false? There is no limit on the amount of money an individual may donate to a federal political party or candidate. Base: n=49,993 (WAVE 1)
The following were less likely to know that there are limits on political contributions:
Indigenous electors (55%) versus 69% of non-Indigenous electors.
New Canadians (51%) compared with non-immigrants (69%) and immigrants who became citizens before the 2015 GE (68%).
Non-binary/transgender (60%) and female (63%) electors compared with male electors (75%).
NEET youth (42%) compared with youth working full-time (59%) and youth attending school (50%).
Those not interested in politics (45%) compared with those interested in politics (74%).
Non-voters in the 2015 GE (46%) versus 73% of voters.
In addition, the likelihood of knowing about political contribution limits increased with electors' age, from 46% of 18- to 24-year-olds to 78% of electors aged 75 and older.
Near-consensus that the public has a right to know how parties and candidates are financed
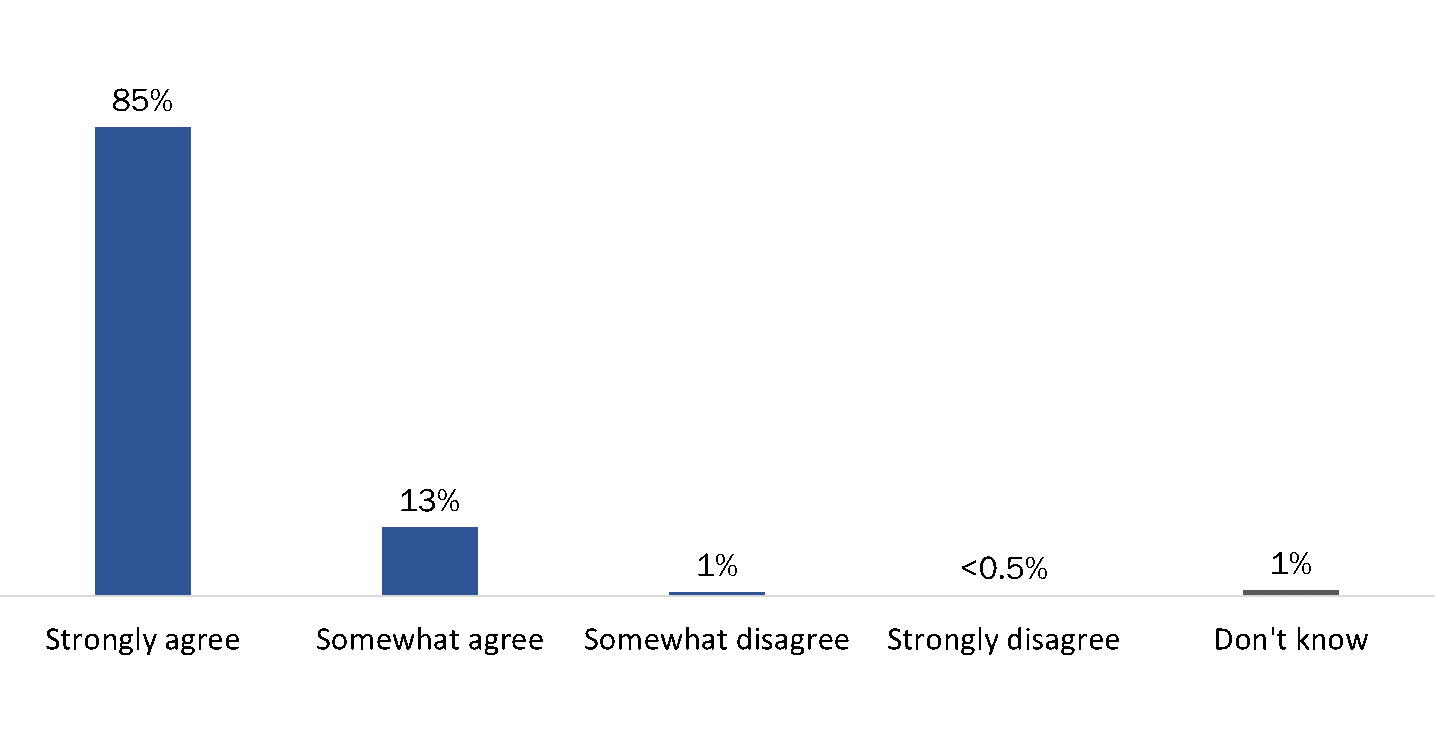
During the election period, nearly all (98%) respondents agreed that the public has a right to know where political parties and candidates get their money. Moreover, a substantial majority (85%) strongly agreed. The proportion who agreed at least somewhat is similar to after the 2015 GE (97%, according to the CES), but a much larger proportion strongly agreed in 2019 (compared with 56% in 2015).
Figure 2: Views on whether the public has a right to know where political parties and candidates get their money
Q. How much do you agree or disagree with the following statement? The public has a right to know where political parties and candidates get their money. Base: n=12,060 (WAVE 2)
Although groups agreed at similar levels overall that the public has a right to know the sources of political financing for parties and candidates, the following were less likely to strongly agree:
Those who did not vote in the 2015 GE (74%) versus 87% of voters.
Electors not interested in politics (73%) versus 88% of electors who expressed an interest in politics.
Electors with a high school or less education (77%) compared with those with some post-secondary or college (85%) and those who have completed university (88%).
Widespread impression that having spending limits during elections is a good thing
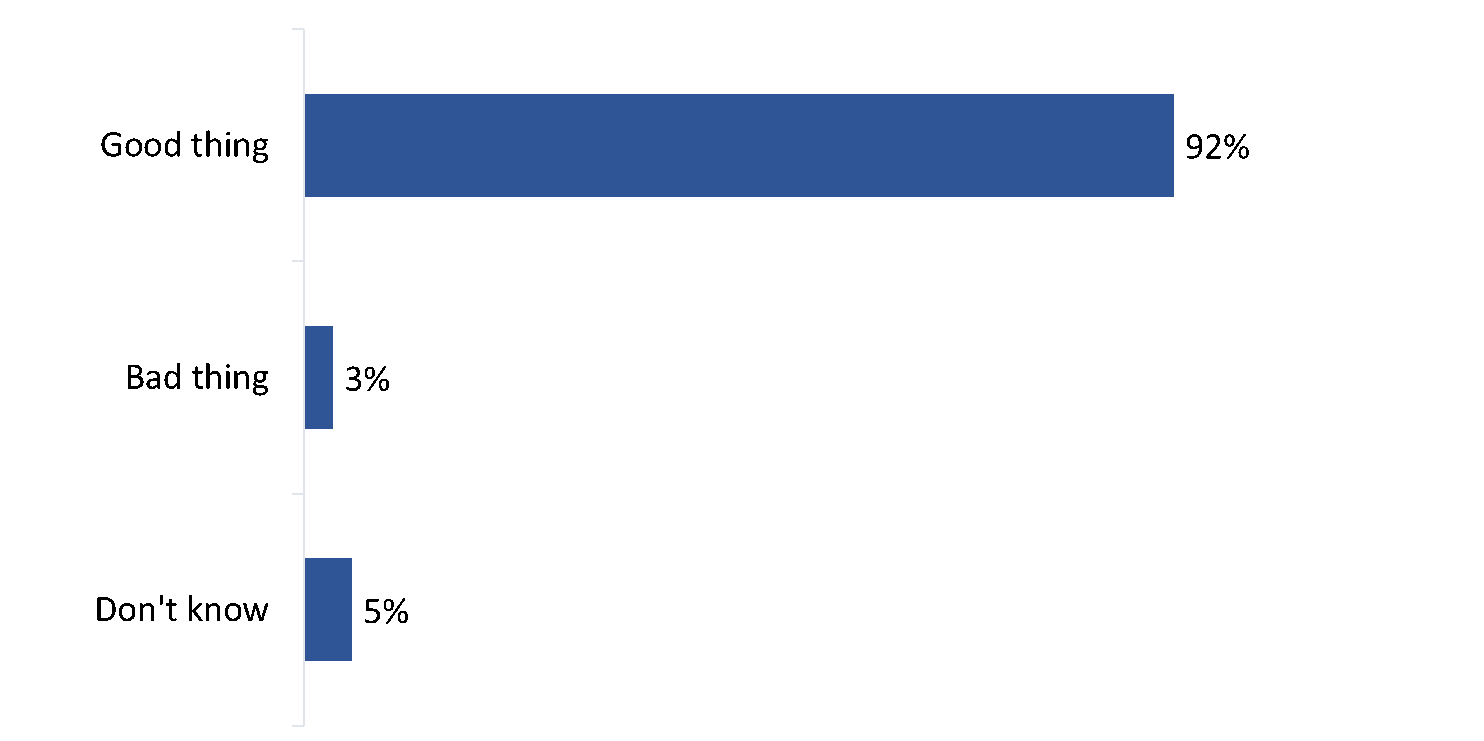
More than 9 in 10 (92%) respondents during the election period said it is a good thing that there are limits on how much political parties can spend during elections. Among the remaining respondents, 3% indicated it is a bad thing. This is similar to the 2015 CES (90% said spending limits are a good thing, 4% said they are a bad thing).
Figure 3: Views on political party spending limits during elections
Q. There are limits on how much political parties can spend during elections. Is this a good thing or a bad thing? Base: n=11,820 (WAVE 2)
Non-voters in the 2015 GE (83% versus 93% of voters) and men (91% versus 93% of women) were less likely to view spending limits as a good thing. In contrast, the likelihood of viewing spending limits as a good thing increased with age, from 90% of electors aged 18 to 24 to 97% of electors aged 75 and older.
The majority consider it inappropriate for one level of government to advertise about election issues during an election at the other level
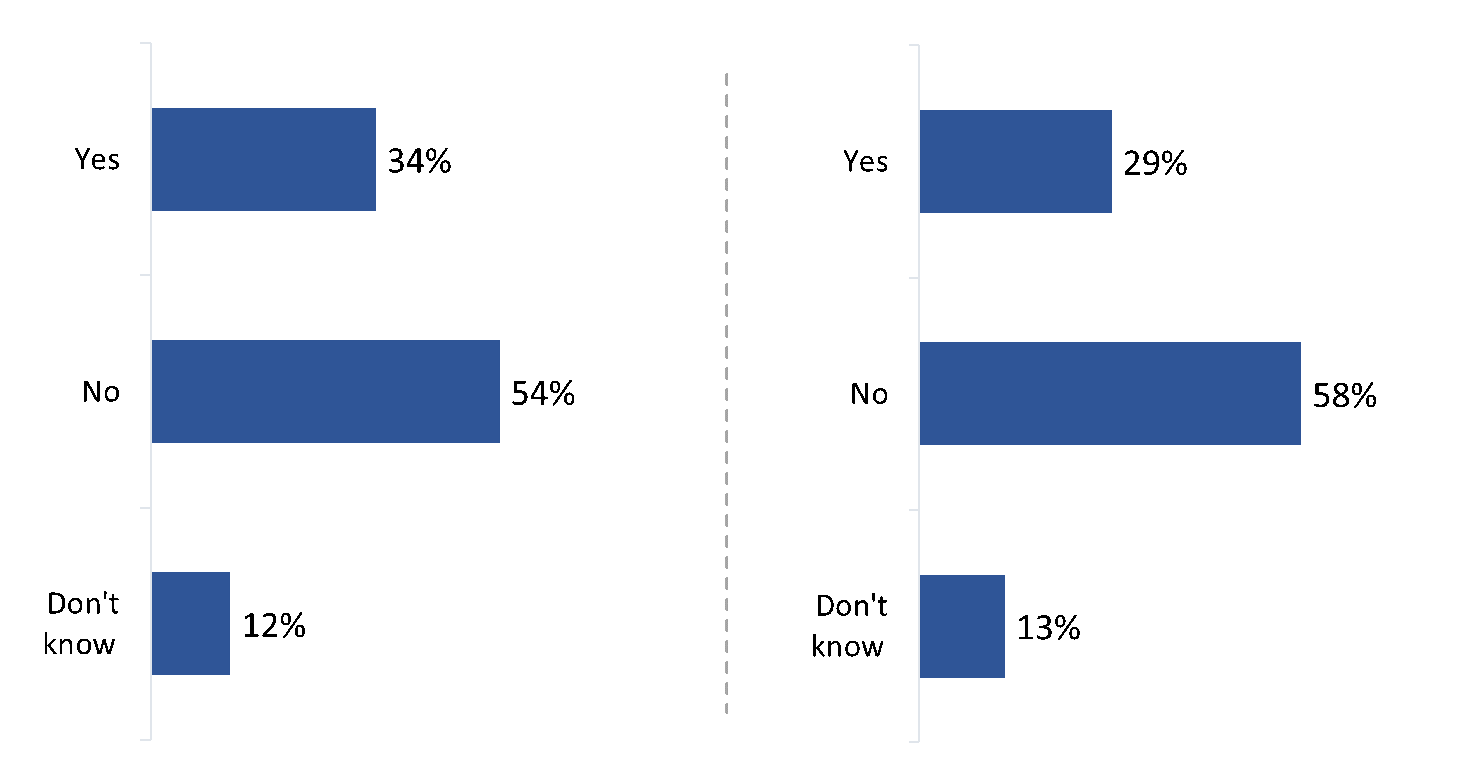
A majority of respondents consider it inappropriate for a federal or provincial government to run inappropriate for the federal government to run ads about provincial advertising about issues related to an election taking place in the other's jurisdiction: in the pre-election survey, 58% said they thought it would be inappropriate for the federal government to run ads about provincial election issues during a provincial election, and 54% thought it would be inappropriate for a provincial government to run ads about federal election issues during a federal election.
Conversely, approximately one third (34%) thought it would be appropriate for a provincial government to run advertising about federal election issues during a federal election, while slightly fewer (29%) thought it would be appropriate for the federal government to run ads about provincial election issues during a provincial election.
Figure 4: Views on government advertising during elections in another jurisdiction
[Left] Q. Do you think it is appropriate for a provincial government to run advertising about federal election issues during a federal election? Base: n=12,435; Split sample (Wave 1) [Right] Q. Do you think it is appropriate for a federal government to run advertising about provincial election issues during a provincial election? Base: n=12,317; Split sample (Wave 1)
The following were more likely to consider it inappropriate for a provincial government to run ads about federal election issues during a federal election:
Those interested in politics (57%) compared with those who are not (41%).
Those who voted in the 2015 GE (57%) compared with those who were eligible but did not vote (37%).
Electors with a university degree (60%) compared with those with some post-secondary or college (51%) or a high school or less education (44%).
In addition, the likelihood of considering this to be inappropriate increased with age, from 41% of 18- to 24-year-olds to 62% of those aged 75 and older.
The following were less likely to consider it inappropriate:
Indigenous electors (44%) versus 54% of non-Indigenous electors.
New Canadians (47%) compared with non-immigrants (54%) and immigrants who became citizens before the 2015 GE (55%).
Electors in Alberta (45%) and the Prairie provinces (43%) compared with those in other provinces (ranging from 52% to 57% of electors).
The following were more likely to consider it inappropriate for a federal government to run ads about provincial election issues during a provincial election:
Those interested in politics (62%) compared with those who are not (42%).
Voters in the 2015 GE (57%) compared with non-voters (37%).
Electors with a university degree (63%) compared with those with some post-secondary or college (57%) or a high school or less education (48%).
Electors in Alberta (64%) and British Columbia (62%) compared with electors in Ontario (57%), Quebec (56%) and the Atlantic provinces (54%).
In addition, the likelihood of considering this to be inappropriate increased with age, from 43% of 18- to 24-year-olds to 73% of those aged 75 and older.
The following were less likely to consider it inappropriate:
Indigenous electors (44%) versus 54% of non-Indigenous electors.
New Canadians (48%) compared with immigrants who became citizens before the 2015 GE (56%) and non-immigrants (59%).
More electors say it is inappropriate for federal government officials to campaign during a provincial election than for provincial government officials to campaign during a federal election
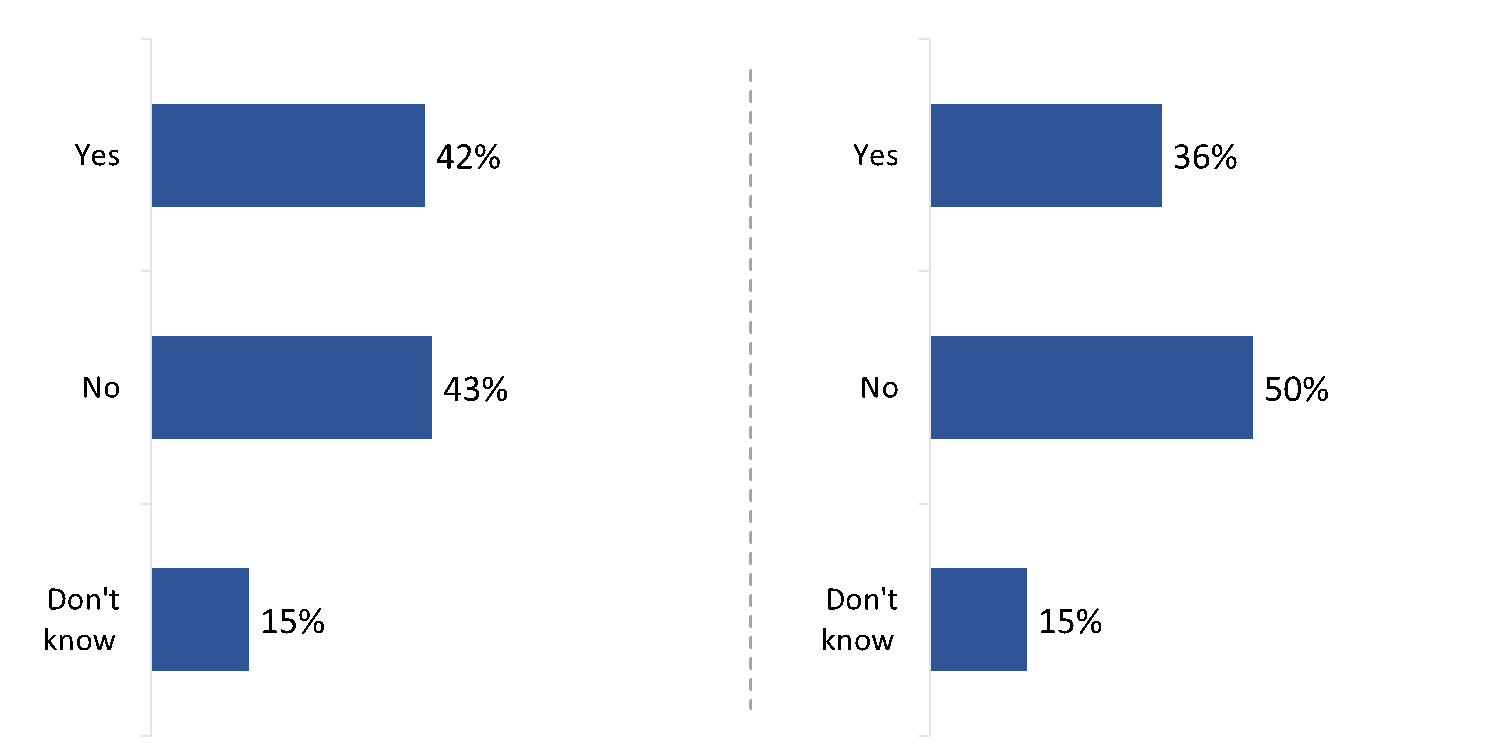
Respondents were almost equally divided on whether it would be appropriate for provincial government officials to campaign about federal election issues during a federal election, with 43% considering it inappropriate and 42% appropriate. However, when it came to whether it would be appropriate for federal government officials to campaign about provincial election issues during a provincial election, half (50%) of respondents considered this inappropriate, while just over one third (36%) considered it appropriate.
Figure 5: Views on government officials campaigning in another jurisdiction
[Left] Q. Do you think it is appropriate for provincial government officials to campaign about federal election issues during a federal election? Base: n=12,570; Split sample (Wave 1) [Right] Q. Do you think it is appropriate for federal government officials to campaign about provincial election issues during a provincial election? Base: n=12,671; Split sample (Wave 1)
In either scenario, the groups that were more likely to say government officials campaigning in another jurisdiction would be inappropriate were largely similar to those who viewed both scenarios of government advertising to be inappropriate: those interested in politics, those who voted in the 2015 GE, those with a university education, and as age increased.
Similarly, Indigenous electors were less likely to view either scenario of government officials campaigning as inappropriate. New Canadians were less likely to think it would be inappropriate for federal government officials to campaign during a provincial election (36%) compared with 48% of immigrants who became citizens before the 2015 GE and 50% of non-immigrants. But there was no difference between new Canadians and other Canadians on the appropriateness of provincial government officials campaigning during a federal election.
Otherwise, the following were more likely to consider it inappropriate for provincial government officials to campaign during a federal election:
Electors in Ontario (47%), British Columbia (43%) and Quebec (43%) compared with electors in Alberta (35%), the Prairie provinces (39%) and the Atlantic provinces (39%).
The following were more likely to consider it inappropriate for federal government officials to campaign during a provincial election:
Electors in Alberta (53%) and Quebec (51%) compared with British Columbia (48%) and the Atlantic provinces (45%).
2. Civic Engagement and Participation in Politics
This section of the report presents electors' views on potential ways to increase civic engagement and participation in politics.
Perceptions on responsibility for encouraging civic engagement among young people
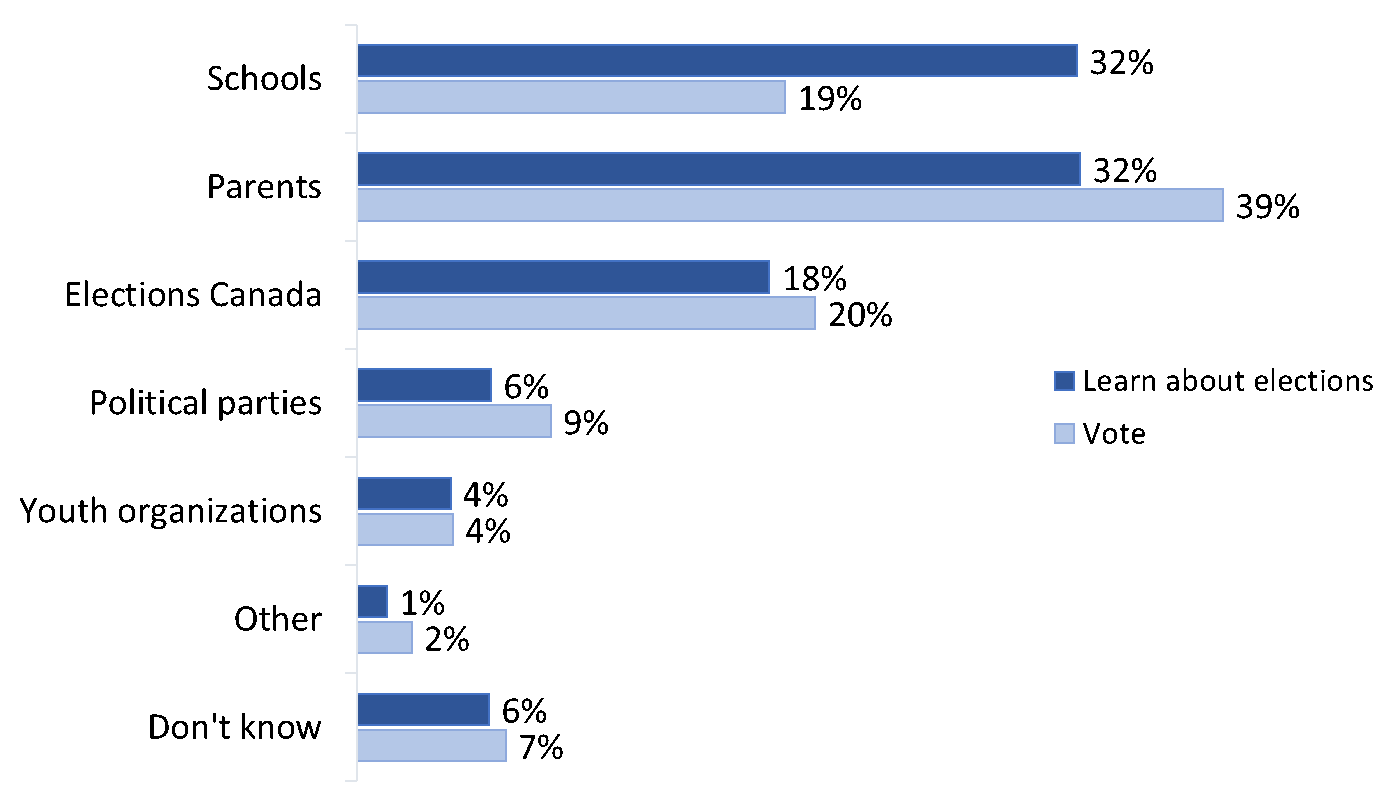
In the election period survey, respondents most often said that schools and parents should be most responsible for encouraging young people to learn about elections. Each of these agents was identified by approximately one third of respondents (32%). The only other actor identified with any frequency in this regard was EC (18%). A smaller proportion identified political parties (6%) and youth organizations (4%).
When it came to who should be most responsible for encouraging young people to vote, respondents were most likely to identify parents (39%), followed at a distance by EC (20%) and schools (19%). Nearly 1 in 10 (9%) thought that political parties should be most responsible for this, while 4% thought it should be youth organizations.
Figure 6: Views on who is most responsible for encouraging civic education versus encouraging young people to vote
Q. Who do you think should be MOST responsible for encouraging young people to learn about elections? Base: n=1,531 Q. Who do you think should be MOST responsible for encouraging young people to vote? Base: n=1,581; Split samples (Wave 2)
The following were more likely to think parents should be most responsible for encouraging young people to learn about elections:
Canadians aged 25 and older (34%) versus 21% of Canadians aged 18 to 24.
Voters in the 2015 GE (34%) versus 23% of non-voters who were eligible to vote.
The following were more likely to think parents should be most responsible for encouraging young people to vote:
Canadians aged 25 and older (41%) versus 10% of Canadians aged 18–24.
Youth working full-time (27%) compared with youth attending school (14%).
Voters in the 2015 GE (42%) versus 27% of non-voters who were eligible to vote.
Those who view voting as more of a duty (42%) rather than more of a choice (31%).
In addition, the following differences were notable:
Canadians aged 18 to 24 (39% versus 17% of Canadians aged 25 and older) were more likely to think that schools should be most responsible for encouraging young people to vote.
Voters in the 2015 GE (8%) were less likely than non-voters (15%) to think that political parties should be most responsible for encouraging young people to vote.
Majority disagree with lowering the voting age in federal elections to 16
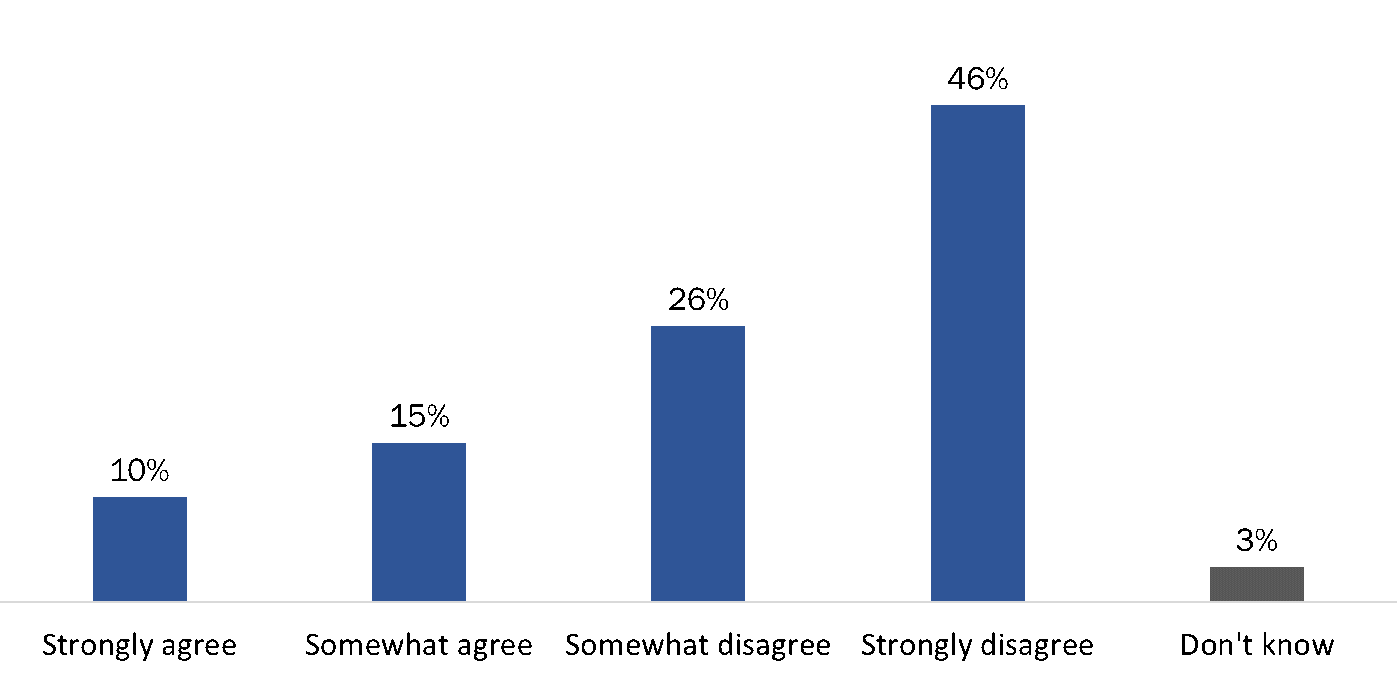
Approximately 7 in 10 (72%) respondents in the pre-election survey disagreed that the voting age in federal elections should be lowered from 18 to 16, with more than 4 in 10 (46%) strongly disagreeing. Conversely, one quarter of respondents agreed either somewhat (15%) or strongly (10%) with lowering the voting age. This is effectively no change in views from the 2015 CES, when 75% disagreed with lowering the voting age (including 52% who strongly disagreed).
Figure 7: Views on lowering the voting age to 16
Q. Do you strongly agree, somewhat agree, somewhat disagree or strongly disagree with the following statement? The voting age in a federal election should be lowered from 18 to 16 years old. Base: n= 7,046; Split sample (Wave 1)
The following were more likely to agree that the voting age should be lowered:
Canadians 18 to 24 years of age (40%) compared with Canadians aged 25 and older (23%).
Respondents who live with at least one person under 18 years old (28%) compared with those who do not (23%).
Indigenous electors (30%) versus 24% of non-Indigenous electors.
Youth attending school (43%) compared with NEET youth (29%) and youth working full-time (36%).
In addition, the likelihood of agreeing that the voting age should be lowered increased as the severity of a disability increased, from 23% of persons with no disability to 30% of those with a severe or very severe disability, and it decreased as age increased, from 40% of 18- to 24-year-olds to 13% of electors aged 75 and older.
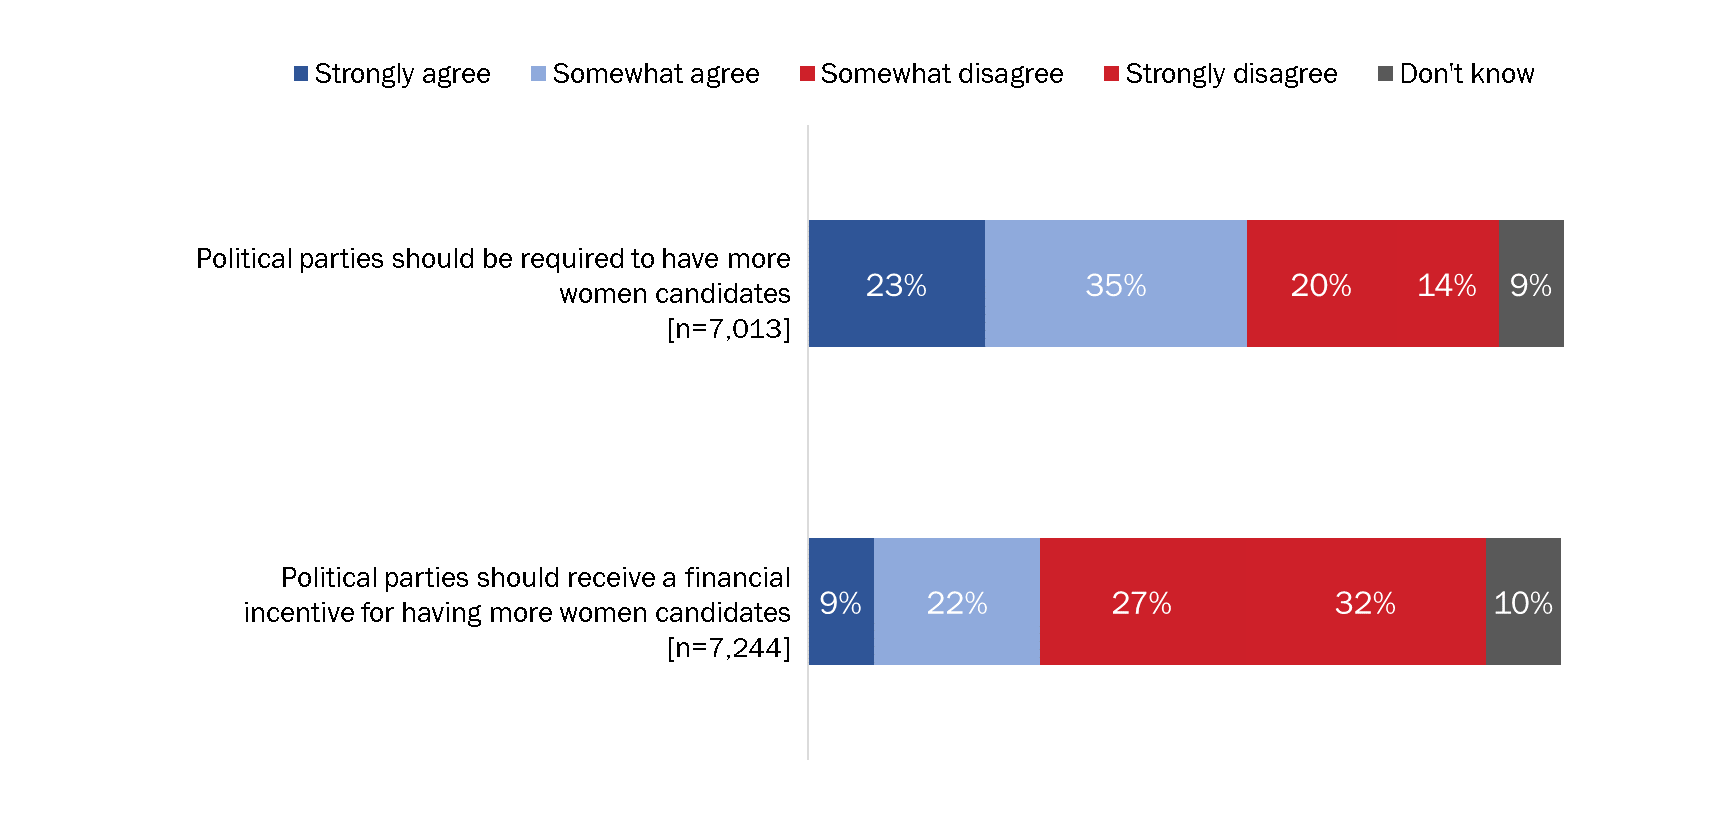
Many think political parties should be required to have more women candidates; fewer think political parties should receive a financial incentive for doing so
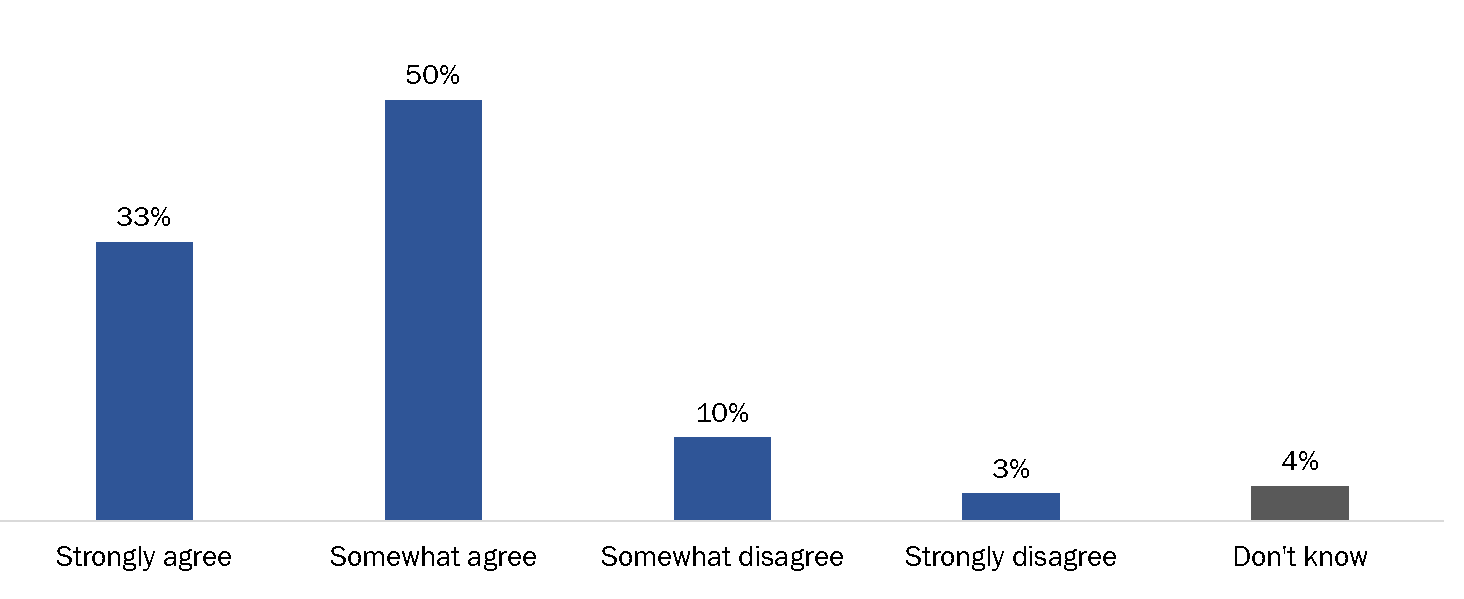
A majority (58%) of respondents agreed that political parties should be required to have more women candidates, although respondents were more likely to somewhat agree (35%) than strongly agree (23%). Conversely, just over one third (34%) disagreed, either somewhat (20%) or strongly (14%), while 9% said they did not know.
In contrast, 6 in 10 (59%) disagreed that political parties should receive a financial incentive for having more women candidates, including 3 in 10 (32%) who strongly disagreed. One in three agreed with having an incentive, although they were more likely to somewhat agree (22%) than strongly agree (9%).
Figure 8: Views on ways to ensure representation of women among candidates
Q. In some countries, there are rules or incentives in place to ensure political parties run candidates from certain groups. Do you strongly agree, somewhat agree, somewhat disagree or strongly disagree that …? Split samples (Wave 1)
Those more likely to agree that political parties should be required to have more women run as candidates included the following:
Women (68%) compared with men (47%).
Indigenous electors (63%) versus 58% of non-Indigenous electors.
Electors aged 75 and older (66%) and 18 to 24 (64%) compared with all other age categories (a range of 56% to 58%).
University graduates (61%) versus those with high school or less education (57%) and those who have completed some university or college or graduated from college (56%).
Youth attending school (68%) versus 56% of youth working full-time and 55% of NEET youth.
New Canadians (70%) and immigrants who became citizens before the 2015 GE (62%) compared with non-immigrants (57%).
Electors in Quebec (66%) compared with other regions of Canada (a range of 46% to 59%).
The likelihood of agreeing also increased as the severity of a disability increased (from 57% of persons with no disability to 65% of those with a severe/very severe disability).
Those more likely to agree that political parties should receive a financial incentive for having more women candidates included the following:
Women (34%) versus 27% of men.
Persons with a severe/very severe disability (36%) compared with those without a disability (30%).
Indigenous electors (42%) versus 30% of non-Indigenous electors.
Youth attending school (46%) compared with youth working (34%) and NEET youth (31%).
New Canadians (39%) and immigrants who became citizens before the 2015 GE (35%) compared with non-immigrants (30%).
The likelihood of agreeing declined as age increased, from 40% of 18- to 24-year-olds to 25% of electors aged 75 and older.
Electors in Alberta were more likely to disagree (68%) compared with those in other regions of Canada (a range of 52% to 62%).
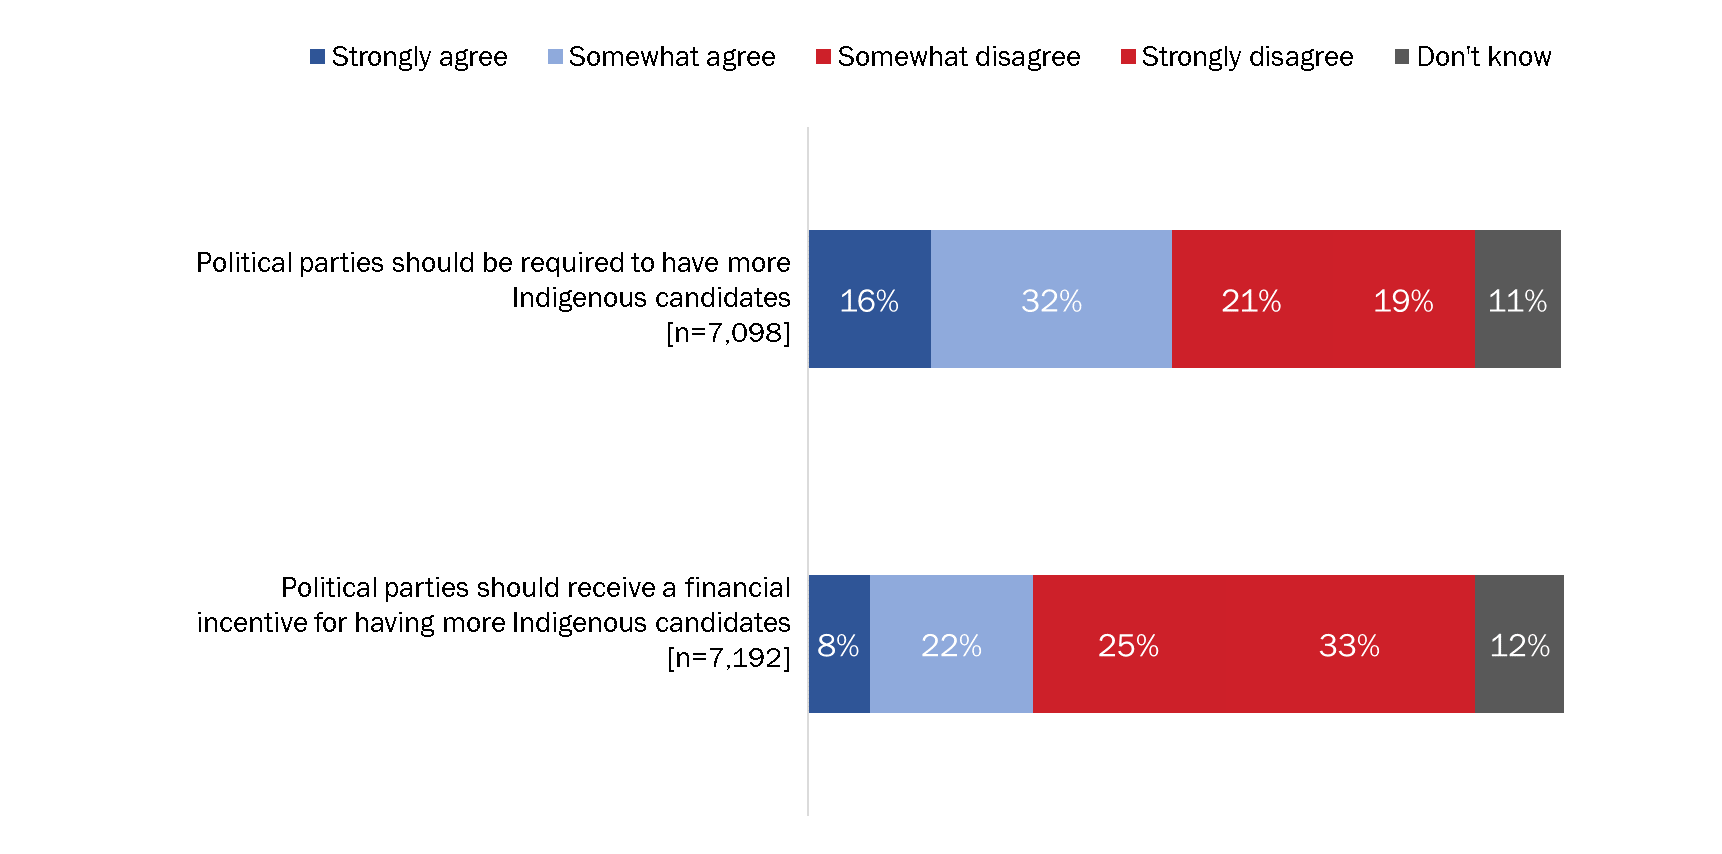
Divided views on ways to increase Indigenous representation among candidates
Nearly half (48%) of respondents agreed that political parties should be required to have more Indigenous candidates, although respondents were twice as likely to somewhat agree (32%) than strongly agree (16%). Conversely, 40% disagreed either somewhat (21%) or strongly (19%), while 11% said they did not know.
In contrast, a majority (58%) of respondents disagreed that political parties should receive a financial incentive for having more Indigenous candidates, including one third (33%) who strongly disagreed. Three in 10 (30%) respondents agreed with having an incentive, although they were more likely to somewhat agree (22%) than strongly agree (8%). Just over 1 in 10 respondents (12%) said they did not know.
Figure 9: Views on ways to ensure Indigenous representation among candidates
Q. In some countries, there are rules or incentives in place to ensure political parties run candidates from certain groups. Do you strongly agree, somewhat agree, somewhat disagree or strongly disagree that …? Split samples (Wave 1)
The following were more likely to agree that political parties should be required to have more Indigenous candidates:
Indigenous electors (68%) versus 48% of non-Indigenous electors.
Women (55%) versus 41% of men.
Electors aged 18 to 24 (55%) and 25 to 34 (54%) compared with those aged 35 and older (46%).
Electors in Ontario (52%), Quebec (54%) and the Atlantic provinces (47%) compared with those in Alberta (38%) and the Prairie provinces (37%).
Youth attending school (63%) versus 50% of youth working full-time and 50% of NEET youth.
New Canadians (65%) and immigrants who became citizens before the 2015 GE (53%) compared with non-immigrants (47%).
The likelihood of agreeing with this also increased as the severity of a disability increased, from 47% of persons with no disability to 58% of those with a severe or very severe disability.
The following were more likely to agree that political parties should receive a financial incentive for having more Indigenous candidates:
Indigenous electors (47%) versus 29% of non-Indigenous electors.
Women (31%) compared with 28% of men.
Electors in Quebec (33%) and Ontario (33%), followed by those in Atlantic Canada (30%) and British Columbia (27%), compared with electors in Alberta (20%) and the Prairie provinces (19%).
Canadians 18 to 24 years of age (39%) versus 29% of Canadians aged 25 and older.
Youth attending school (46%) compared with 34% of youth working full-time and 32% of NEET youth.
New Canadians (43%) and immigrants who became citizens before the 2015 GE (37%) compared with non-immigrants (28%).
3. Voting Technology
This section presents electors' views on potential technology for voting, including the use of technology at the polls and voting over the Internet.
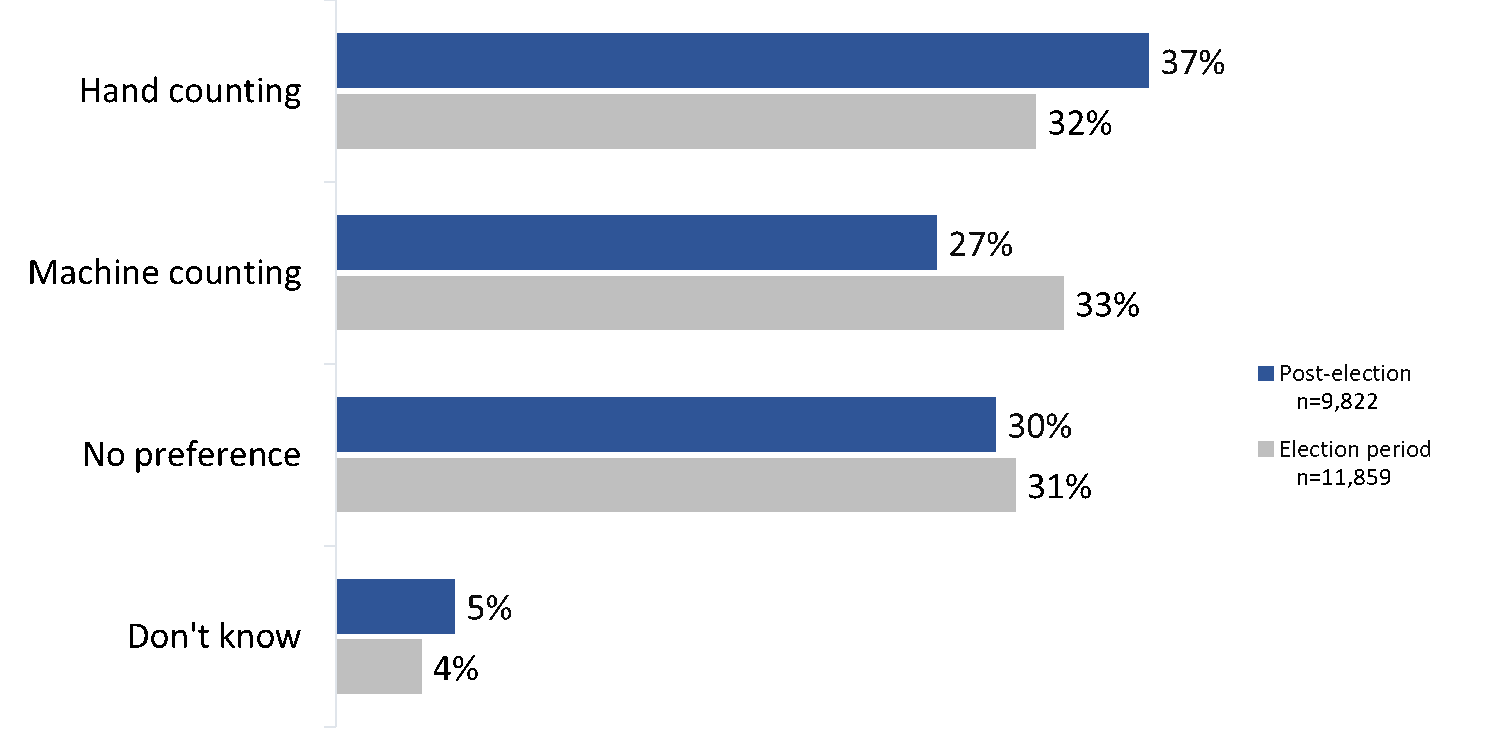
Electors had mixed views on the preferred methods for counting ballots and keeping lists of electors, although preferences for existing methods were higher after the election
Throughout the election period and post-election surveys, electors' views were mixed on whether they prefer to have paper ballots counted by hand or instead scanned into a machine that counts the votes. In the election period survey, nearly identical proportions said they prefer machine counting (33%) and hand counting (32%). However, in the post-election survey, the proportion who preferred hand counting increased to 37%, while those who preferred machine counting decreased to 27% of electors. Another 3 in 10 electors had no preferred vote-counting method in either survey.
Figure 10: Preferred ballot-counting method
Q. In Canadian federal elections, each paper ballot is counted by hand. In some provincial elections, paper ballots are scanned into a machine that counts the votes. Which vote-counting method do you prefer? (Wave 2, Wave 3)
After the election, the proportion of those who prefer hand counting was higher among:
Indigenous electors (45%) versus 37% of non-Indigenous electors.
Electors aged 55 and older (41%) compared with 35% of those aged 18 to 54.
Atlantic Canadians (48%) compared with electors in British Columbia (36%), Alberta (33%), the Prairie provinces (39%), Ontario (32%) and Quebec (43%).
Men (40%) versus 34% of women.
Voters in the 2019 GE (38%) versus 27% of non-voters.
The proportion of those who prefer machine counting was higher among:
New Canadians (41%) versus 27% of other Canadians.
University graduates (29%) versus 26% of those with a college education or some university.
Electors in Ontario (33%), Alberta (29%) and British Columbia (27%) compared with those in Quebec (22%) and the Atlantic provinces (18%).
Non-voters in the 2019 GE (34%) versus 27% of voters.
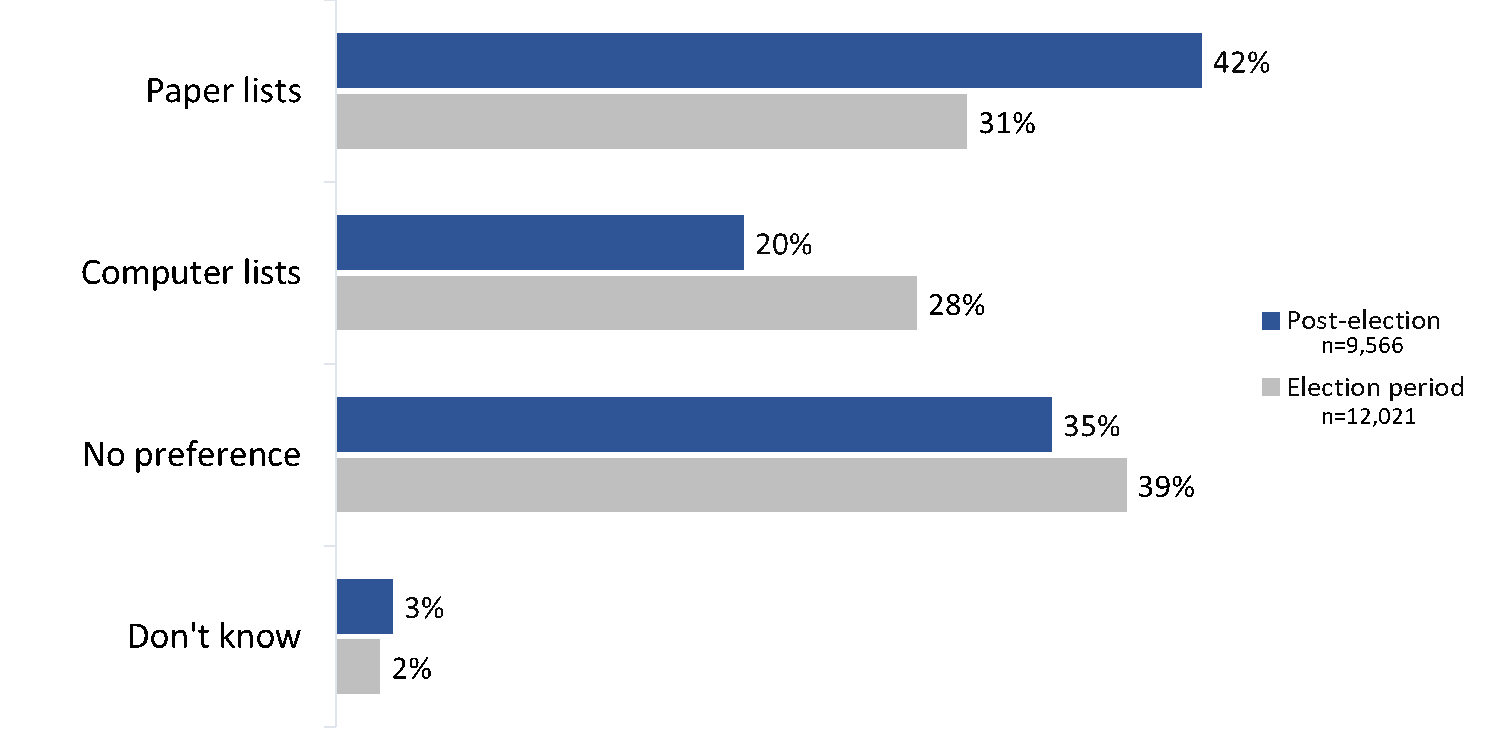
Electors' views were also mixed on whether they prefer paper or computers for the lists used to keep track of electors who voted at the polls. In the election period survey, the largest proportion (39%) said they had no preference compared with 31% who said they preferred paper lists and 28% who preferred computer lists. However, in the post-election survey, the plurality (42%) now preferred paper lists, while the proportion who had no preference decreased to 35%, and those who preferred computer lists decreased to 20% of electors.
Figure 11: Preferred method of keeping lists of electors at the polls
Q. In a Canadian federal election, workers at the polls use paper lists to see if an elector's name is on the list and to mark them off after they vote. In some provincial elections, poll workers use computers or tablets to electronically look up and mark off electors' names. Which method do you prefer? (Wave 2, WAve 3)
After the election, the proportion of those who preferred paper lists was higher among:
Electors with a high school or less education (54%) compared with those with some post-secondary or college (42%) and those who have completed university (39%).
Indigenous electors (48%) versus 42% of non-Indigenous electors.
Men (45%) versus 40% of women.
Electors aged 55 and older (48%) versus 38% of electors aged 18 to 54.
The proportion of those who preferred computer lists was higher among:
Electors aged 18 to 24 (27%) versus 19% of those aged 25 and older.
New Canadians (30%) versus 20% of other Canadians.
Electors in Ontario (22%), Alberta (21%) and Quebec (20%) compared with those in British Columbia (17%), the Prairie provinces (17%) and the Atlantic provinces (16%).
Non-voters in the 2019 GE (29%) versus 19% of voters.
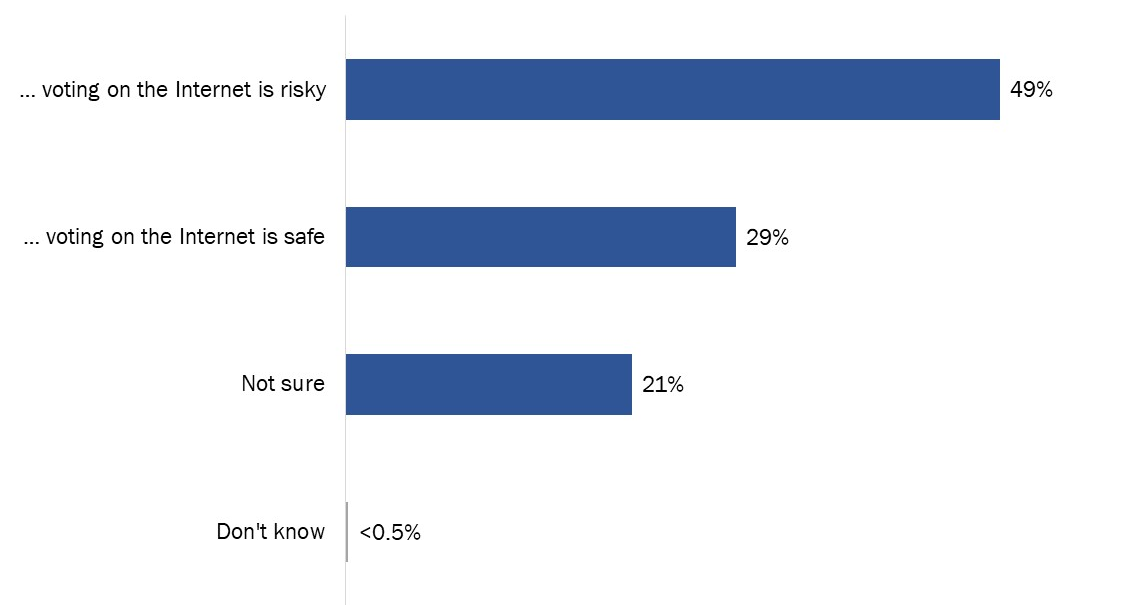
Nearly half consider voting on the Internet to be risky
Respondents in the pre-election survey were asked whether they tend to view voting on the Internet as risky or safe. Nearly half (49%) said that “voting on the Internet is risky” comes closest to their own view, 29% said “voting on the Internet is safe,” and 21% said they were unsure. Based on the 2015 CES, the view that Internet voting is risky decreased slightly compared with after the 2015 GE, when 55% said risky, 26% said safe and 19% were not sure.
Figure 12: Views on voting on the Internet as risky versus safe
Q. Which statement comes closest to your own view? Base: n=7,184; Split sample (Wave 1)
The following were more likely to hold the view that voting on the Internet is risky:
Indigenous electors (55%) versus 49% of non-Indigenous electors.
Electors with a high school or less education (55%) compared with those with a college education or some post-secondary (50%) and those who have completed university (46%).
Canadians 18 to 24 years of age (54%) versus 49% of Canadians aged 25 and older.
Voters in the 2015 GE (50%) versus 39% of non-voters who were eligible to vote.
Electors in Alberta (56%), British Columbia (53%), the Prairie provinces (52%) and the Atlantic provinces (55%) compared with those in Ontario (46%) and Quebec (46%).
The following were more likely to view voting on the Internet as safe:
Men (32%) compared with 27% of women.
Electors in Ontario (34%) compared with those in Quebec (28%), British Columbia (26%), Alberta (24%) and the Atlantic provinces (25%).
The following were more likely to be unsure whether voting on the Internet is risky or safe:
Women (24%) compared with 19% of men.
Electors in Quebec (26%) versus a range of 19% to 21% of electors in the other provinces.
Just over half agree that voting over the Internet should be an option in federal elections
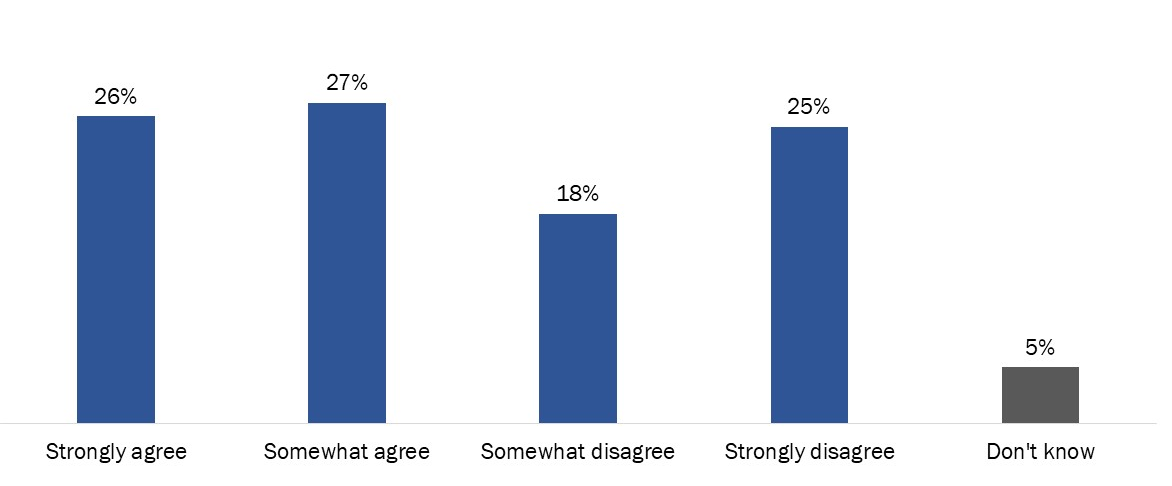
In the pre-election survey, a majority of respondents (53%) agreed that Canadians should have the option to vote over the Internet in federal elections. These respondents were almost evenly divided between those who strongly agreed with voting over the Internet (26%) and those who somewhat agreed (27%). A sizable minority disagreed either somewhat (18%) or more often strongly (25%). These views are slightly more polarized compared with the 2015 CES, when only 15% strongly agreed that Internet voting should be an option, while 30% somewhat agreed, 27% somewhat disagreed and only 16% strongly disagreed.
Figure 13: Views on whether voting over the Internet should be an option in federal elections
Q. Do you strongly agree, somewhat agree, somewhat disagree or strongly disagree with the following statement? Canadians should have the option to vote over the Internet in federal elections. Base: n=7,211; Split sample (Wave 1)
The following were more likely to agree that voting over the Internet should be an option in federal elections:
Electors aged 18 to 54 (55%) compared with those aged 55 and older (49%).
New Canadians (65%) and immigrants who became citizens before the 2015 GE (58%) compared with non-immigrants (51%).
Those who were eligible but did not vote in the 2015 GE (59%) compared with those who voted (51%).
Those who view voting as more of a choice (58%) compared with more of a duty (51%).
Electors in Ontario (58%), the Atlantic provinces (57%) and Quebec (53%) compared with those in British Columbia (46%), Alberta (44%) and the Prairie provinces (42%).
4. Protection of Personal Information
This section of the report presents findings on electors' views of personal information, including trust in Elections Canada to protect the personal information of Canadians and views on political parties' collection and use of Canadians' personal information.
A substantial majority trust Elections Canada to protect personal information
Approximately 8 in 10 (83%) respondents agreed that EC can be trusted to protect the personal information of Canadians. Half (50%) said they somewhat agree, and one third (33%) said they strongly agree. Of the remaining respondents, 13% said they somewhat or strongly disagree that EC can be trusted to protect the personal information of Canadians.
Figure 14: Trust in Elections Canada to protect the personal information of Canadians
Q. Elections Canada keeps the name, address and date of birth of all Canadians who are registered to vote. This information is shared with federal political parties every year and when there is an election. Do you strongly agree, somewhat agree, somewhat disagree or strongly disagree with the following statements? Base: n=49,993 (Wave 1)
The following were less likely to trust EC to protect personal information:
Indigenous electors (75%) versus 83% of non-Indigenous electors.
Non-binary/transgender electors (74%) compared with female (82%) and male (84%) electors.
Those aged 18 to 24 (80%) compared with Canadians aged 25 and older (83%).
NEET youth (73%) versus 82% of youth attending school and 84% of youth working full-time.
Those who did not vote in the 2015 GE (68%) versus 84% of voters.
The likelihood of trusting EC to protect the personal information of Canadians also decreased as the severity of a disability increased, from 84% of persons with no disability to 73% of those with a severe or very severe disability.
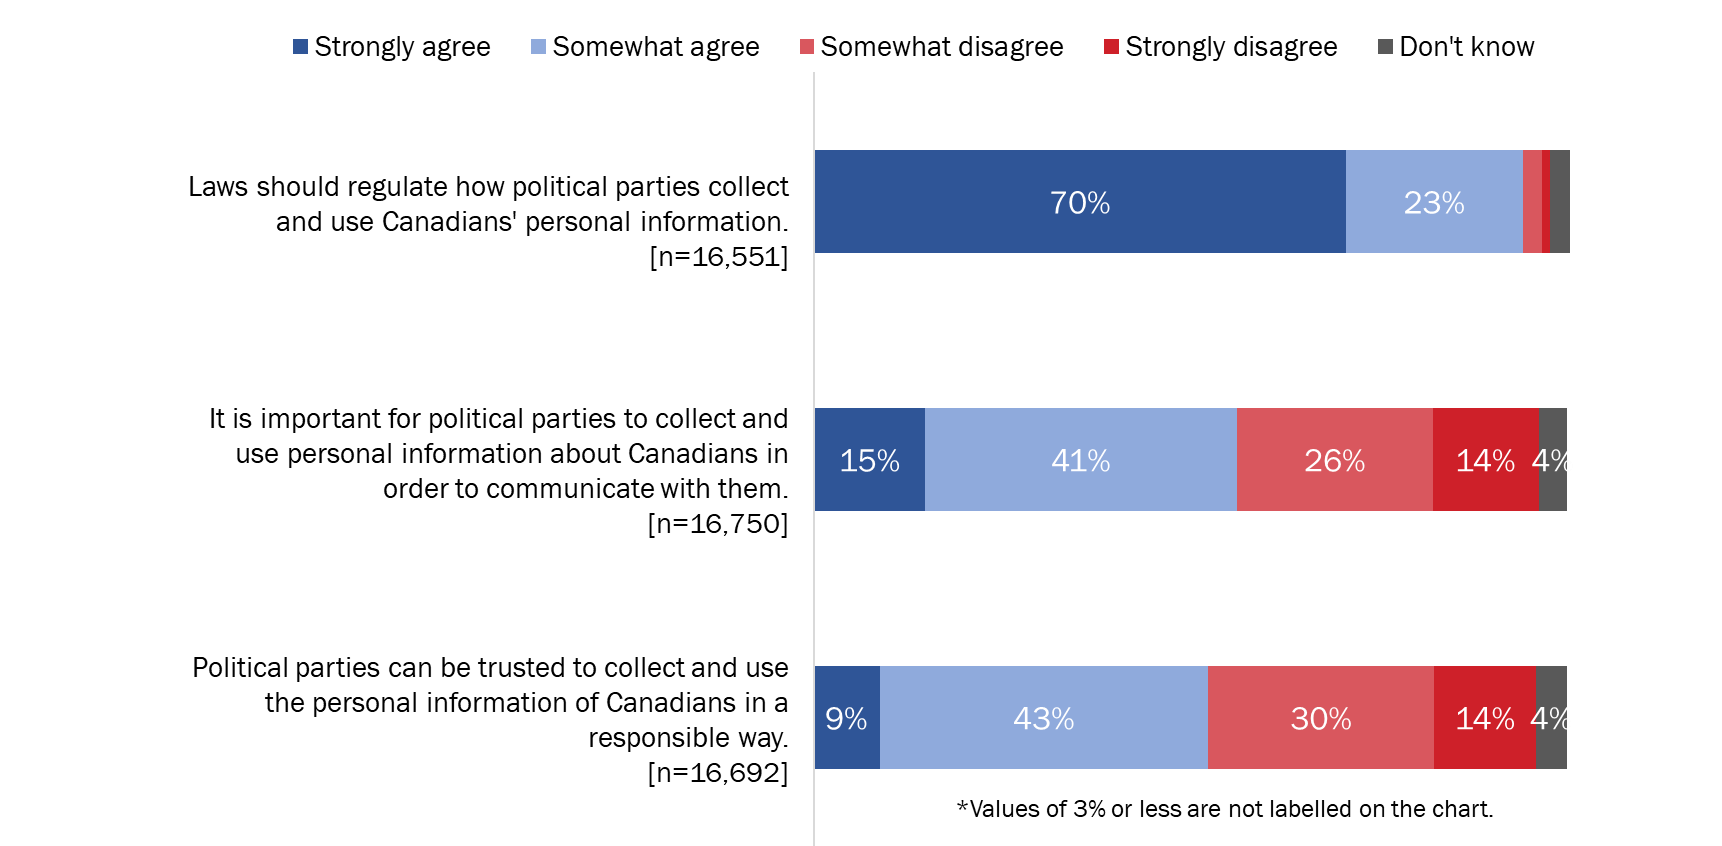
A large majority favour laws to regulate how parties collect and use 'personal information, even while a majority agree it is important for parties to be able to do so
More than 9 in 10 (93%) respondents agreed that laws should regulate how political parties collect and use Canadians' personal information, including 70% who strongly agreed. Smaller majorities agreed, more often somewhat than strongly, that it is important for political parties to collect and use personal information about Canadians in order to communicate with them (56% agreed, 15% strongly agreed) and agreed that political parties can be trusted to collect and use the personal information of Canadians responsibly (51% agreed, 9% strongly agreed).
Figure 15: Views on political parties' collection and use of personal information
Q. Elections Canada keeps the name, address and date of birth of all Canadians who are registered to vote. This information is shared with federal political parties every year and when there is an election. [Phone] Do you strongly agree, somewhat agree, somewhat disagree or strongly disagree with the following statements? Base: all respondents; Split samples (Wave 1)
Canadians aged 25 and older (94% versus 88% of Canadians 18 of 24 years of age) and voters in the 2015 GE (95% versus 85% of non-voters) were more likely to agree that laws should regulate how political parties collect and use Canadians' personal information.
The following were more likely to agree that it is important for political parties to collect and use personal information about Canadians in order to communicate with them:
Canadians 18 to 24 years of age (61%) versus 55% of Canadians aged 25 and older.
Voters in the 2015 GE (56%) versus 50% of non-voters.
The following were more likely to agree that political parties can be trusted to collect and use the personal information of Canadians in a responsible way:
Electors aged 75 and older (60%) and those 18 to 24 (57%) compared with 25- to 34-year-olds (51%), 35- to 54-year-olds (49%) and 55- to 74-year-olds (53%).
Women (55%) versus 49% of men and 33% of non-binary/transgender electors.
Those interested in politics (53%) compared with those not interested (50%).
Voters in the 2015 GE (53%) versus 44% of non-voters.
The following were more likely to disagree that political parties can be trusted with personal information:
Electors in Alberta (50%) and British Columbia (48%) compared with those in other provinces (a range of 36% to 45%).
Non-binary/transgender electors (65%) compared with men (48%) and women (39%).
5. Political Communications
This section of the report presents electors' views on, and experiences with, being contacted by political parties and candidates during the 2019 GE.
Most electors think it is appropriate for parties and candidates to contact them in person or by mail
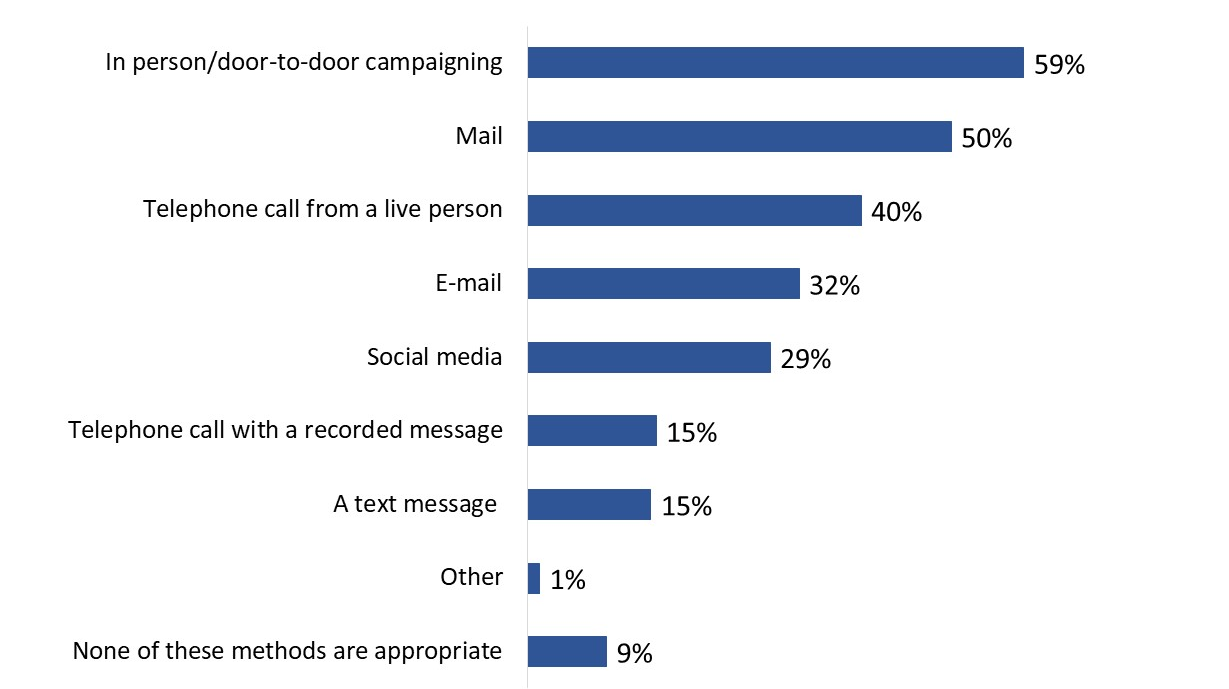
In the election period survey, 6 in 10 (59%) electors said they consider it appropriate for parties and candidates to contact them in person, such as when door-to-door campaigning; half (50%) think it appropriate to be contacted by mail. Phone contact was much more likely to be considered appropriate if the call comes from a live person (40%) rather than a recorded message (15%) or text message (15%). Around 3 in 10 consider it appropriate to be contacted using online methods, whether by email (32%) or social media (29%). Nearly 1 in 10 (9%) thought that none of these contact methods are appropriate.
Figure 16: Ways viewed as appropriate for political entities to contact electors
Q. What do you think are appropriate ways for political parties or candidates to contact you during an election? [Multiple responses accepted.] Base: n=23,880 (Wave 2) DK/NR: 4%
Canadians aged 18 to 24 and 25 to 34 were more likely than those aged 35 and older to think that it is appropriate to be contacted by electronic methods, including through social media (42% and 36% versus 25%, respectively), by email (40% and 39% versus 30%) and text message (21% versus 20% versus 13%).
Men were more likely than women to think it appropriate to be contacted by various methods, most notably in person (63% versus 55%) or by email (37% versus 28%).
New Canadians were less likely than other Canadians to think it is appropriate to be contacted in person (53% versus 60%), by mail (45% versus 51%) or on a live telephone call (35% versus 40%).
Electors with a severe or very severe disability were less likely than electors with no disability to think it is inappropriate to be contacted by various methods, most notably in person (50% versus 60%) or on a live telephone call (34% versus 41%).
Those who said they were unlikely or certain not to vote in the 2019 GE were more likely to say that none of these contact methods are appropriate (26%) compared with 9% of those who were certain/likely to vote during the election period and 7% of those who voted early in the 2019 GE.
The majority of electors said they were contacted directly by a political party or candidate during the election, most often in person or by telephone
In the post-election survey, over half (54%) of respondents said that they were contacted directly by a political party or candidate during the 2019 GE. footnote 1
The following groups were less likely to say that they had been contacted by a party or candidate:
New Canadians (43%%) compared with other Canadians (54%).
NEET youth (41%) and youth working full-time (46%) compared with youth attending school (54%).
The following were more likely to have been contacted by a party or candidate:
Electors aged 55 and older (61%) compared with those aged 18 to 54 (49%).
Electors in Ontario (62%) compared with other provinces (a range of 40% to 58%).
Electors with a university education (59%) compared with those with college or some post-secondary (52%) or high school or less (45%).
Voters in the 2019 GE (56%) compared with non-voters (35%).
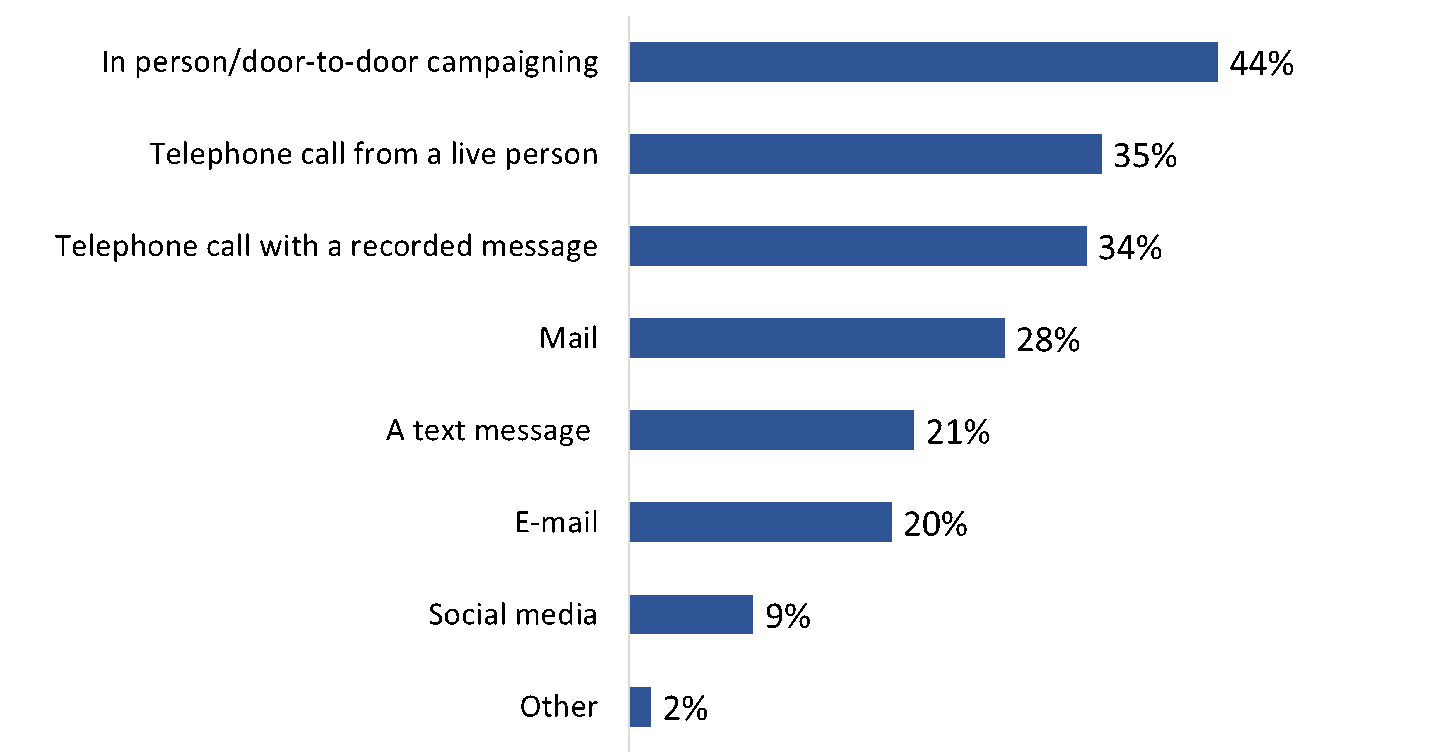
Among those who were contacted by a political party or candidate during the election, electors most often said they had been contacted in person, such as during door-to-door campaigning (44%), followed by a telephone call, including from a live person (35%) or with a recorded message (34%). Over one quarter (28%) said they had been contacted by mail, while 1 in 5 said they had received a text message (21%) or an email (20%). Nearly 1 in 10 (9%) said they had been contacted through social media.
Figure 17: Ways in which electors were contacted by parties or candidates during the election
Q. How did the political party or candidate contact you? [Multiple responses accepted.] Base: n=15,295: those who had been contacted during the election (Wave 2 + Wave 3)
This section of the report presents electors' views on issues that could impact the integrity of an election and trust in the electoral system: concerns about the potential impact of voter fraud and obstruction, trust in sources of news information, electors' exposure to disinformation about the voting process and concerns about the impact of different forms of electoral interference on the outcome of the 2019 GE.
Two thirds of electors think it would be a major problem if an eligible voter was prevented from voting; more than half think it would be a major problem if an ineligible voter was able to vote
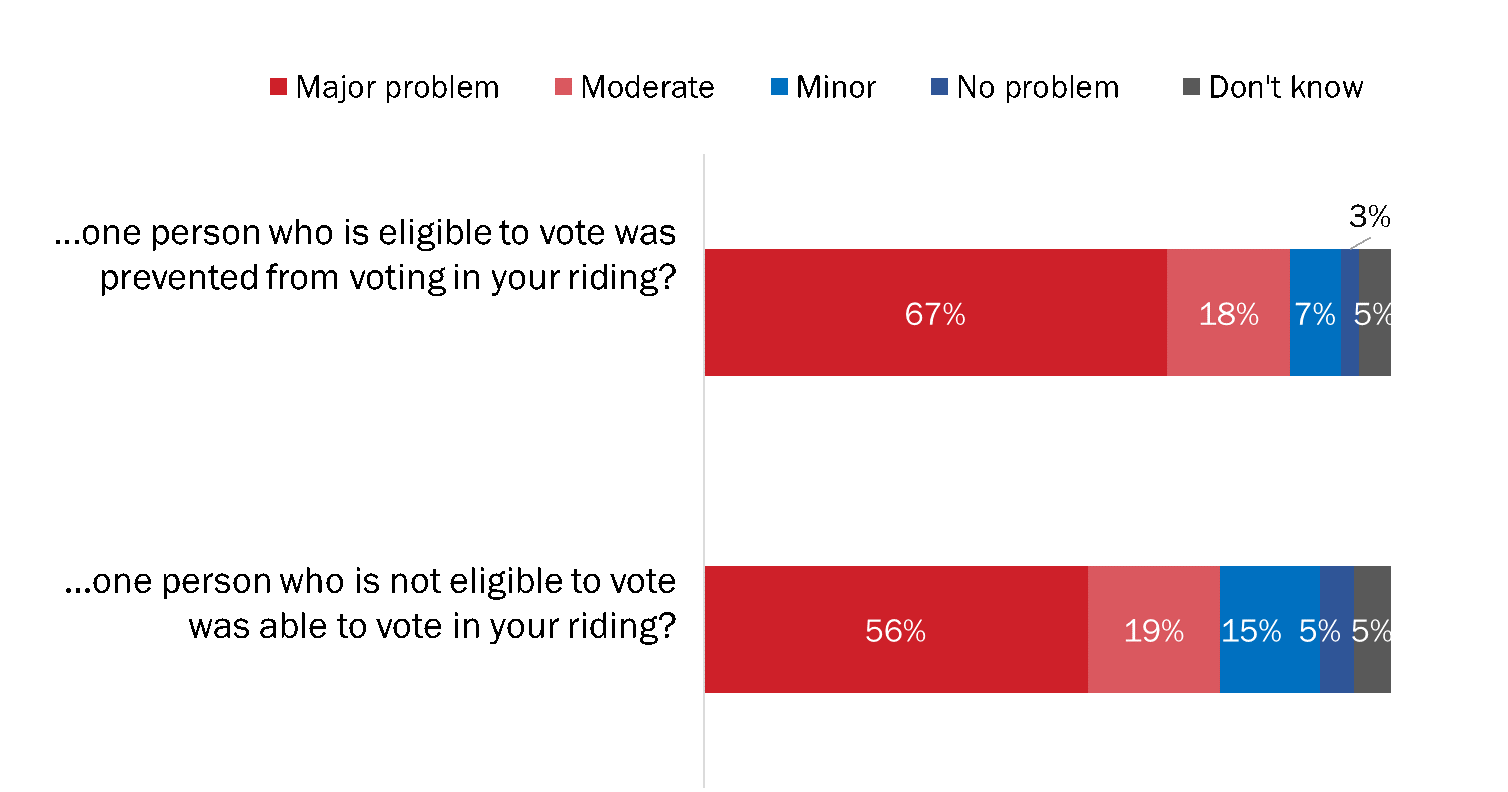
More than 8 in 10 (85%) respondents said it would be at least a moderate problem if one person who was eligible to vote were prevented from voting in their riding, with two-thirds (67%) saying it would be a major problem. By comparison, three quarters indicated that it would be at least a moderate problem if one person ineligible to vote in a riding were able to do so, with 56% saying it would be a major problem.
Figure 18: Views on the potential impact of voter fraud
Q. Thinking about the election in your riding, how much of a problem would it be if … Base: n=23,880 (Wave 2)
The following were more likely to consider it a problem if one eligible voter were prevented from voting:
Youth attending school (89%) and youth working full-time (86%) compared with NEET youth (74%).
Non-binary/transgender electors (96%) compared with men (86%) and women (85%).
Voters in the 2015 GE (87%) versus 69% of those who were eligible but did not vote.
Those who voted early in the 2019 GE (92%) or were certain/likely to vote (86%) compared with those who were unlikely/certain not to vote (56%).
The likelihood of considering this to be a problem increased with education level, from 76% of electors with a high school or less education to 89% of electors who had completed university.
The following were more likely to consider it a problem if one ineligible person was able to vote:
Men (77%) compared with women (73%) and non-binary/transgender (56%) electors.
College- and university-educated electors (76%) versus those with high school or less (70%).
Youth working full-time (69%) compared with NEET youth (60%).
Electors in Quebec (84%) compared with those in other provinces (a range of 70% to 75%).
Voters in the 2015 GE (77%) versus 61% of non-voters.
Those who voted early in the 2019 GE (78%) or were certain/likely to vote (76%) compared with those who were unlikely/certain not to vote (52%).
In addition, the likelihood of considering this to be a problem declined as the severity of a disability increased, from 77% of persons with no disability to 68% of those with a severe/very severe disability, and increased with electors' age, from 64% of 18- to 24-year-olds to 81% of electors aged 75 and older.
Many more electors trust traditional journalism than social media for news information
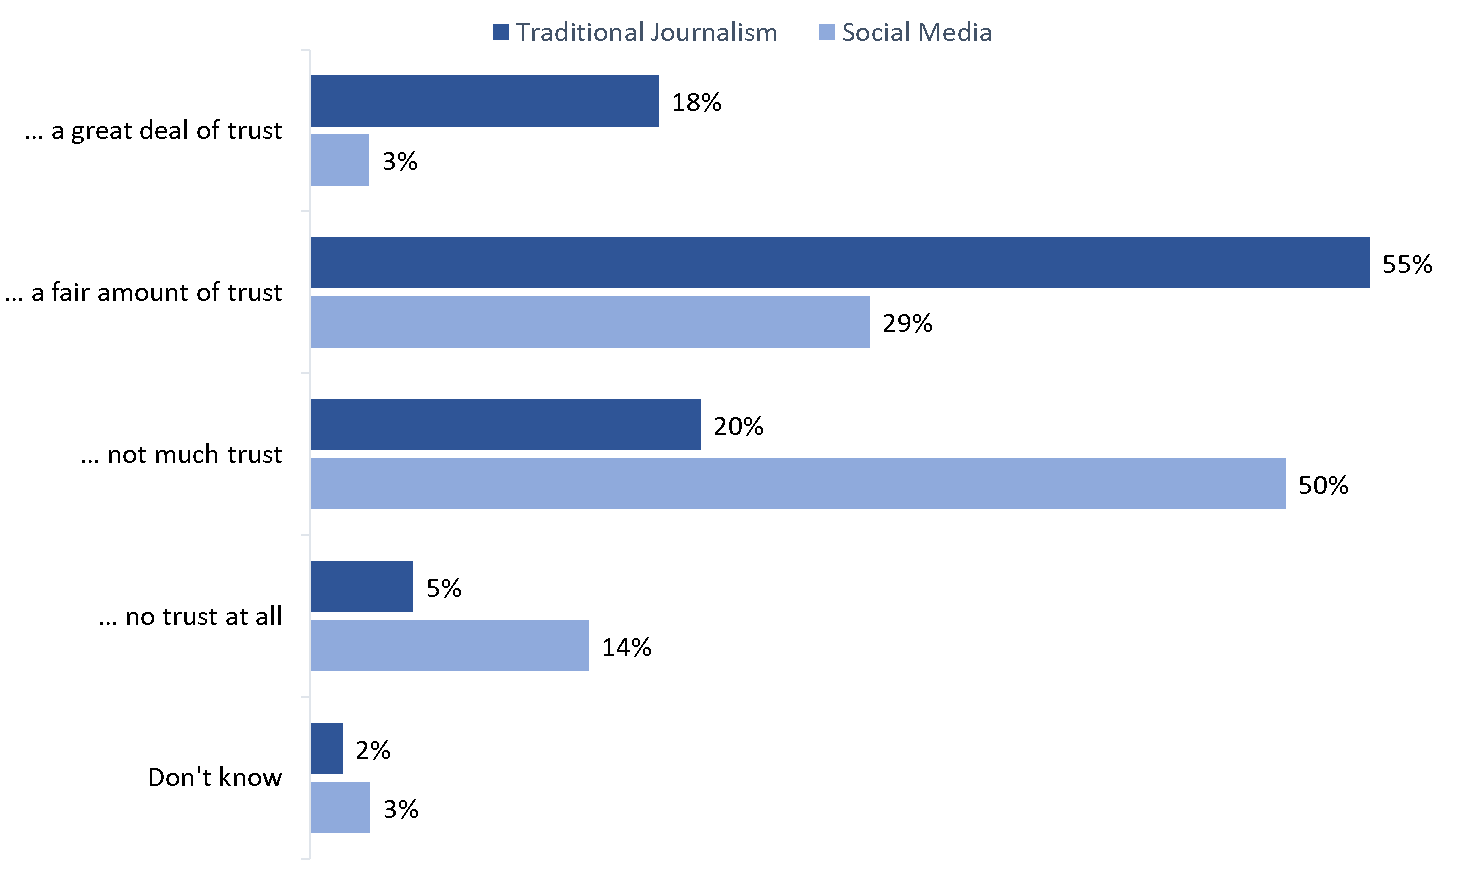
Nearly three quarters (73%) of respondents in the pre-election survey indicated that they trust news information from traditional sources of journalism, although respondents were three times more likely to say they have a fair amount of trust (55%) than a great deal of trust (18%). One-quarter (25%) of respondents said they have not much trust (20%) or no trust at all (5%) in news information provided by traditional journalism.
Considerably fewer respondents said they trust social media for news information. Approximately one third said they trust news information posted on social media either a fair amount (29%) or a great deal (3%). By contrast, nearly two thirds said they have not much trust (50%) or no trust at all (14%) in news information posted on social media.
Figure 19: Trust in sources of news information
Q. Would you say that you have a great deal of trust, a fair amount, not much or no trust at all in the following sources of news information? a) Traditional journalism, which includes mainstream media outlets available in print, on TV and online; b) News information posted on social media. This does not include people's personal opinions. Base: n=49,993 (Wave 1)
The following were less likely to trust news information provided by traditional journalism:
Indigenous electors (65%) compared with 73% of non-Indigenous electors.
Non-binary/transgender (49%) electors and men (70%) compared with women (76%).
Youth attending school (67%) and working full-time (66%) compared with NEET youth (60%).
Electors in the Prairie provinces (65%) and Alberta (66%) compared with those in other provinces (a range of 71% to 78%).
Those uninterested in politics (65%) compared with 75% of those who are interested in politics.
Non-voters in the 2015 GE (59%) compared with 75% of voters.
The likelihood of trusting news information provided by traditional journalism increased with age, from 64% of 18- to 24-year-olds to 80% of electors aged 75 and older, and with education, from 66% of those with a high school or less education to 79% of those who have completed university.
The following were more likely to trust news information posted on social media:
Canadians 18 to 24 years of age (42%) compared with 31% of Canadians aged 25 and older.
Women (35%) compared with men (29%) and non-binary/transgender electors (28%).
Youth attending school (43%) versus 34% of youth working full-time and 39% of NEET youth.
New Canadians (42%) versus 34% of immigrants who became citizens before the 2015 GE and 31% of non-immigrants.
Limited recall of false information about the voting process during the election period
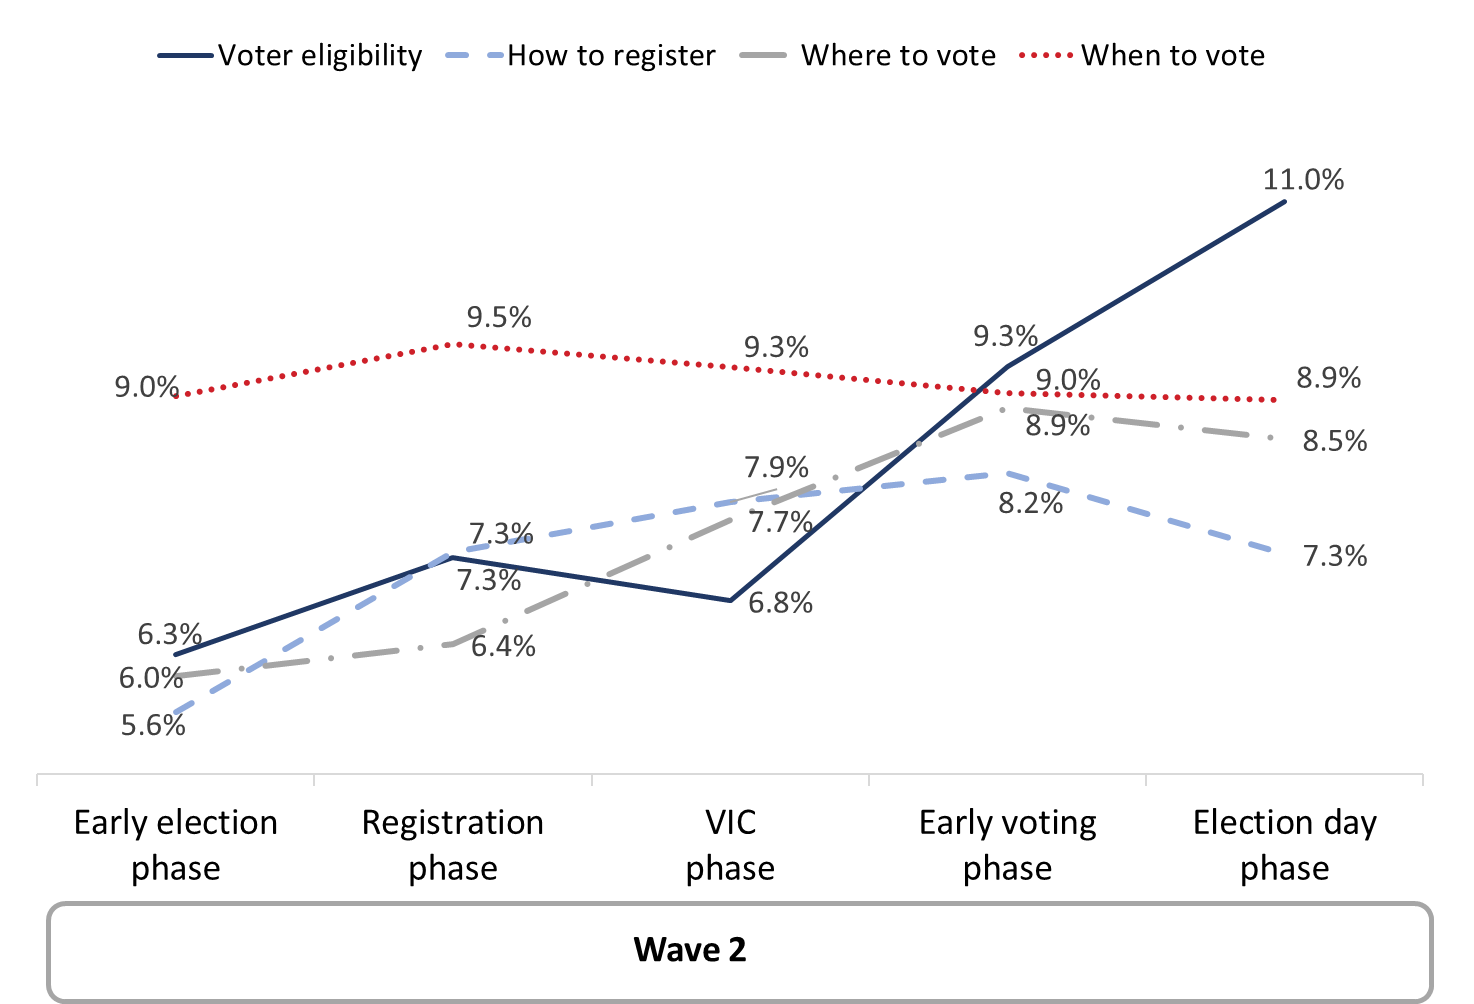
Relatively few respondents said they recalled hearing or seeing false information related to the voting process since the beginning of the election campaign. The proportion of electors who recalled false information about when to vote was stable at around 9% from the earliest phase of the election period survey through to the final phase leading up to election day. Recall of false information about other aspects of the voting process, including about who is eligible to vote, how to register and where to vote, were each mentioned by only 6% of electors in the early election phase, but generally increased slightly over the election period: by the election day phase, recall of false information about who is eligible to vote was highest at 11% of electors, followed by where to vote at 9%, and how to register at 7%.
Figure 20: Recall of false information about voting during the election period
Q. Since the beginning of the election campaign, do you recall seeing or hearing any false information about …. who is eligible to vote? how to register? where to vote? when to vote? Base: n=23,880 (Wave 2)
Across the election period as a whole, some groups were more likely to recall being exposed to false information about each of these aspects of the voting process. Specifically, recall of exposure to false information during the election was higher among:
Indigenous electors, compared with non-Indigenous electors, for false information about:
Who is eligible to vote (16% versus 8%)
How to register (13% versus 7%)
Where to vote (13% versus 7%)
When to vote (14% versus 8%)
Electors with a severe/very severe disability, compared with electors with a mild/moderate disability and with no disability, for false information about:
Who is eligible to vote (12% versus 8%)
How to register (11% versus 7%)
Where to vote (11% versus 7%)
When to vote (13% versus 9%)
Electors aged 18 to 54, compared with those aged 55 and older, for false information about:
Who is eligible to vote (10% versus 5%)
How to register (9% versus 5%)
Where to vote (9% versus 5%)
When to vote (11% versus 6%)
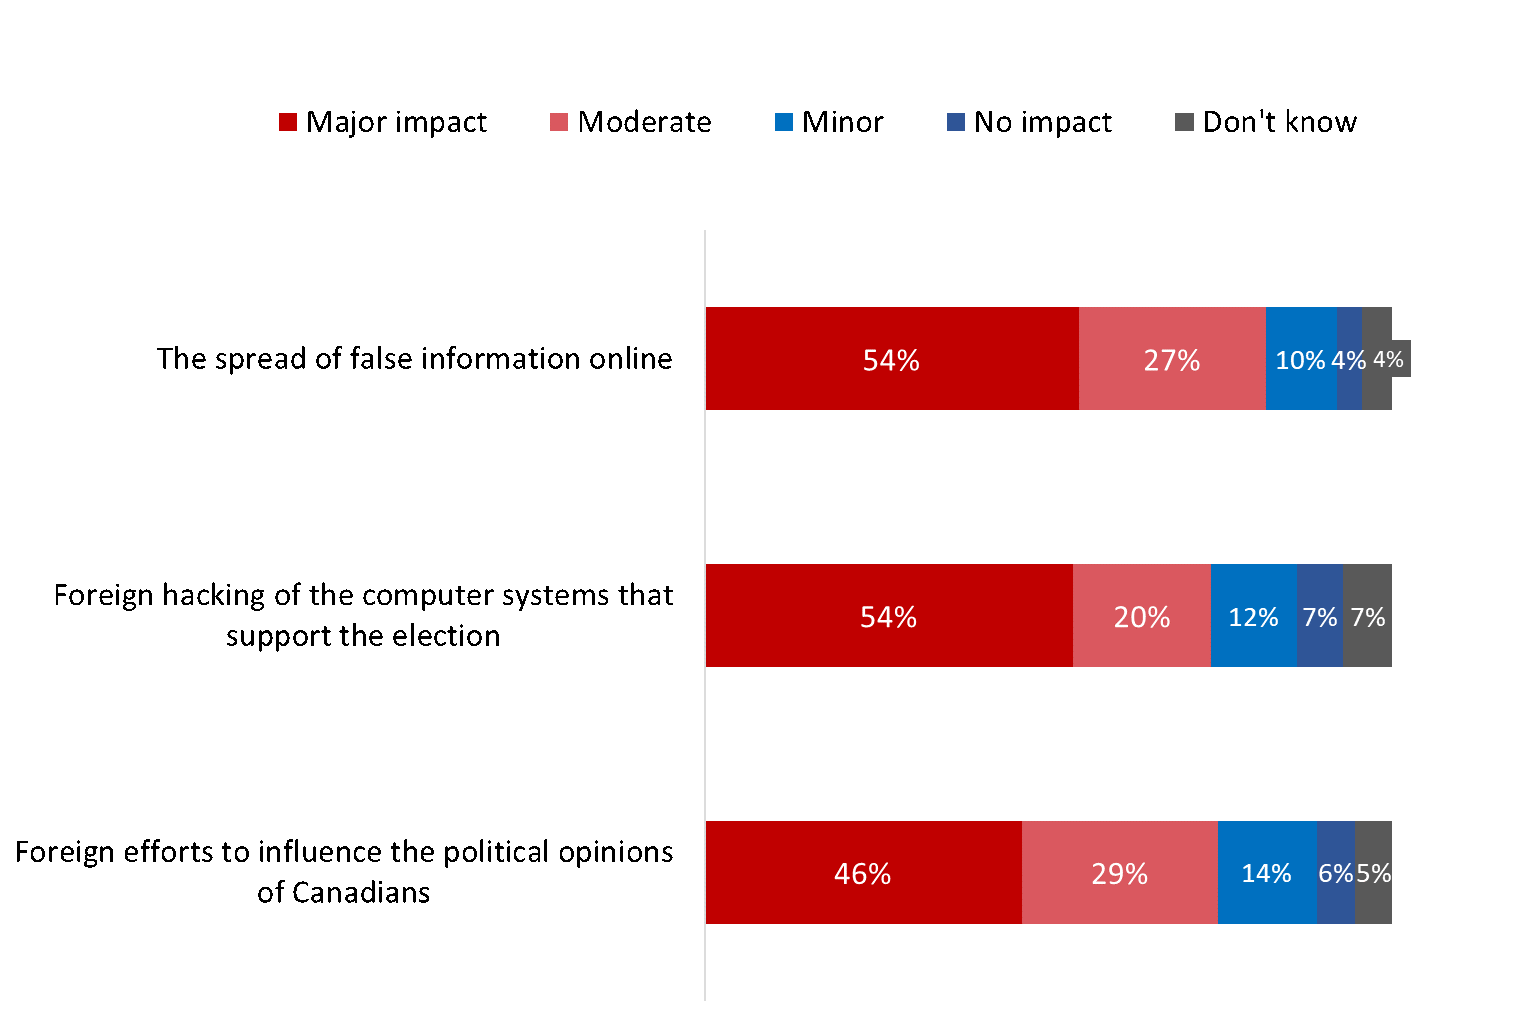
Majorities had concerns that the spread of false information, foreign influence and foreign interference could impact the outcome of the election
Throughout the election period, respondents were asked whether they thought different types of electoral interference could have any potential impact on the outcome of the 2019 GE.
Eight in 10 (82%) electors were concerned that the spread of false information online could potentially have a moderate or greater impact on the outcome of the election, including 54% who thought it could have a major impact. Three quarters of electors thought that there could be a moderate or greater impact on the election outcome from hacking by foreign countries or groups into the computer systems that support the election (74%, including 54% who thought it could have a major impact), and from foreign countries or groups using social media and other means to influence the political opinions of Canadians (75%, including 46% who thought it could have a major impact).
Figure 21: Election-period concerns about the potential impact of electoral interference on the election outcome
Q. Based on what you have seen or heard recently, what impact, if any, do you think the following could have on the outcome of the election? Hacking by foreign countries or groups into the computer systems that support the election/Foreign countries or groups using social media and other means to influence the political opinions of Canadians/The spread of false information online. Base n=23,880 (Wave 2)
The following were more likely to think that the spread of false information online could have a major impact on the outcome of the election:
Indigenous electors (58%) compared with non-Indigenous electors (54%).
Electors aged 18 to 24 years (59%) compared with those aged 25 years or more (54%).
Women (59%) and non-binary/transgender electors (66%) compared with men (50%).
New Canadians (57%) compared with other Canadians (54%).
Those who voted early in the 2019 GE (59%) or were certain/likely to vote (55%) compared with those who were unlikely/certain not to vote (37%).
The following were more likely to think foreign hacking could have a major impact on the outcome of the election:
Electors aged 55 years or more (63%) compared with electors aged 18 to 54 (47%).
Women (58%) compared with men (49%) and non-binary/transgender electors (44%).
New Canadians (57%) compared with other Canadians (53%).
Electors in Quebec (65%) compared with those in other regions of Canada (a range of 46% to 54%).
Those who voted early in the 2019 GE (53%) or were certain/likely to vote (54%) compared with those who were unlikely/certain not to vote (38%).
The following were more likely to think foreign influence efforts could have a major impact on the outcome of the election:
Electors aged 55 years or more (51%) compared with electors aged 18 to 54 (42%).
Women (49%) and non-binary/transgender electors (55%) compared with men (43%).
Electors in Quebec (50%) compared with those in other provinces (a range of 41% to 47%).
Those who voted early in the 2019 GE (49%) or were certain/likely to vote (47%) compared with those who were unlikely/certain not to vote (29%).
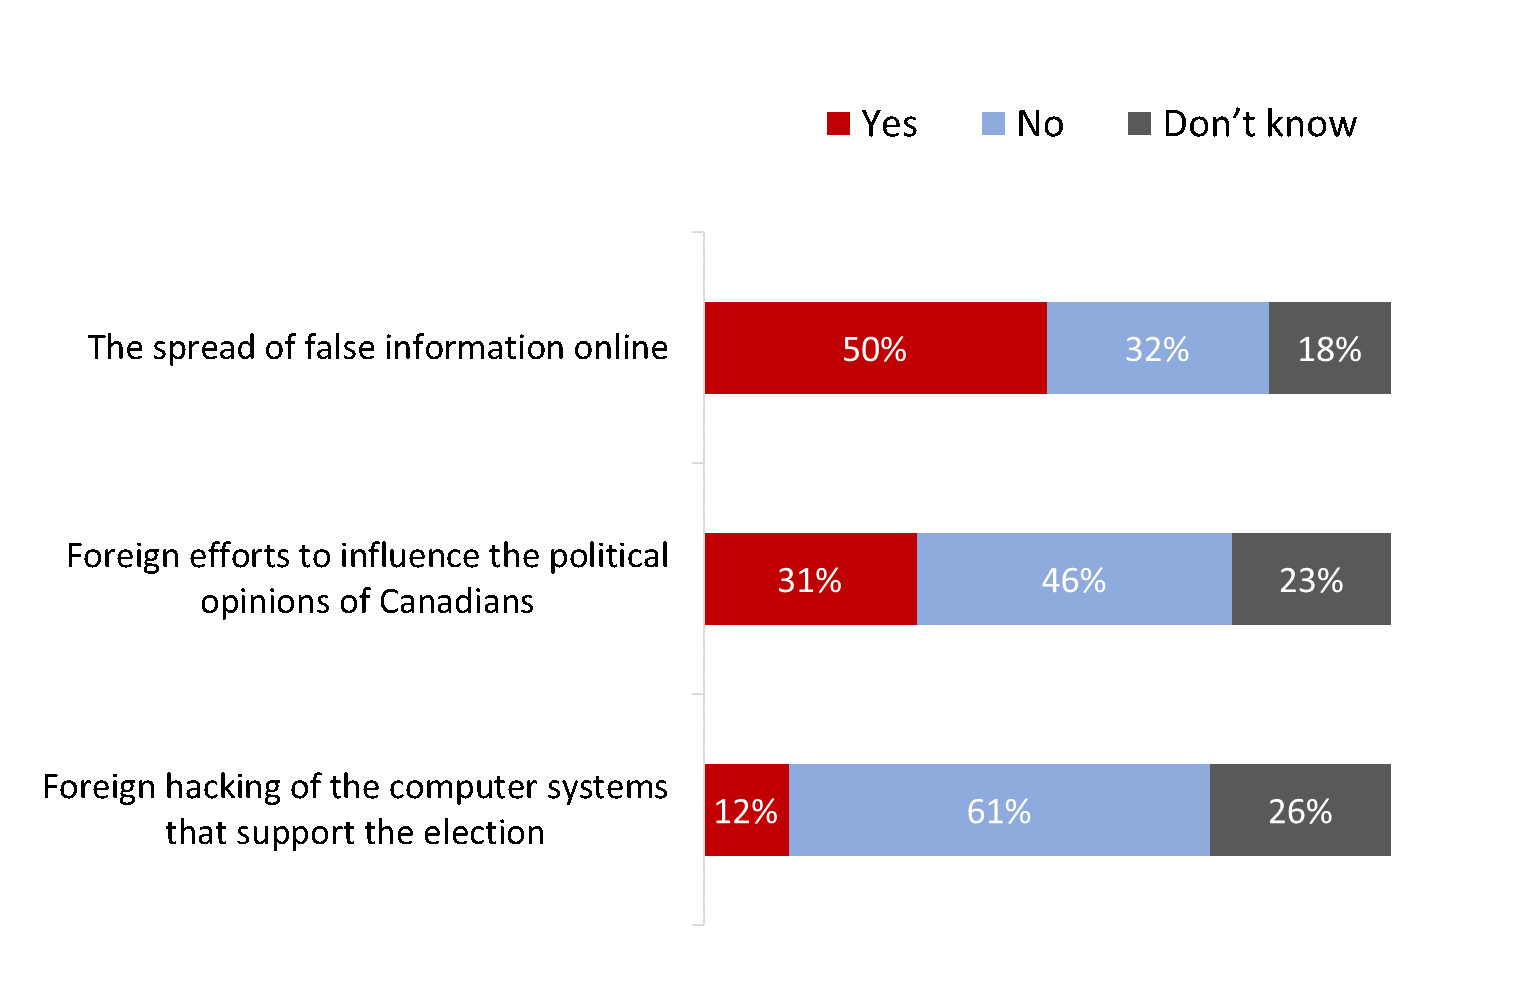
More thought the spread of false information online was a problem during the election compared with foreign influence or hacking of election systems
In the post-election survey, respondents were asked whether they thought different types of electoral interference were actually a problem during the 2019 GE, based on what they had seen or heard recently. Half (50%) of all electors thought the spread of false information online was a problem in the 2019 GE. Three in 10 (31%) electors thought foreign countries or groups using social media and other means to influence the political opinions of Canadians had been a problem in the 2019 GE. A little more than 1 in 10 (12%) electors thought foreign countries or groups hacking into the computer systems that support the election was a problem in the 2019 GE.
Figure 22: Post-election perception that electoral interference was a problem in the GE
Q. Based on what you have seen or heard recently, do you think any of the following were a problem in this election? Hacking by foreign countries or groups into the computer systems that support the election./Foreign countries or groups using social media and other means to influence the political opinions of Canadians./The spread of false information online. Base n=19,411 (Wave 3)
The following were more likely to say that false information was a problem in the election:
Indigenous electors (60%) compared with non-Indigenous electors (50%).
Electors in Alberta (60%) compared with those in other provinces (a range of 36% to 54%).
Voters in the 2019 GE (51%) compared with non-voters (41%).
The likelihood of thinking that false information was a problem in the election decreased as age increased, from 68% of electors aged 18 to 24 to 36% of electors aged 75 or older.
The following were more likely to say that foreign influence efforts had been a problem in the election:
Indigenous electors (40%) compared with non-Indigenous electors (31%).
Electors in Alberta (39%) compared with those in other provinces (a range of 24% to 33%).
Voters in the 2019 GE (32%) compared with non-voters (27%).
The likelihood of thinking that foreign influence was a problem in the election decreased as age increased, from 38% of electors aged 18 to 24 to 21% of electors aged 75 or older.
The following were more likely to say that foreign hacking had been a problem in the election:
Indigenous electors (18%) compared with non-Indigenous electors (12%).
New Canadians (17%) compared with other Canadians (12%).
Non-voters in the 2019 GE (16%) compared with voters (12%).
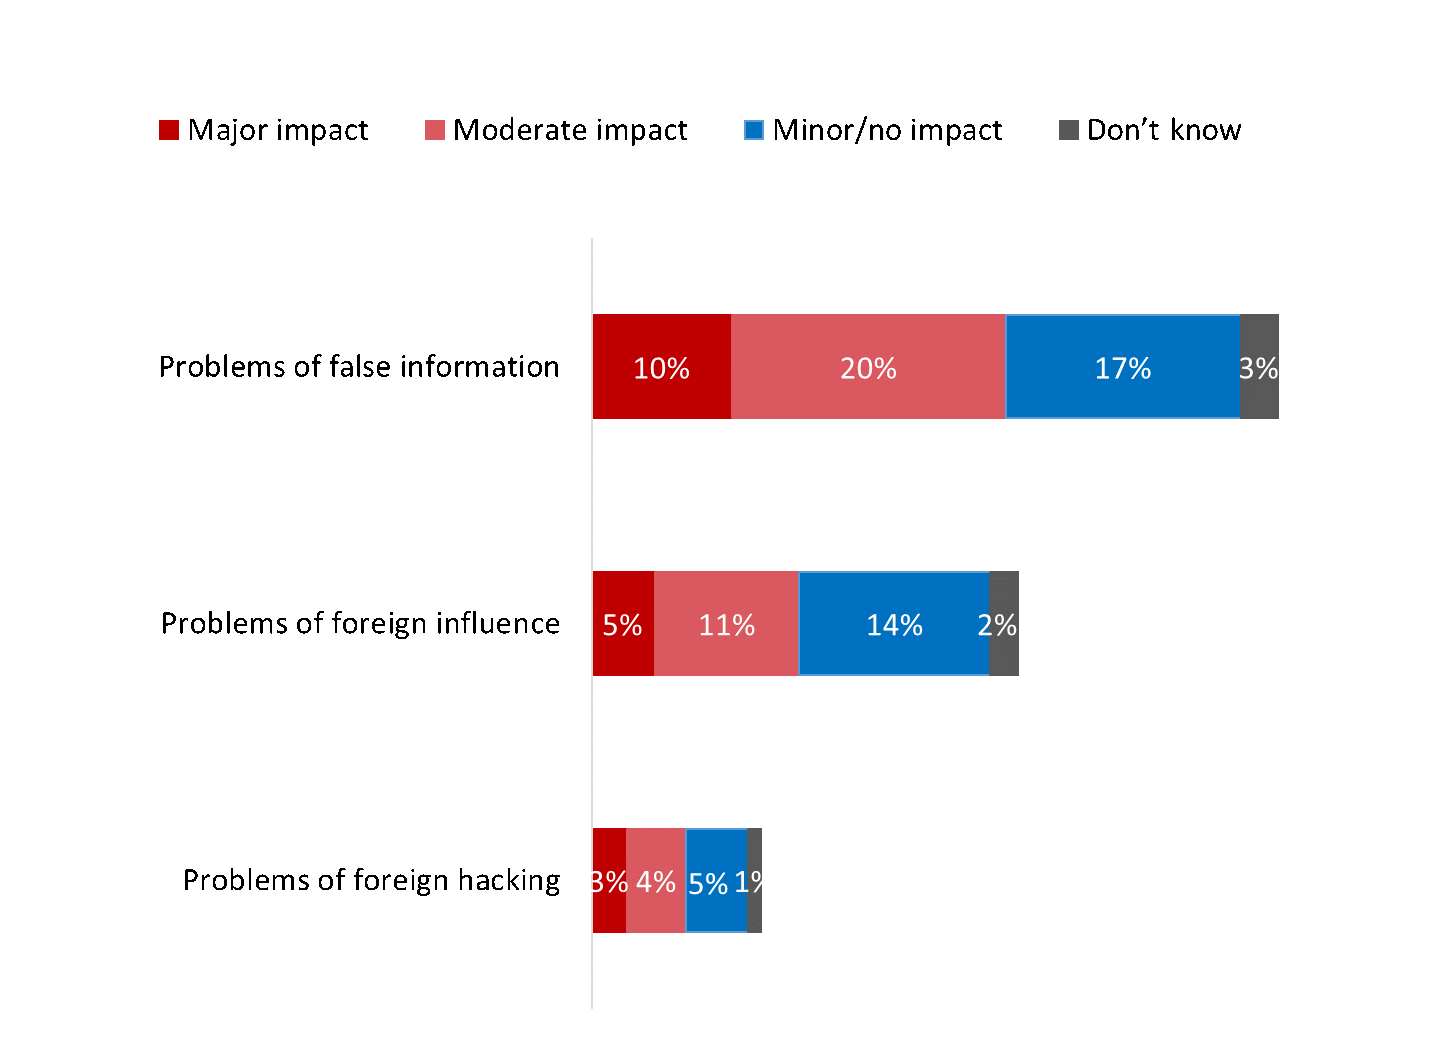
One in 10 electors overall thought problems of false information had a major impact on the election
Respondents were asked what actual impact, if any, they thought problems of electoral interference had on the outcome of the election. footnote 2
Overall, 1 in 10 (10%) electors thought problems of false information had a major impact on the outcome of the election and 20% thought it had a moderate impact. Another 17% of electors said that while they thought false information had been a problem in the election, it had only a minor impact or no impact on the outcome.
In comparison, only 5% of all electors thought problems of foreign influence had a major impact on the outcome of the election, 1% thought it had a moderate impact, and 14% thought foreign influence had been a problem, but it had only a minor impact or no impact.
Only 3% of all electors thought problems of foreign hacking had a major impact on the outcome of the election, 4% thought it had a moderate impact, and 5% thought foreign hacking had been a problem, but it had only a minor impact or no impact.
Figure 23: Proportion of electors who thought problems of electoral interference had an impact on the outcome of the GE
Q. What impact, if any, do you think problems of [foreign hacking/foreign influence/false information] had on the outcome of this election? Base: all respondents (rebased); n=19,411 (Wave 3)
Return to source of footnote 1 Q: During the election, were you directly contacted by a political party or candidate? Base: n=19,410: all respondents (Wave 2 + Wave 3).
Return to source of footnote 2 Only respondents who said that they thought there had been a problem with electoral interference were asked what impact they thought that problem had on the outcome of the election. To allow for comparison of the results across the different forms of electoral interference, the results were rebased to include all electors, including those who did not think there had been a problem. For example, among the 50% of electors who thought false information had been a problem, 20% thought it had a major impact on the outcome of the election. In other words, 10% of all electors thought it had a major impact. In comparison, among the 12% of electors who thought foreign hacking had been a problem, 21% thought it had a major impact; this translates to 3% of all electors who thought problems of foreign hacking had a major impact.