A strong three-quarters majority (76%) were satisfied to some extent with Election Canada's administration of the 44th GE. Close to nine in 10 (87%) were satisfied with the way the returning officer (RO) ran the election in their riding. The small proportion (12%) dissatisfied with their RO mainly felt they had not been sufficiently supported.
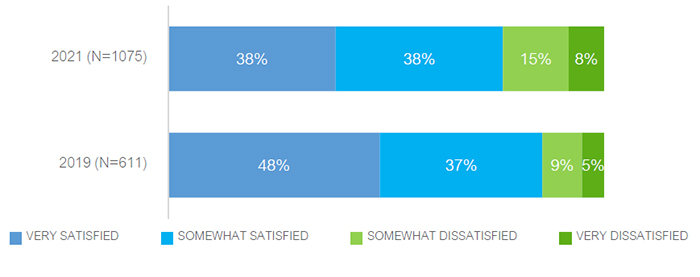
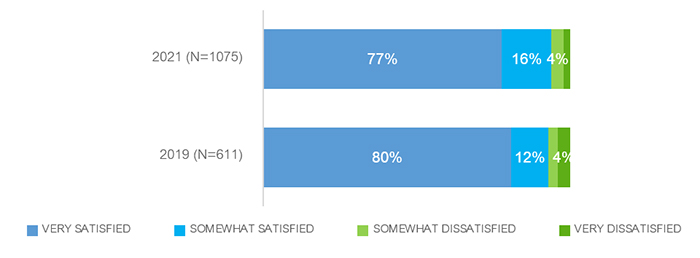
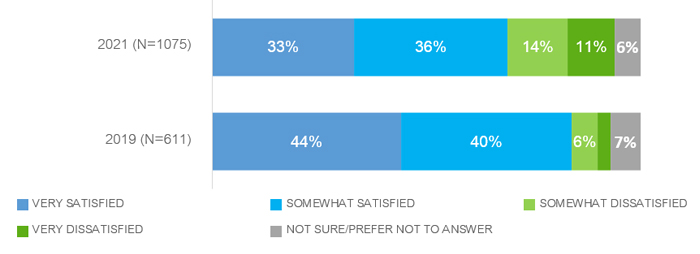
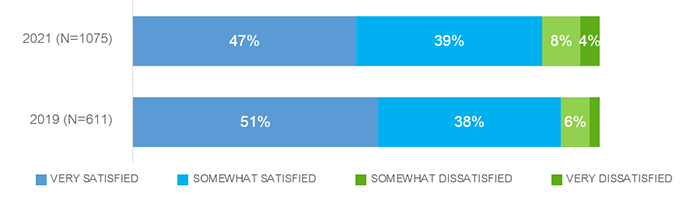
Three-quarters of candidates (76%) expressed some level of satisfaction overall with Elections Canada's administration of the 44th general election, with just under four in 10 (38%) being very satisfied. These proportions are statistically lower than in 2019 among those candidates who were asked this using a four-point scale. A minority of one-quarter are dissatisfied to some extent.
Text version of "Chart 1: Satisfaction with EC's administration of election"
Q1: Overall, how satisfied were you with the way the federal election was administered by Elections Canada in your riding?
Base: all respondents. Includes those respondents (1%) who said "not sure."
The following subgroups were more likely to be satisfied with Elections Canada's administration of the election:
Close to nine in 10 (87%) candidates were satisfied to some extent with how the returning officer ran the election in their riding; almost two-thirds were very satisfied. These results are statistically similar to the 43rd GE.
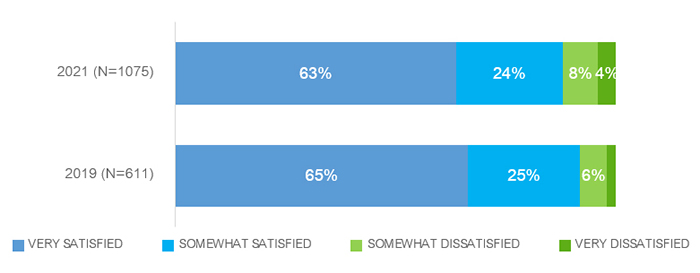
Text version of "Chart 2: Satisfaction with the way the RO ran the election"
Q2: How satisfied were you with the way the returning officer ran it in your riding?
Base: all respondents. Includes those respondents (1%) who said "not sure."
Overall satisfaction with the way the RO ran the election is similar among subgroups of candidates, although the following groups were more likely to be very satisfied:
The one in 10 (12%) who expressed dissatisfaction with the way the RO ran the election in their riding (n=130) were asked, in an open-ended manner, to indicate why they felt that way. Responses were not shown online and were unprompted on the telephone.
The most common reason, given by almost half of dissatisfied candidates, was that they did not feel supported by Elections Canada or the returning officer. One-quarter (23%) said they felt the polling stations were not accessible, and around one in six (17%) said they experienced difficulties getting election materials or information from the returning officer. Just over one in 10 each mentioned an unfair voting process or that the processing of the nomination paper was delayed. Fewer made other individual mentions.
Subgroups of this population are generally too small to support deeper analysis.
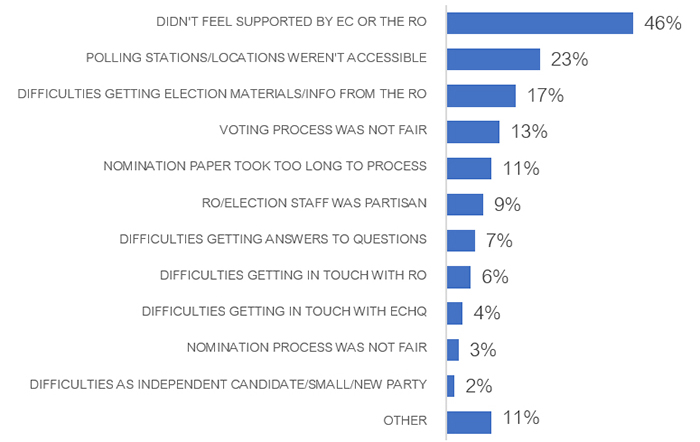
Q3: Why were you dissatisfied with the way the returning officer ran the election in your riding?
Base: n=130: Candidates dissatisfied with the way the returning officer ran the election. Includes those respondents (3%) who said "not sure."
Three-quarters (77%) of candidates said complying with nomination requirements was at least somewhat easy; the main difficulty among those (22%) who said it was at least difficult was in obtaining signatures. Almost all candidates (94%) were satisfied with nomination process timeliness and relatively few experienced difficulties finding an official agent (20%) or auditor (13%). Just over half (54%) said it was at least somewhat easy to collect nomination signatures despite COVID-19 restrictions. Close to nine in 10 (89%) felt well-informed about the nomination process.
Three-quarters of candidates said it was very (32%) or somewhat (45%) easy to comply with the nomination requirements, virtually the same as in 2019. Two in 10 expressed some level of difficulty.
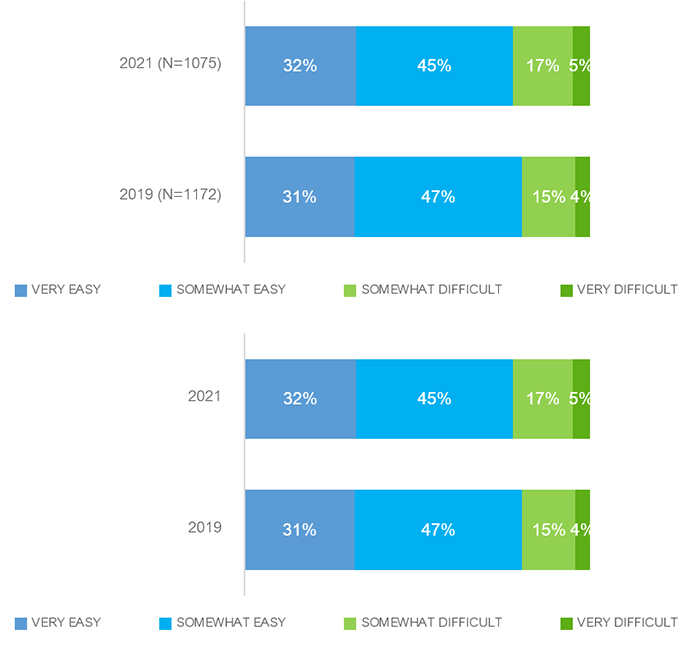
Text version of "Chart 4: Ease of complying with nomination requirements"
Q4: How easy was it to comply with the nomination requirements
Base: all respondents. Includes those respondents (1%) who said "not sure."
The following groups were more likely to have found the nomination process to be very easy:
Those who said the nomination process was somewhat or very difficult (22% of respondents, n=239) mainly cited difficulties in obtaining signatures (67%), significantly higher than was the case in the 43rd GE (39%). Just under one in five (18%) mentioned difficulties meeting the deadline, similar to 2019, and one in 10 cited unclear or inconsistent information. Candidates in 2021 were somewhat less likely than in 2019 to mention challenges related to being new or an independent/small party candidate, having too much paperwork/bureaucracy, or unexplained requirements.
| Reasons | 2021
(N=239) |
2019
(N=223) |
|---|---|---|
| Difficult to obtain required number of signatures | 67% | 39% |
| Difficult to meet deadline | 18% | 15% |
| Unclear/inconsistent information process | 9% | 9% |
| Difficulties as independent candidate/small/new party | 8% | 14% |
| Too much paperwork/bureaucracy/complexity | 7% | 24% |
| Procedures/requirements not explained | 5% | 20% |
| Difficult to deal with RO | 5% | - |
| Difficult to provide proof of identity | 4% | - |
| Signatures an unnecessary/unreasonable requirement | n/a | 10% |
| Other | 6% | 3% |
| Don't know/no response | 3% | 4% |
Q5: Why was it not easy to comply with the nomination requirements?
Base: Candidates who felt it was difficult to comply.
Responses are quite similar across subgroups. Saying it was difficult to obtain the required number of signatures is the top response for all, but is higher among those who ran previously (76%, versus 61% among first-time candidates).
Almost all (94%) candidates were satisfied to some extent with the timeliness of the returning officer's processing of their nomination, and three-quarters (77%) were very satisfied. This is statistically unchanged from 2019.
Text version of "Chart 5: Satisfaction with timeliness of processing nomination papers"
Q6: How satisfied were you with the returning officer's timeliness in processing your nomination?
Base: all respondents. Includes those respondents (1%) who said "not sure."
Satisfaction is similar across candidate population subgroups, although the following groups were more likely to be very satisfied:
Candidates were asked if they had any difficulties finding either an official agent or an auditor. Small minorities indicated they had difficulties finding an official agent (20% of those asked) or an auditor (13% of those who said they needed an auditor); both of these proportions are similar to responses given following the 43rd GE.
Text version of "Chart 6: Had difficulties finding an official agent"
Q7A: Did you encounter any difficulties in finding an official agent?
Base: Half sample. Includes those respondents (1%) who said "not sure."
Text version of "Chart 7: Had Difficulties finding an auditor"
Q7B: Did you encounter any difficulties in finding an auditor?
Base: Those who said they needed an auditor in a half sample.
While a minority of candidates said they encountered some difficulties finding an official agent, those with less political experience or from smaller parties were more likely to experience some difficulties:
Having difficulties finding an auditor is a low proportion across the board, but higher among first-time candidates (11%) compared to candidates who ran in a previous election (5%).
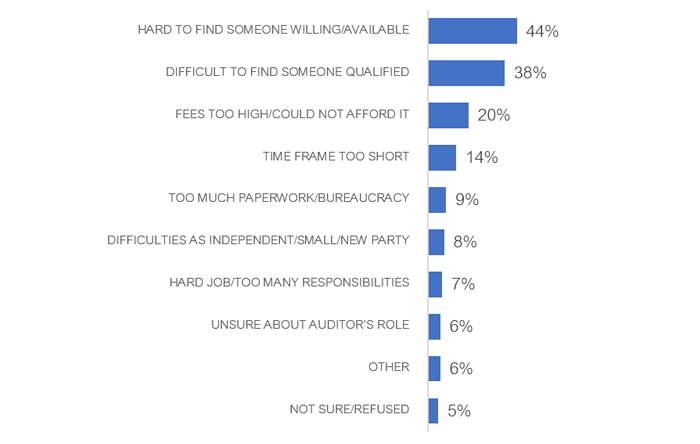
Among those reporting difficulties in finding an official agent (20% of respondents, n=107), a slim majority (55%) simply said it was hard to find someone willing or available to take on the role, which was also the top response in 2019 (67%). Over two in 10 (24%) mention it being hard to find someone with the right qualifications or that it is a hard job with too many responsibilities (22%). One in 10 or fewer provide other top-of-mind responses, including that the time frame was too short (9%) or there is too much paperwork/bureaucracy (8%).
Responses are similar across subgroups; that it was hard to find someone willing or available to take on the official agent role is the top response for all groups.
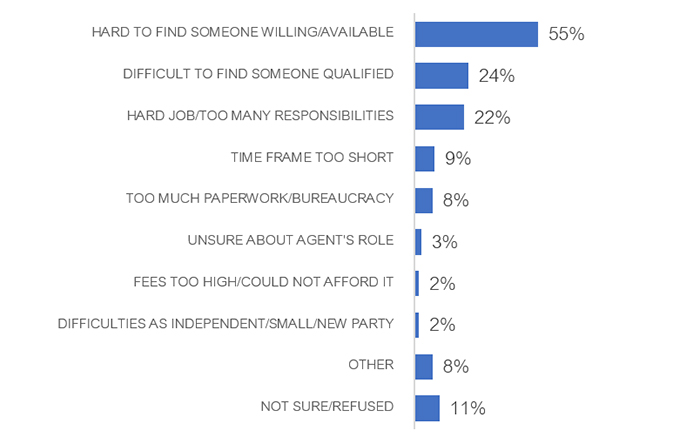
Text version of "Chart 8: Difficulties finding an official agent"
Q8: What difficulties did you encounter in finding an [IF ASKED 7A: official agent/IF ASKED 7B: auditor]?
Base: n=107: Candidates reporting difficulty finding an official agent.
Reasons for having difficulty finding an auditor are similar to those given for finding official agents. Among those of who reported difficulties finding an auditor (13% of those who needed one, n=45), over four in 10 say it was hard to find someone willing or available (44%), and just under four in 10 say it was difficult to find someone qualified (38%). Two in 10 say auditors' fees were prohibitively high/unaffordable. Fewer mention other difficulties.
Subgroup sizes for this population are too small to report differences at that level.
Text version of "Chart 9: Difficulties finding an auditor"
Q8: What difficulties did you encounter in finding an [IF ASKED 7A: official agent/IF ASKED 7B: auditor]?
Base: n=45: Candidates reporting difficulty finding an auditor.
Just over half (54%) of candidates said it was at least somewhat easy to collect nomination signatures despite COVID-19 restrictions; just under half (45%) said it was difficult to some extent.
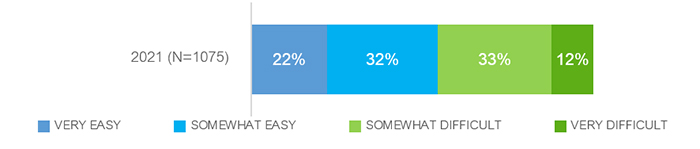
Q9: Considering COVID-19 restrictions in your area, how easy or difficult was it to collect electors' signatures for your nomination?
Base: all respondents. Includes those respondents (1%) who said "not sure."
Candidates with a disability (64%) were more likely to find it difficult to collect electors' signatures for nomination considering the COVID restrictions than those without any disability (43%).
On the other hand, the following groups were more likely to say it was at least somewhat easy to collect electors' signatures for nomination despite COVID-19 restrictions:
Close to nine in 10 (89%) candidates said they felt either very or somewhat well-informed about Election Canada's nomination process, unchanged from the 2019 election. One in 10 felt not very or not at all informed.
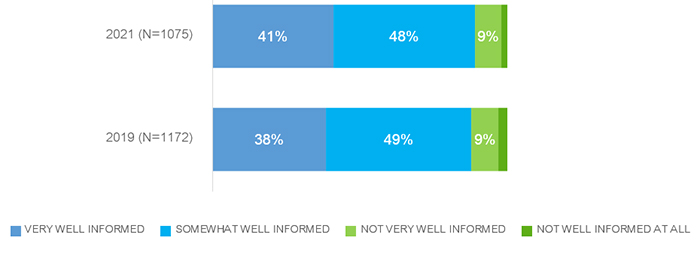
Text version of "Chart 11: How informed candidates felt about EC nomination process"
Q10: Overall, how well-informed did you feel about Elections Canada's nomination process?
Base: all respondents. Includes those respondents (1%) who said "not sure."
Majorities of all candidates subgroups felt at least somewhat well-informed. Having felt very informed increases as age of candidate increases (from 31% for those under age 35 up to 49% for those aged 60+), and is higher among the following:
Two-thirds (65%) of campaigns used the online portal, usually to download election materials. Nine in 10 (90%) agreed the portal contained useful information; eight in 10 agreed it was easy to create an account (81%) and that it provided easy access to documents (79%). Three-quarters (76%) of users were satisfied with their overall experience to some extent. The main reason candidates gave for not using the portal was that they did not need to use it (34%).
Two-thirds of campaigns (65%) reported using the Political Entities Service Centre, including four in 10 candidates (41%) who personally used it. Two in 10 (19%) say no one associated with the campaign used it, under one in 10 (7%) were unaware of it, and one in 10 are not sure. This is significantly higher reported use than in the 43rd GE in 2019 (when 47% said someone in the campaign used it and 33% said they did not).
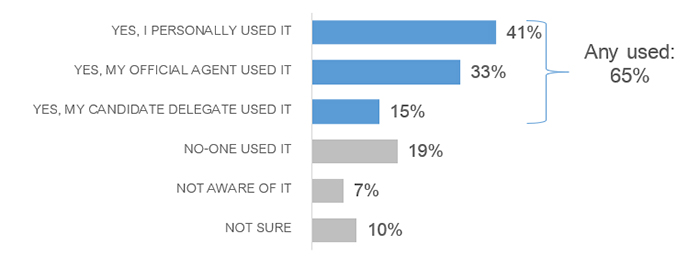
Text version of "Chart 12: If candidate's campaign used the portal"
Q11: Elections Canada offers a secure web portal called the Political Entities Service Centre that candidates can use to access electoral products and services. Did you, or any of your representatives, use the portal?
Base: n=1,075: all respondents.
Across most subgroups, a majority of around six in 10 or more reported campaign use of the portal. Candidates' personal use of the portal was higher among the following groups:
Those who reported their campaign used the portal (65% of respondents, n=698) were asked how it was used. Five possible options were shown or read, and candidates could also specify other actions. As in 2019, the primary purpose was to download election materials (60%, comparable to 56%). This is followed by using it to submit financial returns (37%) and to access post-election results or resources (35%, versus 28% in 2019). Around three in 10 used it to maintain their account and contact profile (31%, comparable to 27% in 2019) or to submit their nomination electronically (30%, identical to 2019). Very few used it to look for information or training in general.
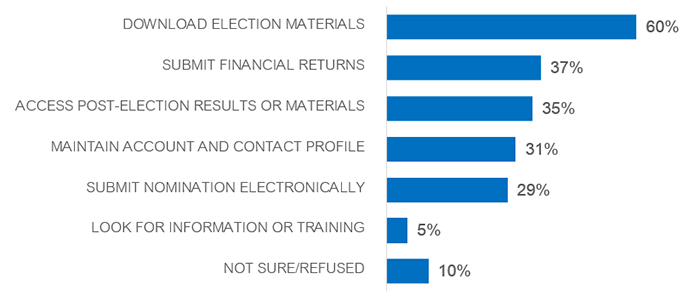
Text version of "Chart 13: Uses of the portal"
Q12: What did you, or your representative, use the portal for?
Base: n=698: Candidates whose campaign used the portal.
Responses are generally similar across the population of candidates whose campaigns used the portal. Downloading election materials was the top mentioned use across almost all subgroups.
Candidates who personally used the portal (41% of respondents, n=450) were asked their level of agreement with several statements about it. Seven in 10 or more agreed to some extent with most statements, with one exception. Overall agreement is similar to 2019 in most cases (base n=292).
The largest proportion (90%) of candidates who used the portal agreed that it contained useful information; eight in 10 agreed it was easy to create an account (81%) and that it provided easy access to documents (79%). Around three-quarters (73%) said it ensured the protection of candidate and elector personal information and seven in 10 (69%) agreed it was easy to navigate.
Among those who used the portal to submit their nomination, 75% agreed that it made that process convenient (somewhat lower than 82% in 2019). Seventy percent of those who submitted their financial returns using the portal said it made that process convenient, although strong agreement with the latter is notably lower compared to the previous statements.
Only one-third (35%) of respondents agreed that the portal was compatible with mobile devices, but this is because there is a substantial proportion, over half, who said they are not sure, presumably because they did not attempt to access the portal using a mobile device. The proportion who agreed is statistically higher than in 2019 (14%).
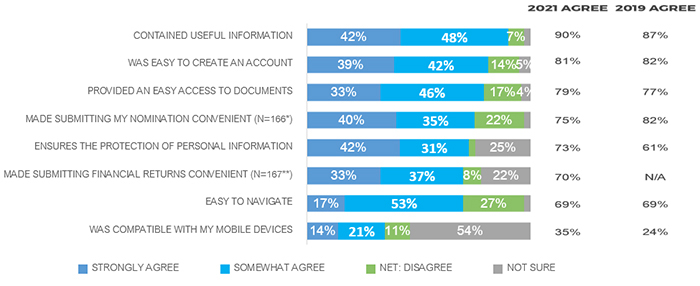
Text version of "Chart 14: Experience with the portal"
Q13: How strongly do you agree or disagree with the following statements about the portal?
Base: n=450: Candidates who personally used the portal.
* Base: Candidates who used the portal who submitted nomination electronically.
** Base: Candidates who used the portal who submitted financial returns electronically.
Overall agreement is essentially similar across the candidates' user population, with few notable patterns (many subgroup sizes are too small to report).
Three-quarters (76%) of candidates whose campaign used the portal were satisfied with their overall user experience to some extent, with just under one-quarter being very satisfied; just over one in 10 expressed some level of dissatisfaction, and one in 10 were unable to say. Overall satisfaction is higher than for the 43rd GE (65%).
Satisfaction is quite consistent across subgroups of this population; overall satisfaction is higher in Alberta (87%) than in other jurisdictions (70% to 77%).
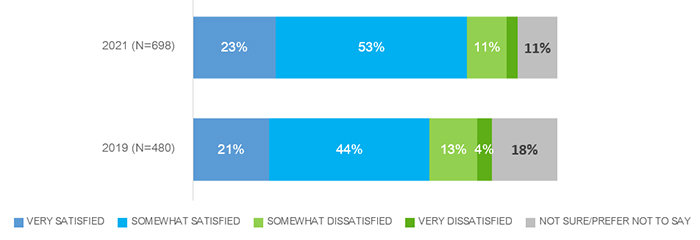
Text version of "Chart 15: Satisfaction with the portal"
Q14: How satisfied were you/was your representative with the overall user experience of the portal?
Base: n=698: Candidates whose campaign used the portal
The small proportion of respondents whose campaign did not use the portal (19% of respondents, n=202) were asked why. The main reason, given by one-third, was that they did not need to use it. A quarter of respondents said they did not have time to use it, while one in six said it was not easy to use or too complex. Fewer gave other individual reasons for not using the portal, with just under one in five (17%) not providing a reason.
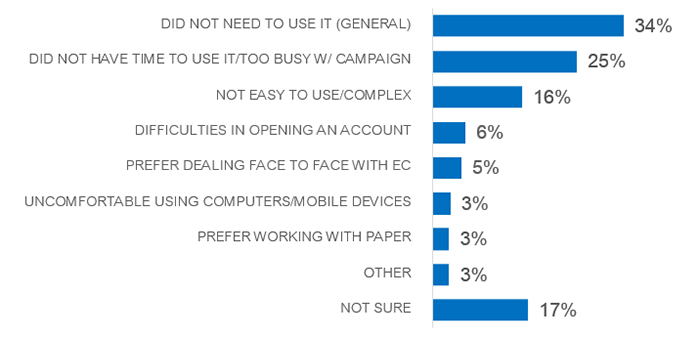
Text version of "Chart 16: Reasons for not using the portal"
Q15: Why did you not use the portal?
Base: n=202: Candidates whose campaign didn't use the portal.
Responses are generally similar across this limited population (many subgroup sizes are too small to permit analysis at this level). Not having needed to use the portal and not having time/being too busy are the top responses for all.
The top EC products used in 2021 were lists of polling stations (60%), maps of polling place service areas (55%), and lists of electors (50%). Eight in 10 (82%) of those who used lists of electors were satisfied to some extent with list quality. Just under half (48%) of those who used lists of polling stations think paper and electronic formats are equally useful. Among the 12% who used EC's tools to communicate with electors, the most useful ones were the Guide to the Federal Election booklet (37%) and the infographics (36%). Close to nine in 10 (85%) said EC products were at least somewhat useful to their campaign.
Three-quarters of campaigns (74%) were represented at an all-candidates briefing. Eight in 10 (79%) of those who attended found these useful and majorities were satisfied with both in-person (91%) and online (89%) formats. Two-thirds (65%) of candidates found EC's COVID-19 procedures and guidelines to be useful to some extent. Eight in 10 or more who contacted EC (through the local office, by email or via the toll-free line) were satisfied with the service they received.
Candidates were asked to indicate which EC products they used, from a list. The top items used in 2021 were the lists of polling stations, the maps of polling place service areas, and the lists of electors. Use of all individual products was at least somewhat lower than reported in 2019, and this is especially notable for the maps of polling place service areas (down 15 percentage points), the bingo sheets (down 17 points) and the political financing handbook (down 16 points).
| Reasons | 2021 | 2019 |
|---|---|---|
| n= (all candidates) | 1,075 | 1,172 |
| Lists of polling stations | 60% | 68% |
| Maps of polling place service areas | 55% | 70% |
| Lists of electors, including preliminary lists, revised lists and official lists | 50% | 57% |
| Political financing handbook for candidates and official agents | 48% | 64% |
| Bingo sheets | 24% | 41% |
| Political financing training videos | 20% | n/a |
| EC's tools to communicate with electors | 12% | 18% |
| I did not use any of EC's products/not sure/refused | 18% | 13% |
Q16: Which of the following Elections Canada products did you use?
In general, the groups most likely to report using the top three products or services are those who are more established; that is, candidates for parties represented in the House of Commons, those who were elected or incumbents, those who have run previously, and those who have the highest household incomes. Specific proportions are indicated below:
As in 2019, just under half (48%) of those reporting use of lists of polling stations think paper and electronic lists were equally useful. In 2021, one-third expressed a preference for electronic lists, while one in seven (17%) preferred paper, a lower proportion than in past federal elections.
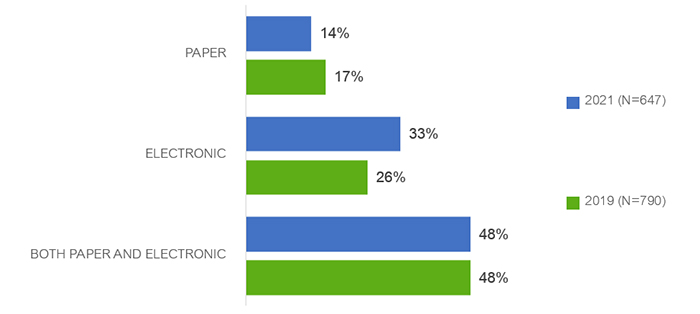
Text version of "Chart 17: Most useful format of polling station lists"
Q17: In your opinion, which format of the updated lists of polling stations was most useful?
Base: Candidates who used lists of polling stations. Includes 6% of respondents who said "not sure."
This pattern is echoed across subgroups of this population. A minority of candidates expressed a preference for paper versions of the polling station lists. This preference is slightly higher among the following groups:
Among those who used the lists of electors (50% of respondents, n=531), eight in 10 (82%) were satisfied to some extent with the list quality; three in 10 were very satisfied. One in 10 were dissatisfied to some extent. These proportions are statistically comparable to those in 2019 who were asked about their satisfaction using the same four-point scale.
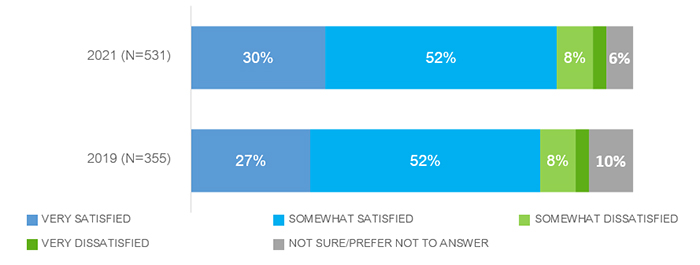
Text version of "Chart 18: Satisfaction with overall quality of list of electors"
Q18: How satisfied were you with the overall quality of the lists of electors?
Base: Those who used list of electors.
Those who indicated they used EC communications tools (n=133) were asked to indicate which of four tools was the most useful for their campaign (multiple mentions were permitted). The most useful tools were the Guide to the Federal Election booklet (37%) and the infographics (36%, statistically higher than in 2019). As before, just under four in 10 do not indicate a communication tool they found to be most helpful.
Opinions are quite similar across subgroups of this population; many subgroup sizes are too small for deeper analysis.
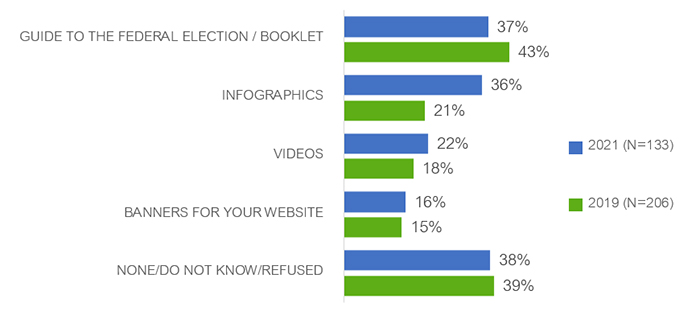
Text version of "Chart 19: Useful communication tools"
Q19: Which of the following EC tools to communicate with electors were the most useful for your campaign?
Base: Candidates who used EC's tools to communicate with electors.
Candidates who used maps of polling places (55% of respondents, n=592) were asked which of three formats they used; multiple responses were permitted. As in previous years, the top response is paper, used by seven in 10 in this past election. Four in 10 (42%) used PDFs and one in six (16%) used the online event map viewer on the portal. Statistically fewer used the paper format and more used a PDF than in the 43rd GE.
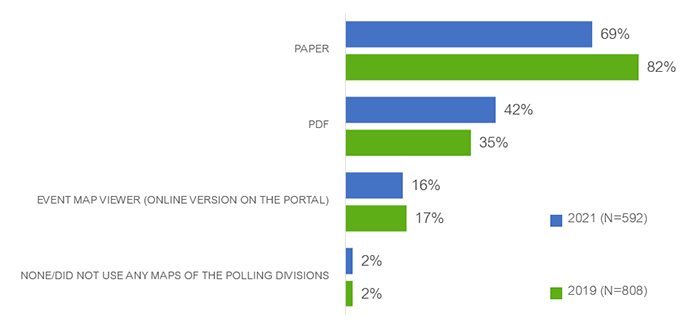
Text version of "Chart 20: Format of polling place maps"
Q20: Which format of the maps of polling place service areas did you use?
Base: Candidates who used maps of polling place service areas. Includes those respondents (8%) who said "not sure."
The following are notable differences in format of use:
Those who used at least one EC product (n=888) were asked how useful these were when considering what was needed to run their campaign. A strong majority of close to nine in 10 said these were at least somewhat useful, the same result as in 2019. Just over one in 10 feel they were not very or at all useful.
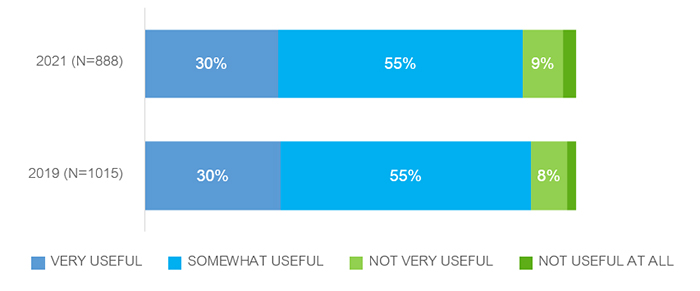
Text version of "Chart 21: Usefulness of Elections Canada products in the campaign"
Q21: Thinking about what you needed to run your campaign, how useful were Elections Canada's products?
Base: Candidates who used Elections Canada products. Includes those respondents (3%) who said "not sure."
The following groups were more likely to find EC's products to be very useful:
The small number of EC's products users who did not think these were useful (n=109) were most likely to indicate that the bingo sheets (32%) and polling place service area maps (30%) were not useful, followed by elector communication tools (26%) and lists of electors (24%). Results are quite similar to 2019, with a larger proportion mentioning the polling place service maps than previously (16% in 2019).
Opinions are quite similar across subgroups of this population; most subgroup sizes are too small for deeper analysis.
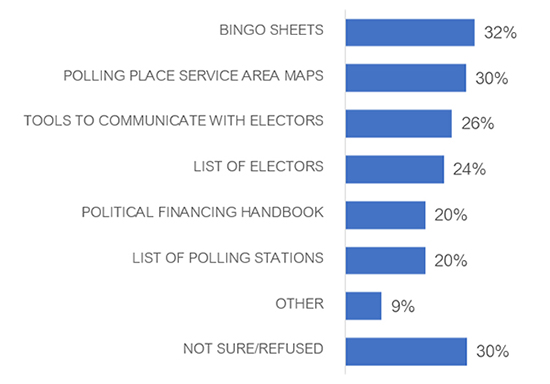
Text version of "Chart 22: Elections Canada Products that were not useful"
Q22: Which Elections Canada products did you think were not useful?
Base: n=109: Those indicating EC products were not useful.
Three-quarters of candidates (74%) reported they or someone else from their campaign attended an all-candidates briefing for the 44th GE. Just under half of candidates attended the briefing themselves, either in person or via videoconference, comparable to 2019.
| Attendance | 2021 | 2019 |
|---|---|---|
| n= (all candidates) | 1,075 | 1,172 |
| Net: Campaign attended | 74% | n/a |
| Candidate attended personally (net) | 47% | 47% |
| Candidate attended in person | 31% | n/a |
| Candidate attended via videoconference | 17% | n/a |
| Other in campaign attended (net) | 47% | n/a |
| Campaign delegate/manager attended, in-person or remotely | 27% | 37% |
| Official agent attended, in-person or remotely | 16% | 19% |
| Other | 1% | n/a |
| No one attended | 26% | 21% |
| Don't know/no response | n/a | 4% |
Q23: The returning officer in your riding organized an all-candidates briefing for the general election. Please indicate which of the following applies.
Attending the briefing personally (either in person or virtually) is higher among the following candidates:
Having another campaign official (manager or official agent) attend is higher among:
Not having had anyone in the campaign attend the briefing is higher among the following groups:
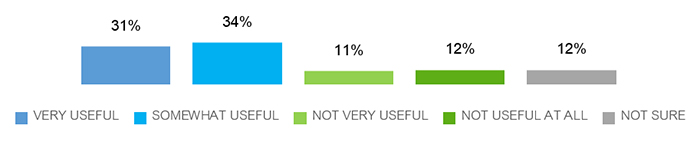
Those whose campaign was represented at the all-candidates briefing (n=788) were asked how useful it was. Eight in 10 (79%) said it was useful, with one-third saying it was very useful. Just over one in 10 said it was not very or not at all useful.
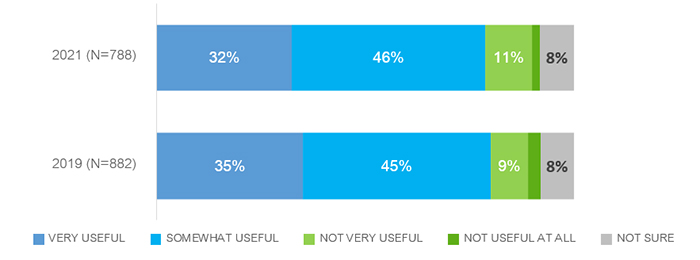
Text version of "Chart 23: Usefulness of all-candidates briefing"
Q24: How useful was the all-candidates briefing?
Base: Candidates who attended or were represented at the briefing.
Majorities across all subgroups said the all-candidate briefing was useful to some extent. The following groups were more likely to say it was very useful:
Candidates who attended the all-candidates briefing, either in person or remotely (n=515), were asked how satisfied they were with the format. Both formats have extremely high overall levels of satisfaction (91% for in person, and 89% for online), but the in-person format has the higher level of strong satisfaction.
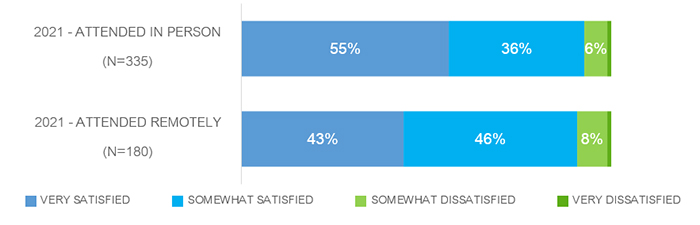
Text version of "Chart 24: Level of satisfaction with format of all-candidates briefing"
Q25A: How satisfied were you with the format of the in-person all-candidates briefing?
Q25B: How satisfied were you with the format of the all-candidates briefing you attended remotely?
Base: Candidates who personally attended the briefing. Includes 2% "not sure" responses for both in-person and videoconference.
Overall satisfaction is quite uniformly high across subgroups. The following groups were more likely to be very satisfied with each format:
The very small number of candidates who expressed some level of dissatisfaction with either format (n=42) mainly said it was because of a lack of useful information (39%) or that it was not engaging (23%). Smaller proportions give other individual reasons. This population is too small for subgroup analysis.
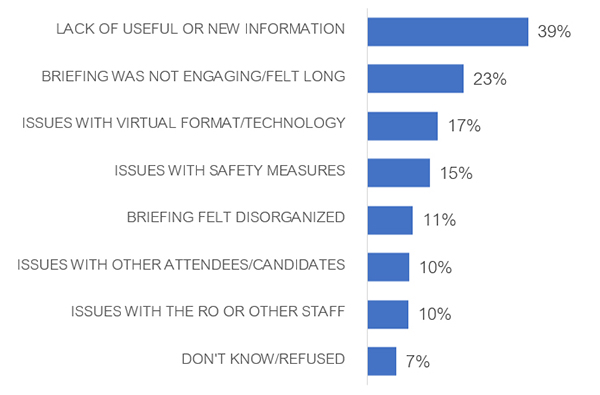
Q26: Why were you dissatisfied with the format of the (IF ONLY A: in person all-candidates briefing? / IF ONLY B: remote all-candidates briefing? / IF BOTH A AND B: the formats of the all-candidates' briefings?)
Base: n=42: Candidates who were dissatisfied with briefing format.
All candidates were asked how useful they felt EC's COVID-19 procedures and guidelines were. Two-thirds (65%) found them useful to some extent, while just under one-quarter said they were not very or at all useful. One in 10 are unable to say. Three in 10 say these were very useful.
Text version of "Chart 26: Usefulness of COVID-19 procedures and guidelines"
Q27: How useful were Elections Canada's procedures and guidelines to avoid the spread of COVID-19?
Base: n=1,075: All respondents.
Majorities across most subgroups say the guidelines and procedures were useful to some extent, with one exception: Those who ran for parties not represented in the House of Commons, who were about equally likely to say they were useful (43%) or not useful (40%).
The following groups were more likely to say that EC's guidelines were very useful:
While men and women were equally likely to say the guidance was very useful (31%), women were more likely than men to think it was at least somewhat useful (70% versus 61%).
Candidates were asked if their campaign contacted EC during the election by any of three modes. All candidates completing the survey online and one-third of telephone respondents were asked about contacting EC by the toll-free support line, through the local office, or by email.
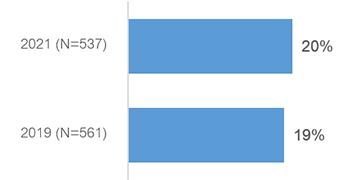
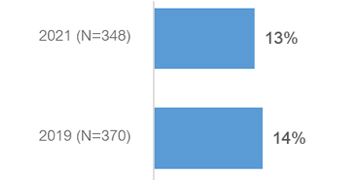
A strong majority of candidates (86%) reported their campaign had contacted the local EC office, an identical proportion to 2019. Close to half contacted EC via email (47%), and one-third (32%) used the toll-free support line, statistically less than the proportion who did so in 2019.
| Year | Yes | No | Not sure |
|---|---|---|---|
| Local EC office | |||
| 2021 (n=787) | 86% | 10% | 3% |
| 2019 (n=611) | 86% | 12% | 2% |
| EC by email | |||
| 2021 (n=787) | 47% | 37% | 16% |
| 1-800 support line | |||
| 2021 (n=787) | 32% | 50% | 18% |
| 2019 (n=561) | 39% | 43% | 18% |
Q28: During the election, did you, or any of your representatives, contact…:
Base: Online respondents and 1/3 of telephone respondents for each mode.
Proportions for the email and toll-free contact methods are quite similar across subgroups. The following groups were more likely to have contacted the local EC office:
Those who used each of the contact methods were asked to indicate their level of satisfaction with the services provided. Over six in 10 of those who dealt with their local EC office said they were very satisfied, and nine in 10 (90%) were satisfied overall; this is comparable to 2019. Just under nine in 10 (85%) were satisfied to some extent with contacting EC by email, and eight in 10 (79%) were satisfied with their experience using the toll-free support line (compatible to 2019); strong satisfaction with the latter two methods is lower than for the local EC office.
| Year | Very satisfied | Somewhat satisfied | Not very satisfied | Not at all satisfied |
|---|---|---|---|---|
| Local EC office | ||||
| 2021 (n=681) | 63% | 27% | 7% | 3% |
| 2019 (n=522) | 64% | 24% | 5% | 4% |
| EC by email | ||||
| 2021 (n=373) | 53% | 32% | 8% | 3% |
| 1-800 support line | ||||
| 2021 (n=253) | 44% | 35% | 10% | 5% |
| 2019 (n=185) | 42% | 32% | 11% | 11% |
Q29: How satisfied were you, or your representative, with the services you received from…:
Base: Those who used each contact option. Includes those (1% for Local EC office, 4% for EC by email and 6% for 1-800 support line) who said "not sure."
Being satisfied with the services via each of these methods is very consistent across subgroups, with few exceptions.
Despite the pandemic, seven in 10 (69%) candidates interacted with electors by going door-to-door and almost six in 10 (56%) did other in-person events or outreach. One-quarter of candidates (24%) provided the returning officer with a list of names of election staff to work at polling stations. Of those who reported that they used voter lists (68% of the candidates), almost all (96%) took measures to protect the personal information contained in them, usually by limiting access to them (51%) or by securing them (24%). Over four in 10 (44%) candidates took measures to ensure their campaign was accessible to electors with disabilities, most often by using wheelchair-accessible venues (26%). Just over one-third (37%) were aware of reimbursement incentives when deciding to run as a candidate, but only a few of them (8%) said this made a difference to them.
Candidates faced special challenges in the 44th GE due to the pandemic. They were asked how they interacted with electors during the campaign, given public health guidelines; possible responses were shown online but not read out on the telephone.
Despite the pandemic, majorities of candidates interacted with electors in person: seven in 10 (69%) went door-to-door, and just under six in 10 (56%) were involved in other in-person events and outreach. Half (51%) made phone calls, and just under half (45%) reached out by email. One-third each reported having virtual gatherings (35%) or sending communications by mail (32%). Relatively few (12%) reported reaching electors via social media.
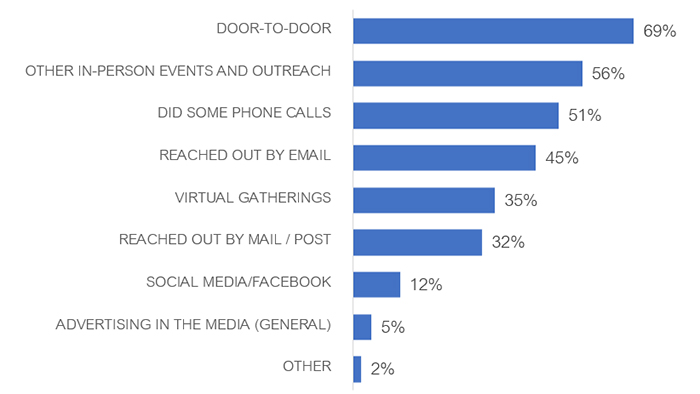
Text version of "Chart 27: Interaction with electors during COVID-19"
Q30: Considering the public health guidelines about COVID-19, how did you interact with electors during your campaign?
Base: n= 1,075: All respondents. Includes those (2%) who said "not sure."
The groups most likely to have interacted with electors by various methods include:
One-quarter of candidates (24%) provided a list of election staff names to the RO to work at the polling station, statistically comparable to 2019. Over half did not, and one in 10 did not know they could do this.
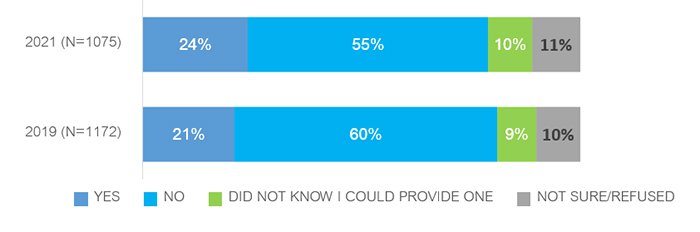
Text version of "Chart 28: If campaign provided a list of names of election staff"
Q31: Did you provide the returning officer with a list of names of election staff to work at the polling station?
Base: All respondents.
Across many subgroups, only a minority of candidates provided the RO with a list of election staff who would work at the polling station. The proportion is higher among the following groups, several of which indicate candidates with more experience:
Those who did not provide the RO with a list of staff names (n=598) were asked why they did not do so. The main reasons, related to not having anyone interested or available, were also the top reason in 2019. Close to two in 10 said there was no need to do this (higher than in 2019), and one in seven said this was difficult to do as a smaller entity (independent candidate or with a small or new party). One in 10 or fewer gave other individual reasons for not providing a list of staff to work the election.
| Reason | 2021
(n=598) |
2019
(n=724) |
|---|---|---|
| Did not have anyone (net) | 28% | 46% |
| Did not have anyone/unable to find people interested/available | 26% | n/a |
| Did not have anyone/unable to find competent people | 2% | n/a |
| No need to provide a list | 18% | 3% |
| Difficulties as independent candidate/small party/new party | 14% | 8% |
| Not enough time to find people | 10% | 10% |
| Procedures not explained | 8% | 4% |
| I did not want to provide a list | 7% | 5% |
| Returning officers did not request such a list | 3% | 4% |
| Elections Canada/RO should do this | 3% | 4% |
| Other (mentions) | 6% | 2% |
| Not sure/refused | 17% | 22% |
Q32: Why did you not provide a list of names?
Base: Those who did not provide a list of staff names.
Responses are quite similar across subgroups of this population. Not having anyone or being unable to find someone is similar whether or not the party is represented in the House of Commons, but is higher among the following groups:
Two-thirds of candidates (66%) said they took measures to protect the personal information contained in the voters' lists they received; one-third said they did not use these lists or were unsure. When recalculated to exclude those not using the lists or unsure about their use, almost all (96%) took some measures to protect private information, comparable to 2019.
Nine in 10 or more of subgroups of this population say they took privacy protection measures.
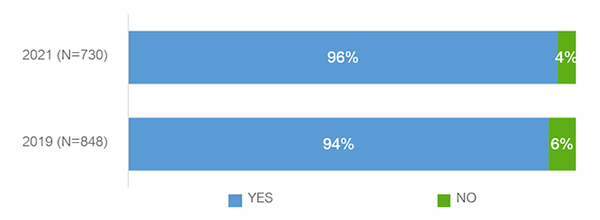
Text version of "Chart 29: If measures taken to ensure protection of personal information"
Q33: Did you take any measures to ensure the protection of personal information contained in the voters' lists that you received?
Base: Those using the lists.
Those who took measures to ensure the protection of personal information contained in the voters' lists they received (n=704) were most likely to indicate they limited access to the lists, stored the lists securely, or ensured the destruction of the lists once the election was over. These were also the top responses in 2019. Candidates were somewhat less likely than previously to indicate they safeguarded or destroyed the lists.
| Measure | 2021
(n=704) |
2019
(n=789) |
|---|---|---|
| Ensured limited access to lists | 51% | 52% |
| Kept lists in secure place/kept locked away | 24% | 36% |
| Ensured the destruction of voters' lists at end of the election | 19% | 24% |
| Issued instructions regarding use of voters' lists | 9% | 8% |
| Encrypted the lists | 9% | 4% |
| Kept at home/office | 4% | 2% |
| Issued procedures to re-collect copies of voters' lists after event | 2% | 2% |
| Brought voters' lists back to returning officer | 2% | 3% |
| Other | 2% | - |
| Not sure/refused | 13% | 15% |
Q34: What measures did you take to ensure the protection of personal information?
Base: Those who took protection measures.
Responses are generally quite similar across the candidate population.
Over four in 10 candidates said they took measures to ensure their campaign's materials, events or website were accessible to electors with a disability (slightly higher than in 2019). One-quarter said they did not ensure this, and three in 10 are not sure.
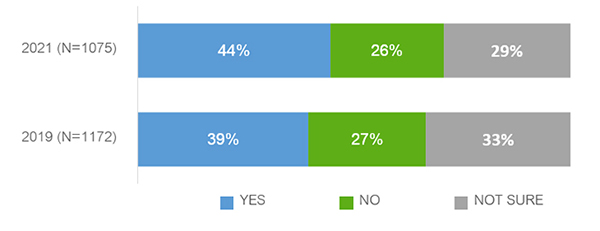
Text version of "Chart 30: If took measures to ensure campaign's accessibility"
Q35: Did you take any measures to ensure that your campaign's materials, events or website were accessible to electors with a disability?
Base: All respondents.
The following groups were more likely to have taken accessibility measures in their campaign:
Those indicating they took measures to make campaign elements accessible (n=474) were asked to indicate what they did, unprompted. They were most likely to indicate they used wheelchair-accessible venues (26%, comparable to 27% in 2019), used various communication channels (17%), had an accessible website (15%) or asked electors how to accommodate their needs (15%).
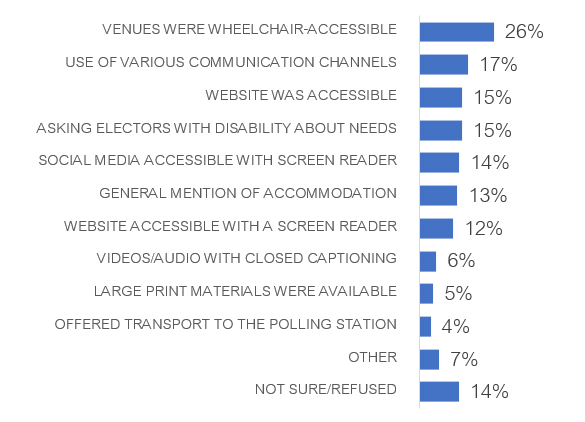
Text version of "Chart 31: Accessibility measures"
Q36: Which measures did you take to make your campaign accessible?
Base: n=474: Those who took measures to make their campaign accessible.
Responses are generally similar across this population. Candidates self-identifying as having a disability cite similar accommodations to others; they are somewhat less likely to mention wheelchair-accessible venues (14% versus 28% of others) and more likely to mention social media content being accessible to electors with a screen reader (23% versus 12%) or having large-print materials available (13% versus 4%).
Just over one-third of candidates said they were aware of reimbursement incentives when they were deciding to run as a candidate, the same proportion as in 2019. Six in 10 were not aware of this.
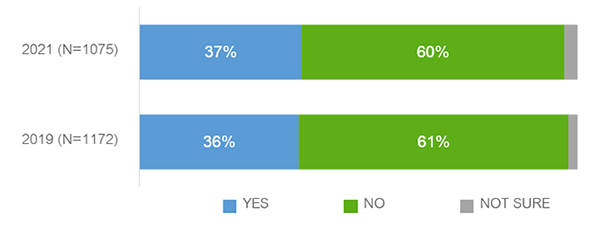
Text version of "Chart 32: Awareness of financial incentives"
Q37: The Canada Elections Act provides for partial reimbursement of elections expenses as well as some personal expenses like childcare costs and expenses related to a disability. When deciding to run as a candidate, were you aware of these financial incentives?
Base: All respondents. Includes those (3%) who said "not sure."
Awareness of financial incentives is higher among candidates with more resources and experience: Those running for parties represented in the House of Commons (42%, versus 29% from a non-represented party), elected candidates (61% versus 33% of unelected candidates), incumbents (66% versus 32% of non-incumbents), and those who had run in previous elections (59% versus 24% of first-time candidates).
Awareness is also higher among the following:
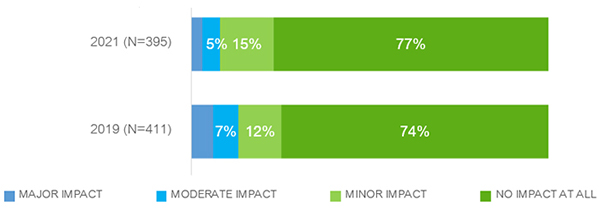
Three-quarters (77%) of those who were aware of financial incentives for candidates (n=395) said these made no impact on their decision to run, a similar proportion to 2019. The incentives at least moderately impacted the decision for around one in 12.
Strong majorities of all subgroups indicate this information did not impact their decision to run.
Text version of "Chart 33: Impact of financial incentives on decision to run"
Q38: What impact, if any, did these financial incentives have on your decision to run in the last general election?
Base: Those aware of financial incentives. Includes those (1%) who said "not sure."
Seven in 10 candidates (69%) were satisfied with the advance poll and election day polling site locations. One-quarter were dissatisfied to some extent. Being dissatisfied was mainly due to having too few polls or their being too far away. Overall satisfaction with the the way the voting process went is close to eight in 10 (78%); top reasons for dissatisfaction are long line-ups or issues with EC staff. About one in six candidates (16%) said they or their representatives witnessed problems related to the voter identification requirements in general (half of them saw these at least somewhat often), and just over one in 10 (12%) saw problems related to use of the VIC (62% of them saw these at least somewhat often). Just under half (48%) agreed to some extent that it was harder to observe the election because of COVID-19-related safety measures at the polls.
Seven in 10 candidates (69%) were at least somewhat satisfied with the locations chosen as polling sites for advance polls and on election day, and one-third were very satisfied. Both of these proportions are lower than was the case in 2019 (84% satisfied overall, 44% very). One-quarter were dissatisfied to some extent.
Text version of "Chart 34: Satisfaction with location of polling sites"
Q39: How satisfied were you with the locations chosen as polling sites for advance polls and on election day?
Base: All respondents.
All subgroups of candidates were satisfied with the polling site locations, but satisfaction is higher among the following, including some groups associated with having less experience being a candidate (e.g. non-elected, first time candidates, party not represented in the House of Commons):
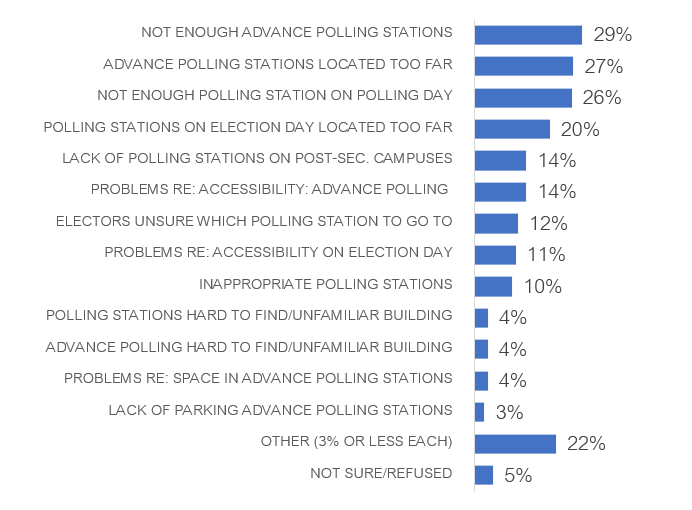
Those dissatisfied with polling station locations (n=269) were asked why, without prompting; multiple responses were permitted. They indicated a number of problems, including not enough polling stations (29% for advance polls and 26% for election day polls) and polling stations being too far away (27% advance, 20% election day). One in seven mentioned either a lack of polling stations on post-secondary campuses or problems with accessibility of advance polls. Around one in 10 or fewer mentioned other specific issues.
There are no important subgroup differences or response patterns to note.
Text version of "Chart 35: Reasons for dissatisfaction with location of polling sites"
Q40: Why were you dissatisfied with the location of the polling sites?
Base: n=269: Those dissatisfied with polling site locations.
Overall satisfaction with the way the voting process went on advance polls and election day was close to eight in 10 (78%, comparable to 81% in 2019); just under four in 10 (38%) were very satisfied, which is statistically lower than the 2019 election (45%). One in six were dissatisfied to some degree.
There are no important subgroup differences or response patterns to note.
Text version of "Chart 36: Satisfaction with voting process"
Q41: How satisfied were you with the way the voting process went on advance polls and election day?
Base: All respondents.
Satisfaction is fairly consistent across candidate subgroups, with the following groups having higher overall satisfaction than others:
The small proportion of candidates who were dissatisfied to some extent with the voting process (n=186) were asked, without prompting, to explain why they were dissatisfied. Multiple responses were permitted. The top reasons were long lineups at both advance polls and on election day (three in 10 each); one-quarter had an issue with EC staff. Around one in seven each mentioned there having been too few locations, on either polling day or for the advance polls. One in 10 or fewer mentioned other issues, including one in 10 expressing dissatisfaction with COVID-19 protocols.
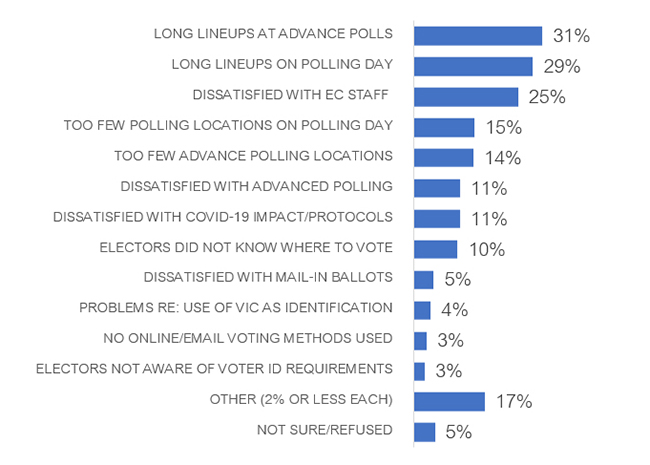
Text version of "Chart 37: Reasons for dissatisfaction with the voting process"
Q42: Why were you dissatisfied with the voting process?
Base: n=186: Those dissatisfied with the voting process.
While mentions are similar by subgroups, in general, mentions of almost all issues are at least somewhat higher among those groups with more experience: those with a party represented in the House of Commons, elected candidates and incumbents, and those who ran before:
As in 2019, candidates were asked one of two questions about problems experienced with voter identification. The resulting analysis focuses on the responses of those who said they were present at or represented at the polling location.
Relatively few candidates — about one in six (16%) — reported they or their representatives witnessed problems related to the voter identification requirements in general. This is a comparable proportion to 2019, and consistent across subgroups.
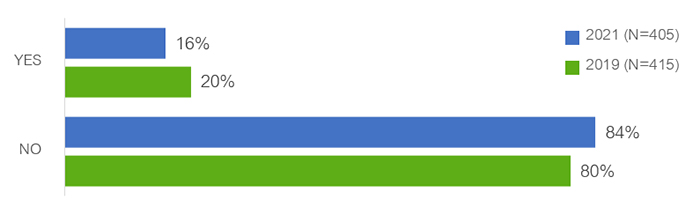
Text version of "Chart 38: If there were problems related to voter identification requirements"
Q43: Did you, or your representative, witness any problems related to…
Base: Those present at the polling location.
When it comes to use of the Voter Information Card (VIC) as a form of ID, just over one in 10 saw some type of problem, statistically similar to 2019 and also similar across subgroups.
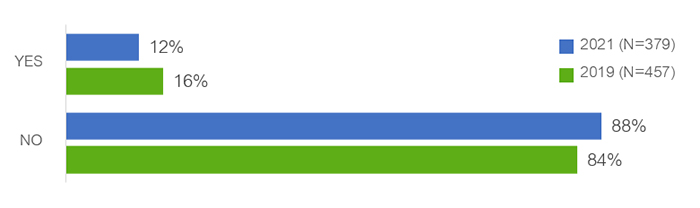
Text version of "Chart 39: If there were problems related to use of VIC as piece of ID"
Q43: Did you, or your representative, witness any problems related to…
Base: Those present at the polling location.
The small number of candidates who reported having seen a general voter identification problem (n=64) were most likely to report there being uneven interpretation of the rules by officers, or suspicion of fraud. One in 10 or fewer mentioned each of a range of other individual issues, including people having problems proving their identity or address, or their address not matching the listed address.
Most subgroups of this population are too small for analysis on that level.
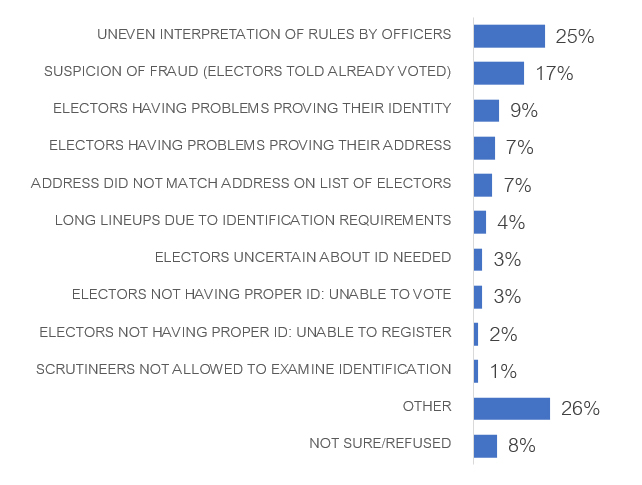
Text version of "Chart 40: Problems witnessed with voter ID process"
Q44A: What problems were witnessed?
Base: n=64: Candidates who witnessed problems with voter identification process.
The small number of candidates who reported having seen a problem with electors using the VIC for identification (n=43) were most likely to mention that it did not arrive before election day, or that they saw people generally having difficulty proving their identity. One in 10 or fewer mentioned a range of other individual issues, including electors having no ID other than the VIC, the VIC address not matching the list, and an uneven interpretation of identification rules.
Subgroups of this population are too small for analysis on that level.
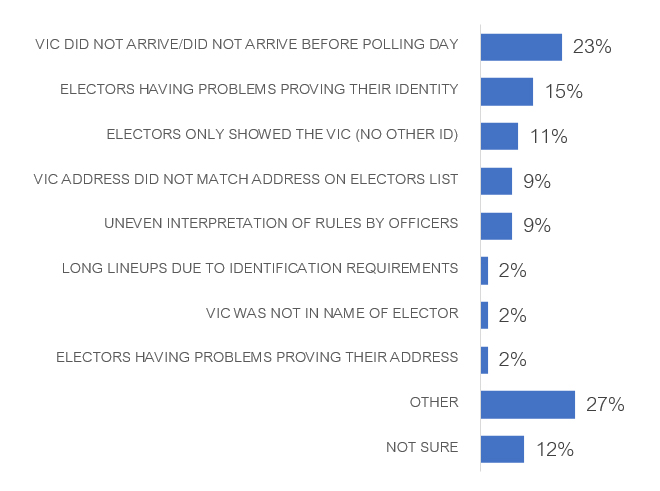
Text version of "Chart 41: Problems witnessed with use of the VIC as ID"
Q44B: What problems did you witness regarding the use of the VIC (voter information card) as a piece of identification?
Base: n=43: Candidates who witnessed problems with use of VIC as ID.
Half of those who witnessed voter identification issues said these occurred either very or somewhat often, four in 10 (39%) said these were not that often or often at all, and one in 10 were unable to say. Having witnessed it very often was lower than was the case in 2019.
Among those who witnessed VIC-related problems, six in 10 (62%) witnessed this very or somewhat often, and one-third saw it less frequently. Due to small sample sizes, having witnessed it very often is statistically comparable to 2019.
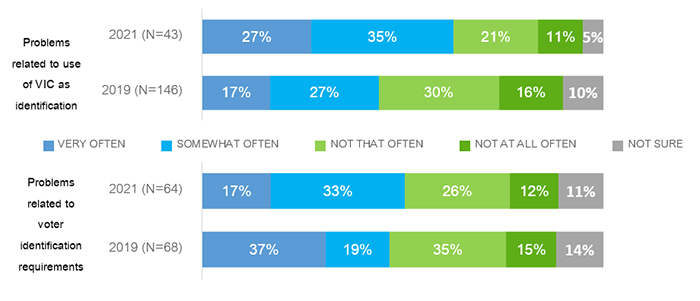
Text version of "Chart 42: Frequency of problems with voter identification"
Q45: How often did you observe those problems?
Base: Those who observed problems related to voter identification.
Just under half of candidates (48%) agreed to some extent that it was harder to observe the election because of COVID-19-related safety measures at the polls. One-quarter disagreed either somewhat or strongly, and one-quarter are unable to say.

Q46: Candidates and their representatives have the right to observe certain steps of the voting and counting process. How strongly do you agree or disagree that it was harder to observe the election because of COVID-19-related safety measures at the polls?
Base: n=1,075: All respondents.
Overall agreement that the COVID-19 safety measures made election observation harder is higher among the following groups:
Three-quarters of candidates (76%) felt EC administered the election either very or somewhat fairly. A strong majority of over eight in 10 (83%) had at least somewhat high trust in the accuracy of the results; over half (55%) had very high trust. Nine in 10 (90%) expressed some level of satisfaction with their interactions with the RO, and close to nine in 10 (86%) are satisfied to some degree with the overall quality of service received from Elections Canada. The top suggested improvement to Elections Canada services is more timely or accessible information.
Three-quarters (76%) of candidates feel EC ran the election either very or somewhat fairly, which is statistically lower than in 2019 (81%). Two in 10 think it was unfair to some extent.
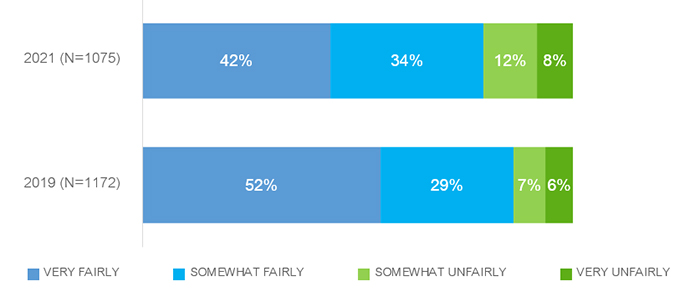
Text version of "Chart 44: Perceived fairness of EC's administration of the general election"
Q47: Thinking about the September 20 federal election, would you say that Elections Canada ran the election…
Base: All respondents. Includes those (4%) who said "not sure."
Thinking the election was administered very or somewhat fairly by EC is higher among the following groups:
A strong majority (83%) of candidates in the federal election have at least somewhat high trust in the accuracy of the results, and over half (55%) have very high trust, the same proportion as in 2019 (54%). Just over one in 10 distrust the results to some extent.
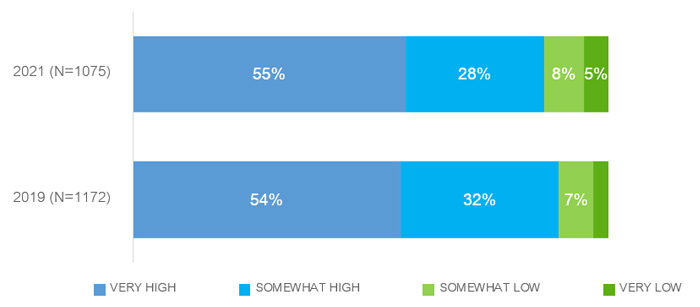
Text version of "Chart 45: Perceived trust in the accuracy of election results in the riding"
Q48: What level of trust do you have in the accuracy of the election results in your riding?
Base: All respondents. Includes those (3%) who said "not sure."
Majorities in all candidate subgroups have at least some trust in the accuracy of results. Having very high trust is higher among the following:
Nine in 10 (90%) candidates expressed some level of satisfaction with their interactions with the RO, and about three-quarters (73%) were very satisfied; these proportions are statistically the same as for the 43rd GE. One in 10 expressed some level of dissatisfaction with their interactions.

Text version of "Chart 46: Satisfaction with interactions with the returning officer"
Q49: Overall, how satisfied were you with your interactions with the returning officer?
Base: All respondents. Includes those (2%) who said "not sure" or had no interactions with the RO.
There were no significant differences in overall satisfaction among subgroups.
Quebec candidates were somewhat less likely to be very satisfied (66%) than candidates from other regions of Canada (74-79%).
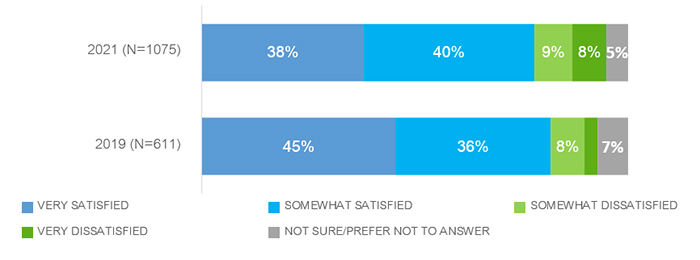
Close to nine in 10 (86%) candidates were satisfied to some degree with the overall quality of service they received from Elections Canada in the most recent federal election, and just under half were very satisfied. These results are statistically similar to the proportions of 2019.
Text version of "Chart 47: Satisfaction with quality of EC services"
Q50: How satisfied were you with the overall quality of service you received from Elections Canada in the most recent federal election?
Base: All respondents. Includes those (2%) who said "not sure."
As with satisfaction with RO interactions, responses are quite consistent across subgroups, with 81% to 91% being at least somewhat satisfied. Strong satisfaction is somewhat lower in Quebec (37%) than elsewhere (47%-56%) and is higher among men (50%, versus 43% of women).
All candidates were asked, without prompting, for suggestions about how EC can improve their services to candidates. Close to six in 10 (58%) made at least one suggestion. The top response was to provide more timely or accessible information. Fewer than one in 10 make any other individual mention; these include improving the website or portal, improving communications, simplifying paperwork and additional staff training.
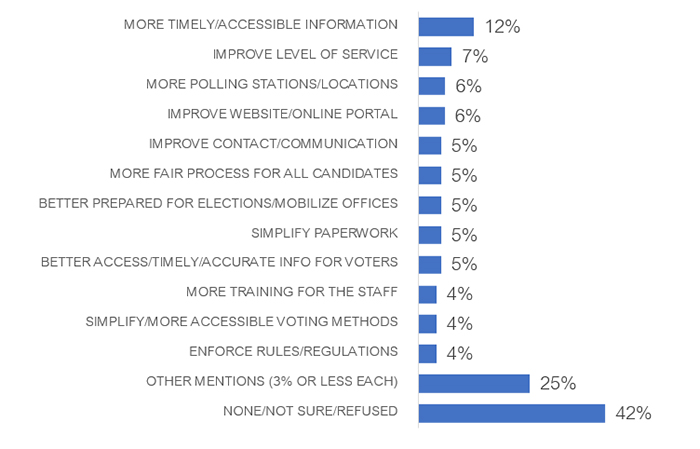
Text version of "Chart 48: Suggestions for improving EC services"
Q51: Thinking about the services you received from Elections Canada during the election, what is your main suggestion, if anything, to improve those services?
Base: n=1,075: All respondents. Includes those (3%) who said "not sure."
Results are generally consistent across candidate subgroups. Mentions of needing more polling stations (e.g. on post-secondary campuses) were somewhat higher in the Atlantic region (13%) and Ontario (10%) than elsewhere (5% to 2%).
Close to six in 10 candidates (56%) felt the spread of false information online was a problem in this election; nearly four in 10 among them (38%) thought it had a major impact on the election outcome. Nearly four in 10 candidates (38%) said foreign countries or groups using social media to influence the political opinions of Canadians was a problem, with 38% of them feeling this problem had a major impact on the outcome of the election. One in 10 (10%) candidates thought foreign countries or groups hacking into the computer systems that support the election was a problem in this election, and just under half (46%) of them said it had a major impact.
Over four in 10 (44%) still preferred paper voter lists, and over six in 10 (62%) preferred hand-counted ballots. There was minority support (38%) for online voting, but close to six in 10 (56%) felt online voting is risky.
A majority of 56% of candidates thought the spread of false information online was a problem in this election, somewhat down from the two-thirds who felt that way in 2019. As well, candidates were slightly less likely than in 2019 (38%, down 6 percentage points) to think foreign countries or groups using social media and other means to influence the political opinions of Canadians was a problem. Unchanged statistically is the one-in-10 proportion thinking hacking by foreign countries or groups into the computer systems that support the election was a problem.
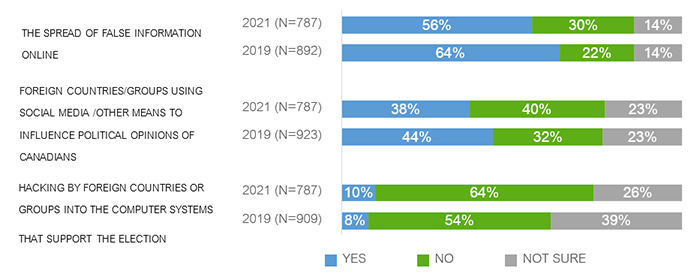
Q52: Based on what you have seen or heard recently, do you think any of the following were a problem in this election?
Base: Online respondents plus 1/3 of telephone respondents.
While the proportions agreeing these were problems are relatively similar across subgroups, the following are the more likely to agree regarding each:
Candidates were asked what actual impact, if any, they thought problems of electoral interference had on the outcome of the election.2
Overall, two in 10 candidates (21%) thought the spread of false information online had a major impact on the election outcome. The same proportion (22%) thought it had a moderate impact of the election outcome. These proportions are comparable to the proportions of candidates reporting in 2019 that the spread of false information online had a major (19%) or a moderate (22%) impact on the election outcome.
An equally low proportion of candidates (14%) thought foreign countries or groups using social media or other means to influence political opinions of Canadians had a major or a moderate impact on this election's outcome. While the proportion of those thinking it had a major impact is slightly on the rise compared to 2019 (9%), the proportion of those thinking it has a moderate impact remained stable (15% in 2019).
A lower proportion of candidates thought foreign countries or groups hacking into the computer systems that support the election had an impact in this election. Only 4% of candidates thought it had a major impact on the outcome of the election and 3% thought it had a moderate impact.
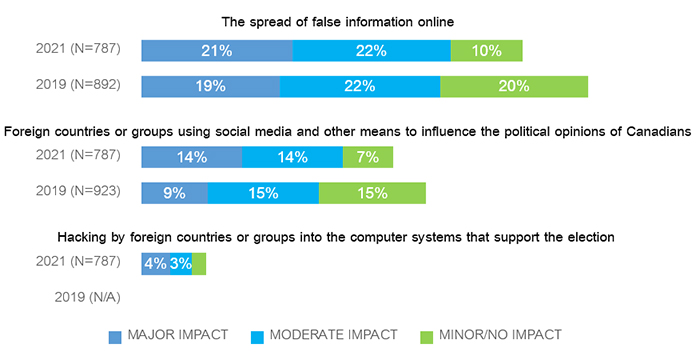
Text version of "Chart 50: Impact of perceived interference in election"
Q53: [TELEPHONE] What impact, if any, do you think this had on the outcome of the election?
[ONLINE] What impact, if any, do you think the following had on the outcome of the election?
Base: Online respondents plus 1/3 of telephone respondents.
Thinking each of these had a major impact on the election outcome is generally similar across subgroups; thinking that each was a major problem was higher among those whose party is not represented in the House of Commons.
Candidates were each asked one of two questions about technology use in elections, either about the lists of electors used at the polls or about the ballot-counting method.
Of those who were asked about their preference between paper or electronic voter lists, over four in 10 (44%) still preferred paper lists; just under three in 10 preferred computerized lists (28%), and two in 10 (22%) didn't have a preference between the two. These results are comparable to 2019.
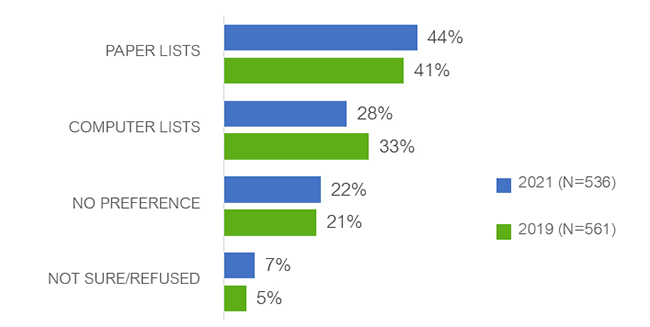
Text version of "Chart 51: Preference for paper or electronic lists of electors used at the polls"
Q54A: In a Canadian federal election, workers at the polls use paper lists to find a voter's name and keep track of who voted. In some provincial elections, poll workers use computers or tablets to do this electronically. Which method do you prefer?
Base: Half of sample.
Paper lists are preferred by higher proportions of the following groups:
Computerized lists are preferred by higher proportions of the following groups:
Among those who were asked about ballot-counting methods, over six in 10 (62%) expressed a preference for hand-counted ballots, notably higher than the just under half who preferred this in 2019. One in six (17%) preferred machine counting, down 14 percentage points from 2019. One in six expressed no preference (unchanged).
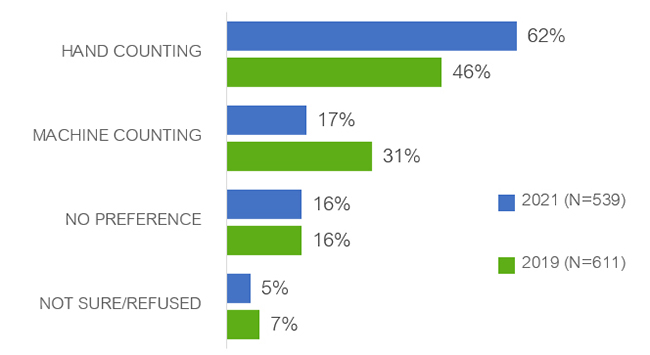
Text version of "Chart 52: Preference for machine or hand counting of paper ballots"
Q54B: In Canadian federal elections, each paper ballot is counted by hand. In some provincial elections, paper ballots are scanned into a machine that counts the votes. Which vote counting method do you prefer?
Base: Half of sample.
Hand-counting is preferred by higher proportions of the following groups:
Machine-counting is preferred by those in a party represented in the House of Commons (21% versus 9% in a non-represented party) and those born outside of Canada (25%, versus 16% born in Canada), but is otherwise similar by subgroup.
Candidates were asked one of two questions about online voting.
Among those who were asked if they think electors should be able to vote by using the Internet, just under four in 10 said they should, which is comparable to the proportion in 2019, but both are lower than the 54% in favour in 2015.
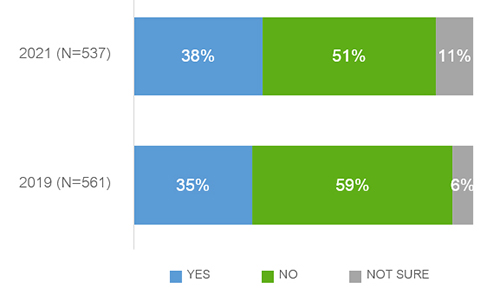
Text version of "Chart 53: If electors should be able to vote by using the internet"
Q55A: Do you think that electors should be able to vote by using the Internet?
Base: Half of sample.
A minority of candidates across all subgroups think electors should be able to vote online but the proportion is higher among the following:
Among those who were asked if online voting is risky or safe, close to six in 10 (56%) feel it is risky, three in 10 (31%) think it is safe, and one in 10 are unsure. The proportion who think it is risky is lower than in 2019, with a corresponding increase in those who think it is safe.
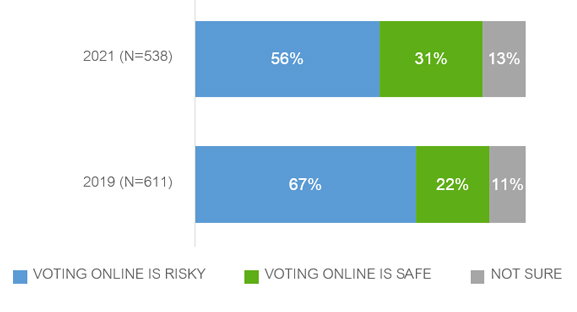
Text version of "Chart 54: If online voting is risky or safe"
Q55B: Which statement comes closest to your own view?
Base: Half of sample.
A minority of candidates across all subgroups think online voting is safe, but the proportion is higher among the following groups:
Over half of candidates (55%) were satisfied to some extent with the way democracy works in Canada; top reasons for dissatisfaction were the lack of proportional representation, or that first-past-the-post does not reflect voter preferences. Candidates are divided about lowering the voting age to 16, but marginally more likely to disagree (53%) than agree (46%). Just over half (54%) thought parties should be required to have more women candidates, but a slim majority (53%) disagreed that there should be financial incentives to accomplish this.
Over half of candidates in the 44th GE (55%) are satisfied to some extent with the way democracy works in Canada, and one-quarter (24%) are very satisfied. Both of these proportions are statistically higher than in 2019. Two in 10 are very dissatisfied.
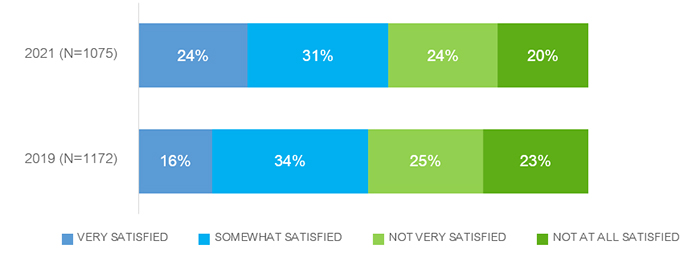
Text version of "Chart 55: Level of satisfaction with the way democracy works in Canada"
Q56: Overall, how satisfied are you with the way democracy works in Canada?
Base: All respondents. Includes those (<1%) who said "not sure."
A slim majority of most candidate subgroups were at least somewhat satisfied with the way democracy works in Canada, with some exceptions. The following groups were less often satisfied:
Those dissatisfied with the way democracy works in Canada (n=475) were most likely to cite the lack of proportional representation, or that first-past-the-post does not reflect voter preferences; these were also top responses in 2019. One in six made a general comment about the system being unfair or undemocratic, and a similar proportion said there was too much media bias or censorship. One in 10 or fewer gave other individual reasons for being dissatisfied with the way democracy works.
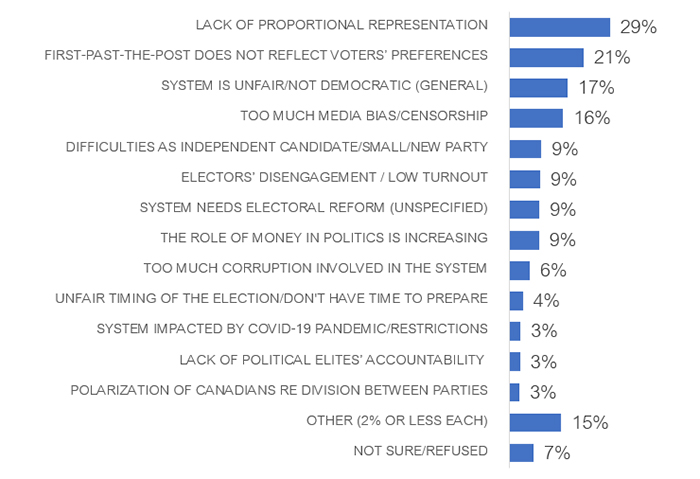
Text version of "Chart 56: Reasons for dissatisfaction with democracy in Canada"
Q57: Is there a specific reason why you are dissatisfied with the way democracy works in Canada?
Base: n=475: Those dissatisfied with the way democracy works in Canada.
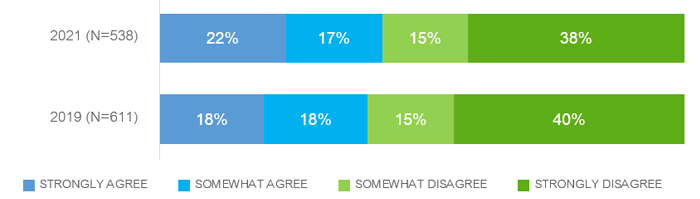
On the question of whether the federal voting age should be lowered from 18 to 16, strong disagreement (42%) outweighs strong agreement (30%) by 12 percentage points, no change since 2019.
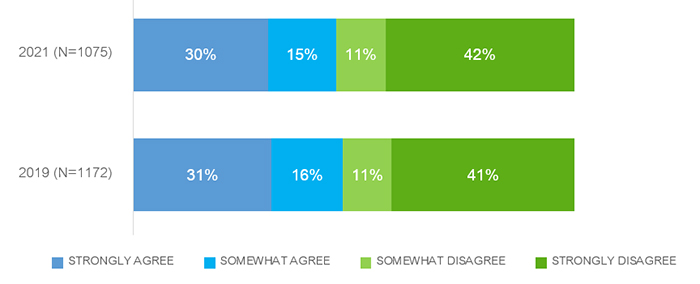
Text version of "Chart 57: Level of agreement with lowering the voting age"
Q58: How strongly do you agree or disagree that the voting age in a federal election should be lowered from 18 to 16 years old?
Base: All respondents. Includes those (2%) who said "not sure."
Candidates from the following groups were more likely to agree to some extent that the voting age should be lowered to 16:
Candidates were each asked one of two questions regarding increasing the proportion of women candidates.
On whether political parties should be required to have more women candidates, just over half (54%) agreed to some extent with this premise, and one-third agreed strongly; both of these measures have increased from 2019.
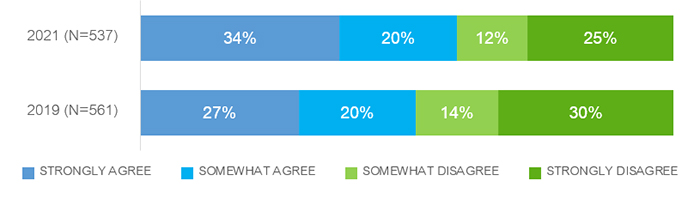
Q59: How strongly do you agree or disagree that…
Base: Half of sample. Includes those (9%) who said "not sure."
Overall agreement is higher among the following:
When asked if political parties should receive financial incentives to have more candidates who are women, as in 2019 there is slim majority disagreement (53%, statistically similar to 55%), and close to four in 10 strongly disagree.
Q59: How strongly do you agree or disagree that…
Base: Half of sample. Includes those (8%) who said "not sure."
Overall agreement that financial incentives should be provided to encourage political parties to include more women is the minority view across most subgroups, but higher among the following:
The following tables describe the weighted socio-demographic characteristics of respondents to the survey.
| British Columbia | 11% |
|---|---|
| Alberta | 10% |
| Prairies/Territories | 9% |
| Ontario | 34% |
| Quebec | 28% |
| Atlantic | 8% |
| 1 | 58% |
|---|---|
| 2+ | 39% |
| 18-34 | 19% |
|---|---|
| 35-49 | 33% |
| 50-59 | 26% |
| 60+ | 21% |
| Male | 62% |
|---|---|
| Female | 38% |
| Born in Canada | 81% |
|---|---|
| Born outside Canada | 17% |
| White | 72% |
|---|---|
| South Asian | 6% |
| Black | 3% |
| Latin American | 2% |
| Chinese | 2% |
| Other ethnicity | 11% |
| Indigenous | 5% |
|---|---|
| Non-Indigenous | 88% |
| Prefer not to say | 7% |
| English | 71% |
|---|---|
| French | 24% |
| Other | 4% |
| Yes | 10% |
|---|---|
| No | 88% |
| Not sure/not stated | 2% |
| Less than high school | 2% |
|---|---|
| High school | 4% |
| Some or full college/vocational/trade school | 14% |
| Some university | 8% |
| Completed university | 36% |
| Post grad | 33% |
| Lower | <$20K | 4% |
|---|---|---|
| $20K-$39K | 8% | |
| Middle | $40K-$59K | 8% |
| $60K-$79K | 9% | |
| $80K-$99K | 10% | |
| Higher | $100K+ | 44% |
1 Household income ranges are defined in the socio-demographics section.
2 Only respondents who said that they thought there had been a problem with electoral interference were asked what impact they thought that problem had on the outcome of the election. To allow for comparison of the results across the different forms of electoral interference, the results were rebased to include all respondents, including those who did not think there had been a problem. For example, among the 56% candidates who felt that the spread of false information online was a problem in this election, 38% thought it had a major impact on the election outcome. Of the 38% who believed foreign countries or groups using social media or other means to influence political opinions of Canadians was a problem, 38% thought it had a major impact on the election outcome. Among those (10%) who thought foreign countries or groups hacking into the computer systems that support the election was a problem, just under half (46%) said it had a major impact on the election.