National Electors Study following the 44th Canadian Federal Election: Report on Voter Experience Detailed Findings
1. Attitudes and Past Voting Behaviour
This section of the report presents findings that relate to electors' election-period views on politics and voting along with their past voting behaviour.
Nine in 10 at least somewhat interested in politics
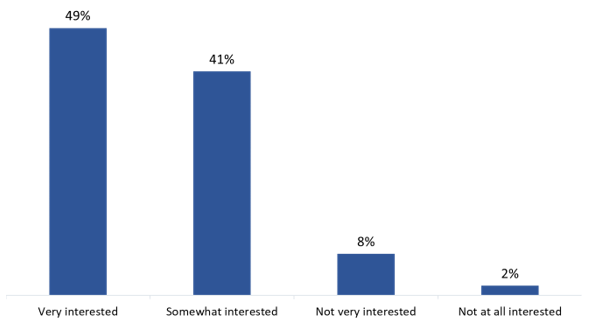
Among respondents to the election period survey, the vast majority (90%) said they are at least somewhat interested in politics, including nearly half (49%) who are very interested. Conversely, 8% of respondents said they are not very interested in politics, with an additional 2% saying they are not at all interested.
Figure 1: Interest in politics
Q: In general, how interested are you in politics? Base: n=53,731; all respondents. [DK/NR: <0.5%]. [WAVE 1]
Text version of Figure 1: Interest in politics
This vertical bar chart shows the level of interest respondents had in politics. The breakdown is as follows:
Very interested, 49 percent
Somewhat interested, 41 percent
Not very interested, 8 percent
Not at all interested, 2 percent
The following subgroups of electors were less likely to be very interested in politics:
electors with a disability (46%) compared to those with no disability (50%)
18- to 24-year-olds (41%) compared to Canadians aged 35 and older (51%)
women (43%) compared to men (55%)
Eight in 10 described voting as a duty first and foremost
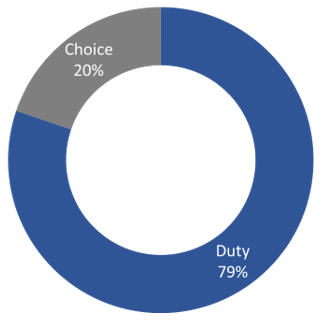
When asked if they personally think voting is first and foremost a duty or a choice, eight in 10 (79%) said they view voting as a duty. Two in 10 (20%) said they view voting as a choice.
Figure 2: Is voting a duty or a choice?
Q: For some people, voting is a [duty/choice], for others it is a [choice/duty]. For you personally, is voting first and foremost a [duty/choice] or a [choice/duty]? Base: n=53,731; all respondents [DK/NR: 1%]. [WAVE 1].
Text version of Figure 2: Is voting a duty or a choice?
This pie chart shows the percentage of respondents who felt that voting was either a duty or a choice. 79 percent felt voting was a duty. 20 percent felt voting was a choice.
The following were less likely to view voting as a duty:
men (77%) compared with women (82%)
Indigenous electors (68% versus 82% of non-Indigenous electors)
those uninterested in politics (63% versus 83% of those who are interested)
In addition, the likelihood of viewing voting as a duty
decreased as the severity of a disability increased, from 82% of those with no disability to 74% of those with a very severe disability, but
increased with age, from 75% among ages 18 to 24 to 84% among ages 55 and up, and
increased with level of education, from 69% of electors with a high school education or less to 84% of electors who completed university.
Vast majority said they voted in the previous federal election
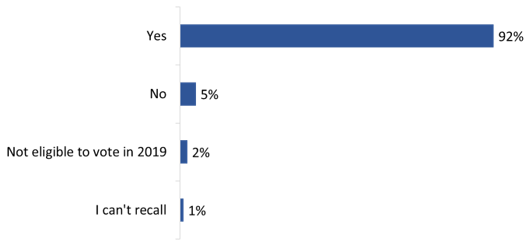
Nine in 10 (92%) respondents eligible to vote in 2019 said they voted in the previous federal election, held on October 21, 2019. Only 2% were ineligible to vote in 2019, which means they were new electors in 2021.
Figure 3: Voting in the 2019 federal election
Q: Did you vote in the previous federal election held on October 21, 2019? Base: n=53,731; all respondents. [WAVE 1]
Text version of Figure 3: Voting in the 2019 federal election
This horizontal bar chart shows the percentage of respondents who reported that they voted in the previous federal election. The breakdown is as follows:
Yes, 92 percent
No, 5 percent
Not eligible to vote in 2019, 2 percent
I can't recall, 1 percent
The following were less likely to say they voted in the 2019 federal general election:
electors with a disability (90%), compared to those with no disability (93%)
Indigenous electors (88%), compared to non-Indigenous electors (93%)
those uninterested in politics (79%), compared to those who are interested (94%)
those who view voting as a choice (81%), compared to those who view it as a duty (96%)
2. Voter Registration
This section details electors' experience and knowledge with voter registration during and after the 2021 federal election.
Majority received a VIC and nearly all said the address and name were correct
Post-election, nine in 10 (92%) of those aware of the federal election said they received a voter information card (VIC) in the mail addressed to them personally; the VIC serves to notify electors of their registration.footnote 1
Virtually everyone who recalled receiving a VIC said their name (98%) and address (98%) on the card were correct, with the following notable differences:
Non-binary/transgender electors were less likely to have received a VIC with their correct name (91% compared with 98% of women and 99% of men).
Youth aged 18 to 24 were less likely than those aged 25 to 34 and 35 and older to have received a VIC with their correct address (95% compared with 97% and 99%).
Electors who had moved in the last 12 months were less likely to have received a VIC with their correct address (94% compared with 99% of those who had not moved).
One-quarter made sure they were registered correctly for the 44th GE
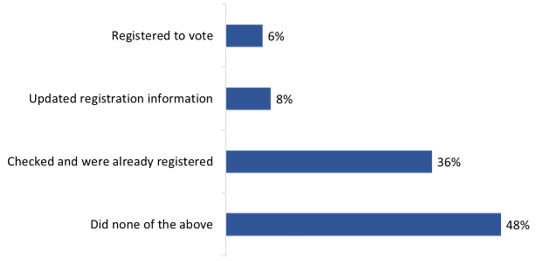
Electors were asked what, if anything, they did during the election period to make sure they were registered to vote in the 44th GE. One-half (51%) of electors said they had made sure they were registered to vote in the election: 36% said they checked that they were already registered to vote; 8% said they updated their registration information; and 6% said they registered to vote recently.
Figure 4: Registered or updated information during the election
Q: What, if anything, did you do to make sure you were registered to vote in this federal election? Did you...? Base: n=39,516. [DK/NR: 1%]. [WAVE 1 + WAVE 2]
Text version of Figure 4: Registered or updated information during the election
This horizontal bar chart shows the actions taken by respondents to make sure they were registered to vote. The breakdown is as follows:
Registered to vote, 6 percent
Updated registration information, 8 percent
Checked and were already registered, 36 percent
Did none of the above, 48 percent
The following groups were more likely to have updated their registration information:
18- to 24-year-olds (11%) and 25- to 34-year-olds (12%) versus 7% of those 35 and older
electors with a disability (9% versus 7% of those with no disability)
non-binary/transgender electors (18% versus 8% of female electors and 8% of male electors)
those who did not receive a VIC (16% versus 7% of those who did)
electors who had moved in the last 12 months (30% versus 4% of those who had not)
The following groups were more likely to have registered to vote:
18- to 24-year-olds (15% versus 7% of 25- to 34-year-olds and 5% of those 35 and older)
new Canadians (14% versus 7% of immigrants who became citizens before the 2015 election and 6% of Canadians by birth)
non-binary/transgender electors (12% versus 6% of female electors and 7% of male electors)
Indigenous electors (9% versus 6% of non-Indigenous electors)
those who did not receive a VIC (17% versus 6% of those who did)
electors who had moved in the last 12 months (11% versus 6% of those who had not)
Non-voters were more likely to have done nothing to make sure they were registered (62%) than those who voted in the 2021 election (48%).
Nearly all found it easy to make sure they were registered
Among those who made sure they were registered to vote, almost everyone found it easy to some degree (94%). Three-quarters (76%) said they found it very easy, while 19% said they found it somewhat easy. In contrast, only 3% said they found it somewhat difficult, and 1% said very difficult. These proportions are similar to 2019, when 96% said it was easy and 77% said it was very easy to make sure they were registered.
Figure 5: Ease of registration
Ease of making sure elector was registered by action taken
Registered
Updated registration
Checked registration
Overall
Very easy
70%
64%
79%
76%
Somewhat easy
21%
26%
17%
19%
Somewhat difficult
4%
5%
2%
3%
Very difficult
1%
1%
<0.5%
1%
Q. How easy or difficult was it to make sure you are registered? Base: n=26,050; respondents who made sure they were registered. [DK/NR: 3%]. [WAVE 1 + WAVE 2]
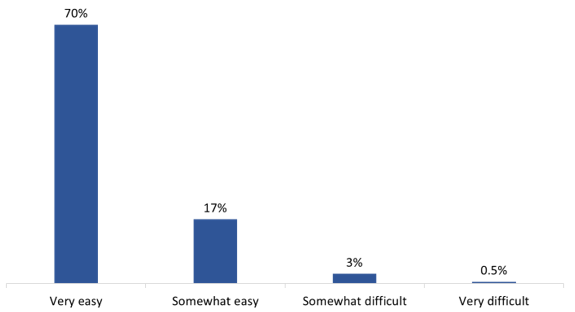
Electors were less likely to say it was very easy if they had to register (70%) or update their registration information (64%) compared with those who only had to check that they were already registered with the correct information (79%).
Groups that were more likely to have needed to register or update their registration information were consequently less likely to say it was very easy for them to make sure they were registered:
18- to 24-year-olds (62% versus 72% of 25- to 34-year-olds and 79% of those 35 and older)
new Canadians (71% versus 75% of immigrants who became citizens before the 2015 election and 76% of Canadians by birth)
electors with a disability (72% versus 78% of those with no disability)
non-binary/transgender electors (62% versus 78% of female electors and 74% of male electors)
Indigenous electors (69% versus 76% of non-Indigenous electors)
those who did not receive a VIC (57% versus 78% of those who did)
electors who had moved in the last 12 months (67% versus 78% of those who had not)
Six in 10 used the VIC to make sure they were registered correctly
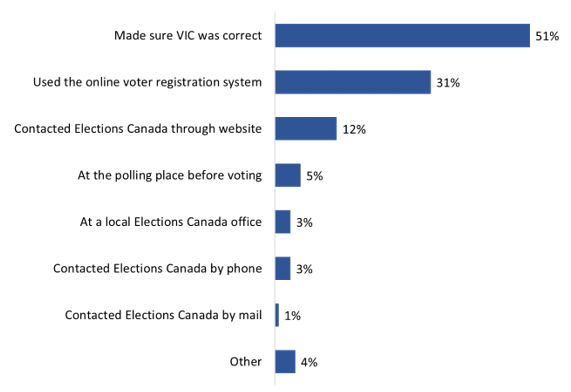
A majority (51%) of respondents who made sure they were registered said they did so by checking that the information on their VIC was correct. Nearly one-third (31%) used the online voter registration system, while 12% said they contacted Elections Canada through its website.
Additional actions were taken by smaller proportions of electors. These included checking at the polling place before voting (5%), checking at the local Elections Canada office (3%), and contacting Elections Canada by phone (3%) or by mail (1%).
Figure 6: Method used to check/update voter registration
Q: How did you make sure you were registered? Base: n=19,617; respondents who registered, checked or updated their voter registration. [DK/NR: 2%]. [WAVE 2]
Text version of Figure 6: Method used to check/update voter registration
This horizontal bar chart shows the methods used by respondents to register, check or update their voter registration. The breakdown is as follows:
Made sure VIC was correct, 51 percent
Used the online voter registration system, 31 percent
Contacted Elections Canada through website, 12 percent
At the polling place before voting, 5 percent
At a local Elections Canada office, 3 percent
Contacted Elections Canada by phone, 3 percent
Contacted Elections Canada by mail, 1 percent
Other, 4 percent
Use of the online registration system was more likely among the following groups:
electors aged 18 to 24 (56%) and 25 to 34 (47%) (versus 24% of those 35 or older)
new Canadians (54% versus 33% of immigrants who became citizens before the 2015 GE and 31% of Canadians by birth)
electors who had moved in the last 12 months (47% versus 28% of those who had not)
Contact with Elections Canada
This section discusses electors' interaction with Elections Canada and its website during the election period, including their level of satisfaction with the service received during these interactions.
One in 10 contacted Elections Canada during the election period; most who contacted EC used Internet or phone
One in 10 (11%) respondents in the post-election survey said they contacted Elections Canada during the election period. This is similar to the 12% who said they contacted Elections Canada during the 2019 GE.
The likelihood of contacting Elections Canada was higher among women (12% versus 10% of men), those 55 years or older (14% versus 9% of both 18- to 34-year-olds and 35- to 54-year-olds) and electors with a disability (13% versus 10% of those with no disability).
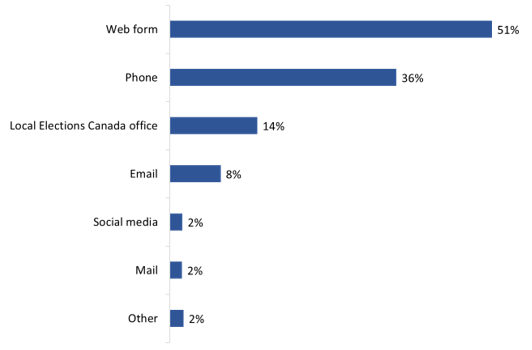
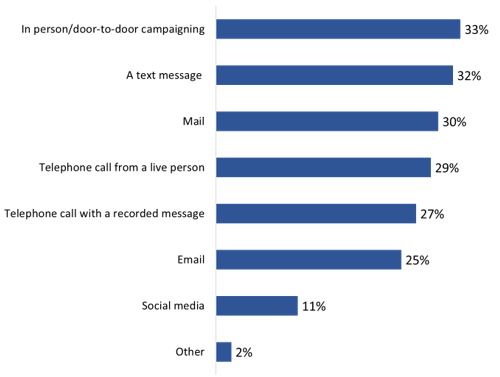
Electors who contacted Elections Canada were most likely to do so through a web form on the Elections Canada website (51%), a significant increase from 39% in the 2019 election. This was followed by phone at 36% (unchanged from 2019). Fewer than one in five (14%) visited a local Elections Canada office, while 8% used email to contact Elections Canada. Smaller proportions of respondents used social media and mail (2% each).
Figure 7: Methods used to contact EC during the campaign
Q: How did you contact Elections Canada? Base: n=4,461; online survey respondents who contacted EC during the election period. [DK/NR: <0.5%]. [WAVE 2]
Text version of Figure 7: Methods used to contact EC during the campaign
This horizontal bar chart shows the methods respondents used to contact Elections Canada during the election period. The breakdown is as follows:
Web form, 51 percent
Phone, 36 percent
Local Elections Canada office, 14 percent
Email, 8 percent
Social media, 2 percent
Mail, 2 percent
Other, 2 percent
The likelihood of using the phone to contact EC increased with severity of one's disability, from 34% of those who identified having no disability to 43% of those with a severe or very severe disability, and decreased as age increased, from 53% of 18- to 24-year-olds to 34% of those aged 35 and older.
Majority were satisfied with service received from EC
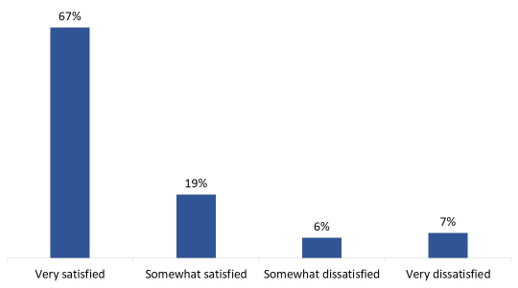
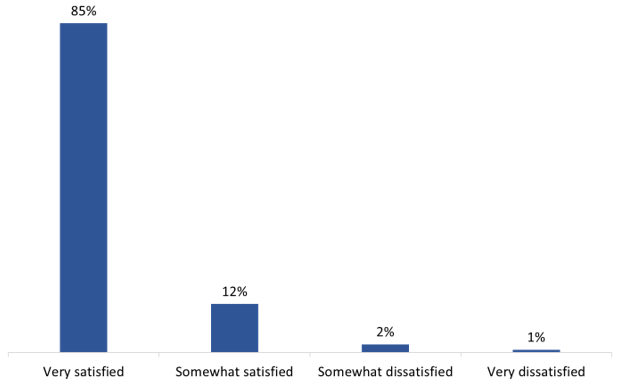
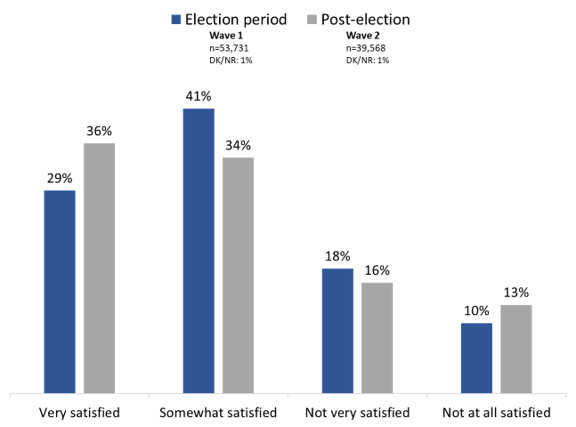
The majority (86%) of those who contacted Elections Canada during the election period were satisfied with the service they received, including two-thirds (67%) who were very satisfied. Slightly more than one in 10 expressed some degree of dissatisfaction (6% were somewhat dissatisfied, and 7% were very dissatisfied).
Figure 8: Satisfaction with service received from contacting EC
Q: How satisfied were you with the service you received when you contacted Elections Canada? Base: n=4,461; online survey respondents who contacted EC during the election period. [DK/NR: 1%]. [WAVE 2]
Text version of Figure 8: Satisfaction with service received from contacting EC
This vertical bar chart shows respondents' level of satisfaction with the service they received from contacting Elections Canada. The breakdown is as follows:
Very satisfied, 67 percent
Somewhat satisfied, 19 percent
Somewhat dissatisfied, 6 percent
Very dissatisfied, 7 percent
Those less likely to be very satisfied with the service they received from Elections Canada included electors aged 18 to 34 (57% versus 64% of those aged 35 to 54 and 72% of those aged 55 and older), electors with a disability (65% versus 70% of electors with no disability) and those who did not receive a VIC (63% versus 69% of those who did).
More than one-third visited EC's website during the election period; satisfaction was high among those who did
More than one-third (38%) of electors said they visited Elections Canada's website during the election period. This represents an increase from 35% in the 2019 National Electors Study and 23% in the 2015 Survey of Electors. The likelihood of visiting the website was higher among those who did not receive a VIC (62% versus 36% of those who received a VIC), new Canadians (58% versus 39% of those who became citizens before the 2015 GE and 38% of Canadians by birth), electors aged 18 to 24 (57%) and 25 to 34 (51%) compared with those 35 and older (33%), and youth attending school (62% versus 51% of youth working full-time, 50% of NEET youth and 49% of all other youth).
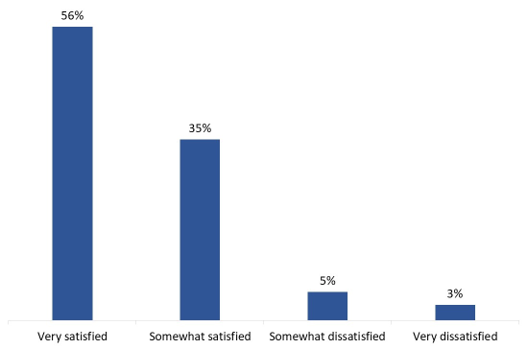
Of those who visited Elections Canada's website, most were somewhat (35%) or very (56%) satisfied with their experience using it.
Figure 9: Satisfaction with experience on EC website
Q: How satisfied were you with your experience using Elections Canada's website? Base: n=14,731; online survey respondents who visited EC's website. [DK/NR: 1%.] [WAVE 2]
Text version of Figure 9: Satisfaction with experience on EC website
This vertical bar chart shows respondents' level of satisfaction with their experience on the Elections Canada website. The breakdown is as follows:
Very satisfied, 56 percent
Somewhat satisfied, 35 percent
Somewhat dissatisfied, 5 percent
Very dissatisfied, 3 percent
4. Voter Participation
This section reports on issues related to voter participation.
Respondents' intention to vote was high throughout the 2021 election period
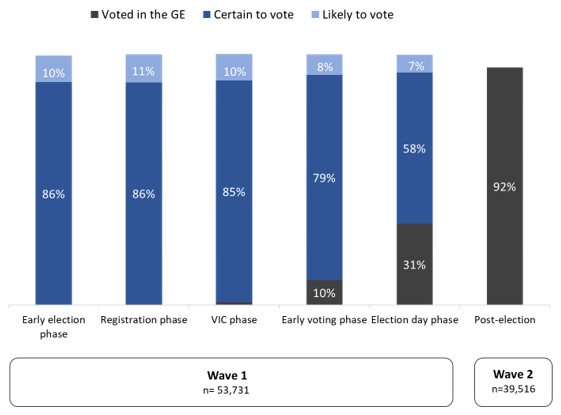
As part of the election period survey, electors were asked how likely it was that they would vote in the GE. At least four in five electors indicated that they were certain to vote or that they had already voted when they completed the survey. By the final week of the election period leading up to election day,footnote 2 90% of surveyed electors indicated that they had either already voted (31%) or were certain to vote (58%); a further 7% said they were likely to vote.
Among post-election survey respondents aware of the 2021 GE, 92% said they voted in the election.footnote 3
Figure 10: Vote intention and participation
Q: How likely or unlikely is it that you will vote in the federal election? [DK/NR: <2%] [WAVE 1].
Q. Many people don't or can't vote for a variety of reasons. Which of the following statements describes you? [DK/NR: <2%] [WAVE 1 + WAVE 2].
Text version of Figure 10: Vote intention and participation
This vertical bar chart shows respondents' vote intention and participation throughout the phases of the election period and post-election. The breakdown is as follows:
Early election phase
Certain to vote, 86 percent
Likely to vote, 10 percent
Registration phase
Certain to vote, 86 percent
Likely to vote, 11 percent
Voter information card phase
Voted in the general election, 1 percent
Certain to vote, 85 percent
Likely to vote, 10 percent
Early voting phase
Voted in the general election, 10 percent
Certain to vote, 79 percent
Likely to vote, 8 percent
Election day phase
Voted in the general election, 31 percent
Certain to vote, 58 percent
Likely to vote, 7 percent
Post-election
Voted in the general election, 92 percent
In the election-period survey, the following subgroups of electors were less likely to say that they would be likely or certain to vote:
electors with a severe/very severe disability (86% versus 88% of electors with a mild/moderate disability and 89% of electors with no disability)
18- to 24-year-olds (85% compared to 88% of 25- to 34-year-olds and 89% of 35 and older)
those not interested in politics (82% versus 89% of those interested in politics)
those who view voting as a choice (83%) compared to a duty (90%)
those who were eligible but did not vote in 2019 (68%) compared to those who voted (90%)
Post-election, electors less likely to report that they voted include:
Indigenous electors (81% compared to 93% of non-Indigenous electors)
First Nations electors who live on a reserve (52% compared to 82% of First Nations who do not live on a reserve)
new Canadians (89% compared to 92% of immigrants who became citizens before the 2015 election and 92% of Canadians by birth)
NEET youth (86% compared to 91% of youth working full-time, 91% of youth attending school and 91% of all other youth)
those who did not receive a VIC during the election (80% versus 93% of those who did)
those who were eligible but did not vote in 2019 (51% versus 94% of those who voted in 2019)
those uninterested in politics (79% versus 94% of those interested in politics)
those who view voting as a choice (80%) compared to a duty (95%)
those not vaccinated for COVID-19 (85%) compared to those vaccinated with at least one dose (93%)
Furthermore, the likelihood of reporting having voted decreased as the severity of an elector's disability increased, from 94% of those with no disability to 78% of those with a very severe disability; and it increased with age, from 89% of those aged 18 to 24 to 94% of those aged 65 and older.
Political reasons most cited reason for not voting
Respondents who were aware of the election but who did not vote (n=2,576) were most likely to point to political reasons (35%) as the main reason why they did not vote. This was followed by everyday life reasons (24%) and reasons related to the electoral process (19%). A further 6% said the main reason they did not vote was related to the pandemic, most often because they did not feel comfortable going to vote due to COVID-19 (5%). Thirteen percent mentioned some other reason.
Electoral process–related reasons for not voting were higher in the 2021 NES (19%) compared with the 2019 NES (12%). This increase can be mainly attributed to the 5% of those who did not vote due to lineups being too long, compared with 1% in 2019. The other part can be attributed to new electoral process reasons related to voting by mail, with 2% saying they did not vote due to missing the mail-in ballot deadline and another 2% saying they tried to vote by mail but did not receive their ballot in time.footnote 4
The table below provides a detailed breakdown of the reasons why respondents did not vote during the 44th GE in 2021, alongside reasons given for the 43rd GE in the 2019 National Electors Study.
Figure 11: Main reason for not voting in GE
Reason for not voting (%)
2021 (n=2,576)
2019 (n=1,751)
Political reasons
35%
43%
Did not like candidates, parties or campaign
13%
14%
Felt voting would not make a difference
12%
10%
Not interested in politics
4%
9%
Did not know who to vote for
3%
7%
Lack of information about campaign issues and parties' positions
3%
4%
Everyday life or health reasons
24%
29%
Too busy
8%
11%
Out of town/away from home
10%
10%
Illness or disability
7%
8%
Electoral process–related reasons
19%
12%
Transportation problem/polling station too far
2%
3%
Not on voters list
1%
2%
Polling place was not accessible
1%
2%
Issues with the voter information card
1%
1%
Could not prove identity or address
2%
1%
Lack of information about voting process (e.g., when/where to vote)
2%
1%
Lineups were too long
5%
1%
Voting process was not accessible
1%
1%
Missed the mail-in ballot deadline
2%
-
Tried to vote by mail but did not receive ballot in time
2%
-
COVID-19 reasons
6%
-
Did not feel comfortable going to vote due to COVID-19
5%
-
Needed to quarantine due to exposure to COVID-19
2%
-
Other reasons
16%
16%
Religious or other beliefs
2%
2%
Forgot to vote
3%
2%
Other reasons
9%
10%
No particular reason
1%
-
Don't know
1%
2%
Q. What is the main reason you did not vote? Base: n=2,576; respondents aware of the election but did not vote. [WAVE 2]
Political reasons for not voting were more likely to be identified by the following groups of non-voters:
men (40%) compared to women (30%)
electors with no disability (44%) compared to those with a disability (39%)
youth aged 25 to 34 (42%) compared to youths aged 18 to 24 (34%) and those aged 35 and older (33%)
NEET youth (45%) and youth working full-time (42%) compared with youth attending school (33%)
electors who are uninterested in politics (48%) compared to those interested in politics (30%)
those who were not vaccinated against COVID-19 (44%) compared with those who had received at least one dose (33%)
those who view voting as a choice (45%) compared with those who view it as a duty (24%)
those who were eligible to vote in 2019 but did not vote (45%) compared with those who did (31%)
Everyday life reasons for not voting were more likely to be identified by the following:
seniors aged 65 and older (29%) versus those aged 18 to 64 (23%)
those interested in politics (28%) versus those who are uninterested (16%)
those who view voting as a duty (32%) versus those who view it as a choice (17%)
Electoral process–related reasons for not voting were more likely to be identified by the following:
women (23%) compared to men (16%)
Indigenous electors (23%) compared with non-Indigenous electors (19%)
electors who have a disability (21%) versus those who do not (18%)
youth aged 18 to 24 (23%) compared with youth aged 25 to 34 (16%)
new Canadians (35%) compared to Canadians by birth (19%)
2021 non-voters who did vote in 2019 (21%) versus those who did not vote in 2019 (14%)
those who had moved in the last 12 months (28%) versus those who had not (17%)
those who did not receive a VIC (30%) compared with those who did (17%)
electors in Ontario (23%) and Quebec (20%) compared with those in the Prairies (10%)
COVID-19–related reasons for not voting were more likely to be identified by women (8%) compared with men (4%).
Voting at advance polls and by mail increased in the 2021 election
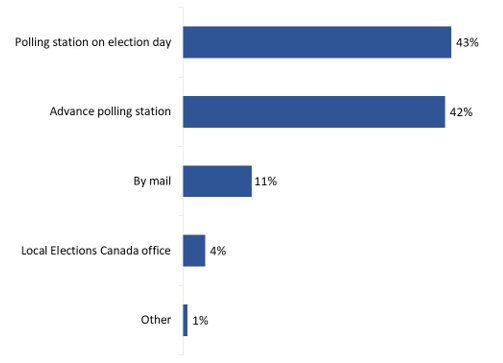
Most electors who said they voted in the 2021 federal election reported voting at a polling station on election day (43%) or at an advance polling station (42%). Compared to the 2019 NES and 2015 Survey of Electors, this represents a decrease in election day voting (57% reported in 2019 and 73% reported in 2015) and an increase in advance voting (37% reported in 2019 and 25% in 2015).
As was the case in 2019, self-reported voting at advance polls in the 2021 NES is overreported considering the Official Voting Results for the 44th GE, where 34% of valid votes were cast at an advance poll. Still, the increase in self-reported advance voting is consistent with the trend, if not the magnitude, of increasing advance voting that has been observed across previous surveys and official results through multiple past elections.
Eleven percent of voters reported that they voted by mail (compared to <0.5% in 2019), which is similarly overreported, but again it reflects the increase in voting by special ballot that was observed in the 2021 election footnote 5 amid the greater promotion and awareness among electors of the option to vote by mail due to the COVID-19 pandemic. footnote 6 It should also be noted, however, that some amount of this overreporting is due to a measurement error that was observed and corrected partway through the data collection. footnote 7
Figure 12: Method used to vote in the GE
Q: You mentioned that you voted. In order to vote, how or where did you receive your ballot? Base: n=35,838; respondents who voted in the federal election. [DK/NR: <0.5%]. [WAVE 1 + WAVE 2]
Text version of Figure 12: Method used to vote in the GE
This horizontal bar chart shows the methods respondents used to vote in the federal election. The breakdown is as follows:
Polling station on election day, 43 percent
Advance polling station, 42 percent
By mail, 11 percent
Local Elections Canada office, 4 percent
Other, 1 percent
The following groups of voters were more likely to say they voted at a polling station on election day:
voters aged 18 to 34 (50%) and 35 to 54 (48%) compared with those aged 55 and older (36%)
voters in rural areas (48%) compared with those in urban areas (42%)
Indigenous voters (50%) compared with non-Indigenous voters (43%)
First Nations voters who live on a reserve (71%) compared with First Nations who do not (48%)
voters who had not been vaccinated for COVID-19 (51%) compared with those who had received at least one dose (43%)
The following were more likely to say they voted at an advance polling station:
seniors aged 65 years and older (49%) versus those aged 18 to 64 (39%)
those who completed university (44%) compared with some post-secondary or college (40%) or a high school education or less (39%)
The following were more likely to say they voted by mail:
voters in British Columbia (14%) and Ontario (12%) compared with other provinces (results range from 8% to 9%)
urban voters (11%) compared with rural voters (8%)
voters with a severe/very severe disability (15%) compared with voters who have a mild/moderate disability (11%) or no disability (10%)
5. Getting to the Polling Place
This section of the report discusses issues relating to the experience of voters in getting to and accessing the polling place.
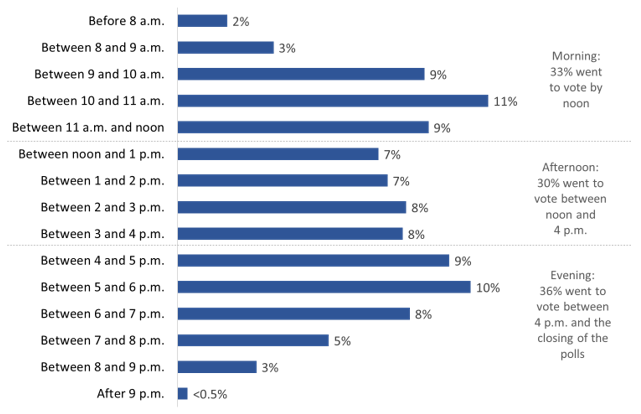
Almost four in 10 election day voters went to the polls in the evening
Across the country on election day, polls were open for 12 hours, which varied based on time zone. footnote 8
Electors who said they went to vote on election day (n=15,204) did so throughout the day. While it was generally evenly split, more went in the evening period between 4:00 p.m. and the closing of the polls (36%). This was closely followed by one-third (33%) indicating they went to vote in the morning between the opening of the polls and noon, and three in 10 (30%) who went in the afternoon between noon and 4 p.m.
Figure 13: Time of day when went to vote – election day
Q: Do you remember approximately what time it was when you went to the [polling station/advance polling station/local Elections Canada office]? Base: n=15,204; voters who voted on election day. [DK/NR: 1%] [WAVE 1 + WAVE 2]
Text version of Figure 13: Time of day when went to vote – election day
This horizontal bar chart shows the time of day respondents went to vote on election day. The breakdown is as follows:
Before 8 a.m., 2 percent
Between 8 and 9 a.m., 3 percent
Between 9 and 10 a.m., 9 percent
Between 10 and 11 a.m., 11 percent
Between 11 and noon, 9 percent
Between noon and 1 p.m., 7 percent
Between 1 and 2 p.m., 7 percent
Between 2 and 3 p.m., 8 percent
Between 3 and 4 p.m., 8 percent
Between 4 and 5 p.m., 9 percent
Between 5 and 6 p.m., 10 percent
Between 6 and 7 p.m., 8 percent
Between 7 and 8 p.m., 5 percent
Between 8 and 9 p.m., 3 percent
After 9 p.m., less than 0.5 percent
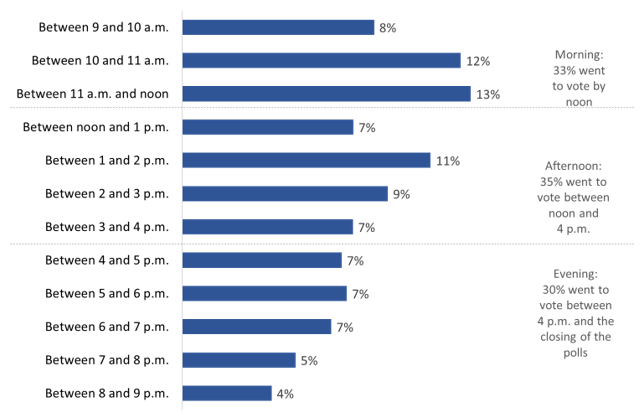
Roughly one-third of advance voters went to vote during the afternoon
During the four days of advance voting, advance polls across the country were open from 9:00 a.m. to 9:00 p.m. (local time).
Of those who said they voted at an advance poll (n=15,070), slightly more than one-third (35%) reported that they went to vote in the afternoon between noon and 4 p.m. This was closely followed by another third (33%) who went to vote in the morning and 30% who went in the evening.
Figure 14: Time of day when went to vote – advance poll
Q: Do you remember approximately what time it was when you went to the [polling station/advance polling station/local Elections Canada office]?
Base: n=15,070; voters who voted at an advance poll. [DK/NR: 2%] [WAVE 1 + WAVE 2]
Text version of Figure 14: Time of day when went to vote – advance poll
This horizontal bar chart shows the time of day respondents went to vote at advance polls. The breakdown is as follows:
Between 9 and 10 a.m., 8 percent
Between 10 and 11 a.m., 12 percent
Between 11 and noon, 13 percent
Between noon and 1 p.m., 7 percent
Between 1 and 2 p.m., 11 percent
Between 2 and 3 p.m., 9 percent
Between 3 and 4 p.m., 7 percent
Between 4 and 5 p.m., 7 percent
Between 5 and 6 p.m., 7 percent
Between 6 and 7 p.m., 7 percent
Between 7 and 8 p.m., 5 percent
Between 8 and 9 p.m., 4 percent
Private vehicle top method to get to polling place
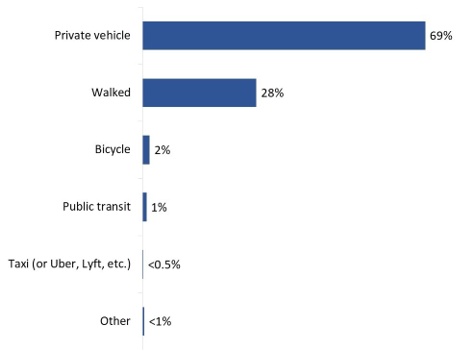
Of those who said they voted, just over two-thirds (69%) said they used a private vehicle to get to the polling place. Roughly three in 10 (28%) said they walked to the voting place.
Figure 15: Means of transportation used when going to vote
Q: You mentioned that you received your ballot at [the polling station/the advance polling station/a local Elections Canada office]. What kind of transportation did you take to get there? Base: 31,558; those who voted. [DK/NR: <0.5%]. [WAVE 2]
Text version of Figure 15: Means of transportation used when going to vote
This horizontal bar chart shows the means of transportation respondents used to get to the polling place. The breakdown is as follows:
Private vehicle, 69 percent
Walked, 28 percent
Bicycle, 2 percent
Public transit, 1 percent
Taxi (or Uber, Lyft, etc.), less than 0.5 percent
Other, less than 1 percent
The following were more likely to say they walked to the polling place:
urban voters (30%) compared with rural voters (10%)
election day voters (33%) compared with advance-poll voters (24%) and local EC office voters (11%)
The likelihood of walking to the polling place decreased as age increased (from 34% of those aged 18 to 34 to 24% of those aged 55 and older) and as the severity of one's disability increased (from 30% of those with no disability to 22% of those with a severe/very severe disability). Conversely, it increased as education level increased (from 19% of those with a high school diploma to 23% of those with some post-secondary or college and up to 33% of those who completed university).
The following were more likely to say they used a private vehicle:
voters in rural areas (89%) compared to those in urban areas (66%)
voters in the Atlantic provinces (85%) compared with all other provinces (results range from 63% to 79%)
electors with a disability (71%) versus those with no disability (67%)
Indigenous electors (75%) compared to non-Indigenous electros (68%)
local EC office voters (82%) and advance-poll voters (73%) versus election day voters (63%)
Half said it took no more than five minutes to get to the polling place; nearly all said the distance from their home was reasonable
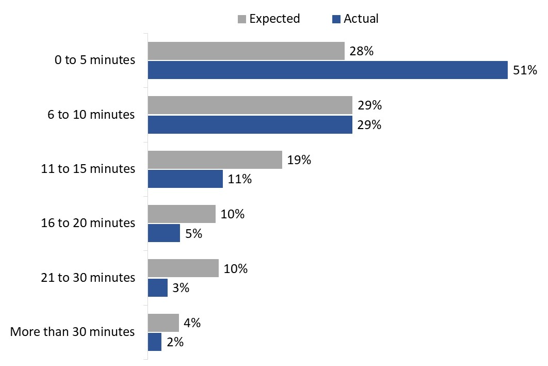
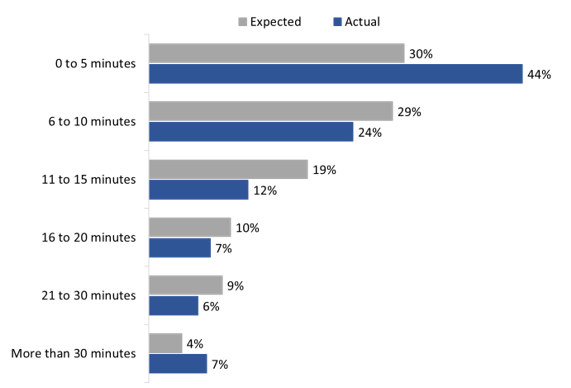
In the post-election survey, half (51%) of respondents who voted in person said it took them five minutes to get to the polling place. This is better than what electors expected: in the election period survey, only 28% of electors expected it would take five minutes or less. Three in 10 (29%) voters said their actual travel time was six to 10 minutes, while two in 10 (20%) said it took them more than 10 minutes.
Overall, voters spent slightly longer travelling to the polls in 2021 compared with 2019: on average, voters spent 12 minutes getting to the polls on election day and 14 minutes getting to the advance polls, compared with average travel times of 9 minutes for both election day and advance polls reported in 2019.
Even so, almost all respondents (97%) said that the voting place was located a reasonable distance from their home; of these, 86% said it was very reasonable. These results are similar to those of 2019, when 98% said the distance was reasonable and 88% said it was very reasonable.
Figure 16: Time to get to the polls: expected versus actual
Q: How much time do you think it would take you to go to the polling place? Base: n=19,061; [WAVE 1]
Q. To the best of your knowledge, how long did it take you to travel to the [polling station/advance polling station/local Elections Canada office]? Base: n=31,185: voters; [WAVE 1 + WAVE 2]
Text version of Figure 16: Time to get to the polls: expected versus actual
This horizontal bar chart shows the time respondents expected it would take to get to the polling place before they voted versus the actual time it took to get to the polls. The breakdown is as follows:
Expected
0 to 5 minutes, 28 percent
6 to 10 minutes, 29 percent
11 to 15 minutes, 19 percent
16 to 20 minutes, 10 percent
21 to 30 minutes, 10 percent
More than 30 minutes, 4 percent
Actual
0 to 5 minutes, 51 percent
6 to 10 minutes, 29 percent
11 to 15 minutes, 11 percent
16 to 20 minutes, 5 percent
21 to 30 minutes, 3 percent
More than 30 minutes, 2 percent
The following were less likely to report that actual travel to their voting location took 5 minutes or less:
electors aged 55 and older (48%) compared to those aged 35 to 54 (55%) and those aged 18 to 34 (51%)
electors who voted at a local EC office (25%) or advance poll (47%) compared with those who voted on election day (57%)
electors with a disability (50%) compared to those with no disability (52%)
electors in BC (48%) compared with those in Ontario (51%), Alberta (52%), the Prairies (54%) and the Atlantic provinces (56%)
Majority agreed that the polling place was in a familiar location
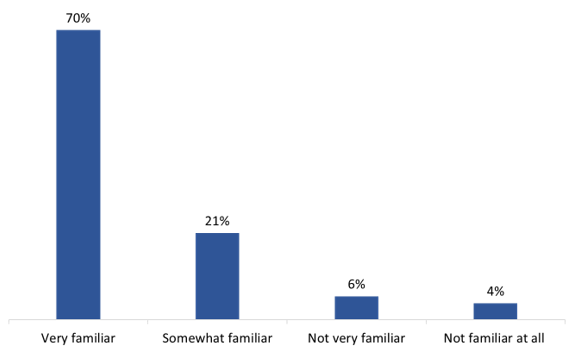
The majority (90%) of those who voted said the polling place was in a location that was at least somewhat familiar to them, including 70% who said the location was very familiar. This is slightly lower than results from 2019 (93% familiar, 73% very familiar).
Figure 17: Familiarity of polling place location
Q: Was the [polling station/advance polling station/local Elections Canada office] in a location that was familiar to you? Base: 31,501; Respondents who voted. [DK/NR: <0.5%]. [WAVE 2]
Text version of Figure 17: Familiarity of polling place location
This vertical bar chart shows how familiar respondents who voted in person were with the location of their polling place. The breakdown is as follows:
Very familiar, 70 percent
Somewhat familiar, 21 percent
Not very familiar, 6 percent
Not familiar at all, 4 percent
The following were less likely to say the polling place was in a very familiar location:
electors in an urban location (69%) compared to electors in a rural location (79%)
electors who have a disability (68%) versus those with no disability (71%)
youth who attend school (55%) compared to youth who work full-time (60%) and NEET youth (63%)
those who did not receive a VIC (58%) versus those who did (70%)
electors in Quebec (63%) compared with all other provinces (results range from 70% to 79%)
The likelihood of saying the polling place was in a very familiar location increased with age (from 59% of those age 18 to 34 to 75% of those aged 55 and older). Conversely, it decreased as education level increased (from 73% of those with a high school education or less to 68% of those who completed university).
One in 10 electors with a mobility or vision limitation needed level access
Electors who reported having at least some difficulty seeing, using stairs and/or having recurring pain (n=14,714) were asked if they needed level access to enter the polling place. In response, one in 10 (10%) said they did require level access.
The need for level access
increased with the severity of one's disability, from 7% of those with no disability to 26% of those with a very severe disability;
was higher among seniors aged 65 years and older (14%) compared with those aged 18 to 64 (8%); and
was higher among women (11%) compared to men (9%).
Most voters with a disability said it was easy to access the polling place
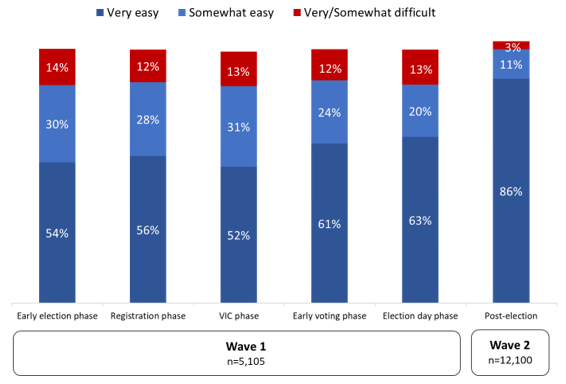
Over half (54%) of electors with a disability surveyed early in the election period said they expected it would be very easy for them to enter and access the polling place. The perception that accessing the polling place would be easy fluctuated over the election period but generally increased: by the final phase, the week leading up to election day, nearly two-thirds (63%) of those with a disability expected it would be very easy.
Figure 18: Ease of accessing the polling place
Q: If you do vote, how easy or difficult do you think it would be to enter and access the polling place? [DK/NR: 3%]. [WAVE 1]
Q. How easy or difficult was it for you to enter and access the [polling station/advance polling station/local Elections Canada office]? Base: voters with a disability who voted in person. [DK/NR: <0.5%]. [WAVE 2]
Text version of Figure 18: Ease of accessing the polling place
This vertical bar chart shows how easy or difficult electors with a disability thought it would be for them to access the polling station if they voted across the phases of the election period, compared to how easy or difficult it actually was for voters with a disability to enter and access the polling station according to responses from after the election. The breakdown is as follows:
Early election phase
Very easy, 54 percent
Somewhat easy, 30 percent
Very/Somewhat difficult, 14 percent
Registration phase
Very easy, 56 percent
Somewhat easy, 28 percent
Very/Somewhat difficult, 12 percent
Voter information card phase
Very easy, 52 percent
Somewhat easy, 31 percent
Very/Somewhat difficult, 13 percent
Early voting phase
Very easy, 61 percent
Somewhat easy, 24 percent
Very/Somewhat difficult, 12 percent
Election day phase
Very easy, 63 percent
Somewhat easy, 20 percent
Very/Somewhat difficult, 13 percent
Post-election
Very easy, 86 percent
Somewhat easy, 11 percent
Very/Somewhat difficult, 3 percent
In the post-election survey, the actual experience of voters with a disability exceeded their expectations: 86% of those who voted found it was very easy to access the polling place. Furthermore, 11% said it was somewhat easy. These results are similar to the 2019 election (85% said it was very easy to access the polling place, and 12% said it was somewhat easy).
Electors with a severe/very severe disability (81%) were less likely than those with a mild/moderate disability (87%) to say they found it very easy to enter and access the polling place.
Nearly all said the building where they voted was suitable for holding an election
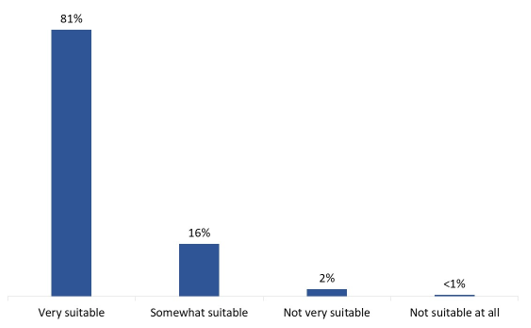
Practically all voters (97%) described the building where they voted as at least somewhat suitable for holding an election, with the vast majority (81%) saying it was very suitable. Over time, the proportion of voters who found the polling site suitable has remained steady: 98% in 2019 and 97% in 2015.
Figure 19: Suitability of polling site
Q: Overall, would you say that the building where you received your ballot was...? Base: n=31,558; those who voted. [WAVE 2]
Text version of Figure 19: Suitability of polling site
This horizontal bar chart shows respondents' views on how suitable the building where they voted was for use as a polling place. The breakdown is as follows:
Very suitable, 81 percent
Somewhat suitable, 16 percent
Not very suitable, 2 percent
Not suitable at all, less than 1 percent
Those who voted at an advance poll (82%) or at a poll on election day (81%) were more likely to say the building was very suitable compared to those who voted at a local EC office (75%).
Electors in Quebec (79%) and Ontario (80%) were less likely to say the building was very suitable compared with those in other provinces (results range from 82% to 84%).
The likelihood of finding the polling place very suitable increased with age, from 76% of those aged 18 to 34 to 84% of those aged 55 and older. Conversely, it decreased as the severity of disability increased, from 83% of those who have no disability to 77% of those with a severe or very severe disability.
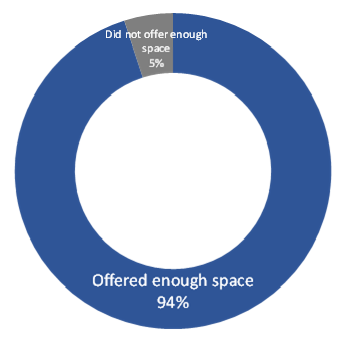
Vast majority of electors said the polling place provided enough space to physically distance
Ninety-four percent of voters said the polling place offered enough space to practise physical distancing, in accordance with COVID-19 health and safety measures.
Figure 20: Space for physical distancing at polling places
Q: Did the [polling station/advance polling station/local Elections Canada office] offer enough space to practice physical distancing? Base: 31,558; Respondents who voted. [DK/NR: 1%]. [WAVE 2]
Text version of Figure 20: Space for physical distancing at polling places
This pie chart shows the percentage of respondents who said the polling place had enough space to practise physical distancing. 94 percent said the polling place offered enough space. 5 percent said the polling place did not offer enough space.
The following were less likely to report that the polling place offered enough space for physical distancing:
election day voters (93% versus 95% of advance-poll voters and 97% of local EC office voters)
Indigenous voters (92% versus 94% of non-Indigenous voters)
electors with a disability (93% compared to 95% of electors with no disability)
urban voters (94% compared with 97% of rural voters)
In addition, the likelihood of saying there was enough space to practise physical distancing increased with age, from 90% of those aged 18 to 34 years to 97% of those aged 55 or older.
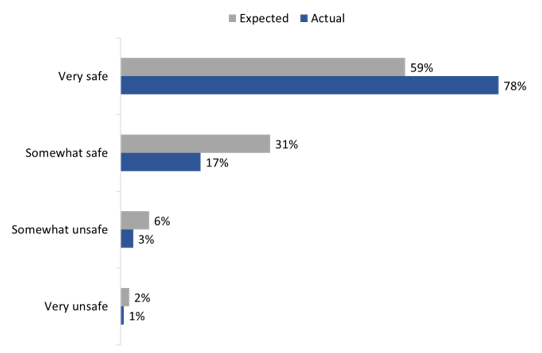
More than nine in 10 felt safe at the polling place with COVID-19 health and safety measures
During the election period, electors were asked how safe or unsafe they would feel if they voted in person, knowing that there would be health and safety measures for COVID-19 in place at the polls. Overall, 90% of election-period respondents said they expected they would feel safe voting in person, including 59% who said they would feel very safe. The perception that it would be very safe to vote in person increased over the course of the election period, from 56% of electors early in the election period to 63% during the final week of the election period leading up to election day.
Post-election, 95% of electors who went to a voting place said they felt safe with the health and safety measures for COVID-19 that were in place there, including 78% who said they felt very safe.
Figure 21: COVID-19 health and safety of voting in person: expectations versus experience
Q. Knowing that there will be health and safety measures for COVID-19 in place at the polls, how safe or unsafe would you feel voting in person at a polling place? Base: n=49,467; all respondents. [DK/NR: 2%]. [WAVE 1]
Q. Thinking about the health and safety measures for COVID-19 that were in place at the [polling station/advance polling station/local Elections Canada office], how safe or unsafe did you feel you were during your visit? Base: n=31,558; Respondents who voted. [DK/NR: <1%]. [WAVE 2]
Text version of Figure 21: COVID-19 health and safety of voting in person: expectations versus experience
This horizontal bar chart shows respondents' expectations during the election period of how safe or unsafe they would feel if they voted in person given the COVID-19 health and safety measures in place at the polls compared to how safe or unsafe voters actually felt during their visit to the polling place. The breakdown is as follows:
Expected
Very safe, 59 percent
Somewhat safe, 31 percent
Somewhat unsafe, 6 percent
Very unsafe, 2 percent
Actual
Very safe, 78 percent
Somewhat safe, 17 percent
Somewhat unsafe, 3 percent
Very unsafe, 1 percent
Voters who said they had received at least one dose of a COVID-19 vaccine were more likely to say they felt safe at the voting place (96%) compared with those who had not been vaccinated (89%).
Voters less likely to report they felt safe include:
Indigenous voters (93% versus 95% of non-Indigenous voters)
electors with a disability (94% compared to 96% of electors with no disability)
The likelihood of saying they felt safe increased with age, from 93% of those aged 18 to 34 years indicating this to 97% of those aged 55 or older.
6. Experience at the Polling Place
This section discusses voters' experience at the polling place.
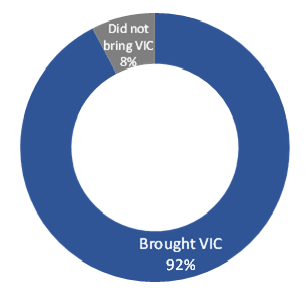
Vast majority brought their VIC to vote
Nine in 10 (92%) electors who received a VIC and voted said they brought their VIC with them to the polling place. Similar proportions of voters reported bringing their VIC to the polls in 2019 (91%) and 2015 (89%). Eight percent did not bring their VIC to the polling place.
Figure 22: Brought VIC to the polls
Q: Did you bring your voter information card with you to the [polling station/advance polling station/local Elections Canada office]? Base: n=29,812; respondents who voted. [DK/NR: <0.5%]. [WAVE 1 + WAVE 2]
Text version of Figure 22: Brought VIC to the polls
This pie chart shows the percentage of respondents who brought their voter information card (VIC) to the polls. 92 percent said they brought their VIC. 8 percent said they did not bring their VIC.
Youth voters aged 18 to 24 (86%) and 25 to 34 (91%) were less likely than those aged 35 and older (93%) to bring their VIC with them to the polling place.
Almost half said it took five minutes or less to vote
Voters said it took less time to cast their ballot than expected: during the initial phases of the election-period survey, nearly one-third (30%) of voters said they expected it would take five minutes or less to vote, and four in 10 (41%) expected it would take more than 10 minutes.
In the post-election survey, more than four in 10 (44%) said it took them no more than five minutes to vote once they arrived at the polling place. One-quarter (24%) said it took six to 10 minutes to vote, while nearly one-third (32%) said it took longer than 10 minutes. Overall, voters in the 2021 election reported taking an average of 13 minutes to cast their ballot: 12 minutes on election day and 14 minutes at advance polls.
Although they were better than electors expected, voting times in the 2021 GE were longer overall than in the 2019 GE, when 63% were able to vote in five minutes or less and the average time to vote was eight minutes across all in-person voting methods. Some increase in the time it could take to vote was anticipated due to changes made in response to the COVID-19 pandemic, including health and safety measures at the polls, such as frequent disinfecting of high-touch surfaces, physical distancing and one-way traffic. However, wait times were especially long in some urban electoral districts due to significantly fewer polling locations being available compared with previous elections.footnote 9
Figure 23: Time it took to vote: expected versus actual
Q: How much time do you think it would take you to vote once you arrive at the polling place? Base: n= 19,263; [DK/NR: 6%]. [WAVE 1] Q. To the best of your knowledge, how long did it take you to vote once you arrived at the [polling station/advance polling station/local Elections Canada office]? Base: n=31,252; respondents who voted. [DK/NR: 2%]. [WAVE 1 + WAVE 2]
Text version of Figure 23: Time it took to vote: expected versus actual
This horizontal bar chart shows how long it took respondents to vote, comparing their expectations before they voted with the actual time it took them to vote once they arrived at the polling place. The breakdown is as follows:
Expected
0 to 5 minutes, 30 percent
6 to 10 minutes, 29 percent
11 to 15 minutes, 19 percent
16 to 20 minutes, 10 percent
21 to 30 minutes, 9 percent
More than 30 minutes, 4 percent
Actual
0 to 5 minutes, 44 percent
6 to 10 minutes, 24 percent
11 to 15 minutes, 12 percent
16 to 20 minutes, 7 percent
21 to 30 minutes, 6 percent
More than 30 minutes, 7 percent
Across in-person voting methods, some sub-groups experienced longer voting times on average:
voters in urban areas (13 minutes) compared with voters in rural areas (10 minutes)
voters in Ontario (14 minutes) compared with voters in other provinces (results range from 10 to 12 minutes)
youth aged 18 to 34 (13 minutes) compared with those aged 35 and older (12 minutes)
voters who did not receive a VIC (16 minutes) compared with those who received a VIC (12 minutes)
Ultimately, 90% of respondents said that the time it took them to vote was reasonable, a 5-percentage-point drop from 2019. Urban voters were less likely (89%) than rural voters (93%) to say the time it took to vote was reasonable, as were voters in Ontario (87%) compared with voters in other provinces (results range from 90% to 93%).
7. Voter Identification
This section reports on issues related to voter identification.
Most used a driver's licence to meet identification requirements
Most (94%) voters said they used one piece of government-issued photo ID to prove their identity and address when they voted: 90% used their driver's licence, while 3% used a provincial or territorial photo identification card. Another 4% of voters used two pieces of ID that together could establish identity and address for the purpose of voting. Fewer than 1% had someone vouch for them or provided a signed affidavit with their name and address. Overall, the distribution of voters who used each option for meeting the identification requirements was unchanged from 2019 (94% used one piece and 4% used two pieces) and similar to 2015 (93% used one piece and 3% used two pieces).
Those more likely to have used two pieces of ID include:
Quebec voters (8% compared to 3% of voters from Ontario, Atlantic Canada and the territories, 2% of voters from Alberta, and 1% of voters from British Columbia and the Prairies); this difference is notable considering that Quebec is the only jurisdiction in Canada that does not issue a general photo identification card containing address for non-drivers
Urban voters (4% compared with 2% of rural voters)
non-binary/transgender voters (10% compared to 4% of female and 3% of male voters)
18- to 34-year-olds (5% compared to 3% of those aged 35 to 54 and 55 and older)
youth attending school (8% compared to 4% of youth working full-time)
The likelihood of using two pieces of ID increased as the severity of a disability increased (from 3% of those with no disability to 6% of those with a severe/very severe disability).
Voters who used two pieces of ID most often used the VIC to establish proof of residence
Among those who presented two pieces of ID to meet the identification requirements for voting (n=1,207), the most frequently mentioned pieces were:
a health card (48% of voters who used two pieces of ID)
a Canadian passport (26% of voters who used two pieces)
the VIC (53% of voters who used two pieces)
utility bill (14% of voters who used two pieces)
The health card, therefore, was the most common piece of ID used that could satisfy the proof of identity requirement, while the VIC was the most common piece used to satisfy proof of address (51%). This represents an increase in the proportion of voters who used the VIC when compared to the 43rd GE, when 43% of voters who used two pieces used it as proof of address.
Virtually everyone said it was easy to meet voter identification requirements
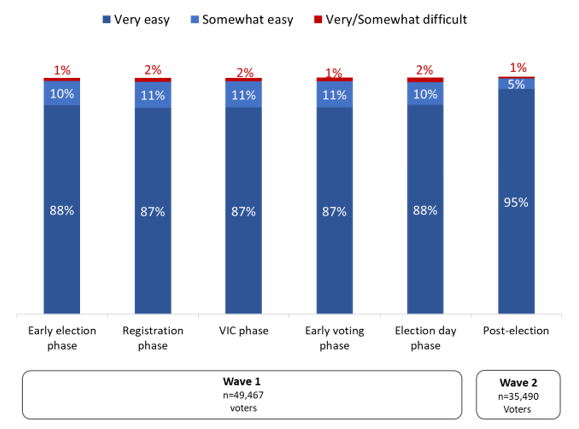
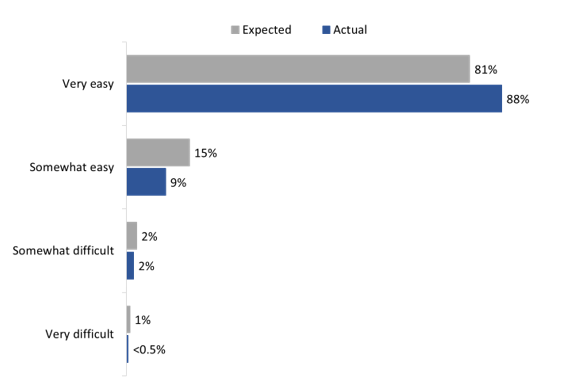
During the election period survey, nearly nine in 10 (88%) respondents said they expected it would be very easy for them to prove their identity and address if they were to vote, while another 10% expected it would be somewhat easy. This is similar to 2019, when 87% expected it would be very easy for them to prove their identity and address if they were to vote. Expectations did not change over the course of the election period.
In the post-election survey, an even greater proportion (95%) of voters reported that they in fact did find it very easy to prove their identity and address when they voted. Another 5% said it was somewhat easy. These proportions are similar to 2019, when 94% said meeting the voter identification requirements was very easy, and another 5% said this was somewhat easy.
Figure 24: Ease of meeting ID requirements
Q: If you do vote, how easy or difficult do you think it would be to prove your identity and address? [DK/NR: <0.5%]. [WAVE 1]
Q. Overall, how easy or difficult was it to meet the identification requirements? [DK/NR: <0.5%]. [WAVE 1 + WAVE 2]
Text version of Figure 24: Ease of meeting ID requirements
This vertical bar chart shows respondents' expectations during the phases of the election period for how easy or difficult they thought it would be for them to prove their identity and address if they voted compared to how easy or difficult it actually was for them to meet the identification requirements according to voters' responses after the election. The breakdown is as follows:
Early election phase
Very easy, 88 percent
Somewhat easy, 10 percent
Very/Somewhat difficult, 1 percent
Registration phase
Very easy, 87 percent
Somewhat easy, 11 percent
Very/Somewhat difficult, 2 percent
VIC phase
Very easy, 87 percent
Somewhat easy, 11 percent
Very/Somewhat difficult, 2 percent
Early voting phase
Very easy, 87 percent
Somewhat easy, 11 percent
Very/Somewhat difficult, 1 percent
Election day phase
Very easy, 88 percent
Somewhat easy, 10 percent
Very/Somewhat difficult, 2 percent
Post-election
Very easy, 95 percent
Somewhat easy, 5 percent
Very/Somewhat difficult, 1 percent
The following were less likely to find it was very easy to meet the ID requirements when they voted:
Indigenous voters (92%) compared with non-Indigenous voters (95%)
non-binary/transgender voters (81%) compared with women (95%) and men (94%)
youth aged 18 to 34 attending school (89%) compared with youth aged 18 to 34 working full-time (94%)
those who had moved in the last 12 months (91%) compared with those who had not (95%)
voters who did not receive a VIC (85%) compared with those who did (95%)
those who used vouching/affidavit (79%) or two pieces of ID (84%) compared with those who used one piece of ID (95%) to meet the ID requirements
The likelihood of voters finding it very easy to meet the ID requirements increased as age increased, from 92% of voters aged 18 to 34 to 96% of those aged 55 and older.
Conversely, the likelihood of voters finding it very easy to meet the ID requirements decreased as the severity of a person's disability increased, from 96% of those with no disability to 90% of those with a severe/very severe disability.
8. Vote-by-Mail Experience
This section reports on the experience of electors who said that they voted by receiving a special ballot in the mail.
Over nine in 10 found it easy to submit their application to receive a special ballot in the mail
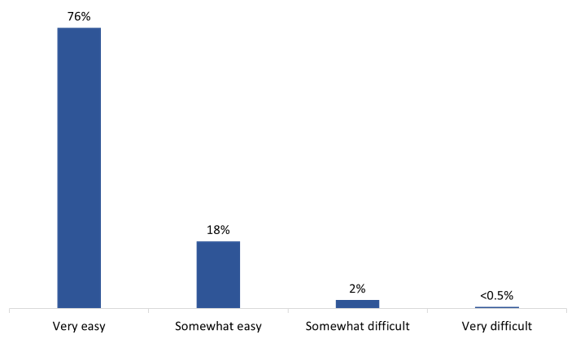
Among voters who received their ballot in the mail, 94% said it was easy to apply for their special ballot, including 76% who said it was very easy.
Figure 25: Ease of applying for special ballot
Q: How easy or difficult was it to apply for your special ballot? Base: n=2,848; voters who reported receiving their ballot in the mail [DK/NR: 3%] [WAVE 1 + WAVE 2]
Text version of Figure 25: Ease of applying for special ballot
This vertical bar chart shows the percentages of respondents who found it easy or difficult to apply for a special ballot. The breakdown is as follows:
Very easy, 76 percent
Somewhat easy, 18 percent
Somewhat difficult, 2 percent
Very difficult, less than 0.5 percent
The following were more likely to say it was very easy to apply for a special ballot:
those who submitted their application for a special ballot online (78%) compared with those who applied by mail/courier (69%) or in person at a local Elections Canada office (67%)
electors with no disability (77%) compared with those who have a disability (74%)
electors aged 25 to 34 (77%) and 35 and older (77%) compared with youth aged 18 to 24 (66%)
Two-thirds received their ballot in the mail within a week of applying
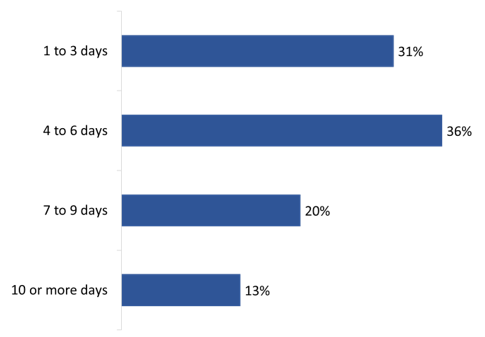
Two-thirds of voters who received their ballot in the mail reported that it took less than a week to receive their ballot after applying: 31% said it took one to three days, and 36% said it took four to six days. One in five (20%) said it took seven to nine days, while 13% said it took 10 days or longer. The average reported time it took to receive a ballot in the mail was six days; the median was five days.
Figure 26: Time it took to receive ballot in the mail
Q: After you applied to get your ballot in the mail, how long did it take to receive it? Base: n=2,165; voters who reported receiving their ballot in the mail [WAVE 1 + WAVE 2]
Text version of Figure 26: Time it took to receive ballot in the mail
This horizontal bar chart shows the reported time it took for those who applied to receive their ballot in the mail. The breakdown is as follows:
1 to 3 days, 31 percent
4 to 6 days, 36 percent
7 to 9 days, 20 percent
10 or more days, 13 percent
The following groups reported that it took longer on average to receive their ballot in the mail:
electors in rural areas (average of seven days) compared with in urban areas (six days)
electors in BC, Alberta and Ontario (six days) compared with electors in Quebec and the Prairies (five days)
Nine in 10 said the time it took to receive their ballot in the mail was reasonable
Among voters who received their ballot in the mail, 89% said the amount of time it took was reasonable. Nine percent said the amount of time was not reasonable. The proportion who said that the amount of time was reasonable decreased as the time it took to receive their ballot in the mail increased, from 98% of those who received their ballot in one to three days to 70% of those who received it in 10 or more days.
Figure 27: Time it took to receive ballot in the mail was reasonable
Time it took to receive ballot in the mail was reasonable by how long it took
1 to 3 days
4 to 6 days
7 to 9 days
10 or more days
Overall
Yes, reasonable
98%
93%
82%
70%
90%
No, not reasonable
0%
6%
16%
26%
9%
Don't know
1%
2%
1%
3%
2%
Q. Would you say this was a reasonable amount of time? Base: n=2,179; voters who reported receiving their ballot in the mail [WAVE 1+WAVE 2]
The following groups were less likely to say the time it took to receive their ballot in the mail was reasonable:
electors with a severe/very severe disability (79%) compared with those who have a mild/moderate disability (90%) or no disability (91%)
youth aged 18 to 24 (80%) and 25 to 34 (86%) compared with those and 35 and older (91%)
Nearly nine in 10 found it easy to complete their ballot using the special ballot voting kit
Among voters who received their special ballot in the mail or took it home with them from a local Elections Canada office, 87% said it was easy to complete their ballot using the special ballot kit, including 70% who said it was very easy.
Figure 28: Ease of completing the special ballot
Q: How easy or difficult was it to complete your ballot using the special ballot voting kit? Base: n=3,922; voters who reported receiving their ballot in the mail or taking it home with them from a local Elections Canada office to return later [DK/NR: 10%] [WAVE 1 + WAVE 2]
Text version of Figure 28: Ease of completing the special ballot
This vertical bar chart shows how easy or difficult respondents said it was to complete their ballot using the special ballot voting kit. The breakdown is as follows:
Very easy, 70 percent
Somewhat easy, 17 percent
Somewhat difficult, 3 percent
Very difficult, 0.5 percent
The following were more likely to say it was easy to complete their special ballot:
electors in BC (90%) compared with those in Ontario (87%), Quebec (85%) and Alberta (85%)
electors in urban areas (88%) compared with those in rural areas (81%)
electors aged 55 and older (90%) compared with those aged 35 to 54 (85%) and 18 to 34 (84%)
9. Accessible Voting Services
This section reports on awareness and use of Elections Canada's accessible voting services among electors with a disability.
Half of electors with a disability were aware of accessible voting tools and services
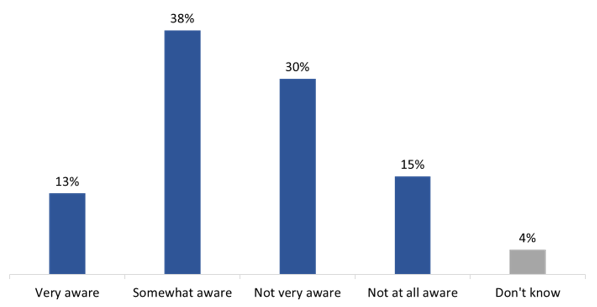
Half (51%) of electors with a disability said they are at least somewhat aware of the voting services and tools that Elections Canada offers to make voting more accessible. Awareness is unchanged from 2019 (50%) but continues to be higher than it was in 2015 (43%).
Figure 29: Awareness of services and tools for electors with disabilities
Q: Elections Canada offers a number of voting tools and services to make voting more accessible, for example, for Canadians with disabilities. How aware are you of the tools and services that are available? Base: n=15,816; electors with a disability. [WAVE 2]
Text version of Figure 29: Awareness of services and tools for electors with disabilities
This vertical bar chart shows the level of awareness of Elections Canada's accessible voting tools and services among electors with a disability. The breakdown is as follows:
Very aware, 13 percent
Somewhat aware, 38 percent
Not very aware, 30 percent
Not at all aware, 15 percent
Don't know, 4 percent
Those with a severe/very severe disability (53%) were more likely to be aware of the tools and services available than those with a mild/moderate disability (50%).
Three-quarters of those who needed information on accessibility found it easy to find
Among electors with a disability, 13% said they needed information on the accessibility of their polling place for this election, and 10% needed information on accessible voting tools and services to assist them with voting.footnote 10
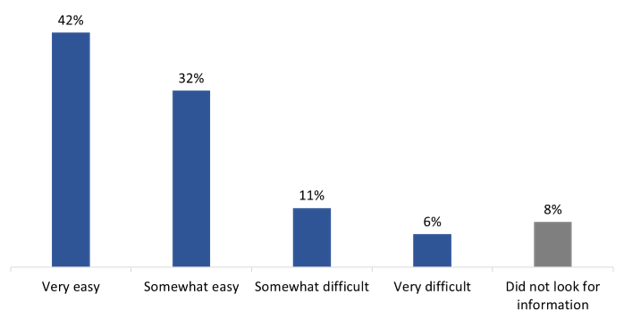
Three-quarters (74%) of those who needed information on accessibility found it easy to find the information. Specifically, 42% said it was very easy, while 32% said it was somewhat easy to find this information. Eight percent said they did not look for information. In 2019, a slightly greater proportion (78%) of those who needed information on accessibility said it was at least somewhat easy to find this information.
Figure 30: Ease of access to accessible information for voters
Q: How easy or difficult was it to find the information you needed on accessibility for the election? Base: n=2,681; electors with a disability who required information [DK/NR: 2%]. [WAVE 2]
Text version of Figure 30: Ease of access to accessible information for voters
This vertical bar chart shows how easy or difficult it was for electors with a disability who required information to find the information they needed on accessibility for the election. The breakdown is as follows:
Very easy, 42 percent
Somewhat easy, 32 percent
Somewhat difficult, 11 percent
Very difficult, 6 percent
Did not look for information, 8 percent
Large-print lists was the tool most commonly used by electors with disabilities
Consistent with the finding that one in 10 (10%) electors with a disability said they needed information on accessible voting tools and services, use of these tools and services to assist with voting was relatively limited:
The only tool used with any frequency was large-print lists of candidates, used by 8% of voters who have difficulty with seeing, a cognitive activity such as concentrating and/or a developmental disability (n=8,650).
Braille lists of candidates were used by 5% of voters who have a lot of difficulty seeing or are unable to see (n=268).
Language or sign-language interpretation was used by 2% of voters who have a lot of difficulty hearing or are unable to hear (n=1,068).
Other assistive voting tools (signature guide, magnifiers, tactile and Braille template, a personal smart phone to read the ballot) were used by 1% or fewer among their respective intended users.
Most who received assistance marking their ballot were assisted by Elections Canada staff
Four percent of electors with a disability who voted in person said someone assisted them in marking their ballot, compared to 7% during the 43rd GE in 2019. footnote 11 Those with a severe/very severe disability were more likely to need assistance (4% compared to 3% of those with a mild/moderate disability).
Among respondents who received assistance marking their ballot, most (87%) indicated that Elections Canada staff assisted them, whereas 7% said they were assisted by someone they knew, such as a family member, friend or personal support worker. footnote 12 Very few (5%) could not recall who assisted them. Sources of assistance are consistent with those reported in 2019, when 85% were assisted by Elections Canada staff and 10% by someone they knew.
Most of those who received assistance marking their ballot were satisfied with the assistance
Nearly all of those with a disability who received assistance when voting (95%) said they were at least somewhat satisfied with the assistance, including 81% who were very satisfied with it.
Figure 31: Satisfaction with assistance marking ballot
Q: How satisfied were you with the assistance you received marking your ballot? Base: n=441; electors with a disability who needed assistance marking their ballot. [DK/NR: 1%]. [WAVE 2]
Text version of Figure 31: Satisfaction with assistance marking ballot
This vertical bar chart shows the level of satisfaction voters with a disability reported having with the assistance they received in marking their ballot. The breakdown is as follows:
Very satisfied, 81 percent
Somewhat satisfied, 15 percent
Somewhat dissatisfied, 3 percent
Very dissatisfied, 1 percent
The likelihood of being very satisfied with the assistance received was highest among those aged 55 and older (94%) compared to 18- to 34-year-olds (70%) and 35- to 54-year-olds (76%).
Eight in 10 said EC staff were sensitive to their needs when voting
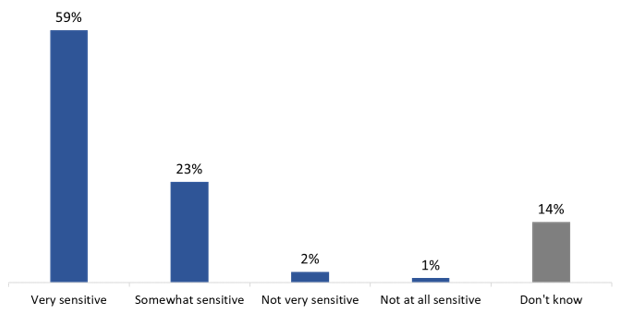
Eight in 10 (82%) voters with a disability indicated that Elections Canada staff were at least somewhat sensitive to their needs when voting, with more than half (59%) saying staff were very sensitive. The remainder were more likely to offer no response to this question (14%) than to indicate that staff were insensitive to their needs (4%).
The likelihood of saying that Elections Canada staff were very sensitive to their voting needs increased with age, from 50% of voters aged 18 to 34, to 54% of those aged 35 to 54, to 67% of those aged 55 and older.
Figure 32: Sensitivity of poll staff with regard to elector's disability
Q: Overall, how sensitive would you say Elections Canada staff were regarding your needs when voting? Base: n=12,105; voters with a disability who voted in person. [Refused: <0.5%]. [WAVE 2]
Text version of Figure 32: Sensitivity of poll staff with regard to elector's disability
This vertical bar chart shows the level of sensitivity poll staff had with regard to the needs of electors with a disability. The breakdown is as follows:
Very sensitive, 59 percent
Somewhat sensitive, 23 percent
Not very sensitive, 2 percent
Not at all sensitive, 1 percent
Don't know, 14 percent
10. Satisfaction with Elections Canada and the Voting Process
This section reports on satisfaction with the voting process.
Satisfaction with the service provided by Elections Canada staff was strong and widespread
Of those who voted in person, nearly everyone (97%) said they were at least somewhat satisfied with the services provided by Elections Canada staff, including a substantial majority (85%) who said they were very satisfied. These are similar proportions to 2019, when 98% of voters were at least somewhat satisfied, including 85% who were very satisfied.
Figure 33: Satisfaction with services provided by EC staff when voting
Q: Overall, how satisfied were you with the services provided by Elections Canada staff when you voted? Base: n=31,556; respondents who voted. [DK/NR: <0.5%]. [WAVE 2]
Text version of Figure 33: Satisfaction with services provided by EC staff when voting
This vertical bar chart shows the level of satisfaction respondents had with the services provided by Elections Canada staff when they voted. The breakdown is as follows:
Very satisfied, 85 percent
Somewhat satisfied, 12 percent
Somewhat dissatisfied, 2 percent
Very dissatisfied, 1 percent
The likelihood of being very satisfied increased with age, from 81% of those aged 18 to 34 to 88% of those aged 55 and older. The likelihood of being very satisfied was lower among electors with a disability (82%, versus 86% of those with no disability) and Indigenous electors (80%, versus 85% of non-Indigenous electors).
Official language service satisfaction was high overall but lower when OLMC voters were not served in their primary official language
More than three-quarters of those who voted (77%) said they were served in English, one in five (19%) said they were served in French, and 4% said they were served in both of Canada's official languages.footnote 13
Voters in the official language minority community (OLMC, n=1,490) footnote 14 were less likely to say they had received service in their primary official language than non-OLMC voters: 69% of OLMC voters received service in their primary official language (or both official languages) when voting in person in 2021; English OLMC voters were more likely to have received service in their primary official language (73%) than French OLMC voters (53%).
As was the case in 2015 and 2019, virtually all (99%) voters in the 2021 GE expressed satisfaction with the official language in which they were served. footnote 15 In comparison, 94% of OLMC voters were satisfied with the official language in which they were served in 2021. Specifically, OLMC voters who did not receive service in their primary official language were less likely to be satisfied (82%) than OLMC voters who received at least some service in their primary official language (98%), who had a similar level of satisfaction as non-OLMC voters.
During the election period, OLMC electors (n=1,874) were asked if they expected they would be able to receive service in their primary official language if they went to vote in person. footnote 16 Eighty-four percent of English OLMC electors expected they would be able to receive service in English; only 16% of French OLMC voters expected they would be able to receive service in French.
Nearly everyone found it easy to vote overall
Across the election period, 81% of electors expected it would be very easy to vote, similar to 2019.
In the post-election survey, the actual experience of voters exceeded their final expectations: 88% of voters found it was very easy to vote, with an additional 9% finding it was somewhat easy to vote. In comparison, 85% of voters found it very easy to vote in 2019, while another 13% found voting to be somewhat easy.
Figure 34: Ease of voting: expectations versus experience
Q. If you do vote, how easy or difficult do you think it would be to vote at the polling place? Base: n=49,467 [DK/NR: <1%]. [WAVE 1] Q. Overall, how easy or difficult was it to vote? Base: n=36,374 [DK/NR: <0.5%]. [WAVE 2]
Text version of Figure 34: Ease of voting: expectations versus experience
This horizontal bar chart shows respondents' expectations during the election period for how easy or difficult they thought it would be to vote at the polling place compared to how easy or difficult it actually was for them to vote. The breakdown is as follows:
Expected
Very easy, 81 percent
Somewhat easy, 15 percent
Somewhat difficult, 2 percent
Very difficult, 1 percent
Actual
Very easy, 88 percent
Somewhat easy, 9 percent
Somewhat difficult, 2 percent
Very difficult, less than 0.5 percent
The following subgroups were less likely to say it was very easy to vote:
18- to 34-year-olds (84%) compared to those aged 35 to 54 (88%) and those 55 and older (90%)
electors with a disability (85%) compared to electors with no disability (90%)
Indigenous electors (85%) compared to non-Indigenous electors (89%)
Canadians at birth (88%) compared to those who became citizens before the 2015 GE (90%) and new Canadians (91%)
voters in urban areas (88%) compared with those in rural areas (91%)
voters who did not receive a VIC (77%) compared to those who did (89%)
those who voted by receiving a ballot in the mail (82%) compared to those who voted at a local EC office (88%), at an advance poll (89%) or on election day (89%)
voters who had not been vaccinated against COVID-19 (85%) compared with those who had received at least one dose (89%)
Strong and widespread overall satisfaction with voting experience
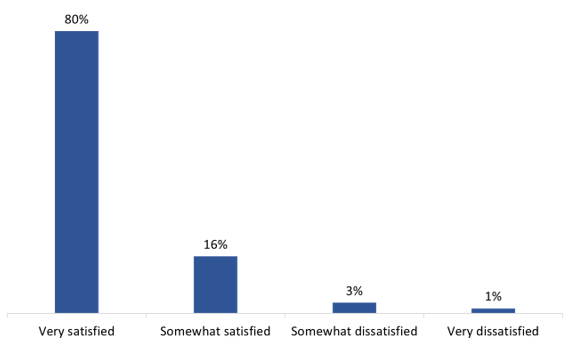
The vast majority of voters (96%) indicated they were at least somewhat satisfied with their voting experience, with the substantial majority (80%) being very satisfied. These proportions are virtually identical to those of the 2019 GE, when 97% were at least somewhat satisfied, including 80% who were very satisfied.
Figure 35: Satisfaction with the overall voting experience
Q: Overall, how satisfied were you with your voting experience? Base: n=36,374; Voters. [DK/NR: <0.5%] [WAVE 2]
Text version of Figure 35: Satisfaction with the overall voting experience
This vertical bar chart shows the level of satisfaction voters had with their overall voting experience. The breakdown is as follows:
Very satisfied, 80 percent
Somewhat satisfied, 16 percent
Somewhat dissatisfied, 3 percent
Very dissatisfied, 1 percent
The following groups of voters were less likely to be very satisfied with their voting experience:
men (78%) compared to women (81%)
voters in urban areas (80%) compared with those in rural areas (83%)
voters aged 18 to 34 (73%) compared to voters aged 35 to 54 (78%) and aged 55+ (84%)
voters with a disability (76%) compared to voters with no disability (82%)
Indigenous voters (76%) compared to non-Indigenous voters (80%)
voters who did not receive their VIC (69%) compared to those who did (80%)
voters who received their ballot in the mail (76%) compared to those who voted on election day (79%), at an advance poll (80%) or at a local EC office (83%)
those who were eligible but did not vote in the 2019 GE (71%) compared with those who did vote in 2019 (80%)
voters who had not been vaccinated against COVID-19 (66%) compared with those who had received at least one dose (81%)
11. Trust in Elections Canada and the Election Results
This section covers issues related to satisfaction with the administration of the democratic process in Canada.
Widespread impression that Elections Canada ran the election fairly
Approximately nine in 10 (87%) respondents said Elections Canada ran the election at least somewhat fairly, with 70% saying they believe Elections Canada ran the election very fairly. The proportion who said Elections Canada ran the election at least somewhat fairly is slightly lower than the level obtained in 2019 (90%), but the proportion who said very fairly remained the same (70%).
Figure 36: Perception that EC ran the election fairly
Q: Thinking about the September 20 federal election, how fairly would you say Elections Canada ran the election? Base: n=39,568; all respondents [WAVE 2]
Text version of Figure 36: Perception that EC ran the election fairly
This vertical bar chat shows respondents' perceptions of how fairly Elections Canada ran the election. The breakdown is as follows:
Very fairly, 70 percent
Somewhat fairly, 17 percent
Somewhat unfairly, 4 percent
Very unfairly, 3 percent
Don't know, 6 percent
The following were less likely to say that the election was run very fairly:
respondents who live in rural areas (68%) compared to those who live in urban areas (72%)
Indigenous electors (58%) compared to non-Indigenous electors (71%)
NEET youth (50%) compared to youth attending school (58%) and youth working full-time (60%)
electors who did not receive a VIC (58%) compared to those who did receive a VIC (71%)
those who did not vote in the 2021 GE (43%) compared to voters (72%) footnote 17
those who had not been vaccinated against COVID-19 (34%) compared with those who had received at least one dose (74%)
Additionally, the likelihood of saying the election was run very fairly
increased with age, from 58% of those aged 18 to 34 to 77% of those aged 55 and older;
increased with education, from 60% of those with a high school education or less to 75% of electors who had completed university; and
decreased as the severity of a disability increased (from 72% of electors with no disability to 60% of those with a severe/very severe disability).
Just over half expected the election results would be known on election night
Because of a higher expected volume of special ballots due to the pandemic, Elections Canada communicated well in advance of election day that the count of special ballots would not begin until the day after election day, September 21, and that it could be up to five days before the count was finished. In practice, the last electoral districts finished their counts on September 26, the sixth day after election day. footnote 18
To measure whether electors were aware of this difference from previous elections, election period survey respondents were asked how long they expected it would take after the polls closed on election day for all the ballots to be counted and the election results to be known. Just over half (54%) expected the results would be known on election night, followed by 30% who expected it would take one or two days after election day, 6% who expected three or four days, and 4% who expected five days to a week. One percent expected it would take weeks or even longer.
Figure 37: Expected time it would take to know the results
Q: After the polls close on election day, when do you expect all the ballots will be counted and the election results will be known? Base: n=53,731; all respondents [WAVE 1].
Text version of Figure 37: Expected time it would take to know the results
This horizontal bar chart shows the expected time respondents thought it would take to know the election results after the polls had closed. The breakdown is as follows:
On election night, 54 percent
One or two days after, 30 percent
Three or four days, 6 percent
Five days to a week, 4 percent
Weeks, 1 percent
A month or more, less than 0.5 percent
Don't know, 3 percent
The following groups were less likely to expect that the results would be known on election night:
youth aged 18 to 24 (35%) and 25 to 34 (49%) compared with those aged 35 and older (58%)
new Canadians (48%) compared with Canadians by birth (54%) and immigrants who became citizens before the 2015 election (55%)
electors who had been vaccinated with at least one dose against COVID-19 (53%) versus those who were not vaccinated (58%)
electors in British Columbia (42%) compared with all other provinces (results range from 52% to 64%)
Electors in Quebec (64%) were more likely to expect the results would be known on election night compared with all other provinces (results range from 42% to 56%).
Trust in the accuracy of the election results in their riding was widespread
Despite the additional time it took to count special ballots in the 2021 election, there was widespread trust in the accuracy of the election results in respondents' respective ridings: 91% had at least some level of trust in the accuracy of the results, with seven in 10 (72%) saying their trust was very high. This represents a slight increase in trust levels when compared to the 2019 NES, when 89% reported having at least some trust, including 61% who said they had a very high level of trust in the accuracy of the results.
Figure 38: Trust in accuracy of the results
Q: What level of trust do you have in the accuracy of the election results in your riding? Base: n=39,568; all respondents [WAVE 2].
Text version of Figure 38: Trust in accuracy of the results
This vertical bar chart shows the level of trust respondents reported having in the accuracy of the election results in their riding. The breakdown is as follows:
Very high, 72 percent
Somewhat high, 18 percent
Somewhat low, 4 percent
Very low, 3 percent
Don't know, 2 percent
The following were less likely to report a very high level of trust in the accuracy of results:
electors who reside in rural areas (70%) compared to those who live in urban areas (75%)
electors in Alberta (68%), Quebec (70%) and the Prairies (71%) compared with all other provinces (results range from 73% to 77%)
Indigenous electors (59%) compared to non-Indigenous electors (74%)
First Nations electors living on a reserve (46%) compared with First Nations not living on a reserve (61%)
NEET youth (55%) compared to youth attending school (66%) and working full-time (65%)
2021 non-voters (48%) compared to voters (74%)
those who had not been vaccinated against COVID-19 (29%) compared with those who had received at least one dose (78%)
In addition, the likelihood of expressing very high trust in the accuracy of results
increased with age, from 63% of those aged 18 to 34 to 79% of those aged 55 and older;
increased with education, from 57% of those with a high school education or less to 80% of electors who had completed university; and
decreased as the severity of a disability increased (from 75% of those with no disability to 61% of those with a severe/very severe disability).
Confidence in Elections Canada was high before the election
During the election period survey, respondents were asked about their level of confidence in various institutions in Canada, including Elections Canada. As demonstrated by the graph below, electors reported having a comparatively high level of confidence in Elections Canada. Specifically, more than eight in 10 (86%) electors said they had a great deal or fair amount of confidence in EC, followed by the police (74%), the federal government (58%), business and corporations (51%) and mainstream media (51%).
Figure 39: Confidence in Canadian institutions
Q: How much confidence, if any, do you have in the following institutions in Canada? Base: n=53,731; all respondents [WAVE 1]
Text version of Figure 39: Confidence in Canadian institutions
This horizontal bar chart shows the level of confidence respondents had in various institutions in Canada during the election period. The breakdown is as follows:
Elections Canada
A great deal of confidence, 45 percent
A fair amount of confidence, 41 percent
Not much confidence, 9 percent
No confidence, 3 percent
Don't know, 2 percent
Police
A great deal of confidence, 26 percent
A fair amount of confidence, 48 percent
Not much confidence, 18 percent
No confidence, 7 percent
Don't know, 1 percent
Federal government
A great deal of confidence, 14 percent
A fair amount of confidence, 44 percent
Not much confidence, 26 percent
No confidence, 15 percent
Don't know, 1 percent
Business and corporations
A great deal of confidence, 6 percent
A fair amount of confidence, 46 percent
Not much confidence, 35 percent
No confidence, 11 percent
Don't know, 2 percent
Mainstream media
A great deal of confidence, 8 percent
A fair amount of confidence, 43 percent
Not much confidence, 28 percent
No confidence, 19 percent
Don't know, 1 percent
Confidence in Elections Canada increased overall and in intensity through the election period
Throughout the election, the proportion of electors who had confidence in Elections Canada increased marginally from the early election phase of 87% to 91% in the post-election survey. More notable was the proportion who said they have a great deal of confidence, which increased from 46% during the election period to two-thirds (66%) following the 44th GE. This is the same pattern that was reflected in NES 2019, except the proportion of respondents who have a great deal of confidence in Elections Canada was higher in 2021, both at the start of the election period (46% in 2021 versus 35% in 2019) and post-election (66% in 2021 versus 58% in 2019).
Figure 40: Confidence in EC
Q: How much confidence, if any, do you have in the following institutions in Canada? Base: all respondents [WAVE 1] Q. Overall, how much confidence do you have in Elections Canada? Base: all respondents [WAVE 2]
Text version of Figure 40: Confidence in EC
This vertical bar chart shows the level of confidence respondents had in Elections Canada throughout the phases of the election period and after the election. The breakdown is as follows:
Early election phase
A great deal of confidence, 46 percent
A fair amount, 40 percent
Not much, 8 percent
No confidence, 4 percent
Registration phase
A great deal of confidence, 45 percent
A fair amount, 41 percent
Not much, 9 percent
No confidence, 3 percent
VIC phase
A great deal of confidence, 44 percent
A fair amount, 42 percent
Not much, 9 percent
No confidence, 3 percent
Early voting phase
A great deal of confidence, 46 percent
A fair amount, 41 percent
Not much, 9 percent
No confidence, 3 percent
Election day phase
A great deal of confidence, 46 percent
A fair amount, 41 percent
Not much, 8 percent
No confidence, 3 percent
Post-election
A great deal of confidence, 66 percent
A fair amount, 25 percent
Not much, 5 percent
No confidence, 3 percent
Post-election, the following were less likely to say they have a great deal of confidence in Elections Canada:
Indigenous electors (52% compared to 67% of non-Indigenous electors)
First Nations electors who live on a reserve (41%) compared with First Nations who do not live on a reserve (54%)
Canadians by birth (65%) compared to new Canadians (71%) and immigrants who became citizens before the 2015 election (71%)
NEET youth (45% compared to 57% of youth attending school and youth working full-time)
electors in rural areas (60%) compared with those in urban areas (69%)
electors in Alberta (57%) and the Prairies (60%) compared with electors in other provinces (results range from 65% to 69%)
those who did not vote in 2021 (44% versus 68% of those who did vote)
those who had not been vaccinated against COVID-19 (21%) compared with those who had received at least one dose (72%)
The likelihood of electors saying they have a great deal of confidence in Elections Canada increased with age (from 55% of those aged 18 to 34 to 73% of those aged 55 and older) and education (from 50% of those with a high school education or less to 74% of those who completed university). Conversely, it decreased as the severity of disability increased, from 69% of electors with no disability to 53% of electors with severe or very severe disability.
Moderate satisfaction with the way democracy works in Canada
Seven in 10 (70%) respondents during both the election and post-election surveys reported being at least somewhat satisfied with the way democracy works in Canada. However, those who said they were very satisfied increased from 29% in the election period to 36% of those in the post-election survey. Compared with 2019, overall satisfaction with the way democracy works in Canada was lower in 2021 (70%) compared with 2021 (78%), but the proportion who were very satisfied was slightly higher (36% compared with 33%).
Figure 41: Satisfaction with the way democracy works in Canada
Q: Overall, how satisfied are you with the way democracy works in Canada? Base: all respondents [WAVE 1, WAVE 2]
Text version of Figure 41: Satisfaction with the way democracy works in Canada
This vertical bar chart shows the level of satisfaction respondents had with the way democracy works in Canada during the election period and post-election. The breakdown is as follows:
Election period, Wave 1 n=53,731
Very satisfied, 29 percent
Somewhat satisfied, 41 percent
Not very satisfied, 18 percent
Not at all satisfied, 10 percent
Post-election, Wave 2 n=39,568
Very satisfied, 36 percent
Somewhat satisfied, 34 percent
Not very satisfied, 16 percent
Not at all satisfied, 13 percent
Among post-election respondents, satisfaction with the way democracy works in Canada was more likely among the following:
electors in Quebec (81%) compared to electors in other provinces (results range from 55% in Alberta to 73% in the Atlantic provinces)
women (75%) compared to men (67%) and non-binary/transgender electors (36%)
electors who completed university (75% compared to 66% of those who completed college or some post-secondary education and 64% of those who completed high school or less)
those who are interested in politics (71% compared to 64% of those uninterested in politics)
those who voted in 2021 (71% versus 58% of non-voters)
Those less likely to express satisfaction with the way democracy works in Canada include:
NEET youth (45%) compared to youth working full-time (55%) and youth in school (57%)
Indigenous electors (59% versus 75% of non-Indigenous electors)
Canadians by birth (69%) compared with new Canadians (81%) and immigrants who became citizens before the 2015 GE (78%)
those who had not been vaccinated against COVID-19 (28% compared to 76% of those who had received at least one dose)
In addition, the likelihood of expressing satisfaction with how democracy works in Canada increased as age increased (from 54% of those aged 18 to 34 to 81% of those aged 55 and older). Conversely, it decreased as the severity of disability increased (from 74% of electors who have no disability to 58% of those who have severe or very severe disability).
12. Opinions on Election-related Technology, Privacy and Political Communications
This section discusses electors' views on election-related policy issues related to the potential use of technology in elections, protection of electors' personal information and being contacted by political parties.
Electors had mixed views on the preferred methods for counting ballots and keeping lists of electors
In the post-election survey, respondents were asked about their preferred method for counting ballots. Their views were mixed. One-third (34%) said they preferred hand counting, whereas one-quarter (26%) said they preferred machine counting. The largest proportion, 37%, indicated they had no preference, while 3% said they don't know. In contrast, following the 43rd GE in 2019, 37% expressed a preference for hand counting, 27% preferred machine counting, and 30% had no preference.
Figure 42: Preferred ballot-counting method
Q: In Canadian federal elections, each paper ballot is counted by hand. In some provincial elections, paper ballots are scanned into a machine that counts the votes. Which vote counting method do you prefer? Base: n= 15,996 (WAVE 2)
Text version of Figure 42: Preferred ballot-counting method
This horizontal bar chart shows respondents' preferred ballot-counting method. The breakdown is as follows:
Hand counting, 34 percent
Machine counting, 26 percent
No preference, 37 percent
Don't know, 3 percent
The likelihood of preferring hand counting was higher among the following:
men (38% versus 30% of women)
electors with a high school education or less (41%) and some post-secondary/college (36%) versus 31% of those who completed university
Indigenous electors (47% versus 33% of non-Indigenous electors)
electors in rural areas (40%) compared with urban areas (33%)
voters in 2021 (34%) compared with non-voters (29%)
electors who had not been vaccinated against COVID-19 (60% compared to 31% of electors who had received at least one dose)
The likelihood of preferring machine counting was higher among electors who live in Ontario (29%) compared to all other provinces (results range from 22% to 25%).
Electors' views were also mixed on whether they prefer paper or computers for the lists used to keep track of electors who voted at the polls. In the post-election survey, the largest proportion (41%) said they have no preference, compared to 35% who said they prefer paper lists and 23% who preferred computer lists. In contrast, following the 43rd GE, 42% expressed a preference for paper lists, 20% preferred computer lists, and 35% had no preference.
Figure 43: Preferred method for keeping lists of electors at the polls
Q: In Canadian federal elections, workers at the polls use paper lists to see if an elector's name is on the list and to mark them off after they vote. In some provincial elections, poll workers use computers or tablets to electronically look up and mark off electors' names. Which method do you prefer? Base: n= 15,625 (WAVE 2)
Text version of Figure 43: Preferred method for keeping lists of electors at the polls
This horizontal bar chart shows respondents' preferred method for keeping lists of electors at the polls. The breakdown is as follows:
Paper lists, 35 percent
Computer lists, 23 percent
No preference, 41 percent
Don't know, 1 percent
The proportion of those who prefer paper lists was higher among the following:
men (38% versus 31% of women)
seniors aged 65 and older (38% compared to 33% of those aged 18 to 64)
electors with a high school education or less (47%) and some post-secondary/college (38%) compared to 30% of those who completed university
Indigenous electors (44% compared to 34% of non-Indigenous electors)
electors in the Prairies (41%), Alberta (38%) and BC (38%) compared with other provinces (results range from 32% to 33%)
voters in 2021 (35%) compared with non-voters (30%)
electors who had not been vaccinated against COVID-19 (59% versus 31% of those who had received at least one dose)
The proportion of those who prefer computer lists was higher among electors in Quebec (29%) compared to other provinces (a range of 17% to 27%) and new Canadians (38% compared to 22% of Canadians by birth).
Half consider voting on the Internet to be risky
Respondents were asked whether they tend to view voting on the Internet as risky or safe. Half (53%) said that "voting on the Internet is risky" comes closest to their view. Additionally, one-quarter (25%) said voting on the Internet is safe, and 22% said they were unsure. Compared to the 2019 NES, the view that voting is risky increased from 49% to 53%. footnote 19
Figure 44: Views on voting on the Internet as risky versus safe
Q: Which statement comes closest to your own view? Base: n=15,702; (WAVE 2)
Text version of Figure 44: Views on voting on the Internet as risky versus safe
This horizontal bar chart shows respondents' views on whether voting on the Internet is risky or safe. The breakdown is as follows:
Voting on the Internet is risky, 53 percent
Voting on the Internet is safe, 25 percent
Not sure, 22 percent
The following were more likely to hold the view that voting on the Internet is risky:
electors aged 18 to 34 (60% versus 53% of those aged 35 to 54 and 49% of those aged 55 and older)
electors with a high school education or less (60% versus 56% of those with some post-secondary or college and 49% of those who completed university)
electors in Alberta (63%) and the Prairies (60%) compared with electors in other provinces (results range from 46% to 55%)
voters in 2021 (53%) compared with non-voters (45%)
electors who had not been vaccinated against COVID-19 (76%) compared with those who had received at least one dose (50%)
The following were more likely to view voting on the Internet as safe:
electors in the Atlantic provinces (33%) compared with other provinces (results range from 19% to 28%)
those who voted by mail (36%) compared with those who voted in person (results range from 23% to 27%)
The following were more likely to say they were unsure if voting on the Internet is risky or safe:
women (26% compared to 18% of men)
electors aged 55 and older (26% versus 16% of those aged 18 to 34 and 20% of those aged 35 to 54)
Majority disagree that voting over the Internet should be an option in federal elections
Forty-three percent of respondents agreed that Canadians should have the option to vote over the Internet in federal elections. These respondents were evenly distributed between those who strongly agreed (20%) and somewhat agreed (23%). In contrast, a majority of 51% disagreed, most of whom disagreed strongly (31%) as opposed to somewhat (21%). This represents a significant decline since the 2019 NES, when 53% agreed that there should be an option to vote over the Internet. footnote 20
Figure 45: Views on whether voting over the Internet should be an option in federal elections
Q: How strongly do you agree or disagree that Canadians should have the option to vote over the Internet in federal elections? Base: n=15,919; (WAVE 2)
Text version of Figure 45: Views on whether voting over the Internet should be an option in federal elections
This vertical bar chart shows how strongly respondents agree or disagree that voting over the Internet should be an option to vote in federal elections. The breakdown is as follows:
Strongly agree, 20 percent
Somewhat agree, 23 percent
Somewhat disagree, 21 percent
Strongly disagree, 31 percent
The following were more likely to agree that voting over the Internet should be an option in federal elections:
electors aged 35 to 54 (45% compared to 40% of those aged 18 to 34 and 43% of those aged 55 and older)
electors who completed university (45% compared to 40% of those with a high school education or less and 41% of those with some post-secondary or college)
electors in the Atlantic provinces (54%), Quebec (48%) and Ontario (44%) compared with other provinces (results range from 33% to 37%)
those who voted by mail (50%) compared with those who voted in person (results range from 40% to 44%)
non-voters in 2021 (54%) compared with voters (42%)
Substantial majority trust Elections Canada to protect personal information
Roughly eight in 10 (84%) respondents agreed that Elections Canada can be trusted to protect the personal information of Canadians. These respondents were evenly distributed between those who strongly and somewhat agree (42% respectively). Of the remaining respondents, 13% said they somewhat or strongly disagree that Elections Canada can be trusted to protect the personal information of Canadians.
In 2019, a similar proportion (83%) of respondents agreed that Elections Canada can be trusted to protect the personal information of Canadians, but a smaller proportion strongly agreed (33% in 2019 versus 42% in 2021).
Figure 46: Trust in EC to protect the personal information of Canadians
Q: Elections Canada keeps the name, address and date of birth of all Canadians who are registered to vote. This information is shared with federal political parties every year and when there is an election. How strongly do you agree or disagree with the following statement? Elections Canada can be trusted to protect the personal information of Canadians. Base: n=53,731 (WAVE 1)
Text version of Figure 46: Trust in EC to protect the personal information of Canadians
This vertical bar chart shows how strongly respondents agree or disagree that Elections Canada can be trusted to protect the personal information of Canadians. The breakdown is as follows:
Strongly agree, 42 percent
Somewhat agree, 42 percent
Somewhat disagree, 9 percent
Strongly disagree, 4 percent
Don't know, 3 percent
The following were less likely to agree that Elections Canada can be trusted to protect personal information:
electors with a disability (81% compared to 86% of electors with no disability)
Indigenous electors (77% compared to 85% of non-Indigenous electors)
NEET youth (75% versus 85% of youth attending school, 82% of youth working full-time and 81% of all other youth)
non-binary/transgender electors (80%) compared with women (86%) and men (84%)
electors in Alberta (78%) compared with other provinces (results range from 82% to 86%)
those who were eligible but did not vote in 2019 (69% compared to 85% of 2019 voters)
those who had not been vaccinated against COVID-19 (62%) compared with those who had received at least one dose (88%)
Large majority favour laws to regulate how parties collect and use personal information
More than nine in 10 (96%) respondents agreed that laws should regulate how political parties collect and use Canadians' personal information, including 78% who strongly agreed. This is a small increase from 2019, when 93% agreed and 70% strongly agreed.
Smaller majorities agreed, more often somewhat than strongly, that it is important for political parties to collect and use personal information about Canadians to communicate with them (58% agreed, while 18% strongly agreed, compared with 56% who agreed in 2019) and that political parties can be trusted to collect and use the personal information of Canadians responsibly (53% agreed, while 12% strongly agreed, compared with 51% who agreed in 2019).
Figure 47: Views on political parties' collection and use of personal information
Q: Elections Canada keeps the name, address and date of birth of all Canadians who are registered to vote. This information is shared with federal political parties every year and when there is an election. How strongly do you agree or disagree with the following statement? Base: all respondents. SPLIT SAMPLES (WAVE 1)
Text version of Figure 47: Views on political parties' collection and use of personal information
This vertical horizontal bar chart shows how strongly respondents agree or disagree with various statements about political parties' collection and use of personal information. The breakdown is as follows:
Laws should regulate how political parties collect and use Canadians' personal information (n=18,092)
Strongly agree, 78 percent
Somewhat agree, 18 percent
Somewhat disagree, 2 percent
Strongly disagree, 1 percent
Don't know, 2 percent
It is important for political parties to collect and use personal information about Canadians in order to communicate with them (n=17,890)
Strongly agree, 18 percent
Somewhat agree, 40 percent
Somewhat disagree, 24 percent
Strongly disagree, 15 percent
Don't know, 3 percent
Political parties can be trusted to collect and use the personal information of Canadians in a responsible way (n=17,749)
Strongly agree, 12 percent
Somewhat agree, 41 percent
Somewhat disagree, 28 percent
Strongly disagree, 16 percent
Don't know, 3 percent
The following were less likely to agree that it is important for political parties to collect and use personal information about Canadians to communicate with them:
Indigenous electors (54% versus 59% of non-Indigenous electors)
electors aged 18 to 64 (56%) compared with seniors aged 65 and older (62%)
those uninterested in politics (49%) compared with those who are interested (59%)
The following were less likely to agree that political parties can be trusted to collect and use the personal information of Canadians in a responsible way:
non-binary/transgender electors (36% versus 50% of men and 58% of women)
electors with a disability (50% versus 56% of electors with no disability)
Indigenous electors (48% versus 54% of non-Indigenous electors)
electors in Alberta (46%) compared with other provinces (results range from 50% to 60%)
those uninterested in politics (46% versus 54% of those interested)
Fewer electors in 2021 thought it appropriate for parties and candidates to contact them in person
Approximately half of electors surveyed during the election period said they consider it appropriate for parties and candidates to contact them by mail (53%), followed by in-person contact, such as door-to-door campaigning (49%). Notably, fewer electors in 2021 said they consider in-person contact to be appropriate compared with the 2019 NES, when the largest part of electors (59%) said in-person contact was appropriate. It is likely that this change is a result of the COVID-19 pandemic.
Figure 48: Views on appropriate ways political parties contact electors
Q: Thinking about this election, what do you think are appropriate ways for political parties or candidates to contact you? [Multiple responses accepted]. Base: n=53,731 (WAVE 1) DK/NR: 3%
Text version of Figure 48: Views on appropriate ways political parties contact electors
This horizontal bar chart shows respondents' views on appropriate ways for political parties or candidates to contact electors in this election. The breakdown is as follows:
Mail, 53 percent
In person, that is, door-to-door campaigning, 49 percent
Email, 42 percent
Telephone call from a live person, 41 percent
Social media, 39 percent
A text message, 27 percent
Telephone call with a recorded message, 17 percent
Other, 2 percent
None of these methods are appropriate, 7 percent
For other contact methods, contact by phone was more likely to be considered appropriate if the call comes from a live person (41%) rather than from a recorded message (17%) or text message (27%). Roughly four in 10 consider it appropriate to be contacted using online methods whether by email (42%) or social media (39%). The proportions who consider phone contact by a live person or a recorded message to be appropriate did not change significantly compared to 2019; however, more electors in 2021 said it was appropriate for parties and candidates to contact them by email (42% in 2021 versus 32% in 2019), social media (39% versus 29%), and text message (27% versus 15%).
The following subgroup variations were notable:
Men were more likely than women to think it appropriate to be contacted in person (55% versus 44%), by a live telephone call (42% versus 39%) or by email (45% versus 39%).
Seniors aged 65 and older were more likely than younger electors to think it is appropriate to be contacted by telephone, either by a live telephone call (45% versus 39%, respectively) or by a recorded message (20% versus 16%).
Youth aged 18 to 24 and 25 to 34 were more likely than those aged 35 and older to think it is appropriate to be contacted through social media (50% and 43% compared with 36%, respectively) or by text message (37% and 30% compared with 25%).
Even distribution of method that political party or candidate used to contact electors
In the post-election survey, over half (57%) of respondents said they were contacted directly by a political party or candidate during the 2021 GE. footnote 21 This is slightly higher than in 2019, when 54% said they were contacted in this way.
One-third (33%) of those who were contacted by a political party or candidate during the election most often said contact was in person, such as door-to-door campaigning, 11 points lower than the 44% of electors who were contacted during the 2019 election. Another third (32%) indicated they had been contacted by text message, 11 points higher than in 2019 (21%). Around three in 10 were contacted by mail (30%, similar to 28% in 2019) or by a telephone call by either a live person (29%, down from 35%) or a recorded message (27%, down from 34%). Additionally, 25% said they were contacted by email, and 11% were contacted through social media.
Figure 49: Methods political parties used to contact electors
Q: How did the political party or candidate contact you? [Multiple responses accepted]. Base: n=18,201; those who had been contacted during the election (WAVE 1+2)
Text version of Figure 49: Methods political parties used to contact electors
This horizontal bar chart shows the methods political parties used to contact electors in the election. The breakdown is as follows:
In person, that is, door-to-door campaigning, 33 percent
A text message, 32 percent
Mail, 30 percent
Telephone call from a live person, 29 percent
Telephone call with a recorded message, 27 percent
Email, 25 percent
Social media, 11 percent
Other, 2 percent
The following subgroup variations were notable:
Electors in Quebec (14%) and BC (21%) were less likely to have been contacted in person compared with other provinces (results range from 37% to 42%).
Electors in Quebec (38%) were more likely to be contacted by a recorded telephone message compared with other provinces (results range from 24% to 27%).
Electors in BC (39%) and Alberta (37%) were more likely to be contacted through a text message compared with other provinces (results range from 23% to 30%).
Electors in urban areas (34%) were more likely to be contacted in person than rural electors (20%).
Seniors aged 65 and older were more likely than other electors to have been contacted by telephone, either by a live telephone call (38% versus 25%) or by a recorded message (36% versus 24%).
Electors aged 18 to 34 were more likely than those aged 35 and older to be contacted by text message (46% versus 28%) but less likely to be contacted in person (29% versus 34%) or through a live telephone call (21% versus 31%).
Indigenous electors (38%) were more likely than non-Indigenous electors (31%) to say they had been contacted through a text message.
13. Concerns about Electoral Integrity Issues
This section presents electors' views on issues that could impact the integrity of an election and trust in the electoral system in terms of perceptions of the susceptibility of the voting system in Canada to fraud, electors' exposure to disinformation about the voting process, and their concerns about the impact of different forms of electoral interference on the outcome of the 2021 election.
Opinions on the integrity of the voting system and voting by mail improved after the election
During the election period, 12% of a split sample of electors had the opinion that the voting system in Canada is prone to fraud, compared with 82% who said the voting system is safe and reliable and 6% who said they did not know. Opinions on the integrity of voting by mail were more negative: in the other half of the split sample, 28% of electors had the opinion that voting by mail is prone to fraud, while 55% said voting by mail is safe and reliable and 17% said they did not know.
Opinions on the integrity of the vote generally improved in the aftermath of the election. In the post-election survey, the proportion who said the voting system is prone to fraud decreased slightly, by 2 points to 10%, while the proportion who said voting by mail is prone to fraud decreased by 5 points to 23%.
Figure 50: Opinions on the integrity of the voting system and voting by mail in Canada
Q: Which statement is closest to your opinion about [the voting system/voting by mail] in Canada? SPLIT SAMPLES (WAVE 1, WAVE 2)
Text version of Figure 50: Opinions on the integrity of the voting system and voting by mail in Canada
This horizontal bar chart shows respondents' opinions on the integrity of the voting system and voting by mail in Canada, comparing the election period and post-election responses. The breakdown is as follows:
Election period (n=27,001)
Voting is prone to fraud, 12 percent
Voting is safe and reliable, 82 percent
Don't know, 7 percent
Post-election (n=15,981)
Voting is prone to fraud, 10 percent
Voting is safe and reliable, 84 percent
Don't know, 6 percent
Election period (n=26,730)
Voting by mail is prone to fraud, 28 percent
Voting by mail is safe and reliable, 55 percent
Don't know, 17 percent
Post-election (n=15,640)
Voting by mail is prone to fraud, 23 percent
Voting by mail is safe and reliable, 59 percent
Don't know, 18 percent
Post-election, the following subgroups were more likely to say the voting system in Canada is prone to fraud:
men (11%) compared with women (9%) and non-binary/transgender electors (7%)
Indigenous electors (18%) compared with non-Indigenous electors (10%)
electors aged 18 to 34 (13%) and 35 to 54 (12%) compared with those 55 and older (8%)
electors with a high school education or less (16%) or some post-secondary/college (13%) compared with those who have completed university (7%)
electors in Alberta (15%) and the Prairies (13%) compared with other provinces (results range from 8% to 10%)
non-voters (17%) compared with voters (10%)
non-voters who did not vote due to political reasons (21%) compared with non-voters who had everyday life reasons (11%)
those who had not been vaccinated against COVID-19 (43%) compared with those who had received at least one dose (6%)
The following were more likely to say voting by mail in Canada is prone to fraud:
men (26%) compared with women (20%) and non-binary/transgender electors (10%)
Indigenous electors (31%) compared with non-Indigenous electors (22%)
electors aged 35 to 54 (28%) compared with those aged 18 to 34 (22%) and 55 and older (21%)
electors with a high school education or less (33%) or some post-secondary/college (29%) compared with those who have completed university (16%)
electors in Alberta (31%), Quebec (26%) and the Prairies (25%) compared with those in Ontario (21%), BC (19%) and the Atlantic provinces (18%)
non-voters (27%) compared with voters (23%)
non-voters who did not vote due to political reasons (34%) compared with non-voters who had electoral process reasons (24%), everyday life reasons (22%) or reasons related to COVID-19 (19%)
those who had not been vaccinated against COVID-19 (70%) compared with those who had received at least one dose (17%)
Electors recalled seeing false information about voting by mail more often than about other aspects of voting
Relatively few respondents said they recalled hearing or seeing false information related to the voting process since the beginning of the election campaign, although the proportions of those who did generally increased by a few points over the course of the election period. From the earliest phase of the election period survey through to the final phase leading up to election day, recall of false information about who is eligible to vote increased from around 6% to 10%, about where to vote went from 3% to 9%, about when to vote went from 7% to 10%, and recall of false information on voting by mail increased from 9% to 14%.
At every phase of the election period survey, recall of false information about voting by mail was higher than recall of false information about the other aspects of the voting process. Compared with the 2019 NES, recall of false information about who is eligible to vote, where to vote and when to vote did not change significantly during the 2021 GE. footnote 22
Figure 51: Recall of false information about voting during the election period
Q: Since the beginning of the election campaign, do you recall seeing or hearing any false information about... who is eligible to vote? where to vote? when to vote? voting by mail? Base: n=53,731 (WAVE 1)
Text version of Figure 51: Recall of false information about voting during the election period
This line graph shows respondents' recall of false information about different aspects of the voting process during the phases of the election period. The breakdown is as follows:
Voter eligibility
Early election phase, 5.7 percent
Registration phase, 6.5 percent
Voter information card phase, 7.6 percent
Early voting phase, 8.3 percent
Election day phase, 9.7 percent
Voting by mail
Early election phase, 9 percent
Registration phase, 9.3 percent
Voter information card phase, 10.2 percent
Early voting phase, 11.2 percent
Election day phase, 14.4 percent
Where to vote
Early election phase, 3.5 percent
Registration phase, 4.3 percent
Voter information card phase, 5.8 percent
Early voting phase, 7.3 percent
Election day phase, 9 percent
When to vote
Early election phase, 7.2 percent
Registration phase, 8 percent
Voter information card phase, 9 percent
Early voting phase, 8.9 percent
Election day phase, 9.7 percent
Across the election period, some groups were more likely to recall being exposed to false information about each of these aspects of the voting process. Specifically, recall of exposure to false information during the election was higher among:
youth aged 18 to 34 and 25 to 34 compared with those aged 35 and older, for false information about
who is eligible to vote (11% and 10% versus 7%)
where to vote (10% and 8% versus 5%)
when to vote (12% and 11% versus 8%)
voting by mail (15% and 13% versus 10%)
Indigenous electors compared with non-Indigenous electors, for false information about
who is eligible to vote (11% versus 7%)
where to vote (10% versus 6%)
when to vote (12% versus 8%)
voting by mail (15% versus 10%)
new Canadians compared with Canadians by birth and immigrants who became citizens before the 2015 GE, for false information about
who is eligible to vote (12% versus 8% and 7%)
where to vote (9% versus 6% and 6%)
when to vote (11% versus 8% and 9%)
voting by mail (13% versus 11% and 10%)
Majorities were concerned about the spread of false information
During the election period, respondents were asked if they thought different types of electoral interference could have any impact on the outcome of the 2021 GE.
Seven in 10 (71%) electors were concerned that the spread of false information online could have a moderate or more impact on the outcome of the 2021 election. This included 37% who thought it could have a major impact. This is notably lower than during the 2019 election period, when 82% thought false information could have at least a moderate impact and 54% thought it could have a major impact on the outcome of the 2019 election.
Half (50%) of electors thought there could be a moderate or greater impact on the election outcome from foreign countries or groups trying to interfere with the election or political opinions of Canadians, including 22% who thought it could have a major impact. Again, concern with this type of electoral interference was lower than during the 2019 election, when 75% thought foreign efforts to influence the political opinions of Canadians could have at least a moderate impact, and 46% thought it could have a major impact.footnote 23
Figure 52: Election-period concerns about the potential electoral interference on the election outcome
Q: Based on what you have seen or heard recently, what impact, if any, do you think the following could have on the outcome of the election? Foreign countries or groups trying to interfere with the election or political opinions of Canadians. / The spread of false information online. Base n=53,731 (WAVE 1)
Text version of Figure 52: Election-period concerns about the potential electoral interference on the election outcome
This horizontal bar chart shows respondents' concerns about the level of impact that two types of potential electoral interference could have on the election outcome. The breakdown is as follows:
The spread of false information online
Major impact, 37 percent
Moderate, 34 percent
Minor, 19 percent
No impact, 6 percent
Don't know, 5 percent
Foreign countries or groups trying to interfere with the election or political opinions of Canadians
Major impact, 22 percent
Moderate, 28 percent
Minor, 30 percent
No impact, 13 percent
Don't know, 8 percent
The following were more likely to think the spread of false information online could have a major impact on the outcome of the election:
women (40%) and non-binary/transgender electors (47%) compared to men (35%)
Indigenous electors (41%) compared to non-Indigenous electors (37%)
electors in Alberta (42%) compared to other provinces (a range of 34% to 39%)
new Canadians (47%) compared to immigrants who became citizens before the 2015 GE (39%) and Canadians by birth (37%)
The likelihood of thinking the spread of false information online could have a major impact on the outcome of the election decreased as age increased, from 45% of those aged 18 to 24 to 33% of those 65 or older.
The following were more likely to think foreign countries or groups trying to interfere with the election or political opinions of Canadians could have a major impact on the outcome of the election:
electors in Alberta (25%) compared to other provinces (a range of 18% to 23%)
men (22%) and women (21%) compared to non-binary/transgender electors (16%)
Indigenous electors (26%) compared to non-Indigenous electors (21%)
new Canadians (28%) compared to immigrants who became citizens before the 2015 GE (24%) and Canadians by birth (21%)
Twice as many electors thought the spread of false information online was a problem during the election compared to foreign interference
In the post-election survey, respondents were asked if they thought these different types of electoral interference were actually a problem during the 2021 GE, based on what they had seen or heard. Half (52%) of all electors thought the spread of false information online was a problem during the 2021 GE, similar to the 50% of electors who said the same about the 2019 election. One-quarter (25%) of electors thought foreign countries or groups trying to interfere with the election or political opinion of Canadians had been a problem in the 2021 election (compared with 31% in 2019). footnote 24
Figure 53: Post-election perception that electoral interference was a problem in the GE
Q: Based on what you have seen or heard recently, do you think any of the following were a problem in this election? Foreign countries or groups trying to interfere with the election or political opinions of Canadians. / The spread of false information online. Base n=31,621 (WAVE 2)
Text version of Figure 53: Post-election perception that electoral interference was a problem in the GE
This horizontal bar chart shows the percentages of respondents who perceived that two types of electoral interference had been a problem in the general election. The breakdown is as follows:
The spread of false information online
Yes, 52 percent
No, 34 percent
Don't know, 14 percent
Foreign countries or groups trying to interfere with the election or political opinions of Canadians
Yes, 25 percent
No, 55 percent
Don't know, 20 percent
The following were more likely to say that false information had been a problem in the election:
electors in Alberta (59%) compared to other provinces (a range of 37% to 56%)
Indigenous electors (55%) compared to non-Indigenous electors (51%)
electors who had received at least one dose of a COVID-19 vaccine (52%) compared with those who had not been vaccinated (49%)
The likelihood of thinking false information was a problem in the election decreased as age increased, from 64% of electors aged 18 to 34 to 44% of those 55 and older.
The following were more likely to say that foreign countries or groups trying to interfere with the election or political opinion of Canadians had been a problem in the election:
electors in Alberta (33%) compared to other provinces (a range of 17% to 29%)
men (31%) compared to women (20%) and non-binary/transgender electors (18%)
Indigenous electors (30%) compared to non-Indigenous electors (25%)
electors who had not been vaccinated against COVID-19 (41%) compared with those who had received at least one dose (23%)
Nearly one in 10 electors overall thought problems of false information had a major impact on the election
Respondents were asked what actual impact, if any, they thought problems of electoral interference had on the outcome of the election. footnote 25
Close to one in 10 (9%) electors thought problems of false information had a major impact on the outcome of the election, and 20% thought it had a moderate impact. An additional 18% of electors said it had only a minor impact on the outcome. Only 2% said it had no impact on the outcome of the election. These proportions are similar to the results obtained following the 2019 election.
Only 4% of electors thought that problems of foreign interference had a major impact on the outcome of the election, while 9% thought it had a moderate impact. Additionally, 10% thought foreign interference had a minor impact on the outcome of the election, while 1% said it had no impact. The proportions of electors who thought foreign interference had a moderate or major impact on the outcome of the election slightly diminished compared with the 2019 election, when 5% thought problems of foreign influence had a major impact and 11% thought it had a moderate impact on the outcome of the 2019 election.
Figure 54: Electors' perceptions of the impact of problems of foreign interference on election outcome
Perceived impact on 2021 election outcome
Problems of false information
Problems of foreign interference
Major impact
9%
4%
Moderate impact
20%
9%
Minor impact
18%
10%
No impact at all
2%
1%
Don't know
2%
1%
Q. What impact, if any, do you think problems of (foreign interference/false information interference) had on the outcome of this election? Base: respondents who thought foreign interference (n=8,308) or false information (n=16,498) had been a problem during this election. Results rebased to represent all respondents n=31,621. (WAVE 2)
Footnotes
Return to footnote 1 Electors' recall of receiving the VIC are reported in detail in the National Electors Study Report on the Voter Information Campaign and Elector Awareness.
Return to footnote 2 The election-day phase of the Wave 1 survey corresponds to the final week of the election period, beginning after the close of advance polls.
Return to footnote 3 Self-reported voter turnout is historically overreported in public opinion surveys: in this survey, self-reported turnout, post-election, was 92%, while the official turnout rate for the 44th GE among registered electors was 62.6%. A limitation of this current research, therefore, is that it overrepresents voters in the survey sample. Two factors may be responsible for the overrepresentation of voters: 1) people who vote may be more likely than non-voters to participate in a study about voting (response bias), and 2) people who did not vote may report doing so because they want to present themselves in a more positive light (social desirability bias).
Return to footnote 4 These reasons were included in the list of options presented to respondents in the 2021 online survey but were not included in the 2019 survey. Some part of the increase in electoral process–related reasons may be due to this change in the measurement.
Return to footnote 5 Formally, voting by mail is done using the special ballot voting method, which is also used for in-person voting at local Elections Canada offices in each electoral district as well as for groups of electors such as Canadian Forces and incarcerated electors. According to the Official Voting Results, in 2021, 6.1% of all valid votes were cast by special ballot, up from 3.5% in 2019. The Official Voting Results do not distinguish between special ballots cast in person versus by mail, but estimates based on preliminary results indicate that the increase in special ballots was largely driven by an increase in electors voting by mail from inside their electoral district, which accounted for 2.95% of all ballots cast in 2021 compared with only 0.03% in 2019 (see Table 2 in 2. Delivering the General Election – Report on the 44th General Election of September 20, 2021 – Elections Canada).
Return to footnote 6 See the NES GE44 Report on the Voter Information Campaign and Elector Awareness for results on electors' awareness of the option to vote by mail and other voting methods.
Return to footnote 7 The voting method questions were adjusted for the 2021 NES in an effort to accommodate the variety of ways that electors could vote during the pandemic election, including new scenarios such as voters who received a ballot in the mail but who opted to return their marked ballot in person using designated ballot boxes at polling places. For this reason, voters were asked how they received their ballot in order to vote, with web respondents being given the option to say they "received it in the mail." It was observed on September 28 during data collection that an aberrant portion of respondents who selected "received it in the mail" was unable to answer follow-up questions pertaining to the vote-by-mail experience, with some open-ended responses indicating that these respondents did not vote by mail but rather suggested that they had been thinking about the VIC they had received in the mail. To clarify the question, the option was changed to "vote-by-mail kit" on September 28, which reduced the proportions who selected this option as well as those who were unable to answer the follow-up questions. Prior to September 28, around 12% of respondents selected "received it in the mail." After September 28, around 9% of respondents selected "vote-by-mail kit."
Return to footnote 8 Poll hours across the time zones were as follows: Newfoundland (8:30 a.m. to 8:30 p.m.), Atlantic (8:30 a.m. to 8:30 p.m.), Eastern (9:30 a.m. to 9:30 p.m.), Central (8:30 a.m. to 8:30 p.m.), Mountain (7:30 a.m. to 7:30 p.m.), and Pacific (7:00 a.m. to 7:00 p.m.).
Return to footnote 10 Q. For this election, did you need information on ... the accessibility of your polling place? ... accessible voting tools and services to assist you with voting? Base: n=15,785; electors with a disability. [Wave 2]
Return to footnote 11 Q. When you voted, did someone assist you with marking your ballot? Base: 12,105; voters with a disability [DK: 1%]. [WAVE 2]
Return to footnote 12 Q: Who gave you assistance marking your ballot? Base: n=441; voters with a disability who needed assistance marking their ballot. [WAVE 2]
Return to footnote 13 Q. Voters can choose to be served in either official language, English or French. In which language were you served by Elections Canada staff? Base: n=31,576; Voters. [DK/NR: <0.5%]. [WAVE 2]
Return to footnote 14 Survey respondents were considered members of the OLMC based on the province or territory they reside in and their reported primary language, meaning the language they speak most often at home. Those who speak primarily French and live outside of Quebec are considered French OLMCs, while those who speak primarily English and live inside Quebec are considered English OLMCs.
Return to footnote 15 Q. Were you satisfied with the official language in which you were served? Base: n=31,498; Voters. [DK/NR: <0.5%]. [WAVE 2]
Return to footnote 16 Q. If you go to vote in person, do you think you will be able to receive service in [English/French]? Base: n=1,874; OLMC electors. [DK/NR: <0.5%]. [WAVE 1]
Return to footnote 17 Some part of this difference can be attributed to a higher proportion of "don't know" responses to this question among non-voters: 16% of non-voters said they did not know how fairly EC ran the election, compared to 5% of voters.
Return to footnote 19 Some of this difference might be due to measuring opinions on this question at different points in the 2019 and 2021 electoral cycles: 2019 opinions were measured during the pre-election survey; 2021 opinions were measured during the post-election survey.
Return to footnote 20 Some of this difference might be due to measuring opinions on this question at different points in the 2019 and 2021 electoral cycles: 2019 opinions were measured during the pre-election survey, while 2021 opinions were measured during the post-election survey.
Return to footnote 21 Q. During the election [so far, have you been/were you] directly contacted by a political party or candidate? Base: n=31,621 (WAVE 1+2) DK/NR: 1%
Return to footnote 22 The 2019 NES did not measure recall of false information about voting by mail.
Return to footnote 23 Results are not strictly comparable: the wording of this option changed from "Foreign efforts to influence the political opinions of Canadians" in the 2019 NES to "Foreign countries or groups trying to interfere with the election or political opinions of Canadians" in 2021.
Return to footnote 24 Results are not strictly comparable: the wording of this option has changed from "Foreign efforts to influence the political opinions of Canadians" in the 2019 NES to "Foreign countries or groups trying to interfere with the election or political opinions of Canadians" in 2021.
Return to footnote 25 Only respondents who said they thought there had been a problem with electoral interference were asked what impact they thought that problem had on the outcome of the election. To allow for comparison of the results across the different forms of electoral interference, the results were rebased to include all electors, including those who did not think there had been a problem. For example, among the 52% of electors who thought false information had been a problem, 18% thought it had a major impact on the outcome of the election. In other words, 9% of all electors thought it had a major impact. In comparison, among the 25% of electors who thought foreign interference had been a problem, 17% thought it had a major impact; this translates to 4% of all electors who thought problems of foreign interference had a major impact.