Government of Canada 2019 Pilot Public Opinion Research Survey on Accessibility
Employment and Social Development Canada
October 2019
Final Report
Prepared for:
Employment and Social Development Canada
Supplier Name: Quorus Consulting Group Inc.
Contract Award Date: June 19, 2018
Delivery Date: October 2019
Contract Amount (incl. HST): $149,955.97
Contract #: G9292-191234/001/CY
POR Number: 012-18
For more information, please contact:
nc-por-rop-gd@hrsdc-rhdcc.gc.ca
Ce rapport est aussi disponible en français.
Copyright Page
Government of Canada 2019 Pilot Public Opinion Research Survey on Accessibility
This publication is available for download at canada.ca/publicentre-ESDC.
It is available upon request in multiple formats (large print, MP3, braille, audio CD, e-text CD, DAISY or accessible PDF), by contacting 1 800 O-Canada (1-800-622-6232).
By teletypewriter (TTY), call 1-800-926-9105.
© Her Majesty the Queen in Right of Canada, 2019
For information regarding reproduction rights: droitdauteur.copyright@HRSDC-RHDCC.gc.ca.
Cat. No. : Em4-24/2019E-PDF
ISBN: 978-0-660-32678-8
ESDC
Cat. No. : POR-107-12-19E
Projet pilote de recherche sur l’opinion publique sur l’accessibilité réalisé par le gouvernement du Canada en 2019
Vous pouvez télécharger cette publication en ligne sur le site canada.ca/publicentre-EDSC
Ce document offert sur demande en médias substituts (gros caractères, MP3, braille, audio sur DC, fichiers de texte sur DC, DAISY, ou accessible PDF) auprès du 1 800 O-Canada (1-800-622-6232).
Si vous utilisez un téléscripteur (ATS), composez le 1-800-926-9105.
© Sa Majesté la Reine du Chef du Canada, 2019
Pour des renseignements sur les droits de reproduction : droitdauteur.copyright@HRSDC-RHDCC.gc.ca
Nº de cat. : Em4-24/2019E-PDF
ISBN : 978-0-660-32679-5
EDSC
Nº de cat. : POR-107-12-19F
Political Neutrality Certification
I hereby certify as Senior Officer of Quorus Consulting Group Inc. that the deliverables fully comply with the Government of Canada political neutrality requirements outlined in the Policy on Communications and Federal Identity and the Directive on the Management of Communications - Appendix C.
Specifically, the deliverables do not include information on electoral voting intentions, political party preferences, standings with the electorate or ratings of the performance of a political party or its leaders.
Signed:

Rick Nadeau, President
Quorus Consulting Group Inc.
Table of Contents
Table of Figures
Figure 1: Incidence of Persons with Disabilities
Figure 2: Regional Quotas for General Population Interviews
Figure 4: Comparing Survey Sample with Population Distribution
Figure 5: Dialing Disposition Report for the General Population Segment
Figure 7: General Population – Understanding of Barriers
Figure 8: Top Barriers Identified for Persons with Disabilities, by Persons without Disabilities
Figure 10: Persons with Disabilities – Types of Barriers Experienced in Past Year
Figure 11: Persons with Disabilities - Types of Barriers Experienced in Past Year (Continued)
Figure 12: General Population – Awareness of Attitude Barriers
Figure 13: General Population – Witnessing Employment Barriers for a Person with a Disability
Figure 18: Persons with Disabilities – Mobility (Unadjusted Incidence): Have This Type of Disability
Figure 20: Persons with Disabilities – Mobility: Difficulty with Disability
Figure 21: Persons with Disabilities – Mobility (Adjusted Incidence): Have This Type of Disability
Figure 22: Persons with Disabilities – Pain (Unadjusted Incidence): Have This Type of Disability
Figure 23: Persons with Disabilities – Pain: Frequency of Environment Limiting Inclusion in Society
Figure 24: Persons with Disabilities – Pain: Difficulty with Disability
Figure 25: Persons with Disabilities – Pain (Adjusted Incidence): Have This Type of Disability
Figure 26: Persons with Disabilities – Flexibility: Have This Type of Disability
Figure 28: Persons with Disabilities – Flexibility: Difficulty with Disability
Figure 30: Persons with Disabilities – Dexterity (Adjusted Incidence): Have This Type of Disability
Figure 33: Persons with Disabilities – Mental Health-Related: Difficulty with Disability
Figure 35: Persons with Disabilities – Memory (Unadjusted Incidence): Have This Type of Disability
Figure 37: Persons with Disabilities – Memory: Difficulty with Disability
Figure 38: Persons with Disabilities – Memory (Adjusted Incidence): Have This Type of Disability
Figure 39: Persons with Disabilities – Seeing (Unadjusted Incidence): Have This Type of Disability
Figure 41: Persons with Disabilities – Seeing: Difficulty with Disability
Figure 42: Persons with Disabilities – Seeing (Adjusted Incidence): Have This Type of Disability
Figure 43: Persons with Disabilities – Hearing (Unadjusted Incidence): Have This Type of Disability
Figure 45: Persons with Disabilities – Hearing: Difficulty with Disability
Figure 46: Persons with Disabilities – Hearing (Adjusted Incidence): Have This Type of Disability
Figure 47: Persons with Disabilities – Learning (Unadjusted Incidence): Have This Type of Disability
Figure 49: Persons with Disabilities – Learning: Difficulty with Disability
Figure 50: Persons with Disabilities – Learning (Adjusted Incidence): Have This Type of Disability
Figure 53: Persons with Disabilities – Communication: Difficulty with Disability
Figure 55: Persons with Disabilities – Speech (Unadjusted Incidence): Have This Type of Disability
Figure 57: Persons with Disabilities – Speech: Difficulty with Disability
Figure 58: Persons with Disabilities – Speech (Adjusted Incidence): Have This Type of Disability
Figure 61: Persons with Disabilities – Developmental: Difficulty with Disability
Figure 62: Persons with Disabilities – Language (Unadjusted Incidence): Have This Type of Disability
Figure 64: Persons with Disabilities – Language: Difficulty with Disability
Figure 65: Persons with Disabilities – Language (Adjusted Incidence): Have This Type of Disability
Figure 68: Persons with Disabilities – Other Disability: Difficulty with Disability
Figure 70: Persons with Disabilities – Experience with Attitude Barriers
Figure 71: Persons with Disabilities – Barriers to Employment
Figure 72: Persons with Disabilities – Barriers to Public Buildings and Areas
Figure 73: Persons with Disabilities – Barriers to Transportation
Figure 74: Persons with Disabilities – Barriers to Information and Communication Technology
Figure 75: Persons with Disabilities – Barriers to Program and Service Delivery
Figure 76: Persons with Disabilities – Tried to Access Information on Government Programs/Services
Figure 77: Persons with Disabilities – Ease of Finding Information on Government Programs/Services
Figure 78: Persons with Disabilities – Type of Program or Service
Figure 79: Persons with Disabilities – Type of Program or Service that Was Difficult to Find
Figure 80: Persons with Disabilities – Remember the Name of Programs/Services
Figure 82: Persons with Disabilities – Equipment, Aids or Support Used
Figure 83: Persons with Disabilities – Types of Equipment, Aids or Support Used
Figure 84: Persons with Disabilities – Difficulty Communicating
Figure 85: Persons with Disabilities – Caregiver/Legal Guardian of a Person with a Disability
Figure 86: General Population – Interaction with a Person with a Disability
Figure 87: Awareness of BillC-81: The Accessible Canada Act
Figure 88: Persons with Disabilities – Recall of Details about Bill C-81
Figure 89: General Population – Recall of Details about Bill C-81
Figure 90: Knowledge of Regional Laws, Programs or Strategies
Executive Summary
Overview – Background and Methodology
In 2018, Employment and Social Development Canada (ESDC)’s Accessibility Secretariat commissioned a study to measure Canadians’ awareness and experience(s) with accessibility and disability issues. The results of the survey will be used primarily to track progress for Canadians in the implementation of the Accessible Canada Act and becoming a Canada without barriers.
The scope of the study involved two key population segments: persons with disabilities and members of the general population (i.e. individuals who do not have a disability). An Instrument was developed to identify people with disabilities specifically for the purpose of this public opinion research. While some of the wording for some of the questions used was borrowed from the Disability Screening Questions (DSQ) of the 2017 Canadian Survey on Disability, the instrument is completely different from the DSQ and does not pretend to replicate it in any way. Questions on difficulty with certain activities along with questions about how these difficulties limit people in their everyday lives were used to screen respondents into the disability segment of the survey. The study focused on accessibility and not the degree a person’s disability limits their daily activities.
The data collection approaches used for each segment can be summarized in the following ways:
General Population
A total of 1,350 telephone interviews with Canadians, 18 years of age and older.
The sample consisted of traditional wireline telephone numbers and a sub-quota of cell phone-only households.
The margin of error of this sample size is +/− 2.7%, 19 times out of 20.
Data was weighted by region, gender, and age to ensure that the final distributions within the final sample mirror those of the Canadian population according to the latest Census data.
Persons with Disabilities
A total of 2,456 surveys were completed with persons with disabilities at least 18 years of age, of which 666 were completed by telephone, 1,788 were completed online and 2 were completed by respondents who submitted a hardcopy version of the questionnaire or completed and emailed an electronic version of the questionnaire.
Nearly all surveys completed over the telephone (~650) consisted of traditional wireline telephone numbers and a sub-quota of cell phone-only households. The remaining telephone interviews were completed with individuals who dialed into the toll-free number to schedule an interview.
Surveys through other data collection modes were completed by individuals contacted through departmental partnerships and stakeholder networks.
In 2018, more than 50 organizations, interested in creating relevant and effective federal legislation, came together to form the Federal Accessibility Legislation Alliance (FALA). The federal government provided a grant to assist these organizations in working together. Feedback was sought from the disability community to determine how to strengthen the legislation. By the end of the project, there were over 100 organizations and over 2,700 individuals working with FALA. The questionnaire used for this study was designed by Quorus Consulting in consultation with ESDC, and the leadership team of FALA. In the questionnaire, the definition of disability from the Accessible Canada Act was used. The entire questionnaire underwent a plain language edit by a service provider to ensure it was as approachable as possible for persons with intellectual and learning disabilities.
Respondents from this segment could complete the survey using a variety of accessible formats: telephone, online, American or Quebec Sign Language, downloadable PDF and MSWord versions, e-text, Braille, digital Braille, DAISY, VRS and hardcopy versions.
Given the non-probability nature of the sampling, a margin of error cannot be calculated. As well, data for this segment were not weighted. Therefore, the population segment that participated in this survey cannot be compared to the broader population of people with disabilities in Canada.
Study parameters common to both segments included the following:
Data collection occurred between May 24th and July 8th, 2019, and included a pretest of all data collection modes and formats. In addition to testing for accessibility, the pretest helped assess the flow of the survey, comprehension of the questions, language, data integrity, and the length of the survey instrument.
All study respondents were informed that the study was being conducted by Quorus on behalf of ESDC.
All data collection modes were available in English and in French.
Participants did not receive any incentive for completing the survey.
All participants were provided the following standard reassurances regarding the confidential and anonymous nature of their opinion data:
Your responses will be kept entirely confidential and anonymous. If at any time during the survey you are not comfortable with a question, you can skip it.
Your decision to participate is up to you and will not affect your relationship with the Government of Canada or the services they provide you. The information provided will be managed according to the requirements of the Privacy Act. The final report on the survey will be available through Library and Archives Canada.
Depending on their feedback, the survey took respondents approximately 15 minutes to complete.
OVERVIEW OF RESULTS – GENERAL POPULATION
Nearly three-quarters (72%) of the general population would say they understand quite well the idea of what a disability is (i.e. they rated their understanding at least an 8 on a scale from 0 to 10). Using the same 10-point scale, 47% would say they understand quite well the types of barriers that Canadians with a disability may encounter.
When asked, without any examples, to describe the top three barriers respondents believed people with disabilities face, the results reveal a wide range of barriers. The most common types described included the following:
The most common types of barriers described were related to physical accessibility, such as access to buildings (39%).
At 24%, general mobility-related barriers were described while 19% specifically identified barriers to transportation or public transportation.
Roughly 18% mentioned barriers related to access to services.
A majority of respondents (57%) indicated having heard of “attitude barriers” before participating in this study. For instance, people with disabilities are sometimes treated badly or differently because of behaviours, perceptions, and assumptions that other people have. This is called an “attitude barrier.”
Respondents who were asked how often they witnessed different types of accessibility-related barriers, witnessed employment-related barriers the most. Statistics for each type of disability are as follows:
As for employment-related barriers, 24% indicated always or often witnessing a barrier to finding meaningful work, 21% witnessed a barrier to moving up in an organization, 21% witnessed a barrier to having access to supports or workplace accommodations, and 16% witnessed a barrier to being hired.
In terms of transportation-related barriers, 11% always or often witnessed barriers to using municipal public-transit, 10% to using taxis and ridesharing services, 5% to using school transportation, 2% to using ferries, 3% to using VIA rail or interprovincial trains, 6% to travel by air, and 4% to using buses that cross borders.
Nearly one in five respondents (17%) have always or often witnessed built environment-related barriers, i.e. barriers that limited someone’s ability to move in and around public buildings and spaces.
Less than one tenth of respondents have always or often witnessed Information and Communication Technology (ICT)-related barriers, including: website accessibility (7%), wireless service accessibility (7%), using self-service technology in a public space (6%), watching cable (5%), watching a show on a streaming service (5%), or watching a video on the Internet (6%).
Program or service delivery barriers are reported to be always or often witnessed in terms of the accessibility of a program/service provided by a company/an organization (7%), or the accessibility of a government program or service (6%).
A minority (15%) have seen, read, or heard anything about the Government of Canada’s Bill C-81 (The Accessible Canada Act) and its purpose.1 When asked to explain, without any examples, what they remember about this Act, 20% who remember the Bill explain it will generally support or assist people with disabilities and 16% explain it will increase accessibility.
Half believe their province or territory (50%) has accessibility legislation or an accessibility strategy or plan and a similar proportion (55%) believe their municipality has accessibility by laws, strategies, policies or programs.
OVERVIEW OF RESULTS – PERSONS WITH DISABILITIES
When first asked if respondents identified themselves as a person with a disability, 74% agreed. To establish if the respondents “qualify” for the disabilities segment of the survey, respondents were presented a list of disabilities and directly asked if they have had each specific disability. If yes, then the difficulty and limitation as a result of the disability(ies) were then considered to screen participants to qualify for the persons with disabilities segment of the survey. Note that the types of disabilities listed here may not perfectly represent all persons with disabilities in Canada.
The disability screening revealed the following:
Figure 1: Incidence of Persons with Disabilities
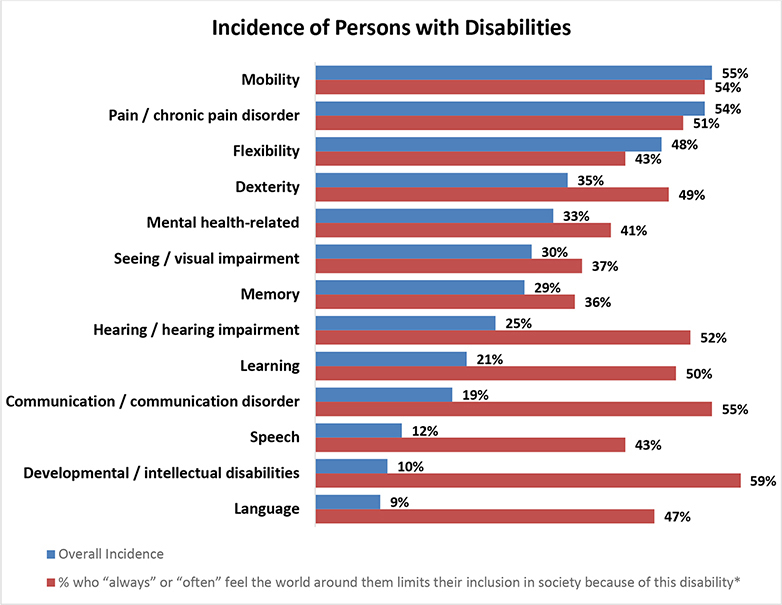
A graph with the data on the incidence of persons with different disabilities
Description: The horizontal bar graph presents the incidence of persons with 13 types of disabilities. The graph shows a set of two bars for each disability that represents the overall incidence, and the percentage of respondents who “always” or “often” feel the world around them limits their inclusion in society because of this disability. The data inferred from the graph is as follows: mobility - 55 percent (overall incidence), 54 percent (limits inclusion in society); pain or chronic pain disorder - 54 percent (overall incidence), 51 percent (limits inclusion in society); flexibility - 48 percent (overall incidence), 43 percent (limits inclusion in society); dexterity - 35 percent (overall incidence), 49 percent (limits inclusion in society); mental health-related - 33 percent (overall incidence), 41 percent (limits inclusion in society); seeing or visual impairment - 30 percent (overall incidence), 37 percent (limits inclusion in society); memory - 29 percent (overall incidence), 36 percent (limits inclusion in society); hearing or hearing impairment - 25 percent (overall incidence), 52 percent (limits inclusion in society); learning - 21 percent (overall incidence), 50 percent (limits inclusion in society); communication or communication disorder - 19 percent (overall incidence), 55 percent (limits inclusion in society); speech - 12 percent (overall incidence), 43 percent (limits inclusion in society); developmental or intellectual disabilities - 10 percent (overall incidence), 59 percent (limits inclusion in society); and language - 9 percent (overall incidence), 47 percent (limits inclusion in society).
Nearly two-thirds of respondents (63%) used equipment, an aid or a support to help them with their daily activities. Among these respondents, a very wide range of “supports” are used, the most common ones being a cane or walker (32%), a wheelchair or mobility scooter (32%), and a hearing aid (19%).
One in ten (11%) feel they “always” experience “attitude barriers”, 30% feel they “often” encounter them and another 28% “sometimes” encounter them.
From a communication standpoint, challenges vary according to the form of communication – more specifically:
23% feel communicating over the phone is difficult
21% feel writing down information is difficult
16% feel in person or face to face communications are difficult
14% feel reading and understanding written materials is difficult
13% feel communicating over the Internet is difficult
Respondents who were asked how often they experienced the following types of accessibility-related barriers, experienced employment-related barriers the most. Statistics for each type of disability are as follows:
As for employment-related barriers, 25% indicated always or often experiencing a barrier to finding meaningful work, 24% witnessed a barrier to having access to supports or workplace accommodations, 23% witnessed a barrier to moving up in an organization, and 21% witnessed a barrier to being hired.
In terms of transportation-related barriers, 20% always or often experienced barriers to using municipal public-transit, 19% to travelling by air, 17% to using taxis and ridesharing services, 6% to using ferries, 9% to using VIA rail or interprovincial trains, and 8% to using buses that cross borders.
Over one quarter of respondents (30%) have always or often experienced built environment-related barriers, i.e. barriers that limited someone’s ability to move in and around public buildings and spaces.
Less than one fifth of respondents have always or often experienced Information and Communication Technology (ICT)-related barriers, including: website accessibility (12%), wireless service accessibility (10%), using self-service technology in a public space (16%), watching cable (11%), watching a show on a streaming service (10%), or watching a video on the Internet (14%).
Program or service delivery barriers are reported to be always or often experienced in terms of the accessibility of a program/service provided by a company/an organization (20%), or the accessibility of a government program or service (17%).
Two in five respondents (41%) have seen, read, or heard anything about the Government of Canada’s Bill C-81 and its purpose. When asked to explain, unprompted, what they remember about this Act, 17% who remember the Bill explain it will generally support or assist people with disabilities and 17% explain it will increase accessibility.
Nearly half believe their province or territory (45%) has accessibility legislation or an accessibility strategy or plan and a similar proportion (45%) believe their municipality has accessibility by laws, strategies, policies or programs.
Over the past 12 months, 42% of respondents have tried to access information on any government programs or services related to accessibility or disability.
Among these respondents, 69% sought out provincial information, 57% federal information, and 36% municipal information.
Generally, a majority felt the experience was either “very difficult” (22%) or “difficult” (37%) whereas 14% felt the experience was easy.
When it comes to Government of Canada employees providing equal access to services and programs to people with different disabilities, including communication disabilities, 44% believe “much more” needs to be done in this area and 26% believe “a little more” needs to be done.
Methodology
Methodology
The scope of the study involved multiple modes of data collection to survey two segments of the Canadian population:
Persons with disabilities, and,
Members of the general population (i.e. individuals who do not have a disability).
For the purposes of this study, the Accessible Canada Act (ACA) definition of disability is used. The term “Disability” refers to a physical, mental, intellectual, learning, communication, or sensory impairment – or a functional limitation – whether permanent, temporary, or episodic in nature that, in interaction with a barrier, may hinder a person’s full and equal participation in society.
Questionnaire Design. Quorus designed the survey instruments in English in working with ESDC. Together, they ensured the research objectives were addressed, that plain language was used, and that the questionnaires flowed easily for respondents. To further ensure that the survey script used plain language, ESDC worked closely with a service provider that specializes in developing and revising texts in plain language.
Various ESDC partners and stakeholders with specific knowledge of disability and accessibility issues in Canada, including the Federal Accessibility Legislation Alliance (FALA), were consulted in the design of the study and the development of the questionnaires.
A different questionnaire was developed for each segment with many questions overlapping in both questionnaires. The survey with members of the general population focused on their familiarity with barriers to accessibility and the extent to which they may have witnessed certain types of barriers. The survey with persons with disabilities focused more directly on their own experiences with barriers to accessibility.
An Instrument was developed to establish if the respondent was an individual with a disability and ultimately determined which version of the questionnaire they would complete. While some of the wording for some of the questions used was borrowed from the Disability Screening Questions (DSQ) of the 2017 Canadian Survey on Disability, the instrument is completely different from the DSQ and does not pretend to replicate it in any way.
More specifically, participants were presented with thirteen specific types of disabilities and then asked if, yes or no, they believe they have had each disability. For each disability where the respondent indicated having had the disability, two follow-up questions were asked to establish whether they should follow the disability segment stream of the questionnaire:
A first question established how often they feel this disability limits their inclusion in society: “How often would you say the world around you - for example physical spaces, technology, or people’s attitudes towards you - limits your inclusion in society because of this disability?” If the respondent indicated “always”, “often” or “sometimes”, they followed the disability segment stream of the questionnaire. If they indicated “rarely” or “never”, they were asked the next follow-up question.
The next follow-up question asked how much difficulty they have with the specific disability. If the respondent indicates that they have “some difficulty”, “a lot of difficulty” or they cannot function, then they follow the disability segment stream of the questionnaire.
This process was repeated for each of the thirteen specific types of disabilities in addition to any “other” disability the respondent believes they may have had.
The questionnaire consisted mostly of closed-ended questions and was designed to take the average respondent 15 minutes to complete the survey.
All study respondents were informed that the study was being conducted by ESDC.
Participants did not receive any incentive for completing the survey.
Quorus translated the client-approved English versions of the survey. Respondents had the choice to complete the survey in English or in French.
The approved final questionnaires were used to create multiple formats of the questionnaire. The General Population segment responded to the survey through a telephone survey. Quorus, in collaboration with ESDC, created multiple versions of the questionnaire for persons with disabilities to ensure the questionnaire was accessible. The different formats created included:
Telephone
Online
Hardcopy – Regular font size
Arial 12 – downloadable PDF
Arial 12 MSWord version
Arial 12 fillable MSWord version
Hardcopy – Large font size
Arial 18 – downloadable PDF
Arial 18 MSWord version
Arial 18 fillable MSWord version
Daisy file
EPUB file
Braille (hardcopy and digital)
The English and French telephone versions of the questionnaire were pre-tested according to Government of Canada standards. A total of 39 surveys (22 Disability and 17 General Population) were completed. For the disability segment, 10 surveys were completed in English and 12 in French, the results of which were ultimately included as part of the final dataset. The pretest helped assess the flow of the survey, comprehension of the questions, language, data integrity, and the length of the survey instrument.
Extensive internal testing of alternate formats was completed within ESDC to ensure these formats met Government of Canada accessibility standards.
Respondent Support. Quorus hosted and designed, in collaboration with ESDC, an accessible and bilingual webpage dedicated to this study that described the background and objectives; provided visitors with a study Question and Answer (Q&A); contact information for Quorus and ESDC; and access to the various formats of the survey, including a link to the online version of the survey. Respondents could also contact Quorus or ESDC directly by telephone or email to ask questions or to request a hardcopy version of the questionnaire, including a hardcopy in Braille. They could also email their completed survey back to Quorus or ESDC. The webpage also included a 1-800 number where study participants could request that an interviewer call them back to complete a telephone survey, ask questions or request a hardcopy version of the questionnaire.
Quorus informed respondents of their rights under the Privacy and Access to Information Acts and ensured that those rights were protected throughout the research process. This included: informing participants of the purpose of the research; identifying both the sponsoring department or agency and research supplier at the end of the interview; informing participants that the study will be made available to the public in 6 months after field completion through Library and Archives Canada, informing participants that their participation in the study was voluntary, and that the information provided would be administered according to the requirements of the Privacy Act.
Data Collection
Data collection for both population segments occurred between May 28th, and July 7th, 2019.
General Population Segment. For the General Population segment, a total of 1,350 telephone interviews with Canadians, 18 years of age and older were completed. The sample consisted of traditional wireline telephone numbers and a sub-quota of cell-phone only households (CPO households). Cell phone numbers were added to the landline Random Digit Dialing telephone sample to reduce coverage error and provide a more representative final sample.
The survey introduction was adjusted to appropriately capture the reality of calling Canadians on their cell phones (Are you in a place where you are comfortable to continue with the survey?).
The “most recent birthday” approach was used to ensure randomness within the household.
Regional quotas were established to generate sufficient data regionally for robust analysis. The distribution suggested for the final sample is the usual distribution of respondents per region when research is conducted for the Government of Canada. Within each region, data was monitored to ensure a 50/50 gender split and that no specific age cohort was under-represented.
Figure 2: Regional Quotas for General Population Interviews
A table illustrates the proportion of regional quotas in ten provinces or territories on the distribution of general population interviews
The table lists the percentage of the general population interviews in ten provinces or territories. The column headers read province or territory and approximate distribution of general population interviews. The data as inferred from the table is as follows: 1, Newfoundland and Labrador, 4 percent; 2, Prince Edward Island, 3 percent; 3, New Brunswick, 4 percent; 4, Nova Scotia, 3 percent; 5, Quebec, 19 percent; 6, Ontario, 30 percent; 7, Manitoba/Nunavut, 7 percent; 8, Saskatchewan, 7 percent; 9, Alberta/NWT, 10 percent; and 10, British Columbia/Yukon, 13 percent. The last row in the table indicates the total distribution which is 100 percent.
| PROVINCE/TERRITORY | Approximate distribution of General Population interviews |
|---|---|
| Newfoundland and Labrador | 4% |
| Prince Edward Island | 3% |
| New Brunswick | 4% |
| Nova Scotia | 3% |
| Quebec | 19% |
| Ontario | 30% |
| Manitoba/Nunavut | 7% |
| Saskatchewan | 7% |
| Alberta/NWT | 10% |
| British Columbia/Yukon | 13% |
| TOTAL | 100% |
The margin of error of this sample size is +/− 2.7%, 19 times out of 20. The research findings can be extrapolated to the broader audience considering the margin of error associated with this sample size. The margins of error for the results in this study will vary based on a variety of factors. For instance, results for subgroups with smaller sample sizes will have a higher margin of error. As well, the margin of error is typically highest for questions where 50% of respondents answered one way and 50% answered another way. The margin of error typically decreases as the percent for a particular response approaches 0% or 100%.
The data was weighted by region and gender to ensure the final distributions within the final sample mirror those of the Canadian population according to the latest census data. In this report, all sample sizes/base sizes are unweighted numbers whereas all percentages pertaining to the General Population are weighted numbers.
The table below shows the weighting framework used for this study:
Figure 3: Weighting Framework
A table depicting the framework for weighting the survey data by gender and region
Description: The table showing the framework weighted for both the genders in 13 regions. It is presented in the order of region, gender, sample, population, sample proportion, and sample population. The data as inferred from the table is as follows: 1, Newfoundland, Male, 17 (sample), 207,385 (population), 1 percent (Sample proportion), 1 percent (sample population); 2, Newfoundland, Female, 30 (sample), 221,675 (population), 2 percent, 1 percent; 3, Prince Edward Island, Male, 19 (sample), 55,090 (population), 1 percent (Sample proportion), 0 percent (sample population); 4, Prince Edward Island, Female, 26 (sample), 59,990 (population), 2 percent (Sample proportion), 0 percent (sample population); 5, Nova Scotia, Male, 13 (sample), 363,195 (population), 1 percent (Sample proportion), 1 percent (sample population); 6, Nova Scotia, Female, 30 (sample), 396,555 (population), 2 percent (Sample proportion), 1 percent (sample population); 7, New Brunswick, Male, 31 (sample), 296,655 (population), 2 percent (Sample proportion), 1 percent (sample population); 8, New Brunswick, Female, 16 (sample), 315,715 (population), 1 percent (Sample proportion), 1 percent (sample population); 9, Quebec, Male, 120 (sample), 3,206,345 (population), 9 percent (Sample proportion), 11 percent (sample population); 10, Quebec, Female, 132 (sample), 3,374,530 (population), 10 percent (Sample proportion), 12 percent (sample population); 11, Ontario, Male, 177 (sample), 5,184,285 (population), 13 percent (Sample proportion), 18 percent (sample population); 12, Ontario, Female, 227 (sample), 5,582,440 (population), 17 percent (Sample proportion), 20 percent (sample population); 13, Manitoba, Male, 33 (sample), 480,760 (population), 2 percent (Sample proportion), 2 percent (sample population); 14, Manitoba, Female, 61 (sample), 504,355 (population), 5 percent (Sample proportion), 2 percent (sample population); 15, Saskatchewan, Male, 42 (sample), 414,510 (population), 3 percent (Sample proportion), 1 percent (sample population); 16, Saskatchewan, Female, 52 (sample), 427,355 (population), 4 percent (Sample proportion), 2 percent (sample population); 17, Alberta, Male, 65 (sample), 1,565,685 (population), 5 percent (Sample proportion), 6 percent (sample population); 18, Alberta, Female, 71 (sample), 1,578,320 (population), 5 percent (Sample proportion), 6 percent (sample population); 19, British Columbia, Male, 81 (sample), 1,845,345 (population), 6 percent (Sample proportion), 7 percent (sample population); 20, British Columbia, Female, 89 (sample), 1,960,230 (population), 7 percent (Sample proportion), 7 percent (sample population); 21, Yukon, Male, 5 (sample), 14,105 (population), 0.4 percent (Sample proportion), 0.05 percent (sample population); 22, Yukon, Female, 4 (sample), 14,340 (population), 0.3 percent (Sample proportion), 0.05 percent (sample population); 23, Northwest Territories, Male, 2 (sample), 15,975 (population), 0.1 percent (Sample proportion), 0.06 percent (sample population); 24, Northwest Territories, Female, 0 (sample), 15,295 (population), 0 percent (Sample proportion), 0.05 percent (sample population); 25, Nunavut, Male, 1 (sample), 11,470 (population), 0.1 percent (Sample proportion), 0.04 percent (sample population); and 26, Nunavut, Female, 0 (sample), 10,940 (population), 0 percent (Sample proportion), 0.04 percent (sample population). The last row in the table indicates the total value of sample, population, sample proportion, and sample population which are 1, 344 (sample); 28,122, 545 (population); 100 percent (Sample proportion), and 100 percent (sample population).
| Region | Gender | Sample | Population | Sample Proportion | Sample Population |
|---|---|---|---|---|---|
| Newfoundland | Male | 17 | 207,385 | 1% | 1% |
| Female | 30 | 221,675 | 2% | 1% | |
| Prince Edward Island | Male | 19 | 55,090 | 1% | 0% |
| Female | 26 | 59,990 | 2% | 0% | |
| Nova Scotia | Male | 13 | 363,195 | 1% | 1% |
| Female | 30 | 396,555 | 2% | 1% | |
| New Brunswick | Male | 31 | 296,655 | 2% | 1% |
| Female | 16 | 315,715 | 1% | 1% | |
| Quebec | Male | 120 | 3,206,345 | 9% | 11% |
| Female | 132 | 3,374,530 | 10% | 12% | |
| Ontario | Male | 177 | 5,184,285 | 13% | 18% |
| Female | 227 | 5,582,440 | 17% | 20% | |
| Manitoba | Male | 33 | 480,760 | 2% | 2% |
| Female | 61 | 504,355 | 5% | 2% | |
| Saskatchewan | Male | 42 | 414,510 | 3% | 1% |
| Female | 52 | 427,355 | 4% | 2% | |
| Alberta | Male | 65 | 1,565,685 | 5% | 6% |
| Female | 71 | 1,578,320 | 5% | 6% | |
| British Columbia | Male | 81 | 1,845,345 | 6% | 7% |
| Female | 89 | 1,960,230 | 7% | 7% | |
| Yukon | Male | 5 | 14,105 | 0.4% | 0.05% |
| Female | 4 | 14,340 | 0.3% | 0.05% | |
| Northwest Territories | Male | 2 | 15,975 | 0.1% | 0.06% |
| Female | 0 | 15,295 | 0% | 0.05% | |
| Nunavut | Male | 1 | 11,470 | 0.1% | 0.04% |
| Female | 0 | 10,940 | 0% | 0.04% | |
| TOTAL | 1,344 | 28,122,545 | 100% | 100% | |
Non-Response Bias – General Population Segment. Upon completion of this project a non-response analysis was conducted to assess the potential for non-response bias. Non-response is the result of a unit of the sample not participating in the survey—either refusing to take part in the survey (a refusal) or not being reached during the data collection period (non-contact). Non-response results in biases in the survey sample when there are differences between respondents and non-respondents.
To undertake the analysis for this survey, the unweighted sample distribution by gender was compared to the actual population (based on 2016 Census figures from Statistics Canada).
Contrary to most surveys of the general population, age was not factored into the quota structure, the weighting scheme or the analysis of non-response since the definition of “general population” for this study differs from what is typically seen. In this study, members of the general population represented the segment of Canadians who do not have a disability and since disability is related to age, including age in the quotas and weights would be misleading.
As the table below shows, the survey sample and the population distribution are very similar. The survey data was weighted to address whatever variations existed between genders. Weighting also corrected the sample design for the survey, which was regionally disproportionate. Weighting serves to reduce bias should it be present, but not to eliminate it completely.
Figure 4: Comparing Survey Sample with Population Distribution
A table comparing the survey sample against census population distribution
Description: the table shows the comparison of the survey sample population against the 2016 census population distribution. Survey Sample (unweighted), population (Census), and % difference (plus or minus) from the table is as follows: 1, Male, survey sample 44.90%, census population distribution, 49.11% difference, plus 4.21%.2, female, survey sample 54.70%, census population distribution 50.88%, difference, minus 3.82%.
| Survey Sample (Unweighted) | Population (Census 2016) | % diff (+/−) | |
|---|---|---|---|
| Male | 44.90% | 49.11% | 4.21% |
| Female | 54.70% | 50.88% | -3.82% |
Persons with Disabilities. A total of 2,456 surveys were completed with persons with disabilities at least 18 years of age, of which:
Six hundred and sixty-six (666) were completed by telephone. Nearly all surveys completed over the telephone (~650) were completed the same way as the General Population segment, in other words these interviews were completed via traditional wireline telephone numbers and a sub-quota of cell-phone only households. The remaining telephone interviews were completed with individuals who dialed into the toll-free number to schedule an interview.
Majority of the responses (1,788) were completed online, and,
Two responses were completed by respondents who submitted a hardcopy version of the questionnaire or completed and emailed an electronic version of the questionnaire.
A dual sample frame approach was used for this segment of the population. In addition to the RDD (random digit dialing/cell-phone) frame described above, study respondents were also contacted through departmental partnerships and stakeholder networks, including FALA. Hence, for the second frame, there is no information available allowing the research team to understand exactly how many partners were involved, how many outreach invitations were issued to potential survey respondents, how many potential survey respondents accessed the invitation or how many reminders were issued. These limitations impede our ability to calculate a response rate for this portion of the study.
Given the source for many of the contacts invited to participate in this study (departmental stakeholder and partner groups), it is very likely that the segment representing persons with disabilities may underrepresent certain types of individuals, such as individuals with low literacy and those with severe functional limitations. This segment may also be over-represented in terms of individuals who are engaged in disability or accessibility-related causes, who are vocal, who are well-informed and/or who are generally active.
Given the non-probability nature of the sampling approach for the segment focused on persons with disabilities, a margin of error cannot be calculated. As well, data for this segment were not weighted. As such, in this report, all sample sizes/base sizes and all percentages pertaining to persons with disabilities are unweighted numbers.
Response rate – General Population Segment. The portion of the study involving telephone surveys with members of the general population saw a response rate of 6.7% across the entire sample. The response rate was higher for Random Digit Dialing (9.3%) compared to calls made to cell phones (4.5%).
Figure 5: Dialing Disposition Report for the General Population Segment
The table presents the information about the dialing disposition report for the general population segment
Description: The table presents the information about the dialing disposition report for the general population segment. Total, RDD, and Cell for 21 factors from the table are listed as follows: 1, Total Numbers Attempted, 118535 (total), 33528 (Random Digit Dialing), 85007 (Cell); 2, Out-of-scope - Invalid, 77603 (total), 14248 (Random Digit Dialing), 63355 (Cell); 3, Unresolved (U), 16506 (total), 4863 (Random Digit Dialing), 11643 (Cell); 4, No answer/Answering machine, 16506 (total), 4863 (Random Digit Dialing), 11643 (Cell); 5, In-scope - Non-responding (IS), 3057 (total), 1366 (Random Digit Dialing), 1691 (Cell); 6, Language barrier, 541 (total), 310 (Random Digit Dialing), 231 (Cell); 7, Incapable of completing (ill/deceased), 255 (total), 186 (Random Digit Dialing), 69 (Cell); 8, Callback (Respondent not available), 2261 (total), 870 (Random Digit Dialing), 1391 (Cell); 9, Total Asked, 21369 (total), 13051 (Random Digit Dialing), 8318 (Cell); 10, Refusal, 18335 (total), 11096 (Random Digit Dialing), 7239 (Cell); 11, Termination, 282 (total), 171 (Random Digit Dialing), 111 (Cell); 12, In-scope - Responding units (R), 2752 (total), 1784 (Random Digit Dialing), 968 (Cell); 13, Completed Interview, 2016 (total), 1322 (Random Digit Dialing), 694 (Cell); 14, NO - Quota Full, 595 (total), 378 (Random Digit Dialing), 217 (Cell); 15, 31 (INT31) NOT WILLING TO TAKE PART, 43 (total), 43 (Random Digit Dialing), 0 (Cell); 16, 32 (INT32) (CELL) NOT WILLING TO TAKE PART, 60 (total), 20 (Random Digit Dialing), 40 (Cell); 17, 33 (INT33) NQ- AGE (LESS THAN 18), 19 (total), 5 (Random Digit Dialing), 14 (Cell); 18, 34 (INT34) DONT KNOW/REFUSED, 19 (total), 16 (Random Digit Dialing), 3 (Cell); 19, Refusal Rate, 87.12 (total), 86.33 (Random Digit Dialing), 88.36 (Cell); 20, Response Rate, 6.72 (total), 9.25 (Random Digit Dialing), 4.47 (Cell); and 21, Incidence, 73.26 (total), 74.26 (Random Digit Dialing), 71.69 (Cell).
| TOTAL | RDD | CELL | |
|---|---|---|---|
| Total Numbers Attempted | 118535 | 33528 | 85007 |
| Out-of-scope - Invalid | 77603 | 14248 | 63355 |
| Unresolved (U) | 16506 | 4863 | 11643 |
| No answer/Answering machine | 16506 | 4863 | 11643 |
| In-scope - Non-responding (IS) | 3057 | 1366 | 1691 |
| Language barrier | 541 | 310 | 231 |
| Incapable of completing (ill/deceased) | 255 | 186 | 69 |
| Callback (Respondent not available) | 2261 | 870 | 1391 |
| Total Asked | 21369 | 13051 | 8318 |
| Refusal | 18335 | 11096 | 7239 |
| Termination | 282 | 171 | 111 |
| In-scope - Responding units (R) | 2752 | 1784 | 968 |
| Completed Interview | 2016 | 1322 | 694 |
| NQ - Quota Full | 595 | 378 | 217 |
| 31 (INT31) NOT WILLING TO TAKE PART | 43 | 43 | 0 |
| 32 (INT32) (CELL) NOT WILLING TO TAKE PART | 60 | 20 | 40 |
| 33 (INT33) NQ- AGE (LESS THAN 18) | 19 | 5 | 14 |
| 34 (INT34) DONT KNOW/REFUSED | 19 | 16 | 3 |
| Refusal Rate | 87.12 | 86.33 | 88.36 |
| Response Rate | 6.72 | 9.25 | 4.47 |
| Incidence | 73.26 | 74.10 | 71.69 |
This study was conducted following the Standards for the Conduct of Government of Canada Public Opinion Research – Telephone Surveys, and, the Standards for the Conduct of Government of Canada Public Opinion Research – Online Surveys.
Detailed Results
Research Purpose and Objectives
The Accessible Canada Act came into force on July 11, 2019. ESDC wanted to gather data on Canadians’ opinions on, experience with, and awareness of accessibility and disability issues. This research will be used to measure and track outcomes of the Accessible Canada Act, and help shape future accessibility policies. Results may assist in measuring the Canadian public’s understanding and knowledge of accessibility and disability issues in Canada. It will also be part of the sources of data used to assess and measure indicators of accessibility for Canadians as a result of the implementation of the Accessible Canada Act, with the goal of becoming a Canada without barriers in 2040.
More specifically, the research assessed the attitudes, understanding and knowledge across six of the following seven priority areas identified in the legislation:
Employment;
Built environment;
Transportation;
Information and communication technologies (ICT);
Communication, other than ICT;
Design and delivery of programs and services; and
Procurement2.
ESDC commissioned Quorus to conduct public opinion research to gather information on the following specific areas:
Awareness / attitude of members of the general population (i.e. without a disability) in relation to barriers to accessibility for people with disabilities in priority areas;
Experiences from persons with disabilities related to barriers to accessibility encountered in priority areas;
Accessibility and disability definitions and issues;
Invisible and visible disabilities that are permanent, temporary or episodic in nature;
Current barriers and experiences of accessibility, particularly in six of the seven priority areas identified above; and,
The Accessible Canada Consultation and ongoing development of the proposed legislation.
Note to the reader:
Questions are marked with a “D” to indicate they were asked to the disability segment, and with “GP” if they were asked to the general population.
Respondent Profile
A variety of questions were asked to study participants to obtain information about their demographic and socio-economic profile. This information allowed the research team to not only understand their profile, but also to weigh (as needed) the data and ensure results are representative of the population. The incidence of individuals who refused to provide a specific type of information is not shown to simplify the presentation of results.
Figure 6: Respondent Profile
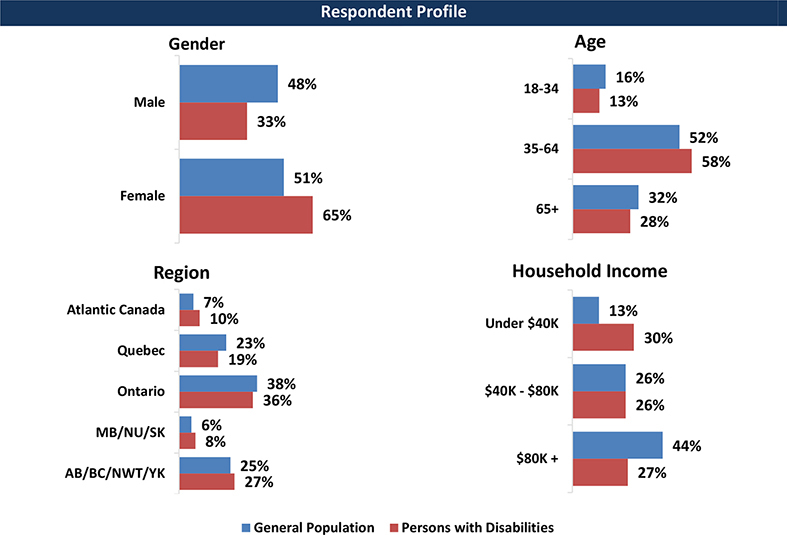
The summary of respondent profiles by gender, age, region, and household income
Description: Four horizontal bar graphs represent the profile of respondents by gender, age, region, and household income. Each graph shows a set of two bars for each category marked along the vertical axis and that represents the percentage of the general population (general population) and persons with disabilities (persons with disabilities). The first graph represents the profile of respondents by gender, and the data inferred from the graph in the above-mentioned order is as follows: Male - 48 percent (general population), 33 percent (persons with disabilities), and female - 51 percent (general population), 65 percent (persons with disabilities). The second graph represents the respondent profiles by age, and the data from the graph is as follows: 18 to 34 - 16 percent (general population), 13 percent (persons with disabilities); 35 to 64 - 52 percent (general population), 58 percent (persons with disabilities); and above 65 - 32 percent (general population), 28 percent (persons with disabilities). The third graph represents the profile of respondents by region, and which shows the following data: Atlantic Canada - 7 percent (general population), 10 percent (persons with disabilities); Quebec - 23 percent (general population), 19 percent (persons with disabilities); Ontario - 38 percent (general population), 36 percent (persons with disabilities); MB/NU/SK - 6 percent (general population), 8 percent (persons with disabilities); and AB/BC/NWT/YK - 25 percent (general population), 27 percent (persons with disabilities). The fourth graph represents the data of profiles by household income and that shows the following data: under 40 K dollars - 13 percent (general population), 30 percent (persons with disabilities), 40 k to 80 k dollars - 26 percent (general population), 26 percent (persons with disabilities), and above 80 k dollars - 44 percent (general population), 27 percent (persons with disabilities).
Awareness and Understanding of Disability
Survey participants without a disability were asked to rate their understanding of what a disability is, using a scale from 0 to 10, where 10 meant understanding the idea extremely well, and 0 meant not understanding it at all.
Over 7 in 10 respondents (72%) feel they have a very good understanding of what a disability is, rating their understanding from 8 to 10 on the 10-point scale.
In addition, 19% rated their understanding from 6 to 7, 6% rated it as 5 (mid-point), and 2% less than 5.
From a subgroup perspective the following differences were noted:
Respondents at least 65 years of age believe they have a better understanding of what a disability is compared to respondents 18 to 34 (76% vs. 66%).
Women also claim having a very good understanding of disabilities, compared to men (78% vs. 66%).
Respondents in Quebec are more likely to say they have a very good understanding of disabilities (78%), compared to those in Ontario (71%) or Manitoba, Saskatchewan and Nunavut (64%).
Respondents were less confident when asked to rate their own understanding of the types of barriers that Canadians with a disability may encounter. Using the same 10-point scale, nearly half of respondents (47%) feel they understand these barriers very well, giving scores from 8 to 10. A third (33%) gave a score of 6 or 7, while 11% rated themselves with a 5 (mid-point), and 7% with 4 or less.
Subgroup differences found include:
The older respondents are, the higher they rate their understanding of barriers for people with a disability.
Women also are more likely than men to rate their understanding very highly (50% vs. 43%).
Regionally, respondents in Quebec and Ontario are the most likely among all regions to rate their understanding of barriers as very high, with scores from 8 to 10 (52% and 51% respectively).
Figure 7: General Population – Understanding of Barriers
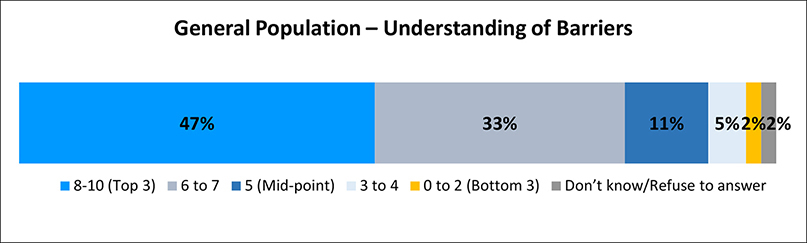
The understanding of barriers among the general population of Canada with disabilities is illustrated
The chart presents the person’s understanding of the type of barriers. The data inferred is as follows: 47 percent of people understand the barrier with the score from 8 to 10 (top 3); 33 percent of people understand the barriers with the score from 6 to 7; 11 percent of people understand the barriers with the score 5 (midpoint); 5 percent of people understand the barriers with the score from 3 to 4; 2 percent of people understand the barriers with the score from 0 to 2, and the rest 2 percentage of people don’t know or refuse to answer.
Types of Barriers Canadians with a Disability May Encounter – Examples from Persons without Disabilities
Survey participants with a minimum understanding3 of the types of barriers that Canadians with a disability may encounter were asked to describe what the top-three barriers could be for this segment of the population. Participants were not provided any list from which they could choose – the question was open-ended, and results are as follows:
Over 3 in 5 respondents (62%) mentioned a type of physical barrier including access to buildings, access to services, wheelchair access, washrooms or public washrooms, or other type of barrier.
Nearly 2 in 5 (38%) mentioned mobility-related barriers related to public transportation or other type of transportation in general.
Roughly one quarter (26%) think Canadians with disabilities face social barriers such as ableism and discrimination, 24% think Canadians with disabilities face financial barriers, including employment opportunities, housing and cost of living; and 23% think they face communication barriers, such as vision and blindness, hearing and deafness, or other type of communication barrier.
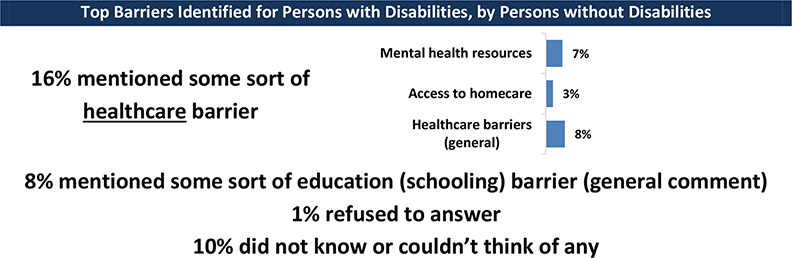
To a lesser extent, 16% of respondents think other barriers are related to mental health, including access to general mental health resources and access to homecare.
Roughly 1 in 10 feel Canadians with disabilities face educational barriers for schooling, and an additional 10% do not know what barriers these Canadians could face.
These results are not intended to be an exhaustive list of all the barriers faced by persons with disabilities – rather, respondents were asked to list what they considered to be the top-3 barriers faced.
Figure 8: Top Barriers Identified for Persons with Disabilities, by Persons without Disabilities
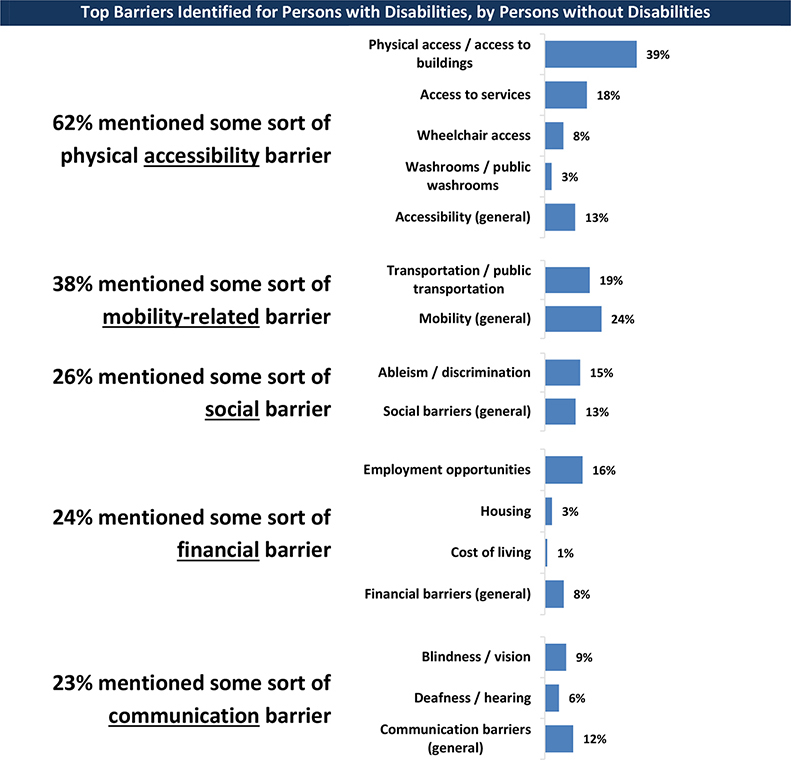
A survey result depicts the list of top barriers for disabled persons, by persons without disabilities
Description: In the survey result, the top barriers for persons with disabilities, by persons without disabilities are listed. The barriers are surveyed as per the list of categories, physical accessibility barrier, mobility-related barrier, social barrier, financial barrier, and communication barrier. The data inferred from this survey are as follows: 62 percent of persons without disabilities mentioned some sort of physical accessibility barriers. The different physical accessibility barriers are as follows : physical access or access to buildings - 39 percent, access to services - 18 percent, wheelchair access - 8 percent, washrooms or public washrooms - 3 percent, and accessibility (general) - 13 percent. 38 percent mentioned some sort of mobility-related barrier that includes transportation or public transportation - 19 percent and mobility (general) - 24 percent. 26 percent mentioned some sort of social barrier that includes ableism or discrimination - 15 percent and social barriers (general) - 13 percent. 24 percent mentioned some sort of financial barrier that includes employment opportunities - 6 percent, housing - 3 percent, cost of living - 1 percent, and financial barriers (general) - 8 percent. 23 percent mentioned some sort of communication barrier that includes blindness or vision - 9 percent, deafness or hearing - 6 percent, and communication barriers (general) - 12 percent.
Figure 9: Top Barriers Identified for Persons with Disabilities, by Persons without Disabilities (Continued)
The continuation of the survey result lists the top barriers for persons with disabilities
Description: The survey results on healthcare barriers shows 16 percent of persons without disabilities mentioned some sort of healthcare barriers that includes mental health resources - 7 percent, access to homecare - 3 percent, and healthcare barriers (general) - 8 percent. Another 8 percent of persons mentioned some sort of education (schooling) barrier (general comment), 1 percent refused to answer, and 10 percent did not know or couldn’t think of any.
From a subgroup perspective, the following differences were noted:
Respondents under 65 years are more likely to mention Canadians with disabilities face communication barriers, compared to older respondents.
Women are more likely than men to perceive Canadians with disabilities face physical accessibility barriers.
Regionally, Quebec respondents are the most likely among all provinces and territories to say Canadians with a disability face physical and general mobility barriers, the top-2 barriers identified overall.
Respondents in Ontario also identify these two barriers for the disability segment, as well as healthcare.
Those in Manitoba, Saskatchewan and Nunavut are more likely to mention general mobility barriers, while those in Alberta are more likely than respondents in many other regions to not identify financial and healthcare barriers.
Respondents in British Columbia are more likely to mention general mobility and healthcare barriers, while those in Atlantic Canada are also more likely to identify healthcare as a barrier.
Types of Barriers Encountered – Examples from Persons with Disabilities
After the survey section asking participants their experience with different types of specific barriers, they were asked to describe a few examples of the type of barriers that they had experienced in the last year. This was an open-ended question, giving respondents the opportunity to specify where and how these experiences happened.
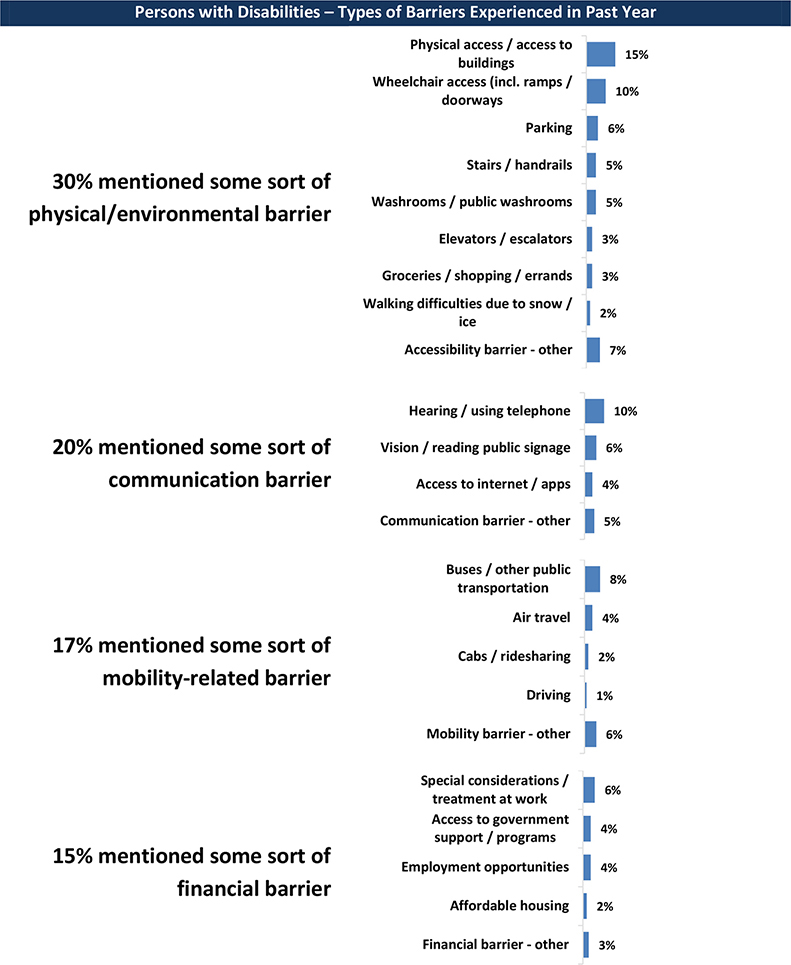
Among the examples provided by respondents, common barriers that have been experienced include day-to-day physical barriers (30%) including access to buildings, wheelchair access, parking, stairs and handrails, washrooms/public washrooms, elevators or escalators, ability to do groceries, shopping or errands, walking difficulties due to snow or ice, among other barriers.
One fifth of respondents (20%) also say they have experienced communication barriers, including using the phone due to a hearing disability, reading public signage due to sight disability, access to the internet or apps, among other communication barriers.
Roughly another fifth (17%) say they have experienced transportation related mobility barriers such as using buses or other public transportation, air travel, cabs or ridesharing, or driving.
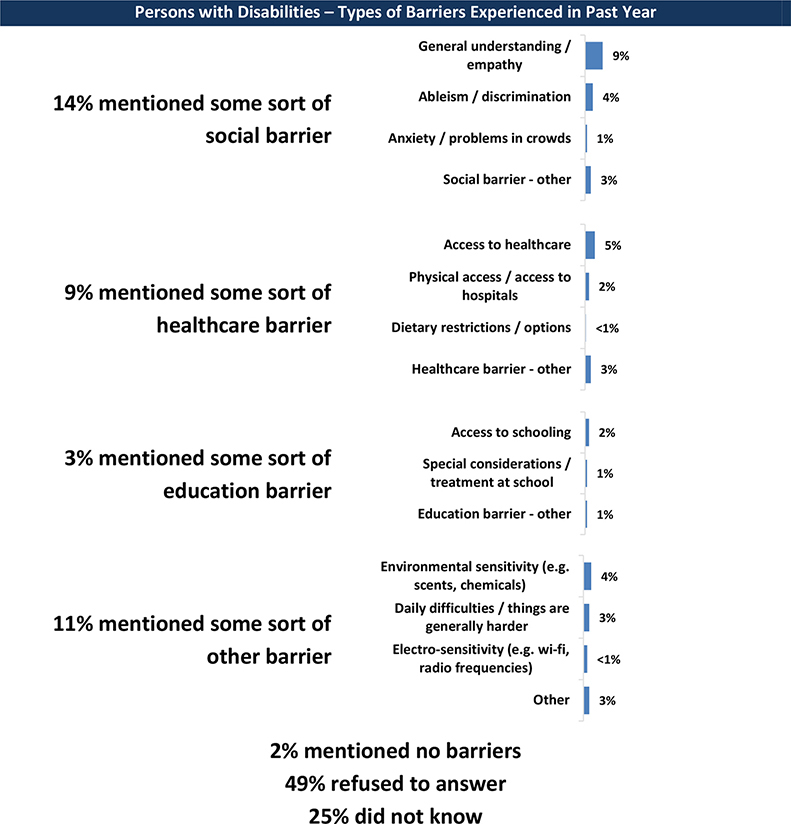
Over a tenth say they have experienced financial barriers (15%) and social barriers (14%) such as special considerations or treatment at work, access to government support or programs, employment opportunities, affordable housing, general understanding and empathy, ableism and discrimination, or anxiety or problems in crowds.
Less than 1 in 10 respondents say they also have experienced healthcare barriers (9%), education (3%), or other types of barriers including access to healthcare, physical access to hospitals, options for dietary restrictions, access to schooling, special considerations or treatment at school, environmental sensitivities (to scents, chemicals, etc.), electro-sensitivity (to Wi-Fi, radio frequencies, etc.), or simply the barrier of dealing with their disability in daily life.
Figure 10: Persons with Disabilities – Types of Barriers Experienced in Past Year
A figure listing barriers experienced by persons with disabilities in the past year
Description: The chart depicts the types of barriers experienced by persons with disabilities in the past year, and which shows the following information: 30 percent of persons with disabilities mentioned some sort of physical or environmental barrier. These barriers are as follows: physical access or access to buildings - 15 percent, wheelchair access (including ramps or doorways) - 10 percent, parking - 6 percent, stairs or handrails - 5 percent, washrooms or public washrooms - 5 percent, elevators or escalators - 3 percent, groceries or shopping or errands - 3 percent, walking difficulties due to snow or ice - 2 percent, and other accessibility barrier - 7 percent. 20 percent of persons with disabilities mentioned some sort of communication barrier. These barriers are as follows: hearing or using telephone - 10 percent, vision or reading public signage - 6 percent, access to internet or applications - 4 percent, and other communication barriers - 5 percent. 17 percent of persons with disabilities mentioned some sort of mobility-related barrier. These barriers are as follows: buses or other public transportation - 8 percent, air travel - 4 percent, cabs or ridesharing - 2 percent, driving - 1 percent, and other mobility barriers - 6 percent. 15 percent of persons with disabilities mentioned some sort of financial barrier. These barriers are as follows: special considerations or treatment at work - 6 percent, access to government support or programs - 4 percent, employment opportunities - 4 percent, affordable housing - 2 percent, and other financial barriers - 3 percent.
Figure 11: Persons with Disabilities - Types of Barriers Experienced in Past Year (Continued)
The continuation of the types of barriers experienced by persons with disabilities in the past year
Description: The chart summarizing the types of barriers experienced by persons with disabilities in the past year shows the following information: 14 percent of persons with disabilities mentioned some sort of social barrier. These barriers are as follows: general understanding or empathy - 9 percent, ableism or discrimination - 4 percent, anxiety or problems in crowds - 1 percent, and other social barriers - 3 percent. 9 percent of persons with disabilities mentioned some sort of healthcare barrier. These barriers are as follows: access to healthcare - 5 percent, physical access or access to hospitals - 2 percent, dietary restrictions or options - less than 1 percent, and other healthcare barriers - 3 percent. 3 percent of persons with disabilities mentioned some sort of education barrier. These barriers are as follows: access to schooling - 2 percent, special considerations or treatment at school - 1 percent, and other education barriers - 1 percent. 11 percent of persons with disabilities mentioned some sort of other barriers that include: environmental sensitivity (examples: scents, chemicals) - 4 percent, daily difficulties or things are generally harder - 3 percent, electro-sensitivity (examples: wi-fi, radio frequencies) - less than 1 percent, and other - 3 percent. 2 percent of persons with disabilities mentioned no barriers, 49 percent refused to answer, and 25 percent did not know.
In terms of subgroup differences, the following are noted:
When asked to provide examples of barriers they have encountered, the younger respondents are the more inclined they are to present financial (18% of respondents under 65 years old vs. 5% of respondents at least 65), social (18% of respondents 18 to 34, 15% among those 35 to 64, and 10% among those 65 or older) and educational barriers (6% of respondents 18 to 34, 3% among those 35 to 64, and 1% among those 65 or older) compared to older respondents. The latter are more likely to highlight mobility impairments compared to their younger counterparts (18% among respondents 65 or older, 17% among those 35 to 64, and 12% among respondents 18 to 34 years old).
Women are more likely than men to describe social (15% vs. 11%) and healthcare barriers (10% vs. 6%).
Regionally, Nova Scotians are more likely than residents in other regions to describe financial barriers (20%), while Manitobans are more likely to talk about communication (33%) and social barriers (18%), and British Columbians are more likely to highlight accessibility (43%) and mobility (21%) barriers. Healthcare barriers are least mentioned in Manitoba (5%), compared to other provinces and territories.
Awareness of Specific Barriers among Individuals without Disabilities
Attitude Barriers
Respondents were specifically asked if they were aware of attitude barriers based on the following definition:
Sometimes people with disabilities are treated badly or differently because of ideas and beliefs – or attitudes – that other people have about disability. This is called an ‘attitude barrier.’
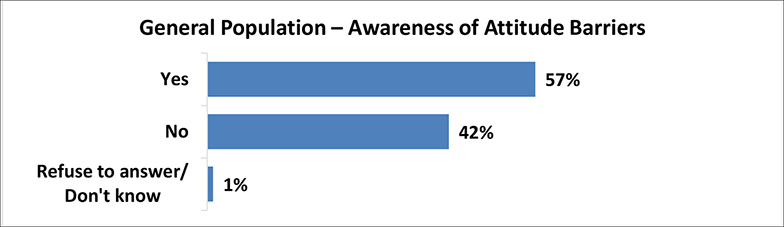
As seen in the previous section, unprompted, roughly 26% of respondents seemed to recognize “social barriers” as part of their top-3 set of barriers faced by persons with disabilities. When specifically prompted, over half of survey participants (57%) say they are aware of “attitude barriers.”
No significant differences are observed at a regional level, however, other significant differences include:
Respondents at least 65 years or older are more likely to be aware of this barrier, compared to those under 35 (59% vs. 56%).
Women are also more aware than men (63% vs. 51%).
Figure 12: General Population – Awareness of Attitude Barriers
General population awareness of attitude barriers
Description: The horizontal bar graph depicts the survey results on the awareness of attitude barriers among the general population. The data from the graph are as follows: The percentage of respondents answered Yes are 57, the percentage of respondents answered No is 42, and the percentage of respondents refused to answer or don’t know is 1%.
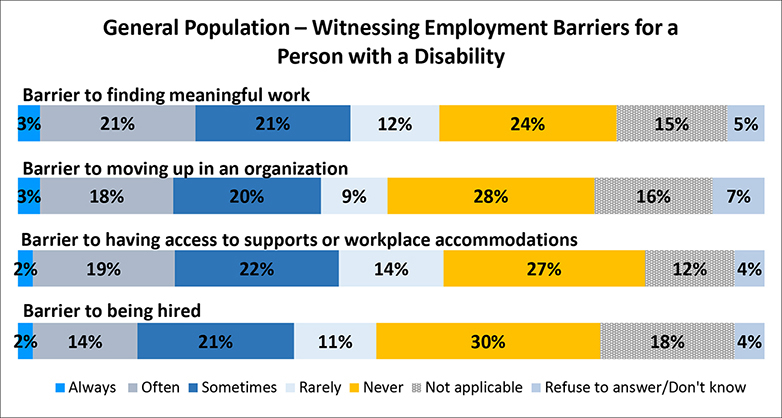
Employment Barriers
Survey respondents were asked how often they had witnessed situations related to employment barriers due to a lack of accessibility. Barriers to employment could be interview processes that do not accommodate different disabilities (i.e. vision impairment, deafness, learning disabilities etc.), or there are no accommodations or inadequate accommodations provided to people with disabilities at work (i.e. screen readers, sign language interpretation) or people with disabilities aren’t able to get jobs that match their skills due to attitude barriers.
Roughly one in five respondents always or often witnessed a barrier to finding meaningful work for a person with a disability (23%), to moving up in an organization (21%), to having access to supports or workplace accommodation (21%), or to being hired (16%).
Notable significant differences include:
Compared to respondents 18 to 34 years old, respondents at least 65 years old are more likely to say they have witnessed these types of barriers.
Respondents in Manitoba, Saskatchewan and Nunavut are more likely than those in Ontario or Alberta to say they have witnessed a barrier to finding meaningful work or to moving up in an organization for a person with a disability.
Figure 13: General Population – Witnessing Employment Barriers for a Person with a Disability
Employment barriers for a person with a disability witnessed by general population
Description: In the survey, the following are the different employment barriers witnessed for a person with a disability: 1. Barrier to find meaningful work: 3 percent of people witness it always, 21 percent witness it often, 21 percent witness it sometimes, 12 percent witness it rarely, 24 percent of people never witness it, 15 percent not applicable, 5 percent of people refused to answer or don’t know. 2. Barrier to moving up in an organization: 3 percent of people witness it always, 18 percent witness it often, 20 percent witness it sometimes, 9 percent witness it rarely, 28 percent of people never witness it, 16 percent not applicable, 7 percent of people refused to answer or don’t know. 3. Barrier to having access to supports or workplace accommodations: 2 percent of people witness it always, 19 percent witness it often; 22 percent witness it sometimes, 14 percent witness it rarely, 27 percent of people never witness it, 12 percent not applicable, 4 percent of people refused to answer or don’t know. 4. Barrier to being hired: 2 percent of people witness it always, 14 percent witness it often, 21 percent witness it sometimes, 11 percent witness it rarely, 30 percent of people never witness it, 18 percent not applicable; 4 percent of people refused to answer or don’t know.
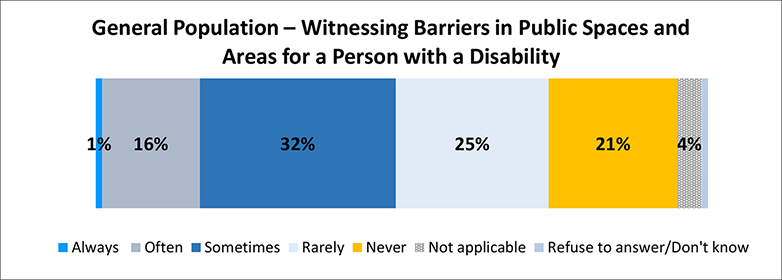
Barriers Related to the Built Environment
Examples of barriers related to the built environment are often perceived as physical barriers and the need for ramps, elevators, and accessible washrooms. However, all disabilities need to be considered when looking at the accessibility of buildings and public spaces. This broader recognition of how persons with varying impairments or limitations interact with their built surroundings is key to the concept of “universal design”.
In terms of barriers that limited someone’s ability to move in and around public buildings and spaces, 17% of respondents say they witness these types of barriers either always or often. Women are more likely than men to say they witness these types of barriers (21% vs. 12%).
Figure 14: General Population – Witnessing Barriers in Public Spaces and Areas for a Person with a Disability
A figure depicts results among the general population who witness barriers in public spaces and areas for persons with a disability
Description: The chart depicts the percentage of general population who witness barriers experienced by persons with a disability in public spaces and areas. The data inferred from the chart is as follows: 1 percent of people always witness this issue, 16 percent of people often witness this issue, 32 percent of people sometimes witness this issue, 25 percent of people rarely witness this issue, 21 percent of people never witness this issue, 4 percent not applicable and the rest of the people refused to answer or don’t know about the issue.
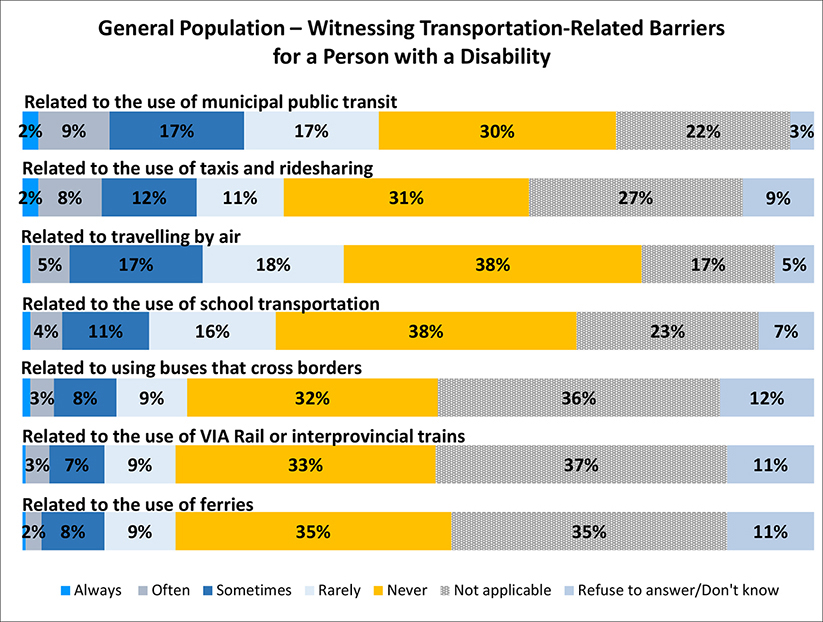
Transportation-Related Barriers
Transportation-related barriers were also explored with respondents. The Government of Canada regulates travel by airplane, rail and some bus and ferry services between provinces and territories and internationally. Most other travel within a city or a province, whether by bus, streetcar or train, is the responsibility of other levels of government.
Barriers to transportation could be a lack of accessible seating, additional space/seating for support persons or service animals, or visual and audio indicators of stops. For many of the specific types of barriers explored, important proportions of respondents could not provide an assessment since they don’t use the types or modes of transportation in question (for these cases, respondents had the choice to select not applicable).
Roughly one in ten respondents say they always or often witness a barrier for a person with a disability related to:
The use of municipal public transit (11%),
The use of taxis and ridesharing, such as Uber or Lyft (10%),
Traveling by air, for example, at the airport, airplane, terminal, facilities, equipment, communication, or services (6%),
Using school transportation (5%),
Using buses in federal jurisdictions to cross borders, for example, between provinces and territories at the bus stations, on the bus, equipment, communication, or services (4%),
Using VIA Rail or Interprovincial trains, for example, at the train station, the train, or equipment, communication or services (3%), or
Using a ferry (2%).
Subgroup differences were sparse. Men are more likely than women to say they rarely or never have witnessed many of these transportation-related barriers.
Figure 15: General Population – Witnessing Transportation-Related Barriers for a Person with a Disability
A figure depicts general Population – Witnessing Transportation-Related Barriers for a Person with a Disability
Description: The horizontal stacked bar graph presents the experience with the barriers to transportation by persons with disabilities, as witnessed by the general population. The data inferred is shown for seven categories. 1. Barrier related to the use of municipal public transit: 2 percent of people witness it always, 9 percent witness it often, 17 percent witness it sometimes, 17 percent witness it rarely, 30 percent never witness it, 22 percent not applicable, 3 percent of people refused to answer or don’t know. 2. Barrier related to the use of taxis and ridesharing: 2 percent of people witness it always, 8 percent witness it often, 12 percent witness it sometimes, 11 percent witness it rarely, 31 percent never witness it; 27 percent not applicable, 9 percent of people refused to answer or don’t know. 3. Barrier related to travelling by air: 5 percent of people witness it often, 17 percent witness it sometimes, 18 percent witness it rarely, 38 percent never witness it; 17 percent not applicable, 5 percent of people refused to answer or don’t know. The percent for people who always witnessed is not available. 4. Barriers related to the use of school transportation: 4 percent of people witness it often, 11 percent witness it sometimes, 16 percent witness it rarely, 38 percent never witness it; 23 percent not applicable, 7 percent of people refused to answer or don’t know. The percentage of people who always witnessed is not available. 5. Barriers related to using buses that cross borders: 3 percent of people witness it often, 8 percent witness it sometimes, 9 percent witness it rarely, 32 percent never witness it; 36 percent not applicable, 12 percent of people refused to answer or don’t know. The percentage of people who always witnessed is not available. 6. Barrier related to the use of VIA Rail or interprovincial trains: 3 percent of people witness it often, 7 percent witness it sometimes, 9 percent witness it rarely, 33 percent never witness it; 37 percent not applicable, 11 percent of people refused to answer or don’t know. The percentage of people who always witness it is not available. 7. Barrier related to the use of ferries: 2 percent of people witness it often, 8 percent witness it sometimes, 9 percent witness it rarely, 35 percent never witness it; 35 percent not applicable, 11 percent of people refused to answer or don’t know. The percentage of people who always witness it is not available.
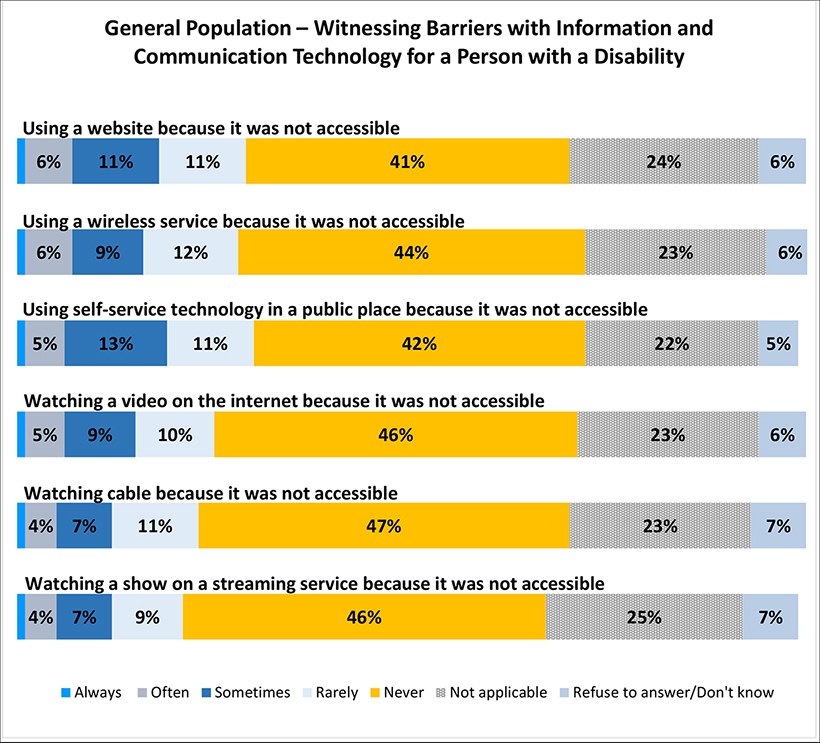
Information and Communication Technology (ICT)-Related Barriers
Six barriers related to the use of information and communication technology (ICT) were then explored. Barriers to ICTs could be information on a website that is difficult or impossible to access or use, read or understand either due to technology or the way the information is presented. Other examples of barriers are mobile handsets that can’t be accessed by people with dexterity or physical disabilities, or wireless plans that don’t take into consideration that people who are deaf primarily communicate by video.
Results reveal that fewer than one in ten respondents say they always or often witness someone with a disability facing a barrier with each of the types of technologies explored in this study, because these were not accessible to someone they know due to a disability. More specifically, respondents witnessed barriers to:
Using a website or wireless service (7% respectively),
Using self-service technology in a public place (6%),
Watching a video on the internet, for example on YouTube, Facebook, other social media or websites (6%),
Watching cable (5%), or
Watching a show on a streaming service such as Netflix, AppleTV, Crave, Amazon Prime (5%).
At least 2 in 5 respondents say they have never witnessed these situations.
Respondents in Ontario, British Columbia, Manitoba, Saskatchewan and Nunavut are the most likely to have witnessed these situations, compared to those in other regions.
Figure 16: General Population – Witnessing Barriers with Information and Communication Technology for a Person with a Disability
A figure depicts General population survey participants list various barriers with information and communication technology witnessed for a person with a disability
Description: The following are the different barriers with information and communication technology witnessed by the general population for persons with disabilities. 1. Using a website because it was not accessible: 6 percent of people witness it often, 11 percent witness it sometimes, 11 percent witness it rarely, 41 percent of people never witness it, 24 percent not applicable, 6 percent of people refused to answer or don’t know. The rest of the percentage of people (percentage value not mentioned) witness it always. 2. Using a wireless service because it was not accessible: 6 percent witness it often, 9 percent witness it sometimes, 12 percent witness it rarely, 44 percent of people never witness it, 23 percent not applicable, 6 percent of people refused to answer or don’t know. The rest of the percentage of people (percentage value not mentioned) witness it always. 3. Using self-service technology in a public place because it was not accessible: 5 percent witness it often, 13 percent witness it sometimes, 11 percent witness it rarely, 42 percent of people never witness it, 22 percent not applicable, 5 percent of people refused to answer or don’t know. The rest of the percentage of people (percentage value not mentioned) witness it always. 4. Watching a video on the internet because it was not accessible: 5 percent witness it often, 9 percent witness it sometimes, 10 percent witness it rarely, 46 percent of people never witness it, 23 percent not applicable, 6 percent of people refused to answer or don’t know. The rest of the percentage of people (percentage value not mentioned) witness it always. 5. Watching cable because it was not accessible: 4 percent witness it often, 7 percent witness it sometimes, 11 percent witness it rarely, 47 percent of people never witness it, 23 percent not applicable, 7 percent of people refused to answer or don’t know. The rest of the percentage of people (percentage value not mentioned) witness it always. 6. Watching a show on a streaming service because it was not accessible: 4 percent witness it often, 7 percent witness it sometimes, 9 percent witness it rarely, 46 percent of people never witness it, 25 percent not applicable, 7 percent of people refused to answer or don’t know. The rest of the percentage of people (percentage value not mentioned) witness it always.
Barriers Related to Program and Service Delivery
Few respondents say they always or often witness barriers when it comes to government or private sector program and/or service delivery. Barriers to program and service delivery could be negative attitudes or beliefs about what a person with a disability can or cannot do; a lack of training for service providers to be able to provide services to people in their preferred method of communication; or not having materials in accessible formations (i.e. braille, large print).
This study shows that 7% always or often witness a barrier for a person with a disability that impacts the accessibility of a program or service provided by a company or organization, and 6% always or often witness a barrier that impacts the accessibility of a government program or service.
Women are more likely than men to witness these situations at this frequency (8% vs. 5%). No specific regions seem to experience these situations more than others.
Figure 17: General Population – Witnessing Barriers to Program and Service Delivery for a Person with a Disability
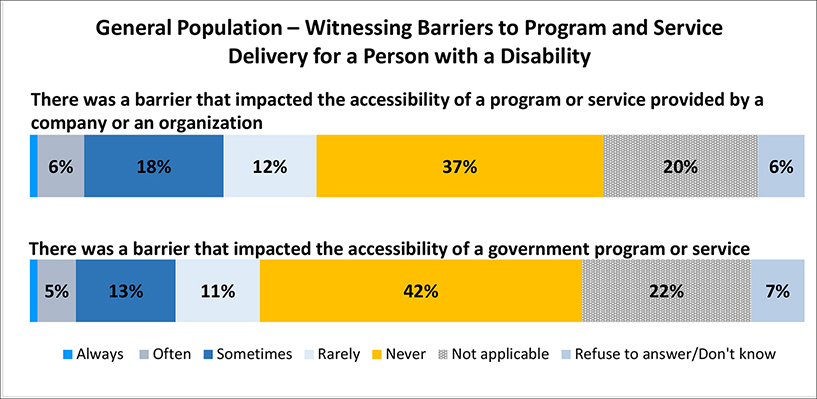
A figure depicts general population – Witnessing Barriers to Program and Service Delivery for a Person with a Disability
Description: A horizontal stacked bar graph presents the survey results for the two barriers witnessed by the general population. First barrier: “There was a barrier that impacted the accessibility of a program or service provided by a company or an organization.” People who witnessed it always - 6 percent, who witnessed often - 18 percent, who witnessed sometimes - 12 percent, who never witnessed - 37 percent, not applicable - 20 percent, and who refused to answer or don’t know - 6 percent. Second barrier: “There was a barrier that impacted the accessibility of a government program or service.” People who witnessed it always - 5 percent, who witnessed often - 13 percent, who witnessed sometimes - 11 percent, who never witnessed - 42 percent, not applicable - 22 percent, and who refused to answer or don’t know - 7 percent.
Disability Types
When respondents were asked if they identified themselves as a person with a disability, 74% agreed. This section of the questionnaire related to disability types modeled the 2017 Disability Screening Questions4 from the Canadian Survey on Disability developed by Statistics Canada in collaboration with the Office for Disability Issues. The Canadian Survey on Disability has 11 disability types that fall under five categories of disability, to which ESDC added three more. Categories of disability are groupings of disability types that are conceptually related. For example, mobility, flexibility, dexterity, and pain are types of disabilities that fall under the physical category of disability. All survey participants were asked to indicate if they had any of the 14 different disabilities listed such as: mobility, pain, flexibility, dexterity, mental health-related, memory, seeing, hearing, learning, communication, speech, developmental, language, or any other type of disability.
The incidence of a given disability was determined in two different ways:
The unadjusted incidence considers the proportion of individuals who answer “yes” when asked if they had a given disability.
These individuals were then asked up to two additional questions to determine the overall “adjusted incidence” of a given disability:
They were first asked to also specify how often they felt limited in terms of being included in society because of this disability. Those who responded always, often or sometimes were included in the calculation of the adjusted incidence.
Those who responded rarely or never were then asked the level of difficulty they had with that disability and all those who said they had at least some difficulty were included in the calculation of the adjusted incidence.
Participants who met the criteria for the adjusted incidence for at least one type of disability were part of the disability segment5.
The following section shows the results for these questions for each disability, followed by a graphic based on the respondents who were eventually categorized for that particular disability (adjusted incidence for the disability).
Mobility Disability
Over half (55%) of all survey participants with a disability say they have or have had a mobility disability. This was described as a physical disability that affects a person’s ability to move. Over 4 in 5 of these respondents (83%) say this disability always, often or sometimes limits their inclusion in society. Among those who say this happens rarely or never, 90% say they have at least some difficulty moving.
Figure 18: Persons with Disabilities – Mobility (Unadjusted Incidence): Have This Type of Disability
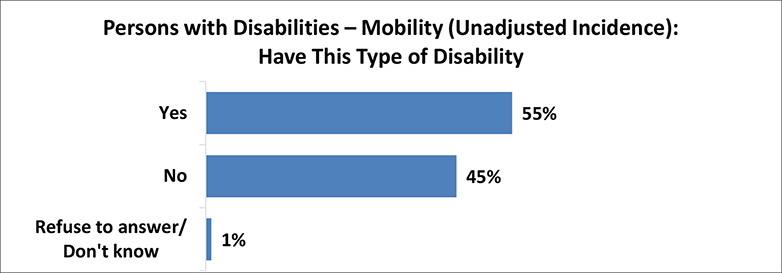
A figure depicts surve results of persons with Disabilities – Mobility (Unadjusted Incidence):
Description: The horizontal bar graph depicts the survey results among the person with disabilities having a mobility (unadjusted incidence) disability. The rate of people who answered Yes - 55 percent, No - 45 percent, and Refused to answer or don’t know - 1 percent.
Figure 19: Persons with Disabilities – Mobility: Frequency of Environment Limiting Inclusion in Society
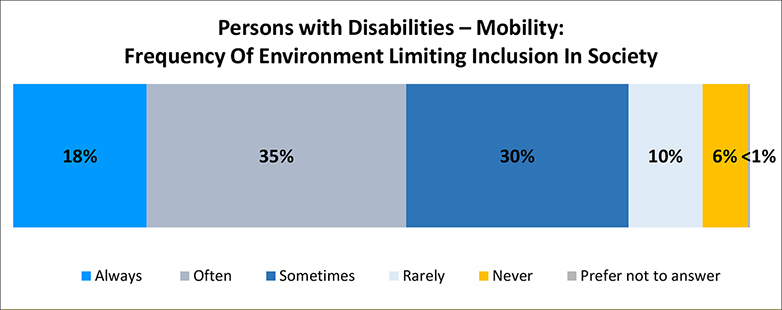
A figure depicts the percentage persons with mobility disabilities feel limited inclusion in society due to the world around them
Description: The chart depicts the percentage of disabled persons who feel they are not included in society due to their mobility disabilities. The data inferred from the chart is as follows: 18 percent of persons always face this issue, 35 percent of persons often face this issue, 30 percent of persons face this issue sometimes, 10 percent of persons rarely face this issue, 6 percent of persons have never faced this issue, and less than 1 percent of persons prefer not to say.
Figure 20: Persons with Disabilities – Mobility: Difficulty with Disability
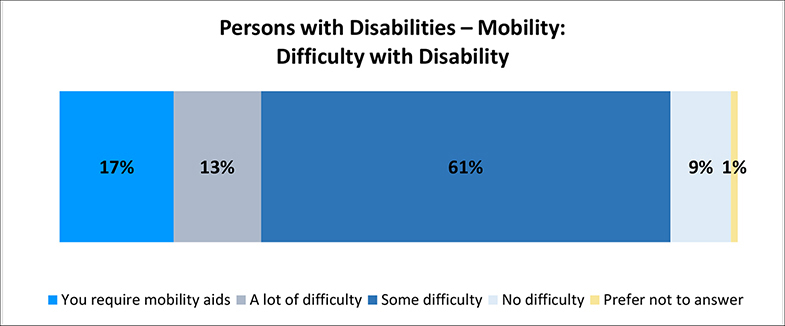
A figure depicts the level of difficulty a person with a mobility disability has with their disability
Description: The chart depicts the percentage of persons who face difficulty with a mobility disability. The data inferred from the chart is as follows: 17 percent of persons require mobility aids, 13 percent of persons face a lot of difficulties, 61 percent of person fins some difficulty, 9 percent of people face no difficulty, and 1 percent of persons prefer not to answer.
Once the incidence is adjusted for this disability, 53% participants have this disability. The older respondents are, the more they seem to say they have mobility impairments, and the lower the income, the more respondents say they have a mobility disability. British Columbia and Nova Scotia have the highest proportion of respondents with this disability.
Figure 21: Persons with Disabilities – Mobility (Adjusted Incidence): Have This Type of Disability
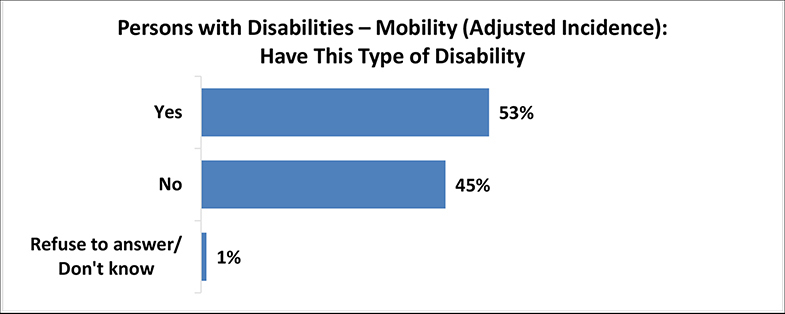
A figure depicts the percentage of persons with mobility disabilities with unadjusted incidence
Description: The horizontal bar graph depicts the survey results for people with a mobility disability (adjusted incidence). The data inferred is as follows: Persons who answered yes - 53 percent, persons who answered no - 45 percent, and persons who refuse to answer or don’t know - 1 percent.
Pain Disability
Over half (53%) of survey participants with a disability say they suffer from pain. This disability was described as a chronic pain disorder that affects a person’s ability to function due to pain. Four in five of these respondents (80%) say this disability always, often or sometimes limits their inclusion in society. Among those who say this happens rarely or never, 94% say they have at least some difficulty with pain.
Figure 22: Persons with Disabilities – Pain (Unadjusted Incidence): Have This Type of Disability
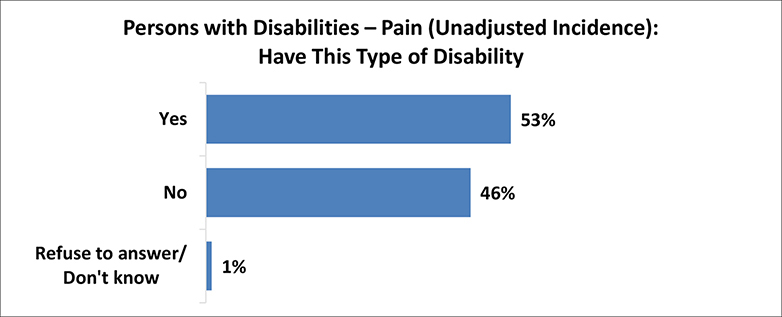
A figure depicts the percentage of persons with pain disabilities with adjusted incidence
Description: The horizontal bar graph represents the percentage of persons having pain disability with unadjusted incidence. The data inferred is as follows: Persons who answered yes - 53 percent, persons who answered no - 46 percent, and persons who refuse to answer or don’t know - 1 percent.
Figure 23: Persons with Disabilities – Pain: Frequency of Environment Limiting Inclusion in Society
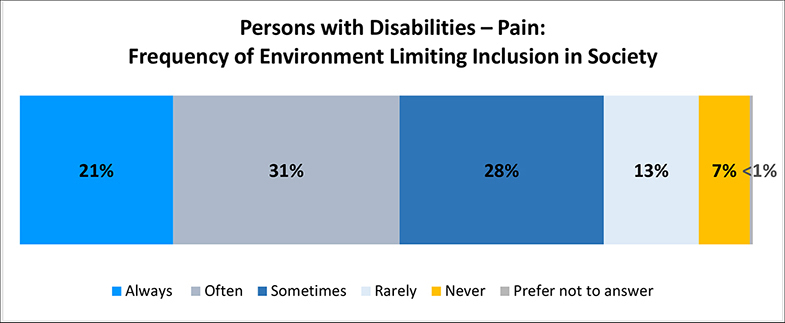
A figure depicts the percentage persons with pain disabilities feel limited in their inclusion in society due to the world around them
Description: The chart depicts the percentage of respondents with pain disabilities who feel they are not included in society due to the world around them. The data inferred from the chart is as follows: 21 percent of respondents always feel this way, 31 percent of respondents often feel this way, 28 percent of respondents sometimes feel this way, 13 percent of respondents rarely feel this way, 7 percent of respondents never feel this way, and less than 1 percent of respondents prefer not to say.
Figure 24: Persons with Disabilities – Pain: Difficulty with Disability
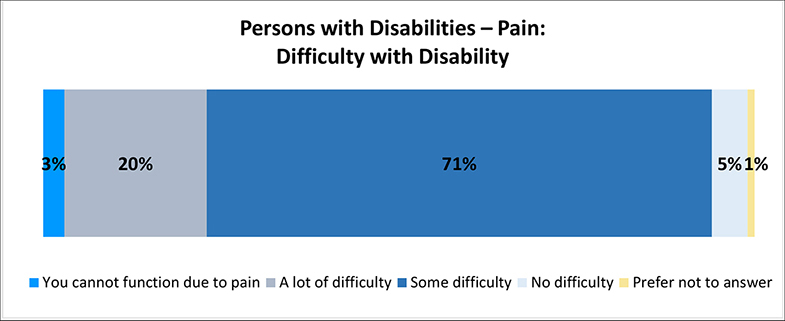
A figure depicts the percentage of difficulty a person with pain disability has with their disability
The horizontal chart depicts the percentage of persons who face difficulty with pain disability. The data inferred from the chart is as follows: 3 percent of persons cannot function due to pain, 20 percent of persons face a lot of difficulties, 71 percent of persons find some difficulty, 5 percent of people find no difficulty and 1 percent of persons prefer not to answer.
Once the incidence is adjusted for this disability, 52% of participants have this disability. More women say they have this disability than men, it is less common among respondents 18 to 34 years of age and it is more common among those in households earning no more than $40K per year. The regions with the highest proportion of respondents with this disability are British Columbia, Atlantic Canada and Ontario.
Figure 25: Persons with Disabilities – Pain (Adjusted Incidence): Have This Type of Disability
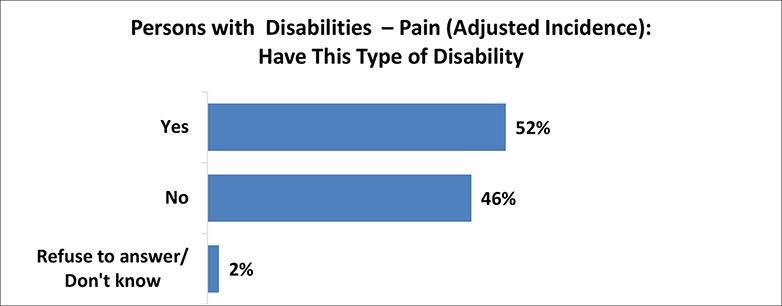
A figure depicts the percentage of persons who have pain disabilities with adjusted incidence
Description: A horizontal bar graph depicts the survey results for people with disability of pain (adjusted incidence). The data inferred is as follows: Persons who answered yes - 52 percent, persons who answered no - 46 percent, and persons who refuse to answer or don’t know - 2 percent
Flexibility Disability
Roughly half (47%) of survey participants say they have a flexibility disability. This disability was described as a physical disability that affects a person’s ability to move their joints. Nearly 4 in 5 of these respondents (79%) say this disability always, often or sometimes limits their inclusion in society. Among those who say this happens rarely or never, 97% say they have at least some difficulty with flexibility.
Figure 26: Persons with Disabilities – Flexibility: Have This Type of Disability
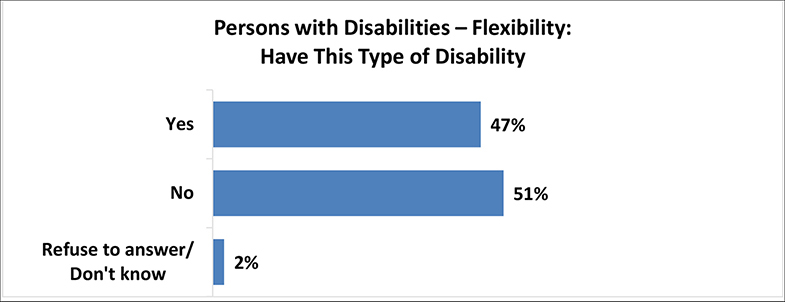
A figure depicts the percentage of persons who have flexibility disabilities
Description: The horizontal bar graph depicts the survey results for persons with flexibility disabilities. The data inferred is as follows: Persons who answered yes - 47 percent, persons who answered no - 51 percent, and persons who refuse to answer or don’t know - 2 percent.
Figure 27: Persons with Disabilities – Flexibility: Frequency of Environment Limiting Inclusion in Society
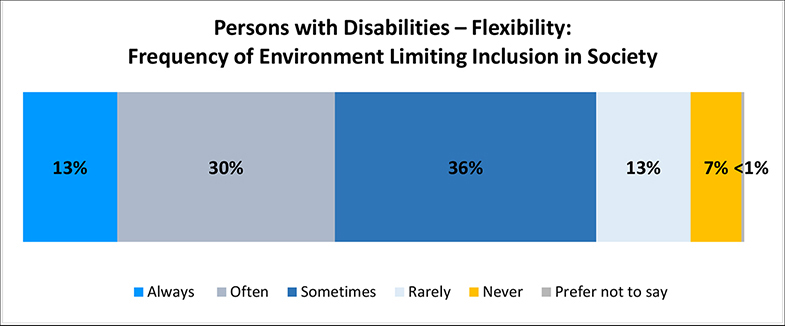
A figure depicts the percentage persons with flexibility disabilities feel limited in their inclusion in society due to the world around them
Description: The chart depicts the percentage of persons with flexibility disabilities who feel they are not included in society due to the world around them. The data inferred from the chart is as follows: 13 percent of respondents always feel this way, 30 percent of respondents often feel this way, 36 percent of respondents sometimes feel this way, 13 percent of respondents rarely feel this way, 13 percent of respondents never feel this way, and less than 1 percent of respondents prefer not to say.
Figure 28: Persons with Disabilities – Flexibility: Difficulty with Disability
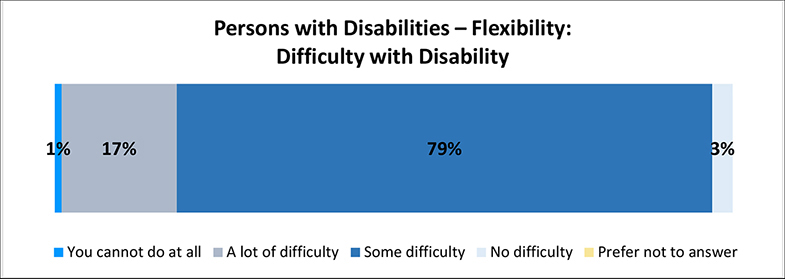
A figure depicts the percentage of difficulty a person with flexibility disability has with their disability
Description: The horizontal chart depicts the percentage of persons with flexibility disability who have difficulty with their disability. The data inferred from the chart is as follows: 1 percent of respondents cannot do at all, 17 percent of respondents have a lot of difficulties, 79 percent of respondents have some difficulty, and 3 percent of respondents prefer not to answer.
The adjusted incidence did not have much impact as still 47% participants have this disability once social inclusion and level of difficulty are factored in. Age seems to have an impact on the incidence of this disability - the older respondents are, the more likely they are to say they have a flexibility disability. It is also less common among those earning at least $80K/year.
Figure 29: Persons with Disabilities – Flexibility (Adjusted Incidence): Have This Type of Disability
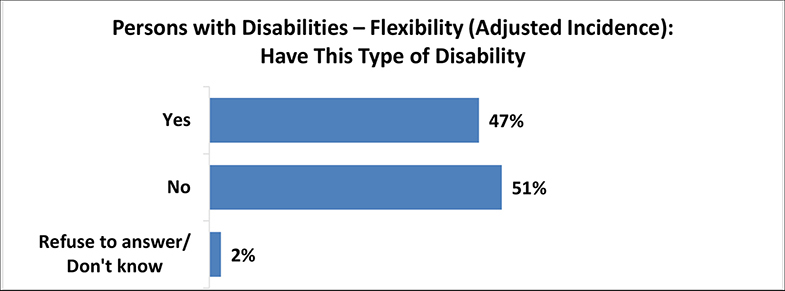
A figure depicts the percentage of persons with flexibility disabilities with adjusted incidence
Description: The horizontal bar graph depicts the survey results for persons with flexibility disabilities (adjusted incidence). The data inferred is as follows: Persons who answered yes - 47 percent, persons who answered no - 51 percent, and persons who refuse to answer or don’t know - 2 percent.
Dexterity Disability
Roughly one third (34%) of survey participants say they have a dexterity disability. This disability was described as a physical disability that affects a person’s ability to do tasks, especially with their hands. Over 4 in 5 of these respondents (83%) say this disability always, often or sometimes limits their inclusion in society. Among those who say this happens rarely or never, 79% say they have at least some difficulty grasping small objects.
Once the incidence is adjusted for this disability, 33% of participants have this disability. Respondents with lower household incomes tend to have a higher incidence of this disability. The province with the highest proportion of respondents with this disability is British Columbia.
Figure 30: Persons with Disabilities – Dexterity (Adjusted Incidence): Have This Type of Disability
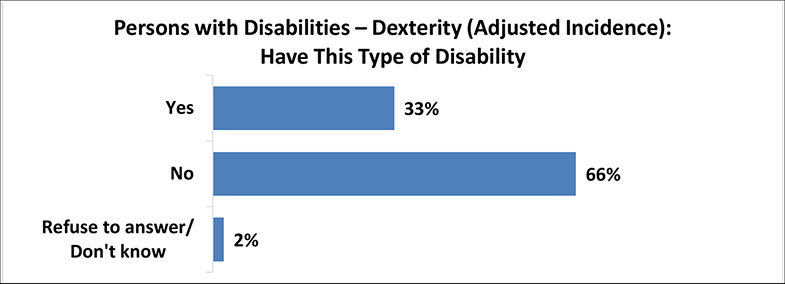
A figure depicts the percentage of persons with dexterity disabilities with adjusted incidence
Description: The horizontal bar graph depicts the survey results for persons with dexterity disabilities (adjusted incidence). The data inferred is as follows: Persons who answered yes - 33 percent, persons who answered no - 66 percent, and persons who refuse to answer or don’t know - 2 percent.
Mental Health-Related Disability
Nearly one third (32%) of survey participants say they have a mental health-related disability. This disability was described as a mental illness that affects a person’s psychology or their behavior. Over 3 in 4 of these respondents (78%) say this disability always, often or sometimes limits their inclusion in society. Among those who say this happens rarely or never, 83% say they have at least some difficulty with their mental health condition.
Figure 31: Persons with Disabilities – Mental Health-Related (Unadjusted Incidence): Have This Type of Disability
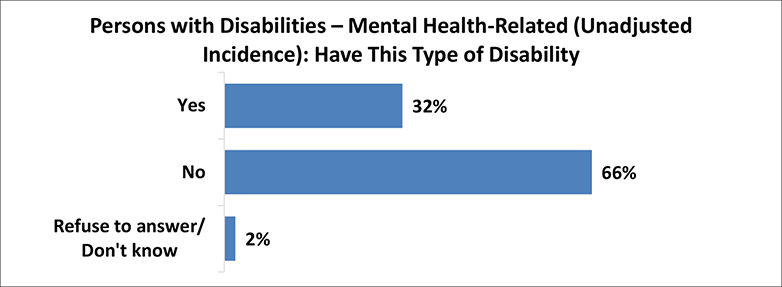
A figure depicts the percentage of persons with mental health-related disabilities with unadjusted incidence
Description: The horizontal bar graph depicts the survey results for persons with mental health-related disabilities with unadjusted incidence. The data inferred is as follows: Persons who answered yes - 32 percent, persons who answered no - 66 percent, and persons who refuse to answer or don’t know - 2 percent.
Figure 32: Persons with Disabilities – Mental Health-Related: Frequency of Environment Limiting Inclusion in Society
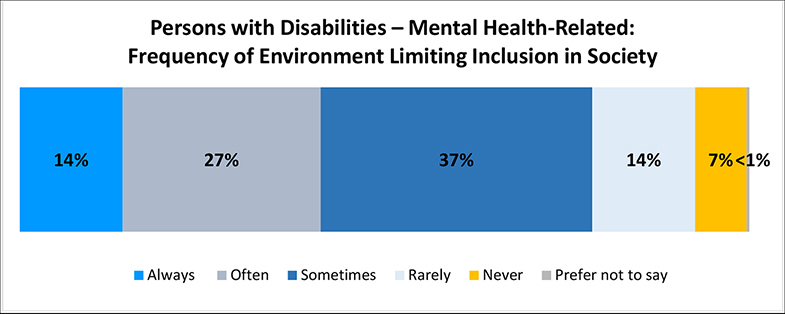
A figure depicts A figure depicts the percentage persons with mental health-related disabilities feel limited in their inclusion in society due to the world around them
Description: The chart depicts the percentage of persons with mental health-related disabilities who feel limited inclusion in society due to the world around them. The data inferred from the chart is as follows. 14 percent of respondents always feel this way, 27 percent of respondents often feel this way, 47 percent of respondents sometimes feel this way, 14 percent of respondents rarely feel this way, 7 percent of respondents never feel this way, and less than 1 percent of respondents prefer not to say.
Figure 33: Persons with Disabilities – Mental Health-Related: Difficulty with Disability
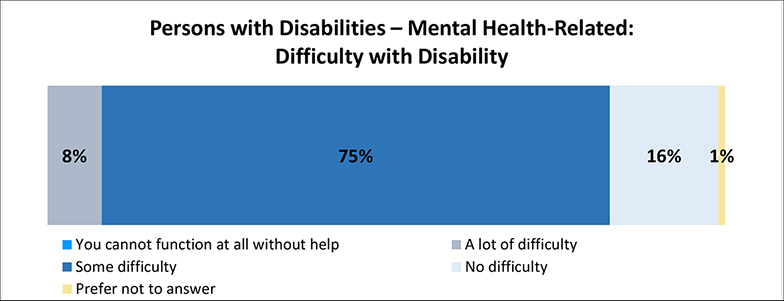
A figure depicts the amount of difficulty persons with mental health-related disabilities have with their disability
Description: The horizontal chart depicts the amount of difficulty persons with mental health-related disabilities have with their disability. The data inferred from the chart is as follows. 8 percent of respondents have a lot of difficulty, 75 percent of respondents have some difficulty, 16 percent of respondents have no difficulty, and 1 percent of respondents prefer not to answer.
Once the incidence is adjusted for this disability, 31% of participants have this disability. The younger respondents are the higher the incidence of this disability. This also seems to affect more women than men. Respondents with lower household incomes tend to have a higher incidence of this disability. The province with proportionally more respondents with this disability is New Brunswick.
Figure 34: Persons with Disabilities – Mental Health-Related (Adjusted Incidence): Have This Type of Disability
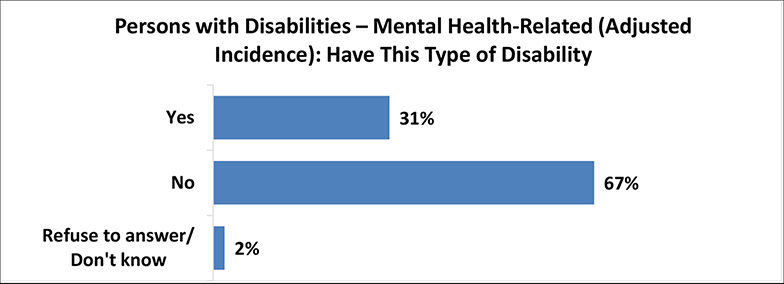
A figure depicts persons with mental health-related disabilities with adjusted incidence
Description: The horizontal bar graph represents the percentage of persons with mental health-related disabilities with adjusted incidence. The data inferred is as follows. Persons who answered yes - 31 percent, persons who answered no - 67 percent, and persons who refuse to answer or don’t know - 2 percent.
Memory Disability
Over one quarter (29%) of survey participants say they have a memory disability. This disability was described as a memory disorder that affects a person’s ability to remember information. Over 4 in 5 of these respondents (85%) say this disability always, often or sometimes limits their inclusion in society. Among those who say this happens rarely or never, 93% say they have at least some difficulty with their memory.
Figure 35: Persons with Disabilities – Memory (Unadjusted Incidence): Have This Type of Disability
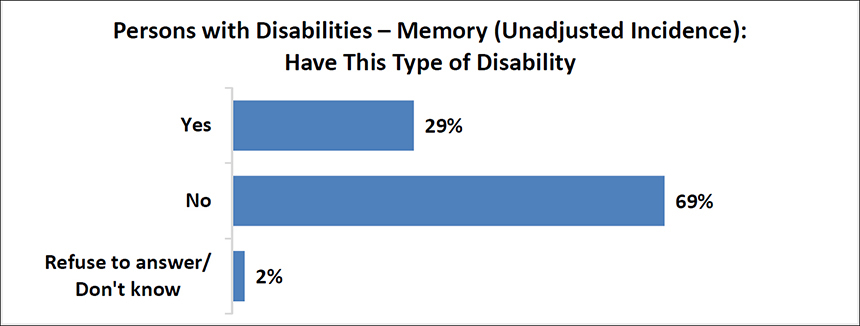
A figure depicts the percentage of persons with memory disabilities with unadjusted incidence
Description: The horizontal bar graph represents the percentage of persons with memory disabilities with unadjusted incidence. The data inferred is as follows. Persons who answered yes - 29 percent, persons who answered no - 69 percent, and persons who refuse to answer or don’t know - 2 percent.
Figure 36: Persons with Disabilities – Memory: Frequency of Environment Limiting Inclusion in Society
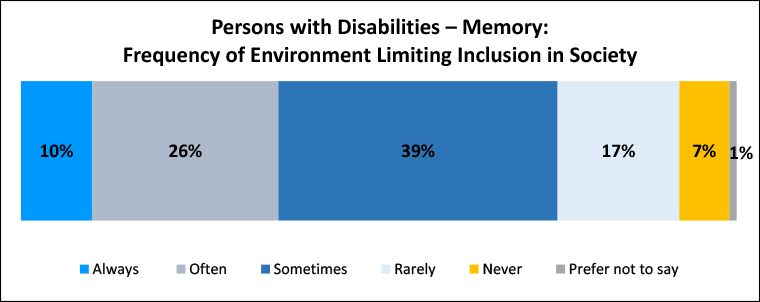
A figure depicts the percentage persons with memory disabilities feel limited in their inclusion in society due to the world around them
Description: The horizontal chart depicts the percentage persons with memory disabilities feel they are not included in society due to the world around them. The data inferred from the chart is as follows. 10 percent of respondents always feel this way, 26 percent of respondents often feel this way, 39 percent of respondents sometimes feel this way, 17 percent of respondents rarely feel this way, 7 percent of respondents never feel this way, and 1 percent of respondents prefer not to say.
Figure 37: Persons with Disabilities – Memory: Difficulty with Disability
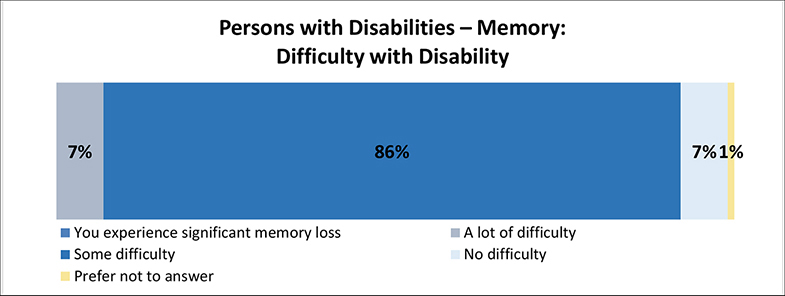
A figure depicts the amount of difficulty persons with memory disability have with their disability
Description: A horizontal chart depicts the percentage of persons with memory disabilities who have e difficulty with their disability. The data inferred from the chart is as follows. 7 percent of respondents have a lot of difficulty, 86 percent of respondents have some difficulty, 7 percent of respondents have no difficulty, and 1 percent of respondents prefer not to answer. The percentage of respondents who experience significant memory loss is not mentioned in the chart.
Once the incidence is adjusted for this disability, 28% of participants have this disability. Slightly more women than men say they have this disability. Memory disabilities seem to occur relatively more to respondents in New Brunswick, Nova Scotia, Prince Edward Island, and the Territories. They also seem to become less common as the household income increases.
Figure 38: Persons with Disabilities – Memory (Adjusted Incidence): Have This Type of Disability
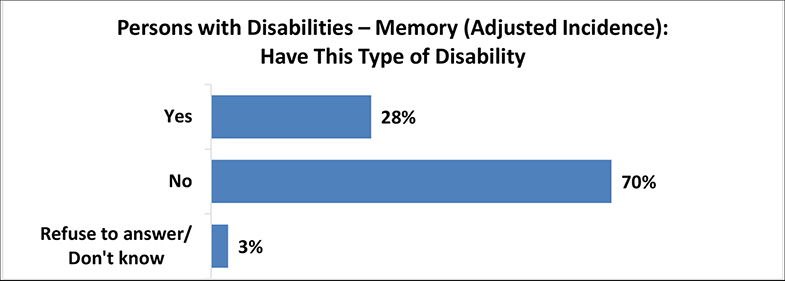
A figure depicts the percentage of persons with memory disabilities with adjusted incidence
Description: A horizontal bar graph depicts the survey results for persons with memory disabilities (adjusted incidence). The data inferred is as follows. Persons who answered yes - 28 percent, persons who answered no - 70 percent, and persons who refuse to answer or don’t know - 3 percent.
Seeing Disability
Three in ten (30%) survey participants say they have a disability related to seeing. This disability was described as a visual impairment that affects a person’s ability to see, even when wearing glasses or contact lenses. Over 3 in 5 of these respondents (64%) say this disability always, often or sometimes limits their inclusion in society. Among those who say this happens rarely or never, 71% say they have at least some difficulty seeing, even when wearing glasses or contact lenses.
Figure 39: Persons with Disabilities – Seeing (Unadjusted Incidence): Have This Type of Disability
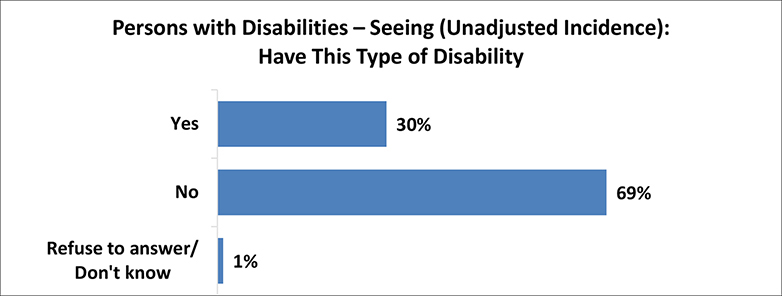
A figure depicts the percentage of persons with seeing having disabilities related to seeing with unadjusted incidence
Description: A horizontal bar graph depicts the survey results for persons with seeing disabilities (unadjusted incidence). The data inferred is as follows. Persons who answered yes - 30 percent, persons who answered no - 69 percent, and persons who refuse to answer or don’t know - 1 percent.
Figure 40: Persons with Disabilities – Seeing: Frequency of Environment Limiting Inclusion in Society
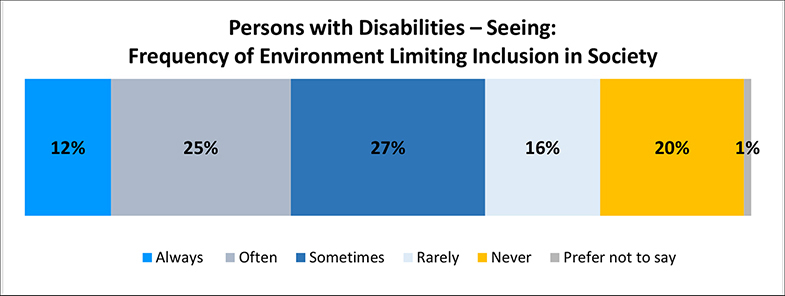
A figure depicts the percentage of persons with seeing disabilities feel limited in their inclusion in society due to the world around them
Description: A chart depicts the percentage of persons with seeing disabilities who feel they are not included in society due to the world around them. The data inferred from the chart is as follows. 12 percent of respondents always feel this way, 25 percent of respondents often feel this way, 27 percent of respondents sometimes feel this way, 16 percent of respondents rarely feel this way, 20 percent of respondents never feel this way, and 1 percent of respondents prefer not to say.
Figure 41: Persons with Disabilities – Seeing: Difficulty with Disability
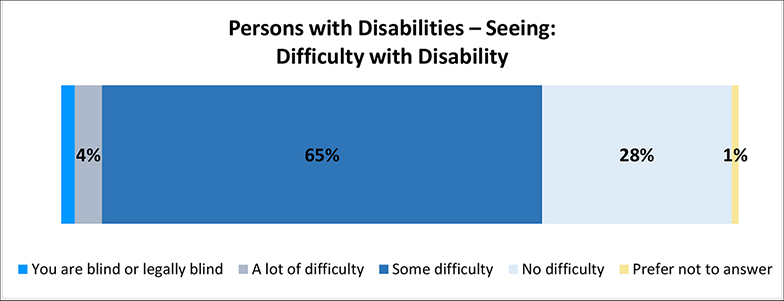
A figure depicts the amount of difficulty persons with seeing disabilities have with their disability
Description: The horizontal chart depicts the percentage of persons with seeing disabilities who have difficulty with their disability. The data inferred from the chart is as follows: 4 percent of respondents have a lot of difficulty, 65 percent of respondents have some difficulty, 28 percent of respondents have no difficulty, and 1 percent of respondents prefer not to answer. The rest of the percentage (percentage value not displayed) corresponds to respondents who are blind or legally blind.
Once the incidence is adjusted for this disability, 26% of participants have this disability. Slightly more men than women say they have this disability, and from a regional perspective, is more common in Saskatchewan.
Figure 42: Persons with Disabilities – Seeing (Adjusted Incidence): Have This Type of Disability
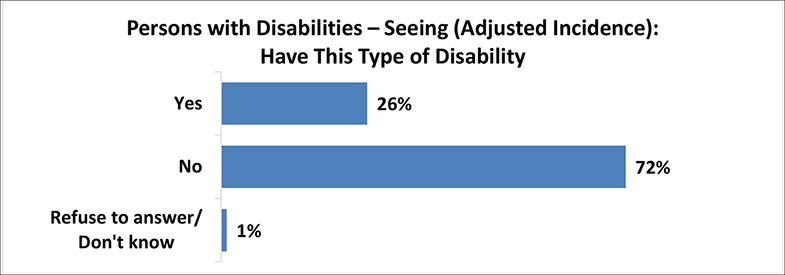
A figure depicts the percentage of persons with seeing disabilities with adjusted incidence
Description: A horizontal bar graph depicts the survey results for persons with seeing disabilities (adjusted incidence). The data inferred is as follows. Persons who answered yes - 26 percent, persons who answered no - 72 percent, and persons who refuse to answer or don’t know - 1 percent.
Hearing Disability
Nearly one quarter (24%) of survey participants say they have a hearing disability. This disability was described as Deaf or Hard of Hearing - it affects a person’s ability to hear, even when using a hearing aid. Over 4 in 5 of these respondents (82%) say this disability always, often or sometimes limits their inclusion in society. Among those who say this happens rarely or never, 79% say they have at least some difficulty hearing, even when using a hearing aid.
Figure 43: Persons with Disabilities – Hearing (Unadjusted Incidence): Have This Type of Disability
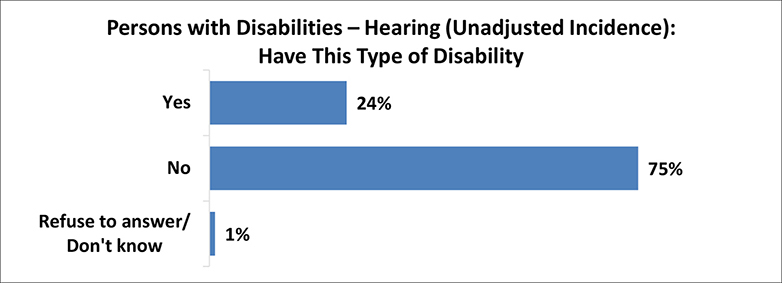
A figure depicts the percentage of persons with hearing disabilities with unadjusted incidence
Description: A horizontal bar graph depicts the survey results for persons with hearing disabilities (unadjusted incidence). The data inferred is as follows. Persons who answered yes - 24 percent, persons who answered no - 75 percent, and persons who refuse to answer or don’t know - 1 percent.
Figure 44: Persons with Disabilities – Hearing: Frequency of Environment Limiting Inclusion in Society
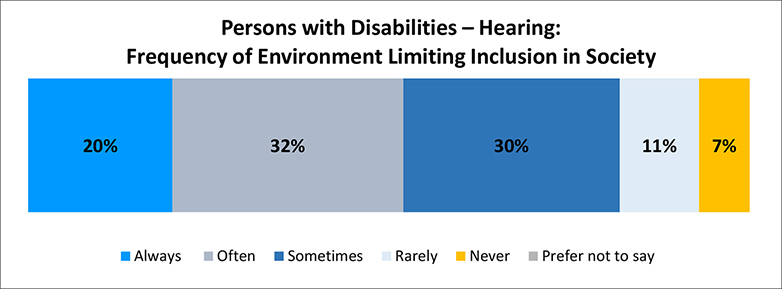
A figure depicts the percentage of persons with hearing disabilities feel limited in their inclusion in society due to the world around them
Description: A horizontal chart depicts the percentage of persons with hearing disabilities who feel they are not included in society due to the world around them. The data inferred from the chart is as follows: 20 percent of respondents always feel this way, 32 percent of respondents often feel this way, 30 percent of respondents sometimes feel this way, 11 percent of respondents rarely feel this way, and 7 percent of respondents never feel this way. The percentage of respondents who prefer not to say is not mentioned in the chart.
Figure 45: Persons with Disabilities – Hearing: Difficulty with Disability
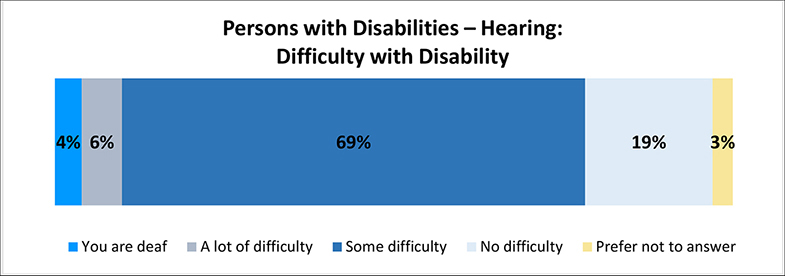
A figure depicts the amount of difficulty persons with hearing disabilities have with their disability
Description: A horizontal chart depicts the percentage of persons with hearing disabilities who have difficulty with their disability. The data inferred from the chart is as follows: 4 percent of respondents are deaf, 6 percent of respondents have a lot of difficulty, 69 percent of respondents have some difficulty, 19 percent of respondents have no difficulty, and 3 percent of respondents prefer not to answer.
Once the incidence is adjusted for this disability, 23% of participants have this disability. The older respondents are, the more they say they have a hearing disability. More men than women report having this disability. Newfoundland has the highest proportion of respondents with a hearing disability.
Figure 46: Persons with Disabilities – Hearing (Adjusted Incidence): Have This Type of Disability
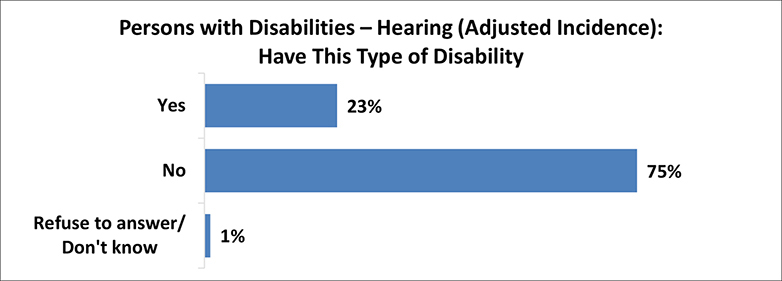
A figure depicts the percentage of persons with hearing disabilities with adjusted incidence
Description: A horizontal bar graph depicts the survey results for persons with hearing disabilities (adjusted incidence). The data inferred is as follows. Persons who answered yes - 23 percent, persons who answered no - 75 percent, and persons who refuse to answer or don’t know - 1 percent.
Learning Disability
Roughly one in five (21%) survey participants say they have a learning disability. This disability was described as one that affects the way a person receives, understands, and uses information. Over 4 in 5 of these respondents (81%) say this disability always, often or sometimes limits their inclusion in society. Among those who say this happens rarely or never, 83% say they have at least some difficulty learning.
Figure 47: Persons with Disabilities – Learning (Unadjusted Incidence): Have This Type of Disability
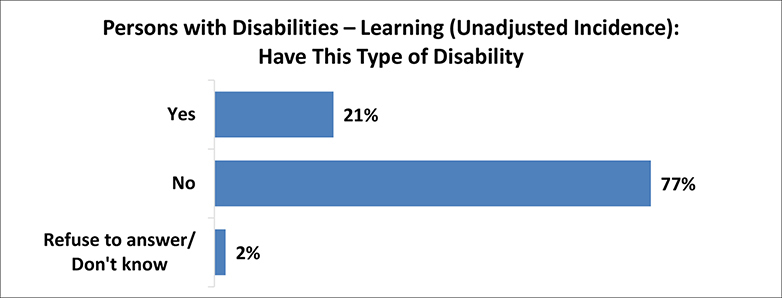
A figure depicts the percentage of persons with learning disabilities with unadjusted incidence
Description: A horizontal bar graph depicts the survey results for persons with learning disabilities (unadjusted incidence). The data inferred is as follows. Persons who answered yes - 21 percent, persons who answered no - 77 percent, and persons who refuse to answer or don’t know - 2 percent.
Figure 48: Persons with Disabilities – Learning: Frequency of Environment Limiting Inclusion in Society
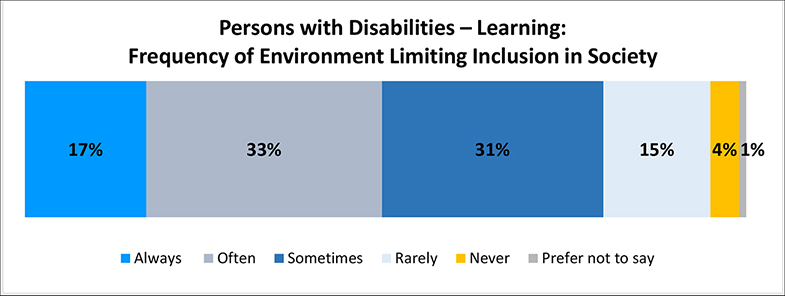
A figure depicts the percentage of persons with learning disabilities feel limited in their inclusion in society due to the world around them
Description: A horizontal chart depicts the percentage of persons with learning disabilities who feel they are not included in society due to the world around them. The data inferred from the chart is as follows. 17 percent of respondents always feel this way, 33 percent of respondents often feel this way, 31 percent of respondents sometimes feel this way, 15 percent of respondents rarely feel this way, 4 percent of respondents never feel this way, and 1 percent of respondents prefer not to say.
Figure 49: Persons with Disabilities – Learning: Difficulty with Disability
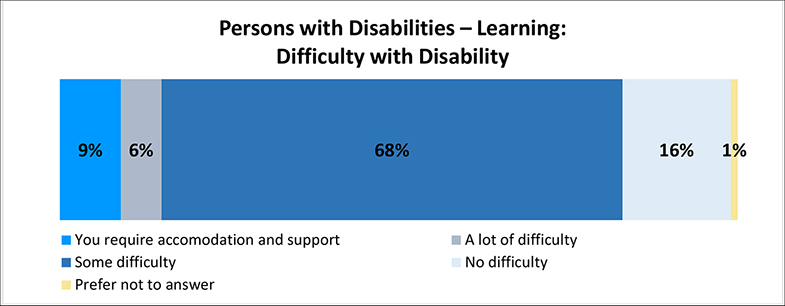
A figure depicts the amount of difficulty persons with learning disabilities have with their disability
Description: A horizontal chart depicts the percentage of persons with learning disabilities who have difficulty with their disability. The data inferred from the chart is as follows. 9 percent of respondents require accommodation and support, 6 percent of respondents have a lot of difficulty, 68 percent of respondents have some difficulty, 16 percent of respondents have no difficulty, and 1 percent of respondents prefer not to answer.
Once the incidence is adjusted for this disability, 20% participants have this disability. The younger respondents are, the higher the incidence for this type of disability. Also, those with lower household incomes have a higher incidence of this disability. The Territories have the highest proportion of respondents with a learning disability.
Figure 50: Persons with Disabilities – Learning (Adjusted Incidence): Have This Type of Disability
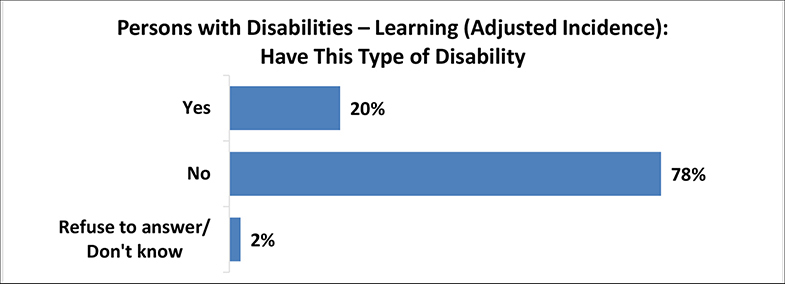
A figure depicts the percentage of persons with learning disabilities with adjusted incidence
Description: A horizontal bar graph depicts the survey results for persons with learning disabilities (adjusted incidence). The data inferred is as follows. Persons who answered yes - 20 percent, persons who answered no - 78 percent, and persons who refuse to answer or don’t know - 2 percent.
Communication Disability
Roughly one in five (18%) survey participants say they have a communication disability. This disability was described as one that affects the way a person receives, understands, and uses information. Over 4 in 5 of these respondents (88%) say this disability always, often or sometimes limits their inclusion in society. Among those who say this happens rarely or never, 77% say they have at least some difficulty communicating.
Figure 51: Persons with Disabilities – Communication (Adjusted Incidence): Have This Type of Disability
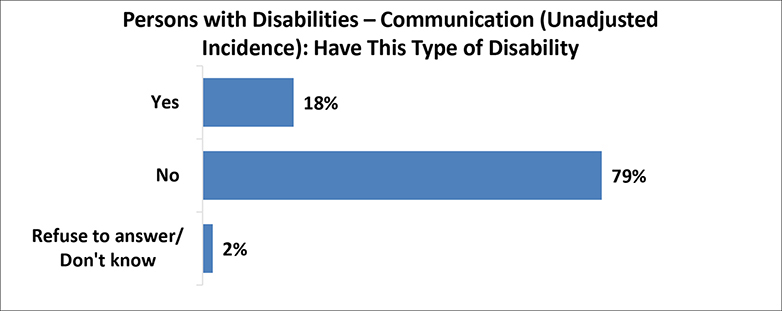
A figure depicts the percentage of persons with communication disabilities with unadjusted incidence
Description: A horizontal bar graph depicts the survey results for persons with communication disabilities (unadjusted incidence). The data inferred is as follows. Persons who answered yes - 18 percent, persons who answered no - 79 percent, and persons who refuse to answer or don’t know - 2 percent.
Figure 52: Persons with Disabilities – Communication: Frequency of Environment Limiting Inclusion in Society
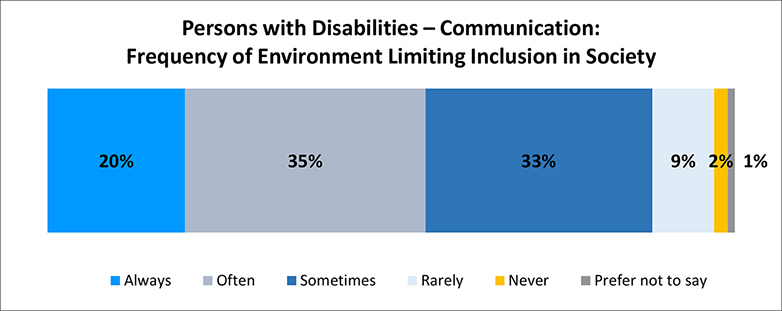
A figure depicts the percentage of persons with communication disabilities feel limited in their inclusion in society due to the world around them
Description: A chart depicts the percentage of persons with communication disabilities who feel they are not included in society due to the world around them. The data inferred from the chart is as follows: 20 percent of respondents always feel this way, 35 percent of respondents often feel this way, 33 percent of respondents sometimes feel this way, 9 percent of respondents rarely feel this way, 2 percent of respondents never feel this way, and 1 percent of respondents prefer not to say.
Figure 53: Persons with Disabilities – Communication: Difficulty with Disability
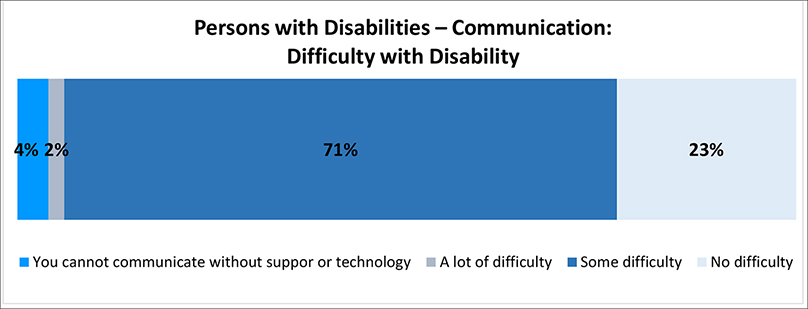
A figure depicts the amount of difficulty persons with communication disabilities have with their disability
Description: A horizontal chart depicts the percentage of persons with communication disabilities who have difficulty with their disability. The data inferred from the chart is as follows. 4 percent of respondents cannot communicate without support or technology, 2 percent of respondents have a lot of difficulty, 71 percent of respondents have some difficulty, and 23 percent of respondents have no difficulty.
The adjusted incidence did not have much impact as still 18% of participants have this disability once social inclusion and level of difficulty are factored in. The younger respondents are, the more likely they are to say they have a communication disability. As well, as the household income decrease, the incidence of this disability increases. The Territories have the highest proportion of respondents with a communication disability.
Figure 54: Persons with Disabilities – Communication (Adjusted Incidence): Have This Type of Disability

A figure depicts the percentage of persons with communication disabilities with adjusted incidence
Description: A horizontal bar graph depicts the survey results for persons with communication disabilities (adjusted incidence). The data inferred is as follows. Persons who answered yes - 18 percent, persons who answered no - 80 percent, and persons who refuse to answer or don’t know - 2 percent.
Speech Disability
Roughly one tenth (11%) of survey participants say they have a speech disability. This disability was described as a speech disorder that affects the way a person makes sounds to form word. Over 4 in 5 of these respondents (84%) say this disability always, often or sometimes limits their inclusion in society. Among those who say this happens rarely or never, 74% say they have at least some difficulty speaking.
Figure 55: Persons with Disabilities – Speech (Unadjusted Incidence): Have This Type of Disability

A figure depicts the percentage of persons with speech disabilities with unadjusted incidence
Description: A horizontal bar graph depicts the survey results for persons with speech disabilities (unadjusted incidence). The data inferred is as follows. Persons who answered yes - 11 percent, persons who answered no - 87 percent, and persons who refuse to answer or don’t know - 2 percent.
Figure 56: Persons with Disabilities – Speech: Frequency of Environment Limiting Inclusion in Society
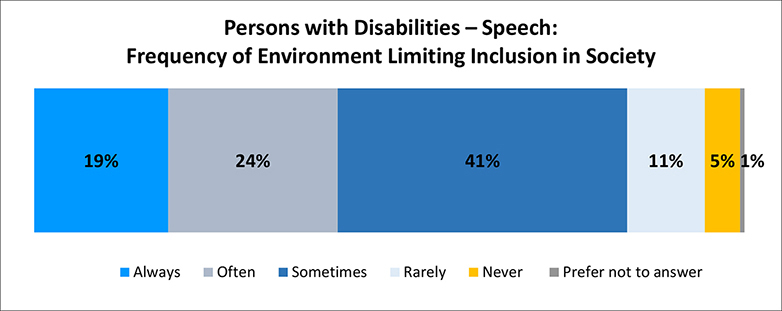
A figure depicts the percentage persons with speech disabilities feel limited in their inclusion in society due to the world around them
Description: A horizontal chart depicts the percentage of persons with speech disabilities who feel they are not included in society due to the world around them. The data inferred from the chart is as follows. 19 percent of respondents always feel this way, 24 percent of respondents often feel this way, 41 percent of respondents sometimes feel this way, 11 percent of respondents rarely feel this way, 5 percent of respondents never feel this way, and 1 percent of respondents prefer not to say.
Figure 57: Persons with Disabilities – Speech: Difficulty with Disability
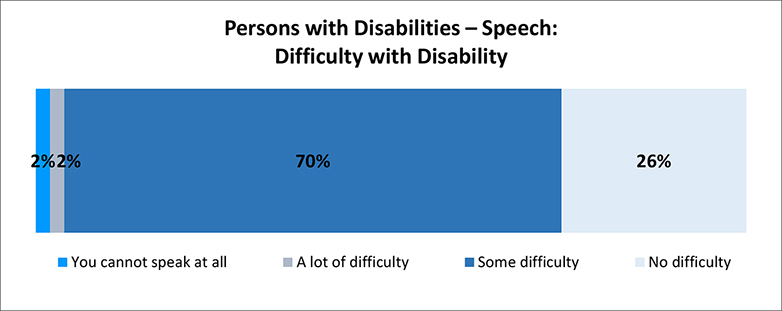
A figure depicts the amount of difficulty persons with speech disabilities have with their disability
Description: A horizontal chart depicts the percentage of persons with speech disabilities who have difficulty with their disability. The data inferred from the chart is as follows. 2 percent of respondents cannot speak at all, 2 percent of respondents have a lot of difficulty, 70 percent of respondents have some difficulty, and 26 percent of respondents have no difficulty.
The adjusted incidence remained at 11% of participants. The younger respondents are, the more likely they are to say they have a speech disability. As the household income decrease, the incidence of this disability increases. At 5%, New Brunswick has the lowest proportion of respondents with a speech disability.
Figure 58: Persons with Disabilities – Speech (Adjusted Incidence): Have This Type of Disability
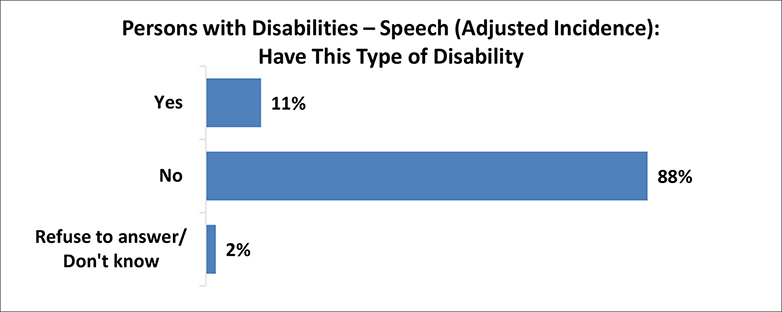
A figure depicts the percentage of persons with speech disabilities with adjusted incidence
Description: A horizontal bar graph depicts the survey results for persons with speech disabilities (adjusted incidence). The data inferred is as follows. Persons who answered yes - 11 percent, persons who answered no - 88 percent, and persons who refuse to answer or don’t know - 2 percent.
Developmental Disability
One tenth (10%) of survey participants say they have a developmental disability. This disability was described as intellectual disabilities that affect a person’s ability to learn and to adapt their behavior to different situations. Over 4 in 5 of these respondents (89%) say this disability always, often or sometimes limits their inclusion in society. Among the 14 disabilities considered, persons with this disability were the most likely to indicate it always limits their inclusion in society (24%). Among those who say this happens rarely or never, 80% say they have at least some difficulty with this condition.
Figure 59: Persons with Disabilities – Developmental (Unadjusted Incidence): Have This Type of Disability
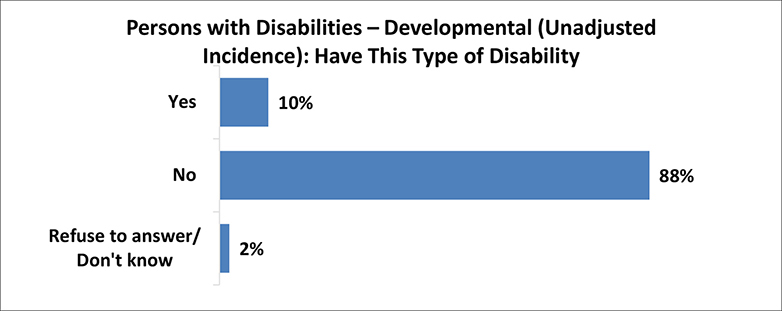
A figure depicts the percentage of persons with developmental disabilities with unadjusted incidence
Description: A horizontal bar graph depicts the survey results for persons with developmental disabilities (unadjusted incidence). The data inferred is as follows. Persons who answered yes - 10 percent, persons who answered no - 88 percent, and persons who refuse to answer or don’t know - 2 percent.
Figure 60: Persons with Disabilities – Developmental: Frequency of Environment Limiting Inclusion in Society
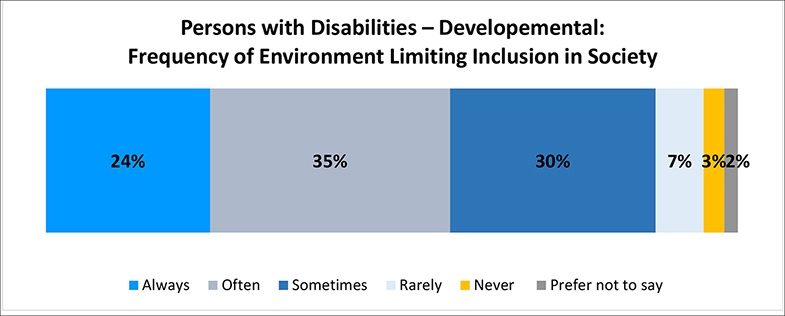
A figure depicts the percentage persons with developmental disabilities feel limited in their inclusion in society due to the world around them
Description: A horizontal chart depicts the percentage of persons with developmental disabilities who feel they are not included in society due to the world around them. The data inferred from the chart is as follows: 24 percent of respondents always feel this way, 35 percent of respondents often feel this way, 30 percent of respondents sometimes feel this way, 7 percent of respondents rarely feel this way, 3 percent of respondents never feel this way, and 2 percent of respondents prefer not to say.
Figure 61: Persons with Disabilities – Developmental: Difficulty with Disability
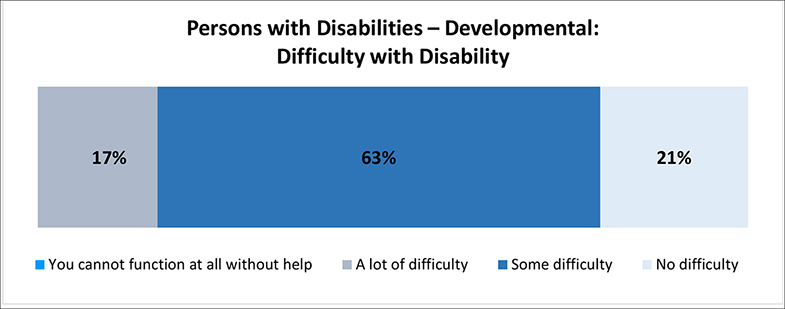
A figure depicts the amount of difficulty persons with developmental disabilities have with their disability
Description: The horizontal chart depicts the percentage of persons with developmental disabilities who have difficulty with their disability. The data inferred from the chart is as follows. 17 percent of respondents have a lot of difficulty, 63 percent of respondents have some difficulty, and 21 percent of respondents have no difficulty. The percentage of respondents who cannot function at all without help is not mentioned in the chart.
This specific disability was not adjusted for a new incidence depending on social inclusion or level of difficulty. The younger respondents are, the more likely they are to say they have a developmental disability. More men than women say they have this condition. Also, as the household income decrease, the incidence of this disability increases.
Language Disability
Roughly one tenth (9%) of survey participants say they have a language disability. This disability was described as a language-based disability that affects a person’s ability to understand and use spoken and written language. Over 4 in 5 of these respondents (82%) say this disability always, often or sometimes limits their inclusion in society. Among those who say this happens rarely or never, 65% say they have at least some difficulty with their language-based disability.
Figure 62: Persons with Disabilities – Language (Unadjusted Incidence): Have This Type of Disability
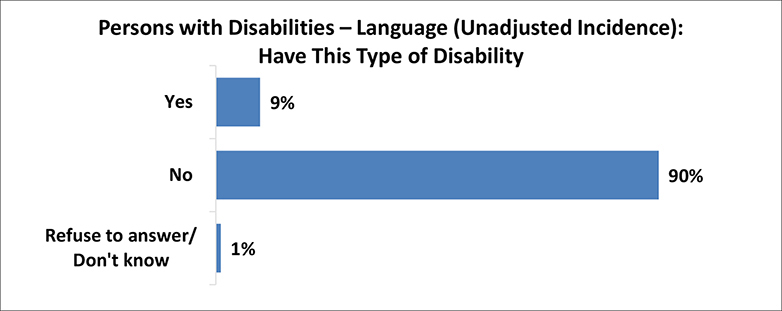
A figure depicts the percentage of persons with language disabilities (unadjusted incidence)
Description: The horizontal bar graph depicts the survey results of persons with language disabilities (unadjusted incidence). The rate of people who answered Yes - 9 percent, No - 90 percent, and Refused to answer or didn’t know - 1 percent.
Figure 63: Persons with Disabilities – Language: Frequency of Environment Limiting Inclusion in Society
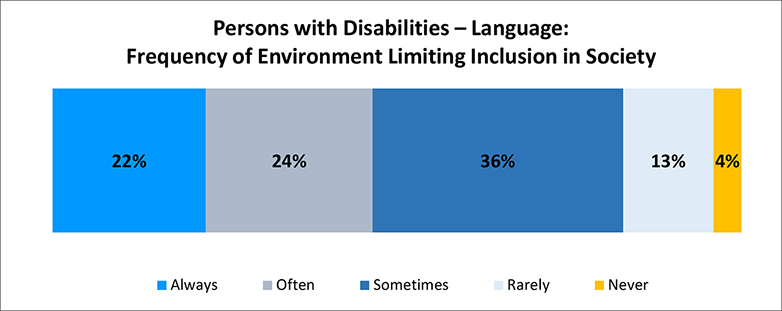
A figure depicts the percentage persons with language disabilities feel limited in their inclusion in society due to the world around them
Description: The horizontal chart depicts the percentage of persons with language disabilities who feel they are not included in society due to the world around them. The data inferred from the chart is as follows: 22 percent of respondents always feel this way, 24 percent often feel this way, 36 percent sometimes feel this way, 13 percent rarely feel this way, and 4 percent of respondents never feel this way.
Figure 64: Persons with Disabilities – Language: Difficulty with Disability
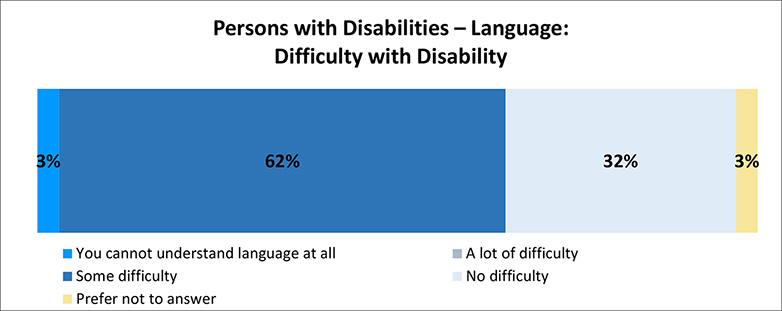
A figure depicts the amount of difficulty persons with language disabilities have with their disability
Description: The horizontal chart depicts the survey results for the persons with language disabilities (difficulty with disability). The data inferred from the graph is as follows: 3 percent of the respondents cannot understand language at all, 62 percent of the respondents have some difficulty, 32 percent of the respondents have a lot of difficulty, and 3 percent of respondents prefer not to answer. The percentage of respondents with no difficulty is not mentioned in the chart.
Once the incidence is adjusted for this disability, 8% of participants have this disability. The younger respondents are, the higher the incidence for this type of disability. Also, those with lower household incomes have a higher incidence of this disability. The Territories have the highest proportion of respondents with a language disability.
Figure 65: Persons with Disabilities – Language (Adjusted Incidence): Have This Type of Disability
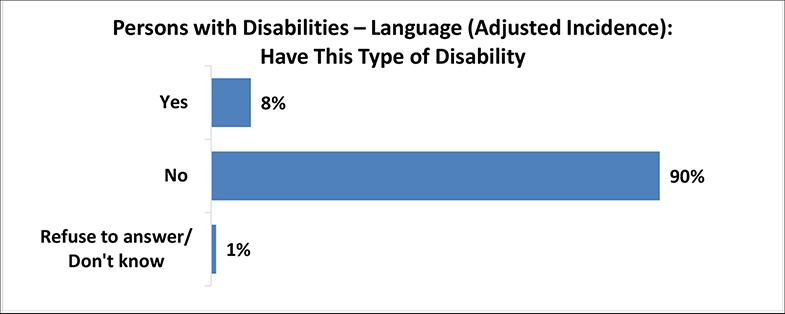
A figure depicts the percentage of persons with language disabilities with adjusted incidence
Description: The horizontal bar graph depicts the survey results for persons with a language disability (adjusted incidence). The rate of people who answered Yes - 8 percent, No - 90 percent, and Refused to answer or didn’t know - 1 percent.
Other Disabilities
One quarter (25%) of survey participants say they have another type of disability. The most common mentions include environmental sensitivities (ES), myalgic encephalomyelitis or chronic fatigue syndrome (ME/CFS), problems with energy availability, multiple chemical sensitivity, and electro sensitivity, among others. Nine in ten of these respondents (90%) say this disability always, often or sometimes limits their inclusion in society. Among those who say this happens rarely or never, 74% say they have at least some difficulty with this other disability.
Once the incidence is adjusted for this disability, 24% of participants have another disability.
Figure 66: Persons with Disabilities – Other Disability (Unadjusted Incidence): Have This Type of Disability
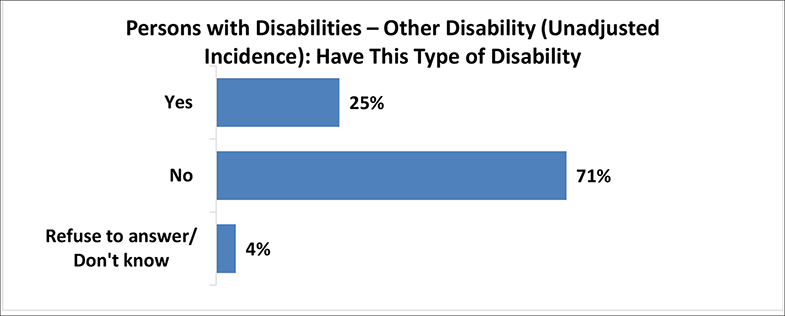
A figure depicts the percentage of persons with other disabilities with unadjusted incidence
Description: A horizontal bar graph depicts the survey results for persons with other disabilities (unadjusted incidence). The rate of people who answered Yes - 25 percent, No - 71 percent, and Refused to answer or didn’t know - 4 percent.
Figure 67: Persons with Disabilities – Other Disability: Frequency of Environment Limiting Inclusion in Society
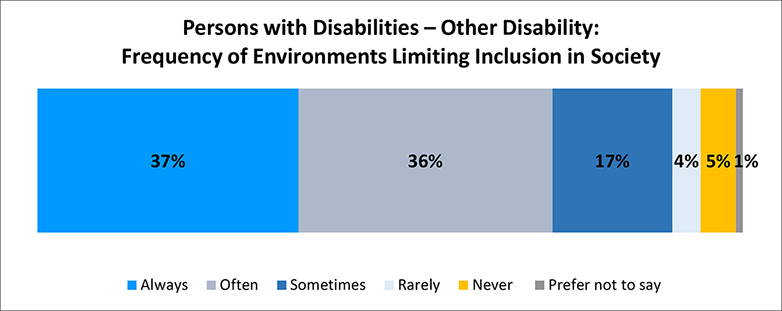
A figure depicts the percentage persons with other disabilities feel limited in their inclusion in society due to the world around them
Description: The horizontal chart depicts the percentage of persons with other disabilities who feel they are not included in society due to the world around them. The data inferred from the graph is as follows: 37 percent of respondents always feel this way, 36 percent often feel this way, 17 percent sometimes feel this way, 4 percent rarely feel this way, 5 percent never feel this way, and 1 percent of respondents prefer not to say.
Figure 68: Persons with Disabilities – Other Disability: Difficulty with Disability
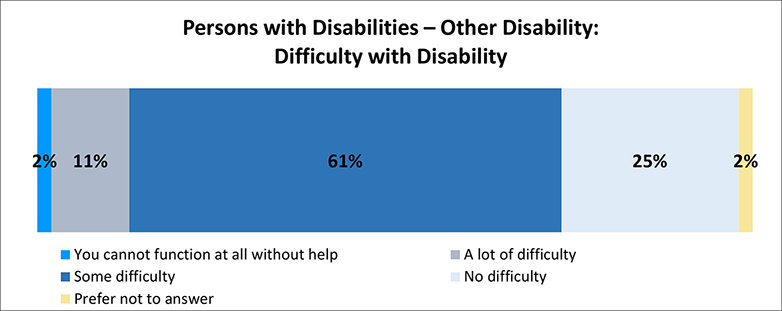
A figure depicts the amount of difficulty persons with other disabilities have with their disability
Description: The horizontal chart depicts the survey results for persons with other disabilities (difficulty with disability). The data inferred from the graph is as follows: 2 percentage of the respondents cannot function at all without help, 11 percent of respondents have a lot of difficulty, 61 percent of respondents have some difficulty, 25 percent of respondents have no difficulty, and 2 percent of respondents prefer not to answer.
Figure 69: Persons with Disabilities – Other Disability (Adjusted Incidence): Have This Type of Disability
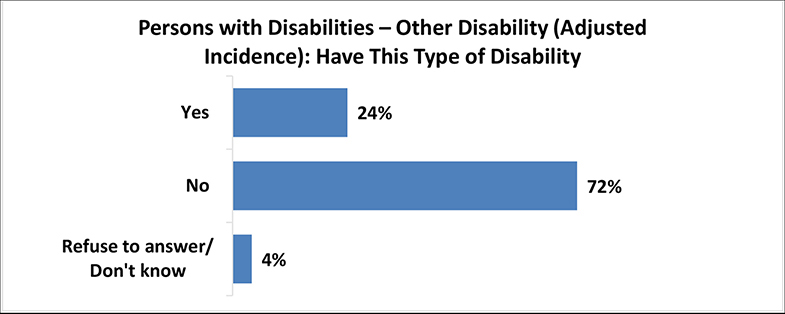
A figure depicts the percentage of persons with other disabilities with adjusted incidence
Description: The horizontal bar graph depicts the survey results for persons with other disabilities (adjusted incidence). The percent of persons who answered Yes - 24 percent, No - 72 percent, Refused to answer or didn’t answer - 4 percent.
Experiences with Barriers among Persons with Disabilities
Attitude Barriers
Respondents with a disability were asked how often they have experienced attitude barriers. Nearly 9 in 10 (88%) say they have experienced this type of barrier at one point in time, with 41% saying they experience it often (30%) or always (11%), and 28% experiencing it sometimes (28%), or rarely (17%).
From a subgroup perspective, the following differences were noted:
The younger respondents are, the more often they are to experience an attitude barrier.
Respondents 18 to 64 years of age are more likely than respondents 65 years of age or older to say they always experience an attitude barrier (14% among 18 to 34, 13% among 35-64 vs. 5% of those at least 65 years old or above).
In addition, respondents 18 to 64 years of age are more likely than respondents 65 years of age or older to say they often experience an attitude barrier (37% among 18 to 34, 33% among 35-64 vs. 21% of those at least 65 years old), while older respondents are the most likely to say they rarely (24%) or never (23%) experience this barrier.
In terms of gender, women are more likely than men to say they experience attitude barriers often (32% vs. 26%), while men are more likely to say they experience this rarely (23% vs. 14%).
Overall, the higher the household income, the less they experience attitude barriers – more specifically, those with a household income under $20,000 are more than twice as likely to say they always encounter this barrier compared to respondents of higher incomes (22% vs. 9%).
At a regional level, respondents most likely to say they always experience an attitude barrier are in British Columbia (15%) and Ontario (12%), while those most likely to experience it often are in Quebec (35%), Manitoba (34%), Alberta (33%) and Ontario (31%), compared to other provinces and territories.
Respondents most likely to say they always experience an attitude barrier are those with a language disability (29%), a speech disability (25%), a developmental disability (25%), a communication disability (20%), or a learning disability (20%).
Figure 70: Persons with Disabilities – Experience with Attitude Barriers
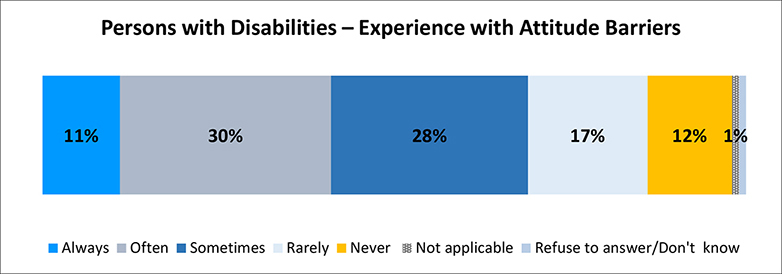
A figure depicts persons with disabilities experiences with attitude barriers
Description: The horizontal chart depicts persons with disabilities experiences with the attitude barriers. The data inferred is as follows: 11 percent of respondents experience it always, 30 percent experience it often, 28 percent experience it sometimes, 17 percent experience it rarely, 12 percent never experience it, remaining 1 percent includes not applicable and respondents who refuse to answer or don’t know.
Employment Barriers
Respondents with a disability were also asked how often they encountered different barriers to employment due to a lack of accessibility over the past 12 months.
One quarter of these respondents have experienced always or often a barrier to finding meaningful work (25%).
In addition, 24% of respondents say they have always or often experienced employment barriers related to having access to supports or workplace accommodations.
Similarly, 23% say they have always or often experienced barriers to moving up in an organization, while 21% they always or often experienced barriers to being hired.
At least one third of respondents say these situations do not apply to them, likely due to not being able to work or being retired.
Figure 71: Persons with Disabilities – Barriers to Employment
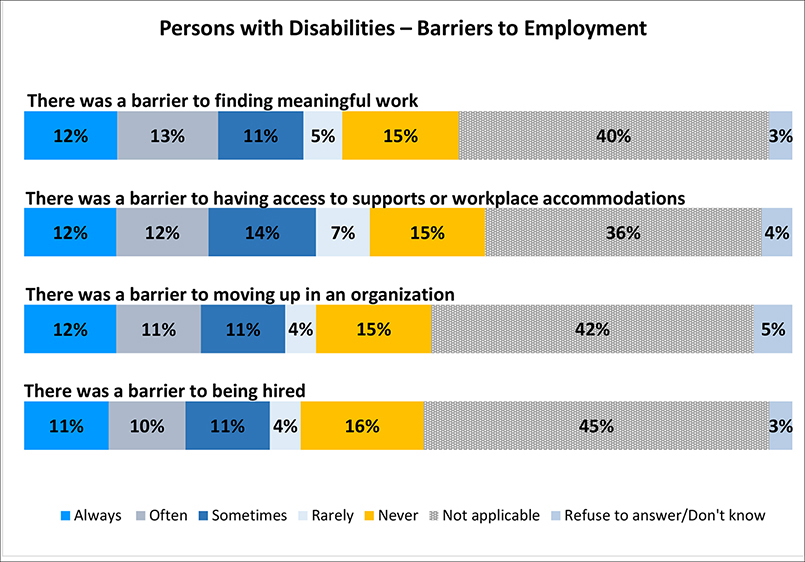
A figure depicts persons with disabilities experiences with employment barriers
Description: The horizontal charts depict persons with disabilities experiences with employment barriers. The data inferred is shown for four categories. 1. Barrier to find meaningful work: 12 percent of respondents experience it always, 13 percent experience it often, 11 percent experience it sometimes, 5 percent experience it rarely, 15 percent never experience it, 40 percent not applicable, 3 percent of respondents refused to answer or don’t know. 2. Barriers to have access to supports or workplace accommodations: 12 percent of respondents experience it always, 12 percent experience it often, 14 percent experience it sometimes, 7 percent experience it rarely, 15 percent never experience it, 36 percent not applicable, 4 percent of respondents refused to answer or don’t know. 3. Barriers to move up in an organization: 12 percent of respondents experience it always, 11 percent experience it often, 11 percent experience it sometimes, 4 percent experience it rarely, 15 percent never experience it, 42 percent not applicable, 5 percent of respondents refused to answer or don’t know. 4. Barriers to being hired: 11 percent of respondents experience it always, 10 percent experience it often, 11 percent experience it sometimes, 4 percent experience it rarely, 16 percent never experience it, 45 percent not applicable, 3 percent of respondents refused to answer or don’t know.
In terms of subgroup differences, the following are noted:
Overall, respondents with lower household incomes tend to experience these employment barriers more often than those with higher household incomes.
Regionally, the incidence of three of these barriers are higher in Alberta, British Columbia, Quebec, and Ontario, notably barriers to having access to supports or workplace accommodations, to finding more meaningful work, and to moving up in an organization.
Respondents in Nova Scotia and British Columbia are the most likely to say they have always or often experienced a barrier to finding meaningful work.
Respondents in Nova Scotia and the Territories are the most likely to say they have experienced always or often a barrier to having access to supports or workplace accommodations, and to moving up in an organization.
Respondents in Quebec are the most likely to say they have experienced always or often a barrier to being hired.
Respondents most likely to say they always experience barriers to employment are those with a language disability, a speech disability, a developmental disability, a communication disability, a learning disability, or a mental health-related disability, particularly to being hired, finding meaningful work, or moving up in an organization.
Barriers Related to the Built Environment
When asked how often respondents encountered different barriers related to the built environment, specifically, barriers to access public buildings and areas. Nearly one third (30%) said they experienced these types of barriers always or often over the past 12 months. In addition, 21% say they have experienced these barriers sometimes, 12% say rarely, and 24% say never.
Figure 72: Persons with Disabilities – Barriers to Public Buildings and Areas
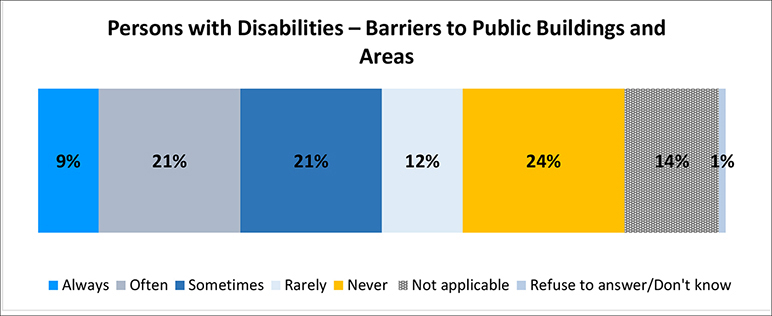
A figure depicts persons with disabilities experiences with barriers to public buildings and areas
Description: The chart depicts the percentage of persons with disabilities who experience barriers to public buildings and areas. The data inferred is as follows: 9 percent of respondents experience it always, 21 percent experience it often, 21 percent experience it sometimes, 12 percent experience it rarely, 24 percent never experience it, 14 percent is not applicable, 1 percent respondents refused to answer or don’t know.
Subgroup differences found include the following:
Respondents with lower household incomes are more likely to say they experience these barriers more often than those with higher household incomes.
Respondents who live in Quebec (12%), are more likely to say they experience these barriers more often than residents in other provinces and territories.
Respondents most likely to say they always or often experience these barriers are those with a dexterity disability, a mobility disability, or a speech disability.
Transportation-Related Barriers
Questions on barriers to transportation were also asked to survey participants:
Roughly one fifth of respondents said they have experienced always or often a barrier when traveling by air, for example, at the airport, airplane, terminal, facilities, equipment, communication, or services (19%); or when using municipal public transit (20%).
Similarly, 18% say they have experienced always or often a barrier related to the use of taxis and ridesharing, such as Uber of Lyft.
To a lesser extent, respondents say they have always or often experienced barriers when traveling by VIA Rail or interprovincial trains, for example, at the train station, the train, or with equipment, communication, or services (9%).
Respondents have always or often experienced barriers when travelling by buses in federal jurisdiction that cross borders (i.e. at the bus stations, on the bus, with equipment, communication, or services) (8%), by ferry (6%), or when using school transportation (5%).
While some of these services seemed to not apply to many respondents, consistently nearly one fifth of respondents said they have never experienced these barriers.
Figure 73: Persons with Disabilities – Barriers to Transportation
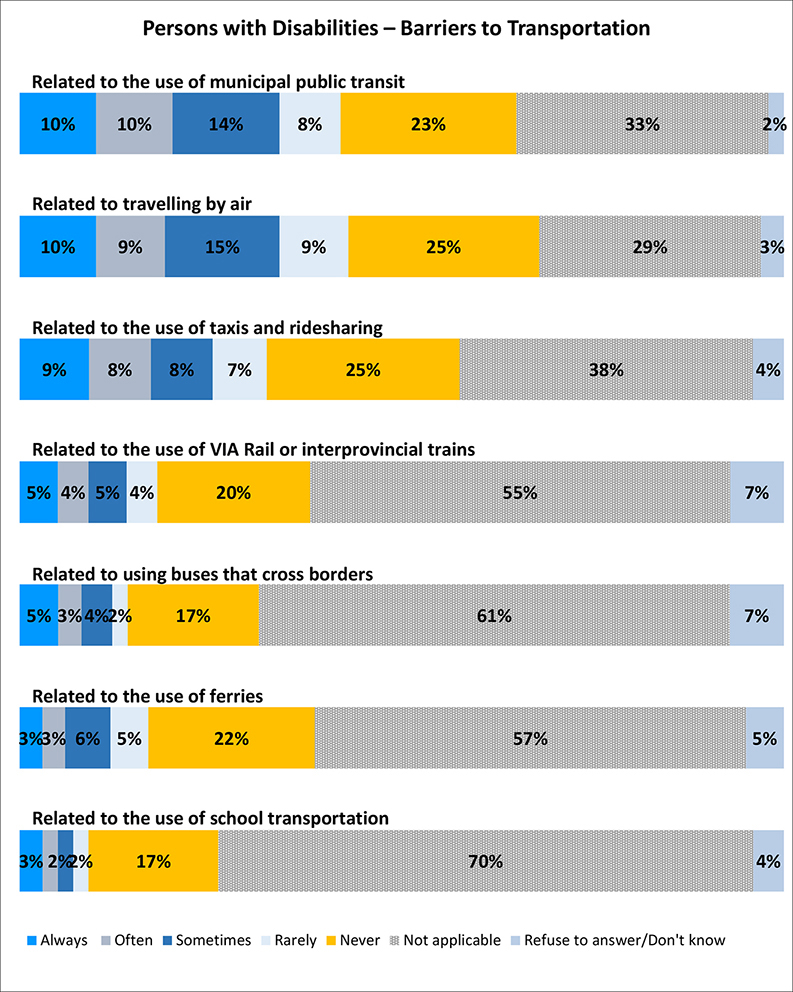
A figure depicts persons with disabilities experiences with transportation barriers
Description: A horizontal chart depicts persons with disabilities experiences with barriers to transportation. The data inferred is shown for seven categories. 1. Barriers related to the use of municipal public transit: 10 percent of respondents experience it always, 10 percent experience it often, 14 percent experience it sometimes, 8 percent experience it rarely, 23 percent never experience it, 33 percent not applicable, 2 percent of respondents refused to answer or don’t know. 2. Barriers related to travelling by air: 10 percent of respondents experience it always, 9 percent experience it often, 15 percent experience it sometimes, 9 percent experience it rarely, 25 percent never experience it, 29 percent not applicable, 3 percent of respondents refused to answer or don’t know. 3. Barriers related to the use of taxis and ridesharing: 9 percent of respondents experience it always, 8 percent experience it often, 8 percent experience it sometimes, 7 percent experience it rarely, 25 percent never experience it, 38 percent not applicable, 4 percent of respondents refused to answer or don’t know. 4. Barriers related to the use of VIA Rail or interprovincial trains: 5 percent of respondents experience it always, 4 percent experience it often, 5 percent experience it sometimes, 4 percent experience it rarely, 20 percent never experience it, 55 percent not applicable, 7 percent of respondents refused to answer or don’t know. 5. Barriers related to using buses that cross borders: 5 percent of respondents experience it always, 3 percent experience it often, 4 percent experience it sometimes, 2 percent experience it rarely, 17 percent never experience it, 61 percent not applicable, 7 percent of respondents refused to answer or don’t know. 6. Barriers related to the use of ferries: 3 percent of respondents experience it always, 3 percent experience it often, 6 percent experience it sometimes, 5 percent experience it rarely, 22 percent never experience it, 57 percent not applicable, 5 percent of respondents refused to answer or don’t know. 7. Barriers related to the use of school transportation: 3 percent of respondents experience it always, 2 percent experience it often, 2 percent experience it sometimes, 2 percent experience it rarely, 17 percent never experience it, 70 percent not applicable, 4 percent of respondents refused to answer or don’t know.
In terms of subgroup differences:
Women are more likely than men to say they have experienced barriers to travel using municipal public transit, travelling by air, and train.
Regionally, respondents in Quebec, Ontario, and British Columbia are the most likely among all provinces and territories to say they have experienced barriers when using municipal public transit, taxis and ridesharing, travelling by air, and by train.
Barriers related to the use of municipal public transit seems to also be relatively high in Nova Scotia, as well as barriers to using ferries in British Columbia, and school transportation in Quebec. Those in the Territories are the most likely to say they have barriers when traveling by air, train, or bus to cross borders, due to a lack of accessibility. Respondents most likely to say they always experience barriers to travel by bus (that crossed borders) or municipal public transit are those with a speech disability, a developmental disability, or a learning disability; to travel by train or ferries are those with a language or developmental disability; to use school transportation are those with a developmental, speech or language disability; and to use taxis or ridesharing services are those with a dexterity or speech disability.
ICT-Related Barriers
Respondents were then asked if they had experienced barriers related to the use of information and communication technology:
Overall, one quarter to one third of respondents said these situations do not apply to them, and another third said they never experienced these barriers. However, over one in ten respondents said they always or often experienced a barrier when using self-service technology in a public place because it was not accessible for them (15%).
A similar proportion (14%) always or often experienced a barrier when watching a video on the internet (for example on YouTube, Facebook, other social media or websites) because it was not accessible, 12% when using a website that was not accessible to them, or to watch cable because it was not accessible (12%).
One in ten respondents said they experienced a barrier to using a wireless service (10%), or to watching a show on a streaming service such as Netflix, AppleTV, Crave, Amazon Prime, or a similar service (10%) because these were not accessible.
Figure 74: Persons with Disabilities – Barriers to Information and Communication Technology
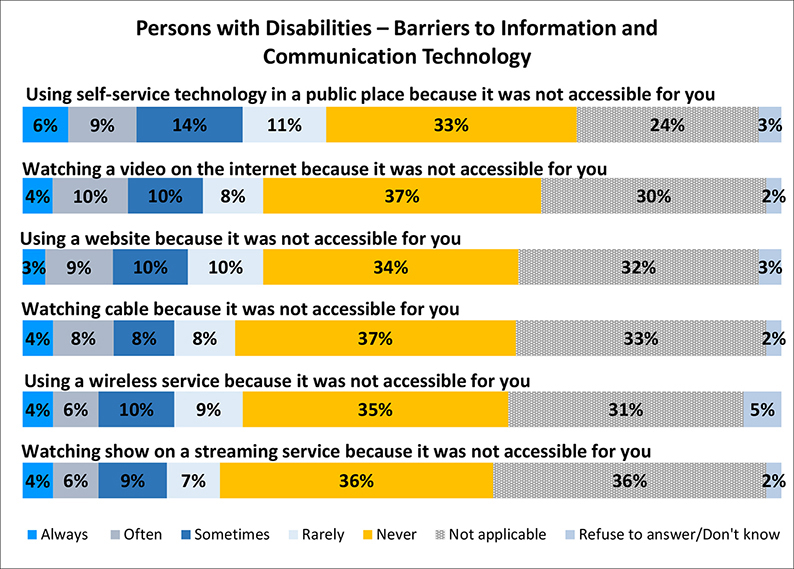
A figure depicts persons with disabilities experiences with barriers to information and communication technology
Description: The horizontal chart depicts persons with disabilities experiences with the barriers to information and communication technology. The data inferred is shown for six categories. 1. Using self-service technology in a public place because it was not accessible for you: 6 percent of respondents experience it always, 9 percent experience it often, 14 percent experience it sometimes, 11 percent experience it rarely, 33 percent never experience it, 24 percent not applicable, 3 percent of respondents refused to answer or don’t know. 2. Watching a video on the internet because it was not accessible for you: 4 percent of respondents experience it always, 10 percent experience it often, 10 percent experience it sometimes, 8 percent experience it rarely, 37 percent never experience it, 30 percent not applicable, 2 percent of respondents refused to answer or don’t know. 3. Using a website because it was not accessible for you: 3 percent of respondents experience it always, 9 percent experience it often, 10 percent experience it sometimes, 10 percent experience it rarely, 34 percent never experience it, 32 percent not applicable, 3 percent of respondents refused to answer or don’t know. 4. Watching cable because it was not accessible for you: 4 percent of respondents experience it always, 8 percent experience it often, 8 percent experience it sometimes, 8 percent experience it rarely, 37 percent never experience it, 33 percent not applicable, 2 percent of respondents refused to answer or don’t know. 5. Using a wireless service because it was not accessible for you: 4 percent of respondents experience it always, 6 percent experience it often, 10 percent experience it sometimes, 9 percent experience it rarely, 35 percent never experience it, 31 percent not applicable, 5 percent of respondents refused to answer or don’t know. 6. Watching show on a streaming service because it was not accessible for you: 4 percent of respondents experience it always, 6 percent experience it often, 9 percent experience it sometimes, 7 percent experience it rarely, 36 percent never experience it, 36 percent not applicable, 2 percent of respondents refused to answer or don’t know.
In terms of differences observed by income, gender, region and disability:
Respondents with household incomes under $20,000 are the most likely to say they always experience these types of barriers, while those with a household income of at least $40,000 are more likely to say they never experience these barriers.
Additionally, men are more likely than women to say they never experience these barriers.
Respondents in Quebec are the most likely to have experienced each of the barriers, followed by respondents in Nova Scotia and the Territories, where respondents are more likely to have experienced 5 out of the 6 barriers tested.
Respondents most likely to say they always or often experience ICT barriers are those with seeing, hearing, learning, developmental, communication, speech, and language disabilities. Specifically:
Respondents who are most likely to say they always face barriers to use a website that was not accessible for them are those with a language, speech, developmental, seeing or hearing disability;
Respondents who are most likely to say they always face barriers to use a wireless service are those with a language, developmental, communication, speech, or hearing disability;
Respondents who are most likely to say they always face barriers to use a self-service technology in a public space are those with a language, visual, dexterity, speech or developmental disability;
Respondents who are most likely to say they always face barriers to watch cable are those with a hearing, developmental, language, visual or speech disability;
Respondents who are most likely to say they always face barriers to watch a show on a streaming service are those with a language, speech, or developmental disability;
Respondents who are most likely to say they always face barriers to watch a video in the internet are those with a language, hearing, communication or speech disability.
Barriers Related to Program and Service Delivery
Respondents were also asked how often they encounter barriers when accessing programs or services from a government or from a company or an organization. Nearly one fifth of respondents (19%) say they always (6%) or often (13%) experience a barrier that impacted the accessibility of a program or service provided by a company, while 17% say they always (6%) or often (11%) experience a barrier that impacted the accessibility of a government program or service.
Figure 75: Persons with Disabilities – Barriers to Program and Service Delivery
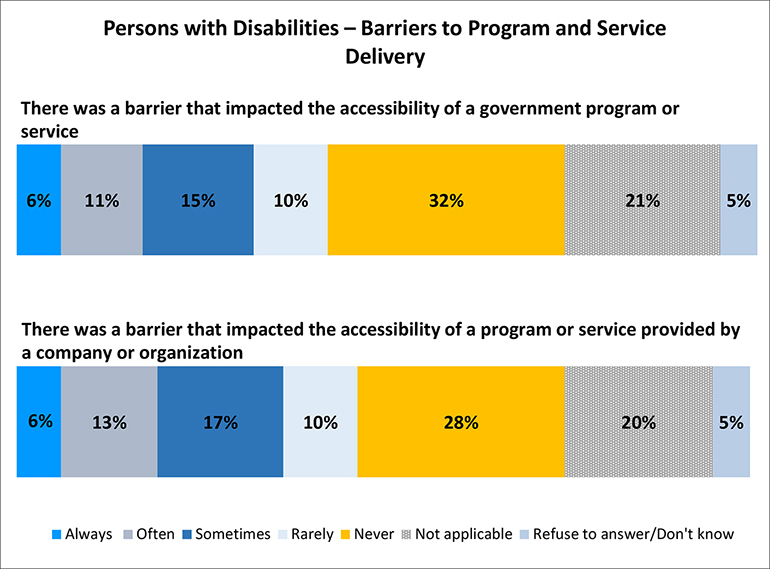
A figure depicts persons with disabilities experiences with barriers to program and service delivery
Description: The horizontal chart depicts persons with disabilities experiences with the barriers to program and service delivery. The data inferred is shown for two categories. 1. There was a barrier that impacted the accessibility of a government program or service: 6 percent of respondents experience it always, 11 percent experience it often, 15 percent experience it sometimes, 10 percent experience it rarely, 32 percent never experience it, 21 percent not applicable, 5 percent of respondents refused to answer or don’t know. 2. There was a barrier that impacted the accessibility of a program or service provided by a company or organization: 6 percent of respondents experience it always, 13 percent experience it often, 17 percent experience it sometimes, 10 percent experience it rarely, 28 percent never experience it, 20 percent not applicable, 5 percent of respondents refused to answer or don’t know.
From a subgroup perspective, the following differences were noted:
The younger respondents are, and the lower the household income bracket is, the more likely respondents are to say they experience these barriers.
In addition, men are more likely than women to say they never experience these barriers.
The frequency of experiencing these barriers is higher among respondents in the Territories, Nova Scotia and British Columbia.
Respondents most likely to say they always experience a barrier that impacted the accessibility of a government program or service are those with a language, speech, developmental, communication, hearing, or learning disability; or a barrier to access a program or service provided by a company or organization are those with a language, communication, development, speech, hearing or learning disability.
Accessing Information, Initiatives and Programs Related to Removing Barriers and Increasing Accessibility (Persons with Disabilities)
When respondents with a disability were asked if they had tried to access any information on government programs or services related to accessibility or disability over the past 12 months, 42% said they have tried to access this type of information.
Figure 76: Persons with Disabilities – Tried to Access Information on Government Programs/Services
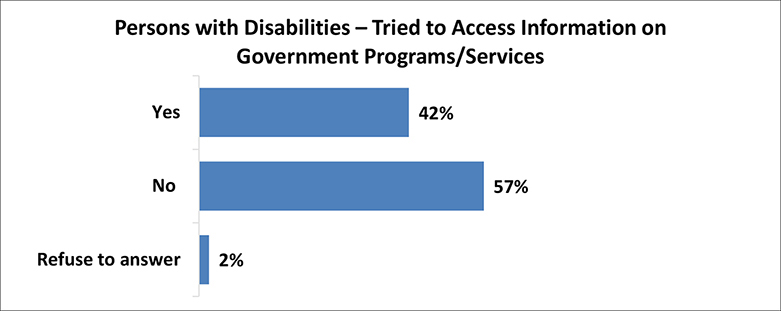
A figure depicts the percentage of persons with disabilities who tried to access information on government programs or services
Description: The horizontal bar graph depicts the percentage of persons with disabilities who tried accessing information on government programs or services. The percent of persons who answered Yes - 42 percent, No - 57 percent, Refused to answer - 2 percent.
Subgroups differences are noted as follows:
The younger respondents are the more likely they are to say they have tried to access this information.
Women are more likely than men to say they have tried to access this information (43% vs. 38%).
Regionally, respondents most likely to say they have tried to access information on government programs and services are those in British Columbia (50%), the Territories (47%), and Alberta (48%), followed by respondents in Ontario (44%), Manitoba (43%) and Nova Scotia (41%).
Among those who have tried to access information on government programs and services, over half (59%) said it was difficult to find this kind of information (22% very difficult, 37% difficult), while 14% said it was easy (3% very easy, 11% easy), and 25% said it was neither easy nor difficult.
While sample sizes become too small when analyzing results regionally, respondents in Quebec are still the most likely to say it was difficult to find this information (68%).
Figure 77: Persons with Disabilities – Ease of Finding Information on Government Programs/Services

A figure depicts the level of ease to find information on government programs or services by persons with disabilities
Description: The horizontal bar graph depicts the level of ease to find information on government programs or services by persons with disabilities. The data inferred is as follows: For 22 percent of respondents it was very difficult, for 37 percent it was difficult, for 25 percent it was neither easy nor difficult, for 11 percent it was easy, for 3 percent it was very easy, 1 percent of respondents refused to answer or don’t know.
Respondents who had tried to access any information on any government programs or services related to accessibility or disability over the past 12 months were asked the regional jurisdiction of the information and the name(s) of the program(s) or service(s).
Overall, most programs were provincial or territorial (69%), followed by federal (57%), and municipal (36%). Respondents in Manitoba were the most likely to say they looked for provincial programs.
Figure 78: Persons with Disabilities – Type of Program or Service
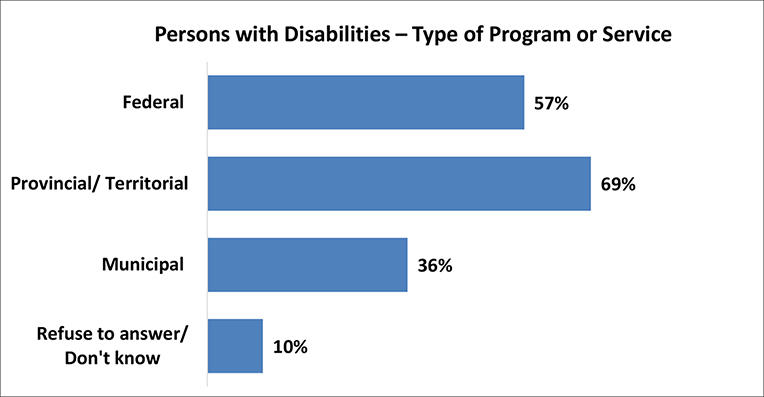
A figure depicts the type of program or service persons with disabilities tried to access
Description: The horizontal bar graph depicts the different types of programs or services persons with disabilities tried to access. The data inferred is as follows: Federal - 57 percent of respondents, Provincial or territorial - 69 percent, municipal - 36 percent, Respondents who refused to answer or don’t know - 10 percent.
When filtering the data for respondents that indicated the type of programs were difficult to find, 73% of respondents said it was a provincial or territorial program, 61% a federal program, and 40% a municipal program.
Respondents in Alberta are the most likely to say the information that was difficult to find was related to a federal program or service.
Figure 79: Persons with Disabilities – Type of Program or Service that Was Difficult to Find
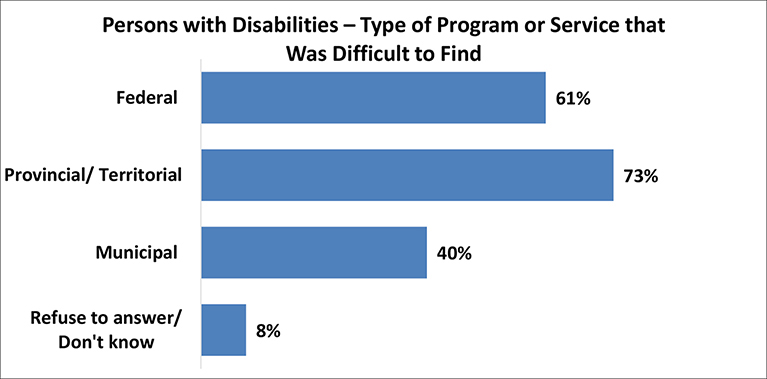
A figure depicts the type of program or service that persons with disabilities had difficulty with
Description: The horizontal bar graph depicts the different types of programs or services that persons with disabilities had difficulty with. The data inferred is as follows: Federal - 61 percent of respondents, Provincial or territorial - 73 percent, municipal - 40 percent, Respondents who refused to answer or don’t know - 8 percent.
Nearly half (49%) of respondents remembered the name of the programs they looked for information and was difficult to find it. The most remembered programs that were difficult to find include the CRA disability tax credits (DTC) by 7% of survey participants, the Canada Pension Plan Disability Benefit (3%), the Ontario Disability Support Program (2%), among others.
Figure 80: Persons with Disabilities – Remember the Name of Programs/Services
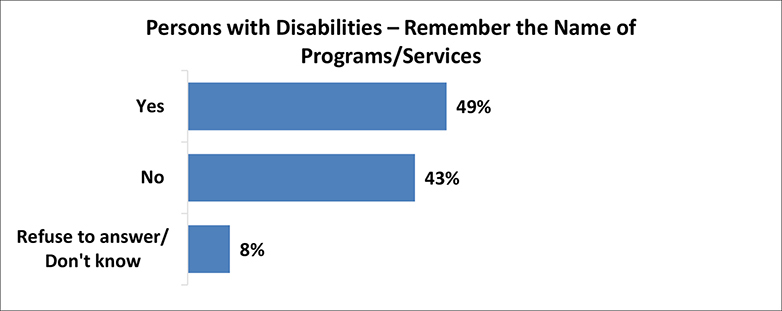
A figure depicts the percentage of persons with disabilities who remember the name of a program or service
Description: The horizontal bar graph depicts the percentage of persons with disabilities who remember and do not remember the names of programs or services. The data inferred is as follows: Respondents who answered yes - 49 percent, no - 43 percent, Refused to answer or don’t know - 8 percent.
The training and conduct of Government of Canada employees was explored. Respondents were specifically asked if more or less needs to be done in terms of Government of Canada employees providing equal access to services and programs to people with different disabilities, including communication disabilities.
Nearly 7 in 10 respondents (69%) believe more needs to be done in this area, of which 44% believe “much more” needs to be done. Most of the remaining respondents did not know if more or less needed to be done.
Figure 81: Persons with Disabilities – Effort Needed by Government in Providing Equal Access to People with Disabilities
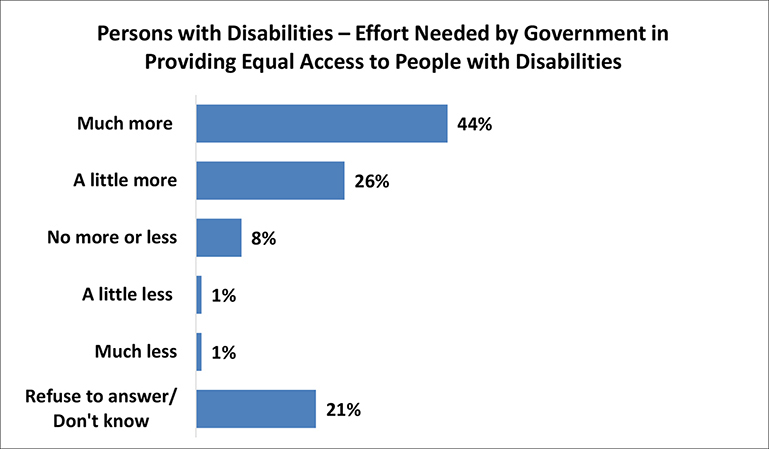
A figure depicts the level of efforts needed by the government in providing equal access to persons with disabilities
Description: The horizontal bar graph depicts the efforts needed by the government to provide equal access to persons with disabilities. The data inferred is as follows: 44 percent of respondents with disabilities believe that much more effort is needed, 26 percent believe a little more effort is needed, 8 percent believe that no more or less effort is needed, 1 percent believe that a little less effort is needed, 1 percent believe that much less effort is needed. 21 percent of respondents refused to answer or didn’t know.
From a subgroup perspective, the following differences were noted:
The younger respondents are the more likely they are to say much more needs to be done in this regard (18-34 years old – 53%, 35-64 years old – 46%, 65 years old or more – 35%).
Women are more likely than men to say much more needs to be done (46% vs. 37%).
As the household income decreases, the feeling that much more needs to be done by government increases.
Respondents more likely to be inclined to believe much more needs to happen in this area are located in Manitoba (54%), Ontario (46%), Alberta (46%), and British Columbia (44%).
Disabilities Equipment, Aids or Support Used
Nearly two thirds (63%) of persons with disabilities use equipment, aids or supports to help them perform their daily activities.
As age increases, so does the use of these aids. Conversely, as household income decreases, the use of aids and supports increases. Men are more likely than women to say they use equipment, aids or supports.
Figure 82: Persons with Disabilities – Equipment, Aids or Support Used
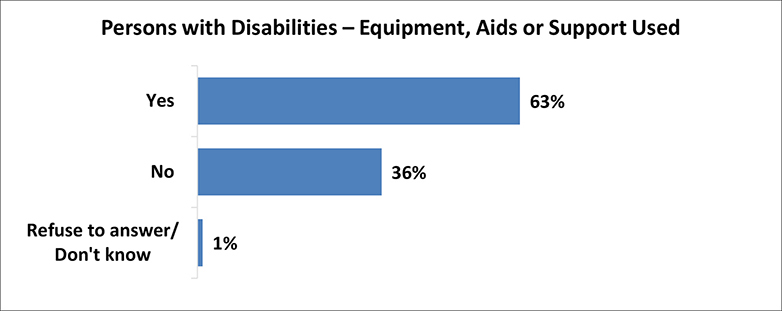
A figure depicts the percentage of persons with disabilities who use equipment, aids or support
Description: The horizontal bar graph depicts the survey results of the persons with disabilities who use equipment, aids or support for their daily activities. The data inferred is as follows: Persons who answered Yes - 63 percent, No - 36 percent, Refused to answer or don’t know - 1 percent.
The most common aids used are a cane or a walker, or a wheelchair / mobility scooter, as reported by 32% of respondents respectively. Over one fifth (21%) report using a hearing aid.
Less than 10% of respondents use other supports such as a social worker or a specific person (9%), a screen reader (7%), or glasses (6%), braces for legs, knees or ankles (5%), a smartphone or tablet (5%), or a service dog (5%).
Less than 5% use a sign language interpreter, a white cane, railings or other physical supports, air purifier or filtering mask, a magnifying glass or magnifier, medication in general, or crutches, among others.
Figure 83: Persons with Disabilities – Types of Equipment, Aids or Support Used
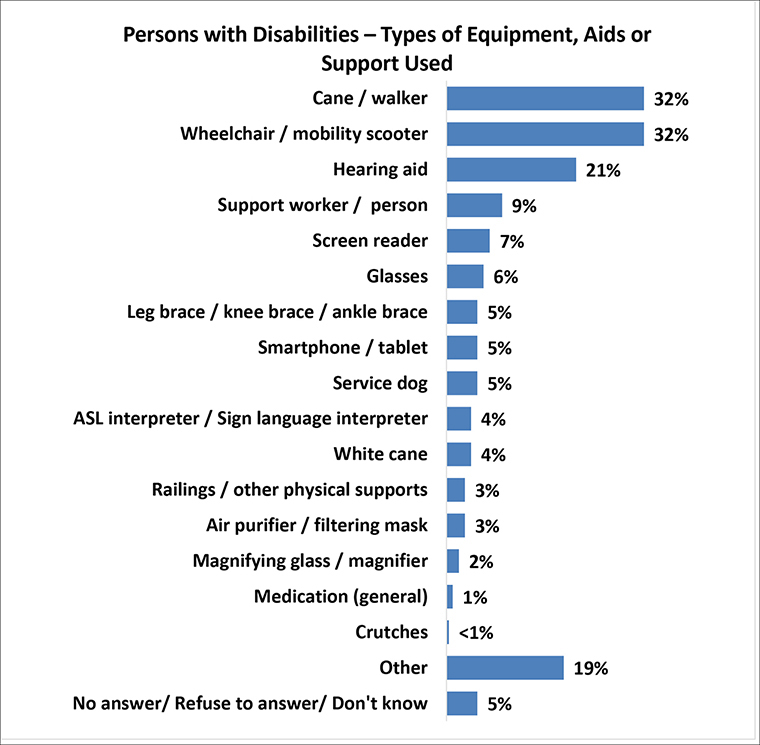
A figure depicts the different types of equipment, aids or support used by persons with disabilities
Description: The horizontal bar graph depicts the equipment or aids used by persons with disabilities. The different aids and the percentage of respondents using it are as follows: Cane or walker - 32 percent, Wheelchair or mobility scooter - 32 percent, hearing aid - 21 percent, support worker or person - 9 percent, screen reader - 7 percent, glasses - 6 percent, leg brace or knee brace or ankle brace - 5 percent, smartphone or tablet - 5 percent, service dog - 5 percent, ASL interpreter or sign language interpreter - 4 percent, white cane - 4 percent, railing or other physical supports - 3 percent, air purifier or filtering mask - 3 percent, magnifying glass or magnifier - 2 percent, medication (general) - 1 percent, crutches - less than 1 percent, other aids - 19 percent, respondents who did not answer or refused to answer or don’t know - 5 percent.
In terms of group differences, the following were noted:
Respondents 65 years old or older are more likely to use a cane or a walker, compared to respondents 18 to 64 years old (44% vs. 27%), as well as hearing aids (31% vs. 16%).
Those between 18 and 64 years old are more likely to say they use sign language, compared to respondents 65 years or older (6% vs. 1%).
Women are more likely than men to say they use a cane or walker (35% vs. 26%), railings or air purifiers (4% vs. 1% respectively).
Overall, household income does not appear to have an impact on the type of equipment used, except for the Cochlear implant and a hearing aid; those with a household income of at least $40,000 are more likely than those with a lower household income to use a hearing aid (19% vs. 14%), or to have a Cochlear implant (4% vs. 1%).
Communicating with Others
Persons with disabilities were asked the level of difficulty they had communicating with others in different situations:
Nearly four in five respondents say they find communicating very easy, easy or neither easy nor difficult; however, 23% of respondents have difficulty (rated “very difficult” or “difficult”) communicating over the phone, and 22% have difficulty writing down information.
In addition, over one in ten say it is difficult for them to communicate in person or face to face (16%), read and understand written materials (14%), or communicate over the Internet (13%).
Figure 84: Persons with Disabilities – Difficulty Communicating
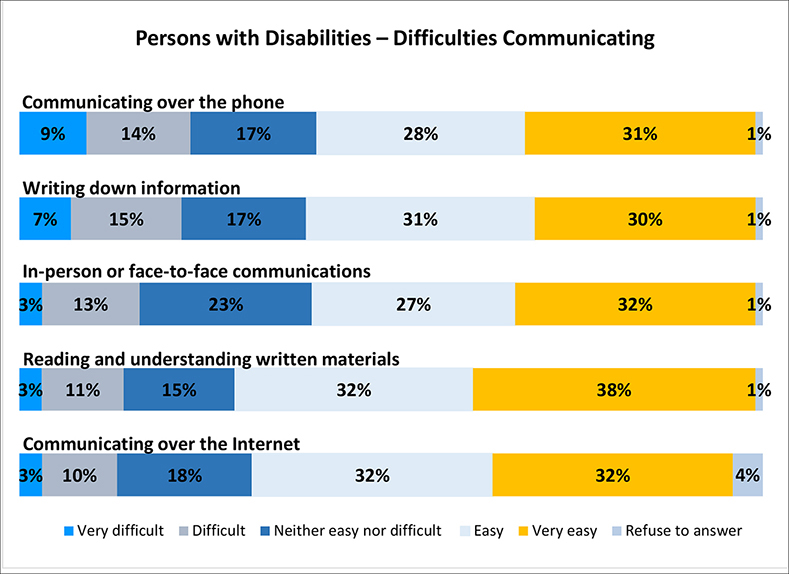
A figure depicts different situations that are difficult to communicate in for persons with disabilities
Description: The horizontal chart depicts the level of difficulty for different types of communication for persons with disabilities. The data inferred for five types of communications are shown. 1. Communicating over the phone: 9 percent of respondents find it very difficult, 14 percent find it difficult, 17 percent say it is neither easy nor difficult, 28 percent find it easy, 31 percent find it very easy, 1 percent of respondents refused to answer. 2. Writing down information: 7 percent of respondents find it very difficult, 15 percent find it difficult, 17 percent say it is neither easy nor difficult, 31 percent find it easy, 30 percent find it very easy, 1 percent of respondents refused to answer. 3. In-person or face-to-face communications: 3 percent of respondents find it very difficult, 13 percent find it difficult, 23 percent say it is neither easy nor difficult, 27 percent find it easy, 32 percent find it very easy, 1 percent of respondents refused to answer. 4. Reading and understanding written materials: 3 percent of respondents find it very difficult, 11 percent find it difficult, 15 percent say it is neither easy nor difficult, 32 percent find it easy, 38 percent find it very easy, 1 percent of respondents refused to answer. 5. Communicating over the internet: 3 percent of respondents find it very difficult, 10 percent find it difficult, 18 percent say it is neither easy nor difficult, 32 percent find it easy, 32 percent find it very easy, 4 percent of respondents refused to answer.
In terms of group differences:
respondents 18 to 64 years old are more likely than respondents at least 65 years old to say that is difficult to communicate over the phone (23% vs. 18%), write down information (23% vs. 17%), communicate in person or face to face (18% vs. 10%), and read and understand written materials (15% vs. 11%).
Respondents with a household income under $40,000 are more likely than those with higher income to say all of these tasks are difficult.
Respondents who have most difficulty communicating in general include those with a learning, developmental, memory, communication, speech and language disabilities.
In addition to these subgroups, respondents with a hearing or a mental health-related disability also have difficulty communicating in person (face to face) or over the phone, and those with a visual disability also have difficulty communicating over the internet, reading and understanding written materials, or writing down information.
Experience as a Caregiver or Legal Guardian
When respondents with a disability were asked if they were the caregiver or legal guardian of another person with a disability, 70% responded they are not, while 15% were in the past but not currently, and 13% are caring for someone else.
Results do not differ much for the general population, among whom 74% say they are not caregivers or legal guardians of a person with a disability, 14% say they were in the past, and 12% say they are currently taking care of someone with a disability.
Figure 85: Persons with Disabilities – Caregiver/Legal Guardian of a Person with a Disability
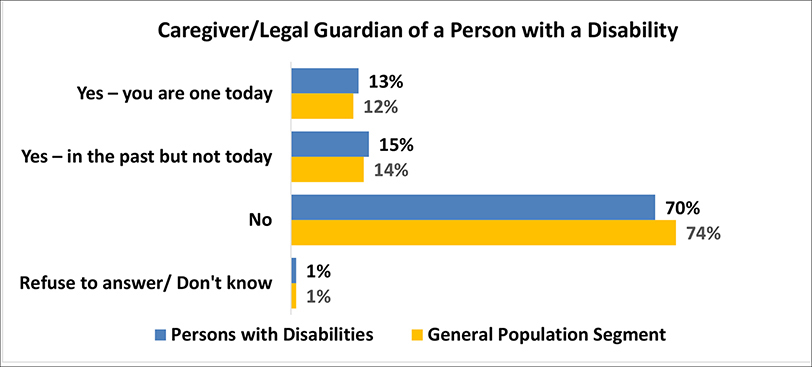
A horizontal chart depicts a comparison of responses from the general population and persons with disabilities who are, or were, the caregiver of a person with a disability
Description: The horizontal double bar graph depicts the details of those who are caregivers of persons with disabilities. Each set of two bars represent the percentage of caregivers who belong to the persons with disabilities and the general population segments, respectively. The data inferred is as follows: The percentage of persons with disabilities who are caregivers in the present is 13 percent, who were caregivers in the past is 15 percent, who were not caregivers is 70 percent, the percentage of persons with disabilities who refused to answer or don’t know is 1 percent. The percentage of the general population who are caregivers in the present is 12 percent, who were caregivers in the past is 14 percent, who were not caregivers is 74 percent, the percentage of the general population who refused to answer or don’t know is 1 percent.
Subgroup differences among persons with disabilities show that:
Women are more likely to be a caregiver than men (15% vs. 10%).
Respondents living in a household income of at least $20,000 are more likely to be a caregiver, compared to those with a household income under $20,000 (14% vs. 9%).
Regionally, respondents who are caregivers or legal guardians of a person with a disability are most likely to be located in New Brunswick, Nova Scotia, Manitoba and Ontario, compared to other regions.
Respondents from the general population taking care of someone with a disability are more likely to be at least 35 years old (12% vs. 4% under 35), and women (16% vs. 8% of men).
Frequency of Interaction with Someone with a Disability
In addition to taking care of a person with a disability, respondents without a disability were asked how often they had interacted with a person with a disability. Over 4 in 5 respondents interact with someone with a disability (86%), among whom 21% do so on a daily basis; one third (34%) do so regularly, from every few days, to a few times a month; and one third (33%) do so rarely.
Respondents in Quebec are the most likely to say they never interact with a person with a disability, compared to other regions.
Figure 86: General Population – Interaction with a Person with a Disability
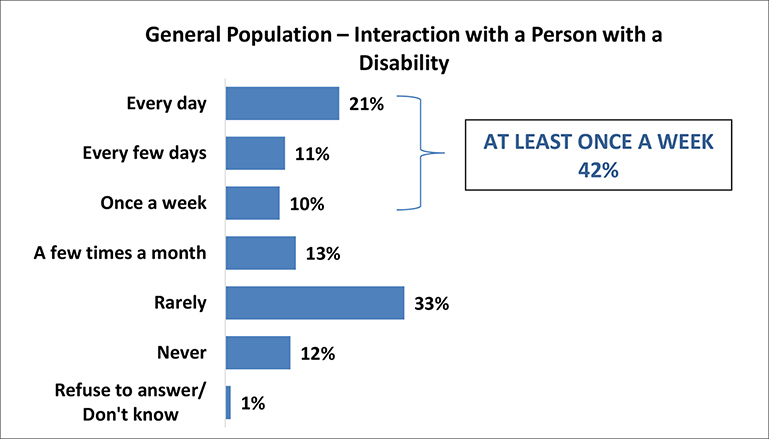
A figure depicts the frequency of interactions the general population has with persons with disabilities
Description: The horizontal bar graph depicts the level of interactions the general population has with persons with disabilities. The data inferred from the graph is as follows: The percentage of the general population who interact every day with the persons with disabilities is 21 percent, who interact every few days is 11 percent, who interact once a week is 10 percent, who interact a few times a month is 13 percent, who rarely interact is 33 percent, who never interact is 12 percent, the percentage of the general population who refused to answer or don’t know is 1 percent. Also, the general population, who interact with persons with disabilities at least once a week is 42 percent.
The Accessible Canada Act
Over two in five survey participants with disabilities (41%) said they are aware of the Government of Canada’s Accessible Canada Act and its purpose.
Figure 87: Awareness of BillC-81: The Accessible Canada Act
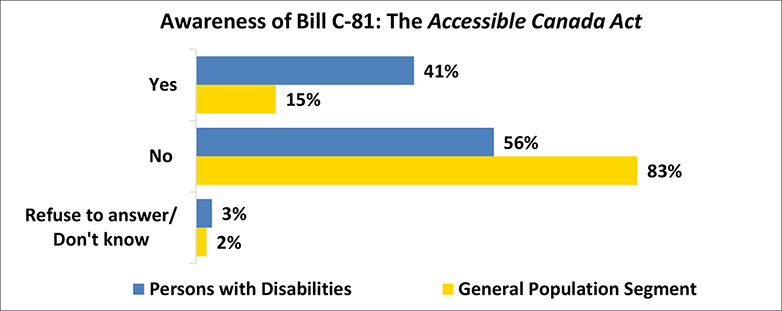
A figure depicts a comparison of responses from the general population and persons with disabilities who are aware of the Accessible Canada Act
Description: The horizontal double bar graph depicts comparison of the awareness of the Accessible Canada Act by persons with disabilities and the general population. Each set of two bars represent the awareness of persons with disabilities and the general population segments, respectively. The data inferred is as follows: persons with disabilities who are aware of the Act is 41 percent, not aware of the Act is 56 percent, 3 percent refused to answer or don’t know. The general population who are aware of the Act is 15 percent, who are not aware of the Act is 83 percent, 2 percent refused to answer or don’t know.
Subgroup differences noted among persons with disabilities are as follows:
Respondents under 65 years old are more likely than older respondents to be aware of this Bill (43% vs. 33%).
Respondents with a household income of at least $80,000 are more likely than respondents with a household income under $80,000 to be aware of this Bill (48% vs. 37%).
Awareness of Bill C-81 is highest among respondents with a disability in Manitoba (47%), British Columbia (47%), the Territories (45%), and Ontario (45%).
Awareness is much lower among those in the general population, where results show that 15% of respondents are aware of Bill C-81: the Accessible Canada Act.
Respondents in the general population with a household income of at least $80,000 are more likely to be aware of the Bill, compared to those with a household income under $20,000 (16% vs. 7%). Awareness is also highest in Ontario (21%).
Respondents with a disability who were aware of the Bill were asked what they remembered about it. Results show that:
Nearly two fifths said they remember the Act will support people with disabilities (17%), or that the Act will increase accessibility (17%).
Nearly one in ten mentioned remembering the Act will make government services accessible (12%), that the legislation lacked scope (10%), that the government had announced or passed the legislation (9%), that the Act recognized sign language as an official language (8%), and that it ensured a barrier-free Canada (8%).
A variety of other responses were provided, all details are listed in the following graph.
Figure 88: Persons with Disabilities – Recall of Details about Bill C-81
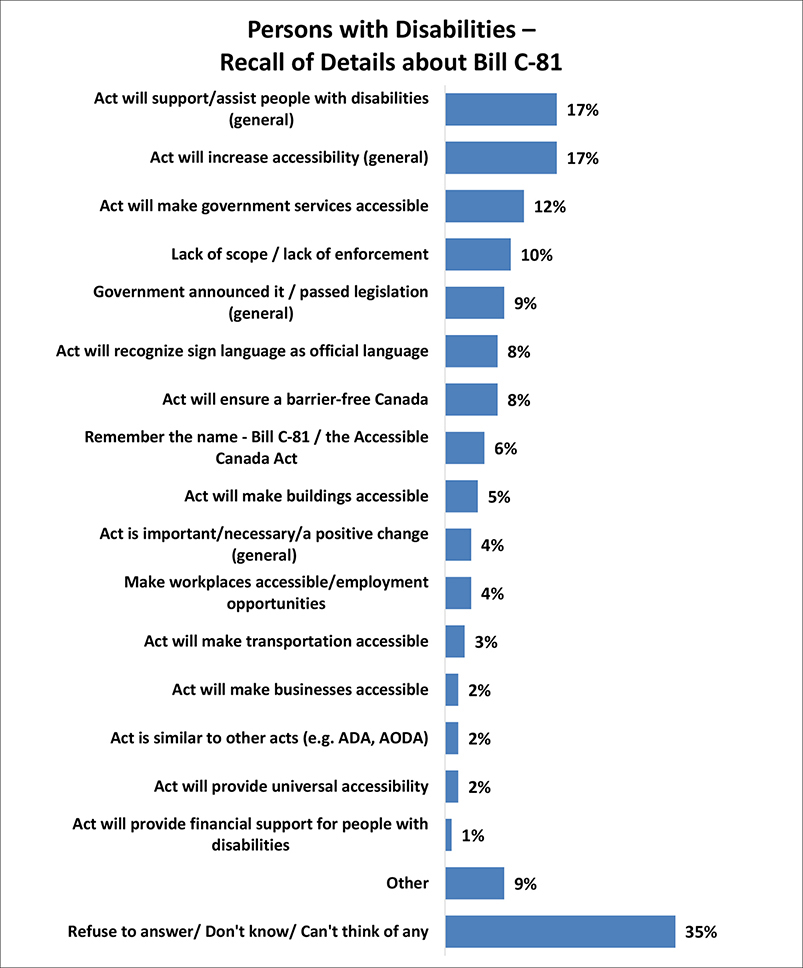
A figure depicts the details about Bill C-81 recalled by persons with disabilities
Description: The horizontal bar graph shows the details about Bill C-81 recalled by persons with disabilities. The details and the percentage of respondents who recalled it are as follows: Act will support or assist people with disabilities (general) - 17 percent, Act will increase accessibility (general) - 17 percent, Act will make government services accessible - 12 percent, Lack of scope or lack of enforcement - 10 percent, Government announced it or passed legislation (general) - 9 percent, Act will recognize sign language as official language - 8 percent, Act will ensure a barrier-free Canada - 8 percent, Remember the name - Bill C-81/ the Accessible Canada Act - 6 percent, Act will make buildings accessible - 5 percent, Act is important or necessary or a positive change (general) - 4 percent, Make workplaces accessible or employment opportunities - 4 percent, Act will make transportation accessible - 3 percent, Act will make businesses accessible - 2 percent, Act is similar to other acts (example ADA, AODA) - 2 percent, Act will provide universal accessibility - 2 percent, Act will provide financial support for people with disabilities - 1 percent, other - 9 percent, respondents who refused to answer or don’t know or can’t think of any is 35 percent.
In terms of subgroup differences for persons with disabilities, the following are noted:
Respondents 18 to 64 years old are more likely than respondents 65 years old or older to remember seeing the Act will recognize sign language as an official language (10% vs. 5%).
Women are more likely than men to remember:
seeing the Act and said it will support or assist people with disabilities (19% vs. 13%),
that the Act said it will make workplaces accessible, and
that it will provide employment opportunities for people with disabilities (5% vs. 3%).
Regionally, respondents in Alberta are the most likely to remember that the Act will increase accessibility (21%), and that the Act will make government services accessible (15%).
Respondents in Ontario and British Columbia are the most likely to say they remember there is a lack of scope and lack of enforcement (12% and 13% respectively), and that the government announced or passed the legislation (11% and 10% respectively).
Other regional results should be analyzed with caution due to the small sample sizes of some groups.
Of the few respondents from the general population who are aware of the Act (198 respondents), the following items were remembered:
The Act will support or assist people with disabilities (20%).
The Act will increase accessibility in general (16%).
The government announced or passed the legislation (10%).
The name of the Bill itself (7%).
All other responses were noted by no more than 4% of respondents as detailed in the following graph.
Since 198 individuals could recall the Bill, the sample sizes for subgroups among the general population are too small to consider statistically meaningful comparisons. As such, subgroup analysis of follow-up questions regarding the Bill are not presented.
Figure 89: General Population – Recall of Details about Bill C-81
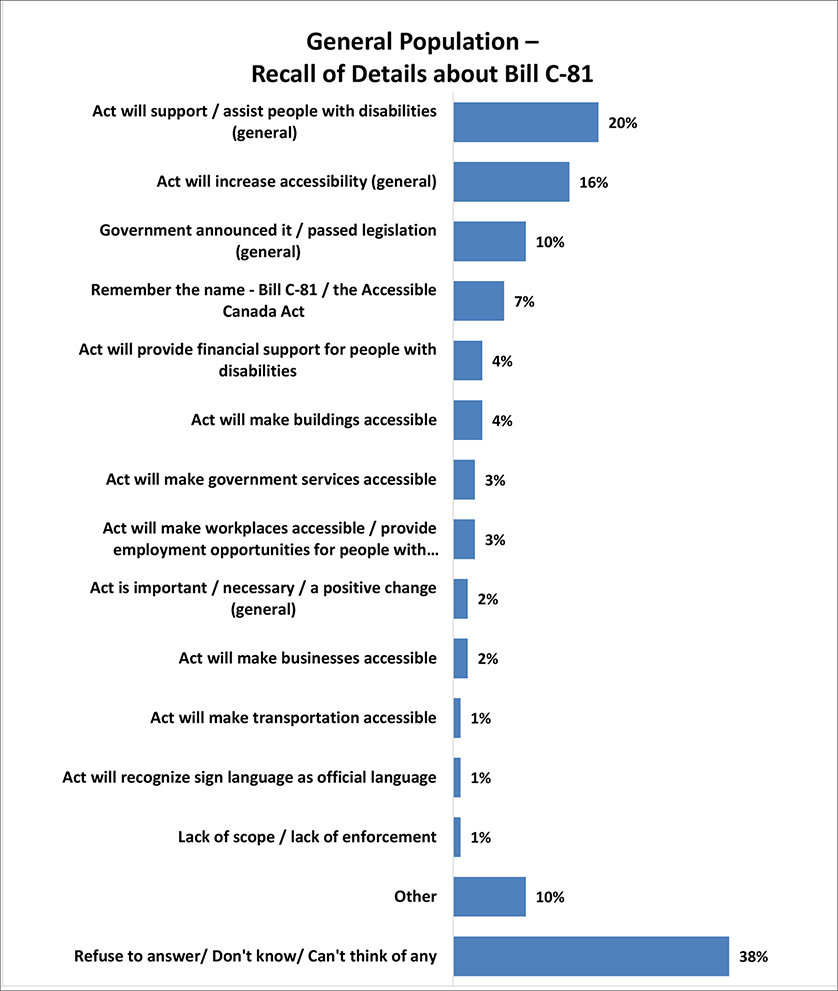
A figure depicts the details about Bill C-81 as recalled by the general population
Description: The horizontal bar graph shows the details about Bill C-81 recalled by the general population. The details and the percentage of the general population who recalled it are as follows: Act will support or assist people with disabilities (general) - 20 percent, Act will increase accessibility (general) - 16 percent, Government announced it or passed legislation (general) - 10 percent, Remember the name - Bill C-81/ the Accessible Canada Act - 7 percent, Act will provide financial support for people with disabilities - 4 percent, Act will make buildings accessible - 4 percent, Act will make government services accessible 3 percent, Act will make workplace accessible or provide employment opportunities for people with - 3 percent, Act is important or necessary or a positive change (general) - 2 percent, Act will make business accessible - 2 percent, Act will make transportation accessible - 1 percent, Act will recognize sign language as official language - 1 percent, Lack or scope or lack of enforcement - 1 percent, other - 10 percent, respondents who refused to answer or don’t know or can’t think of any is 38 percent.
Awareness of Provincial, Territorial and Municipal Legislation, Policies and Programs
Nearly half of persons with disabilities believe their province or territory (45%) or their municipality (45%) has accessibility legislation, policies or programs.
Over a third of respondents do not know if this type of legislation exists at a provincial/territorial level (34%), or at a municipal level (36%).
Figure 90: Knowledge of Regional Laws, Programs or Strategies
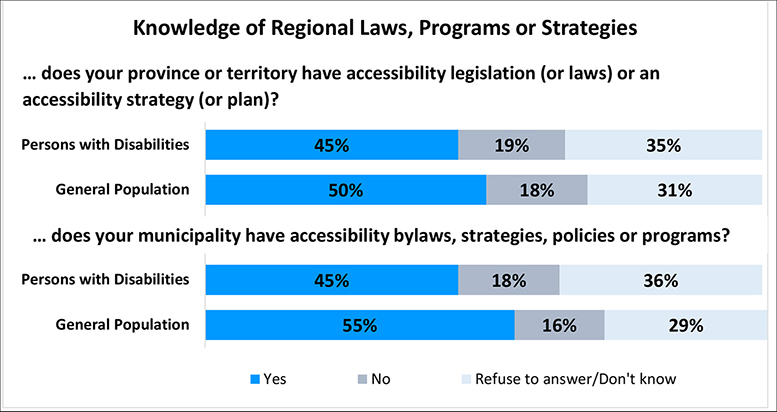
A figure depicts the knowledge of regional laws or strategies in comparison with persons with disabilities and the general population
Description: The horizontal stacked bar graph depicts the survey results for the two questions posed to persons with disabilities and the general population. The first question is “Does your province or territory have accessibility legislation (or laws) or an accessibility strategy (or plan).” Persons with disabilities who answered yes is 45 percent, who answered no is 19 percent, who refused to answer or don’t know is 35 percent. The general population who answered yes is 50 percent, who answered no is 18 percent, who refused to answer or don’t know is 31 percent. The second question is “Does your municipality have accessibility bylaws, strategies, policies or programs.” Persons with disabilities who answered yes is 45 percent, who answered no is 18 percent, who refused to answer or don’t know is 36 percent. The general population who answered yes is 55 percent, who answered no is 16 percent, who refused to answer or don’t know is 29 percent.
The following subgroup differences for persons with disabilities were noted:
Regionally, awareness of provincial/territorial accessibility legislation or an accessibility strategy is highest in Ontario (63%), Manitoba (62%), and Nova Scotia (52%), compared to other provinces and territories.
At the municipal level, awareness is highest among respondents in Ontario (57%), Manitoba (49%), and Alberta (46%).
Respondents in Quebec are the most likely to say there are no such regulations (41% in the province and 40% at the municipal level).
Respondents with a household income of at least $40,000 seem to be more aware of the existence of regional legislation related to accessibility, compared to those with lower income.
Those at least 65 years old are more likely to be aware of municipal legislation in this area, compared to younger respondents (50% vs. 43%).
As for the general population, half (50%) believe their province or territory have accessibility legislation, policies or programs, while 55% believe their municipality has accessibility bylaws, strategies, policies or programs.
Nearly a third of respondents do not know if this type of legislation exists at a provincial/territorial level (31%), or at a municipal level (29%).
From a subgroup perspective, the following differences for the general population are noted:
Knowledge of provincial laws related to accessibility is highest among respondents in Ontario (61%), Atlantic Canada (52%), and Alberta (52%).
Respondents most likely to believe their municipality has accessibility by-laws are in Ontario (64%), Atlantic Canada (57%), and Alberta (62%).
Respondents in Quebec are the most likely to say there are no such regulations in their province (38%), or municipality (33%).
Respondents with a household income of at least $40,000 seem to be more aware of the existence of regional legislation related to accessibility, compared to those with lower income.
Awareness of municipal and provincial/territorial accessibility (by)laws, strategies, policies or programs is highest among respondents 35 to 64 years old and 65 years old and older, compared to respondents 18 to 34 years old (58% vs. 40%).