Government of Canada 2019 Pilot Public Opinion Research Survey on Accessibility
Employment and Social Development Canada
October 2019
Executive Summary
Prepared for:
Employment and Social Development Canada
Supplier Name: Quorus Consulting Group Inc.
Contract Award Date: June 19, 2018
Delivery Date: October 2019
Contract Amount (incl. HST): $149,955.97
Contract #: G9292-191234/001/CY
POR Number: 012-18
For more information, please contact:
nc-por-rop-gd@hrsdc-rhdcc.gc.ca
Ce rapport est aussi disponible en français.
Copyright Page
Government of Canada 2019 Pilot Public Opinion Research Survey on Accessibility
This publication is available for download at canada.ca/publicentre-ESDC.
It is available upon request in multiple formats (large print, MP3, braille, audio CD, e-text CD, DAISY or accessible PDF), by contacting 1 800 O-Canada (1-800-622-6232).
By teletypewriter (TTY), call 1-800-926-9105.
© Her Majesty the Queen in Right of Canada, 2019
For information regarding reproduction rights: droitdauteur.copyright@HRSDC-RHDCC.gc.ca.
Cat. No. : Em4-24/2019E-PDF
ISBN: 978-0-660-32678-8
ESDC
Cat. No. : POR-107-12-19E
Projet pilote de recherche sur l’opinion publique sur l’accessibilité réalisé par le gouvernement du Canada en 2019
Vous pouvez télécharger cette publication en ligne sur le site canada.ca/publicentre-EDSC
Ce document offert sur demande en médias substituts (gros caractères, MP3, braille, audio sur DC, fichiers de texte sur DC, DAISY, ou accessible PDF) auprès du 1 800 O-Canada (1-800-622-6232).
Si vous utilisez un téléscripteur (ATS), composez le 1-800-926-9105.
© Sa Majesté la Reine du Chef du Canada, 2019
Pour des renseignements sur les droits de reproduction : droitdauteur.copyright@HRSDC-RHDCC.gc.ca
Nº de cat. : Em4-24/2019E-PDF
ISBN : 978-0-660-32679-5
EDSC
Nº de cat. : POR-107-12-19F
Political Neutrality Certification
I hereby certify as Senior Officer of Quorus Consulting Group Inc. that the deliverables fully comply with the Government of Canada political neutrality requirements outlined in the Policy on Communications and Federal Identity and the Directive on the Management of Communications - Appendix C.
Specifically, the deliverables do not include information on electoral voting intentions, political party preferences, standings with the electorate or ratings of the performance of a political party or its leaders.
Signed:

Rick Nadeau, President
Quorus Consulting Group Inc.
Table of Contents
Table of Figures
Figure 1: Incidence of Persons with Disabilities
Figure 2: Regional Quotas for General Population Interviews
Figure 4: Comparing Survey Sample with Population Distribution
Figure 5: Dialing Disposition Report for the General Population Segment
Executive Summary
Overview – Background and Methodology
In 2018, Employment and Social Development Canada (ESDC)’s Accessibility Secretariat commissioned a study to measure Canadians’ awareness and experience(s) with accessibility and disability issues. The results of the survey will be used primarily to track progress for Canadians in the implementation of the Accessible Canada Act and becoming a Canada without barriers.
The scope of the study involved two key population segments: persons with disabilities and members of the general population (i.e. individuals who do not have a disability). An Instrument was developed to identify people with disabilities specifically for the purpose of this public opinion research. While some of the wording for some of the questions used was borrowed from the Disability Screening Questions (DSQ) of the 2017 Canadian Survey on Disability, the instrument is completely different from the DSQ and does not pretend to replicate it in any way. Questions on difficulty with certain activities along with questions about how these difficulties limit people in their everyday lives were used to screen respondents into the disability segment of the survey. The study focused on accessibility and not the degree a person’s disability limits their daily activities.
The data collection approaches used for each segment can be summarized in the following ways:
General Population
A total of 1,350 telephone interviews with Canadians, 18 years of age and older.
The sample consisted of traditional wireline telephone numbers and a sub-quota of cell phone-only households.
The margin of error of this sample size is +/− 2.7%, 19 times out of 20.
Data was weighted by region, gender, and age to ensure that the final distributions within the final sample mirror those of the Canadian population according to the latest Census data.
Persons with Disabilities
A total of 2,456 surveys were completed with persons with disabilities at least 18 years of age, of which 666 were completed by telephone, 1,788 were completed online and 2 were completed by respondents who submitted a hardcopy version of the questionnaire or completed and emailed an electronic version of the questionnaire.
Nearly all surveys completed over the telephone (~650) consisted of traditional wireline telephone numbers and a sub-quota of cell phone-only households. The remaining telephone interviews were completed with individuals who dialed into the toll-free number to schedule an interview.
Surveys through other data collection modes were completed by individuals contacted through departmental partnerships and stakeholder networks.
In 2018, more than 50 organizations, interested in creating relevant and effective federal legislation, came together to form the Federal Accessibility Legislation Alliance (FALA). The federal government provided a grant to assist these organizations in working together. Feedback was sought from the disability community to determine how to strengthen the legislation. By the end of the project, there were over 100 organizations and over 2,700 individuals working with FALA. The questionnaire used for this study was designed by Quorus Consulting in consultation with ESDC, and the leadership team of FALA. In the questionnaire, the definition of disability from the Accessible Canada Act was used. The entire questionnaire underwent a plain language edit by a service provider to ensure it was as approachable as possible for persons with intellectual and learning disabilities.
Respondents from this segment could complete the survey using a variety of accessible formats: telephone, online, American or Quebec Sign Language, downloadable PDF and MSWord versions, e-text, Braille, digital Braille, DAISY, VRS and hardcopy versions.
Given the non-probability nature of the sampling, a margin of error cannot be calculated. As well, data for this segment were not weighted. Therefore, the population segment that participated in this survey cannot be compared to the broader population of people with disabilities in Canada.
Study parameters common to both segments included the following:
Data collection occurred between May 24th and July 8th, 2019, and included a pretest of all data collection modes and formats. In addition to testing for accessibility, the pretest helped assess the flow of the survey, comprehension of the questions, language, data integrity, and the length of the survey instrument.
All study respondents were informed that the study was being conducted by Quorus on behalf of ESDC.
All data collection modes were available in English and in French.
Participants did not receive any incentive for completing the survey.
All participants were provided the following standard reassurances regarding the confidential and anonymous nature of their opinion data:
Your responses will be kept entirely confidential and anonymous. If at any time during the survey you are not comfortable with a question, you can skip it.
Your decision to participate is up to you and will not affect your relationship with the Government of Canada or the services they provide you. The information provided will be managed according to the requirements of the Privacy Act. The final report on the survey will be available through Library and Archives Canada.
Depending on their feedback, the survey took respondents approximately 15 minutes to complete.
OVERVIEW OF RESULTS – GENERAL POPULATION
Nearly three-quarters (72%) of the general population would say they understand quite well the idea of what a disability is (i.e. they rated their understanding at least an 8 on a scale from 0 to 10). Using the same 10-point scale, 47% would say they understand quite well the types of barriers that Canadians with a disability may encounter.
When asked, without any examples, to describe the top three barriers respondents believed people with disabilities face, the results reveal a wide range of barriers. The most common types described included the following:
The most common types of barriers described were related to physical accessibility, such as access to buildings (39%).
At 24%, general mobility-related barriers were described while 19% specifically identified barriers to transportation or public transportation.
Roughly 18% mentioned barriers related to access to services.
A majority of respondents (57%) indicated having heard of “attitude barriers” before participating in this study. For instance, people with disabilities are sometimes treated badly or differently because of behaviours, perceptions, and assumptions that other people have. This is called an “attitude barrier.”
Respondents who were asked how often they witnessed different types of accessibility-related barriers, witnessed employment-related barriers the most. Statistics for each type of disability are as follows:
As for employment-related barriers, 24% indicated always or often witnessing a barrier to finding meaningful work, 21% witnessed a barrier to moving up in an organization, 21% witnessed a barrier to having access to supports or workplace accommodations, and 16% witnessed a barrier to being hired.
In terms of transportation-related barriers, 11% always or often witnessed barriers to using municipal public-transit, 10% to using taxis and ridesharing services, 5% to using school transportation, 2% to using ferries, 3% to using VIA rail or interprovincial trains, 6% to travel by air, and 4% to using buses that cross borders.
Nearly one in five respondents (17%) have always or often witnessed built environment-related barriers, i.e. barriers that limited someone’s ability to move in and around public buildings and spaces.
Less than one tenth of respondents have always or often witnessed Information and Communication Technology (ICT)-related barriers, including: website accessibility (7%), wireless service accessibility (7%), using self-service technology in a public space (6%), watching cable (5%), watching a show on a streaming service (5%), or watching a video on the Internet (6%).
Program or service delivery barriers are reported to be always or often witnessed in terms of the accessibility of a program/service provided by a company/an organization (7%), or the accessibility of a government program or service (6%).
A minority (15%) have seen, read, or heard anything about the Government of Canada’s Bill C-81 (The Accessible Canada Act) and its purpose.1 When asked to explain, without any examples, what they remember about this Act, 20% who remember the Bill explain it will generally support or assist people with disabilities and 16% explain it will increase accessibility.
Half believe their province or territory (50%) has accessibility legislation or an accessibility strategy or plan and a similar proportion (55%) believe their municipality has accessibility by laws, strategies, policies or programs.
OVERVIEW OF RESULTS – PERSONS WITH DISABILITIES
When first asked if respondents identified themselves as a person with a disability, 74% agreed. To establish if the respondents “qualify” for the disabilities segment of the survey, respondents were presented a list of disabilities and directly asked if they have had each specific disability. If yes, then the difficulty and limitation as a result of the disability(ies) were then considered to screen participants to qualify for the persons with disabilities segment of the survey. Note that the types of disabilities listed here may not perfectly represent all persons with disabilities in Canada.
The disability screening revealed the following:
Figure 1: Incidence of Persons with Disabilities
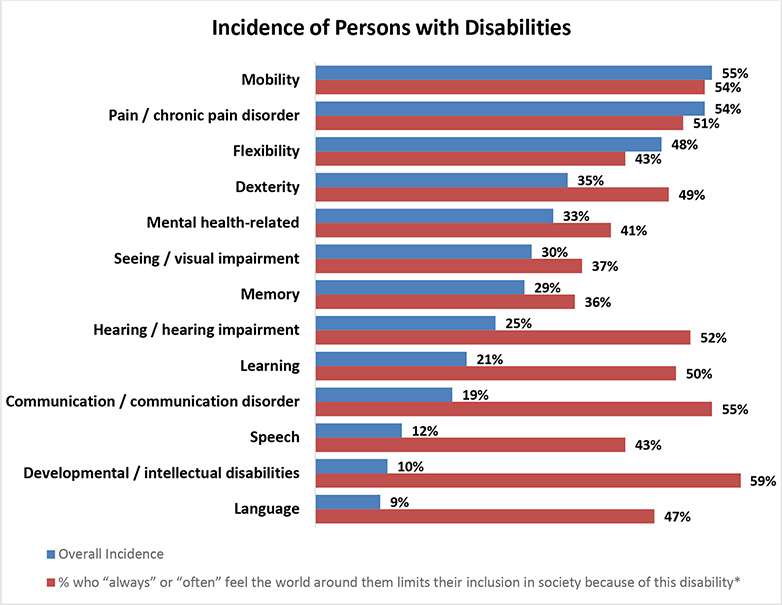
A graph with the data on the incidence of persons with different disabilities
Description: The horizontal bar graph presents the incidence of persons with 13 types of disabilities. The graph shows a set of two bars for each disability that represents the overall incidence, and the percentage of respondents who “always” or “often” feel the world around them limits their inclusion in society because of this disability. The data inferred from the graph is as follows: mobility - 55 percent (overall incidence), 54 percent (limits inclusion in society); pain or chronic pain disorder - 54 percent (overall incidence), 51 percent (limits inclusion in society); flexibility - 48 percent (overall incidence), 43 percent (limits inclusion in society); dexterity - 35 percent (overall incidence), 49 percent (limits inclusion in society); mental health-related - 33 percent (overall incidence), 41 percent (limits inclusion in society); seeing or visual impairment - 30 percent (overall incidence), 37 percent (limits inclusion in society); memory - 29 percent (overall incidence), 36 percent (limits inclusion in society); hearing or hearing impairment - 25 percent (overall incidence), 52 percent (limits inclusion in society); learning - 21 percent (overall incidence), 50 percent (limits inclusion in society); communication or communication disorder - 19 percent (overall incidence), 55 percent (limits inclusion in society); speech - 12 percent (overall incidence), 43 percent (limits inclusion in society); developmental or intellectual disabilities - 10 percent (overall incidence), 59 percent (limits inclusion in society); and language - 9 percent (overall incidence), 47 percent (limits inclusion in society).
Nearly two-thirds of respondents (63%) used equipment, an aid or a support to help them with their daily activities. Among these respondents, a very wide range of “supports” are used, the most common ones being a cane or walker (32%), a wheelchair or mobility scooter (32%), and a hearing aid (19%).
One in ten (11%) feel they “always” experience “attitude barriers”, 30% feel they “often” encounter them and another 28% “sometimes” encounter them.
From a communication standpoint, challenges vary according to the form of communication – more specifically:
23% feel communicating over the phone is difficult
21% feel writing down information is difficult
16% feel in person or face to face communications are difficult
14% feel reading and understanding written materials is difficult
13% feel communicating over the Internet is difficult
Respondents who were asked how often they experienced the following types of accessibility-related barriers, experienced employment-related barriers the most. Statistics for each type of disability are as follows:
As for employment-related barriers, 25% indicated always or often experiencing a barrier to finding meaningful work, 24% witnessed a barrier to having access to supports or workplace accommodations, 23% witnessed a barrier to moving up in an organization, and 21% witnessed a barrier to being hired.
In terms of transportation-related barriers, 20% always or often experienced barriers to using municipal public-transit, 19% to travelling by air, 17% to using taxis and ridesharing services, 6% to using ferries, 9% to using VIA rail or interprovincial trains, and 8% to using buses that cross borders.
Over one quarter of respondents (30%) have always or often experienced built environment-related barriers, i.e. barriers that limited someone’s ability to move in and around public buildings and spaces.
Less than one fifth of respondents have always or often experienced Information and Communication Technology (ICT)-related barriers, including: website accessibility (12%), wireless service accessibility (10%), using self-service technology in a public space (16%), watching cable (11%), watching a show on a streaming service (10%), or watching a video on the Internet (14%).
Program or service delivery barriers are reported to be always or often experienced in terms of the accessibility of a program/service provided by a company/an organization (20%), or the accessibility of a government program or service (17%).
Two in five respondents (41%) have seen, read, or heard anything about the Government of Canada’s Bill C-81 and its purpose. When asked to explain, unprompted, what they remember about this Act, 17% who remember the Bill explain it will generally support or assist people with disabilities and 17% explain it will increase accessibility.
Nearly half believe their province or territory (45%) has accessibility legislation or an accessibility strategy or plan and a similar proportion (45%) believe their municipality has accessibility by laws, strategies, policies or programs.
Over the past 12 months, 42% of respondents have tried to access information on any government programs or services related to accessibility or disability.
Among these respondents, 69% sought out provincial information, 57% federal information, and 36% municipal information.
Generally, a majority felt the experience was either “very difficult” (22%) or “difficult” (37%) whereas 14% felt the experience was easy.
When it comes to Government of Canada employees providing equal access to services and programs to people with different disabilities, including communication disabilities, 44% believe “much more” needs to be done in this area and 26% believe “a little more” needs to be done.
Methodology
Methodology
The scope of the study involved multiple modes of data collection to survey two segments of the Canadian population:
Persons with disabilities, and,
Members of the general population (i.e. individuals who do not have a disability).
For the purposes of this study, the Accessible Canada Act (ACA) definition of disability is used. The term “Disability” refers to a physical, mental, intellectual, learning, communication, or sensory impairment – or a functional limitation – whether permanent, temporary, or episodic in nature that, in interaction with a barrier, may hinder a person’s full and equal participation in society.
Questionnaire Design. Quorus designed the survey instruments in English in working with ESDC. Together, they ensured the research objectives were addressed, that plain language was used, and that the questionnaires flowed easily for respondents. To further ensure that the survey script used plain language, ESDC worked closely with a service provider that specializes in developing and revising texts in plain language.
Various ESDC partners and stakeholders with specific knowledge of disability and accessibility issues in Canada, including the Federal Accessibility Legislation Alliance (FALA), were consulted in the design of the study and the development of the questionnaires.
A different questionnaire was developed for each segment with many questions overlapping in both questionnaires. The survey with members of the general population focused on their familiarity with barriers to accessibility and the extent to which they may have witnessed certain types of barriers. The survey with persons with disabilities focused more directly on their own experiences with barriers to accessibility.
An Instrument was developed to establish if the respondent was an individual with a disability and ultimately determined which version of the questionnaire they would complete. While some of the wording for some of the questions used was borrowed from the Disability Screening Questions (DSQ) of the 2017 Canadian Survey on Disability, the instrument is completely different from the DSQ and does not pretend to replicate it in any way.
More specifically, participants were presented with thirteen specific types of disabilities and then asked if, yes or no, they believe they have had each disability. For each disability where the respondent indicated having had the disability, two follow-up questions were asked to establish whether they should follow the disability segment stream of the questionnaire:
A first question established how often they feel this disability limits their inclusion in society: “How often would you say the world around you - for example physical spaces, technology, or people’s attitudes towards you - limits your inclusion in society because of this disability?” If the respondent indicated “always”, “often” or “sometimes”, they followed the disability segment stream of the questionnaire. If they indicated “rarely” or “never”, they were asked the next follow-up question.
The next follow-up question asked how much difficulty they have with the specific disability. If the respondent indicates that they have “some difficulty”, “a lot of difficulty” or they cannot function, then they follow the disability segment stream of the questionnaire.
This process was repeated for each of the thirteen specific types of disabilities in addition to any “other” disability the respondent believes they may have had.
The questionnaire consisted mostly of closed-ended questions and was designed to take the average respondent 15 minutes to complete the survey.
All study respondents were informed that the study was being conducted by ESDC.
Participants did not receive any incentive for completing the survey.
Quorus translated the client-approved English versions of the survey. Respondents had the choice to complete the survey in English or in French.
The approved final questionnaires were used to create multiple formats of the questionnaire. The General Population segment responded to the survey through a telephone survey. Quorus, in collaboration with ESDC, created multiple versions of the questionnaire for persons with disabilities to ensure the questionnaire was accessible. The different formats created included:
Telephone
Online
Hardcopy – Regular font size
Arial 12 – downloadable PDF
Arial 12 MSWord version
Arial 12 fillable MSWord version
Hardcopy – Large font size
Arial 18 – downloadable PDF
Arial 18 MSWord version
Arial 18 fillable MSWord version
Daisy file
EPUB file
Braille (hardcopy and digital)
The English and French telephone versions of the questionnaire were pre-tested according to Government of Canada standards. A total of 39 surveys (22 Disability and 17 General Population) were completed. For the disability segment, 10 surveys were completed in English and 12 in French, the results of which were ultimately included as part of the final dataset. The pretest helped assess the flow of the survey, comprehension of the questions, language, data integrity, and the length of the survey instrument.
Extensive internal testing of alternate formats was completed within ESDC to ensure these formats met Government of Canada accessibility standards.
Respondent Support. Quorus hosted and designed, in collaboration with ESDC, an accessible and bilingual webpage dedicated to this study that described the background and objectives; provided visitors with a study Question and Answer (Q&A); contact information for Quorus and ESDC; and access to the various formats of the survey, including a link to the online version of the survey. Respondents could also contact Quorus or ESDC directly by telephone or email to ask questions or to request a hardcopy version of the questionnaire, including a hardcopy in Braille. They could also email their completed survey back to Quorus or ESDC. The webpage also included a 1-800 number where study participants could request that an interviewer call them back to complete a telephone survey, ask questions or request a hardcopy version of the questionnaire.
Quorus informed respondents of their rights under the Privacy and Access to Information Acts and ensured that those rights were protected throughout the research process. This included: informing participants of the purpose of the research; identifying both the sponsoring department or agency and research supplier at the end of the interview; informing participants that the study will be made available to the public in 6 months after field completion through Library and Archives Canada, informing participants that their participation in the study was voluntary, and that the information provided would be administered according to the requirements of the Privacy Act.
Data Collection
Data collection for both population segments occurred between May 28th, and July 7th, 2019.
General Population Segment. For the General Population segment, a total of 1,350 telephone interviews with Canadians, 18 years of age and older were completed. The sample consisted of traditional wireline telephone numbers and a sub-quota of cell-phone only households (CPO households). Cell phone numbers were added to the landline Random Digit Dialing telephone sample to reduce coverage error and provide a more representative final sample.
The survey introduction was adjusted to appropriately capture the reality of calling Canadians on their cell phones (Are you in a place where you are comfortable to continue with the survey?).
The “most recent birthday” approach was used to ensure randomness within the household.
Regional quotas were established to generate sufficient data regionally for robust analysis. The distribution suggested for the final sample is the usual distribution of respondents per region when research is conducted for the Government of Canada. Within each region, data was monitored to ensure a 50/50 gender split and that no specific age cohort was under-represented.
Figure 2: Regional Quotas for General Population Interviews
A table illustrates the proportion of regional quotas in ten provinces or territories on the distribution of general population interviews
The table lists the percentage of the general population interviews in ten provinces or territories. The column headers read province or territory and approximate distribution of general population interviews. The data as inferred from the table is as follows: 1, Newfoundland and Labrador, 4 percent; 2, Prince Edward Island, 3 percent; 3, New Brunswick, 4 percent; 4, Nova Scotia, 3 percent; 5, Quebec, 19 percent; 6, Ontario, 30 percent; 7, Manitoba/Nunavut, 7 percent; 8, Saskatchewan, 7 percent; 9, Alberta/NWT, 10 percent; and 10, British Columbia/Yukon, 13 percent. The last row in the table indicates the total distribution which is 100 percent.
| PROVINCE/TERRITORY | Approximate distribution of General Population interviews |
|---|---|
| Newfoundland and Labrador | 4% |
| Prince Edward Island | 3% |
| New Brunswick | 4% |
| Nova Scotia | 3% |
| Quebec | 19% |
| Ontario | 30% |
| Manitoba/Nunavut | 7% |
| Saskatchewan | 7% |
| Alberta/NWT | 10% |
| British Columbia/Yukon | 13% |
| TOTAL | 100% |
The margin of error of this sample size is +/− 2.7%, 19 times out of 20. The research findings can be extrapolated to the broader audience considering the margin of error associated with this sample size. The margins of error for the results in this study will vary based on a variety of factors. For instance, results for subgroups with smaller sample sizes will have a higher margin of error. As well, the margin of error is typically highest for questions where 50% of respondents answered one way and 50% answered another way. The margin of error typically decreases as the percent for a particular response approaches 0% or 100%.
The data was weighted by region and gender to ensure the final distributions within the final sample mirror those of the Canadian population according to the latest census data. In this report, all sample sizes/base sizes are unweighted numbers whereas all percentages pertaining to the General Population are weighted numbers.
The table below shows the weighting framework used for this study:
Figure 3: Weighting Framework
A table depicting the framework for weighting the survey data by gender and region
Description: The table showing the framework weighted for both the genders in 13 regions. It is presented in the order of region, gender, sample, population, sample proportion, and sample population. The data as inferred from the table is as follows: 1, Newfoundland, Male, 17 (sample), 207,385 (population), 1 percent (Sample proportion), 1 percent (sample population); 2, Newfoundland, Female, 30 (sample), 221,675 (population), 2 percent, 1 percent; 3, Prince Edward Island, Male, 19 (sample), 55,090 (population), 1 percent (Sample proportion), 0 percent (sample population); 4, Prince Edward Island, Female, 26 (sample), 59,990 (population), 2 percent (Sample proportion), 0 percent (sample population); 5, Nova Scotia, Male, 13 (sample), 363,195 (population), 1 percent (Sample proportion), 1 percent (sample population); 6, Nova Scotia, Female, 30 (sample), 396,555 (population), 2 percent (Sample proportion), 1 percent (sample population); 7, New Brunswick, Male, 31 (sample), 296,655 (population), 2 percent (Sample proportion), 1 percent (sample population); 8, New Brunswick, Female, 16 (sample), 315,715 (population), 1 percent (Sample proportion), 1 percent (sample population); 9, Quebec, Male, 120 (sample), 3,206,345 (population), 9 percent (Sample proportion), 11 percent (sample population); 10, Quebec, Female, 132 (sample), 3,374,530 (population), 10 percent (Sample proportion), 12 percent (sample population); 11, Ontario, Male, 177 (sample), 5,184,285 (population), 13 percent (Sample proportion), 18 percent (sample population); 12, Ontario, Female, 227 (sample), 5,582,440 (population), 17 percent (Sample proportion), 20 percent (sample population); 13, Manitoba, Male, 33 (sample), 480,760 (population), 2 percent (Sample proportion), 2 percent (sample population); 14, Manitoba, Female, 61 (sample), 504,355 (population), 5 percent (Sample proportion), 2 percent (sample population); 15, Saskatchewan, Male, 42 (sample), 414,510 (population), 3 percent (Sample proportion), 1 percent (sample population); 16, Saskatchewan, Female, 52 (sample), 427,355 (population), 4 percent (Sample proportion), 2 percent (sample population); 17, Alberta, Male, 65 (sample), 1,565,685 (population), 5 percent (Sample proportion), 6 percent (sample population); 18, Alberta, Female, 71 (sample), 1,578,320 (population), 5 percent (Sample proportion), 6 percent (sample population); 19, British Columbia, Male, 81 (sample), 1,845,345 (population), 6 percent (Sample proportion), 7 percent (sample population); 20, British Columbia, Female, 89 (sample), 1,960,230 (population), 7 percent (Sample proportion), 7 percent (sample population); 21, Yukon, Male, 5 (sample), 14,105 (population), 0.4 percent (Sample proportion), 0.05 percent (sample population); 22, Yukon, Female, 4 (sample), 14,340 (population), 0.3 percent (Sample proportion), 0.05 percent (sample population); 23, Northwest Territories, Male, 2 (sample), 15,975 (population), 0.1 percent (Sample proportion), 0.06 percent (sample population); 24, Northwest Territories, Female, 0 (sample), 15,295 (population), 0 percent (Sample proportion), 0.05 percent (sample population); 25, Nunavut, Male, 1 (sample), 11,470 (population), 0.1 percent (Sample proportion), 0.04 percent (sample population); and 26, Nunavut, Female, 0 (sample), 10,940 (population), 0 percent (Sample proportion), 0.04 percent (sample population). The last row in the table indicates the total value of sample, population, sample proportion, and sample population which are 1, 344 (sample); 28,122, 545 (population); 100 percent (Sample proportion), and 100 percent (sample population).
| Region | Gender | Sample | Population | Sample Proportion | Sample Population |
|---|---|---|---|---|---|
| Newfoundland | Male | 17 | 207,385 | 1% | 1% |
| Female | 30 | 221,675 | 2% | 1% | |
| Prince Edward Island | Male | 19 | 55,090 | 1% | 0% |
| Female | 26 | 59,990 | 2% | 0% | |
| Nova Scotia | Male | 13 | 363,195 | 1% | 1% |
| Female | 30 | 396,555 | 2% | 1% | |
| New Brunswick | Male | 31 | 296,655 | 2% | 1% |
| Female | 16 | 315,715 | 1% | 1% | |
| Quebec | Male | 120 | 3,206,345 | 9% | 11% |
| Female | 132 | 3,374,530 | 10% | 12% | |
| Ontario | Male | 177 | 5,184,285 | 13% | 18% |
| Female | 227 | 5,582,440 | 17% | 20% | |
| Manitoba | Male | 33 | 480,760 | 2% | 2% |
| Female | 61 | 504,355 | 5% | 2% | |
| Saskatchewan | Male | 42 | 414,510 | 3% | 1% |
| Female | 52 | 427,355 | 4% | 2% | |
| Alberta | Male | 65 | 1,565,685 | 5% | 6% |
| Female | 71 | 1,578,320 | 5% | 6% | |
| British Columbia | Male | 81 | 1,845,345 | 6% | 7% |
| Female | 89 | 1,960,230 | 7% | 7% | |
| Yukon | Male | 5 | 14,105 | 0.4% | 0.05% |
| Female | 4 | 14,340 | 0.3% | 0.05% | |
| Northwest Territories | Male | 2 | 15,975 | 0.1% | 0.06% |
| Female | 0 | 15,295 | 0% | 0.05% | |
| Nunavut | Male | 1 | 11,470 | 0.1% | 0.04% |
| Female | 0 | 10,940 | 0% | 0.04% | |
| TOTAL | 1,344 | 28,122,545 | 100% | 100% | |
Non-Response Bias – General Population Segment. Upon completion of this project a non-response analysis was conducted to assess the potential for non-response bias. Non-response is the result of a unit of the sample not participating in the survey—either refusing to take part in the survey (a refusal) or not being reached during the data collection period (non-contact). Non-response results in biases in the survey sample when there are differences between respondents and non-respondents.
To undertake the analysis for this survey, the unweighted sample distribution by gender was compared to the actual population (based on 2016 Census figures from Statistics Canada).
Contrary to most surveys of the general population, age was not factored into the quota structure, the weighting scheme or the analysis of non-response since the definition of “general population” for this study differs from what is typically seen. In this study, members of the general population represented the segment of Canadians who do not have a disability and since disability is related to age, including age in the quotas and weights would be misleading.
As the table below shows, the survey sample and the population distribution are very similar. The survey data was weighted to address whatever variations existed between genders. Weighting also corrected the sample design for the survey, which was regionally disproportionate. Weighting serves to reduce bias should it be present, but not to eliminate it completely.
Figure 4: Comparing Survey Sample with Population Distribution
A table comparing the survey sample against census population distribution
Description: the table shows the comparison of the survey sample population against the 2016 census population distribution. Survey Sample (unweighted), population (Census), and % difference (plus or minus) from the table is as follows: 1, Male, survey sample 44.90%, census population distribution, 49.11% difference, plus 4.21%.2, female, survey sample 54.70%, census population distribution 50.88%, difference, minus 3.82%.
| Survey Sample (Unweighted) | Population (Census 2016) | % diff (+/−) | |
|---|---|---|---|
| Male | 44.90% | 49.11% | 4.21% |
| Female | 54.70% | 50.88% | -3.82% |
Persons with Disabilities. A total of 2,456 surveys were completed with persons with disabilities at least 18 years of age, of which:
Six hundred and sixty-six (666) were completed by telephone. Nearly all surveys completed over the telephone (~650) were completed the same way as the General Population segment, in other words these interviews were completed via traditional wireline telephone numbers and a sub-quota of cell-phone only households. The remaining telephone interviews were completed with individuals who dialed into the toll-free number to schedule an interview.
Majority of the responses (1,788) were completed online, and,
Two responses were completed by respondents who submitted a hardcopy version of the questionnaire or completed and emailed an electronic version of the questionnaire.
A dual sample frame approach was used for this segment of the population. In addition to the RDD (random digit dialing/cell-phone) frame described above, study respondents were also contacted through departmental partnerships and stakeholder networks, including FALA. Hence, for the second frame, there is no information available allowing the research team to understand exactly how many partners were involved, how many outreach invitations were issued to potential survey respondents, how many potential survey respondents accessed the invitation or how many reminders were issued. These limitations impede our ability to calculate a response rate for this portion of the study.
Given the source for many of the contacts invited to participate in this study (departmental stakeholder and partner groups), it is very likely that the segment representing persons with disabilities may underrepresent certain types of individuals, such as individuals with low literacy and those with severe functional limitations. This segment may also be over-represented in terms of individuals who are engaged in disability or accessibility-related causes, who are vocal, who are well-informed and/or who are generally active.
Given the non-probability nature of the sampling approach for the segment focused on persons with disabilities, a margin of error cannot be calculated. As well, data for this segment were not weighted. As such, in this report, all sample sizes/base sizes and all percentages pertaining to persons with disabilities are unweighted numbers.
Response rate – General Population Segment. The portion of the study involving telephone surveys with members of the general population saw a response rate of 6.7% across the entire sample. The response rate was higher for Random Digit Dialing (9.3%) compared to calls made to cell phones (4.5%).
Figure 5: Dialing Disposition Report for the General Population Segment
The table presents the information about the dialing disposition report for the general population segment
Description: The table presents the information about the dialing disposition report for the general population segment. Total, RDD, and Cell for 21 factors from the table are listed as follows: 1, Total Numbers Attempted, 118535 (total), 33528 (Random Digit Dialing), 85007 (Cell); 2, Out-of-scope - Invalid, 77603 (total), 14248 (Random Digit Dialing), 63355 (Cell); 3, Unresolved (U), 16506 (total), 4863 (Random Digit Dialing), 11643 (Cell); 4, No answer/Answering machine, 16506 (total), 4863 (Random Digit Dialing), 11643 (Cell); 5, In-scope - Non-responding (IS), 3057 (total), 1366 (Random Digit Dialing), 1691 (Cell); 6, Language barrier, 541 (total), 310 (Random Digit Dialing), 231 (Cell); 7, Incapable of completing (ill/deceased), 255 (total), 186 (Random Digit Dialing), 69 (Cell); 8, Callback (Respondent not available), 2261 (total), 870 (Random Digit Dialing), 1391 (Cell); 9, Total Asked, 21369 (total), 13051 (Random Digit Dialing), 8318 (Cell); 10, Refusal, 18335 (total), 11096 (Random Digit Dialing), 7239 (Cell); 11, Termination, 282 (total), 171 (Random Digit Dialing), 111 (Cell); 12, In-scope - Responding units (R), 2752 (total), 1784 (Random Digit Dialing), 968 (Cell); 13, Completed Interview, 2016 (total), 1322 (Random Digit Dialing), 694 (Cell); 14, NO - Quota Full, 595 (total), 378 (Random Digit Dialing), 217 (Cell); 15, 31 (INT31) NOT WILLING TO TAKE PART, 43 (total), 43 (Random Digit Dialing), 0 (Cell); 16, 32 (INT32) (CELL) NOT WILLING TO TAKE PART, 60 (total), 20 (Random Digit Dialing), 40 (Cell); 17, 33 (INT33) NQ- AGE (LESS THAN 18), 19 (total), 5 (Random Digit Dialing), 14 (Cell); 18, 34 (INT34) DONT KNOW/REFUSED, 19 (total), 16 (Random Digit Dialing), 3 (Cell); 19, Refusal Rate, 87.12 (total), 86.33 (Random Digit Dialing), 88.36 (Cell); 20, Response Rate, 6.72 (total), 9.25 (Random Digit Dialing), 4.47 (Cell); and 21, Incidence, 73.26 (total), 74.26 (Random Digit Dialing), 71.69 (Cell).
| TOTAL | RDD | CELL | |
|---|---|---|---|
| Total Numbers Attempted | 118535 | 33528 | 85007 |
| Out-of-scope - Invalid | 77603 | 14248 | 63355 |
| Unresolved (U) | 16506 | 4863 | 11643 |
| No answer/Answering machine | 16506 | 4863 | 11643 |
| In-scope - Non-responding (IS) | 3057 | 1366 | 1691 |
| Language barrier | 541 | 310 | 231 |
| Incapable of completing (ill/deceased) | 255 | 186 | 69 |
| Callback (Respondent not available) | 2261 | 870 | 1391 |
| Total Asked | 21369 | 13051 | 8318 |
| Refusal | 18335 | 11096 | 7239 |
| Termination | 282 | 171 | 111 |
| In-scope - Responding units (R) | 2752 | 1784 | 968 |
| Completed Interview | 2016 | 1322 | 694 |
| NQ - Quota Full | 595 | 378 | 217 |
| 31 (INT31) NOT WILLING TO TAKE PART | 43 | 43 | 0 |
| 32 (INT32) (CELL) NOT WILLING TO TAKE PART | 60 | 20 | 40 |
| 33 (INT33) NQ- AGE (LESS THAN 18) | 19 | 5 | 14 |
| 34 (INT34) DONT KNOW/REFUSED | 19 | 16 | 3 |
| Refusal Rate | 87.12 | 86.33 | 88.36 |
| Response Rate | 6.72 | 9.25 | 4.47 |
| Incidence | 73.26 | 74.10 | 71.69 |
This study was conducted following the Standards for the Conduct of Government of Canada Public Opinion Research – Telephone Surveys, and, the Standards for the Conduct of Government of Canada Public Opinion Research – Online Surveys.