This publication is available for download at canada.ca/publicentre-ESDC . It is available upon request in multiple formats (large print, MP3, braille, audio CD, e-text CD, DAISY or accessible PDF), by contacting 1 800 O-Canada (1-800-622-6232). By teletypewriter (TTY), call 1-800-926-9105.
Vous pouvez télécharger cette publication en ligne sur le site canada.ca/publicentre-EDSC. Ce document offert sur demande en médias substituts (gros caractères, MP3, braille, audio sur DC, fichiers de texte sur DC, DAISY, ou accessible PDF) auprès du 1 800 O-Canada (1-800-622-6232). Si vous utilisez un téléscripteur (ATS), composez le 1-800-926-9105.
I hereby certify as Senior Officer of Ipsos that the deliverables fully comply with the Government of Canada political neutrality requirements outlined in the Policy on Communications and Federal Identity and the Directive on the Management of Communications. Specifically, the deliverables do not include information on electoral voting intentions, political party preferences, standings with the electorate or ratings of the performance of a political party or its leaders.
President
Ipsos Public Affairs
Additional information
Supplier Name: Ipsos Limited Partnership
PSPC Contract Number: G9292-192214/001/CY
Contract Award Date: January 9, 2019
Executive Summary
Service Canada CX Survey 2018-19 — Results at a Glance
4,401 interviews conducted (between 600-1100 per program)
The Client Experience Measurement Project was conducted in two phases. The first phase involved executing the Client Experience (CX) Survey while the second phase included a series of online focus groups and in-depth interviews with clients identified through the quantitative survey.
The Client Experience (CX) Survey is intended to track the service experience delivered by Service Canada. In 2017-18, the Citizen Service Branch launched the annual CX Survey to obtain a baseline measurement.
In 2018-19, the survey has been used to collect data to contribute to monitoring the service delivery performance of Service Canada, and to inform service transformation.
Note that for this wave of the survey considerable space was devoted to gathering information to support transformation decision-making over tracking detailed aspects of the service experience. This change was made for this wave of the survey since the impact of service transformation was not expected to be evident until at least two years of service transformation implementation.
The second qualitative phase explored why clients who are used to transacting online choose to use the in-person channel and the extent to which they would or would not shift to using the online channel in response to proposed innovations.
The qualitative portion was also used to better understand the service experience among those who encountered a problem or issue or expressed dissatisfaction with their overall experience.
Methodology- Quantitative Phase
A telephone survey was conducted with a sample of 4,401 Service Canada clients across the six major programs. For the 2018-19 survey, recipients of OAS and GIS have been combined into one client group because the applications were combined.
Employment Insurance (EI)
Canada Pension Plan (CPP)
Canada Pension Plan Disability Benefit (CPP-D)
Old Age Security (OAS)/ Guaranteed Income Supplement (GIS) and
Social Insurance Number (SIN).
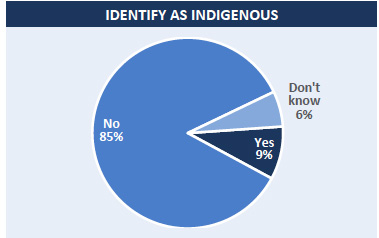
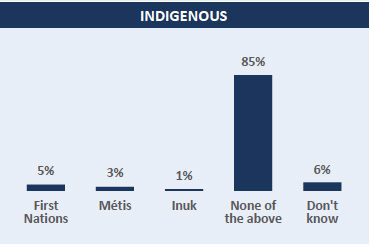
Oversamples were conducted with two vulnerable client groups: those living in remote areas and Indigenous clients.
The interviews were conducted from March 6 and March 31, 2019.
Clients who had received a service outcome during August, September or October 2018 were sampled (for CPP-D and OAS/GIS the period was extended to December 2018 to gather sufficient sample).
The survey sample size has a margin of error of +/-1.5%, with between 600-1100 for each program with a margin of error of between +/-4% to +/-2.9%.
Results were weighted by age, gender, region, program and benefit receipt (approved/ denied) using administrative data on clients who completed a client journey (initial decision) from August to October 2018. Program weights were held constant with 2017-18 to allow the results to highlight any change due to the service experience.
The 2018-19 Client Experience Survey Detailed Methodology document is available under separate cover.
Methodology- Qualitative Phase
A series of 6 qualitative online focus group discussions were convened between May 7 and May 9, 2019.
4 groups for Attracting Clients to Self-Service:
3 groups with 17 participants in total: 1 among those who applied for EI in person but are not e-vulnerable, 1 among those who applied for CPP in person but are not e-vulnerable and 1 among those who applied for CPP-D in person;
1 control group with 8 participants who applied for EI or CPP online.
2 Groups for Dissatisfaction / Issue Resolution:
2 groups with 11 participants in total
All sessions were 90 minutes in length and hosted on Ipsos’ Ideation Exchange platform, and all participants also dialed into a teleconference line. All were in English.
A series of 6 telephone interviews were conducted between May 23 – 28, 2019 in French. 5 were with EI applicants and 1 was with an OAS applicant.
Key Findings: Performance
Satisfaction with the service experience remained stable compared to 2017-18 and continued to be lower for EI and CPP-D clients. Satisfaction is strongly related to trust in Service Canada.
The vast majority of Service Canada’s clientele remain satisfied with the service experience (85%) and found it easy (85%) and effective (84%). Improvements have been made to effectiveness compared to last year and a greater proportion of clients provide the highest ratings for ease and effectiveness, while fewer provide the highest rating for overall satisfaction.
Clients also express a high degree of trust (83%) in Service Canada to deliver services effectively to Canadians (a new measure for 2018-19). Trust is highly correlated to overall satisfaction in the service experience.
Over nine in ten (92%) SIN clients express satisfaction with the service experience, the highest of any program and consistent with 2017-18. Eight in ten EI clients (80%) and closer to six in ten CPP-D clients (62%) are satisfied overall, lower than other programs and statistically unchanged year over year.
Clients remain most satisfied with the in person experience, while satisfaction is lowest for specialized call centres. Challenges have emerged with the specialized call centres experience year over year.
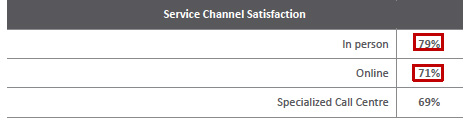
The large majority of clients remain satisfied with each service channel. Satisfaction with in person service remains the highest (87%), followed by online (79%), and specialized call centres (75%).
A decline in satisfaction among those who used specialized call centres has been observed in this survey period compared to the last survey period. Further, fewer clients provide the highest ratings for all service channels than last year.
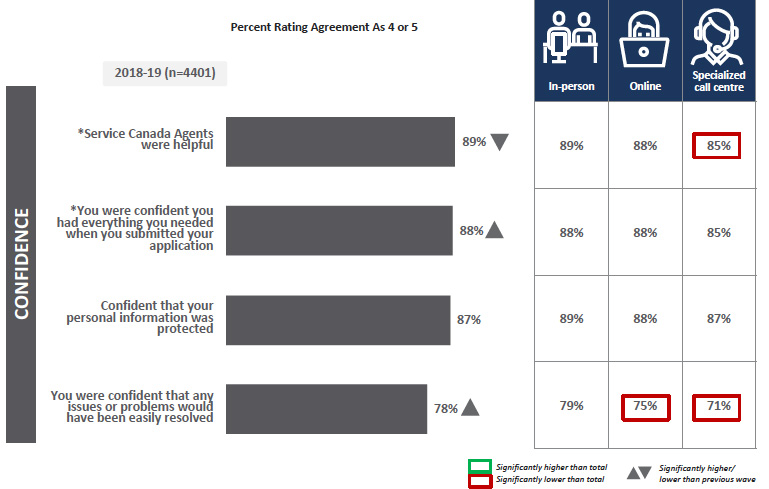
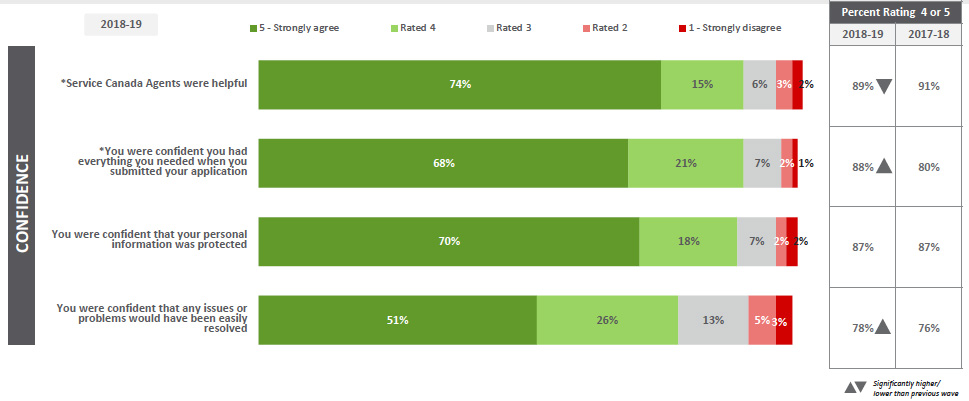
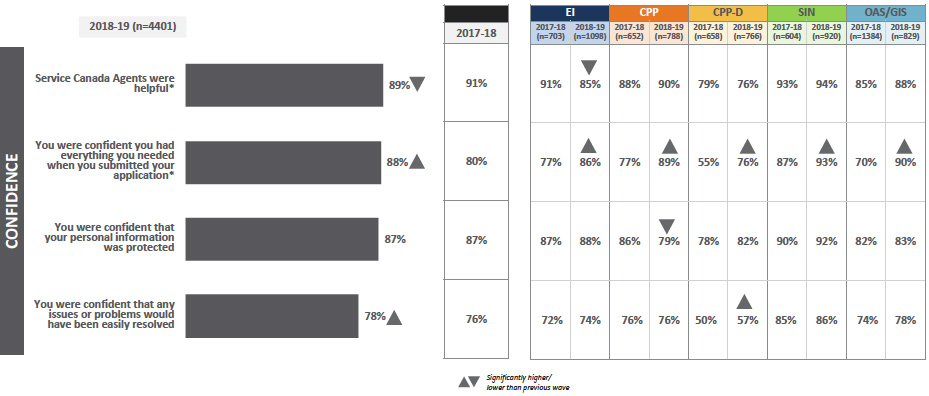
Overall, Service Canada clients rate the service most highly on helpfulness of staff, confidence in having everything needed when submitting an application and confidence in information security.
Nearly nine in ten clients find Service Canada staff helpful (89%), are confident they had everything they needed when they submitted their application (88%) and confident their personal information was protected (87%).
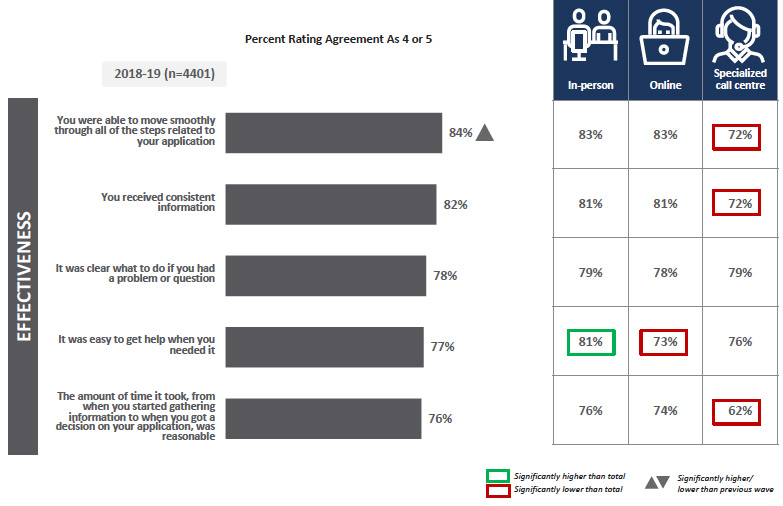
Service attributes with lower ratings are timeliness of service, ease of getting assistance, needing to explain your situation only once and clarity of process.
Fewer than eight in ten provided high ratings for the amount of time it took for the entire client journey was reasonable (76%), ease of getting assistance when needed (77%), needing to explain your situation only once (77%) and that it was clear through the process what would happen next and when (77%).
Certain aspects of service were rated consistently high or low across all programs
Confidence they had everything they needed when they submitted their applications and helpfulness of Service Canada Agents are consistently the highest rated areas. Confidence in issue resolution is consistently among the lowest rated area.
SIN clients continue to provide the highest ratings across all service attributes.
The vast majority of SIN clients provide positive ratings for all attributes and found the service experience easy and effective. Relatively speaking, lower scoring areas (which still achieved ratings of greater than 80%) include clarity of what to do when you have a problem and clarity in what would happen next and when.
CPP and OAS/ GIS clients provide similar ratings across service attributes and most rate each area highly.
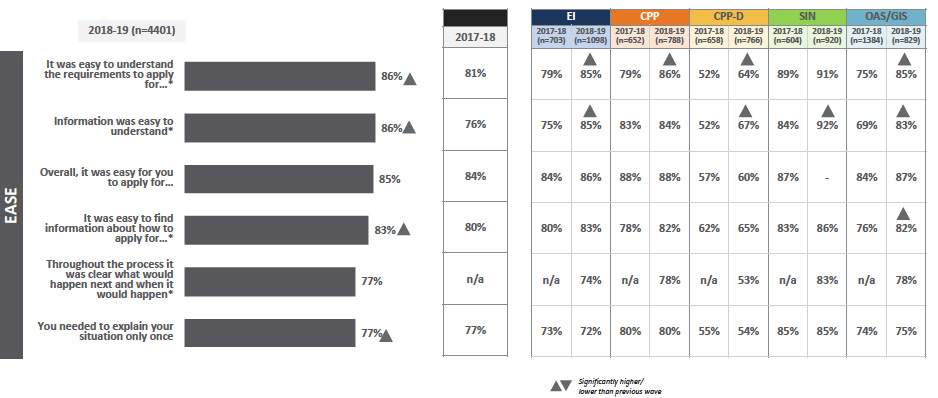
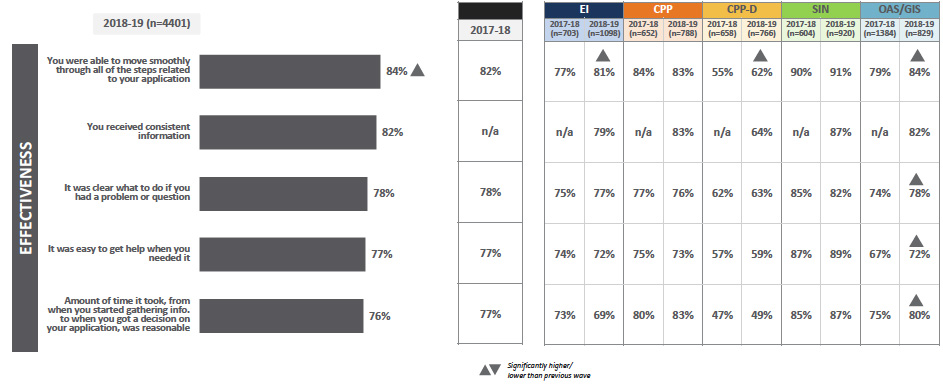
The majority CPP and OAS/GIS clients provide high ratings across most service attributes. The strongest performing areas include helpfulness of Service Canada Agents, ease of applying and ease of understanding the requirements to apply. The consistently lowest rated areas are ease of getting assistance and clarity in what would happen next and when. CPP clients also experienced more difficulty in understanding what to do if they had a problem/question, while OAS/GIS clients provided lower ratings for needing to explain their situation only once.
The majority of EI clients feel positive about most aspects of service, however ratings are slightly lower than other programs.
The EI service experience performs most strongly for confidence in protection of personal information, ease of applying, information being easy to understand and the helpfulness of Service Canada Agents. Lower performing areas include the timeliness of service, explaining situation only once, ease of getting assistance, and clarity of process.
CPP-D clients continue to experience the most difficulty during the service experience.
CPP-D clients provide considerably poorer ratings across most service attributes. The CPP-D service experience is rated highest for confidence in protection of personal information and helpfulness of Service Canada Agents. Lowest rated service attributes include timeliness of service, clarity in what would happen next and when and explaining your situation only once.
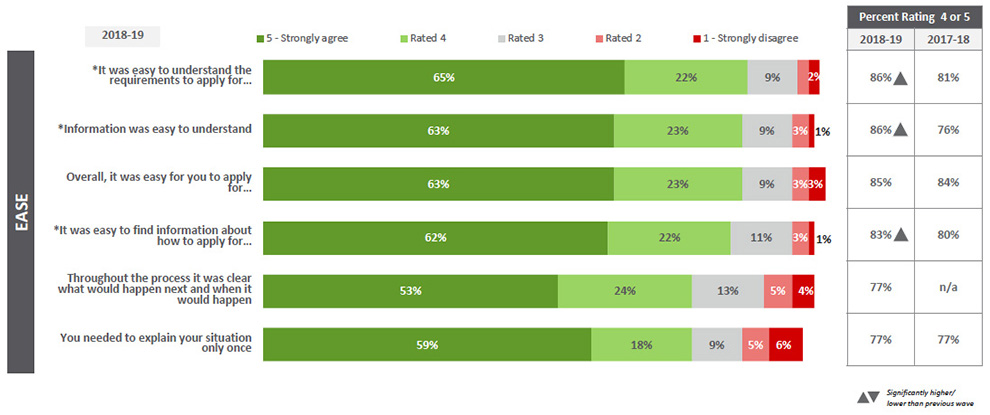
Overall, positive changes have been observed for a number of service attributes related to ease and confidence, while fewer rate the helpfulness of Service Canada Agents highly.
Clients are more likely to agree information was easy to understand, to be confident they had everything they needed when submitting their application, that it was easy to understand the requirements to apply, information about how to apply was easy to find, they were able to move through all steps smoothly, and were confident that any issues would be easily resolved.
Helpfulness of Service Canada Agents has declined compared to last year.
Key Findings: Drivers of Satisfaction
The most important drivers of satisfaction are: timeliness of service, helpfulness of staff, ease of getting assistance, receiving consistent information and ease of issue resolution, though satisfaction has not improved in these areas.
Common areas for potential improvement for the Service Canada clientele remain consistent year over year. To improve the service experience for the greatest number of clients accessing ESDC programs, focus should be placed primarily on improving the timeliness of service, ease of getting assistance, and ease of issue resolution which represent service attributes most strongly related to overall satisfaction where performance is lower relative to other areas.
Timeliness of service has taken on increased prominence in driving satisfaction. Providing a mechanism to better manage expectations regarding wait-times and the timeline for a decision is likely to help to improve satisfaction among clients.
The ease of receiving assistance throughout the client journey is strongly tied to confidence in issue resolution as well as overall satisfaction and trust. It provides clients with the reassurance they desire throughout the different stages of the application process.
While fewer clients experienced an issue this year, challenges arose regarding the ease of resolution. Improvements to online functionality, courtesy when explaining denials, proactively setting expectations for wait times and centralization of application information is likely to lead to more satisfactory outcomes.
Sixteen percent (16%) of clients report having experienced a problem in 2018-19, lower than last year. However, only one-third (33%) of those who did feel it was easily resolved, significantly lower than in 2017-18. The most common problems experienced are long/complicated applications, confusing online information, too long to provide benefit/decision and complaints about staff not being knowledgeable.
CPP-D and EI clients are most likely to have experienced a problem (32% and 24% respectively) and fewer CPP-D, OAS/GIS or SIN clients experienced a problem this year. Ease of problem resolution is highest for CPP clients (46%) and lowest for CPP-D clients (28%) and has declined for EI and SIN clients year over year.
As identified through the qualitative research, suggested improvements relate to greater online functionality, improved courtesy when explaining denials, proactively setting expectations for wait times and centralization of application information for better issue resolution.
Key Findings: Access to Service
Most vulnerable client groups continue to provide high ratings of the service experience. Satisfaction among Indigenous clients has improved year over year.
A strong majority of clients in vulnerable groups Service Canada serves had a positive service experience.
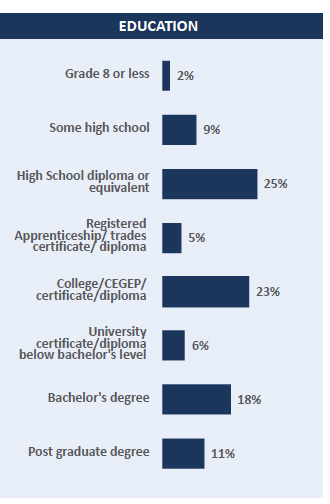
Compared to 2017-18, satisfaction with the service experience has improved substantially among Indigenous clients. Clients with less formal education are less satisfied year over year, however the vast majority provide a positive rating and ratings remain consistent with other clients.
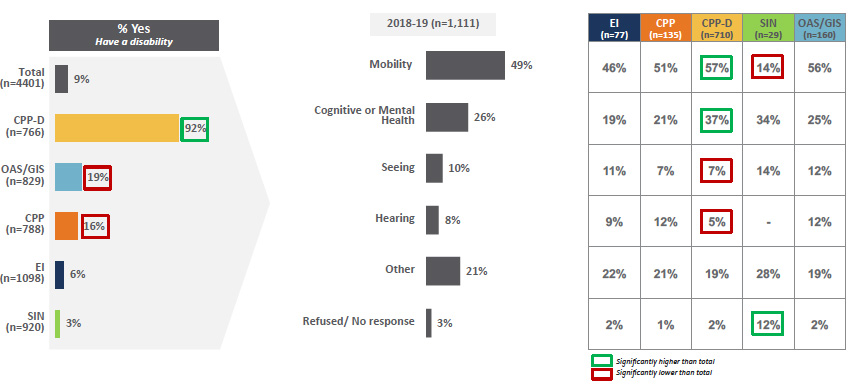
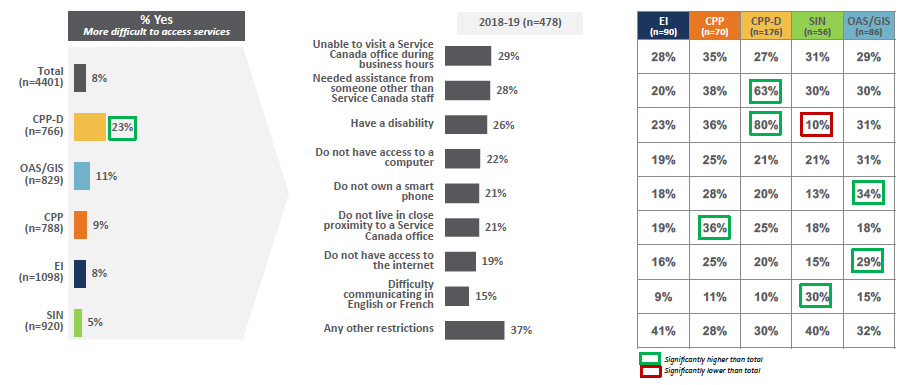
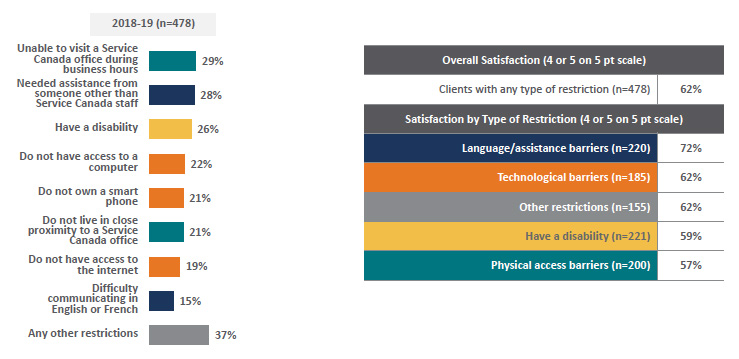
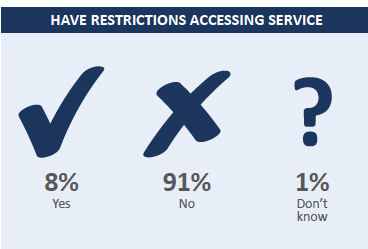
Clients with restrictions that make it more difficult to access service, and clients with disabilities need improvements to their service experience to bring their satisfaction up to the levels of other clients. Improving the simplicity of information, clarity of process and ease of accessing assistance, particularly regarding unique and complex situations, is likely to help to improve their experience.
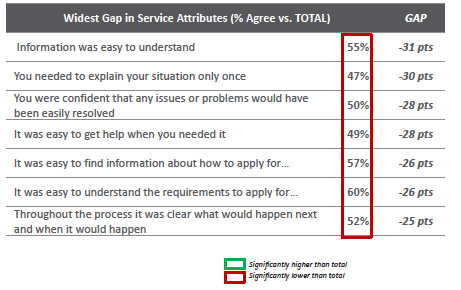
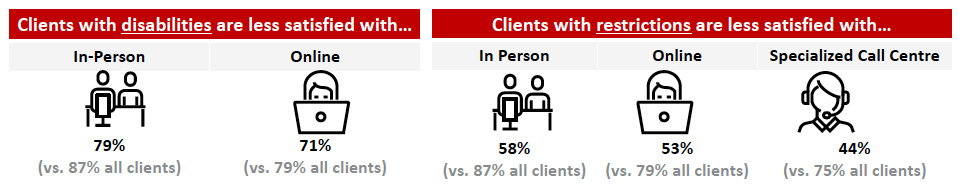
Clients have restrictions are more likely to have experienced a problem, have a longer client journey (specifically more than 8 weeks), and rate satisfaction with all channels lower compared to all clients. They are also less satisfied with several service attributes with the largest gaps for ease of understanding information, needing to explain your situation only once, ease of completing online, confidence in issue resolution and ease of getting assistance.
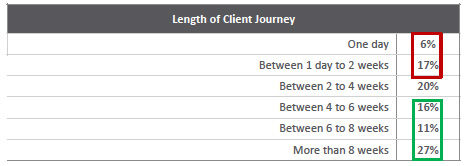
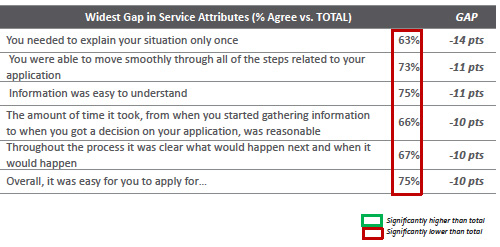
Clients with disabilities are significantly more likely to have experienced a problem, have a longer client journey (specifically 4 weeks or longer), and rate channel satisfaction lower for in-person and online. They are also less satisfied with several service attributes with the largest gaps for ease of completing online, needing to explain your situation only once, moving smoothly through all steps and ease of understanding information.
Key Findings: Service Transformation
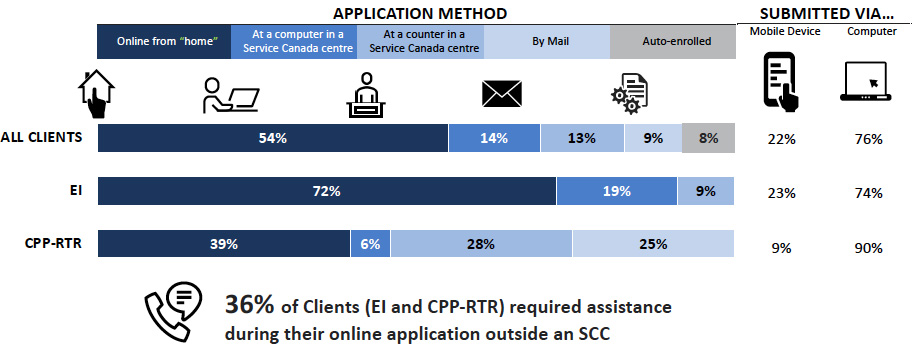
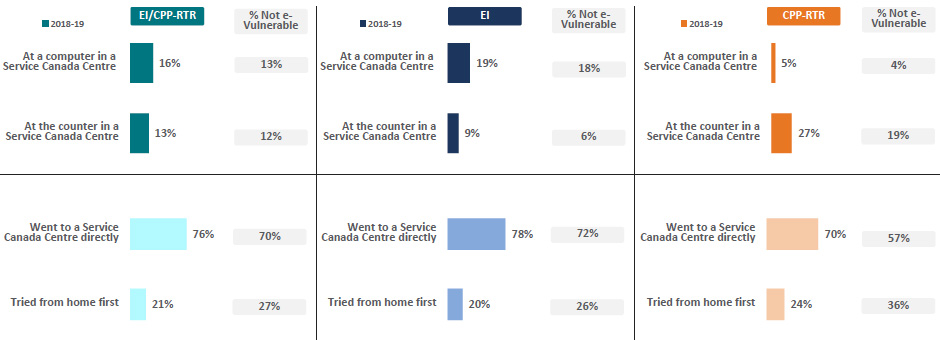
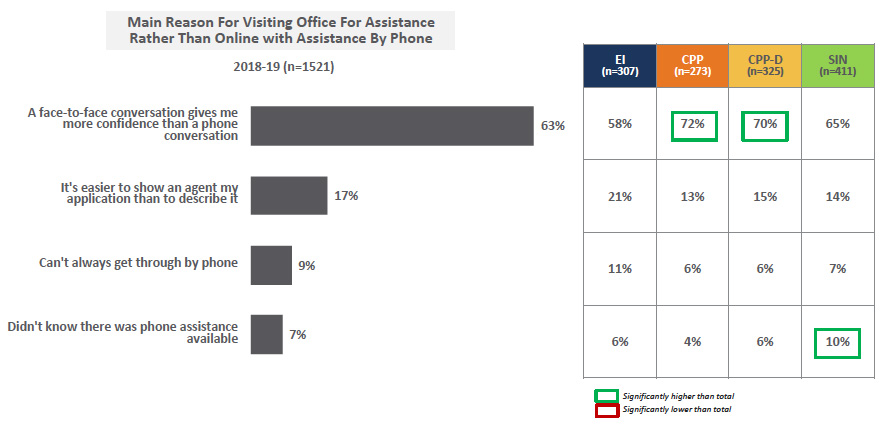
Clients who visited an office to apply, including those who had the option to complete online, did so due to the confidence and ease that they find through person-to-person contact. Having an officer explain the process, and provide assistance improves clients’ confidence that they applied correctly.
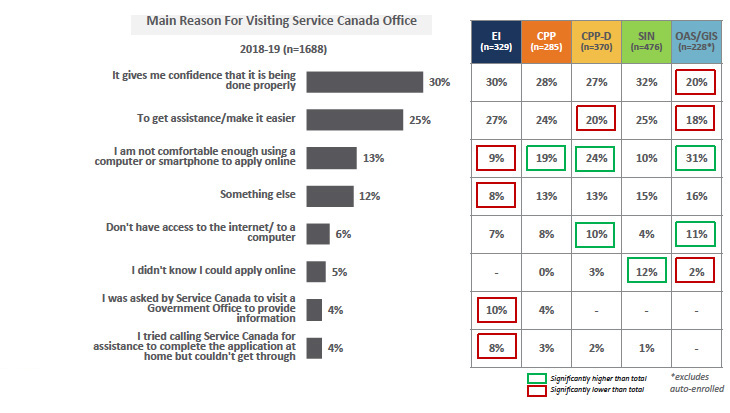
The main reasons clients prefer to visit a Service Canada Office are the confidence things are done properly, and to get assistance/make it easier. Further, OAS/GIS, CPP-D and CPP clients are more likely to say they are not comfortable applying online, while CPP-D and OAS/GIS clients are also more likely to report they don’t have access to the internet / to a computer.
Qualitatively, applying in-person was perceived to have a number of advantages over applying online. These include the confidence that their application was accurate and submitted, that it would be faster or easier than calling to get assistance and the desire to be “coached” through the application, to ensure greater chance of approval and/or to prevent delays.
The need for in-person channels will continue to exist particularly for more complex cases such as clients with restrictions to access service or those with a disability who rely more heavily on in-person channels.
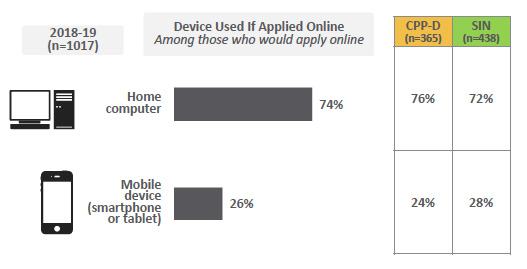
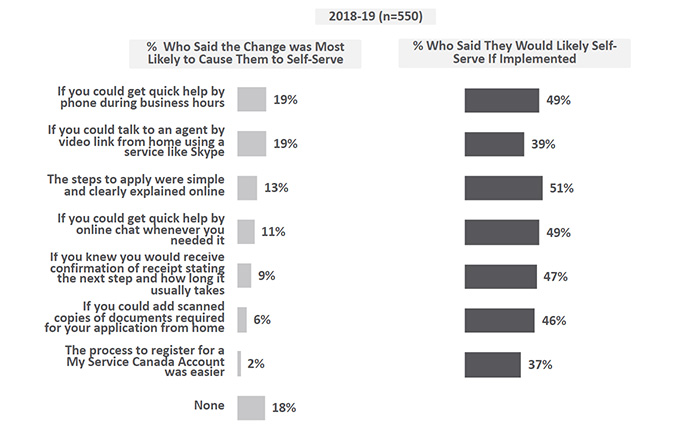
Nearly half of clients who have the option to self-serve would be influenced to do so through improved assistance, either through quick help by phone or chat, or through video link. These changes would help to provide clients with confidence they are following the process properly, which is a strong driver for choosing the in-person channel.
Quick help by phone during business hours and being able to talk to an agent by video link are most likely to drive clients to apply from home. If steps online were simpler and clearly explained or if quick help could be provided through online chat were motivating to some. Notably, two in ten said none of the proposed solutions would motivate them to apply from home.
As learnt through the qualitative research, attracting clients to self-service needs to fulfill their need for detailed information and instruction and providing some of the best aspects of the in-person experience. These include reassurance the application is accurate and actively being processed, confirmation that any supporting documents have been received, and ease of having their questions answered. Concerns with self-service would also need to be addressed including better communication of expectations for each step of the process and providing reassurance that their application matters.
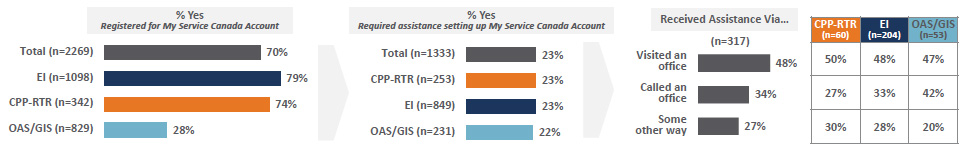
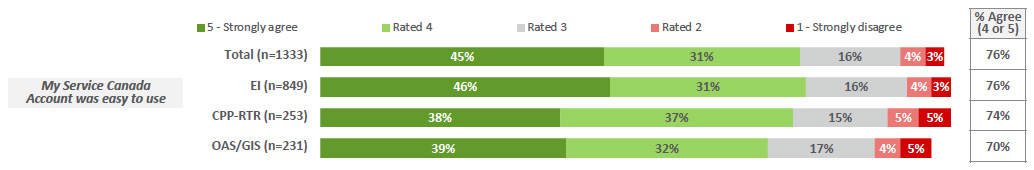
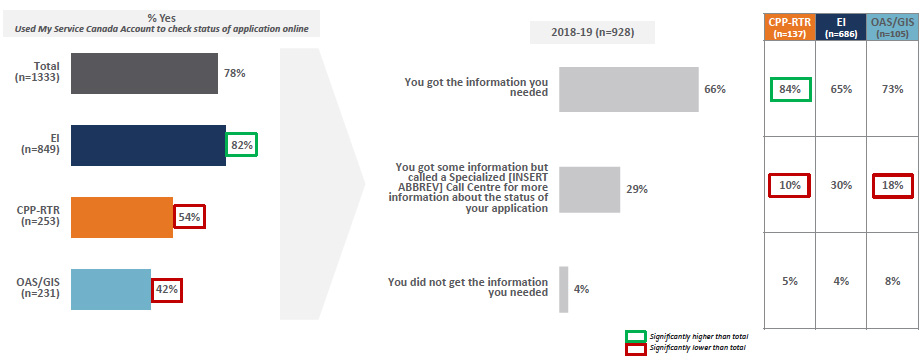
My Service Canada Account (MSCA) is helping to promote self-service by diverting clients away from phone channels. MSCA users value the platform for providing simple and easy access to information and improved clarity about the status of their application. Non-users lacked awareness of the platform and its functionality but found it appealing.
More than seven in ten EI and CPP-RTR clients said they registered for a My Service Canada Account (MSCA) during their application, while three in ten OAS/GIS clients said they did so. Three-quarters of those who said they registered for a MSCA found it easy to use, and ratings are consistent across EI, CPP-RTR and OAS/GIS clients.
Roughly one quarter of clients in each program required assistance setting up their MSCAs, with half of those clients going into an office for help while one-third called an office.
Nearly eight in ten used MSCA to check the status of their application and two-thirds of those who did got the information they needed. EI clients are far more likely to have checked the status of their application. CPP-RTR clients are more likely to have received the information they needed without calling Service Canada for assistance.
Qualitatively, the functionality offered by MSCA is universally appealing. However, many are unaware of the platform and/or about the range of functions and information available.
Clients say that use of MSCA would eliminate confusion and uncertainty about their application, and provide confidence their application was accurate, and actively being processed. The idea of a centralized “case management” system that they could access was extremely appealing. A few had issues with registering for an account and having a PIN number sent via email was appealing to most.
The main barriers to applying online from home are psychological and emotional. Clients are often applying for benefits for the first time and the importance of the support increases the need for reassurance and confidence.
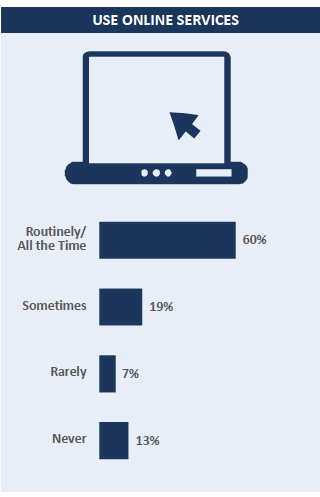
Almost all clients are actively using other online services on a regular basis. However, clients feel that the situations are not parallel in that they very rarely apply for government benefits – for many, they are applying for the first time.
Further, the gravity and importance of what they are applying for means that they have a heightened sense of needing reassurance and feeling confident in the process.
Findings indicate that the following can help to increase uptake of self-service among clients:
MANAGE TIMELINESS EXPECTATIONS – better communicate the steps in the process including how long each step can take up, the client’s role throughout including key milestones, and of ways to receive assistance or information without going in-person (i.e. 1 800 O Canada, MSCA);
AVAILABILITY OF ASSISTANCE – nearly half of clients who have the option to self-serve could be influenced to do so through improved assistance, either through quick help by phone or chat, or through video link; these changes could help to provide clients with confidence they are following the process properly, which is a strong driver for choosing the in-person channel.
CONFIDENCE – clients want to know that their application is important and being actively considered. Service Canada staff excel at making clients feel valued and this represents a shortcoming of the self-service experience at present:
CERTAINTY – providing assurance that their application has been filled out correctly is a strong desired outcome and represents a primary reason clients choose to access services in-person for assistance;
CLARITY – explaining each question in the application, and how to navigate the process overall are key benefits of the in-person channel that could be integrated into other channels;
Background and Objectives
Research Background and Objectives
In line with the Treasury Board Policy on Service which outlines the key principles to achieve better and more efficient design and delivery of Government of Canada services and ESDC’s Service Strategy and Service Transformation Plan the Department required data on its service experience from the client’s perspective to assist in effectively managing service delivery.
In 2017, the Citizen Service Branch launched the annual Client Experience (CX) Survey as part of a structured approach to collecting feedback from clients to track how well Service Canada is delivering federal programs through its service channels.
The survey assesses the extent to which the service design works for clients as they go through the process of accessing programs through Service Canada’s service delivery system.
The Client Experience Measurement Project was conducted in two phases. The first phase involved executing the Client Experience (CX) Survey while the second phase included a series of online focus groups and in-depth interviews with clients identified through the quantitative survey.
Having fielded the baseline wave in 2017-18, the CX Survey in 2018-19 collected trend data to contribute to monitoring the service delivery performance of Service Canada, and to report annual satisfaction to meet service standards on the client experience. The survey also devoted space to assessing the impact of potential changes to channel delivery to meet these client needs on channel use.
Further, the qualitative component explored why clients who are used to transacting online choose to use the in-person channel and the extent to which they would or would not shift to using the online channel in response to proposed innovations. The qualitative portion was also used to better understand the service experience among those who encountered a problem or issue or expressed dissatisfaction with their overall experience.
The research objectives for the quantitative phase were to:
To establish the emerging trend-line on the ease and effectiveness of, and satisfaction with the end-to-end service experience, given the program, client group, and service channels used.
To determine what changes to service design would influence more clients to use self-service or assisted self-service.
To determine which clients would likely use self-service or assisted self-service in response to proposed changes, and which clients would likely continue to need fully assisted service, given the unique requirements of each program.
The research objectives for the qualitative phase were to:
To explore why clients who are used to transacting online but have chosen to use the in-person channel for transactions with Service Canada would or would not shift to using the online channel in response to proposed innovations.
To understand how proposed changes meet the needs of clients who say they would use the online channel, and why they would not meet the needs of clients’ who say they would continue to use the in-person channel.
To gain insight into the service experience among those who encountered a problem or issue or expressed dissatisfaction with their overall experience.
Service Canada Client Experience Survey Model
Service Canada Client Experience (CX) Survey Measurement Model
Service Canada developed the survey model below as a consistent framework for assessing the service experience of its clients.
The methodology for the Client Experience Survey was initially implemented in 2017-18. In the 2018-19 wave of the survey, the questionnaire was limited to the overall experience rather than also assessing each stage of the client journey. This approach was used in the survey’s second year to gather data to inform service transformation as well as track results as changes in the service experience were not expected to be evident within one year.
Figure long description
Service Dimension-Ease
Service Attributes
simplicity
clarity
Convenience
Service Dimension-Effectiveness
Service Attributes
Availability
Timeliness
Consistency
Efficiency
Service Dimension-Confidence
Service Attributes
Attitude
Confidence
Service Attributes connect to Overall experience
Aware-seek general information;
to Apply-Submit application;
to Follow-up-Seek/receive/provide info/application submitted;
to decision-receive service outcome (first decision)
Overall Experience connected to Client Satisfaction
Note: The Model was drawn from a combination of existing models to suit Service Canada context, and validated through consultation with internal stakeholders. The existing models include: The Common Measurements Tool (CMT), owned and licensed by the Institute for Citizen-Centred Service (ICCS), the client survey model used by the Government of Quebec, and Forrester’s approach to client experience measurement.
Service Canada CX Survey Measurement Model: Service Attributes
The following is the full set of detailed service attributes in the model that guided the development of the baseline questionnaire.
Figure long description
EASE
SIMPLICITY
Overall ease
Service/Information is easy to find / it is easy to figure out where to go
Clients tell story once/input personal info. only once
CLARITY
Information is easy understand
Process is easy to determine (e.g. how to get assistance, steps to follow, documents required.)
CONVENIENCE
Can get to the required information easily (in-person, online)
EFFECTIVENESS
ACCESS
Receive relevant information without asking (e.g. proactive service, bundling)
Able to get help when needed (for example, information available, agent available)
Service in official language of choice/ documents available in official language of choice in person
Providing feedback is easy
Process/Stage/Status are transparent
TIMELINESS
Reasonable amount of time to access the service, complete service task, wait to receive information and service/product, or resolve issue
CONSISTENCY
Consistent information received from multiple Service Canada sources (e.g. two separate call centre agents)
EFFICIENCY
Process is easy to follow to complete task. (e.g. procedures are straight-forward)
Able to get tasks completed/issues resolved with few contacts
Clients know what to do if they run into a problem
Move smoothly through the steps (not stuck, bounced around or caught in a loop)
Confidence
ATTITUDE
The interaction with service agents is respectful, courteous and helpful
The service agents demonstrate understanding and ability to address client’s concerns/urgency
ASSURANCE
Client’s personal information is protected
Client confident that he/she is following the right steps (i.e. not concerned about the process)
Client knows when information/decision will be received or the next step will be completed
Confident that any problem that arises will be resolved
Client Perception
Satisfaction with overall service experience
Trust in Service Canada to deliver services effectively
Research Approach
Overview- Quantitative Approach
A telephone survey was conducted with a sample of 4,401 Service Canada clients across the six major programs, with between 600 and 1,100 respondents interviewed about their experience with each program. The interviews were conducted from March 6 to March 31, 2019.
In order to examine the overall service experience, including how clients used the various channels to complete the steps of their client journeys, the clientele was defined as clients who had recently completed a client journey, up to initial decision.
The sample of clients who had received a service outcome during August, September or October 2018 were randomly selected from program administrative databases (for CPP-D and OAS/GIS the period was extended to December 2018 to gather sufficient sample). Comparisons of findings to the baseline data must take into account that the 2017-18 survey wave largely sampled clients who received a service outcome in April, May or June 2017.
The sample was stratified by program. Weighting adjustments were made to bring the sample into proportion with the universe by age, gender and region within each program, and to bring the over-sampled groups back to their proportion among clients.
Data based on the total population has a margin of error of +/-1.5% at the 95% confidence interval, while data based on sub-groups have a larger margin of error. For example, the margin of error for data for each program is between +/-4% to +/-2.9%.
The data have been weighted in proportion to age/gender/region proportions, and by program volume.
Data Collection- Quantitative Approach
The questionnaire was developed based on the Service Canada Client Experience Measurement Model. The 2017-18 CX Survey was used as the baseline instrument and modifications were made to reflect the specific research objectives of the 2018-19 CX Survey. The questionnaire was pretested on March 4 and fieldwork took place between March 6 and March 31, 2019.
Experienced, trained interviewers were specifically briefed on the requirements of this study. A minimum of 10% of each interviewers’ calls were monitored by a team leader.
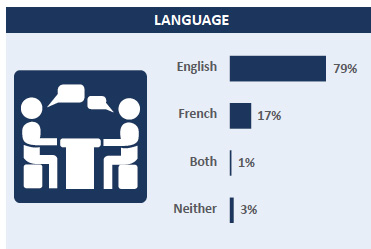
Respondents were interviewed in their choice of English or French. For those who could not respond in either language, a proxy respondent (who had assisted them in contacting Service Canada) could respond on their behalf. In addition, interviews were conducted with respondents who could not speak either official language using an on-demand translation service.
Oversamples were conducted with two vulnerable client groups: those living in remote areas and Indigenous clients (See Appendix A for the definitions of vulnerable client groups.) This was done to provide a minimum of 400 completed interviews with each group.
Calibration of the Data- Quantitative Approach
A multi-tiered approach has been used to weight the data from the sample for the Client Experience survey into proportion with the universe of ESDC clients. Steps in the weighting comprised:
Adjust to the universe proportions of age, gender and region for each program.
Weight over-sampled populations back into proportion to their presence in the universe.
Weight the number respondents in each program in proportion to the total number of clients.
Weight the number respondents by each region in proportion to the total number of clients.
Adjust to the universe proportions of benefit receipt for each program.
OAS and GIS have been combined into one client group in the 2018-19 CX Survey and weighting for age, gender, region and benefit receipt were applied based on combined program figures. The proportion of clients in each program were weighted separately.
The universe proportions used to develop the targets are based on data extracts provided by the client.
Additional details on the methodology are provided in Appendix A. A description of the sampling strategy, weighting and limitations are provided under separate cover, together with the survey questionnaire and the focus group discussion guide.
To ensure comparability of results between 2017-18 and 2018-19 the proportions of clients by program were held consistent and based on composition of the clientele in May of 2017-18.
Overview- Qualitative Approach
A series of 6 qualitative online focus group discussions were convened between May 7 and May 9, 2019.
4 groups for Attracting Clients to Self-Service:
1 with 6 participants who applied for EI in person but are not e-vulnerable
1 with 5 participants who applied for CPP in person and 1 for EI but are not e-vulnerable
1 with 6 participants who applied for CPP-D in person
1 with 8 participants who applied for EI and CPP online (control group)
2 Groups for Dissatisfaction / Issue Resolution:
1 with 5 participants (3 CPP-D, 1 OAS, 1 EI)
1 with 6 participants (4 CPP, 1 OAS, 1 EI)
All sessions were 90 minutes in length and hosted on Ipsos’ Ideation Exchange platform, and all participants also dialed into a teleconference line. All were in English.
A series of 6 telephone interviews were conducted between May 23 – 28, 2019 in French. 5 were with EI applicants and 1 was with an OAS applicant.
Detailed Findings - Performance
Summary: Performance
Service Canada’s clientele remain largely satisfied with the service experience and ratings remain stable year over year.
The vast majority of Service Canada’s clientele remain satisfied with the service experience (85%) and found it easy (85%) and effective (84%). Improvements have been made to effectiveness compared to last year and a greater proportion of clients provide the highest ratings for ease and effectiveness, while fewer provide the highest rating for overall satisfaction.
Clients also express a high degree of trust (83%) in Service Canada to deliver services effectively to Canadians (a new measure for 2018-19). Trust is highly correlated to overall satisfaction in the service experience.
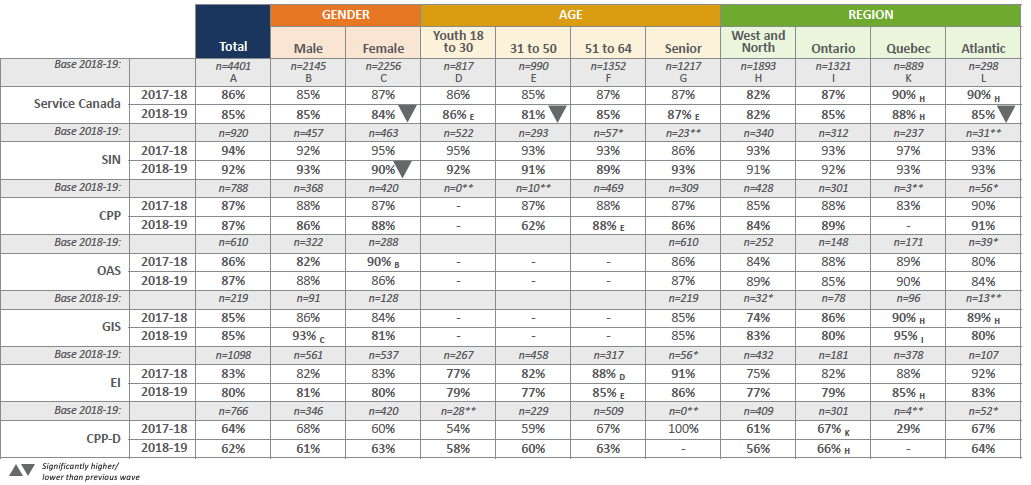
Satisfaction by program is stable and remains higher for SIN clients and lower for EI and CPP-D clients.
Over nine in ten (92%) SIN clients express satisfaction with the service experience, the highest of any program and consistent with 2017-18. Eight in ten EI clients (80%) and closer to six in ten CPP-D clients (62%) are satisfied overall, lower than other programs and statistically unchanged year over year.
Clients remain most satisfied with the in person experience, while satisfaction is lowest for specialized call centres. Challenges with the specialized call centres were detected in this survey period.
The large majority of clients remain satisfied with each service channel. Satisfaction with in person service remains the highest (87%), followed by online (79%), and specialized call centres (75%).
A decline in satisfaction among those who used specialized call centres has been observed. Further, fewer clients provide the highest ratings for all service channels than last year.
The profile of clients who are not satisfied with their service experience remains consistent with 2017-18.
They remains largely EI clients, with higher incidence of problems (and lower ease of resolution among those who did), a higher number of contacts during the client journey.
They are more likely to have been denied a benefit, to be highly educated, and to reside in the West/ Territories.
They are also less satisfied with several service attributes with the largest gaps for timeliness of service, confidence in issue resolution, clarity of the process, ease of getting assistance, and receiving consistent information.
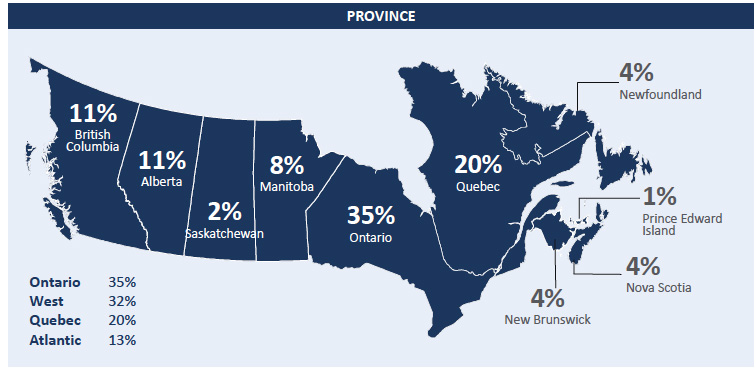
Satisfaction with the service experience is slightly higher than average in Quebec and slightly lower than average in the West. Clients in Atlantic Canada express lower satisfaction with their experience than in 2017-18.
The vast majority of clients in all regions are satisfied with their service experience, however clients from the West / Territories provide lower ratings than clients from other regions.
Lower satisfaction in the West/ Territories can be attributed to lower ratings in a number of areas including: satisfaction with specialized call centres and online, confidence in issue resolution, ease of getting assistance and length of client journey being considered reasonable (however they are no more likely to have had a longer experience than clients from other regions). They are also more likely to have experienced a problem than clients from other regions.
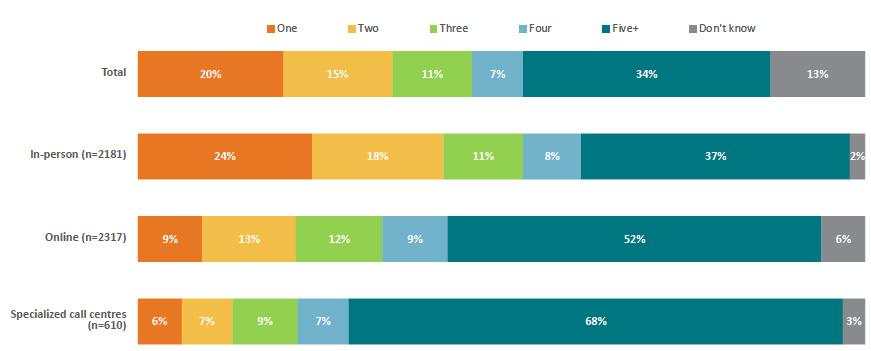
Most clients were in contact with Service Canada up to three times during the client journey. Notably, one third of clients say they had contact five or more times and express lower satisfaction than those with fewer contacts. Number of contacts is highest for EI and CPP-D clients and those who went online or called a specialized call centre.
Among all clients, nearly half had contact with Service Canada up to three times- two in ten were in contact once, roughly one in ten twice and one in ten three times. Fewer than one in ten clients had contact four times, while one-third contacted Service Canada 5 or more times.
Number of contacts differs by program with EI and CPP-D clients most likely to have contacted Service Canada 5+ times, while SIN and OAS/GIS are most likely to have contacted Service Canada 1 or 2 times.
Performance: Trend in key client experience measures
Satisfaction remains high and stable with improvements made to effectiveness year-over year.
Figure long description
Satisfaction icon of man smiling
Ease icon of fingers snapping
Effectiveness icon of thumbs ups
Trust icon of hands holding each other
Satisfaction
Ease Overall, it was easy to apply for
Effectiveness You were able to move smoothly through the steps
Trust
You trust Service Canada to deliver services effectively to Canadians
2018 - 19
85%
85%
84%
83%
2017 -18
86%
84%
82%
Strong correlation between trust and satisfaction *
Throughout the report statistically significant differences between 2017-18 and 2018-19 data have been identified with green (increase) and red (decrease) arrows. Only statistically significant differences have been identified.
* The correlation coefficient between the overall satisfaction and trust in delivering services effectively is R= 0.618 which shows a strong correlation between these service dimensions.
Satisfaction With The Overall Service Experience
Overall, a large majority of clients are satisfied with the service experience, on par with 2017-18. This finding reflects the composition of the clientele, half of which are EI clients, and nearly a third of which are SIN clients.
Year over year, ratings have softened with fewer clients providing a rating of 5 for their overall experience and a greater proportion providing a ratings of 4.
Figure long description
2017-18 (n=4001):
5-very satisfied, 63%;
Rated 4, 24%;
Rated 3 9%;
Rated 2 3%;
1-Very dissatisfied 2%
2018-19 (n=4401):
5-very satisfied, 58%, significant decrease;
Rated 4, 27%, Significant increase;
Rated 3, 9%;
Rated 2, 3%;
1%, 1-Very dissatisfied
Percent Rating 4 or 5
2017-18: 86%
2018-19: 85%
Pie Chart, Proportion of Clients by Program in the Clientele
48%, EI
10% CPP
2% CPP-D
29% SIN
Note: The clientele consisted of those who had recently experienced a client journey. The proportion of clientele by program was calculated from volumes in the program administrative databases in May, 2017. Passport clients were surveyed separately by Immigration, Refugees and Citizenship Canada.
Base: All respondents. Totals may not add to 100 due to rounding.
Overall service experience section: Q38a. How satisfied were you with the service you received from Service Canada related to your [insert abbrev] application? please use a 5-point scale, where 1 means very dissatisfied, and 5 means very satisfied.
Overall Ease and Effectiveness
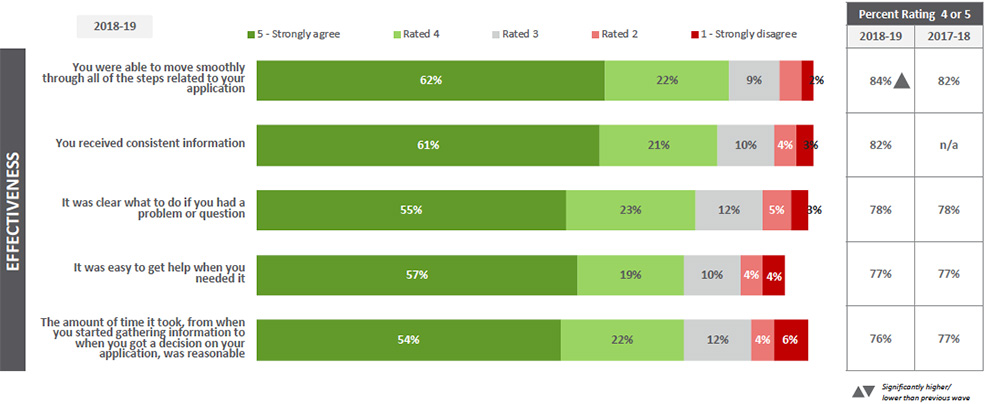
Consistent with 2017-18, a large majority of clients feel the service experience is easy and effective
A greater proportion of clients say the service experience is effective than in 2017-18 and more clients provided a rating of 5 for both ease and effectiveness than in 2018-19
Figure long description
Overall, it was easy to apply for…
2017-2018 (n=3043):
5-Strongly agree, 59%;
Rated 4, 25%;
Rated 3, 10%;
Rated 2, 3%;
1-Strongly disagree, 3%
2018-2019 (n=3073):
5-Strongly agree, 63%, significantly increased from last year;
Rated 4, 23%;
Rated 3, 9%;
Rated 2, 3%;
1-Strongly disagree, 3%
(right) Percent Rating 4 or 5
2017-18: 84%
2018-19: 85%
You were able to move smoothly through all of the steps:
2017-2018 (n=3639);
5-Strongly agree,59%;
Rated 4, 22%; Rated 3, 12%;
Rated 2, 3%;
1-Strongly disagree, 3%;
don’t know, 1%
2018-2019 (n=3993);
5-Strongly agree, significant increase, 62%;
Rated 4, 22%;
Rated 3, 9%;
Rated 2, 4%;
1-Strongly disagree, 2%
(right) Percent Rating 4 or 5:
2017-18: 82%;
2018-19: 84%
Base: All respondents excluding those who were automatically enrolled in OAS and SIN applicants
Overall service experience section: Q36b. Thinking about the service you received, how much do you agree or disagree with the following statements… Overall it was easy for you to apply for [insert abbrev]?
Base: All respondents excluding those who were automatically enrolled in OAS
Q36b. Thinking about the service you received, how much do you agree or disagree with the following statements… You were able to move smoothly through all of the steps related to your [insert abbrev] claim/ application?
Overall, it was easy to apply for…
Trust in Service Canada and Relationship with Satisfaction
A strong majority of clients trust Service Canada to deliver services effectively to Canadians. This measure is strongly correlated to overall satisfaction.
Figure long description
5-trust a great deal, 54%;
Rated 4, 29%;
Rated 3, 11%;
Rated 2, 3%;
1-Do not trust at all, 2%;
Percent Rating 4 or 5, 83%
There is a strong correlation between trust in Service Canada and overall satisfaction (0.618).
Base: All respondents
Q38b. How much would you say you trust Service Canada to deliver services effectively to Canadians? Please use a 5-point scale, where 1 means do not trust at all, and 5 means trust a great deal.
Service Channel Assessments
Satisfaction with service channels differs by program: CPP-D clients rate their satisfaction with all channels lower compared to all clients, EI clients provide lower ratings for in person, while OAS/ GIS provide lower ratings for online. SIN clients provide higher ratings for in person.
Compared to 2017-18, EI clients provide lower ratings for specialized call centres, while CPP clients provide higher ratings.
Figure long description
Service Channel Assessment, % Rating 4 or 5 out of 5 (2018-19), horizontal bar chart:
Total, n=4401;
[icon of person sitting at desk], in-person, 87%;
[icon of person on computer], Online, 79%;
[icon of person with calling headset on], specialized call centres, 74%, significantly less than last year
Total Service Channel Assessment, % Rating the service provided by the channel as 4 or 5 out of 5, excluding SIN clients, n=3491:
In-person, 83%;
Online, 79%;
Specialized call centres, 74%, significantly lower than last year
Total Service Channel Assessment, % Rating the service provided by the channel as 4 or 5 out of 5, by program:
In-person;
EI, 80%, significantly higher than total;
CPP, 90%;
CPP-D, 68%, significantly lower than total;
SIN, 94%, significantly higher than total;
OAS/GIS, 41%, significantly lower than total
Online;
EI, 79%;
CPP, 76%;
CPP-D, 59%, significantly lower than total;
SIN, 84%;
OAS/GIS, 74%, significantly lower than total
Specialized call centres
EI, 74%, significantly lower than last year;
CPP, 80%, significantly higher than last year;
CPP-D, 64%, significantly lower than total;
SIN, 73%;
OAS/GIS, 79%
Q27. How satisfied were you with the overall quality of service you received from… ? (n=Base vary)
Change in Satisfaction by Channel
Satisfaction with in person service remains the highest, followed by online, and specialized call centres.
Compared to the 2017-18 data, there has been a decline in satisfaction among those who used specialized call centres. Also, fewer clients provide ratings of 5/5 for all service channels than last year while a higher proportion provide a rating of 4/5.
Figure long description
In-person, [icon of a person sitting at a desk]
2017-18 (n=1324):
5-very satisfied, 68%;
Rated 4, 21%;
Rated 3, 8%;
Rated 2, 2%;
1-Very dissatisfied, 2%
2018-19 (n=2181):
5-very satisfied, 61%, significantly lower than last year;
Rated 4, 26%, significantly higher than last year;
Rated 3, 8%;
Rated 2, 2%;
1-Very dissatisfied, 2%
(right) Percent Rating 4 or 5
2017-18: 85%
2018-19: 87%
Online [icon of a person on computer]
2017-18 (n=1089);
5-very satisfied, 47%;
Rated 4, 32%;
Rated 3, 13%;
Rated 2, 4%;
1-Very dissatisfied, 3%
2018-19 (n=2317):
5-very satisfied, 43%, significantly lower than last year;
Rated 4, 36%, significantly higher than last year;
Rated 3, 14%;
Rated 2, 4%;
1-Very dissatisfied, 2%
(right) Percent Rating 4 or 5:
2017-18: 79%;
2018-19: 79%
(below) Specialized call centers (excluding SIN) [icon of a person with headset on]:
2017-18 (n=511):
5-very satisfied, 54%;
Rated 4, 28%;
Rated 3, 12%;
Rated 2, 4%;
1-Very dissatisfied, 3%
2018-19 (n=855):
5-very satisfied, 48%, significantly lower;
Rated 4, 28%;
Rated 3, 16%, significantly higher;
Rated 2, 4%;
1-Very dissatisfied, 5%
(right) Percent Rating 4 or 5
2017-18: 82%
2018-19: 75%
Base: Used [INSERT SERVICE CHANNEL]
Q27. How satisfied were you with the overall quality of service you received from… ?
Change in Satisfaction by Program
Satisfaction by program is stable compared to 2017-18.
Satisfaction remains higher for SIN clients, and lower for EI and CPP-D clients.
Satisfaction by Program (% Rated 4 or 5)
Figure long description
SIN;
2017-18: 94%;
2018-19: 92%
CPP;
2017-18: 87%;
2018-19: 87%
OAS/GIA;
2017-18: 86%;
2018-19: 87%
EI;
2017-18: 83%;
2018-19: 80%
CPP-D:
2017-18: 64%;
2018-19: 62%
Base: All respondents
Q38a. How satisfied were you with the service you received from Service Canada related to your [insert abbrev] application? please use a 5-point scale, where 1 means very dissatisfied, and 5 means very satisfied.
Change in Satisfaction by Region
Consistent with 2017-18, satisfaction with the service experience was slightly higher than average in Quebec and slightly lower than average in the West. Clients in Atlantic Canada expressed lower satisfaction with their experience than in 2017-18.
Satisfaction By Region
Figure long description
Clients from the West / Territories provide lower ratings for several areas including:
Satisfaction with specialized call centres or the online channel
Confidence in issue resolution
Easy of getting assistance when needed
Length of client journey was reasonable
They are more likely to have experienced a problem
[Map of Canada divided by region]
West/Territories;
2018-19, 82%;
2017-18, 82%
Quebec;
2018-19, 88%;
2017-18, 90%
Atlantic;
2018-19, 85%, significant decrease from last year;
2017-18, 90%
Ontario
2018-19, 85%;
2017-18, 87%
Base: All respondents.
Overall service experience section: Q38a. How satisfied were you with the service you received from Service Canada related to your [insert abbrev] application? please use a 5-point scale, where 1 means very dissatisfied, and 5 means very satisfied.
Profile of Clients Who Are Not Satisfied
The profile of clients who were not satisfied with their service experience is consistent with 2017-18.
They are largely EI clients who are highly educated but report running into problems, a longer client journey and multiple contacts.
Figure long description
15% of clients were not satisfied. They were largely clients who were:
EI clients (63%)
Highly educated (64% have college education or higher)
Higher incidence of problems (51%)
Longer client journey (59% 4 weeks or longer)
Higher number of contacts with Service Canada (48% were in contact 5 or more times)
A minority of those who were dissatisfied:
Were denied benefits (28%)
Have a disability (13%)
Level of Satisfaction by Number of Contacts
As in 2017-18, the level of satisfaction with the service experience is notably lower among those who had five or more contacts with Service Canada through any channel during the client journey.
Figure long description
Satisfaction by Number of Contacts, Horizontal bar chart, 2018-2019, n=4401:
Total, 85%;
1 time, 90%;
2 times, 85%;
3 times, 88%;
4 times, 90%;
5 or more times, 79%
Base: All respondents
Q1c. And, how many times did you… [IF MULTIPLE SOURCES SELCTED AT Q1a ‘use each of the following’ IF ONLY ONE SOURCE SELECTED AT Q1a ‘INSERT SINGLE ITEM FROM LIST BELOW’] during your experience with [INSERT ABBREV]?
Number of Times Contacted Service Canada
Among all clients, most say they contacted Service Canada up to three times during their client journey however one third of clients had contact five or more times.
Number of contacts differs by program with EI and CPP-D clients most likely to have contacted Service Canada 5+ times, while SIN and OAS/GIS are most likely to have contacted Service Canada 1 or 2 times.
Figure long description
Number of Times Contacted Service Canada, 2018-2019, n=4401, Bar chart:
Total;
One, 20%;
Two, 15%;
Three, 11%;
Four, 7%;
5+, 34%;
Don’t know, 13%
EI
One, 13%;
Two, 11%;
Three, 9%;
Four, 7%;
5+, 48%;
Don’t know, 12%
CPP
One, 18%;
Two, 20%;
Three, 15%;
Four, 9%;
5+, 28%;
Don’t know, 10%
CPP-D
One, 11%;
Two, 14%;
Three, 10%;
Four, 8%;
5+, 43%;
Don’t know, 15%
SIN
One, 30%;
Two, 19%;
Three, 11%;
Four, 6%;
5+, 18%;
Don’t know, 15%
OAS/GIS
One, 21%;
Two, 21%;
Three, 11%;
Four, 8%;
5+, 21%;
Don’t know, 18%
Base: All respondents
Q1c. And, how many times did you… [IF MULTIPLE SOURCES SELCTED AT Q1a ‘use each of the following’ IF ONLY ONE SOURCE SELECTED AT Q1a ‘INSERT SINGLE ITEM FROM LIST BELOW’] during your experience with [INSERT ABBREV]?
Drivers of Satisfaction
Summary: Drivers of Satisfaction
The most prominent drivers of satisfaction in the service experience remain consistent year over year*.
The top drivers include: the amount of time it took from start to finish was reasonable, Service Canada Agents were helpful, ease of getting assistance when needed, receiving consistent information and confidence in issue resolution.
Timeliness of service has taken on increased prominence in driving satisfaction. Providing a mechanism to better manage expectations regarding wait-times and the timeline for a decision is likely to help to improve satisfaction among clients.
The ease of receiving assistance throughout the client journey is strongly tied to confidence in issue resolution as well as overall satisfaction and trust. It provides clients with the reassurance they desire throughout the different stages of the application process.
Common areas for potential improvement for Service Canada clientele as a whole also remain consistent year over year. Results indicate that the service attributes which most strongly drive satisfaction where performance is lowest relative to other areas include the timeliness of service, ease of getting assistance, and ease of issue resolution.
In order to summarize what potential changes could result in an increase in overall satisfaction, the service attributes that most strongly drive satisfaction for Service Canada clients were determined and compared to Service Canada’s performance against these attributes.
The helpfulness of Service Canada Agents remains a prominent strength for the organization and an area that should be protected to maintain high satisfaction scores.
The resulting analysis found that common areas for potential improvement include the timeliness of the overall client journey, the ease of getting help when needed, and the confidence in issue resolution.
Summary: Performance
Most clients continue to feel timeliness of service is reasonable, however experience differs by program and is least reasonable for EI and CPP-D.
Overall, three-quarters of clients (76%) say the timeliness of service was reasonable, consistent with 2017-18. SIN (87%), CPP (83%) and OAS/GIS clients (80%) are the most likely to rate the timeliness of service as reasonable, while EI (69%) and CPP-D clients (49%) are least likely. OAS/GIS are more likely to agree the timeliness of service was reasonable than in 2017-18.
SIN clients had the shortest client journey, while CPP-D clients had by far the longest experience. Timeliness of service being considerably reasonable steadily decreases the longer the experience and clients whose experience was 6 weeks or longer are considerably less likely to find it reasonable.
Fewer clients experienced a problem this year however issues have arisen with timeliness of service and clarity and efficiency of process.
Sixteen percent (16%) of clients report having experienced a problem in 2018-19, lower than last year. However, only one-third (33%) of those who did feel it was easily resolved, significantly lower than in 2017-18. The most common problems experienced are long/complicated applications, confusing online information, too long to provide benefit/decision and complaints about staff not being knowledgeable.
CPP-D and EI clients are most likely to have experienced a problem (32% respectively) and fewer CPP-D, OAS/GIS or SIN clients experienced a problem this year. Ease of problem resolution is highest for CPP clients (46%) and lowest for CPP-D clients (28%) and has declined for EI and SIN clients year over year.
As identified through the qualitative research, suggested improvements relate to greater online functionality, improved courtesy when explaining denials, proactively setting expectations for wait times and centralization of application information for better issue resolution.
Drivers of Satisfaction
The primary drivers of satisfaction in the service experience are: the amount of time it took from start and to finish was reasonable, the helpfulness of Service Canada Agents, ease of getting assistance when needed, receiving consistent information, confidence in issue resolution and clarity of information. Compared to 2017-18, timeliness of service has taken on increased importance in driving satisfaction and has become the most prominent factor.
The strength of the model has improved year over year with the inclusion of new variables that couldn’t be included in 2017-18 (including Service Canada Agents were helpful) increasing the R2 from 0.51 to 0.66.
Figure long description
horizontal bar chart:
The amount of time it took was reasonable, 0.327;
Service Canada Agents were helpful, 0.186;
It was easy to get help when you needed it, 0.112;
You received consistent information, 0.096;
You were confident that any issues or problems would have been easily resolved, 0.085;
Information was easy to understand, 0.063;
Overall, it was easy for you to apply for [program], 0.058;
Being able to complete steps online made the process easier for you, 0.043;
You needed to explain your situation only once, 0.043;
It was clear what to do if you had a problem or question, 0.042;
You were able to move smoothly through all the steps related to you [program] application, 0.041;
Throughout the process it was clear what would happen next and when it would happen, 0.038;
Received/Denied Benefit, 0.034;
It was easy to understand the requirements to apply for [program], 0.021;
It was easy to find information about how to apply for [program], 0.016;
You were confident that your personal information was protected, 0.014;
It was easy to access service in a language I could speak and understand well, 0.007;
You were provided with service in your choice of English or French, 0.005;
You were confident you had everything you needed when you submitted your application, 0.005
*Numbers shown are standardized regression coefficients (Beta weights), which range from 0 to 1, reflecting the impact of attributes on variation in overall satisfaction.
Impact of Outcome on Satisfaction
As seen on the previous slide, the service outcome, that is being granted or denied benefits, is not a prominent driver of satisfaction with the service delivery. Consistent with 2017-18, a majority of CPP and EI clients who were denied benefits responded they were satisfied.However, a majority of CPP-D clients who were denied benefits responded that they were not satisfied.
Satisfaction rates for those who were declined benefits has dropped among EI clients.
Figure long description
% Approved/Denied
CPP
2017-18 (n=652):
98%, approved;
2%, denied
2018-19 (n=788):
98%, approved;
2%, denied
EI
2017-18 (n=703):
81%, approved;
19%, denied
2018-19 (n=1098):
88%, approved;
12%, denied
CPP-D
2017-18 (n=658):
60%, approved;
40%, denied
2018-19 (n=766):
61%, approved;
39%, denied
(below) Percent Rating Satisfaction as 4 or 5
CPP
Approved:
2017-18, (n=652), 88%;
2018-19, (n=788), 87%
Denied:
2017-18, (n=652), 67%;
2018-19, (n=788), 72%
EI
Approved:
2017-18, (n=703), 85%;
2018-19, (n=1098), 84%
Denied:
2017-18, (n=703), 73%;
2018-19, (n=1098), 55%, significantly lower than last year
CPP-D
Approved:
2017-18, (n=658), 79%;
2018-19, (n=766), 76%
Denied:
2017-18, (n=658), 43%;
2018-19, (n=766), 40%
Note: Clients who were denied benefit were present in the administrative databases of EI, CPP and CPP-D, but not other programs.
Base: Those who were denied benefit.
Q38a. How satisfied were you with the service you received from Service Canada related to your [insert abbrev] application? please use a 5-point scale, where 1 means very dissatisfied, and 5 means very satisfied.
Priority Matrix - Overview
READER’S NOTE: This slide is intended to assist the reader in interpreting data shown in a priority matrix. A priority matrix has been used to identify priority improvement areas with respect to staff interacting with clients.
A priority matrix allows for decision makers to identify priorities for improvement by comparing how well clients feel you have performed in an area with how much impact that area has on clients’ overall satisfaction. It helps to answer the question ‘what can we do to improve satisfaction’. Each driver or component will fall into one of the quadrants explained below, depending on its impact on overall satisfaction and its performance score (provided by survey respondents).
Figure long description
4-quadrant priority matrix:
Vertical scale, Impact of performance, lower to higher impact;
Horizontal scale, Performance, lower to higher
1st quadrant, top-left, high impact/lower performance;
IMPROVE / FOCUS;
Driver/ component has more impact on satisfaction, and its performance score is lower relative to other drivers/ components. Focus on improving your performance in this area.;
Driver 1
2nd quadrant, top-right, high impact/high performance
PROTECT / REINFORCE
Driver/ component has more impact on satisfaction, and its performance score is higher relative to other drivers/ components. This is a strength which needs to be protected.
Driver/ component is not as impactful as other drivers/ components and performance scores are high.
Priority Matrix - Impact vs. Performance
The greatest opportunities to improve the service experience for the Service Canada clientele as a whole are improving the timeliness of service and the ease of getting assistance when needed. Results also indicate, attention should also be placed on the ease of issue resolution.
The helpfulness of Service Canada Agents remains a prominent strength for the organization and an area that should be protected to maintain high satisfaction scores.
Figure long description
Priority matrix:
Vertical axis, Impact;
Low impact to high impact;
Scale, Standardized ẞ coefficient;
Quad division at 0.10
Horizontal axis, Performance;
Low performance to high performance;
Scale, % rated 4 or 5;
Quad division at 80%
1st quadrant, top-left, high impact/lower performance;
Improve;
Service attributes:
Client journey took reasonable time;
Ease of getting help when needed
2nd quadrant, top-right, high impact/high performance;
The strengths of Service Canada’s delivery that also have the greatest impact on satisfaction are: helpfulness of officers, consistency of information, and ease with which the information is understood. Areas for improvement relate to: timeliness/duration of service, ease of getting assistance and ease of issue resolution.
Figure long description
Strengths
Service Canada Agents were helpful– 89% (-2)
Information was easy to understand – 86%
Information was consistent – 82%
Areas for Improvement
The amount of time it took, from when you started gathering information to when you got a decision on your application, was reasonable – 76% Stronger driver of satisfaction this year
Easy to get help when you needed it – 77%
Confident that any issues or problems would have been easily resolved – 78% (+2)
Improving the Time Duration of the Client Journey
Overall, three-quarters of clients say the timeliness of service was reasonable, on par with 2017-18. SIN, CPP and OAS/GIS clients are the most likely to rate the timeliness of service as reasonable, while EI and CPP-D provide lower ratings. OAS/GIS are more likely to agree the timeliness of service was reasonable than in 2017-18.
EI and CPP clients are most likely to find the duration reasonable if it is less than 4 weeks, and OAS/GIS less than six weeks. CPP-D clients expect that the process will take longer than eight weeks.
The amount of time it took, from when you started gathering information to when you got a decision on your application, was reasonable
Figure long description
Total, 2018-19 (n=4401):
5-very satisfied, 54%;
Rated 4, 22%;
Rated 3, 12%;
Rated 2, 4%;
1-Very dissatisfied, 6%;
Don’t know, 2%
SIN, 2017-18 (n=920):
5-very satisfied, 65%;
Rated 4, 22%;
Rated 3, 8%;
Rated 2, 2%;
1-Very dissatisfied, 1%;
Don’t know, 2%
CPP, 2017-18 (n=788):
5-very satisfied, 62%, significantly higher than last year;
Rated 4, 21%;
Rated 3, 9%;
Rated 2, 4%;
1-Very dissatisfied, 2%;
Don’t know, 2%
OAS/GIS, 2017-18 (n=829):
5-very satisfied, 58%;
Rated 4, 22%;
Rated 3, 9%;
Rated 2, 3%;
1-Very dissatisfied, 4%;
Don’t know, 4%
EI, 2017-18 (n=1098):
5-very satisfied, 46%;
Rated 4, 23%;
Rated 3, 16%;
Rated 2, 6%;
1-Very dissatisfied, 9%
CPP-D, 2017-18 (n=766):
5-very satisfied, 29%;
Rated 4, 20%;
Rated 3, 20%;
Rated 2, 12%;
1-Very dissatisfied, 18%
Percent Rating 4 or 5:
Total;
2018-19, 76%;
2017-18, 77%
SIN;
2018-19, 87%;
2017-18, 85%
CPP;
2018-19, 83%;
2017-18, 80%
OAS/GIS;
2018-19, 80%, significant increase from last year;
2017-18, 75%
EI;
2018-19, 69%;
2017-18, 73%
CPP;
2018-19, 49%;
2017-18, 47%
Length of client journey
From getting information about how to apply to receiving a decision on your application?
Figure long description
Reported duration of the client journey among those who found it reasonable:
EI, (n=1098);
One day, 5%, majority of clients;
Between 1 day to 2 weeks, 43%, majority of clients;
Between 2 to 4 weeks, 35%, majority of clients;
Between 4 to 6 weeks, 11%;
Between 6 to 8 weeks, 3%;
More than 8 weeks, 2%;
CPP, (n=788);
One day, 8%, majority of clients;
Between 1 day to 2 weeks, 19%, majority of clients;
Between 2 to 4 weeks, 24%, majority of clients;
Between 4 to 6 weeks, 20%;
Between 6 to 8 weeks, 8%;
More than 8 weeks, 15%;
CPP-D, (n=766);
One day, 0%, majority of clients;
Between 1 day to 2 weeks, 7%, majority of clients;
Between 2 to 4 weeks, 14%, majority of clients;
Between 4 to 6 weeks, 14%, majority of clients;
Between 6 to 8 weeks, 14%, majority of clients;
More than 8 weeks, 49%, majority of clients;
SIN, (n=920);
One day, 43%, majority of clients;
Between 1 day to 2 weeks, 39%, majority of clients;
Between 2 to 4 weeks, 8%;
Between 4 to 6 weeks, 4%;
Between 6 to 8 weeks, 2%;
More than 8 weeks, 2%;
OAS/GIS, (n=829);
One day, 11%, majority of clients;
Between 1 day to 2 weeks, 18%, majority of clients;
Between 2 to 4 weeks, 20%, majority of clients;
Between 4 to 6 weeks, 15%, majority of clients;
Between 6 to 8 weeks, 8%;
More than 8 weeks, 16%;
Base: All respondents
Q36b. Thinking about the service you received, how much do you agree or disagree with the following statements…
Q38d. And how long did your entire experience take from getting information about how to apply for [INSERT ABBREV] to receiving a decision on your application?
Improving Ease of Getting Help: Awareness of 1 800 O-Canada
One third of clients are aware of 1 800 O-Canada. Awareness is lower among SIN clients, Youth (18-30), Ontario residents and newcomers.
Figure long description
% Aware of 1-800 O Canada as a Resource, doughnut chart:
%Yes, 34%;
%No, 66%;
Higher, [plus sign]
OAS/ GIS Clients (41%);
Clients over 50 years old (39%);
Quebec (44%) and Atlantic residents (39%);
Remote clients (48%);
Proactively enrolled (40%);
Have a disability (43%);
Born in Canada (38%)
Lower, [negative sign]
SIN clients (27%);
Youth 18-30 (27%);
Ontario residents (29%);
Newcomers (25%)
Base: Haven’t used 1800 O-Canada (n=3467)
1cx. Before today, were you aware of 1 800 O-Canada as a resource you could call to find out what government programs are available and the steps to apply?
Base: Contact Service Canada by phone (n=924)
39c. When thinking about contacting Service Canada by phone to get information regarding your application would you prefer to…
Improving Ease of Getting Help: Awareness of 1 800 O-Canada
Qualitative Findings
Current awareness of 1 800 O-Canada is low although interest is high if the wait times are reasonable.
Many who heard about 1 800 O-Canada during the research expressed interest in using it as a resource while applying for benefits.
Knowing that they could reach out to a live agent for information who would provide guidance similar to what they would receive in person would compel them to at least try calling the number.
Most of those who have had experiences with 1 800 O-Canada characterized these interactions positively, with the agents being helpful and and informative. However, they may have expected the agent to be able to provide information on their specific application but were told that this out of scope (this was also true of in-person interactions).
Mentions were made that the phone number is not clearly visible on the website when finding information or applying.
Many currently believe that wait times to reach a live agent will be long, although this is mostly based on perceptions and not firsthand experience.
This perception is not specific to government call centres/lines, but a general perception by any large organization (including private companies) of long wait times.
Some believed that going in person would actually be faster than calling, since these participants lived relatively close to an office. They simply felt they could “pop by” the office and get the information they needed – their perception of wait times tend to be shorter and their experiences more positive than with phone service.
A few had experienced long wait times for phone service in the past, and this discouraged them from trying again. These experiences reinforced their perceptions of long wait times, and as a result, they defaulted or planned to go in-person to Service Canada for future needs.
Clients currently conflate 1 800 O-Canada with the specialized call centres; they tend to project the same issues or experiences onto the other line/service.
[…] I’ve never heard of this [number] […] Just now is when I found out that O CANADA means Service Canada […]
It would have been nice to have this when you went to the website, like you can call 1 800 O-Canada […] I didn’t see anything saying you can call that number.
Well I did eventually call in and there was no wait time, so had I know that earlier, I just would have called instead of going into the office. But it’s just from past experience, when it comes to any other thing you have to call in for – it’s long wait times […] Any large company.
I actually found the people at Service Canada to be quite helpful, at our location anyway. Actually, our wait time was surprisingly good. We didn’t experience a lot of really long delays. So, I didn’t find much of an issue applying in person […] We tried calling in a few times and the wait time was just too long. We just gave up after awhile [the wait time] was anywhere from 20 minutes to a half an hour. And we just said, ah, forget it, we’ll just go down to the office.
I had experienced years ago with the 1 800 O-Canada, and I was left on hold for a very long time.
Improving Ease of Getting Help: Preferences for Accessing Specialized Call Centres
Clients are equally split on whether they’d prefer to reach an agent every time they called (even if they wait time was up to an hour) or wait 20 minutes to speak with an agent, but not get through each time they called.
Preference When Contacting Service Canada By Phone to Get Information
Figure long description
Preference When Contacting Service Canada By Phone to Get Information, pie chart:
Reach an agent every time, even though there may be a wait time of up to an hour, 47%;
Wait up to 20 minutes to speak with an agent when the line is not busy, but not necessarily get through each time you call, 47%;
DK/Ref/Not Stated, 5%
Base: Haven’t used 1800 O-Canada (n=3467)
1cx. Before today, were you aware of 1 800 O-Canada as a resource you could call to find out what government programs are available and the steps to apply?
Base: Contact Service Canada by phone (n=924)
39c. When thinking about contacting Service Canada by phone to get information regarding your application would you prefer to…
Improving Ease of Getting Help: Preferences for Accessing Specialized Call Centres
Qualitative Findings
Clients would like expectations of wait times from the outset so they can make an informed decision.
Preferences are mixed on whether clients would prefer to wait an hour to be guaranteed to reach an agent, vs. waiting 20 minutes or less without necessarily getting through – a clear winner did not emerge from the qualitative discussions.
Those who liked to be guaranteed to reach an agent, though it might be a long wait up to an hour, liked the certainty of this option and stated that they could go away and do other tasks while t
hey wait.
Those who liked to be guaranteed a wait less than 20 minutes with the possibility of having to call back, preferred this option as they would prefer to call back at a later time.
There were many unaided mentions during all groups of having a callback option – one in which they enter their telephone number and are called back once an agent becomes available.
This feature is available to them from other large organizations, and this would be preferred over either option presented
However, questions arose for a few about the security of this option – in particular, if they were to be asked for their SIN number as part of the verification process over the phone.
Why can’t they have wait times posted for these types of services? So if I wanna phone in and see the wait time is an hour and forty minutes then perhaps I’d change my strategy and phone at a different time when it’s less busy.
I said 20 minutes because I’m just not prepared to spend an hour to wait, it’s just that simple. It seems to me that’s a pretty unreasonable expectation. I’ll take my shot at 20 minutes, and if I don’t get through I’ll try again at a less busy time or whatever. Try early in the morning or very late in the evening or whatever, where it’s a less busy time and you have a better chance at getting through. That’s sort of how you deal with a lot of other organizations that way.
My preference was to sit for an hour, as long as I knew that it would be an hour. Because I can usually put things on speaker, and get to doing other things, I wouldn’t be sitting there wasting the full hour. Ideally, I would like to know how long the wait time would be, and obviously ideally, we’d all like a callback rather than sitting by the phone.
There are other agencies though, that have an option where they can call you back, you know, so if you don’t have time to wait on it then they call you back and it’s a pretty well-known thing. You’d think that that the Government of Canada would catch up on it too.
Effectiveness of Issue Resolution
The incidence of problem experience has declined compared to 2017-18. However, among those who experienced a problem ease of resolution has declined significantly.
Among all clients, confidence that any problems encountered would be easily resolved remains high and has increased compared to last year.
Figure long description
Encountered a Problem:
2017-18 (n=4001): 18%, Yes;
2018-19 (n=4401): 16%, Yes, significant decrease;
Was Issue or Problem Easily Resolved? Among those who encountered a problem:
2017-18 (n=780);
5-very satisfied, 29%;
Rated 4, 18%;
Rated 3, 20%;
Rated 2, 14%;
Very dissatisfied, 18%
2018-19 (n=756);
5-very satisfied, 18%, significant decrease from last year;
Rated 4, 15%;
Rated 3, 23%;
Rated 2, 15%;
Very dissatisfied, 24%, significant increase;
Don’t know, 5%
Percent Rating 4 or 5:
2017-18: 47%;
2018-19: 33%, significantly decrease from last year
Figure long description
You were confident that any issues or problems would have been easily resolved Among all clients
Note: In 2017-18 confidence in issue resolution was asked separately for those who experienced a problem and those who did not. The 2017-18 figure shown represents the combined results for both statements.
2017-18 (n=4001):
5-very satisfied, 53%;
Rated 4, 23%;
Rated 3, 12%;
Rated 2, 6%;
1-Very dissatisfied, 5%;
Don’t know, 1%
2018-19 (n=4401):
5-very satisfied, 51%;
Rated 4, 26%;
Rated 3, 13%;
Rated 2, 5%;
1-Very dissatisfied, 3%;
Don’t know, 5%
Percent Rating 4 or 5
2017-18: 76%
2018-19: 78%, significant increase
*Note: In 2017-18 confidence in issue resolution was asked separately for those who experienced a problem and those who did not. The 2017-18 figure shown represents the combined results for both statements.
Base: All respondents (n=4401)
36a. Thinking about your overall experience getting information about and applying for [INSERT ABBREV], did you experience any problems or issues during this process? n=756 for those who encountered a problem
Q36BX. Would you agree or disagree that the problem or issue was easily resolved, where 1 is strongly disagree and 5 is strongly agree?
Base: All respondents (n=4401)
Q36b. Thinking about the overall service you received, from getting information about [INSERT ABBREV] to receiving a decision, how much do you agree or disagree with the following statements, using a 5-point scale (where 1 means strongly disagree, and 5 means strongly agree.)
Problem/Issue Experienced
The most common problems/issues experienced are long/complicated applications, confusing online information, too long to provide benefit/decision and complaints about staff not being knowledgeable.
Figure long description
% Encountered a Problem
Yes, 16%
No, 83%
How would you describe the problem or issue? (n=756)
Application was too long/complicated, 21%;
Online information was confusing, 15%;
Took too long to provide the benefit/decision. 14%;
Staff were not knowledgeable, 10%;
Not clear information, 8%;
Errors in paperwork/documents, 8%;
Took too long to get a status update on my application, 7%
Got bounced around, 6%;
Telephone lines were busy, 5%;
Took too long to get information on how to apply, 4%;
Denied benefits/rejected/had to appeal 2%;
They did not receive/kost my paperwork/had to re-submit 2%;
Other 11%;
Don’t know 7%
Base: All respondents (n=4401)
36a. Thinking about your overall experience getting information about and applying for [INSERT ABBREV], did you experience any problems or issues during this process?
Base: Encountered a problem (n=756)
36ax. How would you describe the problem or issue you experienced?
Effectiveness of Issue Resolution By Program
CPP-D and EI clients are most likely to have experienced a problem, while OAS/GIS and SIN are least likely. Fewer CPP-D, OAS/GIS or SIN clients experienced a problem this year.
Ease of problem/issue resolution is highest for CPP clients and lowest for CPP-D clients. Ease of resolution has declined significantly for EI and SIN clients this year.
Figure long description
Total:
Total (n=4401): 16%, significant decrease from last year; (right) 2017-18, 18%
Total (n=756): 33%, significant decrease from last year; (right) 2017-18, 47%
CPP-D
Total (n=766): 32%, significant decrease from last year; (right) 2017-18, 38%
Total (n=246): 28%; (right) 2017-18, 31%
EI
Total (n=1098): 24%; (right) 2017-18, 23%
Total (n=233): 32%, significant decrease from last year; (right) 2017-18, 45%
CPP
Total (n=788): 16%; (right) 2017-18, 19%
Total (n=133): 46%; (right) 2017-18, 51%
OAS/GIS
Total (n=829): 11%, significant decrease from last year; (right) 2017-18, 15%
Total (n=91): 33%; (right) 2017-18, 36%
SIN
Total (n=920): 5%, significant decrease from last year; (right) 2017-18, 11%
Total (n=53): 32%, significant decrease from last year; (right) 2017-18, 62%
Base: All respondents
Q36a. Thinking about your overall experience getting information about and applying for [INSERT ABBREV], did you experience any problems or issues during this process?
Q36bx. Would you agree or disagree that the problem or issue was easily resolved, where 1 is strongly disagree and 5 is strongly agree?
Improving Issue Resolution
There were a number of improvements identified by clients who experienced an issue or were dissatisfied with their experience.
Most participants who experienced problems or were dissatisfied said they would like clear and more realistic expectation setting on decisions: when to follow up proactively and communication of wait times that better align with actual experiences.
Not having realistic timelines set out leads to disappointment and disillusionment with the process.
Some said they expected to have their questions answered at the in-person office, but the staff couldn’t access their relevant information. This may affect few clients as the survey found the in-person service was rated highly by 87% of clients.
Clients would like to be able to receive consistent responses regardless of channel, and to have more than one channel option for information specific to their application. Note that the survey found that 7% of clients felt they did not receive consistent information.
They would like to hear proactively from Service Canada in situations where there are changes to their benefits or delays
Some would like improved phone service: shorter wait times, sensitivity training for explaining denials, and ease of understanding officers with accents.
Quick access, tone and accents were mentioned as problems encountered when calling specialized call centres.
Some would like simpler and clearer processes for complex situations.
The current perception is that “the system” is not currently equipped to handle complications and further, these clients are left feeling like they have no recourse or are uncertain of the status of their benefits.
A few would like a clearer, more streamlined and more empowered escalation process.
These clients often seek escalation on the phone and are handed off without resolution to other officers, or resort to other tactics outside of Service Canada – that is, seeking help from the government in other forms.
A few would like better streamlining and best practices for uploading documents.
Since some of the cases with dissatisfied clients involved incomplete paperwork that they were not informed of immediately, they would like better accountability and tracking.
Qualitative Findings
[…] nobody was really sure what happened [with my benefits] […] So in that case, even if the person who works in Service Canada could have more access to know, would be more useful. I guess if it was less kind of traffic for the phone services or any other areas, if that person who is working there already could have some access to see what’s going on. It could make it faster, or at least give me a little bit of peace of mind, okay, now I know what happened, so I’m going to wait, you know what I mean? […] That at least a person in each Service Canada [channel] could have the access.
[…] I sent in my application, got a letter from them that they received it. A couple of months went by and I hadn’t heard anything more so I called, tried calling, and couldn’t stay on the line, I couldn’t stay on hold waiting for someone to answer my call for, like a half an hour to 45 minutes, that was going to take.
[…] whenever you have anything that is unusual, that doesn’t fit the normal workload, nobody seems to know how to deal with it. They need somebody who deals with all those sort of off-the-wall unusual circumstances […] So what I’m saying is, if you have anything unusual, that’s outside of the normal realm of what they normally do for paperwork, nobody seems to know how to deal with it.
[…] I felt like I was talking to a fresh high school graduate who was judging me as claiming Disability when I shouldn’t have been. Like, I was trying to rip off the system or something […] She was denying my claim because I was too young and I had so many working years ahead of me and, like, it went on and on, and that I could appeal if I didn’t like it. And then it just kind of sent me in a spiral. I have mental health conditions and that was a part of it. I feel like, you know, if I had a broken leg or something and I could not work, that would be valid, but because of that mental health condition, then it’s been an uphill battle regardless, and on top of that, add insult to injury, it’s an uphill battle. So it’s just a horrible, it’s a horrible process to go through to feel like you’re being treated like a fraud.
EI Client Experience
The EI service experience is rated highest for: confidence in protection of personal information, confidence in having everything needed when submitting the application, overall ease of applying, information being easy to understand and the helpfulness of Service Canada Agents.
Areas for improvement include: the timeliness of service, explaining situation only once, ease of getting assistance, confidence in problem resolution and clarity in what would happen next and when.
Figure long description
Strengths, % satisfied, horizontal bar chart, [arrow pointing-up]:
Confident that your personal information was protected, 88%;
Confident you had everything you needed when you submitted you application, 86%;
Overall, it was easy for you to apply for…, 86%;
It was easy to understand the requirements to apply, 85%;
Information was easy to understand, 85%;
Service Canada agents were helpful, 85%, yellow box indicating that this is one of the top 5 drivers of overall satisfaction
Areas for Improvement, % satisfied, horizontal bar chart, [arrow pointing-down]:
The amount of time it took, from when you started gathering information to when you got a decision on your application, was reasonable, 69%, yellow box indicating this is among the top 6 drivers of overall satisfaction;
You needed to explain your situation only once, 72%;
Easy to get help when you needed it, 72%, yellow box indicating this is among the top 5 drivers of overall satisfaction;
Confident that any issues or problems would have been easily resolved, 74%, yellow box indicating this is among the top 5 drivers of overall satisfaction;
Throughout the process it was clear what would happen next and when it would happen, 74%
Base: EI-clients, Within this, sample size varies by statement.
CPP Client Experience
The CPP service experience is rated highest for: helpfulness of Service Canada Agents, confidence in having everything needed when submitting the application, overall ease of applying and ease of understanding the requirements to apply.
Areas for improvement include: ease of getting assistance, clarity in what to do if you had a problem/question, confidence in problem resolution and clarity in what would happen next and when.
Figure long description
Strengths, % satisfied, horizontal bar chart, [arrow pointing-up]:
Service Canada Agents were helpful, 90%, yellow box indicating that this is among the top 5 drivers of overall satisfaction;
Confident you had everything you needed when you submitted your application, 89%;
Overall, it was easy for you to apply for…, 88%;
It was easy to understand the requirements to apply, 86%
Areas for improvement, % satisfied, horizontal bar chart, [arrow pointing down]:
Easy to get help when you needed it, 73%, yellow box indicating that this is among the top 5 drivers of overall satisfaction;
Clear what to do if you had a problem or question, 76%;
Confident that any issues or problems would have been easily resolved; 76%, yellow box indicating that this is among the top 5 drivers of overall satisfaction;
Throughout the process it was clear what would happen next and when it would happen, 78%
Base: CPP-clients, Within this, sample size varies by statement.
CPP-D Client Experience
The CPP-D service experience is rated highest for: confidence in protection of personal information, helpfulness of Service Canada Agents and confidence in having everything needed when submitting the application. However, a quarter of clients did not find the agents helpful and a similar proportion were not confident they had what they needed
Areas for improvement include: timeliness of service, clarity in what would happen next and when, explaining your situation only once and confidence in problem resolution.
Figure long description
Strengths, % satisfied, horizontal bar chart, [arrow pointing-up]:
Confident that your personal information was protected, 82%
Service Canada Agents were helpful, 76%, yellow box indicating that this is among the top 5 drivers of overall satisfaction;
Confident you had everything you needed when you submitted your application, 76%
Areas for improvement, % satisfied, horizontal bar chart, [arrow pointing down]:
The amount of time it took, from when you started gathering information to when you got a decision on your application, was reasonable, 49%, yellow box indicating that this is among the top 5 drivers of overall satisfaction
Throughout the process it was clear what would happen next and when it would happen, 53%;
You needed to explain your situation only once, 54%;
Confident that any issues or problems would have been easily resolved, 57%, yellow box indicating that this is among the top 5 drivers of overall satisfaction
Base: CPP-D-clients, Within this, sample size varies by statement.
SIN Client Experience
The SIN service experience is rated highest for: helpfulness of Service Canada Agents, confidence in having everything needed when submitting the application, and confidence in protection of personal information.
Areas for improvement include: clarity of what to do when you have a problem, clarity in what would happen next and when, needing to explain your situation only once, ease of finding information on how to apply and confidence in problem resolution. Notably, the vast majority of SIN clients provide positive ratings for all attributes and performance on suggested areas for improvement remains strong compared to other programs.
Figure long description
Strengths, % satisfied, horizontal bar chart, [arrow pointing-up]:
Service Canada Agents were helpful, 94%, Top 5 driver of overall satisfaction
Confident you had everything you needed when you submitted your application, 93%
Confident that your personal information was protected, 92%
Information was easy to understand, 92%
Areas for improvement, % satisfied, horizontal bar chart, [arrow pointing down]:
Clear what to do if you had a problem or question, 82%
Throughout the process it was clear what would happen next and when it would happen, 83%, Top 5 driver of overall satisfaction
You needed to explain your situation only once, 85%
Easy to find information about how to apply for…, 86%
Confident that any issues or problems would have been easily resolved , 86%, Top 5 driver of overall satisfaction
Base: SIN-clients, Within this, sample size varies by statement.
OAS/GIS Client Experience
The OAS/GIS service experience is rated highest for: confidence you had everything needed submitting application, helpfulness of Service Canada Agents, overall ease of applying and ease of understanding the requirements to apply.
Areas for improvement include: ease of getting assistance, needing to explain your situation only once, confidence in problem resolution and clarity in what would happen next and when.
Figure long description
Strengths, % satisfied, horizontal bar chart, [arrow pointing-up]:
Confident you had everything you needed when you submitted your application, 90%;
Service Canada Agents were helpful, 88%, yellow box indicating that this is among the top 5 drivers of overall satisfaction;
Overall, it was easy for you to apply for…, 87%;
It was easy to understand the requirements to apply, 85%
Areas for improvement, % satisfied, horizontal bar chart, [arrow pointing down]:
Easy to get help when you needed it, 72%;
You needed to explain your situation only once, 75%;
Confident that any issues or problems would have been easily resolved, 78%, yellow box indicating that this is among the top 5 drivers of overall satisfaction;
Throughout the process it was clear what would happen next and when it would happen, 78%, yellow box indicating that this is among the top 5 drivers of overall satisfaction
Base: OAS-clients, Within this, sample size varies by statement.
Access to Service
Summary: Vulnerable Client Groups and Service Barriers
Most vulnerable client groups continue to provide high ratings of the service experience. These groups include the e-vulnerable, seniors, newcomers, and remote clients. Satisfaction among Indigenous clients has improved in 2018-19.
A strong majority of clients in vulnerable groups Service Canada serves had a positive service experience.
Compared to 2017-18, satisfaction with the service experience has improved substantially among Indigenous clients.
Clients with restrictions to accessing service and clients with disabilities have lower satisfaction than other clients*.
Nearly one in ten clients report they have a disability, and CPP-D clients are by far most likely.
Clients with a disability are significantly more likely to have experienced a problem, have a longer client journey (specifically 4 weeks or longer), and rate channel satisfaction lower for in-person and online.
They are also less satisfied with several service attributes. The largest gaps for ease of completing online, needing to explain their situation only once, moving smoothly through all steps and ease of understanding.
Nearly one in ten clients reported having restrictions that made it more difficult to access services, highest among CPP-D clients.
Clients with physical access barriers and those with a disability have the lowest satisfaction.
Clients with restrictions are more likely to have experienced a problem, have a longer client journey (specifically more than 8 weeks), and rate satisfaction with all channels lower compared to all clients.
They are also less satisfied with several service attributes with the largest gaps for ease of understanding information, needing to explain your situation only once, confidence in issue resolution and ease of getting assistance.
Virtually all clients were provided service in their choice of English or French. Further, clients said they were provided service in a language they could understand and speak well, including clients who completed the survey in a language other than English or French.
Well over nine in ten clients agree they were provided service in their choice of English or French and that it was easy to access service in a language they could speak and understand well.
CPP, CPP-D and OAS/GIS clients are most likely to report to each statement, however the vast majority of clients overall not encounter a language barrier during their service experience. OAS/ GIS clients were also less likely to agree it was easy to access service in a language they could speak and understand well though agreement remains very high.
Among those who prefer a language other than English or French, a Chinese language was the most common language spoken.
*Note: Overlap exists between clients with disabilities and clients with restrictions. 2% of clients (n=98) fall into both groups.
Overall: Satisfaction Among Clients in Vulnerable Groups
Clients who report having a restrictions that makes it difficult to access services and clients who report having a disability disabilities have lower satisfaction with their service experience than other clients. Newcomers, OLMC and seniors (60+) report higher satisfaction than other clients.
Compared to 2017-18, satisfaction with the service experience has improved for Indigenous clients and declined for clients with a high school education or less.
Figure long description
Vulnerable groups:
Youth (18 to 30);
number of interviews, 817;
% of total vulnerable population, 33%;
% satisfied (Top2Box):
2018-19, 86%;
2017-18, 86%
Seniors (60+);
number of interviews, 1933;
% of total vulnerable population, 23%;
% satisfied (Top2Box):
2018-19, 87%, significantly higher than total;
2017-18, 87%
OLMC;
number of interviews, 181;
% of total vulnerable population, 4%;
% satisfied (Top2Box):
2018-19, 91%;
2017-18, 89%
High School or less;
number of interviews, 1765;
% of total vulnerable population, 36%;
% satisfied (Top2Box):
2018-19, 85%, significantly lower than last year;
2017-18, 88%
indigenous;
number of interviews, 400;
% of total vulnerable population, 9%;
% satisfied (Top2Box):
2018-19, 85%, significantly lower than total;
2017-18, 77%
Clients with disabilities;
number of interviews, 1111;
% of total vulnerable population, 9%;
% satisfied (Top2Box):
2018-19, 79%, significantly lower than total;
2017-18, N/A
Remote;
number of interviews, 403;
% of total vulnerable population, 3%;
% satisfied (Top2Box):
2018-19, 88%;
2017-18, 87%
E-vulnerable;
number of interviews, 1197;
% of total vulnerable population, 27%;
% satisfied (Top2Box):
2018-19, 84%;
2017-18, 87%
Newcomers (3 years or fewer);
number of interviews, 510;
% of total vulnerable population, 12%;
% satisfied (Top2Box);
2018-19, 93%, significantly lower than total;
2017-18, N/A
Language barrier;
number of interviews, 101;
% of total vulnerable population, 2%;
% satisfied (Top2Box);
2018-19, 81%;
2017-18, N/A%
No online/mobile only;
number of interviews, 670;
% of total vulnerable population, 15%;
% satisfied (Top2Box);
2018-19, 85%;
2017-18, N/A
Clients with restrictions;
number of interviews, 478;
% of total vulnerable population, 8%;
% satisfied (Top2Box);
2018-19, 62%, significantly lower than total;
2017-18, 67%
Note: Percentages are based on weighted data.
Language of Service
Nearly all clients agree they were provided service in their choice of English or French, and that it was easy to access service in a language they could speak and understand well. Similarly, virtually all those who are considered an official language minority community were provided service in their choice of English or French.
Figure long description
[person speaking icon] program provided with service in your choice of English or French:
Total, 96%;
EI, 97%;
CPP, 94%, significantly lower than total;
CPP-D, 93%, significantly lower than total;
SIN, 95%;
OAS/GIS, 97%
Figure long description
man in suit with a talking bubble icon] Easy to access service in a language I could speak or understand well:
Total, 94%
EI, 96%, significantly higher than total;
CPP, 92%, significantly lower than total;
CPP-D, 90%, significantly lower than total;
SIN, 94%;
OAS/GIS, 92%, significantly lower than total
Figure long description
language used by program:
English;
Total, n=4401, 79%;
EI, n=1098, 75%;
CPP, n=788, 97%;
CPP-D, n=766, 95%;
SIN, n=920, 79%;
OAS/GIS, n=829, 74%
French;
Total, n=4401, 17%;
EI, n=1098, 23%;
CPP, n=788, 1%;
CPP-D, n=766, 2%;
SIN, n=920, 13%;
OAS/GIS, n=829, 25%
Both/Either;
Total, n=4401, 1%;
EI, n=1098, 1%;
CPP, n=788, 1%;
CPP-D, n=766, 1%;
SIN, n=920, 1%;
OAS/GIS, n=829, 1%
Other:
Total, n=4401, 3%;
EI, n=1098, 1%;
CPP, n=788, 2%;
CPP-D, n=766, 2%;
SIN, n=920, 6%;
OAS/GIS, n=829, 1%
Other Languages, n=101:
A Chinese language, n=29, 29%;
Arabic, n=8, 8%;
Punjabi, n=8, 8%;
Spanish, n=8, 8%;
Korean, n=6, 6%;
Other, n=43, 43%
Base: All respondents
Q41b. Which language [IF NOT PROXY: do you] / [INSERT IF PROXY: does [INSERT CUSTOMER’S NAME FROM SAMPLE FILE]] prefer to receive service in, English, French or another language?
Client Groups Who Had or Have Lower Satisfaction
In the 2017-18 baseline year, three vulnerable groups had much lower rates of satisfaction than other clients. One of these groups was Indigenous clients, however satisfaction has increased among this group this year. Similar to last year, clients who say they have a restriction that makes it difficult to access service and clients with disabilities have low satisfaction rates.
Figure long description
Indigenous Clients:
Clients with Disabilities:
Clients with Restrictions to access services:
Client group Satisfaction rate
85% ↑ 8%
79%
62%
Client Proportion
9 %
9%
8%
Note: Overlap exists between clients with disabilities and clients with restrictions to access services. 2% of clients (n=98) fall into both groups.
Satisfaction was high for the following client groups: Youth, seniors, clients with low education, remote clients, official language minority clients, newcomers, clients with language barriers, the e-vulnerable and clients not online or with only mobile.
*Unweighted sample sizes: Clients with disabilities (n=1,111), Clients with restrictions (n=478), Indigenous clients (n=400)
Note: Percentages are based on weighted data.
Indigenous Clients
In remote areas satisfaction among Indigenous clients is higher than among all clients. The most problematic aspects of service are ease of/access to online services, and needing to explain the situation more than once.
Figure long description
Satisfaction by area
Urban areas 82%
Rural areas 86%
Remote areas 93%
percentage points lower/higher than total clientele
Urban areas -4%
Rural areas +3%
Remote areas +5%
Figure long description
Service Attributes
Being able to complete steps online made the process easier for you 68%
You needed to explain your situation only once 73%
Information was easy to understand 82%
percentage points lower/higher than total clientele
Being able to complete steps online made the process easier for you -6 pts
You needed to explain your situation only once -4pts
Information was easy to understand -4pts
Figure long description
Profile of Indigenous Clients, horizontal bar chart:
First nations, 58%
Metis, 34%
Inuit, 10%
Q44. Do you identify as First Nations, Métis or Inuit? n=4401, 9 % answered positively, 85% answered none of the above and 6% not stated or do not know
Clients with Disabilities
Nearly one in ten clients report they have a disability. CPP-D clients are by far most likely, while CPP or OAS/GIS clients have a higher presence of disability compared to the proportion among all clients.
Nearly half of the respondents with a disability say they have a mobility restriction, where one quarter have a cognitive or mental health while one in ten mention seeing or hearing. CPP-D clients are more likely to have a mobility or cognitive/ mental health disability.
Figure long description
% saying yes, have a disability, horizontal bar chart:
Total, (n=4401), 9%;
CPP-D, (n=766), 92%, significantly higher than total;
OAS/GIS, (n=829), 19%, significantly lower than total;
CPP, (n=788), 16%, significantly lower than total;
EI, (n=1098), 6%;
SIN, (n=920), 3%
type of disability among clients reporting a disability in 2018-19 data, n=1111, horizontal bar chart:
Mobility, 49%;
Cognitive or Mental Health, 26%;
Seeing, 10%;
Hearing, 8%;
Other, 21%;
Refused/no response, 3%
% with each type of disability within each program:
Mobility;
EI, n=77, 46%
CPP, n=135, 51%;
CPP-D, n=710, 57%, significantly higher than total;
SIN, n=29, 14%, significantly lower than the total;
OAS/GIS, n=160, 56%;
Mental health;
EI, n=77, 19%
CPP, n=135, 21%;
CPP-D, n=710, 37%, significantly higher than total;
SIN, n=29, 34%;
OAS/GIS, n=160, 25%;
Seeing;
EI, n=77, 11%
CPP, n=135, 7%;
CPP-D, n=710, 7%, significantly lower than the total;
SIN, n=29, 14%;
OAS/GIS, n=160, 12%;
Hearing;
EI, n=77, 9%
CPP, n=135, 12%;
CPP-D, n=710, 5%, significantly lower than the total;
SIN, n=29, N/A;
OAS/GIS, n=160, 12%;
Other;
EI, n=77, 22%
CPP, n=135, 21%;
CPP-D, n=710, 19%;
SIN, n=29, 28%;
OAS/GIS, n=160, 19%;
Refused/no response
EI, n=77, 2%
CPP, n=135, 1%;
CPP-D, n=710, 2%;
SIN, n=29, 12%, significantly higher than total;
OAS/GIS, n=160, 2%;
Base: All respondents
Q44A. Do you have a disability?
Base: Have a disability
Q46A. What type of disability do you have?
Clients with disabilities are significantly more likely to have experienced a problem, a longer client journey (specifically 4 weeks or longer), and rate channel satisfaction lower for in-person and online.
There are also many significant gaps on service attributes between clients with disabilities and clients overall. The largest gaps are for needing to explain your situation only once, you were able to move smoothly through all the steps and information was easy to understand.
Figure long description
Experienced a problem, Yes, 26%
Figure long description
Service Channel Satisfaction (% T2B):
In-person, 79%, significantly lower than total;
Online, 71%, significantly lower than total;
Specialized Call Centre, 69%
Figure long description
Length of Client Journey:
One day, 6%, significantly lower than total;
Between 1 day and 2 weeks, 17%, significantly lower than total;
Between 2 to 4 weeks, 20%;
Between 4 to 6 weeks, 16%, significantly higher than total;
Between 6 to 8 weeks, 11%, significantly higher than total;
More than 8 weeks, 27%, significantly higher than total
Figure long description
Widest Gap in Service Attributes (% Agree vs. TOTAL):
Being able to complete steps online made the process easier for you, 47%, significantly lower than total, 27points lower than for all clients;
You needed to explain your situation only once, 63%, significantly lower than total, 14pts lower than total clients;
You were able to move smoothly through all of the steps related to your application,73%, significantly lower than total, 11points lower than all clients;
Information was easy to understand, application,75%, significantly lower than total, 11 points lower than for all clients;
The amount of time it took, from when you started gathering information to when you got a decision on your application was reasonable, application, 66%, significantly lower than total, 10 points lower than for all clients;
Throughout the process it was clear what would happen next and when it would happen, 67%, significantly lower than total, 10pts lower than for all clients;
Overall, it was easy for you to apply for …, 75%, significantly lower than total, 10 points lower than for all clients
Base: All respondents
Clients with Restrictions that Affect Accessing Service
Nearly one in ten clients feel they have restrictions that makes it more difficult to access services, highest among CPP-D clients.
The most common type of restriction experienced include being unable to visit SCC offices during business hours, needing assistance from someone other than SC staff or presence of a disability. CPP-D clients are more likely to have a disability or need assistance from someone other than SC staff, CPP clients are more likely to say they don’t live in close proximity to a SC office, OAS/GIS clients are more likely to say they don’t own a smart phone, or don’t have access to the internet, while SIN clients are more likely to have difficulty communicating in English or French.
Figure long description
% saying, Yes, More difficult to access services, horizontal bar chart:
Total, n=4401; 8%;
CPP-D, n=766, 23%, significantly higher than total;
OAS/GIS, n=829, 11%;
CPP, n=788, 9%;
EI, n=1098, 8%;
SIN, n=920, 5%
type of restriction among clients with restrictions in 2018-2019 data, n=478, horizontal bar chart:
Unable to visit a Service Canada office during business hours, 29%;
Needed assistance from someone other than Service Canada staff;
Have a disability, 26%;
Do not have access to a computer, 22%;
Do not own a smartphone, 21%;
Do not live in close proximity to a Service Canada office, 21%;
Do not have access to the internet, 19%;
Difficulty communicating in English or French, 15%;
Any other restriction, 37%
type of restriction within each program:
Unable to visit a Service Canada office during business hours;
EI, n=90, 28%;
CPP, n=70, 25%;
CPP-D, n=176, 27%;
SIN, n=56, 31%;
OAS/GIS, n=86, 29%
Needed assistance from someone other than Service Canada staff;
EI, n=90, 20%;
CPP, n=70, 38%;
CPP-D, n=176, 63%, significantly higher than total;
SIN, n=56, 30%;
OAS/GIS, n=86, 30%
Have a disability;
EI, n=90, 23%;
CPP, n=70, 36%;
CPP-D, n=176, 80%, significantly higher than total;
SIN, n=56, 10%, significantly lower than total;
OAS/GIS, n=86, 31%
Do not have access to a computer;
EI, n=90, 19%;
CPP, n=70, 25%;
CPP-D, n=176, 21%;
SIN, n=56, 21%;
OAS/GIS, n=86, 31%
Do not own a smartphone;
EI, n=90, 18%;
CPP, n=70, 28%;
CPP-D, n=176, 20%;
SIN, n=56, 13%;
OAS/GIS, n=86, 34%, significantly higher than the total
Do not live in close proximity to a Service Canada office;
EI, n=90, 19%;
CPP, n=70, 36%, significantly higher than the total;
CPP-D, n=176, 25%;
SIN, n=56, 18%;
OAS/GIS, n=86, 18%
Do not have access to the internet;
EI, n=90, 16%;
CPP, n=70, 25%;
CPP-D, n=176, 20%;
SIN, n=56, 15%;
OAS/GIS, n=86, 29%, significantly higher than the total
Difficulty communicating in English or French;
EI, n=90, 9%;
CPP, n=70, 11%;
CPP-D, n=176, 10%;
SIN, n=56, 30%, significantly higher than the total;
OAS/GIS, n=86, 15%
Any other restriction
EI, n=90, 41%;
CPP, n=70, 28%;
CPP-D, n=176, 30%;
SIN, n=56, 40%;
OAS/GIS, n=86, 32%
Base: All respondents
Q45. Do you feel that you have any restrictions that make it more difficult to access services?
Base: Feel it does make it more difficult to access services
Q46. Which of the following types of restrictions apply to you, if any?
Clients with restrictions specifically related to language/assistance barriers have the highest satisfaction of all clients with restrictions, satisfaction is 13% lower than for all clients
Those who are unable to visit during office hours/don’t live close to an office and those who say their restriction is a disability have the lowest satisfaction.
Figure long description
2018-19, types of restriction, horizontal bar chart:
Unable to visit a Service Canada office during business hours, 29%;
Needed assistance form someone other than Service Canada staff, 28%;
Have a disability, 26%.
Do not have a computer, 22%;
Do not own a smartphone, 21%;
Do not live in close proximity to a Service Canada office, 21%;
Do not have access to the internet, 19%;
Difficulty communicating in English or French 15%;
Any other restriction
Overall satisfaction (4 or 5 on a 5 point scale), Clients with any type of restriction, n=478, 62%
Satisfaction by Type of Restriction ( 4 or 5 on 5 point scale):
Language/assistance barriers, n=220, 72%;
Technological barriers, n=185,62%;
Other restrictions, n=155, 62%,
Have a disability, n=221, 59%
Physical access barriers, n=200, 57%
Base: All respondents
Clients with restrictions are more likely to have experienced a problem, have a longer client journey (specifically more than 8 weeks), and rate satisfaction with all channels lower compared to all clients.
There are also many significant gaps on service attributes between clients with restrictions and clients overall. The largest gaps are for information was easy to understand, needing to explain your situation only once, confidence in issue resolution and ease of getting assistance.
Figure long description
Service Channel Satisfaction (% saying 4 or 5 on a 5 point scale):
In-person, 58%, significantly lower than total;
Online, 53%, significantly lower than total;
Specialized call center, 44%, significantly lower than total;
1 800 O-Canada, 42%, significantly lower than total
Figure long description
Length of Client Journey:
One day, 13%;
Between 1 day and 2 weeks, 15%, significantly lower than total;
Between 2 to 4 weeks, 21%;
Between 4 to 6 weeks, 15%;
Between 6 to 8 weeks, 8%;’
More than 8 weeks, 23%, significantly higher than total
Figure long description
Experienced a problem, % Yes, 40%
Figure long description
Widest Gap in Service Attributes (% Agree vs. TOTAL):
Information was easy to understand, 55%, 31 points lower than total;
You needed to explain your situation only once, 47%, 30 points lower than total;
Being able to complete steps online made the process easier for you, 35%, -29 points lower than total;
You were confident that any issues or problems would have been easily resolved, 50%, 28 points lower than total;
It was easy to get help when you needed it, 49%, significantly lower than total, 28 points lower than total;
It was easy to find information about how to apply for…, 57%, 26 points lower than total;
It was easy to understand the requirements to apply for…, 60%, 26 points lower than total;
Throughout the process it was clear what would happen next and when it would happen, 52%, 25 points lower than total;
Base: All respondents
Access to Service: There is no one-size-fits-all solution to improve channel service for clients with disabilities and clients with restrictions accessing services
Clients with disabilities and those with restrictions to accessing service were less satisfied with most service channels. Choice of channel was influenced by the disability or restriction the client experiences. Online offers several potential benefits depending on the client’s disability or restriction.
Figure long description
Clients with disabilities are less satisfied with…
In-Person 79% (vs. 87% all clients)
Online 71% (vs. 79% all clients)
Clients with restrictions are less satisfied with…
In Person 58% (vs. 87% all clients)
Online 53% (vs. 79% all clients)
Specialized Call Centre 44% (vs. 75% all clients)
Channel preferences among clients with disabilities
Some clients with anxiety/concentration/communication disabilities preferred online application forms and online chat because they did not have to express themselves vocally and could proceed at their own pace.
Other clients with disabilities or issues affecting concentration said they preferred going to an in-person office and to deal with tactile forms with officers who are available to show them what to do.
Channel preferences among clients experiencing restrictions accesing services (qualitative):
Some clients in remote locations said they preferred the online channel with assistance due to its convenience.
Some clients not able to visit an office during the day said they preferred the online channel with assistance due to its availability/flexibility.
Service Transformation: Service Design and Channel Use
Summary: Service Design and Channel Use
The majority of Service Canada clients used online and/ or in person channels during the service experience, while a minority called a specialized call centre.
Among all clients, usage is highest for the online channel (60%) during their service experience, followed by in-person service (54%) while fewer called a specialized call centre (20%).
The service experience differs with the channel used during the client journey. Ratings remain high for all service attributes among users of all channels. However clients who called a specialized call centre are clients who are more likely to have experienced challenges compared to those who used other channels.
Clients who called a specialized call centre are less likely to agree to several service attributes including: information was easy to understand, it was clear what would happen next and when, needing to explain their situation only once, moving smoothly through all steps, receiving consistent information, the length of the client journey was reasonable, Service Canada Agents were helpful or to have confidence in issue resolution.
Clients who used the in person channel are more likely to find it was easy to get help when needed. They are clients who are less likely to agree it was easy to apply or understand the requirements to apply.
Clients who used the online channel are clients who are more likely to say it was easy to find information about how to apply. They are less likely however to agree it was clear what would happen next and when, they needed to explain their situation only once, it was easy to get help when needed or to have confidence in issue resolution.
Qualitatively, most clients say they proactively sought information on applying before or during the application process through both government and non-government sources.
Many used government sources for information – primarily in person and government websites. Those who went in person appreciated receiving information on the spot and most who used a government website found it easy to find what they were looking for (CPP clients were more likely to experience navigational issues).
Many also used other non-government sources including websites, friends and family, and for CPP-D clients, their insurance companies.
Few clients used social media to seek information during the service experience.
Five percent of clients say they used social media to discuss or learn from others’ experience with Service Canada programs. SIN clients are the most likely to have used social media through their client journey, while CPP and OAS/GIS clients are least likely.
In-person clients contact Service Canada fewer times than clients who used the online channel
Clients who used the in person channel are more likely to have been in contact once during their experience, while those who used went online or called a specialized call centre are much more likely to have been in contact 5 times or more.
Service Channel Use
At six in ten, clients are most likely to have used the online channel during their service experience, followed by nearly half who went in-person and two in ten who called a specialized call centre.
Figure long description
Service Channel use, % Yes (2018-19), horizontal bar chart:
Total, n=4401;
[person on computer, icon], Online, 60%;
[person sitting at desk, icon], in-person, 54%;
[person with calling headset on, icon], specialized call centres, 20%
Total %Yes excluding SIN, n=3491:
Online, 58%;
In-person, 42%;
Specialized call centre, 25%
Q1A. Which of the following did you use during your experience applying for [PROGRAM] or [ABBREV]? This can include where you went to find out about [ABBREV] before you applied, when you applied or followed up on your application. Which of the following did you use to get or provide information about your OAS and GIS benefits?? (n=4401)
Ease and Channel Use
Clients who used the in person channel are clients who are less likely to agree it was easy to apply and understand the requirements to apply.
Clients who used the online channel alone are clients who are more likely to agree that it was easy to find information about how to apply. They are less likely to agree it was clear what would happen next or that they needed to explain their situation only once.
Clients who called a specialized call centre are clients who are less likely to agree information was easy to understand, that it was clear what would happen next and when or that they needed to explain their situation only once.
Figure long description
EASE by, bar chart;
*It was easy to understand the requirements to apply for…, 86%, significant increase from last year;
*information was easy to understand, 86%, significant increase from last year;
Overall, it was easy for you to apply for…, 85%
*It was easy to find information about how to apply for…,83%, significant increase from last year;
Throughout the process it was clear what would happen next and when it would happen, 77%
You needed to explain you situation only once, 77%
Chart
In-person
*It was easy to understand the requirements to apply for…, 84%, significantly lower than the total;
*information was easy to understand, 85%;
Overall, it was easy for you to apply for…, 81%, significantly lower than the total;
*It was easy to find information about how to apply for…,82%;
Throughout the process it was clear what would happen next and when it would happen, 76%
You needed to explain you situation only once, 77%
Online
*It was easy to understand the requirements to apply for…, 86%;
*information was easy to understand, 87%;
Overall, it was easy for you to apply for…, 86%,;
*It was easy to find information about how to apply for…,85%, significantly higher than the total;
Throughout the process it was clear what would happen next and when it would happen, 75%, significantly lower than the total;
You needed to explain you situation only once, 74%, significantly lower than the total;
Specialized Call Centre
*It was easy to understand the requirements to apply for…, 83%;
*information was easy to understand, 80%, significantly lower than the total;
Overall, it was easy for you to apply for…, 85%;
*It was easy to find information about how to apply for…,81%;
Throughout the process it was clear what would happen next and when it would happen, 66%, significantly lower than the total;
You needed to explain you situation only once, 64%, significantly lower than the total;
*question placement was different and/ or alternative scale used in 2018-19 compared to 2017-18
Base: All respondents, base may vary by statement
Q36b. Thinking about the overall service you received, from getting information about [INSERT ABBREV] to receiving a decision, how much do you agree or disagree with the following statements, using a 5-point scale (where 1 means strongly disagree, and 5 means strongly agree.)
Effectiveness and Channel Use
Clients who used the in person channel are more likely to agree that it was easy to get help when needed.
Clients who used the online channel are less likely to agree it was easy to get help when needed.
Clients who called a specialized call centre are clients who are less likely to agree they were able to move smoothly through all the steps of their application, that they received consistent information or that the length of the client journey was reasonable.
Figure long description
EFFECTIVENESS bar chart;
You were able to move smoothly through all the steps related to your application, 84%, significant increase from last year;
You received consistent information, 82%;
It was clear what to do if you had a problem or question,78%;
It was easy to get help when you needed it 77%;
The amount of time it took, form when you started gathering information to when you got a decision on your application was reasonable, 76%;
Chart
In-Person
You were able to move smoothly through all the steps related to your application, 83%
You received consistent information, 81%;
It was clear what to do if you had a problem or question,79%;
It was easy to get help when you needed it 81%, significantly higher than total;
The amount of time it took, form when you started gathering information to when you got a decision on your application was reasonable, 76%;
Online
You were able to move smoothly through all the steps related to your application, 83%
You received consistent information, 81%;
It was clear what to do if you had a problem or question,78%;
It was easy to get help when you needed it 73%, significantly lower than total;
The amount of time it took, form when you started gathering information to when you got a decision on your application was reasonable, 74%;
Specialized call centre
You were able to move smoothly through all the steps related to your application, 72%, significantly lower than total
You received consistent information, 72%;
It was clear what to do if you had a problem or question,79%;
It was easy to get help when you needed it, 76%;
The amount of time it took, form when you started gathering information to when you got a decision on your application was reasonable, 62%, significantly lower than total;
Base: All respondents base may vary by statement
Q36b. Thinking about the overall service you received, from getting information about [INSERT ABBREV] to receiving a decision, how much do you agree or disagree with the following statements, using a 5-point scale (where 1 means strongly disagree, and 5 means strongly agree.)
Confidence and Channel Use
Clients who used the online channel are less likely to have confidence that issues or problems would be easily resolved.
Clients who called a specialized call centre are less likely to agree Service Canada Agents were helpful or that they had confidence that issues or problems would be easily resolved.
Figure long description
CONFIDENCE, bar chart:
*Service Canada Agents were helpful, 89%, significant decrease from last year;
*You were confident you had everything you needed when you submitted your application, 88%, significant increase from last year;
Confident that your personal information was protected, 87%;
You were confident that any issue or problems would have been easily resolved, 78%, significant increase from last year;
Chart
In-person
*Service Canada Agents were helpful, 89%;
*You were confident you had everything you needed when you submitted your application, 88%;
Confident that your personal information was protected, 89%;
You were confident that any issue or problems would have been easily resolved, 79%;
Online
*Service Canada Agents were helpful, 88%;
*You were confident you had everything you needed when you submitted your application, 88%;
Confident that your personal information was protected, 88%;
You were confident that any issue or problems would have been easily resolved, 75%, significantly lower than total;
Specialized Call Centre
*Service Canada Agents were helpful, 85%, significantly lower than total;
*You were confident you had everything you needed when you submitted your application, 85%;
Confident that your personal information was protected, 87%;
You were confident that any issue or problems would have been easily resolved, 71%, significantly lower than total;
*question placement was different and/ or alternative scale used in 2018-19 compared to 2017-18
Channel Use By Number of Times Clients Contacted Service Canada
Number of contacts during the client journey differs by channel. Clients who used the in person or mail channels are more likely to have been in contact with Service Canada once during their experience, while those used the online channel or called a specialized call centre are much more likely to have been in contact 5 times or more.
Figure long description
Number of Times Contacted Service Canada, 2018-2019, n=4401, Bar chart:
Total;
One, 20%;
Two, 15%;
Three, 11%;
Four, 7%;
5 or more, 34%;
Don’t know, 13%
EI
One, 13%;
Two, 11%;
Three, 9%;
Four, 7%;
5 or more, 48%;
Don’t know, 12%
CPP
One, 18%;
Two, 20%;
Three, 15%;
Four, 9%;
5 or more, 28%;
Don’t know, 10%
CPP-D
One, 11%;
Two, 14%;
Three, 10%;
Four, 8%;
5 or more, 43%;
Don’t know, 15%
SIN
One, 30%;
Two, 19%;
Three, 11%;
Four, 6%;
5 or more, 18%;
Don’t know, 15%
OAS/GIS
One, 21%;
Two, 21%;
Three, 11%;
Four, 8%;
5 or more, 21%;
Don’t know, 18%
Base: All respondents (Varies)
Q1c. And, how many times did you… [IF MULTIPLE SOURCES SELCTED AT Q1a ‘use each of the following’ IF ONLY ONE SOURCE SELECTED AT Q1a ‘INSERT SINGLE ITEM FROM LIST BELOW’] during your experience with [INSERT ABBREV]?
Reasons for Channel Use for Information on Applying
Qualitative Findings
Most sought information on applying for government benefits before or during the application process.
Many participants used government sources for information –Service Canada employees and government website are the primary government sources.
Most who went to Service Canada in person said that receiving the information they were seeking on the spot was a key benefit.
Most who went to the government website found the information they needed although a few were not able to find what they were looking for – this was mostly navigational based on the perception that they thought the information would be available, but couldn’t find it or found it irrelevant to their application– this was especially true for CPP clients.
Many were unaware that they had the option of calling 1 800 O-Canada as a source of information; awareness that it is separate from the specialized CPP and EI call centres was mixed to low.
Regardless of channel, clients would like to receive consistent information from Service Canada; this was mentioned as a pain point for a few.
Many participants also used other sources including non-government websites, friends and family, and for CPP-D clients, their insurance companies.
Mentions were made that upon conducting an internet search, the government website was not the first one to come up.
Some CPP-D clients were provided information by their insurance companies on how to apply and were given information that did not align with service standards – notably, they were told by the insurance company that the wait for a response would be longer than what clients were told by the government.
A few spoke to family or friends who had past experience applying for benefits as a source of information and this was a mixed experience – some found them helpful and others did not.
Service Experiences with Getting Information
Qualitative Findings
When you do the internet search for the CPP or CPP Disability, or any kind of these services, what will push around a lot of commercial [websites] and things first which makes it really hard to find out what you’re doing. And I don’t know how they can make their search a little bit better, Government of Canada, to send them, because they are the official responder for this kind of question, instead of commercial lawyers.
[With friends and family] I got a bunch of conflicting answers […] In part, whether rental income counted as income or how you reported that or if that made you ineligible, or how it would impact the EI process. And also just some stuff around the whole for-cause [termination of employment], not-for-cause angle.
For the most part, the government website is not necessarily the easiest thing to navigate […] it’s not that you can’t get information, it’s that you get so much information and it’s not necessarily the most navigate-able site. If you spend some time on it or you know your way around, you can get into it. Otherwise it can be a fairly overwhelming experience for the average person.
My insurance carrier gave me more information than anybody else, even when I applied, they said, you know the 3 month period, [but] my insurance carrier when I contacted them to say I applied, said, “Don’t expect a response for 6 to 9 months” and they were correct.
Social Media Usage During the Client Journey
Few clients used social media to discuss or learn from others’ experience with Service Canada programs during the client journey.
SIN clients were the most likely to have used social media for this purpose, while CPP and OAS/GIS clients are least likely.
Figure long description
Used Social Media to Discuss or Learn About Other’s Experiences?:
Total, n=4401;
Yes-several times, 1%;
Yes-once or twice, 4%;
No, 95%;
CPP-D, n=766;
Yes-several times, 2%;
Yes-once or twice, 4%;
No, 94%;
SIN, n=920;
Yes-several times, 2%;
Yes-once or twice, 7%;
No, 92%;
EI, n=1098;
Yes-several times, 1%;
Yes-once or twice, 4%;
No, 95%;
CPP, n=788;
Yes-several times, 0%;
Yes-once or twice, 2%;
No, 97%;
OAS/GIS, n=829;
Yes-several times, 0%;
Yes-once or twice, 3%;
No, 96%;
Base: All respondents
Q1h. At any point in your experience with [INSERT ABBREV] did you ever use social media (such as Facebook, Twitter or Reddit) to discuss or learn about others’ experience with this program?
Service Transformation: Self-service Take-up
Summary: Self-Service Take-Up
For those clients who had the option to apply online, the vast majority of EI clients chose to do so, compared to roughly four in ten CPP-RTR clients. The majority did not require phone assistance while doing so.
More than seven in ten (72%) EI clients applied online from “home,” while nearly three in ten (28%) went in person. Roughly four in ten (43%) CPP-RTR clients applied online from “home,” one-third (32%) in person and one quarter (23%) by mail. The majority of both EI (60%) and CPP-RTR clients (54%) did not require any assistance by phone when completing the application online. However, CPP-RTR clients are more likely than EI clients to have required phone assistance.
Among those who submitted online from home, the vast majority used a computer to do so. Around one quarter of EI clients said they submitted using a mobile device, compared to one in ten CPP-RTR clients.
Among EI and CPP-RTR clients who submitted their applications in person, the majority went directly to the centre, without trying online first.
Clients who were not e-vulnerable are less likely to have applied in-person for EI or CPP-RTR however among those who did they are no more likely to have tried online from home before going in person.
Qualitatively, most clients who are “e-savvy” say they are able to apply online with ease and found the experience simple and user-friendly. All clients, however, express the desire for greater online functionality to confirm the accuracy of their application and that it is being processed.
Most clients who applied online characterized the experience as simple from a navigation standpoint and are confident in their own ability to navigate the system, and/or find other information they needed.
The convenience and time savings of not having to go into a Service Canada Office in person are seen as key benefits.
Clients in remote locations, who aren’t able to visit a Service Canada Office as easily, characterized the experience of applying online positively. Those who experienced difficulty typically called a Service Canada Office for assistance.
A few clients mentioned unaided that recent service improvements such as MSCA accounts, and the ability to use more browsers has increased their ability to apply online.
The main barriers to applying online from home are psychological and emotional. Clients are often applying for benefits for the first time and the importance of the support increases the need for reassurance and confidence.
Almost all clients are actively using other online services on a regular basis. However, clients feel that the situations are not parallel in that they very rarely apply for government benefits – for many, they are applying for the first time.
Further, the gravity and importance of what they are applying for means that they have a heightened sense of needing reassurance and feeling confident in the process.
The vast majority of EI and CPP-RTR clients registered for a My Service Canada Account (MSCA), while few OAS/GIS clients did so. Users find the platform simple and easy to use, while non-users lacked awareness of the platform and its functionality.
More than seven in ten EI (79%) and CPP-RTR clients (74%) said they registered for a My Service Canada Account (MSCA) during their application, while only three in ten (28%) OAS/GIS clients said they did so.
Three-quarters (76%) of those who said they registered for a MSCA found it easy to use. Ease of use of MSCA is consistent across EI, CPP-RTR and OAS/GIS clients.
Roughly one quarter of clients in each program required assistance setting it up their MSCA, with half of those clients going into an office for help while one-third called an office.
Nearly eight in ten (78%) used MSCA to check the status of their application and two-thirds (66%) of those who did got the information they needed. EI clients are far more likely to have checked the status of their application. CPP-RTR clients are more likely to have received the information they needed without calling Service Canada for assistance.
Qualitatively, the functionality offered by MSCA is universally appealing. However, many are unaware of the platform and/or about the range of functions and information available.
Clients say that use of MSCA would eliminate confusion and uncertainty about their application, and provide confidence their application was accurate, successfully submitted and actively being monitored or processed.
The idea of a centralized “case management” system that they could access is extremely appealing.
A few had issues with registering for an account and having a PIN number sent via email is appealing to most.
Current awareness of 1 800 O-Canada and its purpose is low although interest is high if the wait times are reasonable.
One third (34%) of clients are aware of 1 800 O-Canada. Awareness is lower among SIN clients (27%), Youth 18-30 (27%), Ontario residents (29%) and newcomers (25%).
Qualitatively, many who heard about 1 800 O-Canada during the research expressed interest in using it as a resource while applying for benefits. However, clients believe that wait times to reach a live agent will be long based on a general perception of past experience with call centres for any large organization.
Clients are divided on their preferred approach to phone channel wait times but universally agreed in the desire for clearer expectations about timeliness of service. Many clients said unaided that they would like the ability to receive a call-back over either queuing option presented.
Clients are equally split on whether they’d prefer to reach an agent every time they called (even if they wait time was up to an hour) or wait 20 minutes to speak with an agent, but not get through each time they called.
Qualitatively, clients would like expectations of wait times from the outset so they can make an informed decision. There were many unaided mentions during all groups of having a callback option where they enter their telephone number and are called back once an agent becomes available.
The main reason clients opt for in-person service is the confidence it provides. To better replicate the in-person experience clients say they would like focus to be placed on ease of access to assistance, and providing a mechanism to confirm accuracy of the application process.
Among those who went in person to a Service Canada Office, the main reasons they prefer to do so are confidence things are done properly, and to get assistance/make it easier. OAS/GIS, CPP-D and CPP clients are more likely to say they are not comfortable applying online, while CPP-D and OAS/GIS clients are also more likely to report they don’t have access to the internet / to a computer.
Similarly, the most common reason for getting help with an online application at an office, rather than by phone, is that face-to-face interactions give clients more confidence (particularly for CPP and CPP-D clients).
Qualitatively, applying in-person is perceived to have a number of advantages over applying online. These include the confidence that their application is accurate and submitted, that it would be faster or easier than calling to get assistance and the desire to be “coached” through the application, to ensure greater chance of approval and/or to prevent delays.
Further, those who had a more complicated case (such as CPP-D clients) feel they would be better handled in person.
For those programs where online applications are not currently available, half say they would apply online from home given the option. CPP-SRV clients are less likely to do so.
When presented the option of applying from home, half of SIN and CPP-D would do so with the balance preferring in person. The majority of CPP-SRV clients would prefer in person with roughly one-third open to an online application.
Of those who say they would apply online from home, three-quarters would do so by a home computer versus a mobile device. CPP-SRV clients are less likely to say they would use a mobile device.
Over half the clients who could self-serve say they would need improved assistance to apply from home but no one solution works for all clients. Providing clients a variety of avenues to receive assistance for: explanations, and mechanisms to confirm receipt of application, and key milestones would motivate more uptake of self-service.
Among those clients who have the option to self-service but chose in person, nearly half would be motivated to apply online from home if improved assistance could be provided during the process.
Quick help by phone during business hours and being able to talk to an agent by video link are most likely to drive clients to apply from home. If steps online were simpler and clearly explained or if quick help could be provided through online chat when needed, this would be motivating to some. Notably, two in ten said none of the proposed solutions would motivate them to apply from home.
As learnt through the qualitative research, attracting clients to self-service needs to fulfill their need for detailed information and instruction and providing some of the best aspects of the in-person experience. These include reassurance the application is accurate and actively being processed, confirmation that any supporting documents have been received, and ease of having their questions answered.
Concerns with self-service would also need to be addressed in order to drive uptake. These include better communication of expectations for each step of the application process and providing reassurance that their application matters. There is also a perception that online systems are less equipped to handle unique and complex situations.
Self-Service Take-up Among EI and CPP-RTR Applicants
A large majority of EI clients and four in ten CPP-RTR clients applied online “from home”*; one third required phone assistance. One in five who applied from home used a mobile device. One third of EI and CPP RTR clients went to an office to apply.
Figure long description
Application Method
All Clients
Online from “home, 54%
At a computer in a Service Canada Centre, 14%
At a counter in a service canda centre, 13%
By mail, 9%
Auto-enrolled, 8%
EI
Online from “home, 72%
At a computer in a Service Canada Centre, 19%
At a counter in a service canda centre, 9%
By mail, N/A
Auto-enrolled, N/A
CPP-RTR
Online from “home, 39%
At a computer in a Service Canada Centre, 6%
At a counter in a service canda centre, 28%
By mail, 25%
Auto-enrolled, N/A
Submitted via…
All clients
Mobile device, 22%
Computer, 76%
EI
Mobile device, 23%
Computer, 74%
CPP-RTR
Mobile device, 9%
Computer, 90%
36% of Clients (EI and CPP-RTR) required assistance during their online application outside an SCC
* “From home” was defined throughout the survey as “submitting an application online from your primary residence or online from some other location, but not in an office with Service Canada staff.”
Self-Service Take-Up
Qualitative Findings
Most who are “e-savvy” are able to apply online with ease but all clients would like more active communication or interface that lets them know that their application is correct and being processed
Most characterized the experience as being relatively simple from a navigation standpoint: they were able to fill out the required information and move from one screen/page with ease – they found the user interface simple and user-friendly
Many are confident in their own ability to navigate the system, and/or find other information they needed through various sources.
Some lived far away (small towns) so applying online is their only option. Most of these clients characterized the experience of applying online positively -- even if they were not entirely comfortable or confident in their online skills, they found the process easy, or they managed to “figured it out”, or they called into a call centre for assistance
Some are less confident in their own e-savviness, but most managed to figure out how to apply and submit their application
Some chose to apply online for the convenience and times savings of not having to go into a Service Canada Office in person
A few preferred to apply online as they feel this allowed them take their time to respond to the questions
A few found recent service improvements such as MSCA accounts, and the ability to use more browsers has increased clients’ ability to apply online.
A few like that they can take their time with the application and fill it out at their convenience and leisure when doing it from home.
A few who applied online repeatedly (EI seasonal worker) said they are familiar with the application process and find it much faster than having to apply in person or by phone (as in previous years).
I was away from the major centre. In a small town. I wanted to ensure I did it correctly ‘cause I know if it’s not put in properly you go to the bottom of the barrel. I phone and sure enough I hadn’t put it in correctly. I’m older and not completely computer literate. They helped me through quite graciously and everything flowed smoothly after that.
It’s always nice to do it online in my own timeframe. That’s why I chose to go online. I like some of the extra features. When I was applying for my service there were additional information screens I used and I used them for a few months ahead of time to help me make my decision.
Whenever you do something online it’s always good to hear back that it worked […] or if it didn’t work. Either or. If you get positive feedback, confirmation it worked, it leaves you feeling psychologically at ease and if it didn’t work well then you know that you’ve got an issue you need to resolve. So it’ll save time.
[…] I went down to Service Canada, and spoke directly […] I did try to find it on the computer, but being older and not really, really familiar with the computer, it can be very, very complicated. Navigating and trying to find specific answers for specific questions was really, really difficult for me.
Other Online Tasks and Applications
Qualitative Findings
The issue with online applications is generally not usability, simplicity or with the website/online application itself – the main barriers are psychological and emotional.
Almost all clients are actively using other online services on a regular basis
These are predominantly banking and shopping, with some other items such as health benefits, business webinars, social media, bill payments, other government services.
These sites all have “instant gratification” features such as order tracking or account information that many perceive is currently lacking on the government benefits website/application process.
However, clients feel that the situations are not parallel in that they very rarely apply for government benefits – for many, they are applying for the first time.
As such, their comfort and ease with other online services is based on frequency of use, often for many years.
Further, the gravity and importance of what they are applying for means that they have a heightened sense of needing reassurance and feeling confident in the process.
For most there are serious financial implications to their applications and so they are especially interested in knowing that their applications have been received and are being processed. This was especially pronounced for those applying for EI and CPP-D, and less pronounced for those applying for CPP/OAS.
The uncertainty of not knowing about their application is also a source of great stress to some.
Applying to a government program like this is a bit more complicated and your answers require a bit more input to them than oh, I ordered the wrong thing [when online shopping]. The programs are complex and it’s not obvious how any given answer is going to affect the given outcome. Where with online ordering, you know that pushing this button is going to do this obvious thing. I think a number of people would like to have someone there to help walk them through it. I think that’s the main difference between that and other online services.
It cost me, probably $5000 in savings that I went through waiting for the CPP Disability, right? Because I was put off my other disability and I had to go into my savings and start using it. Now I was cut off in September and didn’t get payment until February. So, I live very frugally and I still do live very frugally, but that was pretty hard.
Even when you buy something like a gift for someone online, you can track that shipment coming. If it doesn’t arrive within the 3 to 4 days, you already know something’s wrong, you can call and get a recourse. You never know with doing it the other way online with the government.
It’s horrible, you are left swinging in the wind. You do not know exactly what you can do. Your security is gone, because you have no idea whether or not if you are going to be accepted or you’re going to have to make other plans, and you’re watching your savings dwindle to nothing […] the cost of living is going up and it’s just, it’s horrible, it’s just a terrible feeling not knowing.
Among EI and CPP-RTR clients who submitted their applications at a Service Canada centre, the majority went directly to the centre, without trying online first.
Those clients who are not e-vulnerable are less likely to have applied in-person for EI or CPP-RTR however those who did are no more likely to have tried online from home before going in person.
Figure long description
2018-19, EI/CPP-RTR(horizontal bar chart), % not e-Vulnerable:
At a computer in a Service Canada Centre, among EI/CPP-RTR: 16%, Not e-vulnerable: 13%;
At the counter in a Service Canada Centre, among EI/CPP-RTR: 13% , Not e-vulnerable: 12%;
[division line]
Went to a Service Canada Centre directly, among EI/CPP-RTR: 76%, not e-vulnerable: 70%;
Tried from home first, among EI/CPP-RTR: 21%, not e-vulnerable: 27%
2018-19, EI (horizontal bar chart), % not e-Vulnerable:
At a computer in a Service Canada Centre, among EI-CPP-RTR: 19%, Not e-vulnerable: 18% ;
At the counter in a Service Canada Centre, among EI/CPP-RTR: 9%, Not e-vulnerable: 6%;
[division line]
Went to a Service Canada Centre directly, among EI/CPP-RTR: 78% ,not e-vulnerable: 72%;
Tried from home first, among EI/CPP-RTR: 20% , not e-vulnerable: 26%;
2018-19, CPP-RTR(horizontal bar chart), % not e-Vulnerable:
At a computer in a Service Canada Centre, among EI-CPP-RTR: 5%, Not e-vulnerable: 4%;
At the counter in a Service Canada Centre, EI/CPP-RTR: 27%, Not e-vulnerable: 19%;
[division line]
Went to a Service Canada Directly, EI/CPP-RTR: 70%, not e-vulnerable: 57% ;
Tried from home first, EI/CPP-RTR: 24%, not e-vulnerable: 36%
Base: All respondents
Q1d. How did you submit your application?
Base: Submitted application via computer or counter in Service Canada centre
Q1g. Did you go directly to a Service Canada centre to apply or did you try to complete the application online at home first? (ONE RESPONSE ONLY. CLARIFY IF NECESSARY: online from home refers to submitting an application online from your primary residence or online from some other location, but not in a Service Canada Office)
My Service Canada Account: Registration Assistance and Ease
The vast majority of EI and CPP-RTR clients registered for a My Service Canada Account (MSCA) during their application, while only three in ten OAS/GIS clients did so. Among those who registered for MSCA, roughly one quarter required assistance setting it up, with half of those clients going into an office for help while one-third called a call centre.
Three-quarters of those who registered for a MSCA found it easy to use. This was consistent across all relevant programs.
Figure long description
% saying yes, registered for My Service Canada Account, by program:
Total, n=2269, 70%;
EI, n=1098, 79%;
CPP-RTR, n=342, 74%;
OAS/GIS, n=829, 28%
% saying yes, required assistance setting up My Service Canada Account:
Total, n=1333, 23%;
EI, n=253, 23%;
CPP-RTR, n=849, 23%;
OAS/GIS, n=231, 2%
Received Assistance Via each channel, by program n=317:
Visited an office, 48%;
Within CPP-RTR, 50%;
Within EI, 48%;
Within OAS/GIS, 47%
Called an office, 34%;
Within CPP-RTR, 27%;
Within EI, 33%;
Within OAS/GIS,42%
Some other way, 27%;
Within CPP-RTR, 30%;
Within EI, 28%;
Within OAS/GIS, 20%
Figure long description
My Service Canada Account was easy to use:
Total, n=1333;
5-strongly agree, 45%;
Rated 4, 31%;
Rated 3, 16%
Rated 2, 4%
1-Strongly Disagree, 3%
EI, n=849;
5-strongly agree, 46%;
Rated 4, 31%;
Rated 3, 16%
Rated 2, 4%
1-Strongly Disagree, 3%
CPP-RTR, n-253;
5-strongly agree, 38%;
Rated 4, 37%;
Rated 3, 15%
Rated 2, 5%
1-Strongly Disagree, 5%
OAS/GIS, n=231;
5-strongly agree, 39%;
Rated 4, 32%;
Rated 3, 17%
Rated 2, 4%
1-Strongly Disagree, 5%
% Agree (4 or 5)
EI, 76%;
EI,76%;
CPP-RTR, 74%;
OAS/GIS, 70%
Base: All respondents
Q33a. Did you register for a My Service Canada Account during your experience with [INSERT ABBREV]?
Base: Registered for My Service Canada Account during experience with [INSERT ABBREV]
Q33b. Did you require any assistance setting up your My Service Canada Account?
Q34b. Please tell me how much you agree or disagree that your ‘My Service Canada Account was easy to use’ using a 5-point scale.
Base: Required assistance setting up My Service Canada account
Q33bx. How did you receive assistance setting up your My Service Canada Account?
Take-Up of MSCA
Qualitative Findings
Qualitative participants who were MSCA users valued the service.
For those who use MSCA regularly, they are advocates for its use as being a simple and easy-to-use way of accessing their information as it relates to government services and benefits.
They are enthused about its functionality and usefulness, and were happy to advocate its use during the course of the sessions.
For those who are unaware of MSCA, they find the idea appealing and would definitely consider trying/using it.
This was partially due to the enthusiasm and positive feedback from those who are currently actively using an MSCA account.
Even amongst those who had signed up for an account, all were not aware of the various features and functions of MSCA.
Mentions were made by a few that although they had signed up for an account, they did not find a need to use it, and were surprised by the range of items that were available through MSCA.
The idea of a centralized “case management” system that they could access is extremely appealing.
Finding out that many of the concerns they mentioned through the course of discussions could be addressed by using their MSCA was both surprising and would incent many to sign up for an account.
A few qualitative participants had issues with registering for an account and eventually gave up on trying.
Having a PIN number sent via email is appealing to most, who thought this would be an efficient and simple way to receive a PIN.
A few had concerns about the security of receiving a PIN number by email and as such, felt that the option to receive it by mail was preferred.
Being able to see one’s application online is universally appealing.
This would eliminate much of the confusion and uncertainty about their application, and provide confidence about whether or not their application had been filled out correctly, and successfully submitted.
It would address the perception that some have that their application is not being actively monitored or processed.
Some had service experiences that they characterized as poor when they waited for long periods, only to find out from an agent that their application was not complete in some way.
The more detailed information can be provided online, the better.
In other words, not simply saying that the application has been processed, but letting the client know if/how they can and should follow up, or if there are specific items missing that would need to be (re) submitted.
The clients we spoke to are generally not calling to find out their cheque amounts or deposit dates.
Once their application has been processed and approved, this information is relatively straight-forward.
The ambiguity for clients is about the application process for most. Once they know the amount they are entitled to and when it will be received, they are clear on this and don’t require much follow up.
[…] I used my Service Canada account all the time. I love it.
It’s easy to use and I have one, so if I have to log in or check my thing, it’s always there […] Absolutely [would recommend].
I’ve been aware of [MSCA] since day one, and used it for other things like you can go to different areas of Service Canada, look for work anywhere across Canada, file for unemployment benefits, any of that stuff, and I’ve used it for that, as well as the CPP. And it’s very beneficial, and that’s all you need, is that security number. I’ve used the same security number for, I’d say the last 12 years – I’ve used the same PIN number and never had a problem getting in or out.
If we had an account set up […] it would be advantageous to be able to log in to an account, when internet was available, to determine the status, i.e. application being received, being considered, accepted, rejected etc.
it’s a good idea to have a common login for all federal services and then internally we can guide to different platforms.
It’s something I’ll have to take a look at for sure. It’s something I never felt a need for. I’ve only recently started getting CPP. I wasn’t really accessing those programs before so I didn’t really feel any compelling need to have it.
Take-Up of MSCA Using Self-Service, Phone Assistance and In-Person Assistance
Among those who registered for a MSCA, nearly eight in ten used MSCA to check the status of their application. EI clients are far more likely to have done so compared to CPP-RTR and OAS/GIS clients.
Two-thirds of those who checked their status say they got the information they needed and did not need to call for more information.
Figure long description
% saying, yes, Used My Service Canada Account to check status of application online:
Total, n=1333, 78%;
EI, n=849, 82%, significantly higher than total;
CPP-RTR, n=253, 54%, significantly lower than total;
OAS/GIS, n=42, 42%, significantly lower than total
2018-19, n=928, getting information needed from My Service Canada Account (CPP-RTR=137, EI=686,= OAS/GIS=105), horizontal bar chart:
You got the information you needed, 66%;
You got some information but called a specialized [insert abbrev] call centre for more information about the status of your application, 29%;
You did not get the information you needed, 4%;
Chart
CPP-RTR (n=137)
You got the information you needed, 84%, significantly higher than total;
You got some information but called a specialized [insert abbrev] call centre for more information about the status of your application, 10%, significantly lower than total;
You did not get the information you needed, 5%;
EI (n=686)
You got the information you needed, 65%;
You got some information but called a specialized [insert abbrev] call centre for more information about the status of your application, 30%;
You did not get the information you needed, 4%;
OAS/GIS (n=105)
You got the information you needed,73%;
You got some information but called a specialized [insert abbrev] call centre for more information about the status of your application, 18%, significantly lower than total;
You did not get the information you needed, 8%;
Base: Registered for My Service Canada Account during experience with [INSERT ABBREV]
Q34ax. Did you use a My Service Canada Account to check on the status of your application online?
Base: Used My Service Canada Account to check status of application online
Q34bx. Thinking about when you checked the status of your application using your My Service Canada Account, which of the following most closely applies to your experience?
Drivers of Channel Use
The main reasons clients prefer to go in-person to a Service Canada centres are confidence things are done properly, and to get assistance/make it easier.
OAS/GIS, CPP-D and CPP clients are more likely to say they are not comfortable applying online, while CPP-D and OAS/GIS clients are also more likely to report they don’t have access to the internet / to a computer.
Figure long description
Main Reason for visiting Service Canada Office, 2018-19, n=1688 (EI=329, CPP=285, CPP-D=370, SIN=476, OAS/GIS=228):
It gives me confidence that it is being done properly, 30%;
To get assistance/ make it easier, 25%;
I am not comfortable enough using a computer or smartphone to apply online, 13%;
Something else, 12%;
Don’t have access to the inter/to a computer, 6%;
I didn’t know I could apply online
I was asked by Service Canada to visit a Government Office to provide information, 4%;
I tried calling Service Canada assistance to complete the application at home but couldn’t get through, 4%;
Chart
EI
It gives me confidence that it is being done properly, 30%;
To get assistance/ make it easier, 27%;
I am not comfortable enough using a computer or smartphone to apply online, 9%, significantly lower than the total;
Something else, 8%, significantly lower than the total;
Don’t have access to the inter/to a computer, 7%;
I didn’t know I could apply online, N/A
I was asked by Service Canada to visit a Government Office to provide information, 10%. Significantly lower than total;
I tried calling Service Canada assistance to complete the application at home but couldn’t get through, 8%, significantly lower than total;
CPP
It gives me confidence that it is being done properly, 28%;
To get assistance/ make it easier, 24%;
I am not comfortable enough using a computer or smartphone to apply online, 19%, significantly higher than the total;
Something else, 8%, significantly lower than the total, 13%;
Don’t have access to the inter/to a computer, 8%;
I didn’t know I could apply online, 0
I was asked by Service Canada to visit a Government Office to provide information, 4%;
I tried calling Service Canada assistance to complete the application at home but couldn’t get through, 3%;
CPP-D
It gives me confidence that it is being done properly, 27%;
To get assistance/ make it easier, 20%, significantly lower than total;
I am not comfortable enough using a computer or smartphone to apply online, 24%, significantly higher than the total;
Something else, 13%;
Don’t have access to the inter/to a computer, 10%, significantly higher than total;
I didn’t know I could apply online, 3%;
I was asked by Service Canada to visit a Government Office to provide information, N/A;
I tried calling Service Canada assistance to complete the application at home but couldn’t get through, 2%;
SIN
It gives me confidence that it is being done properly, 32%;
To get assistance/ make it easier, 25%;
I am not comfortable enough using a computer or smartphone to apply online, 10%;
Something else, 15%;
Don’t have access to the inter/to a computer, 4%;
I didn’t know I could apply online, 12%%;
I was asked by Service Canada to visit a Government Office to provide information, N/A;
I tried calling Service Canada assistance to complete the application at home but couldn’t get through, 1%;
OAS/GIS
It gives me confidence that it is being done properly, 20%, significantly lower than total;
To get assistance/ make it easier, 18%, significantly lower than total;
I am not comfortable enough using a computer or smartphone to apply online, 31%, significantly higher than the total;
Something else, 16%;
Don’t have access to the inter/to a computer, 11%, significantly higher than total;
I didn’t know I could apply online, 2%;
I was asked by Service Canada to visit a Government Office to provide information, N/A;
I tried calling Service Canada assistance to complete the application at home but couldn’t get through, N/A;
Base: (n=1688)
39a. What is the main reason that you [IF EI OR CPP-RTR INSERT ‘chose’ IF ‘VISIT AN OFFICE TO APPLY AT 38e INSERT ‘would choose’] to visit a Service Canada
Office during your experience with [INSERT ABBREV]?
Qualitative Findings
Applying in-person is perceived to have a number of advantages over applying online for those who chose to use this channel.
Those who applied in person…
Want the confidence and reassurance that their application had been filled out correctly, and confirmation that it had been submitted
Believe that it would be faster or easier than calling (for those aware of this channel) to get their questions answered, and lived close by enough that this was an option
Would like to be “coached” through the correct answers to the questions in the application, to ensure that their application will be approved and/or to prevent delays
For the few clients that have more complicated cases, they feel that they would be better handled in person.
They may have started online but had to submit supporting documents in person, or had questions that they needed answered.
Many are unaware that calling into a call centre and speaking to a live agent is an available option.
Some clients have disabilities, issues or restrictions that are barriers to applying online.
Preferred printed formats for various reasons – because they don’t have access to the internet or a personal restriction, such as a vision issue, that makes applying online difficult for them.
Those who applied by mail…
Are not comfortable applying online
Have supporting documents which needed to be mailed in
Do not have internet access or a Service Canada Office close by
I always need someone to hold my hand while I go through and do it, but it’s just to have someone there to be able to explain things more in depth to me. And writing my responses and what is meant by this certain response or whatever. I start getting really lost and confused about stuff like that. So it would have been really helpful if I’d known that was an option, being on the phone […]
My situation was a bit more complicated. When I lost my job, there was some question about whether it would be more cause or not, and there was an appeal process in the moment, so that was a bit unclear, and I was hoping that someone there might be able to help with explaining how to navigate that.
In person because it was easier, and in case I had any problems then someone was there to help me. [I didn’t call in] because I thought the lines would be busy so I didn’t want to try it.
My issue happens to be with my sight so online really wasn’t much of an option for me.
Reasons For Getting Help with Online Application At An Office Rather than by Phone
By far the most common reason for getting help with an online application at an office, rather than by phone, is that face-to-face interactions give clients more confidence.
A minority of clients feel it’s easier to show an agent their application than to describe it. Fewer say it is because they aren’t always being able to get through by phone or aren’t aware phone assistance is available.
Figure long description
Main reason for visiting office for assistance rather than online with assistance by phone, 2018-19, n=1521(EI=307, CPP=273, CPP-D=325, SIN=411), horizontal bar chart;
A face-to-face conversation gives me more confidence than a phone conversation, 63%;
Its easier to show an agent my application than to describe it, 17%;
Cant always get through by phone, 9%;
Didn’t know there was phone assistance available, 7%;
Chart:
EI, n=307
A face-to-face conversation gives me more confidence than a phone conversation, 58%;
Its easier to show an agent my application than to describe it, 21%;
Cant always get through by phone, 11%;
Didn’t know there was phone assistance available, 6%;
CPP, n=273
A face-to-face conversation gives me more confidence than a phone conversation, 72%, significantly higher than the total;
Its easier to show an agent my application than to describe it, 13%;
Cant always get through by phone, 6%;
Didn’t know there was phone assistance available, 4%;
CPP-D, n=325
A face-to-face conversation gives me more confidence than a phone conversation, 70%, significantly higher than the total;
Its easier to show an agent my application than to describe it, 15%;
Cant always get through by phone, 6%;
Didn’t know there was phone assistance available, 6%;
SIN
A face-to-face conversation gives me more confidence than a phone conversation, 65%;
Its easier to show an agent my application than to describe it, 14%;
Cant always get through by phone, 7%;
Didn’t know there was phone assistance available, 10%, significantly higher than the total;
Base:(n=1521)
39ax. When submitting an application online from home, assistance can be provided over the phone if needed. What is the main reason you [IF EI OR CPP-RTR INSERT ‘chose’ IF ‘VISIT AN OFFICE TO APPLY AT 38e INSERT ‘chose’, ALL OTHERS ‘would prefer’] to go to an office for assistance rather than applying online from home with assistance by phone?
Receptivity To Online Application
If an online application had been available (for SIN, CPP-SRV or CPP-D), half say they would apply online from home, with the balance preferring to visit an office to apply.
Of those who say they would apply online from home, three-quarters would do so by a home computer versus a mobile device.
Figure long description
Online vs. In-Office Application, pie chart:
Total, 2213;
Apply online, 48%;
Visited an office to apply, 51%
Online vs. In-Office Application, pie chart:
CPP-SRV, n=106;
Apply online, 26%, significantly lower than total;
Visited an office to apply, 59%
CPP-D, n=766;
Apply online, 48%;
Visited an office to apply, 48%
SIN, n=920
Apply online, 50%;
Visited an office to apply, 49%
Figure long description
Device used of applied online, 2018-19, n=1017 (CPP-SVR=36, CPP-D=265, SIN=438:
Home Computer, 74%;
Smart device (smartphone or tablet), 26%;
CPP-D, Devices Used if applied online:
Home computer, 76%
Mobile device, 24%
SIN, n=438:
Home computer, 72%
Mobile device, 28%
Base: All respondents excl. OAS, GIS, EI and CPP-RTR
Q38e. If an online application had been available for [INSERT ABBREV], would you have chosen to apply online from home or would you have chosen to visit an office to apply?
Base: Would apply online if available
38ex. If you had applied online, would you have used a home computer or mobile device, such as a smartphone or tablet?
Impact of Potential Changes on the Take-Up of Self-Service
When asked to choose the most motivating change, quick help by phone during business hours and being able to talk to an agent by video link are most likely to drive clients to apply from home. If steps online were simpler and clearly explained or if quick help could be provided through online chat when needed are also motivating to some. Notably, two in ten say none of the proposed solutions would motivate them to apply from home.
Figure long description
% Who said he Change was Most Likely to Cause Them to Self-Serve
If you could get quick help by phone during business hours, 19%;
If you could talk to an agent by video link from home using a service like Skype, 19%;
The steps to apply were simple and clearly explained online, 13%;
If you could get quick help by online chat whenever you needed it, 11%;
If you knew you would receive confirmation of receipt stating the next step and how long it usually takes, 9%;
If you could add scanned copies of documents required for your application from home, 6%;
The process to register for a My Service Canada Account was easier 2%;
None, 18%
% Who Said They Would Likely Self-Serve If Implemented
If you could get quick help by phone during business hours, 49%;
If you could talk to an agent by video link from home using a service like Skype, 39%;
The steps to apply were simple and clearly explained online, 51%;
If you could get quick help by online chat whenever you needed it, 49%;
If you knew you would receive confirmation of receipt stating the next step and how long it usually takes, 47%;
If you could add scanned copies of documents required for your application from home, 46%;
The process to register for a My Service Canada Account was easier 37%;
Base: (n=550) EI / CPP-RTR clients who applied online or at the counter at a SC centre
39b. Service Canada is considering making changes to how it delivers services to Canadians to make it easier to apply for programs online from home. How much more likely would you have been to apply online from home for your most recent application for [INSERT ABBREV] if each of the following were available at the time?
39bx. And which of these changes would make you most likely to apply from home?
Improving Up-Take of Self Service
Qualitative Findings
Attracting clients to self-service needs to fulfill their need for detailed information and instruction, considering varying needs and access, and providing some of the best aspects of the in-person experience
Currently, the biggest gaps for clients are:
Knowing that they have filled the information out correctly – clients mentioned unaided that other application websites will provide some type of confirmation, or disallow the client from moving on to the next screen/page, if filled out incorrectly.
Knowing that any supporting documents they have sent in by mail have been received, are correct and are not missing from their application – some had experiences whereby their documents were not received. Further, they were not proactively made aware of this by Service Canada but only found out when they followed up themselves.
Knowing that their application is being actively processed through the system.
Having their questions answered and/or not being able to find the information they would like online.
Concerns with Self-Service would need to be addressed in order to drive uptake.
There would need to be both communication about what they can expect, and the service experience must live up to them – to encourage clients to use self-service, both initially and in future.
Concerns vary by audience but the overarching themes are uncertainty and a lack of knowledge about the application process. They would like to know that their application matters and that it is being actively monitored and processed.
There is currently a perception that “the system” is less equipped or able to handle situations or situations that are of a higher complexity, or different than the “norm”.
Some of Government of Canada or Ontario websites, they have some kind of tool, like for OSAP, and when, if a student applies for OSAP, they can assume how much they can get. It’s not 100%, but it’s a function around that. That is the expectation I have, Government of Canada can […] when I filled out my forms online, it gives me assumption and some prediction about am I going to be accepted, chance of being accepted, and how much I’m going to get.
I go in person partially because if there’s a question I’m not sure about after I read it what it is meaning or what they need from me, then there’s somebody always there. But if I was filling it in online, I’m not so sure [if] I put in a wrong answer.
It’s timeliness, that we know something’s happening. It’s nice to know your file is active on someone’s desk.
I mean certainty like that [knowing about the process] is always nice. It wasn’t my particular focus when I was applying, but obviously having clearly laid-out steps and timelines can only be a good thing.
Preferred Channel Options
Qualitative Findings
Regardless of which channel option clients chose, the key takeaway is that they would like for it to be quick and easy to access.
Many like online chat as they are familiar with using this format through other organizations.
However, mentions were made by a few that they would not like for this to be a “bot” that answers their questions automatically but personalized service similar to what they would receive in person. Others weren’t concerned with the format as long as their questions were answered to their satisfaction. Some would expect that this would be available right away without having to wait.
Those who are e-savvy prefer this option over others.
Some like the option of receiving quick assistance by phone during business hours
The key to this option would be “quick”, as current expectations and perceptions of phone service generally (not specific to Service Canada) is poor.
This would be an appealing option to those who believe they are less e-savvy.
Clients would expect that the agent would be knowledgeable, helpful and able to answer any questions that they have.
For a few, being able to upload scanned documents is of interest
These clients believed that this would save a lot of time and effort, particularly for those who live far away from a Service Canada Office or for those who had poor experiences in the past (supporting documents were “lost” or not received)
For a few, a video link by Skype is appealing.
This would be a convenient option that would mimic the best aspects of in-person service. A few suggested that this could be a scheduled call.
This could also be a visual option in that the forms or items being discussed could be physically shown to clients.
I like online chats more than phone calls, simply because, you could explain the situation, you’re engaged with the individual, it’s real time, and then they send you a transcript of the call, which is very beneficial in many ways, because then you understand what the situation was, you’ve got something to reference, if you have to call, do another online chat. And also, it removes, it was mentioned earlier, it removes the issues around accents and stuff like that, and hard of hearing, because it’s all done through text.
I’d really like to have online with phone assistance. Because if something is really getting stuck in the online portal it’s good to have the backup support of phone. If someone is less tech savvy there should be phone support […] The person on the other side of the phone has a bit more info and a better understanding of the procedure than me. And I think he’d be able to help me out and give me clear answers to my questions. And he does.
I didn’t need it [for my application] but a lot of other sites I use offer a quick chat box. I suspect sometimes I’m not even chatting with a person. It’s probably AI. But as long as that AI can answer the question I ask, that’s fine.
In my case, because of the type of EI I was applying for, if I was able to upload a scanned document, we could have had this addressed a lot quicker. Unfortunately they don’t accept mailed-in documents for [my situation] I had to literally go sit with a representative and have them do it because they had to stamp and sign it.
Assistance Preferences
Qualitative Findings
Many would welcome some form of assistance when filling out an application, and would also like online confirmation that their application is being actively processed and monitored.
The type of assistance clients would like based on the options presented varied by group.
Those who applied in-person for various programs but are not e-vulnerable (CPP-D and EI) are more likely to want assistance with content and to a lesser degree, some would like technical assistance; those who are e-savvy don’t feel they need any assistance.
CPP clients who applied in person were more likely to want navigational assistance, as they found the government website and online application more confusing than other groups. As such, the function of having an O Canada agent email a URL with application information is appealing to them.
When asked what type of assistance they would like for various tasks of their application (find out the steps to apply, submit an application, provide additional information, ask a question about the application they submitted), most would like to apply online with phone assistance.
Most felt that they would require assistance during these tasks, or at minimum, like knowing that the option is available to them if needed.
This would ensure that they can still have questions answered when needed.
Regardless of the type of available assistance, many would like some form of centralized case management in place so that they can receive answers to their questions regardless of channel.
This is particularly true for those in the Issue Resolution groups, who often escalated because of their difficulty in receiving satisfactory resolution to their questions or issues.
Receiving a message telling clients that the application had been received, what the next step is and how long it usually takes is almost universally appealing and makes them more likely to apply online.
Clients take this a step further to infer that their application is being actively monitored, which is a positive outcome for them.
Always want easy access to technical assistance. Content support to, as disability applicants are often sick. Medicated and fatigued.
I think getting that feedback is a confirmation of where it’s gone and that it’s on its way successfully, so I think it relieves some – anxiety is too strong a word, but you know what I mean. Concern that it’s gone okay.
A good website and simple layout of the website will encourage me to use it. Technical assistance is kind of security if something goes wrong while using the online resource. Content support is important to give some guidance on how and what is expected to be filled.
I strongly believe there should be some kind of monitoring because we are living in an age of technology and we can trace back everything. So yes, I absolutely think so at some level it should be there.
Demographics
Figure long description
Gender:
male icon, 50%;
emale icon, 50%
Figure long description
Age:
Icon of a person listening to music: Youth (18 to 30),33%;
Icon of a person with a satchel on; 31 to 50, 27%,
Icon of a person with a belt: 51 to 64, 22%,;
Icon of a person with a hat: Senior (65 plus),18%
Figure long description
Provinces, [map of Canada, with province border outlined, none in Territories]:
University certificate/diploma below bachelor's level, 6%;
Bachelor's degree, 18%;
Post graduate degree, 11%
Figure long description
Language, horizontal bar chart, [icon of two people sitting at a table]:
English, 79%;
French, 17%;
Both, 1%;
Neither, 3%
Figure long description
Have Restrictions Accessing Service:
Yes, 8%, (check mark icon);
No, 91%, [Giant X];
Don’t know, 1%, [giant question mark]
Figure long description
Identify as Indigenous, pie chart:
No, 85%;
Yes, 9%;
Don’t know, 6%
Figure long description
Indigenous, vertical bar chart:
First nations, 5%;
Metis, 3%;
Inuk, 1%;
None of the above, 85%;
Don’t know, 6%;
Figure long description
Use Online Services, horizontal bar chart, [computer with mouse cursor, icon]:
"Routinely/All the Time“, 60%;
Sometimes, 19%;
Rarely, 7%;
Never, 13
Conclusions
Overall, the vast majority of ESDC clients have a high level of satisfaction (85%) and trust (83%). The timeliness and ease of receiving assistance, including issue resolution, throughout the client journey would either help maintain or improve confidence, which contributes to satisfaction and trust.
Performance
Satisfaction is:
high at 85% satisfied or very satisfied
stable compared to 2017-18
highest for the in-person channel and the delivery of Social Insurance Numbers
strongly related to trust in Service Canada
Service Canada strengths with the greatest impact on satisfaction are:
helpfulness of staff
consistent information
information was easy to understand
Findings indicate that satisfaction can be improved by:
reducing the duration of the client journey for the one third of EI clients and one half of CPP-D clients who found the length to be longer than what is reasonable
increasing ease of accessing assistance through the phone, video link or online chat
improving issue resolution through ease of accessing assistance, simplicity of information, and clarity of process
Access to Service
Strengths:
Clients in most vulnerable groups have a high level of satisfaction with the service delivery
The service experience for Indigenous clients has improved over the previous year
Findings indicate that access can be improved by:
addressing the performance issues previously identified (i.e. duration of client journey, ease of accessing assistance, and improving issue resolution)
supporting clients with restrictions that make it difficult for some clients to access service, such as not being able to visit an office during business hours, needing someone other than an SC officer to assist them, and having a disability
improving the service experience of clients with disabilities to bring their satisfaction up to the levels of other clients. Having a range of ways that the clients can contact Service Canada can help provide access for clients with disabilities but the client journey is long and challenging for many CPP-D clients
Service Transformation
Findings indicate that the following can help to increase uptake of self-service among clients:
MANAGE TIMELINESS EXPECTATIONS – better communicate the steps in the process including how long each step can take up, the client’s role throughout including key milestones, and of ways to receive assistance or information without going in-person (i.e. 1 800 O Canada, MSCA);
AVAILABILITY OF ASSISTANCE – nearly half of clients who have the option to self-serve could be influenced to do so through improved assistance, either through quick help by phone or chat, or through video link; these changes could help to provide clients with confidence they are following the process properly, which is a strong driver for choosing the in-person channel.
CONFIDENCE – clients want to know that their application is important and being actively considered. Service Canada staff excel at making clients feel valued and this represents a shortcoming of the self-service experience at present:
CERTAINTY – providing assurance that their application has been filled out correctly is a strong desired outcome and represents a primary reason clients choose to access services in-person for assistance;
CLARITY – explaining each question in the application, and how to navigate the process overall are key benefits of the in-person channel that could be integrated into other channels;
Appendix A: Details on Methodology
Call Dispositions
Up to seven calls were placed in an effort to reach a selected respondent. Overall, a very high completion rate of 16% was attained compared to the industry average. The final call outcomes are as follows.
CALL OUTCOME
COUNT OF DISPOSITION
Call backs
3603
Completed Interviews
4401
Disqualified
1031
Language Barriers
604
No Answers
11731
Not In Service (Out of Scope)
3795
Over quota
8
Refusals
7663
Terminations
697
TOTAL IN SCOPE
33534
TOTAL RESPONDING
5433
OVERALL RESPONSE RATE
16%
Note: See Detailed methodology report for an analysis of the degree of potential bias among non-responders.
Drivers of Satisfaction – Background on Analysis
The key drivers analysis was conducted by regression among all clients. All key service attributes (Q36b) were included in the key driver analysis in addition to benefit approval/denial. All specific statements included are outlined below.
Based on learnings from the 2017-18 survey, the questionnaire was restructured to allow for inclusion of ‘Service Canada Agents were helpful’. This helped to improve the strength of the drivers analysis from an R2 of 0.51 to 0.66.
Ease
Information was easy to understand
Overall, it was easy for you to apply for [PROGRAM]?
You needed to explain your situation only once
Throughout the process it was clear what would happen next and when it would happen
It was easy to understand the requirements to apply for [PROGRAM]
It was easy to find information about how to apply for [PROGRAM]
Effectiveness
The amount of time it took was reasonable
It was easy to get help when you needed it
You received consistent information
It was clear what to do if you had a problem or question?
You were able to move smoothly through all of the steps related to your [PROGRAM] application
Confidence
Service Canada Agents were helpful
You were confident that any issues or problems would have been easily resolved
You were confident that your personal information was protected
You were confident you had everything you needed when you submitted your application
Other Variables
Received/ Denied Benefit
Definitions For Vulnerable Client Groups
Newcomers
Not born in Canada (Q47c) and arrived within the previous 3 years ((Q47d)
Clients whose preferred language of service is neither English nor French
Identify “other” as preferred language of service (Q41b)
Lower Education
High school or less (Q41)
Youth
Aged 18 to 30 (sample variable)
Seniors
Aged 60 and over (sample variable)
Clients with disabilities
Self-identified (Q44a)
Clients with restrictions
Self-identified (Q45)
Indigenous people
Self-identified as First Nations, Inuit, or Métis (Q44)
E-vulnerable
Clients who rarely or never use online services (Q40)
No online/ mobile only
Self-reported (Q39d)
Remote clients
Sample variable
Official language minorities (OLMC)
Clients in Quebec who prefer service in English, and clients outside Quebec who prefer service in French (sample variable and (Q41b)
Appendix B: Detailed Findings By Service Attribute
Service Attributes- Ease
When it comes to ease of the service experience, nearly nine in ten say it was easy to understand the requirements to apply, information was easy to understand and overall it was easy to apply. Closer to eight in ten say it was easy to find information about how to apply. Comparatively, fewer agree that it was clear what would happen next in the application process or that they need to explain their situation only once.
Compared to 2017-18, clients are more likely to agree that it was easy to understand the requirements to apply, information was easy to understand or it was easy to find information about how to apply.
Figure long description
EASE, Horizontal bar chart, 2018-19:
*It was easy to understand the requirements to apply for…;
5-strongly agree, 65%;
Rated 4, 22%;
Rated 3, 9%;
Rated 2, 2%
1-Strongly disagree, 2%
* information was easy to understand;
5-strongly agree, 63%;
Rated 4, 23%;
Rated 3, 9%;
Rated 2, 3%
1-Strongly disagree, 1%
Overall, it was easy for you to apply for…;
5-strongly agree, 63%;
Rated 4, 23%;
Rated 3, 9%;
Rated 2, 3%
1-Strongly disagree, 3%
*It was easy to find information about how to apply for…;
5-strongly agree, 62%;
Rated 4, 22%;
Rated 3, 11%;
Rated 2, 3%
1-Strongly disagree,1%
Throughout the process it was clear what would happen next and when it would happen;
5-strongly agree, 53%;
Rated 4, 24%;
Rated 3, 13%;
Rated 2, 5%
1-Strongly disagree, 4%
You needed to explain your situation only once;
5-strongly agree, 59%;
Rated 4, 18%;
Rated 3, 9%;
Rated 2, 5%
1-Strongly disagree, 6%
Percent rating 4 or 5 out of 5:
*It was easy to understand the requirements to apply for…;
2018-19, 86%, significantly increased from last year;
2017-18, 81%
* information was easy to understand
2018-19, 86%, significantly increased from last year;
2017-18, 76%
Overall, it was easy for you to apply for…;
2018-19, 85%;
2017-18, 84%
*It was easy to find information about how to apply for…
2018-19, 83%, significantly increased from last year ;
2017-18, 80%
Throughout the process it was clear what would happen next and when it would happen;
2018-19, 77%;
2017-18, N/A
You needed to explain your situation only once
2018-19, 77%;
2017-18, 77%
*question placement was different and/ or alternative scale used in 2018-19 compared to 2017-18
Base: All respondents, base may vary by statement
Q36b. Thinking about the overall service you received, from getting information about [INSERT ABBREV] to receiving a decision, how much do you agree or disagree with the following statements, using a 5-point scale (where 1 means strongly disagree, and 5 means strongly agree.)
Service Attributes- Effectiveness
In terms of effectiveness of the service experience, more than eight in ten agree they were able to move smoothly through all application steps, and that they received consistent information. Comparatively, fewer agree the amount of time the application took was reasonable, that it was easy to get help when needed and it was clear what to do if you had a problem or question.
Compared to 2017-18, clients are more likely to agree that they were able to move smoothly through all the steps.
Figure long description
Effectiveness, horizontal bar charts, 2018-19:
You were able to move smoothly through all of the steps related to your application;
5-strongly agree, 62%;
Rated 4, 22%;
Rated 3, 9%;
Rated 2, 4%;
1-Strongly disagree, 2%
You received consistent information;
5-strongly agree, 61%;
Rated 4, 21%;
Rated 3, 10%;
Rated 2, 4%;
1-Strongly disagree, 3%
It was clear what to do if you had a problem or question;
5-strongly agree, 55%;
Rated 4, 23%;
Rated 3, 12%;
Rated 2, 5%;
1-Strongly disagree, 3%
It was easy to get help when you needed it;
5-strongly agree, 57%;
Rated 4, 19%;
Rated 3, 10%;
Rated 2, 4%;
1-Strongly disagree, 4%
The amount of time it took, from when you started gathering information to when you got your decision on your application, was reasonable
5-strongly agree, 54%;
Rated 4, 22%;
Rated 3, 12%;
Rated 2, 4%;
1-Strongly disagree, 6%
Percent Rating 4 or 5 out of 5:
You were able to move smoothly through all of the the steps related to your application;
2018-19, 84%, significantly higher than last year;
2017-18, 82%
You received consistent information;
2018-19, 82%;
2017-18, N/A
It was clear what to do if you had a problem or question;
2018-19, 78%;
2017-18, 78%
It was easy to get help when you needed it;
2018-19, 77%;
2017-18, 77%
The amount of time it took , from when you started gathering information to when you got your decision on your application, was reasonable
2018-19, 76%;
2017-18, 77%
Base: All respondents, base may vary by statement
Q36b. Thinking about the overall service you received, from getting information about [INSERT ABBREV] to receiving a decision, how much do you agree or disagree with the following statements, using a 5-point scale (where 1 means strongly disagree, and 5 means strongly agree.)
Service Attributes- Confidence
In terms of confidence in the service experience, nearly nine in ten clients agree Service Canada Agents were helpful, they were confident they had everything they needed when submitting their application, and that their personal information was protected. Fewer are confident that any issues/problems would have been easily resolved.
Compared to 2017-18, clients are more likely to agree that they are confident they had everything they needed when they applied or that any issues would be easily resolved. Fewer agree that Service Canada Agents were helpful compared to last year.
Figure long description
Confidence, horizontal bar chart, 2018-19:
*Service Canada Agents were helpful;
5-stringly agree, 74%;
Rated 4, 15%;
Rated 3, 6%;
Rated 2, 3%;
1-Strongly disagree, 2%
*You were confident you had everything you needed when you submitted your application;
5-stringly agree, 68%;
Rated 4, 21%;
Rated 3, 7%;
Rated 2, 2%;
1-Strongly disagree, 1%
You were confident that your personal information was protected;
5-stringly agree, 70%;
Rated 4, 18%;
Rated 3, 7%;
Rated 2, 2%;
1-Strongly disagree, 2%
You were confident that any issues or problems would have been easily resolved;
5-stringly agree, 51%;
Rated 4, 26%;
Rated 3, 13%;
Rated 2, 5%;
1-Strongly disagree, 3%
percent rating 4 or 5 out of 5:
*Service Canada Agents were helpful;
2018-19, 89%, significantly lower than last year;
2017-18, 91%
*You were confident you had everything you needed when you submitted your application;
2018-19, 88%, significantly higher than last year;
2017-18, 80%
You were confident that your personal information was protected
2018-19, 87%;
2017-18, 87%
You were confident that any issues or problems would have been easily resolved;
2018-19, 78%, significantly higher than last year;
2017-18, 76%
Base: All respondents, base may vary by statement
Q36b. Thinking about the overall service you received, from getting information about [INSERT ABBREV] to receiving a decision, how much do you agree or disagree with the following statements, using a 5-point scale (where 1 means strongly disagree, and 5 means strongly agree.)
*question placement was different and/ or alternative scale used in 2018-19 compared to 2017-18
Appendix C: Detailed Findings By Program
Ease By Program
Percent Rating Agreement As 4 Or 5
Figure long description
2018-19, n=4401, horizontal bar chart:
It was easy to understand the requirements to apply for…*,
2018-19, 86%, significantly higher from last year;
2017-18, 81%
Information was easy to understand*,
2018-19, 86%, significantly higher from last year;
2017-18, 76%
Overall, it was easy for you to apply for…;
2018-19, 85%;
2017-18, 84%
It was easy to find information about how to apply for…*;
2018-19, 83%, significantly higher from last year;
2017-18, 80%
Throughout the process it was clear what would happen next and when it would happen*;
2018-19, 77%;
2017-18, N/A
You needed to explain your situation only once:
2018-19, 77%;
2017-18. 77%
Ease attributes by Program;
It was easy to understand the requirements to apply for…*;
EI;
2017-18, n=703, 79%;
2018-19, n=1089, 85%, significantly higher than last year
CPP;
2017-18, n=652, 79%;
2018-19, n=788, 86%, significantly higher than last year
CPP-D;
2017-18, n=658, 52%;
2018-19, n=766, 64%, significantly higher than last year
SIN;
2017-18, n=604, 89%;
2018-19, n=920, 91%
OAS/GIS:
2017-18, n=1384, 75%;
2018-19, n=829, 85%, significantly higher than last year
Information was easy to understand*;
EI;
2017-18, n=703, 75%;
2018-19, n=1089, 85%, significantly higher than last year
CPP;
2017-18, n=652, 83%;
2018-19, n=788, 84%
CPP-D;
2017-18, n=658, 52%;
2018-19, n=766, 67%, significantly higher than last year
SIN;
2017-18, n=604, 84%;
2018-19, n=920, 92%, significantly higher than last year
OAS/GIS:
2017-18, n=1384, 69%;
2018-19, n=829 83%, significantly higher than last year
Overall, it was easy for you to apply for…;
EI;
2017-18, n=703, 84%;
2018-19, n=1089, 86%
CPP;
2017-18, n=652, 88%;
2018-19, n=788, 88%
CPP-D;
2017-18, n=658, 57%;
2018-19, n=766, 60%,
SIN;
2017-18, n=604, 87%;
2018-19, n=920, N/A
OAS/GIS:
2017-18, n=1384, 84%;
2018-19, n=829 87%
It was easy to find information about how to apply for…*;
EI;
2017-18, n=703, 80%;
2018-19, n=1089, 83%
CPP;
2017-18, n=652, 78%;
2018-19, n=788, 82%
CPP-D;
2017-18, n=658, 62%;
;2018-19, n=766, 65%
SIN;
2017-18, n=604, 83%;
2018-19, n=920, 86%
OAS/GIS:
2017-18, n=1384, 76%;
2018-19, n=829 82%, significantly higher than last year
Throughout the process it was clear what would happen next and when it would happen*;
EI;
2017-18, n=703, n/a;
2018-19, n=1089, 74%
CPP;
2017-18, n=652, n/a;
2018-19, n=788, 78%
CPP-D;
2017-18, n=658, n/a;
2018-19, n=766, 53%
SIN;
2017-18, n=604, n/a;
2018-19, n=920, 83%
OAS/GIS:
2017-18, n=1384, n/a;
2018-19, n=829 78%
You needed to explain your situation only once
EI
2017-18, n=703, 73%;
2018-19, n=1089, 72%
CPP
2017-18, n=652, 80%;
2018-19, n=788, 80%
CPP-D
2017-18, n=658, 55%;
2018-19, n=766, 54%
SIN
2017-18, n=604, 85%;
2018-19, n=920, 85%
OAS/GIS
2017-18, n=1384, 74%;
2018-19, n=829, 75%
Base: All respondents, base may vary by statement
Q36b. Thinking about the overall service you received, from getting information about [INSERT ABBREV] to receiving a decision, how much do you agree or disagree with the following statements, using a 5-point scale (where 1 means strongly disagree, and 5 means strongly agree.)
*Statements asked differently with different scale in 2017-18
Effectiveness By Program
Percent Rating Agreement As 4 Or 5
Figure long description
2018-19, n=4401, horizontal bar chart:
You were able to move smoothly through all of the steps related to your application;
2018-19, 84%, significantly higher than last year;
2017-18, 82%
You received consistent information
2018-19, 82%;
2017-18, n/a
It was clear what to do if you had a problem or question
2018-19, 78%;
2017-18, 78%
It was easy to get help when you needed it
2018-19, 77%;
2017-18, 77%
Amount of time it took, from when you started gathering info. to when you got a decision on your application, was reasonable
2018-19, 76%;
2017-18, 77%
Effectiveness attributes by Program:
You were able to move smoothly through all of the steps related to your application
EI;
2017-18, n=703, 77%;
2018-19, n=1098, 81%, significantly different from last year
CPP;
2017-18, n=652, 84%;
2018-17, n=788, 83%
CPP-D;
2017-18, n=658, 55%;
2018-17, n=766, 62%
SIN;
2017-18, n=604, 90%;
2018-17, n=920, 91%
OAS/GIS
2017-18, n=1384, 79%;
2018-17, n=829, 84%, significantly increased from year
You received consistent information
EI;
2017-18, n=703, n/a;
2018-19, n=1098, 79%
CPP;
2017-18, n=652, n/a;
2018-17, n=788, 83%
CPP-D;
2017-18, n=658, n/a;
2018-17, n=766, 64%
SIN;
2017-18, n=604, n/a;
2018-17, n=920, 87%
OAS/GIS
2017-18, n=1384, n/a;
2018-17, n=829, 82%
It was clear what to do if you had a problem or question
EI;
2017-18, n=703, 75;
2018-19, n=1098, 77%
CPP;
2017-18, n=652, 77;
2018-17, n=788, 76%
CPP-D;
2017-18, n=658, 62%;
2018-17, n=766, 63%
SIN;
2017-18, n=604, 85%;
2018-17, n=920, 82%
OAS/GIS
2017-18, n=1384, 74%;
2018-17, n=829, 78%m significantly increase from last year
It was easy to get help when you needed it
EI;
2017-18, n=703, 74%;
2018-19, n=1098, 72%
CPP;
2017-18, n=652, 75%;
2018-17, n=788, 73%
CPP-D;
2017-18, n=658, 57%;
2018-17, n=766, 59%
SIN;
2017-18, n=604, 87%;
2018-17, n=766, 89%
OAS/GIS
2017-18, n=658, 67%;
2018-17, n=766, 72%
Amount of time it took, from when you started gathering info. to when you got a decision on your application, was reasonable
EI;
2017-18, n=703, 73%;
2018-19, n=1098, 69%
CPP;
2017-18, n=652, 80%;
2018-17, n=788, 83%
CPP-D;
2017-18, n=658, 47%;
2018-17, n=766, 49%
SIN;
2017-18, n=604, 85%;
2018-17, n=766, 87%
OAS/GIS
2017-18, n=658, 75%;
2018-17, n=766, 80%, significantly increased from last year
*Note, different scale used in 2017-18
Base: All respondents base may vary by statement
Q36b. Thinking about the overall service you received, from getting information about [INSERT ABBREV] to receiving a decision, how much do you agree or disagree with the following statements, using a 5-point scale (where 1 means strongly disagree, and 5 means strongly agree.)
Confidence By Program
Percent Rating Agreement As 4 Or 5
Figure long description
2018-19, n=4401, horizontal bar chart:
Service Canada Agents were helpful*;
2018-19, 89%, significantly lower than last year;
2017-18, 91%
You were confident you had everything you needed when you submitted your application*;
2018-19, 88%, significantly higher than last year;
2017-18, 80%
You were confident that your personal information was protected;
2018-19, 87%;
2017-18, 87%
You were confident that any issues or problems would have been easily resolved:
2018-19, 78%, significantly higher than last year;
2017-18, 76%
Effectiveness attributes by Program:
Service Canada Agents were helpful*;
EI;
2017-18, n=703, 91%;
2018-19, n=1098, 85%, significantly lower that last year
CPP;
2017-18, n=652, 88%;
2018-19, n=788, 90%
CPP-D;
2017-18, n=658, 79%;
2018-19, n=766, 76%
SIN;
2017-18, n=604, 93%;
2018-19, n=920, 94%
OAS/GIS;
2017-18, n=1384, 85%;
2018-19, n=829, 88%
You were confident you had everything you needed when you submitted your application*;
EI
2017-18, n=703, 77%;
2018-19, n=1098, 86%, significantly higher that last year
CPP;
2017-18, n=652, 77%;
2018-19, n=788, 89%, significantly higher than last year
CPP-D;
2017-18, n=658, 55%;
2018-19, n=766, 76%, significantly higher than last year
SIN;
2017-18, n=604, 87%;
2018-19, n=920, 93%, significantly higher than last year
OAS/GIS:
2017-18, n=1384, 70%, significantly higher than last year;
2018-19, n=829, 90%
You were confident that your personal information was protected;
EI
2017-18, n=703, 87%;
2018-19, n=1098, 88%
CPP;
2017-18, n=652, 86%;
2018-19, n=788, 79%, significantly lower than last year
CPP-D;
2017-18, n=658, 78%;
2018-19, n=766, 82%
SIN;
2017-18, n=604, 90%;
2018-19, n=920, 92%
OAS/GIS;
2017-18, n=1384, 82%;
2018-19, n=829, 83%
You were confident that any issues or problems would have been easily resolved;
EI
2017-18, n=703, 72%;
2018-19, n=1098, 74%
CPP;
2017-18, n=652, 76%;
2018-19, n=788, 76%
CPP-D;
2017-18, n=658, 50%;
2018-19, n=766, 57%, significantly higher than last year
SIN;
2017-18, n=604, 85%;
2018-19, n=920, 86%
OAS/GIS;
2017-18, n=1384, 74%;
2018-19, n=829, 78%
*Statements asked differently in 2017-18
Base: All respondents, base may vary by statement
Q36b. Thinking about the overall service you received, from getting information about [INSERT ABBREV] to receiving a decision, how much do you agree or disagree with the following statements, using a 5-point scale (where 1 means strongly disagree, and 5 means strongly agree.)
Appendix D: Detailed Findings By Client Group
Satisfaction By Client Group
Percent Rating Satisfaction As 4 Or 5
Figure long description
Total;
Service Canada, 4401;
2017-18, 86%;
2018-19, 85%
SIN, n=920
2017-18, 94%;
2018-19, 92%
CPP, n=788
2017-18, 87%;
2018-19, 87%
OAS, n=610
2017-18, 86%;
2018-19, 87%
GIS, n=219
2017-18, 85%;
2018-19, 85%
EI, n=1098
2017-18, 83%;
2018-19, 80%
CPP-D, n=766
2017-18, 64%;
2018-19, 62%
Gender;
Service Canada;
Male, n=2145;
2017-2018, 85%;
2018-2019, 85%
Female, n=2256:
2017-2018, 87%;
2018-2019, 84%, significantly lower than last year
SIN;
Male, n=457;
2017-2018, 92%;
2018-2019, 93%
Female, n=453:
2017-2018, 95%;
2018-2019, 90%, significantly lower than last year
CPP;
Male, n=368;
2017-2018, 88%;
2018-2019, 86%
Female, n=420:
2017-2018, 87%;
2018-2019, 88%,
OAS;
Male, n=322;
2017-2018, 82%;
2018-2019, 88%
Female, n=288:
2017-2018, 90%, significantly different from total;
2018-2019, 86%,
GIS;
Male, n=91;
2017-2018, 86%;
2018-2019, 93%, significantly different the female 2018-19
Female, n=128:
2017-2018, 84%;
2018-2019, 81%,
EI
Male, n=561;
2017-2018, 82%;
2018-2019, 81%
Female, 537;
2017-2018, 83%;
2018-2019, 80%,
CPP-D
Male, n=346;
2017-2018, 68%;
2018-2019, 61%
Female, 420;
2017-2018, 60%;
2018-2019, 63%,
Age;
Service Canada;
Youth 18 to 30, n=817;
2017-18, 85%;
2018-19, 86%, significantly different than 31-50
31 to 50, n=990;
2017-18, 85%;
2018-19, 81%, significantly different from last year
51 to 64, n=1352;
2017-18, 87%;
2018-19, 85%
Senior, n=1217:
2017-18, 87%;
2018-19, 87%, significantly different than 31-50
SIN;
Youth 18 to 30, n=522;
2017-18, 95%;
2018-19, 92%
31 to 50, n=293;
2017-18, 93%;
2018-19, 91%,
51 to 64, n=57*;
2017-18, 93%;
2018-19, 89%
Senior, n=23**:
2017-18, 86%;
2018-19, 93%
CPP;
Youth 18 to 30, n=0**;
2017-18, N/A;
2018-19, N/A
31 to 50, n=10**;
2017-18, 87%;
2018-19, 62%
51 to 64, n=469;
2017-18, 88%;
2018-19, 88%, significantly different from 31 to 50
Senior, n=309:
2017-18, 87%;
2018-19, 86%
OAS;
Youth 18 to 30, n=N/A;
2017-18, N/A;
2018-19, N/A
31 to 50, n=N/A;
2017-18, N/A;
2018-19, N/A
51 to 64, n=N/A;
2017-18, N/A;
2018-19, N/A
Senior, n=610:
2017-18, 86%;
2018-19, 87%
GIS;
Youth 18 to 30, n=N/A;
2017-18, N/A;
2018-19, N/A
31 to 50, n=N/A;
2017-18, N/A;
2018-19, N/A
51 to 64, n=N/A;
2017-18, N/A;
2018-19, N/A
Senior, n=219:
2017-18, 85%;
2018-19, 85%
EI;
Youth 18 to 30, n=267;
2017-18, 77%;
2018-19, 79%
31 to 50, n=458;
2017-18, 82%;
2018-19, 77%
51 to 64, n=317;
2017-18, 88%, significantly different from Youth 18 to 30;
2018-19, 85%, significantly different from 31-50
Senior, n=56*:
2017-18, 91%;
2018-19, 86%
CPP-D;
Youth 18 to 30, n=28**;
2017-18, 54%;
2018-19, 58%
31 to 50, n=229;
2017-18, 59%;
2018-19, 60%
51 to 64, n=509;
2017-18, 67%;
2018-19, 63%
Senior, n=0**:
2017-18, 100%;
2018-19, N/A
Region:
Service Canada;
West and North, n=1893;
2017-18, 82%;
2018-19, 82%
Ontario, n=1321;
2017-18, 87%;
2018-19, 85%
Quebec, n=889;
2017-18, 90%, significantly different from West and North;
2018-19, 88%, significantly different from West and North
Atlantic, n=298
2017-18, 90%, significantly different from west and North;
2018-19, 85%, significantly lower than last year
SIN;
West and North, n=340;
2017-18, 93%;
2018-19, 91%
Ontario, n=312;
2017-18, 93%;
2018-19, 92%
Quebec, n=237;
2017-18, 97%;
2018-19, 93%
Atlantic, n=31:
2017-18, 93%;
2018-19, 93%
CPP;
West and North, n=428;
2017-18, 85%;
2018-19, 84%
Ontario, n=301;
2017-18, 88%;
2018-19, 89%
Quebec, n=3**;
2017-18, 83%%;
2018-19, N/A
Atlantic, n=56*:
2017-18, 90%;
2018-19, 91%
OAS;
West and North, n=252;
2017-18, 84%;
2018-19, 89%
Ontario, n=148;
2017-18, 88%;
2018-19, 85%
Quebec, n=171;
2017-18, 89%;
2018-19, 90%,
Atlantic, n=39*:
2017-18, 80%;
2018-19, 84%
GIS;
West and North, n=32*;
2017-18, 74%;
2018-19, 83%
Ontario, n=78;
2017-18, 86%;
2018-19, 80%
Quebec, n=96;
2017-18, 90%, significantly different from West and North;
2018-19, 95%, significantly different from Ontario
Atlantic, n=13**:
2017-18, 89%, significantly different from west and North;
2018-19, 80%, significantly lower than last year
EI;
West and North, n=432;
2017-18, 75%;
2018-19, 77%
Ontario, n=181;
2017-18, 82%;
2018-19, 79%
Quebec, n=378;
2017-18, 88%;
2018-19, 85%, significantly different from West and North
Atlantic, n=107:
2017-18, 92%;
2018-19, 83%
CPP-D;
West and North, n=409;
2017-18, 61%;
2018-19, 56%
Ontario, n=301;
2017-18, 67%, Significantly different from Quebec;
2018-19, 66%, significantly different from West and North
Quebec, n=4**;
2017-18, 29%;
2018-19, N/A
Atlantic, n=52*
2017-18, 67%;
2018-19, 64%
*small sample size **very small sample size
Q38a. How satisfied were you with the service you received from Service Canada related to your [insert abbrev] application? Please use a 5-point scale, where 1 means very dissatisfied, and 5 means very satisfied.
About IPSOS
Ipsos ranks third in the global research industry. With a strong presence in 87 countries, Ipsos employs more than 16,000 people and has the ability to conduct research programs in more than 100 countries. Founded in France in 1975, Ipsos is controlled and managed by research professionals. They have built a solid Group around a multi-specialist positioning – Media and advertising research; Marketing research; Client and employee relationship management; Opinion & social research; Mobile, Online, Offline data collection and delivery.
Ipsos is listed on Eurolist – NYSE – Euronext. The company is part of the SBF 120 and the Mid-60 index and is eligible for the Deferred Settlement Service (SRD).
At Ipsos we are passionately curious about people, markets, brands and society. We deliver information and analysis that makes our complex world easier and faster to navigate and inspires our clients to make smarter decisions.
We believe that our work is important. Security, simplicity, speed and substance applies to everything we do.
Through specialisation, we offer our clients a unique depth of knowledge and expertise. Learning from different experiences gives us perspective and inspires us to boldly call things into question, to be creative.
By nurturing a culture of collaboration and curiosity, we attract the highest calibre of people who have the ability and desire to influence and shape the future.

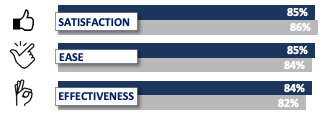
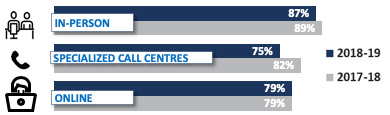
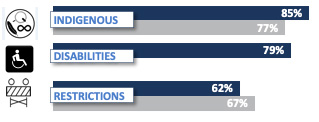
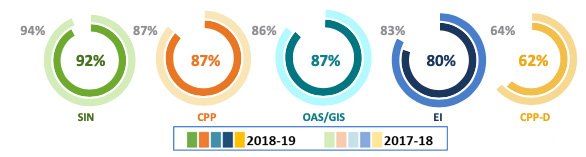
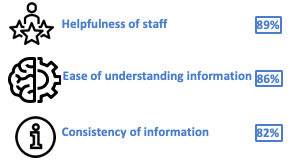
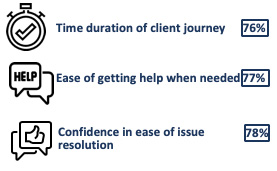


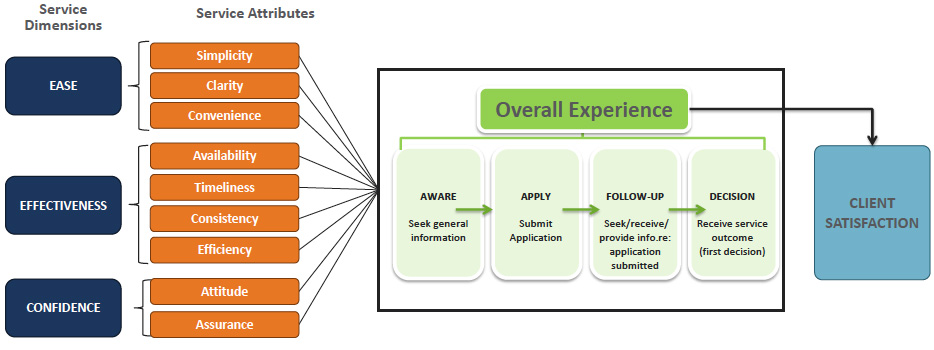
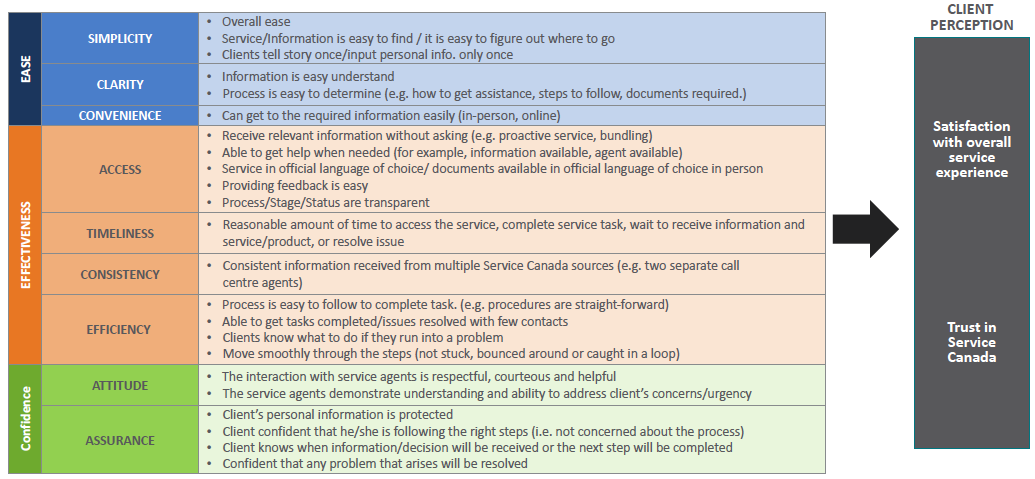


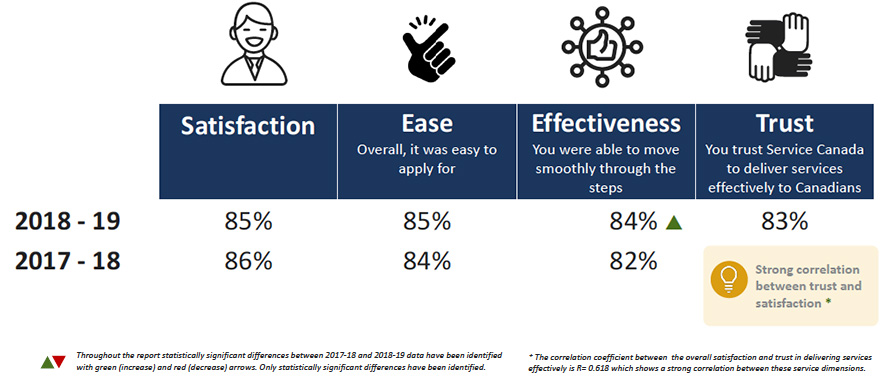
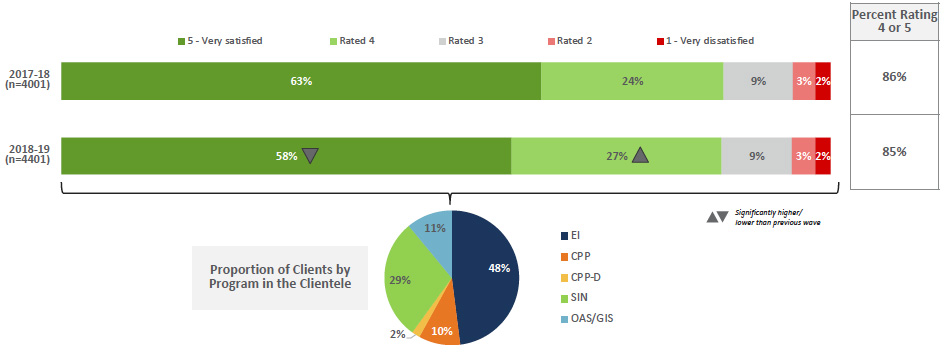
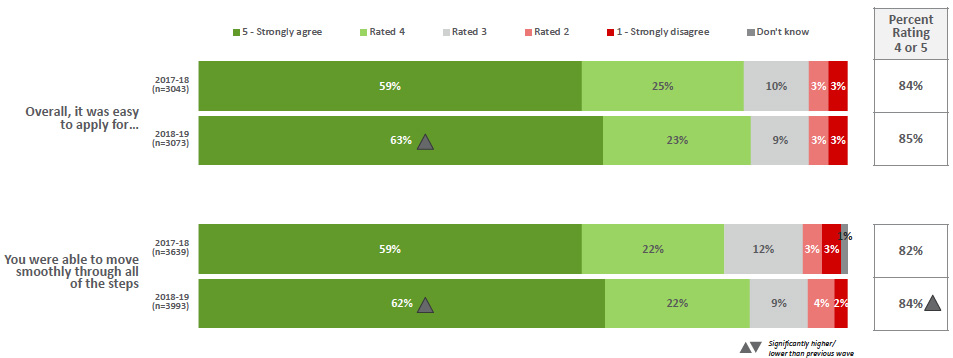
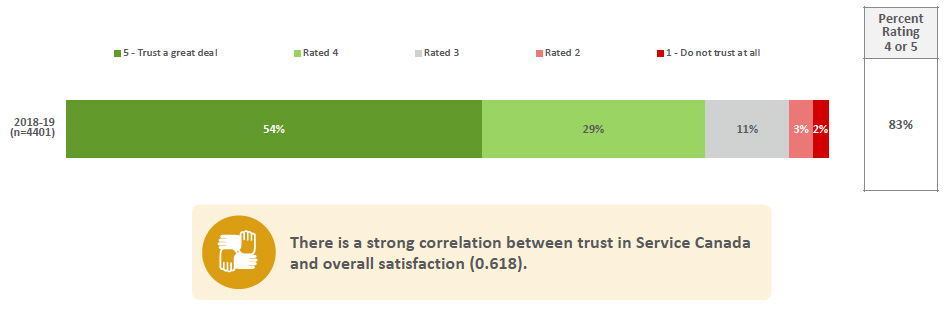
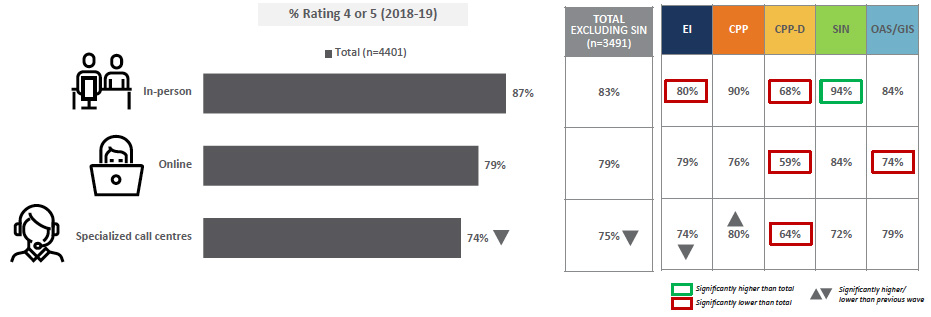
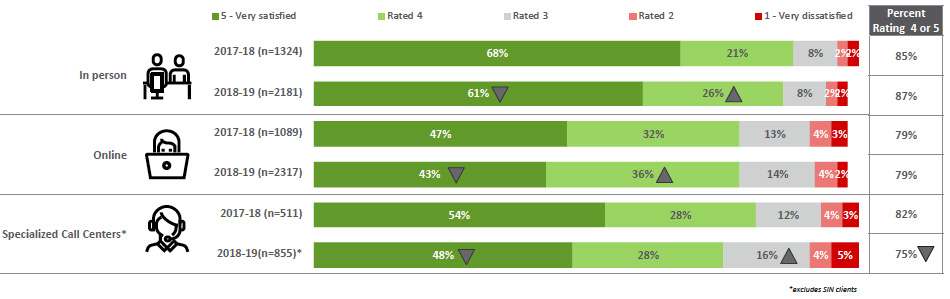
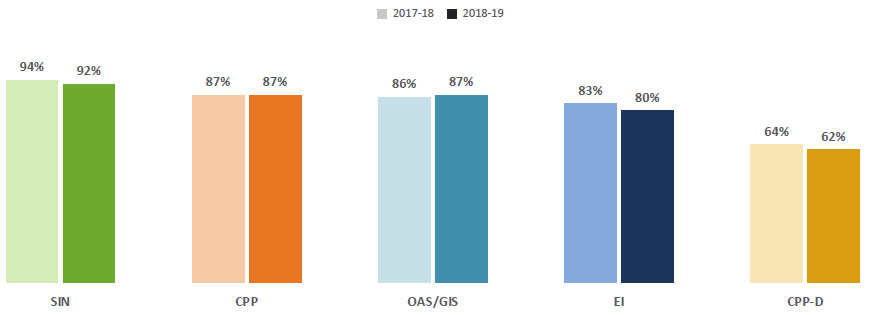
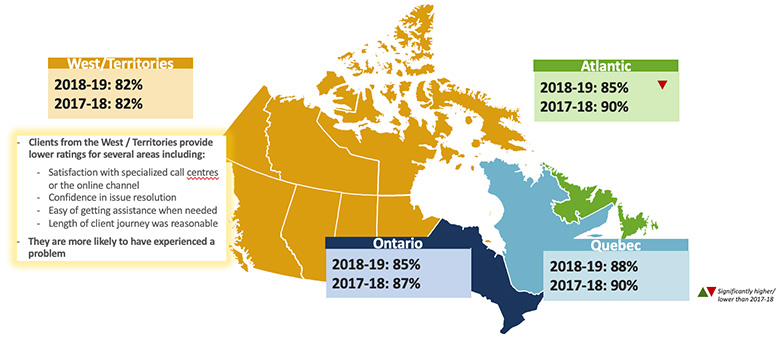
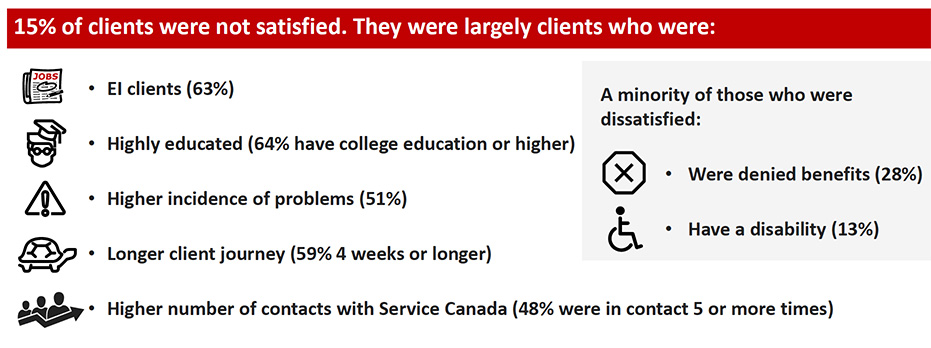
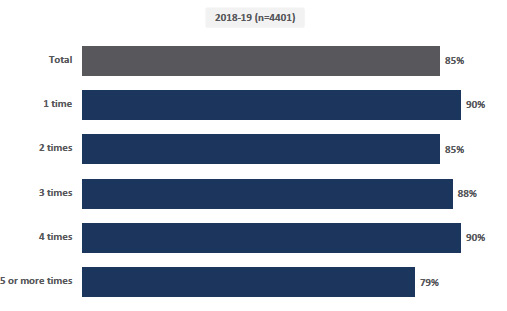
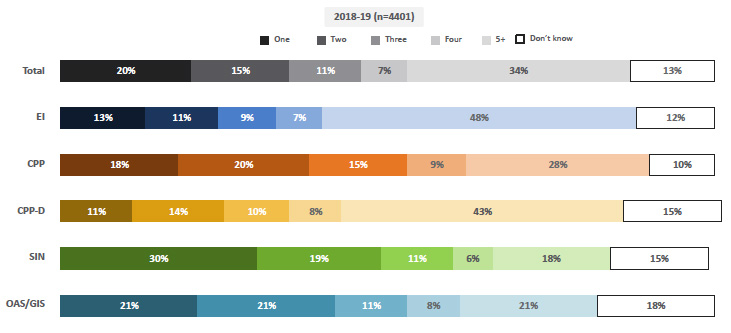
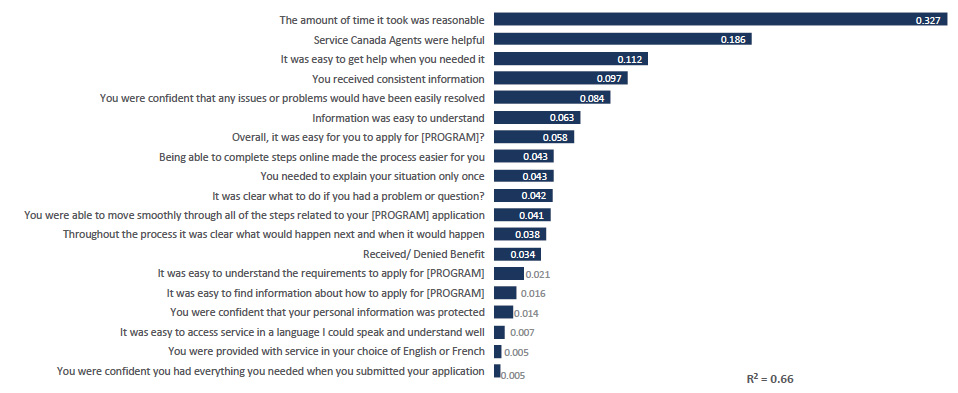
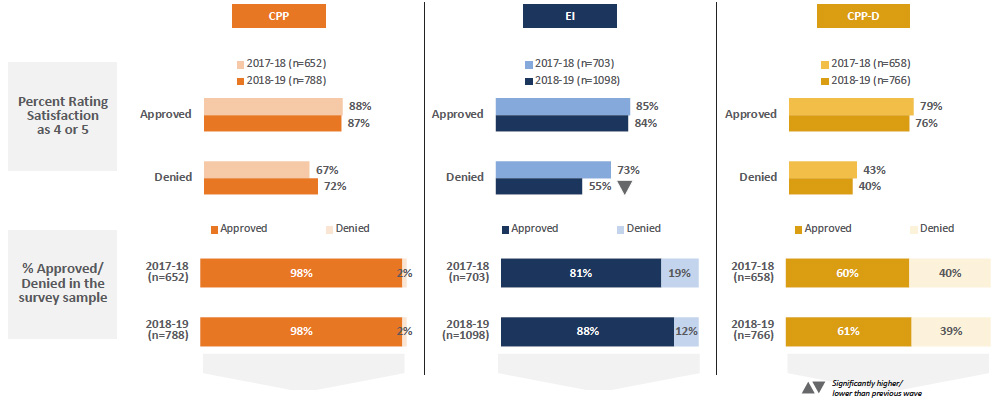
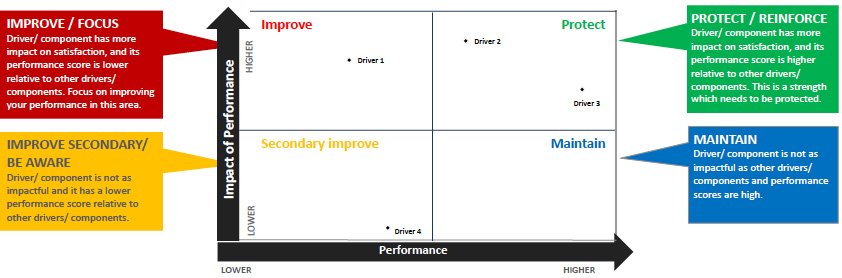
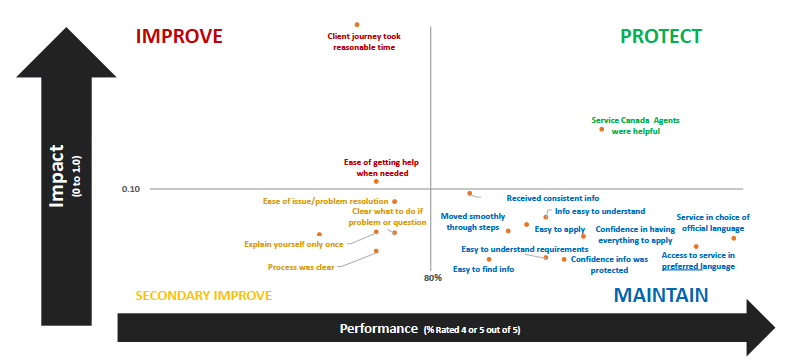
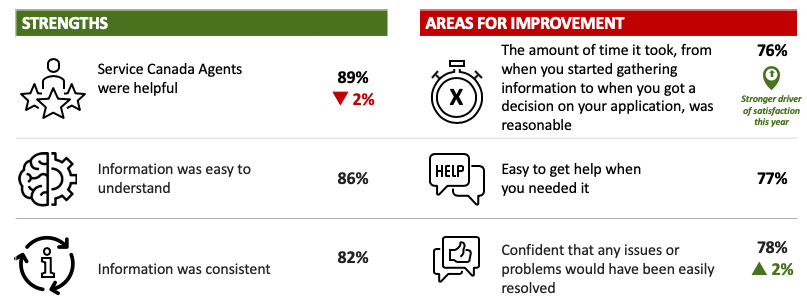
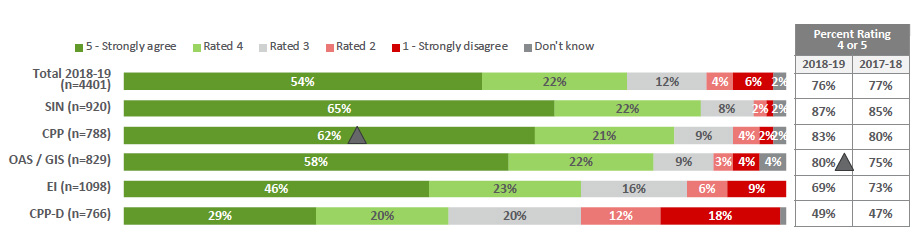
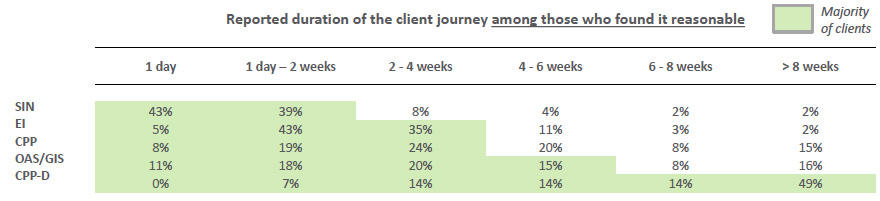
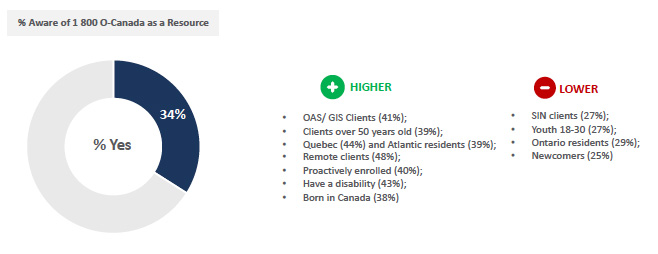
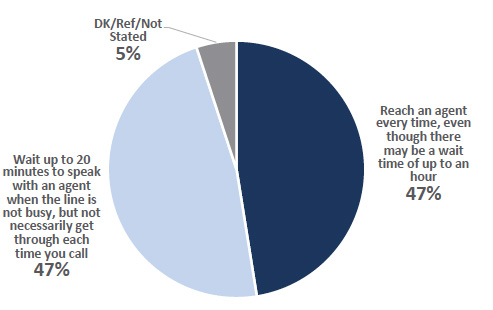
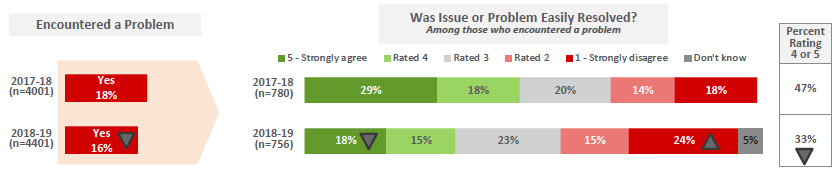
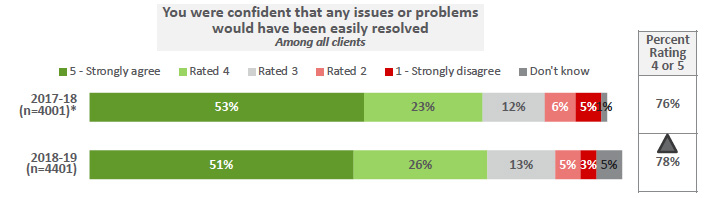
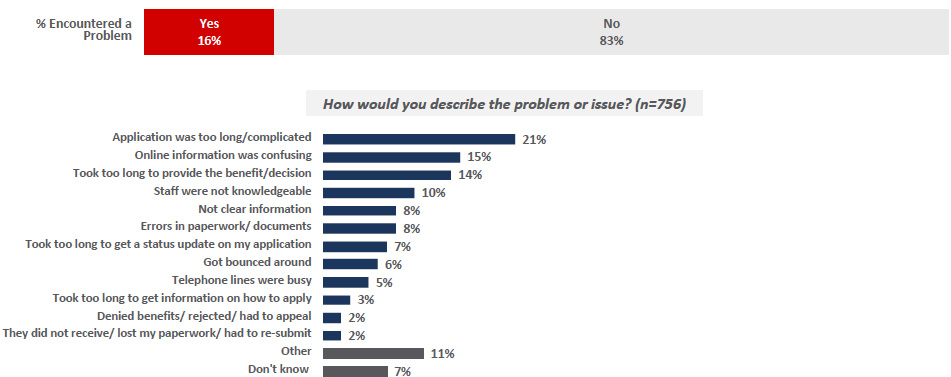
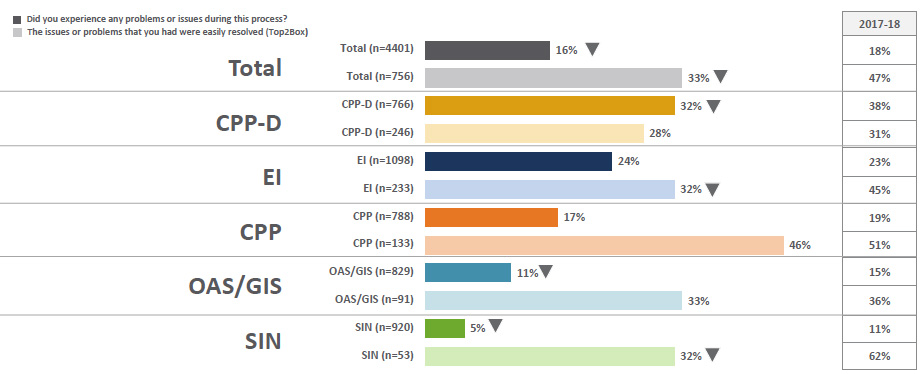
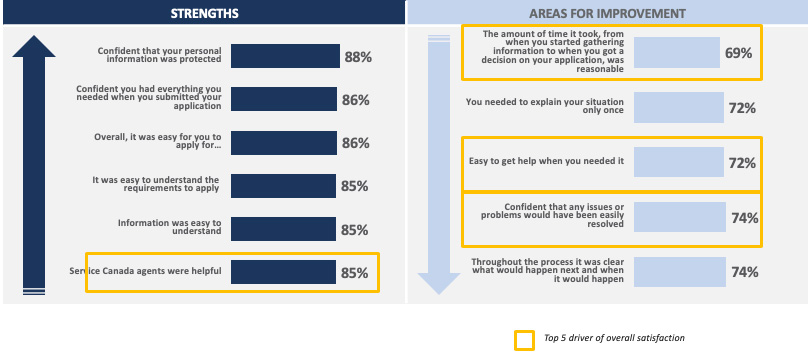
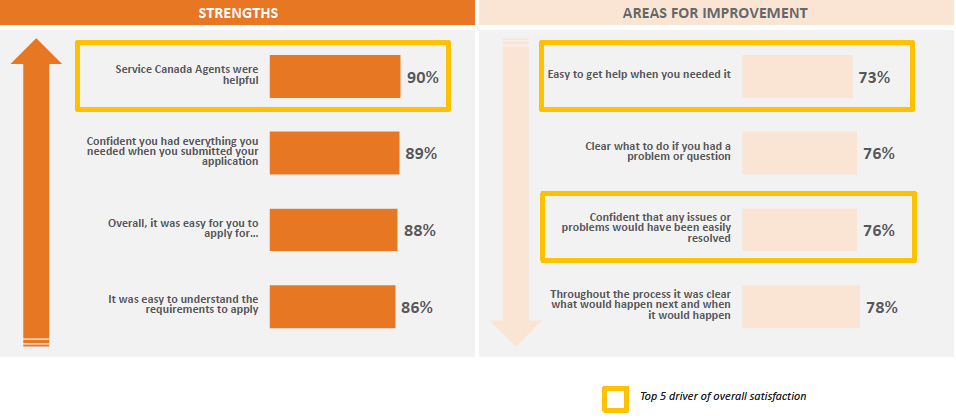
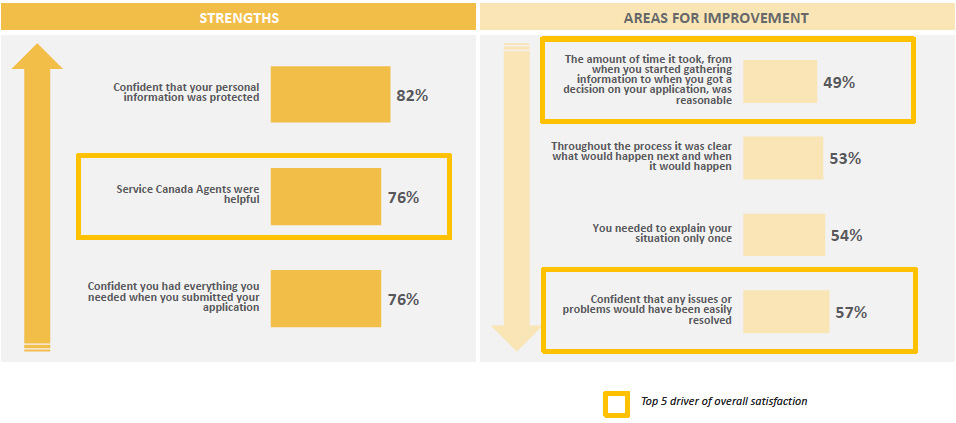
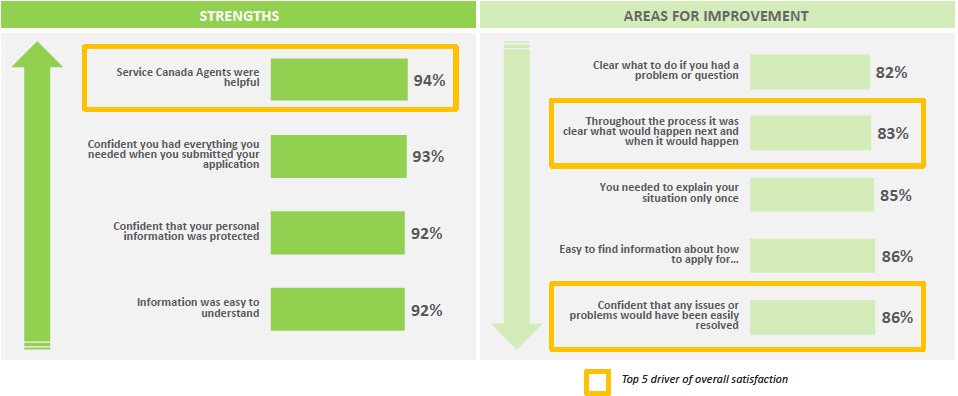
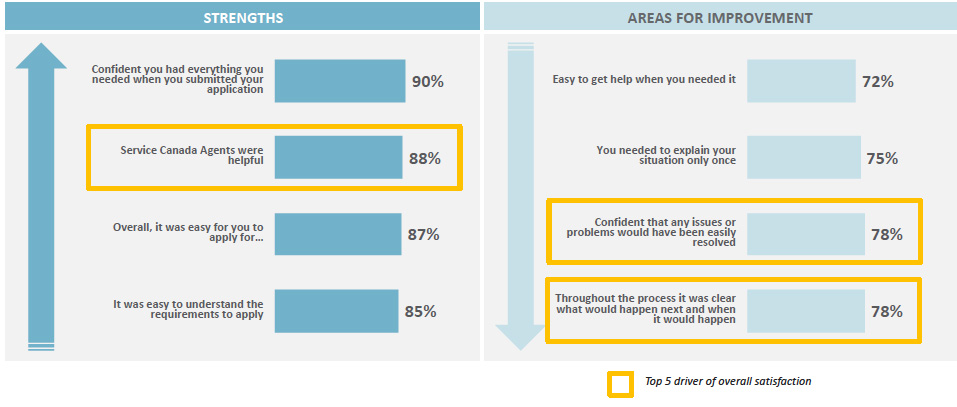
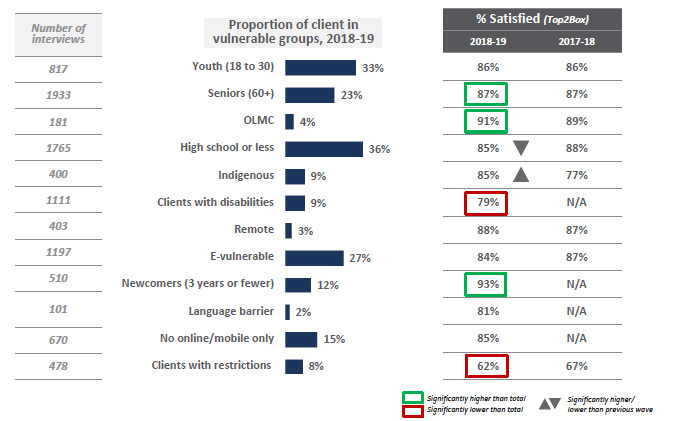
![[person speaking icon] program provided with service in your choice of English or French:](images/fig36-en.jpg)
![man in suit with a talking bubble icon] Easy to access service in a language I could speak or understand well:](images/fig37-en.jpg)