Grants and Contributions Applicants Client Experience Research (Year 2)
Employment and Social Development Canada [ESDC]
June 1, 2022
POR# 060-21
SUPPLIER: Ipsos Limited Partnership
CONTRACT AWARD DATE: 2021-12-08
CONTRACT #: G9292-229941/001/CY
Contract value: $140,330.26 (tax included)
Ce rapport est aussi disponible en français.
For more information on this report, please contact nc-por-rop-gd@hrsdc-rhdcc.gc.ca
Grants and Contributions Applicants Client Experience Research (Year 2)
It is available upon request in multiple formats (large print, MP3,
braille, e-text, DAISY), by contacting 1-800 O-Canada
(1-800-622-6232).
By teletypewriter (TTY), call 1-800-926-9105.
© His Majesty the King in Right of Canada, as represented by the
Minister of Families, Children and Social Development, 2022
https://publications.gc.ca/site/fra/services/modeleDroitsAuteur.html
For information regarding reproduction rights: droitdauteur.copyright@HRSDC-RHDCC.gc.ca.
PDF
Cat. No. : Em20-148/2022E-PDF
ISBN: 978-0-660-44219-8
Recherche sur l’expérience client des subventions et contributions (Année 2)
Ce document offert sur demande en médias substituts (gros
caractères, MP3, braille, fichiers de texte, DAISY) auprès du 1-800
O-Canada (1-800-622-6232).
Si vous utilisez un téléscripteur (ATS), composez le 1-800-926-9105.
© Sa Majesté le Roi du Chef du Canada, représenté par le ministre de
la Famille, des Enfants et du Développement social, 2022
https://publications.gc.ca/site/fra/services/modeleDroitsAuteur.html
Pour des renseignements sur les droits de reproduction: droitdauteur.copyright@HRSDC-RHDCC.gc.ca.
PDF
Nº de cat. : Em20-148/2022F-PDF
ISBN : 978-0-660-44220-4
Political Neutrality Statement
I hereby certify as Senior Officer of Ipsos that the deliverables
fully comply with the Government of Canada political neutrality
requirements outlined in the Policy on Communications and Federal
Identity and the Directive on the Management of Communications.
Specifically, the deliverables do not include information on
electoral voting intentions, political party preferences, standings
with the electorate or ratings of the performance of a political
party or its leaders.

Mike Colledge
President
Ipsos Public Affairs
Additional information
Supplier Name: Ipsos Limited Partnership
PSPC Contract Number: G9292-229941/001/CY
Contract Award Date: 2021-12-08
Executive Summary
Grants & Contributions CX Survey – Results At a Glance
- 1,942 SURVEYS CONDUCTED
- METHODOLOGY: ONLINE SURVEY
- FIELDWORK: February 16 to March 15, 2022
Overall Service Experience
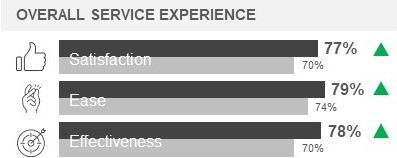
Figure 1: Overall Service Experience
This horizontal bar chart shows responses to three questions about the overall service experience and presents results for Year 1 and Year 2. Respondents were asked to provide ratings on a 5-pt scale and results were grouped by those who provided a rating of 4 or 5. All 1942 respondents in Year 2 answered as follows:
- Overall Satisfaction: Year 2 77%. Year 1 70%.
- Ease: Year 2 79%. Year 1 74%.
- Effectiveness: Year 2 78%. Year 1 70%.
Satisfaction with Service Channels
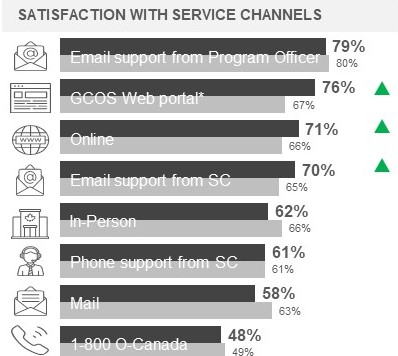
Figure 2: Satisfaction with Service Channels
This horizontal bar chart shows responses to a question about satisfaction with the overall quality of service provided by the service channels used during the applicant process and presents results for Year 1 and Year 2. Respondents were asked to provide ratings on a 5-pt scale and results were grouped by those who provided a rating of 4 or 5. Sample sizes vary by service channel, only those who used each channel during their experience were asked about it.
- Email support from Program Officer (627 respondents answered this question in Year 2): Year 2 79%. Year 1 80%.
- GCOS Web Portal (623 respondents answered this question in Year 2): Year 2 76%. Year 1 67%.
- Online (1365 respondents answered this question in Year 2): Year 2 71%. Year 1 66%.
- Email support from SC (1580 respondents answered this question in Year 2): Year 2 70%. Year 1 65%.
- In-Person (29 respondents answered this question in Year 2): Year 2 62%. Year 1 66%.
- Mail (139 respondents answered this question in Year 2): Year 2 58%. Year 1 63%.
- Phone support from SC (427 respondents answered this question in Year 2): Year 2 61%. Year 1 61%.
- 1 800 O Canada (72 respondents answered this question in Year 2): Year 2 48%.Year 1 49%.
Satisfaction with Client Experience by Program
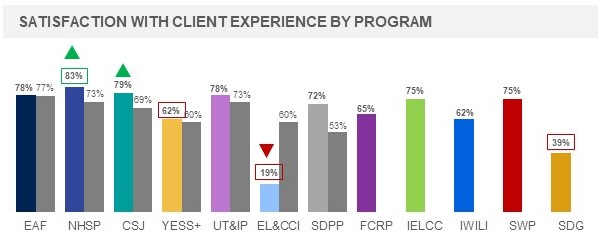
Figure 3: Satisfaction with Client Experience by Program
This vertical bar chart shows responses to a question about satisfaction with overall service experience by program and presents results for Year 1 and Year 2. Respondents were asked to provide ratings on a 5-pt scale and results were grouped by those who provided a rating of 4 or 5. Sample sizes vary by program.
- EAF (207 respondents answered this question in Year 2): Year 2 78%. Year 1 77%.
- NHSP (384 respondents answered this question in Year 2): Year 2 83%. Year 1 73%.
- CSJ (865 respondents answered this question in Year 2): Year 2 79%. Year 1 69%.
- YESS+ (152 respondents answered this question in Year 2): Year 2 62%. Year 1 60%.
- UT&IP (32 respondents answered this question in Year 2): Year 2 78%. Year 1 73%.
- EL&CCI (65 respondents answered this question in Year 2): Year 2 19%. Year 1 60%.
- SDPP (153 respondents answered this question in Year 2): Year 2 72%. Year 1 53%.
- FCRP (20 respondents answered this question in Year 2): Year 2 65%.
- IELCC (8 respondents answered this question in Year 2): Year 2 75%.
- IWILI (13 respondents answered this question in Year 2): Year 2 62%.
- SWP (4 respondents answered this question in Year 2): Year 2 75%.
- SDG (39 respondents answered this question in Year 2): Year 2 (39%).
Funding approval
Satisfaction by Approval Status
- Year 2: Approved 82%. Denied 47%.
- Year 1: Approved 74%. Denied 41%.
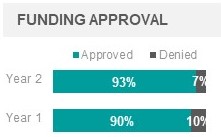
Figure 4: Funding approval
This horizontal bar chart shows responses to a question about whether the applicant received funding approval and presents results for Year 1 and Year 2. A total of 1820 respondents in Year 2 answered as follows:
- Year 2: Approved 93%. Denied 7%.
- Year 1: Approved 90%. Denied 10%.
Strengths
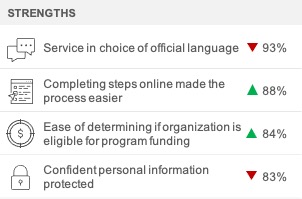
Figure description: Strengths
- Service in choice of official language 93%
- Completing steps online made the process easier 88%
- Ease of determining if organization is eligible for program funding 84%
- Confident personal information protected 83%
Areas for Improvement
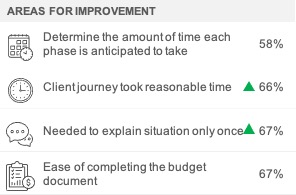
Figure description: Areas for Improvement
- Determine the amount of time each phase is anticipated to take 58%
- Client journey took reasonable time 66%
- Needed to explain situation only once 67%
- Ease of completing the budget document 67%
* referred to as [program] web portal in Year 1
Significantly higher / lower than total
Significantly higher/lower than Year 1
Key Findings - Quantitative Findings
Overall, applicants to Grants and Contributions programs were more satisfied with the process in Year 2 compared to Year 1.
- More than three-quarters (77%) of applicants were satisfied with their overall experience, an increase of seven points from Year 1 (70%), while fewer were dissatisfied (7%, -5 points). The vast majority felt it was easy to apply (79%) and move smoothly through all steps (78%), with improvement on both measures compared to Year 1.
- Satisfaction was highest for NHSP (83%), CSJ (79%), EAF (78%) and UT&IP (78%), followed by IELCC and SWP (both 75%), SDPP (72%), FCRP (65%), YESS (62%) and IWLIL (62%), while ratings were lowest for SDG (39%) and EL&CCI (19%).
Satisfaction was driven by improvements in the overall ease, effectiveness and timeliness of the process among CSJ and NHSP applicants. First-time applicants, those applying to higher complexity programs and organizations more reliant on volunteers continued to experience more difficulties navigating the application process.
- The overall increase in satisfaction is due primarily to higher ratings among applicants to NHSP and CSJ, who represent the vast majority of Grants and Contributions applicants and experienced the most positive improvement in the various aspects of the service experience. Those who applied to EL&CCI were less satisfied than in Year 1.
- Overall, applicants provided higher ratings for several aspects of ease and effectiveness and fewer reported experiencing problems or issues during the application process. The most notable improvements in the service experience have been in the timeliness of service, clarity of the application process, issue resolution and ease of getting assistance.
The aspect of service which had the greatest impact on satisfaction is the helpfulness of Service Canada and 1-800 O-Canada phone representatives, followed by the amount of time it took from start to finish, the ease of getting help and clarity of process. These also represent the aspects of service where ratings were relatively lower than other areas.
- The helpfulness of phone representatives (Service Canada and 1-800 O-Canada) has taken on increased importance and become the primary driver of satisfaction in Year 2, while the ease of getting help when needed has also become more important.
- Working to further reduce the amount of time the application process takes, improving access to assistance when needed and the ability of Service Canada phone representatives to assist applicants represent the greatest opportunities to improve the service experience given their strong impact on satisfaction and relatively lower ratings.
- Awareness of service standards also had an impact on satisfaction and fewer than half of applicants were aware of each standard in Year 2. Those who were aware of service standards had a more positive experience, with fewer issues and were more satisfied with most service channels, the timeliness of service, clarity of the process (including issue resolution) and ease of getting assistance. Working to more clearly communicate service standards to applicants should help to improve impressions of the application process.
Those who were applying to the program for the first time, in particular for higher complexity programs, had greater difficulty with the process which required more contact with Service Canada and time on the part of the applicant. The resulting impact was lower overall satisfaction with their experience applying.
- First-time applicants were typically smaller, younger organizations, which relied more heavily on volunteers to complete the application and required more contact with Service Canada and effort to complete the application. They experienced more challenges particularly in regards to the clarity of the steps and timelines for the application process, ease of getting assistance and overall timeliness of the client journey.
- Notably, most applicants to CSJ reported they apply on the same basis, while applicants to most other programs and specifically those of higher complexity had less experience applying for the particular program.
- As noted in Year 1, satisfaction declined by the number of times the client contacted Service Canada. While applicants reported having fewer contacts than in Year 1, the highest proportion continue to have had more than 10 or more contacts during their experience which is more prominent among applicants to higher complexity programs.
Applicants who were not approved for funding continued to have considerably lower satisfaction with their experience than those who were funded. Most were not provided an explanation for the decision and few who were expressed satisfaction with the rationale. Providing organizations which were unsuccessful a better understanding of the reasons for not receiving approval should help to improve their satisfaction with the process.
- While fewer applicants were denied funding than in Year 1 (7% vs. 10%), only half (47%) of those were satisfied with the application process compared to more than eight in ten (82%) of those approved.
- Most of those who did not receive funding approval were not provided an explanation why and of those who were few were satisfied with the explanation provided. Applicants to programs other than EAF and CSJ were less likely to have been satisfied with the explanation provided.
- Notably, applicants to CSJ were more likely to have received funding approval compared to Year 1 and those who applied to EL&CCI were considerably less likely. Given the impact of funding approval on satisfaction with the application process, the shifts observed in the proportion who received funding is likely a contributing factor to the increase in satisfaction seen for CSJ and decrease for EL&CCI compared to Year 1.
Support provided through email from a program officer remained the highest rated service channel, while telephone channels continued to receive lower ratings. Satisfaction with online channels, including the GCOS web portal and Government of Canada website, has increased and a greater proportion of applicants felt completing steps online improved the ease of the process.
- Eight in ten were satisfied with the email support from a program officer (79%), followed by the GCOS web portal (76%), Government of Canada website (71%) and email support form a Service Canada office (70%).
- Fewer were satisfied with in-person service at a Service Canada office (62%), telephone support from a Service Canada office (61%) and mail (58%), while satisfaction remained lowest for the 1-800 O-Canada (48%).
- The highest rated aspects of service remained the provision of service in choice of official language, that completing steps online made the process easier, confidence in security of their personal information and ease of determining eligibility. Improvement has been made in the ease of completing steps online and determining eligibly. However, compared to Year 1, fewer were confident their information was protected or were provided service in their choice of official language.
- Aspects of service with lower ratings included the ease of determining how long each phase of the process was anticipated to take, the overall amount of time it took, having to explain their situation only once and ease of completing the budget document. Applicants were more satisfied with the timeliness of service and only explaining themselves once than in Year 1, but they remain areas for further improvement.
Applicants continued to rely most heavily on the Government of Canada website in the stages leading up to submitting their application and the vast majority found it easy to find what they were looking for. There has been improvements in the clarity of information online and ease of determining the steps to apply, however ratings were lower for determining how long each phase of the process is anticipated to take.
- When learning about the program, applicants were most likely to have received email communication directly from the GoC, ESDC, or the program they applied to (57%) or to visit the Government of Canada website for the program (48%), followed by the general Government of Canada website (25%), or talked to peers/community network (23%). A greater proportion received an email from the GoC, ESDC, or the program than in Year 1 (driven by an increase among CSJ and NHSP applicants), while fewer talked to peers/community network or their MP.
- CSJ and NHSP applicants were more likely to have received an email from the GoC, ESDC, or program directly during the awareness stage, while those applying to all other programs relied more heavily on the Government of Canada website and experienced more difficulty finding the information they were looking for when doing so (EL&CCI, SDPP and SDG applicants in particular).
- Among those who used the GoC website, ratings were highest for the ease of determining if their organization was eligible for funding, when the application period takes place, and finding general information about the program. Determining the amount of time each phase of the application process is anticipated to take was considered the most difficult information to find.
The vast majority submitted their application online and found it easy to do so. Applicants found it easier to complete most aspects of the application and that it took a reasonable amount of time to complete compared to Year 1, however impressions of the process remain much weaker among those who applied to higher complexity program.
- Most submitted their application using the online fillable form (51%), followed by the GCOS web portal (35%), while fewer downloaded the application and submitted by email (10%) or mail (3%). YESS and CSJ applicants were more likely to have submitted using the GCOS web portal, while applicants to all programs except for CSJ were more likely to have downloaded the application and submitted them by email.
- Improvements observed in the ease of completing the application were due to primarily to higher ratings among CSJ applicants and to a lesser extent NHSP.
- Applicants to all other programs continued to experience more difficulty and were less likely to feel it took a reasonable amount of time to complete. Completing the budget document and narrative questions were the most challenging aspects of the application submission.
Among those approved for funding, most found the tasks associated with funding agreement close-out easy to complete, although applicants to higher complexity programs continued to experience more challenges.
- Consistent with Year 1, a strong majority felt each aspect of the funding agreement close-out was easy to complete and ratings were very consistent between tasks with the exception of resolving any outstanding issues with funding which received lower ratings.
- Those who received funding through CSJ were more likely to find it easy to complete most aspects of the funding agreement close-out, while applicants of all other programs (except for NHSP) were generally less likely and ratings have declined for recipients of EAF and YESS funding across most components.
Almost all applicants supported diverse communities with their application.
- Virtually all applicants (97%) reported that the funding they applied for would support diverse (GBA+) communities. Nearly three-quarters (73%) of applicant organizations said the funding would support those who identify as youth, followed by women (63%), those belonging to a minority racial or ethnic background (62%), low socio-economic status (53%) and Black Canadians (52%).
- Overall satisfaction is consistent among applicants who assist GBA+ communities and those who do not. In addition, overall satisfaction among those who assist GBA+ communities has increased compared to Year 1.
Most organizations operate in Ontario, Quebec, or British Columbia and organizations operating in Quebec reported the highest satisfaction.
- Almost two in five (38%) of applicant organizations operate in Ontario, followed by one quarter in Quebec (25%), and one in ten (13%) in British Columbia. Newfoundland and Labrador (3%), Prince Edward Island (2%), Yukon, Northwest Territories, and Nunavut (1%) were regions where the fewest number of applicant organizations operate.
- Applicant organizations operating in Quebec reported the highest level of satisfaction with their experience (83%) and were more likely to be satisfied compared to all clients. Eight in ten (81%) organizations in Atlantic Canada were satisfied, followed by three-quarters (76%) of those in Ontario, while closer to seven in ten (72%) applicant organizations in the West or Territories which is lower compared to all client.
Findings from the qualitative research aligned with quantitative findings.
- Those with less external support in the Grants and Contributions process, and those with less experience in applying for grants generally, were less satisfied with the application journey and process.
Those who identified as belonging to an equity-seeking group experienced barriers to, or concerns about, applying.
- Some felt that ESDC itself could/should play a role in filling these gaps, particularly since many of these organizations serve equity-seeking groups.
- It is challenging for ‘bare bones’ organizations that have some general / overarching needs for funding, such as equipment upgrade, staffing, programming support.
- These applicants felt that there was little opportunity to ‘tell their story’ in terms of the full context of themselves/the communities they serve.
The organizations who are more confident when applying are better resourced and funded, have levels of collaboration, or have experienced grant writers on staff as advisors.
- They described the application process satisfactory and easier to undertake, and they feel more confident in the type of content and information they provide within their application.
- Enablers to applying for federal funding included experience, diversity, support and collaboration.
- Barriers included lack of resources, the need for partnerships, application requirements, lack of flexibility, perceptions of favouritism or bias, lack of soft metrics, lack of diversity, and vendor challenges.
Many participants expressed concern with a lack of user-friendliness when applying to a program through the GCOS web portal, or the fillable PDF.
- They struggled with various aspects of the portal including a general lack of user-friendliness, being unable to save progress or losing responses, confusing language/legalese, and a lack of online collaboration within their teams.
- However, there were those who considered themselves technically savvy, or had a great deal of experience applying for grants and using other similar portals, who did not share the same concerns and considered applying online easy and straightforward.
Feedback on Service Dimensions were mixed – very few felt that their application experiences aligned with all three that were tested in the research.
- In general, participants are seeking a flexible relationship that recognizes the importance of the work that their organizations do in their communities – and treats them as valued partners who are filling gaps and providing services that otherwise are not available to those who need them the most.
- There was much positive feedback on Ease and Effectiveness, along with some concerns, but Emotions was the Service Dimension where many described negative emotions and experiences, frustrations and pain points.
Concerns and considerations about diversity, equity and inclusion were brought forward throughout the discussions.
- Participants felt that there needs to be more inclusive practices in place, such as ensuring that public-facing Service Canada staff are culturally diverse, providing additional support to organizations serving equity-seeking groups and communities, and providing flexibility for those who are executing projects on-the-ground to take their communities’ unique considerations into account.
Many wished for transparency around evaluation criteria for successful applications.
- This included knowing the overall envelope, and what a reasonable amount their organization should apply for.
- This information would determine whether or not applying for the fund is worth the considerable time and effort it takes to apply. That said, most intended to apply for funding in future, as it is an important source of funding, especially for those organizations who lack core funding or who are not charities who can receive donations.
An ideal experience is one that is timely where timelines are met, communication is proactive, and a two-way discussion about the both funded and unfunded applications is facilitated.
- Further, a clear understanding of decision criteria and what content is expected from applicants, were also important to participants/applicants.
- Making it easier for applicants to access educational information related to the grant or contribution, was consistently raised as contributing to an ideal experience.
Reasons for higher dissatisfaction with Early Learning and Childhood Innovation (ELCC) were uncovered through the qualitative research.
- A clear picture emerged about the experience they had, most of whom characterized it as being very poor. However, this was not in relation to the decision itself, but because of significant delays for the decision, the manner and timing in which it was communicated, and the poor emotional Service Dimension experienced.
- For Sustainable Development Goals (SDG), there was a desire for greater recognition of social enterprise within it and other programs.
Objectives and Methology
Background: Gs&Cs Client Experience Research
The Program Operations Branch (POB) within Employment and Social Development Canada (ESDC) handles the operation and coordination of the Grants and Contributions (Gs&Cs) programs across the Department. To comply with the treasury Board Policy on Service and Digital 3.1 on digital transformation, 3.2 on decision-making, service delivery, use of technology and data and client-centric service and 4.2 on client centric service design and delivery, ESDC requires the gathering of data on the client experience to assist in effectively managing service delivery.
To meet these requirements, POB utilized the Client Experience (CX) Measurement Framework to guide the research on the Gs&Cs business line of client service delivery experience. the data collected through the implementation of the Client Experience (CX) Measurement Framework provides key information to:
- Better understand the needs and expectations of organizations;
- Identify obstacles and challenges from the perspective of the organization;
- Identify strengths and opportunities to improve CX, including opportunities to implement changes and test new approaches related to program design and delivery;
- Assess the extent to which clients’ expectations are being met;
- Identify and prioritize resources and opportunities tied to CX improvements;
- Assess the impact of improvements made to the CX over time; and
- Explore how ESDC’s leadership at all levels can play an important role in creating a positive CX.
This is the second year of POB’s Client Experience Research Program (FY 2021/22). Year Two builds on the first year of research by continuing to use a systematic approach to measuring CX in Gs&Cs service delivery and allowing the department to track process on CX indicators over time.
The detailed methodology and research instruments for all aspects of the quantitative and qualitative research are available under a separate cover.
Note: Program intakes in grants and contributions vary widely, meaning that some year-to-year or program comparisons should be done with caution.
Research Objectives – Quantitative Research
The Client Experience Research Project is carried out in two phases, a quantitative phase and a qualitative phase. The primary objectives of Year 2 are to focus on monitoring selected programs that were previously studied in Year 1 and to capture new CX insights from programs that have not previously been studied.
The research objectives for the quantitative research were to:
- Measure service satisfaction, ease, and effectiveness of the end-to-end client experience;
- Measure CX with service channels;
- Build a baseline of client experience across the spectrum of Gs&Cs programs by introducing new programs while also starting to assess change and consistency by including some of the same programs as Year One;
- Provide diagnostic insights regarding the opportunities for improvement; and
- Assess how potential changes in service delivery might affect the CX.
Methodology – Quantitative Research
An online survey was conducted with 1,942 Service Canada applicants across 12 programs. the survey was fielded from February 16, 2022 to March 15, 2022, and took on average approximately 16 minutes to complete. the survey sample size has a margin of error of +/-2.2%.
Applicants were defined as organizations that applied for grants and contributions funding (including both funded and unfunded) within the last two intake years (2019/20 or 2020/21). A random sampling of organizations that applied to CSJ, EAF or NHSP were included, while all organizations for remaining programs were invited to complete the survey.
ESDC distributed the survey links to participating organizations. Fieldwork launch was executed using two approaches in order to better understand the impact on response rates. Half of the sampling of organizations that applied to CSJ, EAF and NHSP were sent an information email in advance of receiving the survey invitation email containing the survey link, while the other half (and those who applied to all other programs) were only sent the survey invitation email.
The exact intake periods referred to in this study are as follows:
- Canada Summer Jobs (CSJ):January to February 2020; December 2020 to February 2021
- Early Learning and Child Care – Innovation (ELCCI): October 2020 to January 2021
- Enabling Accessibility Fund (EAF): June 2020 to November 2020
- Foreign Credential Recognition Program (FCRP): March to April 2019; February 2020 to June 2020
- Indigenous Early Learning and Childcare (IELCC): February 2021 to April 2021
- Innovative Work Integrated Learning Initiative (IWILI): September 2020 to November 2020
- New Horizons for Seniors Program (NHSP): September 2020 to Oct. 2020
- Social Development Partnerships Program (SDPP): June 2020 to July 2020; March 2021 to April 2021; December 2020 to January 2021
- Student Work Placement (SWP): November 2020 to December 2020
- Sustainable Development Goals (SDG): Grants: May 2019 to November 2019; Contributions: June 2019 to Sept. 2019
- Union training and Innovation Program (UTIP): July to August 2020
- Youth Employment and Skills Strategy (YESS): June 2019 to July 2019; March 2021 to April 2021
Four (4) of the programs included in the survey have different streams that applicants can apply for.
The relevant streams referred to in this study and the exact intake periods are as follows:
- Enabling Accessibility Fund (EAF):
- Small Projects (June 2020 – July 2020)
- Youth Innovation (June 2020 – Nov. 2020)
- New Horizons for Seniors Program (NHSP):
- Small grant (up to $5000) (Sept. 2020 – Oct. 2020)
- Community-based projects (up to $25,000) (Sept. 2020 – Oct. 2020)
- Social Development Partnerships Program (SDPP):
- Supporting Black Canadian Communities (June 2020 – July 2020)
- Supporting Black Canadian Communities – West Intermediaries (Mar. 2021 – April 2021)
- Disability – Community Inclusion Initiative (Dec. 2020 – Jan. 2021)
- Union training and Innovation Program (UTIP):
- Investments in training Equipment (July 2020 – Aug. 2020)
- Innovation and Apprenticeship (July 2020 – Aug. 2020)
Of the 8,704 organizations that were invited to participate, a total of 1,942 organizations completed the survey. the response rate for the survey was 22% which is consistent with industry standards for a survey of this nature.
| Total | |
| Invited to participate | 8704 |
| Click-through | 2941 |
| Partial Completes | 999 |
| Terminates | 0 |
| Over Quota | 0 |
| Completed Surveys | 1942 |
| Response Rate | 22% |
| Abbreviation | Invited | Completed | Response rate | |
| CSJ | Canada Summer Jobs | 1625 | 865 | 53% |
| EAF | Enabling Accessibility Fund | 1625 | 207 | 13% |
| NHSP | New Horizons for Seniors Program | 1625 | 384 | 24% |
| FCRP | Foreign Credential Recognition Program | 125 | 20 | 16% |
| ELCC | Early Learning and Child Care | 455 | 65 | 14% |
| IELCC | Indigenous Early Learning and Childcare | 66 | 8 | 12% |
| IWIL | Innovative Work Integrated Learning Initiative | 10 |
13 | 130%* |
| SWPP | Student Work Placement | 30 | 4 | 13% |
| SDG | Sustainable Development Goals | 688 | 39 | 6% |
| YESS | Youth Employment and Skills Strategy | 936 | 152 | 16% |
| SDPP | Social Development Partnerships Program | 1393 | 153 | 11% |
| UTIP | Union training and Innovation Program | 126 | 32 | 25% |
| Total | 8704 | 1942 | 22% | |
|---|---|---|---|---|
Note: “n=” represents the number of respondents to a question, it is known in statistical language as the size of the sample. Sample sizes below n=30 are considered small and below n=10 considered very small. Results of small and very small sample sizes should be interpreted with caution and findings viewed as directional in nature.
The quantitative survey also served as a recruitment tool for the qualitative research, by asking if organizations would be interested in voluntarily participating in focus groups or in-depth interviews at a later date.
* Response rate exceeding 100% may be due to applicants applying to more than one program and/or sampling procedures. Only those organizations with email contact information on file were invited to participate, which does not represent the total volume of applicants.
Calibration of the Data – Quantitative Approach
Weighting adjustments were made to bring the sample into proportion with the universe by program volume based on 2019 and 2020 figures (depending on the most recent intake for the particular program).
The final data was weighted by the number of respondents in each program in proportion to the total number of applicants as detailed below. the universe proportions used to develop the targets were based on figures provided by ESDC.
| Abbreviation | Program | #Of Applicants | %Of Total |
| CSJ | Canada Summer Jobs | 39202 | 74.13% |
|---|---|---|---|
| EAF | Enabling Accessibility Fund | 2173 | 4.11% |
| NHSP | New Horizons for Seniors Program | 7194 | 13.60% |
| Foreign Credential Recognition Program | 4312 | 8.16% | |
| FCRP | Foreign Credential Recognition Program | 127 | 0.24% |
| ELCC | Early Learning and Child Care | 503 | 0.95% |
| IELCC | Indigenous Early Learning and Childcare | 68 | 0.13% |
| IWIL | Innovative Work Integrated Learning Initiative | 10 |
0.02% |
| SWPP | Student Work Placement | 30 | 0.06% |
| SDG | Sustainable Development Goals | 722 | 1.37% |
| YESS | Youth Employment and Skills Strategy | 971 | 1.84% |
| SDPP | Social Development Partnerships Program | 1755 | 3.32% |
| UTIP | Union training and Innovation Program | 126 | 0.24% |
| Total | 52811 | ||
Note Regarding Program Complexity
For the purpose of this study, program complexity has been defined as low, moderate, and high complexity as outlined in the following table. these service standard clusters are informed by departmental reporting in the Performance Measurement and Management Framework.
Note: Canada Summer Jobs does not fit into these distinct clusters and has been analyzed as a separate group.
| Program Complexity Level | Description | Programs Included |
|---|---|---|
| Low complexity programs | Grant programs in the 112 days/16 week review period |
|
| Moderate delivery-complexity programs | Contribution streams in the 126 days/18 week review period |
|
| High-delivery complexity programs | Contribution streams in the 154 days/22 week review period |
|
Note on Reporting Conventions – Quantitative Data
Throughout the report, subgroup results have been compared to average of all applicants (i.e., total) and statistically significant differences at the 95% confidence level noted using green and red boxes.
Where subgroup results are statistically higher than the total a green box has been used and where results are statistically lower than the total a red box has been used.
Additionally, where results in Year 2 are statistically higher than Year 1, a green arrow has been used and where results in Year 2 are statistically lower than Year 1, a red arrow has been used.
Significantly higher / lower than total
Significantly higher/lower than Year 1
For the purposes of legibility, values of less than 3% have not been labelled in charts throughout the report.
Research Objectives – Qualitative Research
Building on the quantitative results, the qualitative research explored the following through focus group discussions and individual interviews with Gs&Cs applicants who have applied for funding within the past two intake years (FY 2019-20 and 2020-21):
- Client needs and expectations: Validate and/or deepen insights regarding quantitative findings, explore the aspects that make it easy for clients as well as the obstacles/barriers clients face when going through the client experience, the impact of potential changes, and aspects that could transform the experience into a simpler and more responsive process.
- Service dimensions: Assess which service dimensions hold greater or lesser value for clients with respect to accessing service, given the complexity of the services and clients’ capacity to effectively use online services. this would allow us to validate themes to be covered in the department’s survey.
- Organizational characteristics: Investigate and understand organizational characteristics, qualities, and experiences to identify barriers and challenges faced by organizations. this may include organizational characteristics for those serving diverse populations, those organizations that were (un)successful in obtaining funding, and/or organizations that did (not) re-apply for funding.
- New or unique quantitative findings: Explore the nuances and features of the quantitative findings by probing clients or a subset of the client population to explain and contextualize their recent experiences with the Gs&Cs application process
- Based on findings from the quantitative research where certain programs had lower levels of client experience satisfaction, it was determined that applicants from Early Learning and Child Care Innovation (ELCC) and Sustainable Development Goals (SDG) would be targeted for the in-depth interviews.
- the focus groups shifted to target programs other than ELCC and SDG
- Additional questions based on quantitative findings included:
- Understanding perceptions on the length and complexity of the application
- Technical issues with the application process
Research Objectives – Qualitative Research cont’d
The findings of the qualitative research will be used to:
- Explore the client’s interactions with the department and the challenges clients may face;
- Build a deeper awareness and understanding of the clients’ experiences to inform program design and service delivery improvements;
- Identify opportunities for service-related changes, enhancements, and/or policy improvements; and
- Support, challenge, and/or enrich the findings from the survey.
Methodology – Qualitative Research
Respondents from the survey were asked a question whether they would be interested in taking part in follow-up qualitative research. After conducting an analysis of the sample to ensure a mix of programs, regions, and to ensure inclusion of participants in both official languages, potential participants were contacted randomly and asked if they would like to be taken through the screening questionnaire to confirm their eligibility for an in-depth interview or focus group. the breakdown of participation is as follows:
|
408 |
Number of survey respondents who agreed to be recontacted |
|
112 |
Those were contacted to be screened |
|
77 |
Those who agreed to be screened |
|
51 |
Total number of participants in focus groups and in-depth interviews |
The chart below provides a detailed description of the fieldwork.
| Group Composition | Date and Time |
|---|---|
| Group 1: Unfunded applicants to any program other than ELCC and SDG, or those who are unsure NATIONAL - ENGLISH |
May 27 at 10AM 5 Participants |
| Group 2: Funded applicants to any program other than ELCC and SDG NATIONAL - ENGLISH |
May 27 at 1PM ET 6 Participants |
| Group 3: Unfunded applicants to any program other than ELCC and SDG, or those who are unsure QUEBEC - FRENCH |
May 25 at 10AM ET 5 Participants |
| Group 4: Funded applicants to any program QUEBEC - FRENCH |
May 25 at 1PM ET 4 Participants |
| In-depth interviews were focused on applicants to ELCC and SDG programs | May 16th to May 31st 18 English Participants 8 French Participants |
Methodology – Qualitative Research Data Collection and Analysis
Data Collection
With participants’ consent, all qualitative research sessions are both audio and video taped. Verbatim transcripts from each and every focus group and interview is created; however, names or personal identifying details are not captured and/or removed or redacted by the moderator in order to ensure participants’ privacy.
Moderators also capture high level findings on each topic of their own observations – what the overall reaction was, any nuances, and any non-verbal cues on body language or tone. Because our transcripts are anonymous, they are able to comment on any variations by group or audience, if they have not been placed in separate groups – for example, moderators can provide a sense of different opinions by older vs. younger participants, or males vs. females, depending on the topic.
Data Analysis
We identify some basic elements to qualitative analysis:
- Universal agreement where participants all agree, or there is agreement across different groups of stakeholders
- Consensus perspectives that reflect the view of most participants; areas of wide agreement without much counter point (Many, most, several)
- Conflicting or polarized perspectives where views are much more divided, or if there is a spectrum or variety of views (Some vs others)
- Minority perspectives, often expressed by one or two participants as a counterpoint to a consensus viewpoint, or if they have an individual take or example/story (a few, a couple, mention)
- Verbatim commentary, providing examples of what participants actually said during a discussion (direct unattributed quotes)
- External context, for this project it is the results of quantitative research that provided a foundation for the qualitative research conducted and the discussion questions posed.
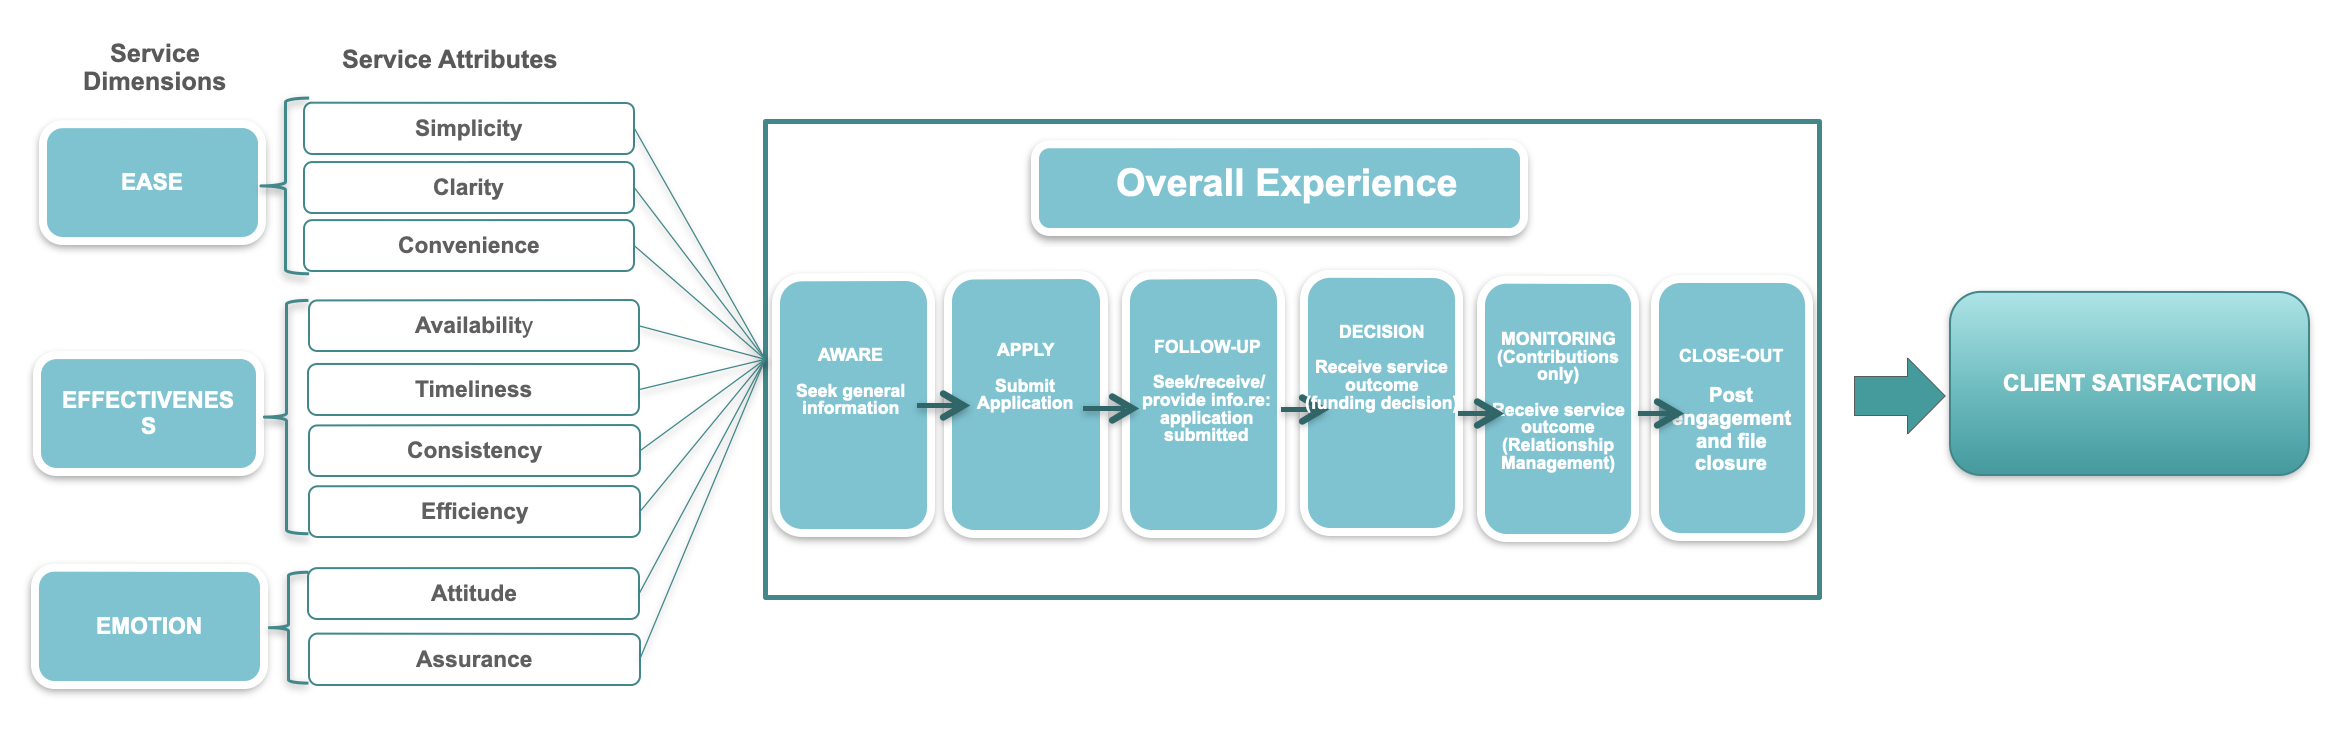
Service Canada Client Experience Survey Model
ESDC’s Gs&Cs CX Survey Measurement Model
ESDC’s Gs&Cs model is inspired by the CX measurement model developed by the ESDC’s Citizen Services Branch. It details the service dimensions, service attributes and the client journey that are assessed to evaluate the overall client experience and satisfaction.
Service Canada CX Survey Measurement Model: Service Attributes
The following was the full set of detailed service attributes in the model that guided the development of the survey questionnaire.
| Easy | Simplicity |
|
→ | |
|---|---|---|---|---|
| Clarity |
|
|||
| Convenience |
|
Client perception | ||
| Effectiveness | Availability |
|
||
| Timeliness |
|
Satisfaction with overall service experience | ||
| Consistency |
|
|||
| Efficiency |
|
Would speak positively to others about service experience | ||
| Emotion | Attitude |
|
||
| Assurance |
|
Detailed Findings
Overall Performance
Satisfaction with Service Experience
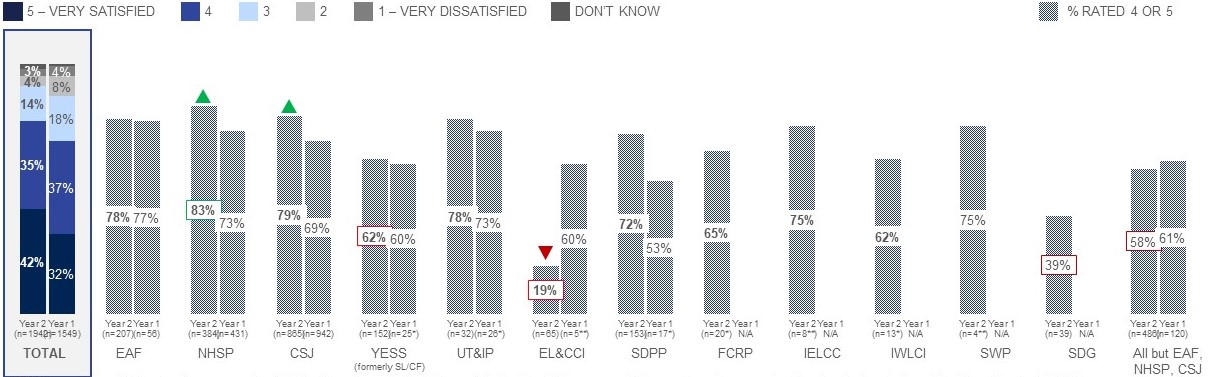
- More applicants were satisfied with their service experience when compared to Year 1. Overall, more than three-quarters (77%) of applicants were satisfied (defined as 4 or 5 on a 5-point scale), an increase of seven points. Around one in ten (14%) provided a neutral rating (-4 pts) and fewer than one in ten (7%) were dissatisfied (-5 pts, defined as 1 or 2 on a 5-point scale).
- Applicants to NHSP were more likely to be satisfied with the service experience compared to all clients, while for all programs but EAF, NHSP and CSJ and in particular YESS, EL&CCI and SDG were less likely to have been satisfied. Compared to Year 1, satisfaction has increased among applicants to NHSP and CSJ and declined among applicants to EL&CCI.
How satisfied or dissatisfied were you with the overall service you received from Service Canada from getting information about [PROGRAM] to receiving a funding decision?
Note: values less than 3% not labelled
* small sample size
** very small sample size
Significantly higher / lower than total
Significantly higher/lower than Year 1
Q31. On a scale from 1 to 5, where 1 means very dissatisfied and 5 means very satisfied, how satisfied or dissatisfied were you with the overall service you received from Service Canada from getting information about [INSERT PROGRAM] to receiving a funding decision? Base: All respondents n=1942
Figure 5: Satisfaction with Service Experience
This vertical bar chart shows responses to a question about how satisfied or dissatisfied the applicant was with the overall service they received from Service Canada from getting information about the program they applied for to receiving a funding decision and presents results for Year 1 and Year 2. Respondents were asked to provide ratings on a 5-pt scale.
- Total: Year 2 42% very satisfied, 35% somewhat satisfied, 14% neutral, 4% somewhat dissatisfied, 3% very dissatisfied. A total of 1942 respondents answered this question. Year 1 33% very satisfied, 37% somewhat satisfied, 18% neutral, 8% somewhat dissatisfied, 4% very dissatisfied, 1% Don’t know.
- EAF: Year 2 78% very/somewhat satisfied. A total of 207 respondents answered this question. Year 1 77% very/somewhat satisfied.
- NHSP: Year 2 83% very/somewhat satisfied. A total of 384 respondents answered this question. Year 1 73% very/somewhat satisfied.
- CSJ: Year 2 79% very/somewhat satisfied. A total of 865 respondents answered this question. Year 1 69% very/somewhat satisfied.
- YESS: Year 2 62% very/somewhat satisfied. A total of 152 respondents answered this question. Year 1 60% very/somewhat satisfied.
- UT&IP: Year 2:78% very/somewhat satisfied. A total of 32 respondents answered this question. Year 1 73% very/somewhat satisfied.
- EL&CCI: Year 2 19% very/somewhat satisfied. A total of 65 respondents answered this question. Year 1 60% very/somewhat satisfied.
- SDPP: Year 2 72% very/somewhat satisfied. A total of 153 respondents answered this question. Year 1 53% very/somewhat satisfied.
- FCRP: Year 2 65% very/somewhat satisfied. A total of 20 respondents answered this question.
- IELCC: Year 2 75% very/somewhat satisfied. A total of 8 respondents answered this question.
- IWLCI: Year 2 62% very/somewhat satisfied. A total of 13 respondents answered this question.
- SWP: Year 2 75% very/somewhat satisfied. A total of 4 respondents answered this question.
- SDG: Year 2 39% very/somewhat satisfied. A total of 39 respondents answered this question.
- All but EAF, NHSP, CSJ: Year 2 58% very/somewhat satisfied. A total of 486 respondents answered this question. Year 1 61% very/somewhat satisfied.
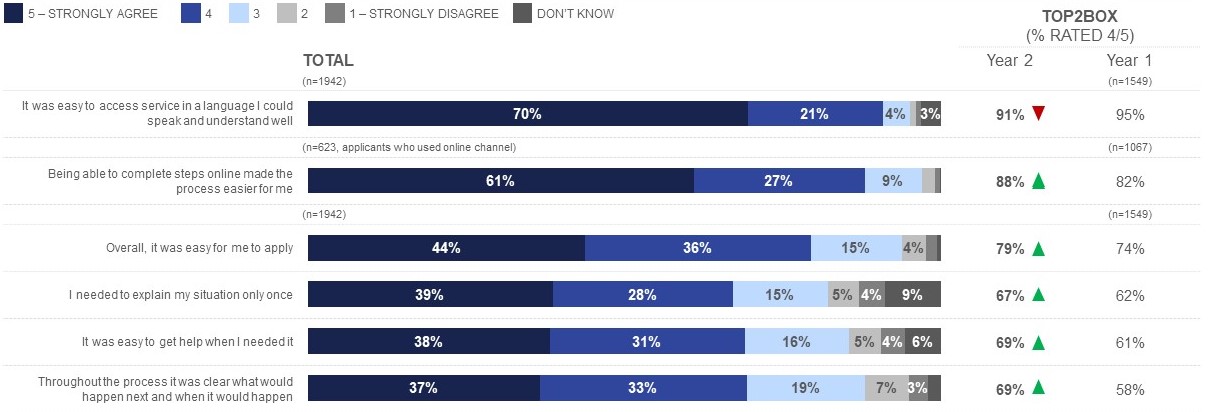
Ease of End-to-End Journey
- Improvement has been made on nearly all aspects of ease except for accessing service in a language applicants could understand well. At nine in ten (91%), nearly all applicants found it easy to access service in a language they could understand, however ratings have decreased compared to Year 1 (-4 pts). Slightly fewer than nine in ten (88%, +6 pts) said that being able to complete steps online made the process easier, followed by eight in ten (79%, +5 pts) who thought the application process was easy. Closer to seven in ten said they needed to explain their situation only once (67%, +5 pts), that it was easy to get help when needed (69%, +8 pts), and that it was clear what would happen next and when (69%, +11 pts).
Thinking about the overall service you received, from getting information about [PROGRAM] to receiving funding decision, how much do you agree or disagree with the following statements?
Note: values less than 3% not labelled
* small sample size
** very small sample size
Significantly higher/lower than Year 1
Q30. Thinking about the overall service you received, from getting information about [INSERT PROGRAM] to receiving funding decision, how much do you agree or disagree with the following statements, using a 5-point scale where 1 means strongly disagree and 5 means strongly agree.
Figure 6: Ease of End-to-end Journey
This horizontal bar chart shows the extent to which respondents agree or disagree with a variety of statements related to the ease of the overall service experience and presents results for Year 1 and Year 2. Respondents were asked to provide ratings on a 5-pt scale. Sample sizes vary by statement.
- It was easy to access service in a language I could speak and understand well: Year 2 70% strongly agree, 21% somewhat agree, 4% neutral, 1% somewhat disagree, 1% strongly disagree, 3% Don’t know. 91% agree. A total of 1942 respondents answered this question. Year 1 95% agree
- Being able to complete steps online made the process easier for me: Year 2 61% strongly agree, 27% somewhat agree, 9% neutral, 1% somewhat disagree, 1% strongly disagree, 0% Don’t know. 88% agree. A total of 623 respondents answered this question. Year 1 82% agree.
- Overall, it was easy for me to apply: Year 2 44% strongly agree, 36% somewhat agree, 15% neutral, 4% somewhat disagree, 2% strongly disagree, 1% Don’t know. 79% agree. A total of 1942 respondents answered this question. Year 1 74% agree.
- I needed to explain my situation only once: Year 2 39% strongly agree, 28% somewhat agree, 15% neutral, 5% somewhat disagree, 4% strongly disagree, 9% Don’t know. 67% agree. A total of 1942 respondents answered this question. Year 1 62% agree.
- It was easy to get help when I needed it: Year 2 38% strongly agree, 31% somewhat agree, 16% neutral, 5% somewhat disagree, 4% strongly disagree, 6% Don’t know. 69% agree. A total of 1942 respondents answered this question. Year 1 61% agree.
- Throughout the process it was clear what would happen next and when it would happen: Year 2 37% strongly agree, 33% somewhat agree, 19% neutral, 7% somewhat disagree, 3% strongly disagree, 1% Don’t know. 69% agree. A total of 1942 respondents answered this question. Year 1 68% agree.
Ease of End-to-End Journey by Program
- NHSP applicants were more likely to say it was easy to get help, that it was clear what would happen next and when, and that they only had to explain their situation once. Those who applied to YESS, EL&CCI, SDG (and to a lesser extent SDPP, FCRP and IWILI) experienced the most trouble with the ease of the application process.
- Compared to Year 1, applicants to CSJ provided higher ratings across most aspects of ease and were less likely to feel it was easy to access service in a language they could understand well. Applicants to NHSP were more likely to agree it was easy to apply and clear what would happen next and when, while applicants to EL&CCI were less likely to feel it was clear what would happen next and when. Ratings among applicants to all other programs were statistically consistent.
Thinking about the overall service you received, from getting information about [PROGRAM] to receiving funding decision, how much do you agree or disagree with the following statements?
| TOP2BOX (% RATED 4/5) | |||||||||||||||||||||||
| TOTAL | EAF | NHSP | CSJ | YESS (formerly SL/CF) | UT&IP NT | EL&CCI | SDPP | FCRP | IELC | IWILI | SWP | SDG | All but EAF, NHSP, CSJ | ||||||||||
| Year 2 | Year 1 | Year 2 | Year 1 | Year 2 | Year 1 | Year 2 | Year 1 | Year 2 | Year 1 | Year 2 | Year 1 | Year 2 | Year 1 | Year 2 | Year 1 | Year 2 | Year 2 | Year 2 | Year 1 | Year 2 | Year 1 | Year 1 | |
| Base: All respondents – n= | 1942 | 1549 | 207 | 56 | 384 | 431 | 865 | 942 | 152 | 25* | 32 | 26* | 65 | 5** | 153 | 17* | 20* | 8** | 13* | 4** | 39 | 486 | 120 |
| It was easy to access service in a language I could speak and understand well | 91% | 95% | 89% | 96% | 92% | 94% | 91% | 95% | 90% | 96% | 94% | 85% | 85% | 60% | 88% | 82% | 90% | 50% | 85% | 50% | 69% | 84% | 88% |
| Base: Applicants who used online channel – n= | 623 | 1067 | 27* | 30 | 69 | 175 | 375 | 802 | 88 | 24* | 5 | 10* | 18*** | 1** | 23* | 5** | 3** | 0 | 3** | 3** | 9** | 152 | 60 |
| Being able to complete steps online made the process easier for me | 88% | 82% | 93% | 90% | 81% | 75% | 89% | 83% | 76% | 71% | 80% | 70% | 61% | 100% | 80% | 60% | 100% | - | 33% | - | 78% | 74% | 73% |
| Base: All respondents – n= | 1942 | 1549 | 207 | 56 | 384 | 431 | 865 | 942 | 152 | 25* | 32 | 26* | 65 | 5** | 153 | 17* | 20* | 8** | 13* | 4* | 39 | 486 | 120 |
| Overall, it was easy for me to apply | 79% | 74% | 75% | 84% | 78% | 71% | 82% | 74% | 65% | 76% | 72% | 54% | 32% | 60% | 69% | 59% | 50% | 63% | 69% | 25% | 59% | 61% | 64% |
| It was easy to get help when I needed it | 69% | 61% | 66% | 63% | 75% | 69% | 70% | 61% | 60% | 60% | 75% | 62% | 23% | 40% | 70% | 65% | 80% | 50% | 54% | 25% | 46% | 58% | 62% |
| Throughout the process it was clear what would happen next and when it would happen | 69% | 58% | 66% | 71% | 77% | 65% | 71% | 57% | 45% | 52% | 63% | 46% | 20% | 60% | 60% | 53% | 50% | 38% | 39% | 25% | 26% | 45% | 51% |
| I needed to explain my situation only once | 67% | 62% | 67% | 63% | 75% | 69% | 67% | 62% | 52% | 48% | 63% | 62% | 31% | 40% | 63% | 41% | 45% | 38% | 39% | - | 49% | 53% | 50% |
Q30. Thinking about the overall service you received, from getting information about [INSERT PROGRAM] to receiving funding decision, how much do you agree or disagree with the following statements, using a 5-point scale where 1 means strongly disagree and 5 means strongly agree.
* small sample size
** very small sample size
Significantly higher / lower than totalSignificantly higher/lower than Year 1
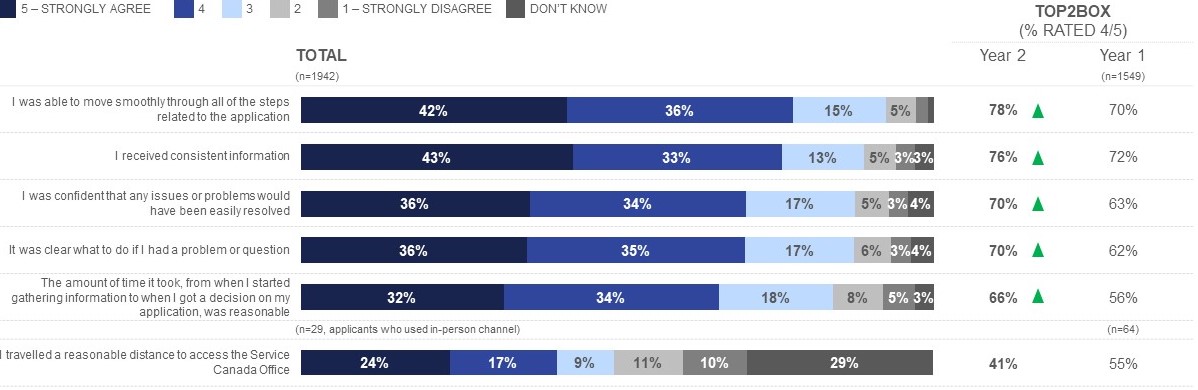
Effectiveness of End-to-End Journey
- There has been improvement in nearly all aspects of the effectiveness of the application process. Nearly eight in ten (78%) agreed that they were able to move smoothly through all steps (78%, +8 pts), followed closely by that they received consistent information (76%, +4 pts). Seven in ten were confident any issues would have been resolved (70%, +7 pts) or thought it was clear what to do if they had a problem or question (70% +8 pts), while two-thirds said the process took a reasonable amount of time (66%, +10 pts). At four in ten (41%, -14 pts), fewer of those who used an in-person channel say they travelled a reasonable distance to access a Service Canada office.
How satisfied or dissatisfied were you with the overall service you received from Service Canada from getting information about [PROGRAM] to receiving a funding decision?
Note: values less than 3% not labelled
* small sample size
** very small sample size
Significantly higher/lower than Year 1
Q30. Thinking about the overall service you received, from getting information about [INSERT PROGRAM] to receiving funding decision, how much do you agree or disagree with the following statements, using a 5-point scale where 1 means strongly disagree and 5 means strongly agree.
Figure 7: Effectiveness of End-to-End Journey
This horizontal bar chart shows the extent to which respondents agree or disagree with a variety of statements related to the effectiveness of the overall service experience and presents results for Year 1 and Year 2. Respondents were asked to provide ratings on a 5-pt scale. Sample sizes vary by statement.
- I was able to move smoothly through all of the steps related to the application: Year 2 42% strongly agree, 36% somewhat agree, 15% neutral, 5% somewhat disagree, 2% strongly disagree, 1% Don’t know. 78% agree. A total of 1942 respondents answered this question. Year 1 70% agree.
- I received consistent information: Year 2 43% strongly agree, 33% somewhat agree, 13% neutral, 5% somewhat disagree, 3% strongly disagree, 3% Don’t know. 76% agree. A total of 1942 respondents answered this question. Year 1 72% agree.
- I was confident that any issues or problems would have been easily resolved: Year 2 36% strongly agree, 34% somewhat agree, 17% neutral, 5% somewhat disagree, 3% strongly disagree, 4% Don’t know. 70% agree. A total of 1942 respondents answered this question. Year 1 63% agree.
- It was clear what to do if I had a problem or question: Year 2 36% strongly agree, 35% somewhat agree, 17% neutral, 6% somewhat disagree, 3% strongly disagree, 4% Don’t know. 70% agree. A total of 1942 respondents answered this question. Year 1 63% agree.
- The amount of time it took, from when I started gathering information to when I got a decision on my application, was reasonable: Year 2 32% strongly agree, 34% somewhat agree, 18% neutral, 8% somewhat disagree, 5% strongly disagree, 3% Don’t know. 66% agree. A total of 1942 respondents answered this question. Year 1 56% agree.
- I travelled a reasonable distance to access the Service Canada Office: Year 2 24% strongly agree, 17% somewhat agree, 9% neutral, 11% somewhat disagree, 10% strongly disagree, 29% Don’t know. 41% agree. A total of 29 respondents answered this question. Year 1 55% agree.
Effectiveness of End-to-End Journey by Program
- NHSP applicants were more likely to say they received consistent information, have confidence in issue resolution, feel it was clear what to do if they had a problem or question, and believe the overall time the process took was reasonable. As with measures related to ease of the process, those who applied to YESS, EL&CCI, SDG (and to a lesser extent SDPP) were less likely to provide high ratings for most aspects of the effectiveness of the process.
- Compared to Year 1, applicants to CSJ provided higher ratings across nearly all aspects of effectiveness, while applicants to NHSP were more likely to agree the amount of time it took was reasonable. Ratings among applicants to all other programs were statistically consistent.
Thinking about the overall service you received, from getting information about [PROGRAM] to receiving funding decision, how much do you agree or disagree with the following statements?
| TOP2BOX (% RATED 4/5) | |||||||||||||||||||||||
| TOTAL | EAF | NHSP | CSJ | YESS (formerly SL/CF) | UT&IP NT | EL&CCI | SDPP | FCRP | IELC | IWILI | SWP | SDG | All but EAF, NHSP, CSJ | ||||||||||
| Year 2 | Year 1 | Year 2 | Year 1 | Year 2 | Year 1 | Year 2 | Year 1 | Year 2 | Year 1 | Year 2 | Year 1 | Year 2 | Year 1 | Year 2 | Year 1 | Year 2 | Year 2 | Year 2 | Year 1 | Year 2 | Year 1 | Year 1 | |
| Base: All respondents – n= | 1942 | 1549 | 207 | 56 | 384 | 431 | 865 | 942 | 152 | 25* | 32 | 26* | 65 | 5** | 153 | 17* | 20* | 8** | 13* | 4** | 39 | 486 | 120 |
| I was able to move smoothly through all of the steps related to the application | 78% | 70% | 73% | 79% | 77% | 74% | 80% | 69% | 80% | 68% | 75% | 62% | 40% | 40% | 71% | 65% | 65% | 50% | 69% | - | 54% | 66% | 61% |
| I received consistent information | 76% | 72% | 73% | 79% | 81% | 76% | 77% | 71% | 61% | 72% | 78% | 62% | 34% | 40% | 68% | 59% | 75% | 50% | 46% | 75% | 49% | 59% | 62% |
| I was confident that any issues or problems would have been easily resolved | 70% | 63% | 71% | 75% | 75% | 69% | 71% | 62% | 53% | 48% | 66% | 58% | 23% | 40% | 65% | 41% | 55% | 63% | 62% | 25% | 46% | 54% | 50% |
| It was clear what to do if I had a problem or question | 70% | 62% | 66% | 70% | 75% | 70% | 71% | 61% | 61% | 68% | 66% | 69% | 26% | 60% | 69% | 71% | 80% | 63% | 62% | 25% | 49% | 59% | 63% |
| The amount of time it took, from when I started gathering information to when I got a decision on my application, was reasonable | 66% | 56% | 70% | 68% | 75% | 59% | 68% | 56% | 43% | 48% | 59% | 58% | 22% | - | 46% | 53% | 55% | 63% | 62% | 25% | 23% | 39% | 46% |
| Base: Applicants who used in-person channel – n= | 29 | 64 | 2 | 2** | 12 | 24* | 10 | 33 | 2 | 0 | 0 | 0 | 0 | 1** | 2 | 0 | 0 | 0 | 0 | 0 | 1 | 5** | 5** |
| I travelled a reasonable distance to access the Service Canada Office | 41% | 55% | - | - | 42% | 58% | 40% | 58% | 50% | - | - | - | - | - | 100% | - | - | - | - | - | - | 55% | 31% |
Q30. Thinking about the overall service you received, from getting information about [INSERT PROGRAM] to receiving funding decision, how much do you agree or disagree with the following statements, using a 5-point scale where 1 means strongly disagree and 5 means strongly agree.
* small sample size
** very small sample size
Significantly higher / lower than totalSignificantly higher/lower than Year 1
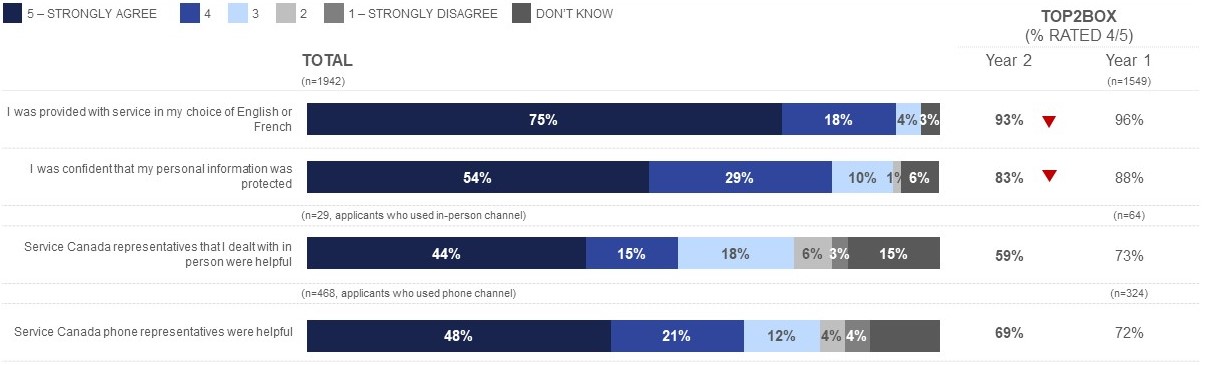
Emotion of End-to-End Journey
- At more than nine in ten (93%, -3 pts), virtually all applicants were provided service in their choice of English or French, followed by over eight in ten who were confident their personal information was protected (83%, -5 pts). Ratings on these two measures, while still very high, have declined compared to Year 1. Seven in ten of those who used the phone channel said the Service Canada representatives were helpful (69%, -3 pts), while six in ten of those who used the in-person channel felt that the Service Canada representatives were helpful (59%, -14 pts).
Thinking about the overall service you received, from getting information about [PROGRAM] to receiving funding decision, how much do you agree or disagree with the following statements?
Note: values less than 3% not labelled
* small sample size
** very small sample size
Significantly higher/lower than Year 1
Q30. Thinking about the overall service you received, from getting information about [INSERT PROGRAM] to receiving funding decision, how much do you agree or disagree with the following statements, using a 5-point scale where 1 means strongly disagree and 5 means strongly agree.
Figure 8: Emotion of End-to-End Journey
This horizontal bar chart shows the extent to which respondents agree or disagree with a variety of statements related to about the emotion of the overall service experience and presents results for Year 1 and Year 2. Respondents were asked to provide ratings on a 5-pt scale. Sample sizes vary by statement.
- I was provided with service in my choice of English or French: Year 2 75% strongly agree, 18% somewhat agree, 4% neutral, 0% somewhat disagree, 0% strongly disagree, 3% Don’t know. 93% agree. A total of 1942 respondents answered this question. Year 1 96% agree.
- I was confident that my personal information was protected: Year 2 54% strongly agree, 29% somewhat agree, 10% neutral, 1% somewhat disagree, 0% strongly disagree, 6% Don’t know. 83% agree. A total of 1942 respondents answered this question. Year 1 88% agree.
- Service Canada representatives that I dealt with in person were helpful: Year 2 44% strongly agree, 15% somewhat agree, 18% neutral, 6% somewhat disagree, 3% strongly disagree, 15% Don’t know. 59% agree. A total of 29 respondents answered this question. Year 1 73% agree.
- Service Canada phone representatives were helpful: Year 2 48% strongly agree, 21% somewhat agree, 12% neutral, 4% somewhat disagree, 4% strongly disagree, 11% Don’t know. 69% agree. A total of 468 respondents answered this question. Year 1 72% agree.
Emotion of End-to-End Journey by Program
- Applicants to EL&CCI and SDG were less likely to report being provided with their choice of service in either official language and being confident their personal information was being protected. Applicants to UT&IP were more likely to have felt confident their personal information was being protected, while applicants to SDPP were more likely to agree that the Service Canada phone representative was helpful.
- Compared to Year 1, applicants to CSJ were less likely to agree that they were provided service in their choice of English or French and that they were confident their personal information was protected (along with applicants to all programs but EAF, NHSP ad CSJ).
Thinking about the overall service you received, from getting information about [PROGRAM] to receiving funding decision, how much do you agree or disagree with the following statements?
| TOP2BOX (% RATED 4/5) | |||||||||||||||||||||||
| TOTAL | EAF | NHSP | CSJ | YESS (formerly SL/CF) | UT&IP NT | EL&CCI | SDPP | FCRP | IELC | IWILI | SWP | SDG | All but EAF, NHSP, CSJ | ||||||||||
| Year 2 | Year 1 | Year 2 | Year 1 | Year 2 | Year 1 | Year 2 | Year 1 | Year 2 | Year 1 | Year 2 | Year 1 | Year 2 | Year 1 | Year 2 | Year 1 | Year 2 | Year 2 | Year 2 | Year 1 | Year 2 | Year 1 | Year 1 | |
| Base: All respondents – n= | 1942 | 1549 | 207 | 56 | 384 | 431 | 865 | 942 | 152 | 25* | 32 | 26* | 65 | 5** | 153 | 17* | 20* | 8** | 13* | 4** | 39 | 486 | 120 |
| I was provided with service in my choice of English or French | 93% | 69% | 92% | 93% | 95% | 96% | 93% | 96% | 96% | 96% | 87% | 85% | 83% | 80% | 89% | 94% | 95% | 75% | 87% | 100% | 82% | 89% | 92% |
| I was confident that my personal information was protected | 83% | 88% | 83% | 86% | 87% | 88% | 83% | 88% | 85% | 88% | 97% | 81% | 63% | 80% | 80% | 88% | 90% | 75% | 69% | 100% | 64% | 77% | 88% |
| Base: Applicants who used in-person channel – n= | 29* | 64 | 2** | 2** | 12* | 24* | 10* | 33 | 2** | 0 | 0 | 0 | 0 | 1** | 2** | 0 | 0 | 0 | 0 | 0 | 1** | 5** | 5** |
| Service Canada representatives that I dealt with in person were helpful | 59% | 73% | 50% | 100% | 75% | 79% | 50% | 73% | 100% | - | - | - | - | - | 100% | - | - | - | - | - | - | 66% | 38% |
| Base: Applicants who used phone channel – n= | 468 | 324 | 83 | 18* | 94 | 92 | 176 | 183 | 52 | 12* | 3** | 3** | 7** | 1** | 58 | 12* | 2* | 1** | 2** | 1** | 12* | 115 | 31 |
| Service Canada phone representatives were helpful | 69% | 72% | 69% | 67% | 75% | 78% | 68% | 72% | 56% | 58% | 33% | 100% | 43% | - | 82% | 100% | 100% | - | 50% | - | 50% | 63% | 69% |
Q30. Thinking about the overall service you received, from getting information about [INSERT PROGRAM] to receiving funding decision, how much do you agree or disagree with the following statements, using a 5-point scale where 1 means strongly disagree and 5 means strongly agree.
* small sample size
** very small sample size
Significantly higher / lower than totalSignificantly higher/lower than Year 1
Profile of Applicants Who Were Satisfied
- Compared to Year 1, a higher proportion of applicants were satisfied with their experience.
- Applicants who were satisfied were more likely to apply for the same program annually, had a fewer number of contacts with Service Canada, were less likely to encounter problems, were more likely to have been contacted by Service Canada to provide more information and less likely to have followed up before receiving a decision. They were more likely to have received funding and fewer had to make changes to the project scope or activities (while those denied were more likely to have been provided an explanation). They were also more likely to be aware of all service standards, less likely to operate or deliver services in the West or Territories and to have felt discriminated against on the basis of identity.
| Overall satisfaction (% rated 4/5) | |
|---|---|
| Year 2 (n=1443) | Year 1 (n=1086) |
| 77% | 70% |
| Prominent differences among those satisfied | |
|---|---|
| Apply for the same program on an annual basis | 37% |
| Fewer number of contacts with Service Canada (average times) | 43% |
| Lower incidence of problems | 15% |
| More likely to have been contacted by Service Canada to provide additional information on application | 37% |
| Less likely to have followed up with Service Canada before receiving a decision (% who did not) | 54% |
| Received funding approval | 96% |
| 47% | |
| More likely to be aware of all service standards: | |
| 52% | |
| 46% | |
| 42% | |
| Less likely to operate (28%) and delivery services in the West and Territories (29%) | |
| Less likely to have felt discriminated against on basis of identity | 2% |
Significantly higher/lower than Year 1
Profile of Applicants Who Were Not Satisfied
- Fewer applicants were dissatisfied with their experience compared to Year 1.
- Applicants who were not satisfied were more likely to report being a first-time applicant to the program, having a greater number of contacts with Service Canada, encountering problems or issues, contacting Service Canada before receiving a decision, to have been denied funding and not provided an explanation why (and if funded to have had to make changes to the project scope or activities). They were also more less likely to be aware of all service standards, more likely to operate or deliver services in Alberta and to have felt discriminated against on the basis of identity.
| Overall satisfaction (% rated 1/2) | |
|---|---|
| Year 2 (n=176) | Year 1 (n=170) |
| 7% | 12% |
| Prominent differences among those not satisfied | |
|---|---|
| First-time applicant to program | 39% |
| Higher number of contacts with Service Canada (10+ times) | 43% |
| Higher incidence of problems | 63% |
| More likely to have contacted Service Canada to check on the status of their application (44%) or determine timelines for funding decision (32%) | |
| Denied funding approval | 32% |
| 56% | |
| Less likely to be aware of all service standards: | |
| 27% | |
| 26% | |
| 17% | |
| More likely to operate (20%) and delivery services in Alberta (22%) |
|
| Felt discriminated against on basis of identity | 14% |
Significantly higher/lower than Year 1
Profile of Applicants – Funded and Not Funded
- Applicants who were approved for funding were more likely to be satisfied with their experience than those who were not. Applicants who were not approved for funding were more likely to experience a problem or issue, were less satisfied with the service provided through most Service Canada channels and were less likely to have received an email from the funding program directly when learning about the program. Unfunded applicants were also less likely to provide high ratings for the ease of several aspects of the awareness and application stages of the process and were more likely to have contacted Service Canada before receiving a decision and to have felt it was difficult to do so.
- Compared to Year 1, applicants who were approved for funding were more likely to be satisfied overall and with the service provided online, through email support from a SC office and the GCOS web portal and were less likely to have experienced a problem. They were also more likely to provide high ratings for the ease of several aspects of the awareness and application stages and were less likely to have contacted SC prior to receiving a decision or to have felt it was difficult to do so. Applicants who were not approved were more likely to have received an email from the program directly (along with those approved) and were less likely to feel it was easy to find out what information they needed to provide.
| Overall satisfaction (% rated 4/5) | |||
|---|---|---|---|
| Year 2 (n=1604) | Year 1 (n=1304) | Year 2 (n=216) | Year 1 (n=187) |
| Fonded | Not Fonded | ||
| 82% | 74% | 47% | 41% |
| Funded | Not Funded | |||
|---|---|---|---|---|
| Year 2 | Year 1 | Year 2 | Year 1 | |
| Experienced a problem or issue | ||||
| % Yes | 20% | 34% | 39% | 36% |
| Service channel satisfaction | ||||
| Government of Canada website | 73% | 67% | 59% | 52% |
| Email support from SC office | 72% | 68% | 47% | 44% |
| Email support from program officer | 81% | 82% | 47% | 58% |
| GCOS web portal | 76% | 68% | 61% | 50% |
| Channel used to learn about program | ||||
| Received an email from the funding program directly | 59% | 53% | 46% | 36% |
| Ease of navigating GoC website (% rated 4/5) | ||||
| Find out what information you need to provide | 81% | 80% | 54% | 67% |
| Understand the information | 82% | 77% | 58% | 64% |
| Determine the steps to apply for funding |
83% | 79% | 68% | 67% |
| Determine the amount of time each phase of the application process is anticipated to take | 61% | - | 35% | - |
| Ease of application process (% rated 4/5) | ||||
| Putting together the information you needed to apply | 77% | 71% | 54% | 51% |
| Completing the narrative questions | 73% | 65% | 54% | 47% |
| Application took reasonable amount of time to complete | 71% | 66% | 54% | 55% |
| Contacted service canada before receiving a decision | ||||
| % Contacted SC (for any reason) | 50% | 67% | 62% | 63% |
| Felt it was ‘difficult’ to follow-up with SC | 10% | 16% | 31% | 29% |
Significantly higher / lower than total
Significantly higher/lower than Year 1
Profile of Applicants – Funded and Not Funded (cont.)
- Applicants who were not approved for funding were less likely to provide high ratings across several service attributes. The largest service attribute gaps were for ease of getting help when needed, clarity what to do if you had a problem or question, the amount of time the process took was reasonable, received consistent information and that overall, it was easy to apply.
- Compared to Year 1, applicants who were approved for funding provided higher ratings across most aspects of service. Applicants who were not approved provided higher ratings for confidence issues or problems would have been easily resolved, clarity of process and overall effectiveness. Both groups provided lower ratings for confidence their personal information was protected, ease of accessing service in a language they could understand well and among those approved for funding being provided service in their choice of English or French.
| Funded | Not Funded | |||
|---|---|---|---|---|
| Year 2 | Year 1 | Year 2 | Year 1 | |
| (n=1604) | (n=1304) | (n=216) | (n=187) | |
| Widest gaps/ shifts in service attributes (% rated 4/5) | ||||
| It was easy to get help when I needed it | 73% | 65% | 40% | 36% |
| It was clear what to do if I had a problem or question | 73% | 65% | 43% | 41% |
| The amount of time it took was reasonable | 70% | 60% | 41% | 31% |
| I received consistent information | 79% | 75% | 52% | 45% |
| Overall, it was easy for me to apply | 83% | 77% | 56% | 49% |
| I was confident that any issues or problems would have been easily resolved | 73% | 66% | 47% | 39% |
| It was clear what would happen next and when it would happen | 72% | 61% | 46% | 35% |
| I needed to explain my situation only once | 70% | 66% | 44% | 38% |
| I was able to move smoothly through all of the steps |
80% | 72% | 65% | 51% |
| Being able to complete steps online made it easier | 89% | 84% | 74% | 68% |
| Confident that my personal information was protected | 84% | 89% | 73% | 82% |
| Easy to access service in a language I could understand | 92% | 95% | 80% | 88% |
| Provided with service in my choice of English or French | 94% | 96% | 86% | 91% |
Significantly higher / lower than total
Significantly higher/lower than Year 1
Profile of Applicants – Funded and Not Funded (cont.)
- Applicants who were not approved for funding were more likely to have been a first-time applicant to the program, to have applied to a different Gs&Cs program in the past 5 years but less likely to apply for federal or provincial/territorial funding on an annual basis. They are also more likely to be organization which do not have any employees and were more likely to have felt discriminated against (9%) on the basis of identity.
- Compared to Year 1, a greater proportion of both groups said they were applying to the program for the first time and fewer said they apply for the same program on an annual basis. Applicants who were not approved were more likely to be from organizations with no employees. Applicants who were approved for funding were more likely to have felt discriminated against (3%) on the basis of identity (however the proportion remains very low).
| Funded | Not Funded | |||
|---|---|---|---|---|
| Year 2 | Year 1 | Year 2 | Year 1 | |
| Application frequency | ||||
| First application | 17% | 12% | 47% | 36% |
| Applied once or twice before | 19% | 19% | 21% | 25% |
| Applied several times before | 26% | 27% | 14% | 18% |
| Apply for the same program on an annual basis | 37% | 42% | 14% | 34% |
| Number of employees | ||||
| None | 11% | 10% | 20% | 10% |
| 1-4 | 28% | 30% | 34% | 39% |
| 5-9 | 20% | 18% | 11% | 11% |
| 10-19 | 15% | 17% | 13% | 17% |
| 20-49 | 14% | 13% | 11% | 12% |
| 50+ | 13% | 11% | 10% | 11% |
| Felt discriminated against on basis of identity | ||||
| % Yes | 3% | 1% | 9% | 7% |
| Experience with submitting appliciations to other programs in the past 5 years | ||||
| Applied to different Gs&Cs program (among first time applicants) | 40% | - | 53% | - |
| Applied for federal funding at least annually | 78% | - | 65% | - |
| Applied for provincial/ territorial funding at least annually | 66% | - | 57% | - |
Significantly higher / lower than total
Significantly higher/lower than Year 1
Trust in Service Canada
- Consistent with Year 1, more than eight in ten (84%, +1 pt) applicants trust Service Canada to deliver services effectively to Canadians. This measure remains strongly correlated to overall satisfaction.
- Applicants to EL&CCI and SDG were less likely to express trust in Service Canada.
How much would you say you trust or distrust Service Canada to deliver services effectively to Canadians?
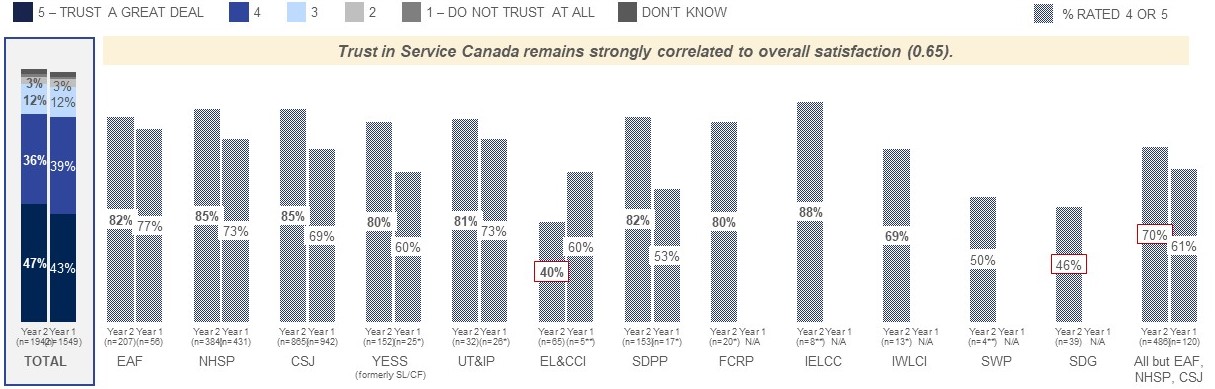
Note: values less than 3% not labelled
* small sample size
** very small sample size
Significantly higher / lower than total
Significantly higher/lower than Year 1
Q32. On a scale from 1 to 5, where 1 means do not trust at all and 5 means trust a great deal, how much do you trust or distrust Service Canada to deliver services effectively to Canadians? Base: All respondents
Figure 9: Trust in Service Canada
This vertical bar chart shows responses to a question about the extent the applicant trusts or distrusts Service Canada and Department of Employment and Social Development Canada (ESDC) to deliver services effectively to Canadians and presents results for Year 1 and Year 2. Respondents were asked to provide ratings on a 5-pt scale.
- Total: Year 2 47% trust a great deal, 36% somewhat trust, 12% neutral, 3% somewhat not trust, 1% do not trust at all, 2% Don’t know. A total of 1942 respondents answered this question. Year 1 43% trust a great deal, 39% somewhat trust, 12% neutral, 3% somewhat not trust, 1% do not trust at all, 2% Don’t know.
- EAF: Year 2 82% trust a great deal/ trust somewhat. A total of 207 respondents answered this question. Year 1 77% trust a great deal/ trust somewhat.
- NHSP: Year 2 85% trust a great deal/ trust somewhat. A total of 384 respondents answered this question. Year 1 73% trust a great deal/ trust somewhat.
- CSJ: Year 2 85% trust a great deal/ trust somewhat. A total of 865 respondents answered this question. Year 1 69% trust a great deal/ trust somewhat.
- YESS: Year 2 80% trust a great deal/ trust somewhat. A total of 152 respondents answered this question. Year 1 60% trust a great deal/ trust somewhat.
- UT&IP: Year 2 81% trust a great deal/ trust somewhat. A total of 32 respondents answered this question. Year 1 73% trust a great deal/ trust somewhat.
- EL&CCI: Year 60% trust a great deal/ trust somewhat. A total of 65 respondents answered this question. Year 1 40% trust a great deal/ trust somewhat.
- SDPP: Year 2 82% trust a great deal/ trust somewhat. A total of 153 respondents answered this question. Year 1 53% trust a great deal/ trust somewhat.
- FCRP: Year 2 80% trust a great deal/ trust somewhat. A total of 20 respondents answered this question.
- IELCC: Year 2 88% trust a great deal/ trust somewhat. A total of 8 respondents answered this question.
- IWLCI: Year 2 69% trust a great deal/ trust somewhat. A total of 13 respondents answered this question.
- SWP: Year 2 50% trust a great deal/ trust somewhat. A total of 4 respondents answered this question.
- SDG: Year 2 46% trust a great deal/ trust somewhat. A total of 4 respondents answered this question.
- ALL BUT EAF, NHSP, CSJ: Year 2 70% trust a great deal/ trust somewhat A total of 486 respondents answered this question. Year 1 61% trust a great deal/ trust somewhat.
Program Level Highlights
Enabling Accessibility Fund (EAF)
Program level-highlights
| Satisfaction | |
|---|---|
| Overall service experience | |
| Year 2 | Year 1 |
| 78% | 77% |
| Ease | |
|---|---|
| Overall, it was easy for me to apply | |
| Year 2 | Year 1 |
| 75% | 84% |
| Effectiveness | |
|---|---|
| I was able to move smoothly through all of the steps | |
| Year 2 | Year 1 |
| 73% | 79% |
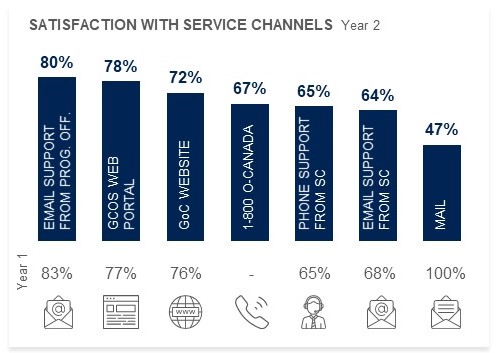
Figure 10: Satisfaction with Service Channels
This vertical bar chart shows responses to a question about how satisfied or dissatisfied the applicant was with the service they received from the service channels they used throughout the application process and presents results for Year 1 and Year 2. Respondents were asked to provide ratings on a 5-pt scale and results were grouped by those who provided a rating of 4 or 5. Sample sizes vary by service channel, only those who used each channel during their experience were asked about it.
- Email Support from Program Officer: Year 2 80%. Year 1 83%.
- GCOS Web Portal: Year 2 78%. Year 1 77%.
- GoC Website: Year 2 72%. Year 1 76%.
- 1-800-OCanada: Year 2 67%.
- Phone Support from SC: Year 2 65%. Year 1 65%.
- Email Support from SC: Year 2 64%. Year 1 68%
- Mail: Year 2 47%. Year 1 100%.
| Complete application in reasonable time | Experienced a problem | ||
|---|---|---|---|
| Year 2 | Year 1 | Year 1 | Year 1 |
| 68% | 66% | 21% | 23% |
| Service attribute performance | ||
|---|---|---|
| Strengths | Year 2 | Year 1 |
| Completing steps online made the process easier | 93% | 90% |
| I was confident that my personal information was protected | 83% | 86% |
| Find general information about EAF | 82% | 89% |
| Determine when the application period for EAF takes place | 80% | - |
| Areas for improvement | Year 2 | Year 1 |
| Understanding requirements of the application | 86% | 80% |
| Completing the project timeline | 60% | 75% |
| Completing the budget document | 59% | 66% |
| Putting together the information you needed to apply for EAF | 58% | 61% |
Base: EAF applicants – Year 2 (n=207); Year 1 (n=56) Analysis was also conducted by program stream and no statistically significant differences were observed in survey responses due in part to small samples sizes among the Youth Innovation stream. Small Projects (n=192); Youth Innovation (n=15*) Note: Figures for ‘[PROGRAM] web portal’ is reported in Year 1 and compared with ‘GCOS web portal’ in Year 2.
Significantly higher / lower than total
Significantly higher/lower than Year 1
New Horizons for Seniors Program (NHSP)
Program level-highlights
| Satisfaction | |
|---|---|
| Overall service experience | |
| Year 2 | Year 1 |
| 83% | 73% |
| Ease | |
|---|---|
| Overall, it was easy for me to apply | |
| Year 2 | Year 1 |
| 78% | 71% |
| Effectiveness | |
|---|---|
| I was able to move smoothly through all of the steps | |
| Year 2 | Year 1 |
| 77% | 74% |
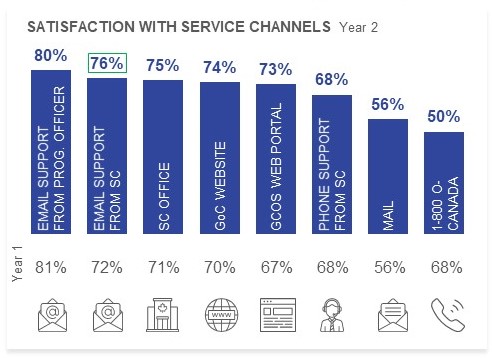
Figure 11: Satisfaction with Service Channels
This vertical bar chart shows responses to a question about how satisfied or dissatisfied the applicant was with the service they received from the service channels they used throughout the application process and presents results for Year 1 and Year 2. Respondents were asked to provide ratings on a 5-pt scale and results were grouped by those who provided a rating of 4 or 5. Sample sizes vary by service channel, only those who used each channel during their experience were asked about it.
- Email Support from Program Officer: Year 2 80%. Year 1 81%.
- Email Support from SC: Year 2 76%. Year 1 72%.
- SC Office: Year 2 75%. Year 1 71%.
- GoC Website: Year 2 74%. Year 1 70%
- GCOS Web Portal: Year 2 73%. Year 1 67%.
- Phone Support from SC: Year 2 68%. Year 1 68%.
- Mail: Year 2 56%. Year 1 56%.
- 1-800-OCanada: Year 2 50%. Year 1 68%.
| Complete application in reasonable time | Experienced a problem | ||
|---|---|---|---|
| Year 2 | Year 1 | Year 1 | Year 1 |
| 66% | 62% | 27% | 32% |
| Service attribute performance | ||
|---|---|---|
| Strengths | Year 2 | Year 1 |
| I was confident that my personal information was protected | 87% | 88% |
| Determine the steps to apply for funding | 86% | 82% |
| Determine if your organization is eligible for NHSP funding | 85% | 84% |
| Find general information about NHSP | 85% | 85% |
| Understand the information about NHSP | 85% | 80% |
| Areas for improvement | Year 2 | Year 1 |
| Putting together the information you needed to apply for NHSP | 69% | 65% |
| Completing the narrative questions | 67% | 60% |
| Determine amount of time each phase of the is anticipated to take | 65% | - |
| Completing the budget document | 62% | 61% |
Base: NHSP applicants – Year 2 (n=384); Year 1 (n=431)
Analysis was also conducted by program stream and no statistically significant differences were observed in survey responses.
Small grant (n=52); Community-based projects (n=332)
Note: Figures for ‘[PROGRAM] web portal’ is reported in Year 1 and compared with ‘GCOS web portal’ in Year 2.
Significantly higher / lower than total
Significantly higher/lower than Year 1
Canada Summer Jobs (CSJ)
Program level-highlights
| Satisfaction | |
|---|---|
| Overall service experience | |
| Year 2 | Year 1 |
| 79% | 69% |
| Ease | |
|---|---|
| Overall, it was easy for me to apply | |
| Year 2 | Year 1 |
| 82% | 74% |
| Effectiveness | |
|---|---|
| I was able to move smoothly through all of the steps | |
| Year 2 | Year 1 |
| 80% | 69% |
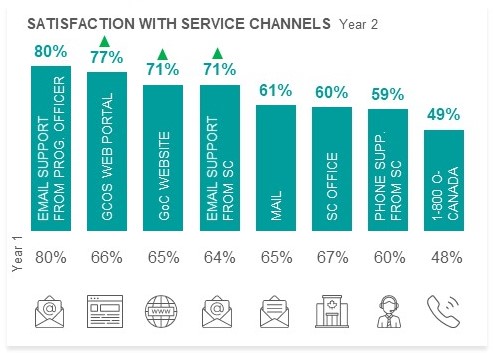
Figure 12: Satisfaction with Service Channels
This vertical bar chart shows responses to a question about how satisfied or dissatisfied the applicant was with the service they received from the service channels they used throughout the application process and presents results for Year 1 and Year 2. Respondents were asked to provide ratings on a 5-pt scale and results were grouped by those who provided a rating of 4 or 5. Sample sizes vary by service channel, only those who used each channel during their experience were asked about it.
- Email Support from Program Officer: Year 2 80%. Year 1 80%.
- GCOS Web Portal: Year 2 77%. Year 1 66%.
- GoC Website: Year 2 71%. Year 1 65%.
- Email Support from SC: Year 2 71%. Year 1 64%.
- Mail: Year 2 61%. Year 1 65%.
- SC Office: Year 2 60%. Year 1 67%.
- Phone Support from SC: Year 2 59%. Year 1 69%.
- 1-800-OCanada: Year 2 49%. Year 1 48%.
| Complete application in reasonable time | Experienced a problem | ||
|---|---|---|---|
| Year 2 | Year 1 | Year 1 | Year 1 |
| 72% | 65% | 20% | 35% |
| Service attribute performance | ||
|---|---|---|
| Strengths | Year 2 | Year 1 |
| Completing steps online made the process easier | 89% | 83% |
| Determine if your organization is eligible for CSJ funding | 87% | 83% |
| Determine when the application period for CSJ takes place | 84% | - |
| Areas for improvement | Year 2 | Year 1 |
| The amount of time it took from gathering information to getting a decision was reasonable | 68% | 56% |
| I needed to explain my situation only once | 67% | 62% |
| Determine amount of time each phase is anticipated to take | 59% | - |
Base: CSJ applicants – Year 2 (n=865); Year 1 (n=942)
Note: Figures for ‘[PROGRAM] web portal’ is reported in Year 1 and compared with ‘GCOS web portal’ in Year 2.
Significantly higher / lower than total
Significantly higher/lower than Year 1
Youth Employment and Skills Strategy (YESS)+
Program level-highlights
| Satisfaction | |
|---|---|
| Overall service experience | |
| Year 2 | Year 1 |
| 62% | 60% |
| Ease | |
|---|---|
| Overall, it was easy for me to apply | |
| Year 2 | Year 1 |
| 65% | 76% |
| Effectiveness | |
|---|---|
| I was able to move smoothly through all of the steps | |
| Year 2 | Year 1 |
| 80% | 68% |
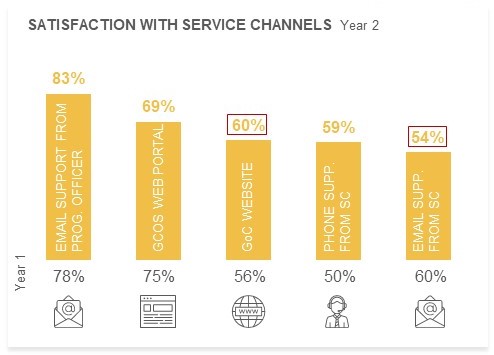
Figure 13: Satisfaction with Service Channels
This vertical bar chart shows responses to a question about how satisfied or dissatisfied the applicant was with the service they received from the service channels they used throughout the application process and presents results for Year 1 and Year 2. Respondents were asked to provide ratings on a 5-pt scale and results were grouped by those who provided a rating of 4 or 5. Sample sizes vary by service channel, only those who used each channel during their experience were asked about it.
- Email Support from Program Officer: Year 2 83%. Year 1 78%.
- GCOS Web Portal: Year 2 69%. Year 1 75%.
- GoC Website: Year 2 60%. Year 1 56%.
- Phone Support from SC: Year 2 59%. Year 1 50%.
- Email Support from SC: Year 2 54%. Year 1 60%.
| Complete application in reasonable time | Experienced a problem | ||
|---|---|---|---|
| Year 2 | Year 1 | Year 1 | Year 1 |
| 51% | 56% | 25% | 20% |
| Service attribute performance | ||
|---|---|---|
| Strengths | Year 2 | Year 1 |
| Determine if your organization is eligible for YESS funding | 89% | 80% |
| I was confident that my personal information was protected | 85% | 88% |
| Find general information about YESS | 84% | 87% |
| Find out what information you need to provide when applying | 84% | 80% |
| Areas for improvement | Year 2 | Year 1 |
| it was clear what would happen next and when | 45% | 52% |
| The amount of time it took from gathering information to getting a decision was reasonable | 43% | 48% |
| Completing the budget document | 41% | 60% |
| Determine amount of time each phase is anticipated to take | 39% | - |
Base: YESS applicants – Year 2 (n=152); Year 1 (n=25*) *small sample size
Note: Figures for ‘[PROGRAM] web portal’ is reported in Year 1 and compared with ‘GCOS web portal’ in Year 2.
Significantly higher / lower than total
Significantly higher/lower than Year 1
Union Training and Innovation Program (UT&IP)
Program level-highlights
| Satisfaction | |
|---|---|
| Overall service experience | |
| Year 2 | Year 1 |
| 78% | 73% |
| Ease | |
|---|---|
| Overall, it was easy for me to apply | |
| Year 2 | Year 1 |
| 72% | 54% |
| Effectiveness | |
|---|---|
| I was able to move smoothly through all of the steps | |
| Year 2 | Year 1 |
| 75% | 62% |
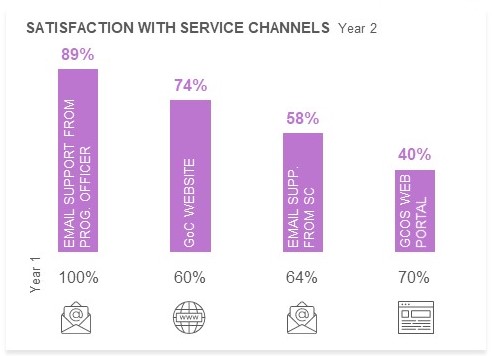
Figure 14: Satisfaction with Service Channels
This vertical bar chart shows responses to a question about how satisfied or dissatisfied the applicant was with the service they received from the service channels they used throughout the application process and presents results for Year 1 and Year 2. Respondents were asked to provide ratings on a 5-pt scale and results were grouped by those who provided a rating of 4 or 5. Sample sizes vary by service channel, only those who used each channel during their experience were asked about it.
- Email Support from Program Officer: Year 2 89%. Year 1 100%.
- GoC Website: Year 2 74%. Year 1 60%.
- Email Support from SC: Year 2 58%. Year 1 64%.
- GCOS Web Portal: Year 2 40%. Year 1 70%.
| Complete application in reasonable time | Experienced a problem | ||
| Year 2 | Year 1 | Year 1 | Year 1 |
| 53% | 42% | 9% | 19% |
| Service attribute performance | ||
|---|---|---|
| Strengths | Year 2 | Year 1 |
| Determine when the application period for UT&IP takes place | 100% | - |
| Determine if your organization is eligible for UT&IP | 100% | 69% |
| I was confident my personal information was protected | 97% | 81% |
| Areas for improvement | Year 2 | Year 1 |
| The amount of time it took was reasonable | 59% | 58% |
| Completing the budget document | 59% | 39% |
| Understanding the requirements of the application | 59% | 39% |
| Completing the project timeline | 56% | 42% |
Base: UT&IP applicants – Year 2 (n=32); Year 1 (n=26*)
Analysis was also conducted by program stream and no statistically significant differences were observed in survey responses due in part to small samples sizes among applicants to either stream. Investments in Training Equipment (n=24*); Innovation and Apprenticeship (n=8**)
Note: Figures for ‘[PROGRAM] web portal’ is reported in Year 1 and compared with ‘GCOS web portal’ in Year 2.
*small sample size
Significantly higher / lower than total
Significantly higher/lower than Year 1
Early Lerning and Child Care Innovation (EL&CCI)
Program level-highlights
| Satisfaction | |
|---|---|
| Overall service experience | |
| Year 2 | Year 1 |
| 19% | 60% |
| Ease | |
|---|---|
| Overall, it was easy for me to apply | |
| Year 2 | Year 1 |
| 32% | 60% |
| Effectiveness | |
|---|---|
| I was able to move smoothly through all of the steps | |
| Year 2 | Year 1 |
| 40% | 40% |
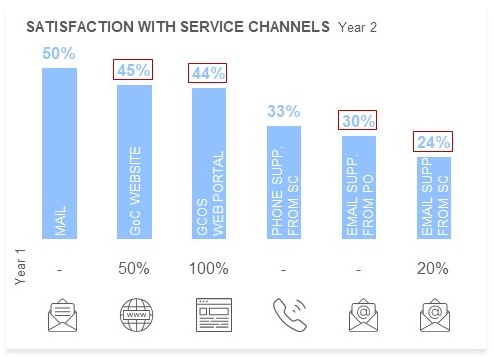
Figure 15: Satisfaction with Service Channels
This vertical bar chart shows responses to a question about how satisfied or dissatisfied the applicant was with the service they received from the service channels they used throughout the application process and presents results for Year 1 and Year 2. Respondents were asked to provide ratings on a 5-pt scale and results were grouped by those who provided a rating of 4 or 5. Sample sizes vary by service channel, only those who used each channel during their experience were asked about it.
- Mail: Year 2 50%.
- GoC Website: Year 2 45%. Year 1 50%.
- GCOS Web Portal: Year 2 44%. Year 1 100%.
- Phone Support from SC: Year 2 33%.
- Email Support from Program Officer: Year 2 30%.
- Email Support from SC: Year 2 24%. Year 1 20%.
| Complete application in reasonable time | Experienced a problem | ||
|---|---|---|---|
| Year 2 | Year 1 | Year 1 | Year 1 |
| 35% | 60% | 52% | 20% |
| Service attribute performance | ||
|---|---|---|
| Strengths | Year 2 | Year 1 |
| Determine the steps to apply for funding | 68% | 100% |
| I was confident my personal information was protected | 63% | 80% |
| Understand the information about EL&CCI | 62% | - |
| Completing steps online made the process easier | 61% | 100% |
| Areas for improvement | Year 2 | Year 1 |
| The amount of time from gathering information to getting a decision was reasonable | 22% | - |
| It was clear what would happen next and when it would happen. | 20% | 60% |
| Determine amount of time each phase is anticipated to take | 19% | - |
Base: EL&CCI applicants – Year 2 (n=65); Year 1 (n=5**)
Note: Figures for ‘[PROGRAM] web portal’ is reported in Year 1 and compared with ‘GCOS web portal’ in Year 2 .
** very small sample size
Significantly higher / lower than total
Significantly higher/lower than Year 1
Social Development Partnerships (SDPP)
Program level-highlights
| Satisfaction | |
|---|---|
| Overall service experience | |
| Year 2 | Year 1 |
| 72% | 53% |
| Ease | |
|---|---|
| Overall, it was easy for me to apply | |
| Year 2 | Year 1 |
| 69% | 59% |
| Effectiveness | |
|---|---|
| I was able to move smoothly through all of the steps | |
| Year 2 | Year 1 |
| 71% | 65% |
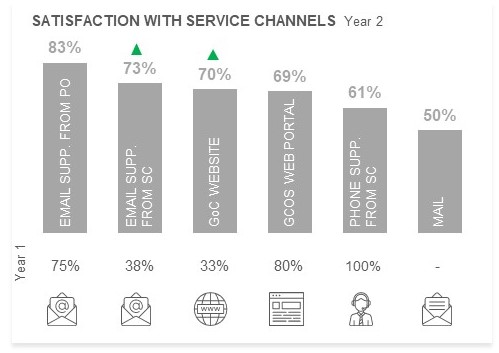
Figure 16: Satisfaction with Service Channels
This vertical bar chart shows responses to a question about how satisfied or dissatisfied the applicant was with the service they received from the service channels they used throughout the application process and presents results for Year 1 and Year 2. Respondents were asked to provide ratings on a 5-pt scale and results were grouped by those who provided a rating of 4 or 5. Sample sizes vary by service channel, only those who used each channel during their experience were asked about it.
- Email Support from Program Officer: Year 2 83%. Year 1 75%.
- Email Support from SC: Year 2 73%. Year 1 38%.
- GoC Website: Year 2 70%. Year 1 33%.
- GCOS Web Portal: Year 2 69%. Year 1 80%.
- Phone Support from SC: Year 2 61%. Year 1 100%.
- Mail: Year 2 50%.
| Complete application in reasonable time | Experienced a problem | ||
|---|---|---|---|
| Year 2 | Year 1 | Year 1 | Year 1 |
| 61% | 47% | 33% | 47% |
| Service attribute performance | ||
|---|---|---|
| Strengths | Year 2 | Year 1 |
| Service Canada phone representatives were helpful | 82% | 100% |
| Completing steps online made the process easier | 80% | 60% |
| I was confident that my personal information was protected | 80% | 88% |
| Areas for improvement | Year 2 | Year 1 |
| The amount of time from gathering information to getting a decision was reasonable | 50% | 29% |
| It was clear what would happen next and when it would happen. | 46% | 53% |
| Determine amount of time each phase is anticipated to take | 40% | - |
Base: SDPP applicants – Year 2 (n=153); Year 1 (n=17*)
Analysis was also conducted by program stream and no statistically significant differences were observed in survey responses due in part to small samples sizes among applicants to two of the three streams. Supporting Black Canadian Communities (n=128); Supporting Black Canadian Communities – West Intermediaries (n=19*); Disability – Community Inclusion Initiative (n=6**)
Note: Figures for ‘[PROGRAM] web portal’ is reported in Year 1 and compared with ‘GCOS web portal’ in Year 2.
*small sample size
Significantly higher / lower than total
Significantly higher/lower than Year 1
Program Levels Highlights- New Programs Added in Year 2
Please note that the following programs were added in Year 2 and as such, there is no Year 1 data for comparison.
- Foreign credential recognition program (fcrp)
- Indigenous early learning and childcare (ielcc)
- Innovative work integrated learning initiative (iwili)
- Student work placement (swp)
- Sustainable development goals (sdg)
Foreign Credential Recognition Program (FCRP)
Program level-highlights
| Satisfaction |
|---|
| Overall service experience |
| 65% |
| Ease |
|---|
| Overall, it was easy for me to apply |
| 50% |
| Effectiveness |
|---|
| I was able to move smoothly through all of the steps |
| 65% |
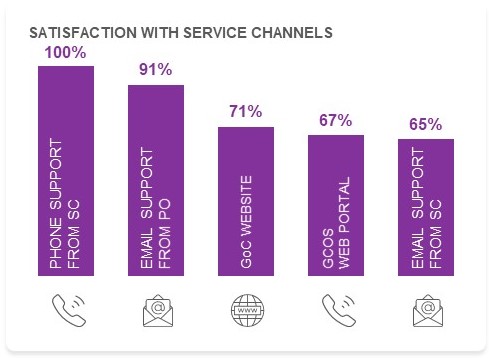
Figure 17: Satisfaction with Service Channels
This vertical bar chart shows responses to a question about how satisfied or dissatisfied the applicant was with the service they received from the service channels they used throughout the application process. Respondents were asked to provide ratings on a 5-pt scale and results were grouped by those who provided a rating of 4 or 5. Sample sizes vary by service channel, only those who used each channel during their experience were asked about it.
- Phone Support from SC: 100%
- Email Support from Program Officer: 91%
- GoC Website: 71%
- GCOS Web Portal: 67%
- Email Support from SC: 100%
| Complete application in reasonable time | Experienced a problem |
|---|---|
| 70% | 25% |
| Service attribute performance | |
|---|---|
| Strengths | |
| I was confident that my personal information was protected | 90% |
| Meeting the requirements of the application | 85% |
| Find out what information you need to provide when applying | 83% |
| Areas for improvement | |
| It was clear what would happen next and when it would happen | 50% |
| Completing the budget document | 50% |
| I needed to explain my situation only once | 54% |
| Determine amount of time each phase is anticipated to take | 42% |
Base: FCRP applicants (n=20*)
*small sample size
Significantly higher / lower than total
Indigenous Early Learning and Childcare (IELCC)
Program level-highlights
| Satisfaction |
|---|
| Overall service experience |
| 75% |
| Ease |
|---|
| Overall, it was easy for me to apply |
| 63% |
| Effectiveness |
|---|
| I was able to move smoothly through all of the steps |
| 50% |
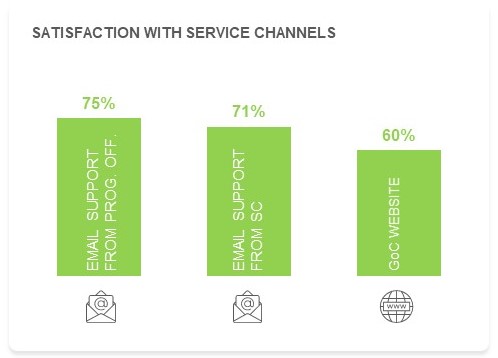
Figure 18: Satisfaction with Service Channels
This vertical bar chart shows responses to a question about how satisfied or dissatisfied the applicant was with the service they received from the service channels they used throughout the application process. Respondents were asked to provide ratings on a 5-pt scale and results were grouped by those who provided a rating of 4 or 5. Sample sizes vary by service channel, only those who used each channel during their experience were asked about it.
- Email Support from Program Officer: 75%
- Email Support from SC: 71%
- GoC Website: 60%
| Complete application in reasonable time | Experienced a problem |
|---|---|
| 63% | 25% |
| Service attribute performance | |
|---|---|
| Strengths | |
| I was confident that my personal information was protected | 75% |
| Determine when the application period for IELCC takes place | 67% |
| Determine if your organization is eligible for funding | 67% |
| Find general information about IELCC | 67% |
| Understand the information about IELCC | 67% |
| Find out what information you need to provide when applying | 67% |
| Areas for improvement | |
| Determine amount of time each phase is anticipated to take | 33% |
| Determine the steps to apply for funding | 33% |
| Putting together the information you needed to apply for IELCC | 25% |
| Completing the budget document | 25% |
Base: IELCC applicants (n=8*)
** very small sample size
Significantly higher / lower than total
Innovative Work Integrated Learning Initiative (IWILI)
Program level-highlights
| Satisfaction |
|---|
| Overall service experience |
| 62% |
| Ease |
|---|
| Overall, it was easy for me to apply |
| 69% |
| Effectiveness |
|---|
| I was able to move smoothly through all of the steps |
| 69% |
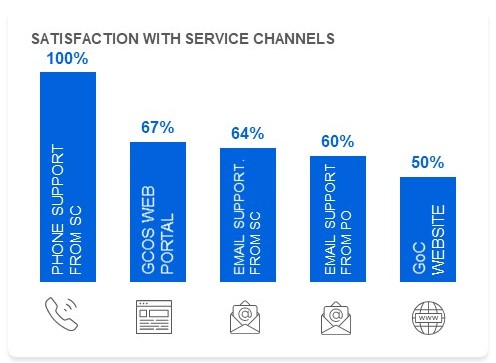
Figure 19: Satisfaction with Service Channels
This vertical bar chart shows responses to a question about how satisfied or dissatisfied the applicant was with the service they received from the service channels they used throughout the application process. Respondents were asked to provide ratings on a 5-pt scale and results were grouped by those who provided a rating of 4 or 5. Sample sizes vary by service channel, only those who used each channel during their experience were asked about it.
- Phone Support from SC: 100%
- GCOS Web Portal: 67%
- Email Support from SC: 64%
- Email Support from Program Officer: 60%
- GoC Website: 50%
| Complete application in reasonable time | Experienced a problem |
|---|---|
| 85% | 33% |
| Service attribute performance | |
|---|---|
| Strengths | |
| Determine the steps to apply for funding | 83% |
| Find general information about IWILCI | 83% |
| Areas for improvement | |
| Being able to complete steps online made the process easier for me | 33% |
| Completing the budget document | 31% |
| Completing the project timeline | 23% |
Base: IWILCI applicants (n=13*)
* small sample size
Significantly higher / lower than total
Student Work Placement (SWP)
Program level-highlights
| Satisfaction |
|---|
| Overall service experience |
| 75% |
| Ease |
|---|
| Overall, it was easy for me to apply |
| 25% |
| Effectiveness |
|---|
| I was able to move smoothly through all of the steps |
| 0% |
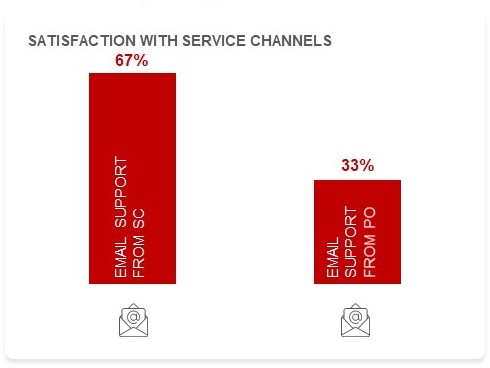
Figure 20: Satisfaction with Service Channels
This vertical bar chart shows responses to a question about how satisfied or dissatisfied the applicant was with the service they received from the service channels they used throughout the application process. Respondents were asked to provide ratings on a 5-pt scale and results were grouped by those who provided a rating of 4 or 5. Sample sizes vary by service channel, only those who used each channel during their experience were asked about it.
- Email Support from SC: 67%
- Email Support from Program Officer: 33%
| Complete application in reasonable time | Experienced a problem |
|---|---|
| 50% | 75% |
| Service attribute performance | |
|---|---|
| Strengths | |
|
100% |
| Areas for improvement | |
|
25% |
Base: SWP applicants (n=4**)
* very small sample size
Sustainable Development Goals (SDG)
Program level-highlights
| Satisfaction |
|---|
| Overall service experience |
| 39% |
| Ease |
|---|
| Overall, it was easy for me to apply |
| 59% |
| Effectiveness |
|---|
| I was able to move smoothly through all of the steps |
| 54% |
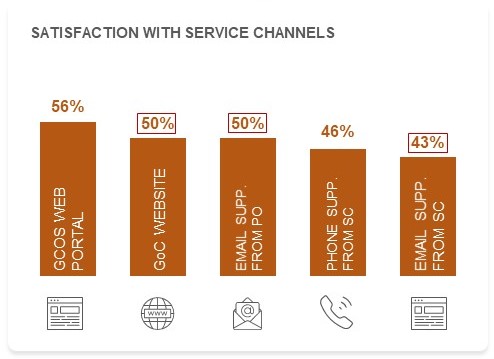
Figure 21: Satisfaction with Service Channels
This vertical bar chart shows responses to a question about how satisfied or dissatisfied the applicant was with the service they received from the service channels they used throughout the application process. Respondents were asked to provide ratings on a 5-pt scale and results were grouped by those who provided a rating of 4 or 5. Sample sizes vary by service channel, only those who used each channel during their experience were asked about it.
- GCOS Web Portal: 56%
- GoC Website: 50%
- Email Support from Program Officer: 50%
- Phone Support from SC: 46%
- Email Support from SC: 43%
| Complete application in reasonable time | Experienced a problem |
|---|---|
| 51% | 46% |
| Service attribute performance | |
|---|---|
| Strengths | |
| Being able to complete steps online made the process easier for me | 78% |
| Determine when the application period for SDG takes place | 71% |
| I was confident that my personal information was protected | 64% |
| Areas for improvement | |
| It was clear what would happen next and when it would happen | 26% |
| The amount of time from gathering information to getting a decision was reasonable | 23% |
| Determine the amount of time each phase of the application process is anticipated to take | 18% |
Base: SDG applicants (n=39*)
* small sample size
Significantly higher / lower than total
Service Channel Assessments
Satisfaction with Service Channels
- Satisfaction with service has increased compared to Year 1 among those using the GCOS web portal (+9 pts), Government of Canada website (+5 pts) and those who received email support from a Service Canada office (+5 pts). At eight in ten (79%), applicants remained most satisfied with email support from a program officer. Three-quarters (76%) were satisfied with the GCOS web portal and seven in ten for the Government of Canada website (71%) and email support form a Service Canada office (70%). Six in ten were satisfied with in-person service at a Service Canada office (62%), telephone support from a Service Canada office (61%) and mail (58%). Satisfaction remained lowest for the 1 800 O-Canada phone line (48%).
How satisfied or dissatisfied were you with the overall quality of service you received from each of the following?
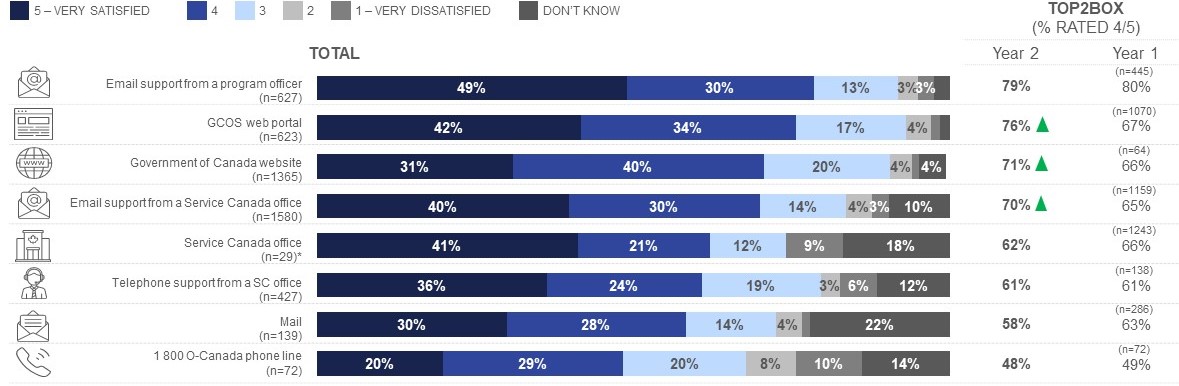
Figure 22: Satisfaction with Service Channels
This horizontal bar chart shows responses to a question about how satisfied or dissatisfied the applicant was with the overall quality of service provided by the service channels used during the applicant process and presents results for Year 1 and Year 2. Respondents were asked to provide ratings on a 5-pt scale. Sample sizes vary by service channel, only those who used each channel during their experience were asked about it.
- Email support from a Program Officer: Year 2 49% very satisfied, 30% somewhat satisfied, 13% neutral, 3% somewhat dissatisfied, 3% very dissatisfied, 2% Don’t know. 79% very/somewhat satisfied. A total of 627 respondents answered this question. Year 1 80% very/somewhat satisfied.
- GCOS Web portal: Year 2 42% very satisfied, 34% somewhat satisfied, 17% neutral, 4% somewhat dissatisfied, 2% very dissatisfied, 2% Don’t know. 76% very/somewhat satisfied. A total of 623 respondents answered this question. Year 1 67% very/somewhat satisfied.
- Government of Canada website: Year 2 31% very satisfied, 40% somewhat satisfied, 20% neutral, 4% somewhat dissatisfied, 2% very dissatisfied, 4% Don’t know. 71% very/somewhat satisfied. A total of 1365 respondents answered this question. Year 1 66% very/somewhat satisfied.
- Email support from a Service Canada office: Year 2 40% very satisfied, 30% somewhat satisfied, 14% neutral, 4% somewhat dissatisfied, 3% very dissatisfied, 10% Don’t know. 70% very/somewhat satisfied. A total of 1580 respondents answered this question. Year 1 65% very/somewhat satisfied.
- Service Canada office: Year 2 41% very satisfied, 21% somewhat satisfied, 12% neutral, 9% somewhat dissatisfied, 18% very dissatisfied, 0% Don’t know. 62% very/somewhat satisfied. A total of 29 respondents answered this question. Year 1 66% very/somewhat satisfied.
- Telephone support from a Service Canada office: Year 2 36% very satisfied, 24% somewhat satisfied, 19% neutral, 3% somewhat dissatisfied, 6% very dissatisfied, 12% Don’t know. 61% very/somewhat satisfied. A total of 286 respondents answered this question. Year 1 66% very/somewhat satisfied.
- Mail: Year 2 30% very satisfied, 28% somewhat satisfied, 14% neutral, 4% somewhat dissatisfied, 1% very dissatisfied, 22% Don’t know 58% very/somewhat satisfied. A total of 139 respondents answered this question. Year 1 63% very/somewhat satisfied.
- 1800 O-Canada phone line: Year 2 20% very satisfied, 29% somewhat satisfied, 20% neutral, 8% somewhat dissatisfied, 10% very dissatisfied, 14% Don’t know. 48% very/somewhat satisfied. A total of 72 respondents answered this question. Year 1 49% very/somewhat satisfied.
Q26. On a scale from 1 to 5, where 1 means very dissatisfied and 5 means very satisfied, how satisfied or dissatisfied were you with the overall quality of service you received from each of the following?
Base: Used channel at aware, apply or follow-up stage. Note: Figures for ‘[PROGRAM] web portal’ is reported in Year 1 and compared with ‘GCOS web portal’ in Year 2.
Note: values less than 3% not labelled
* small sample size
** very small sample size
Significantly higher/lower than Year 1
Satisfaction with Service Channels by Program
- Applicants to EL&CCI and SDG were less satisfied with nearly all service channels used during their experience, while applicants to YESS were less satisfied with the GoC website and email support from a Service Canada office. NHSP applicants were more likely to be satisfied with email support from a Service Canada office.
- Compared to Year 1, applicants to CSJ and SDPP were more likely to be satisfied with the GoC website and email support form a Service Canada office. CSJ applicants were also more likely to be satisfied with the GCOS web portal. Satisfaction with service channels for all other programs remained statistically consistent.
How satisfied or dissatisfied were you with the overall quality of service you received from each of the following?
| TOP2BOX (% RATED 4/5) | |||||||||||||||||||||||
|---|---|---|---|---|---|---|---|---|---|---|---|---|---|---|---|---|---|---|---|---|---|---|---|
| TOTAL | EAF | NHSP | CSJ | YESS (formerly SL/CF) | UT&IP | EL&CCI | SDPP | FCRP | IELC | IWILI | SWP | SDG | All but EAF, NHSP, CSJ | ||||||||||
| Year 2 | Year 1 | Year 2 | Year 1 | Year 2 | Year 1 | Year 2 | Year 1 | Year 2 | Year 1 | Year 2 | Year 1 | Year 2 | Year 1 | Year 2 | Year 1 | Year 2 | Year 2 | Year 2 | Year 2 | Year 2 | Year 2 | Year 1 | |
| Email support from a Program Officer | (n=74) | (n=12*) | (n=141) | (n=140) | (n=213) | (n=249) | (n=76) | (n=9**) | (n=9**) | (n=3**) | (n=30) | (n=0) | (n=43) | (n=8**) | (n=11*) | (n=4**) | (n=5**) | (n=3**) | (n=18*) | (n=199) | (n=44) | ||
| 79% | 80% | 80% | 83% | 80% | 81% | 80% | 80% | 83% | 78% | 89% | 100% | 30% | - | 83% | 75% | 91% | 75% | 60% | 33% | 50% | 69% | 76% | |
| GCOS web portal | (n=27*) | (n=30) | (n=69) | (n=177) | (n=375) | (n=803) | (n=88) | (n=24*) | (n=5**) | (n=10**) | (n=18*) | (n=1*) | (n=23*) | (n=5*) | (n=3**) | (n=0) | (n=3**) | (n=3**) | (n=9**) | (n=152) | (n=60) | ||
| 76% | 67% | 78% | 77% | 73% | 67% | 77% | 66% | 69% | 75% | 40% | 70% | 44% | 100% | 69% | 80% | 67% | - | 67% | - | 56% | 62% | 75% | |
| Government of Canada website | (n=150) | (n=42) | (n=252) | (n=301) | (n=621) | (n=728) | (n=117) | (n=18*) | (n=19*) | (n=20*) | (n=47) | (n=2**) | (n=100) | (n=12*) | (n=14*) | (n=5**) | (n=8**) | (n=2**) | (n=30) | (n=342) | (n=88) | ||
| 71% | 66% | 72% | 76% | 74% | 70% | 71% | 65% | 60% | 56% | 74% | 60% | 45% | 50% | 70% | 33% | 71% | 60% | 50% | - | 50% | 60% | 51% | |
| Email support from a Service Canada office | (n=165) | (n=50) | (n=323) | (n=356) | (n=675) | (n=738) | (n=116) | (n=15*) | (n=31) | (n=25*) | (n=59) | (n=5**) | (n=138) | (n=16*) | (n=17*) | (n=7**) | (n=11*) | (n=3**) | (n=35) | (n=417) | (n=99) | ||
| 70% | 65% | 64% | 68% | 76% | 72% | 71% | 64% | 54% | 60% | 58% | 64% | 24% | 20% | 73% | 38% | 65% | 71% | 64% | 67% | 43% | 58% | 55% | |
| Service Canada office | (n=2**) | (n=2**) | (n=12*) | (n=24*) | (n=10**) | (n=33) | (n=2**) | (n=0) | (n=0) | (n=0) | (n=0) | (n=1**) | (n=2**) | (n=0) | (n=0) | (n=0) | (n=0) | (n=0) | (n=1**) | (n=5** | (n=5**) | ||
| 62% | 66% | - | 50% | 75% | 71% | 60% | 67% | 100% | - | - | - | - | - | 50% | - | - | - | - | - | - | 45% | 38% | |
| Telephone support from a Service Canada office | (n=81) | (n=17*) | (n=82) | (n=80) | (n=155) | (n=159) | (n=51) | (n=12*) | (n=3**) | (n=3**) | (n=6**) | (n=0) | (n=33) | (n=2**) | (n=2**) | (n=0) | (n=2**) | (n=1**) | (n=11*) | (n=109) | (n=30) | ||
| 61% | 61% | 65% | 65% | 68% | 68% | 59% | 60% | 59% | 50% | - | 67% | 33% | - | 61% | 100% | 100% | - | 100% | - | 46% | 55% | 63% | |
| (n=15*) | (n=2**) | (n=52) | (n=81) | (n=46) | (n=49) | (n=6**) | (n=2**) | (n=3**) | (n=0) | (n=2**) | (n=0) | (n=14) | (n=1*) | (n=0) | (n=0) | (n=1**) | (n=0) | (n=0) | (n=26*) | (n=6*) | |||
| 58% | 63% | 47% | 100% | 56% | 56% | 61% | 65% | 83% | 50% | - | - | 50% | - | 50% | - | - | - | - | - | - | 53% | 30% | |
| 1-800 O-Canada phone line | (n=6*) | (n=2*) | (n=18*) | (n=25*) | (n=37) | (n=44) | (n=1**) | (n=0) | (n=0) | (n=0) | (n=2*) | (n=0) | (n=5*) | (n=0) | (n=0) | (n=1*) | (n=0) | (n=0) | (n=2*) | (n=11*) | (n=1*) | ||
| 48% | 49% | 67% | - | 50% | 68% | 49% | 48% | - | - | - | - | - | - | 71% | - | - | - | - | - | - | 30% | 100% | |
Q26. On a scale from 1 to 5, where 1 means very dissatisfied and 5 means very satisfied, how satisfied or dissatisfied were you with the overall quality of service you received from each of the following?
Base: Used channel at aware, apply or follow-up stage
* small sample size
** very small sample size
Significantly higher / lower than totalSignificantly higher/lower than Year 1
Number of Contacts with Service Channels
- Consistent with Year 1, there were significant differences in the number of contacts applicants had with Service Canada depending on the channel they used.
- Applicants who went to a Service Canada office, called 1-800 O-Canada and to a lesser extent communicated with the Government of Canada by mail or called a Service Canada office directly were more likely to have been in contact with Service Canada only once during their experience. Those who used the GCOS web portal, went online to the Government of Canada website or emailed a program officer directly were much more likely to have used the channel 5 times or more.
- Compared to Year 1, applicants report using the GCOS web portal more times and having fewer contacts emailing a Service Canada office or calling 1-800 O-Canada
Thinking about your overall experience, how many times did you use each of the following?
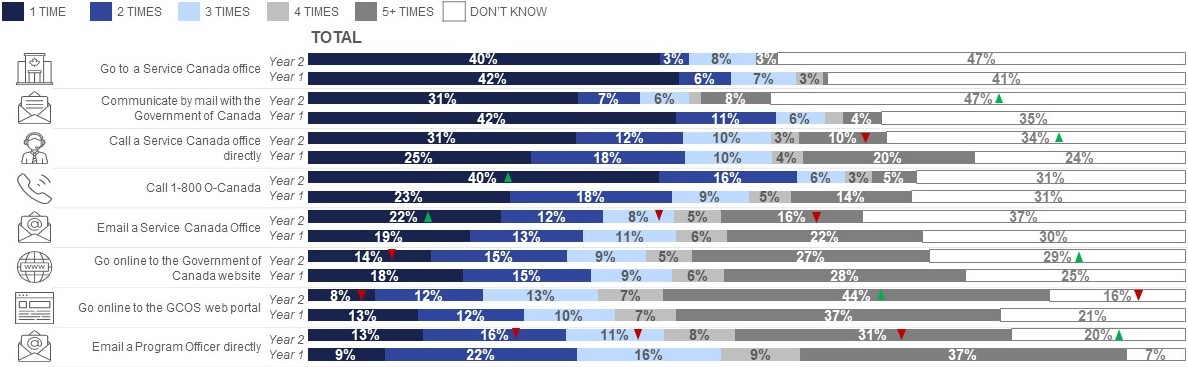
Figure 23: Number of Contacts with Service Channels
This horizontal bar chart shows responses to a question about how many times the applicant used each service channels during their experience and presents results for Year 1 and Year 2. Sample sizes vary by service channel, only those who used each channel during their experience were asked about it.
- Go to a Service Canada office: Year 2 40% one time, 3% two times, 8% three times, 3% four times, 0% five or more times, 47% Don’t know. Year 1 42% one time, 6% two times, 7% three times, 3% four times, 1% five or more times, 41% Don’t know.
- Communicate by mail with the Government of Canada: Year 2 31% one time, 7% two times, 6% three times, 2% four times, 8% five or more times, 47% Don’t know. Year 1 42% one time, 11% two times, 6% three times, 2% four times, 4% five or more times, 35% Don’t know.
- Call a Service Canada office directly: Year 2 31% one time, 12% two times, 10% three times, 3% four times, 10% five or more times, 34% Don’t know. Year 1 25% one time, 18% two times, 10% three times, 4% four times, 20% five or more times, 24% Don’t know.
- Call 1800 O-Canada: Year 2 40% one time, 16% two times, 6% three times, 3% four times, 5% five or more times, 31% Don’t know. Year 1 23% one time, 18% two times, 9% three times, 5% four times, 14% five or more times, 31% Don’t know.
- Email a Service Canada Office: Year 2 22% one time, 12% two times, 8% three times, 5% four times, 16% five or more times, 37% Don’t know. Year 1 19% one time, 13% two times, 11% three times, 6% four times, 22% five or more times, 30% Don’t know.
- Go online to the Government of Canada website: Year 2 14% one time, 15% two times, 9% three times, 5% four times, 27% five or more times, 29% Don’t know. Year 1 18% one time, 15% two times, 9% three times, 6% four times, 28% five or more times, 25% Don’t know.
- Go online to the program they applied for web portal: Year 2 13% one time, 12% two times, 13% three times, 7% four times, 44% five or more times, 16% Don’t know. Year 1 13% one time, 12% two times, 10% three times, 7% four times, 37% five or more times, 21% Don’t know.
- Email a Program Officer directly: Year 2 13% one time, 16% two times, 11% three times, 8% four times, 31% five or more times, 20% Don’t know. Year 1 9% one time, 22% two times, 16% three times, 9% four times, 37% five or more times, 7% Don’t know.
* small sample size
** very small sample size
Significantly higher/lower than Year 1
Q25. Thinking about your overall experience, how many times did you [IF MULTIPLE SOURCES ‘use each of the following’ IF ONLY ONE SOURCE ‘use the following’]? Please provide one response per item. If you are uncertain, please provide your best guess.
Base: Used channel at aware, apply or follow-up stage n=
Number of Contacts by Program
- Across all service channels, a greater proportion of applicants' report having been in contact with Service Canada 1 to 3 times and fewer 10+ times. Three in ten (28%, +13 pts) applicants were in contact with Service Canada 10 or more times, one in ten (13%, -2 pts) were in contact 7 to 9 times and two in ten (21%, -2 pts) 4 to 6 times or 1 to 3 times (19%, +7 pts).
- As observed in Year 1, satisfaction with the service experience declines by the number of times the client contacted Service Canada and continued to be lower among those who had 10 or more contacts through any channel during the client journey.
- Those applying to all programs but EAF, NHSP and CSJ and in particular YESS (55%, -17 pts), SDG (44%), and EL&CCI (38%, -26 pts) were more likely to have been in contact with Service Canada 10 or more times. Applicants to EAF were more likely to have been in contact 1 to 3 times.
- Compared to Year 1, applicants to CSJ were more likely to have been in contact with Service Canada 1 to 3 times (and fewer 10+ times), while applicants to EAF and all programs but EAF, NHSP and CSJ were less likely to report being in contact 10 or more times.
Thinking about your overall experience, how many times did you use each of the following?
| Number of contacts by program | |||||||||||||||||||||||||
|---|---|---|---|---|---|---|---|---|---|---|---|---|---|---|---|---|---|---|---|---|---|---|---|---|---|
| Total # of times | Overall satisfaction (% t2b) |
EAF | NHSP | CSJ | YESS (formerly SL/CF) | UT&IP | EL&CCI | SDPP | FCRP | IWILI | SWP | SDG | All but EAF, NHSP, CSJ | ||||||||||||
| Year 2 | Year 1 | Year 2 | Year 1 | Year 2 | Year 1 | Year 2 | Year 1 | Year 2 | Year 1 | Year 2 | Year 1 | Year 2 | Year 1 | Year 2 | Year 1 | Year 2 | Year 1 | Year 2 | Year 2 | Year 2 | Year 2 | Year 2 | Year 2 | Year 1 | |
| Base: All respondents – n= | 1942 | 1547 | 1905 | 1547 | 204 | 56 | 379 | 430 | 845 | 946 | 150 | 25* | 31 | 26* | 64 | 5** | 148 | 17* | 20* | 8* | 13* | 4* | 39 | 477 | 119 |
| 1-3 times | 19% | 12% | 83% | 79% | 26% | 14% | 21% | 18% | 18% | 12% | 9% | 8% | 10% | 8% | 9% | 20% | 19% | 12% | 15% | - | 15% | 25% | 5% | 13% | 8% |
| 4-6 times | 21% | 19% | 82% | 75% | 17% | 18% | 22% | 25% | 21% | 19% | 8% | 8% | 19% | 12% | 22% | - | 21% | 12% | 10% | - | - | - | 15% | 16% | 8% |
| 7-9 times | 13% | 15% | 76% | 75% | 12% | 14% | 16% | 16% | 13% | 15% | 5% | - | 3% | 8% | 8% | - | 10% | 12% | 10% | 13% | - | - | 5% | 8% | 4% |
| 10+ times | 28% | 41% | 73% | 62% | 20% | 36% | 21% | 26% | 29% | 42% | 55% | 72% | 29% | 35% | 38% | 60% | 23% | 41% | 60% | 13% | 54% | 50% | 44% | 37% | 61% |
| Don’t know | 20% | 13% | 76% | 69% | 25% | 18% | 20% | 15% | 19% | 12% | 24% | 12% | 39% | 39% | 23% | 20% | 26% | 24% | 5% | 75% | 15% | 25% | 31% | 27% | 19% |
Q25. Thinking about your overall experience, how many times did you [IF MULTIPLE SOURCES ‘use each of the following’ IF ONLY ONE SOURCE ‘use the following’]? Please provide one response per item. If you are uncertain, please provide your best guess.
* small sample size
** very small sample size
Significantly higher / lower than totalSignificantly higher/lower than Year 1
Barriers and Issue Resolution
Encountered a Problem – % Yes
- Just over one in five (22%) applicants encountered a problem or issue during the application process, a decrease of 13 points from Year 1.
- Those applying to EL&CCI, SDG, SDPP and NHSP were more likely to say they have encountered a problem.
- Compared to Year 1, CSJ applicants experienced the same decline as observed for the total of all programs.
Thinking about your overall experience getting information and applying for [PROGRAM], did you experience any problems or issues during this process? – % Yes
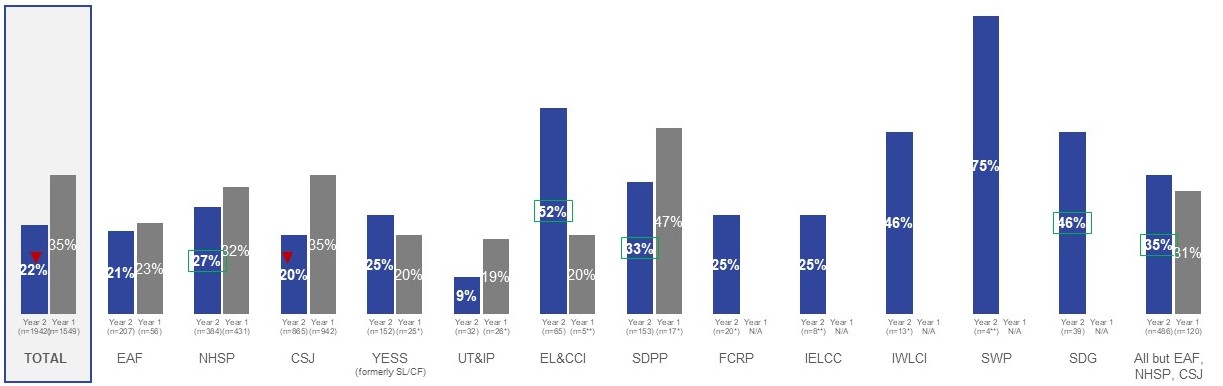
Figure 24: Encountered a Problem
This vertical bar chart shows responses to a question about whether the applicant experienced any problems or issues during the application process and presents results for Year 1 and Year 2
- Total: Year 2 22%. A total of 1942 respondents answered this question. Year 1 35%.
- EAF: Year 2 21% A total of 207 respondents answered this question. Year 1 23%.
- NHSP: Year 2 27%. A total of 384 respondents answered this question. Year 1 32%.
- CSJ: Year 2 20%. A total of 865 respondents answered this question. Year 1 35%.
- YESS: Year 2 25%. A total of 152 respondents answered this question. Year 1 20%.
- UT&IP: Year 2 9%. A total of 32 respondents answered this question. Year 1 19%.
- EL&CCI: Year 2 52%. A total of 65 respondents answered this question. Year 1 20%.
- SDPP: Year 2 33% A total of 153 respondents answered this question. Year 1 47%.
- FCRP: Year 2 25%. A total of 20 respondents answered this question.
- IELCC: Year 2 25%. A total of 8 respondents answered this question.
- IWLCI: Year 2 46%. A total of 13 respondents answered this question.
- SWP: Year 2 75%. A total of 8 respondents answered this question.
- SDG: Year 2 46%. A total of 39 respondents answered this question.
- ALL BUT EAF, NHSP, CSJ: Year 2 35%. A total of 486 respondents answered this question. Year 1 31%.
Q27. Thinking about your overall experience getting information and applying for [INSERT PROGRAM], did you experience any problems or issues during this process?
Base: All respondents n=1942
* small sample size
** very small sample size
Significantly higher / lower than total
Significantly higher/lower than Year 1
Explanation of Problem or Issue
- The most common problems or issues were that it took too long to receive a funding decision (34%), technical difficulties (27%), that it took too long to receive an update (23%), and that the application form was too long (21%).
- Compared to Year 1, fewer applicants reported experiencing most problems or issues, while a greater proportion said the process was complicated/time-consuming.
How would you describe the problem or issue you experienced?
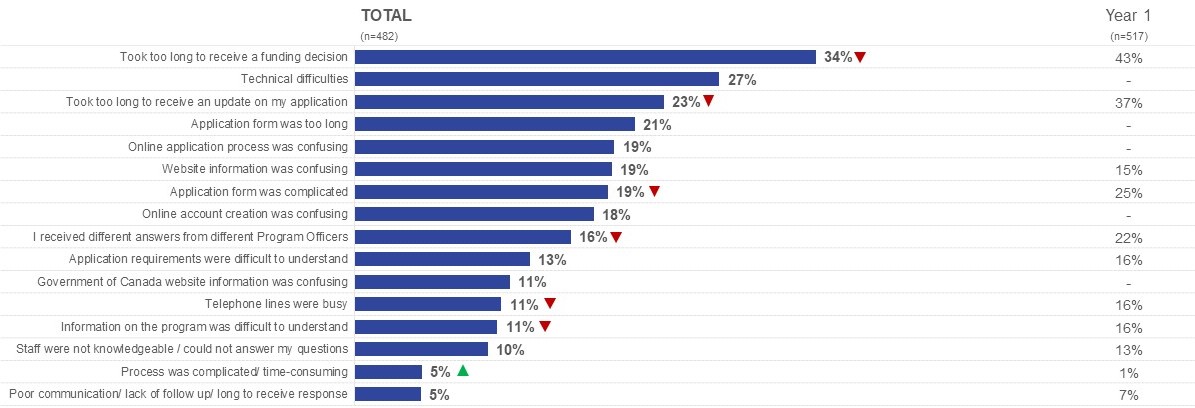
Figure 25: Explanation of Problem or Issue
This horizontal bar chart shows coded responses to an open-ended question about how the applicant would describe the problem or issue they experienced and presents results for Year 1 and Year 2. A total of 482 respondents from Year 2 who experienced problem or issue answered as follows:
- Took too long to receive a funding decision: Year 2 34%. Year 1 43%.
- Technical Difficulties. Year 2 27%.
- Took too long to receive an update on my application: Year 2 23%. Year 1 37%.
- Application form was too long: Year 2 21%.
- Online application portal was confusing: Year 2 30%.
- Website information was confusing: Year 2 19%. Year 1 15%.
- Application form was too complicated: Year 2 19%. Year 1 25%.
- Online account creation was confusing: Year 2 18%.
- I received different answers from different Program Officers: Year 2 16% Year 1 22%.
- Application requirements were difficult to understand: Year 2 13%. Year 1 16%.
- Government of Canada website information was confusing: Year 2 11%.
- Telephone lines were busy: Year 2 16%. Year 1 11%.
- Information on the program was difficult to understand: Year 2 11%. Year 1 16%.
- Staff were not knowledgeable / could not answer my questions: Year 2 10%Year 1 13%.
- Process was complicated/time-consuming: Year 2 5%. Year 1 1%.
- Poor communication/ lack of follow up/ long to receive response: Year 2 5%. Year 1 7%.
Note: Only responses of 3% or more for Year 2 are shown.
Q28. How would you describe the problem or issue you experienced?
Base: Experienced problem or issue (n=482)
Significantly higher/lower than Year 1
Explanation of Problem or Issue by Program
- Among those who experienced a problem or issue, EAF applicants were more likely to cite technical difficulties. Those applying to all programs but EAF, NHSP and CSJ were more likely to say that it took too long to receive their funding decision and an update on their application, application requirements were too difficult to understand and program information was difficult to understand. Those applying to EL&CCI were also more likely to say that staff were not knowledgeable and could not answer their questions, while NHSP were also more likely to say that the application requirements were too difficult to understand.
How would you describe the problem or issue you experienced?
| TOTAL | EAF | NHSP | CSJ | YESS (formerly SL/CF) | UT&IP | EL&CCI | SDPP | FCRP | IELC | IWILI | SWP | SDG | All but EAF, NHSP, CSJ | ||||||||||
|---|---|---|---|---|---|---|---|---|---|---|---|---|---|---|---|---|---|---|---|---|---|---|---|
| Year 2 | Year 1 | Year 2 | Year 1 | Year 2 | Year 1 | Year 2 | Year 1 | Year 2 | Year 1 | Year 1 | Year 2 | Year 1 | Year 2 | Year 1 | Year 2 | Year 2 | Year 2 | Year 2 | Year 2 | Year 2 | Year 2 | Year 2 | |
| Base: Experienced problem or issue – n= | 482 | 517 | 43 | 13* | 104 | 137 | 175 | 332 | 38 | 5** | 3** | 5** | 34 | 1** | 51 | 8* | 5** | 2** | 6* | 3** | 18* | 160 | 35 |
| Took too long to receive a funding decision | 34% | 43% | 23% | 39% | 20% | 39% | 33% | 43% | 61% | 60% | 33% | 20% | 77% | - | 57% | 25% | - | 50% | 17% | - | 72% | 62% | 44% |
| Technical difficulties | 27% | - | 42% | 33% | 27% | 26% | 33% | 21% | 9% | 40% | - | 33% | - | 11% | 15% | ||||||||
| Took too long to receive an update on my application | 23% | 37% | 19% | 31% | 11% | 18% | 21% | 38% | 45% | 80% | - | 20% | 53% | - | 55% | 38% | - | 100% | 33% | 33% | 39% | 48% | 42% |
| Application form was too long | 21% | 14% | 24% | 21% | 16% | 33% | 24% | 10% | 20% | 50% | 33% | - | 28% | 18% | |||||||||
| Online application process was confusing | 19% | 12% | 27% | 20% | 13% | - | 15% | 2% | - | - | 17% | - | 6% | 7% | |||||||||
| Website information was confusing | 19% | 15% | 16% | 23% | 15% | 14% | 20% | 15% | 13% | - | - | - | 18% | - | 9% | 13% | - | 50% | 50% | 33% | 39% | 18% | 19% |
| Application form was complicated | 19% | 19% | 21% | 18% | 13% | 67% | 29% | 13% | 20% | 50% | - | 33% | 28% | 20% | |||||||||
| Online account creation was confusing | 18% | 5% | 13% | 21% | 18% | 33% | 12% | 39% | 1% | - | - | 17% | - | 17% | 9% | ||||||||
| I received different answers from different Program Officers | 16% | 22% | 9% | 15% | 9% | 18% | 18% | 22% | 26% | 20% | 33% | - | 12% | - | 21% | 25% | - | 50% | 17% | - | 11% | 18% | 37% |
| Application requirements were difficult to understand | 13% | 16% | 14% | 46% | 21% | 31% | 9% | 14% | 8% | 20% | 33% | 20% | 24% | - | 25% | - | - | 50% | 17% | - | 28% | 22% | 22% |
| Government of Canada website information was confusing | 11% | 7% | 11% | 12% | 3% | - | 6% | 4% | - | - | 33% | - | 33% | 11% | |||||||||
| Telephone lines were busy | 11% | 16% | 2% | 23% | 7% | 10% | 13% | 16% | 5% | 40% | - | 20% | 9% | - | 10% | 13% | - | - | - | 33% | 11% | 9% | 11% |
| Information on the program was difficult to understand | 11% | 16% | 12% | 31% | 16% | 20% | 7% | 15% | 13% | 20% | - | 20% | 18% | 100% | 16% | 13% | - | 50% | 50% | - | 44% | 22% | 34% |
| Staff were not knowledgeable / could not answer my questions | 10% | 13% | 5% | 8% | 8% | 9% | 10% | 13% | 18% | - | 33% | 20% | 21% | 100% | 8% | - | - | 50% | - | - | 17% | 14% | 26% |
| Process was complicated/ time-consuming | 5% | 2% | 4% | 6% | 8% | - | 3% | - | - | - | - | 33% | 6% | 4% | |||||||||
| Poor communication/ lack of follow up/ long to receive response | 5% | 7% | 2% | 8% | 2% | 6% | 6% | 8% | 3% | - | - | - | 3% | - | 4% | - | 20% | - | - | - | 11% | 5% | 0% |
Note: Only responses of 3% or more for Year 2 Totals are shown.
Q28. How would you describe the problem or issue you experienced?
Base: Experienced problem or issue
* small sample size
** very small sample size
Significantly higher / lower than total
Significantly higher/lower than Year 1
Ease of Issue Resolution
- Among those who experienced a problem or issue, three in ten (29%) felt it was easily resolved which is consistent with Year 1.
- Those having experienced a problem or issue applying for EL&CCI were less likely to say their problem was easily resolved.
Please rate the following statement: The problem or issue was easily resolved.
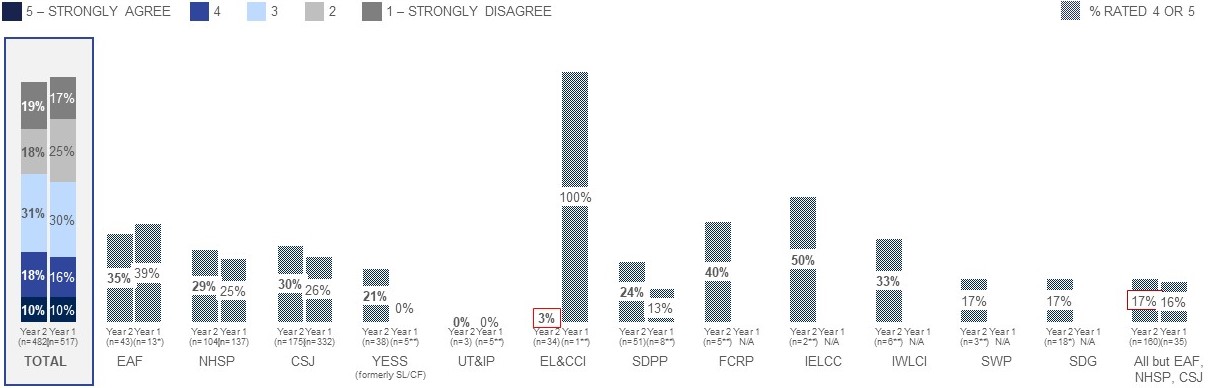
Figure 26: Ease of Issue Resolution
This vertical bar chart shows responses to a question about the extent to which the applicant agrees or disagrees that the problem or issue was easily resolved and presents results for Year 1 and Year 2. Those who experienced problem or issue answered as follows:
- Total: Year 2: 10% strongly agree, 18% somewhat agree, 31% neutral, 18% somewhat disagree, 19% strongly disagree. A total of 482 respondents answered this question. Year 1: 10% strongly agree, 16% somewhat agree, 30% neutral, 25% somewhat disagree, 17% strongly disagree.
- EAF: Year 2 35% strongly/somewhat agree. A total of 43 respondents answered this question. Year 1 39% strongly/somewhat agree.
- NHSP: Year 2 29% strongly/somewhat agree. A total of 104 respondents answered this question. Year 1 25% strongly/somewhat agree.
- CSJ: Year 2 30% strongly/somewhat agree. A total of 175 respondents answered this question. Year 1 26% strongly/somewhat agree.
- YEES: Year 2 21% strongly/somewhat agree. A total of 38 respondents answered this question. Year 1 0% strongly/somewhat agree.
- • UT&IP: Year 2 0% strongly/somewhat agree. A total of 3 respondents answered this question. Year 1 0% strongly/somewhat agree
- EL & CCI: Year 2 3% strongly/somewhat agree. A total of 34 respondent answered this question. Year 1 100% strongly/somewhat agree.
- SDPP: Year 2 24% strongly/somewhat agree. A total of 51 respondents answered this question. Year 1 13% strongly/somewhat agree.
- FCRP: Year 2 40% strongly/somewhat agree. A total of 5 respondents answered this question.
- IELCC: Year 2 50% strongly/somewhat agree. A total of 2 respondents answered this question.
- IWLCI: Year 2 33% strongly/somewhat agree. A total of 6 respondents answered this question.
- • SWP: Year 2 17% strongly/somewhat agree. A total of 3 respondents answered this question.
- SDG: Year 2 17% strongly/somewhat agree. A total of 18 respondents answered this question.
- ALL BUT EAF, NHSP, CSJ: Year 2 17% strongly/somewhat agree. A total of 160 respondents answered this question. Year 1 16% strongly/somewhat agree.
Q29. On a scale from 1 to 5, where 1 is strongly disagree and 5 is strongly agree, please rate the following statement: The problem or issue was easily resolved.
Base: Experienced problem or issue (n=482)
* small sample size
** very small sample size
Significantly higher / lower than total
Significantly higher/lower than Year 1
Drivers of Satisfaction
Drivers of satisfaction
The primary driver of satisfaction in the service experience is the helpfulness of Service Canada and 1-800 O-Canada phone representatives, followed by the amount of time it took from start to finish was reasonable, the ease of getting help when needed and clarity of the process.
- Other prominent drivers include the ease of finding information about the program, finding out what information is needed when applying and confidence in issue resolution.
When comparing the drivers of satisfaction between Year 1 and Year 2, the helpfulness of Service Canada phone representatives has increased in importance and become the primary driver of satisfaction, while timeliness of service has decreased in importance but remains the second most prominent driver overall.
- Other aspects of service which have increased in importance in driving satisfaction include the ease of getting help when needed and the ease of finding out what information needs to be provided when applying and putting together the information needed to apply.
- Aspects of service that have decreased in importance include needing to explain your situation only once, overall ease of applying and ease of completing the project timelines
Overall, the greatest opportunities to improve the service experience are improving the helpfulness of Service Canada phone representatives and the timeliness of service.
- In order to summarize what potential changes could result in an increase in overall satisfaction, the service attributes that most strongly drive satisfaction for Service Canada clients are determined and compared to Service Canada’s performance against these attributes.
- The resulting analysis found that common areas for potential improvement include improving the helpfulness of Service Canada phone reps and the timeliness of service. The most prominent secondary areas for improvement include the ease of getting assistance, clarity of process and confidence in issue resolution.
- The provision of service in either Official Language, the ease gained from completing steps online, ease of determining eligibility and ease of finding information about the program are relative strengths for the organization and areas that should be maintained.
- In Year 2, the primary driver of satisfaction in the service experience is the helpfulness of Service Canada phone representatives, followed by the amount of time it took from start to finish was reasonable, the ease of getting help when needed and clarity of process.
- The strength of the drivers’ analysis is strong and has an R2 of 0.63 (consistent with Year 1, 0.63).
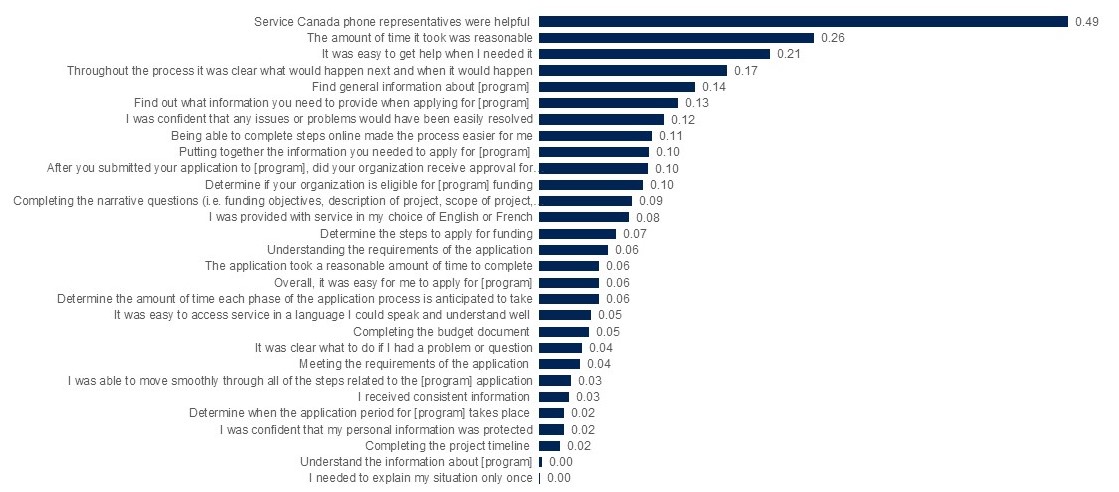
Figure 27: Drivers of Satisfaction
This horizontal bar chart shows results of a regression analysis that was conducted to identify the primary service attributes driving overall satisfaction with the service experience. Results were reported by impact score per service attribute as follows:
- Service Canada phone representatives were helpful 0.49
- The amount of time it took was reasonable 0.26
- It was easy for me to get help when I need it 0.21
- Throughout the process it was clear what would happen next and when it would happen 0.17
- Find general information about [program]: 0.14
- Find out what information you need to provide when applying for [program] 0.13
- I was confident that any issues or problems would have been easily resolved 0.12
- Being able to complete steps online made the process easier for me 0.11
- Putting together the information you needed to apply for [program] 0.10
- After you submitted your application to [program], did your organization receive approval for funding? 0.10
- Determine if your organization is eligible for [program] funding 0.10
- Completing the narrative questions (i.e. funding objectives, description of project, scope of project, etc.) 0.09
- I was provided with service in my choice of English or French 0.08
- Determine the steps to apply for funding 0.07
- Understand the information about [program] 0.06
- The application took a reasonable amount of time to complete 0.06
- Overall, it was easy for me to apply [program] 0.06
- Determine the amount of time each phase of the application process is anticipated to take 0.06
- It was easy to access service in a language I could speak and understand well 0.05
- Completing the budget document 0.05
- It was clear what to do if I had a problem or question 0.04
- Meeting the requirements of the application 0.04
- I was able to move smoothly through all of the steps related to the [program] application 0.03
- I received consistent information 0.03
- Determine when the application period for [program] takes place 0.02
- I was confident that my personal information was protected 0.02
- Completing the project timeline 0.02
- Understanding the requirements about the [program] 0.00
- I needed to explain my situation only once 0.00
R2 = 0.63
Change in Importance of Drivers of Satisfaction- Year 1 vs. Year 2
- When comparing the drivers of satisfaction between Year 1 and Year 2, there has been some notable changes in the importance of certain service attributes. The helpfulness of Service Canada phone representatives has increased in importance and become the primary driver of satisfaction, while timeliness of service has decreased in importance but remains the second most prominent driver overall.
- Other aspects of service which have increased in importance in driving satisfaction include the ease of getting help when needed and the ease of finding out what information needs to be provided when applying and putting together the information needed to apply. Aspects of service that have decreased in importance include needing to explain your situation only once, overall ease of applying and ease of completing the project timelines.
| Increased in importance | Decreased in importance |
|---|---|
| Service Canada phone representatives were helpful | The amount of time it took was reasonable |
| It was easy to get help when I needed it | I needed to explain my situation only once |
| Find out what information you need to provide when applying for [program] | Overall, it was easy for me to apply for [program] |
| Putting together the information you needed to apply for [program] | Completing the project timeline |
Priority Matrix – Overview
READER’S NOTE: This slide was intended to assist the reader in interpreting data shown in a priority matrix. A priority matrix has been used to identify priority improvement areas with respect to service interactions with applicants.
A priority matrix allows for decision makers to identify priorities for improvement by comparing how well applicants feel you have performed in an area with how much impact that area has on applicants’ overall satisfaction. It helps to answer the question ‘what can we do to improve satisfaction’. Each driver or component will fall into one of the quadrants explained below, depending on its impact on overall satisfaction and its performance score (provided by survey respondents).
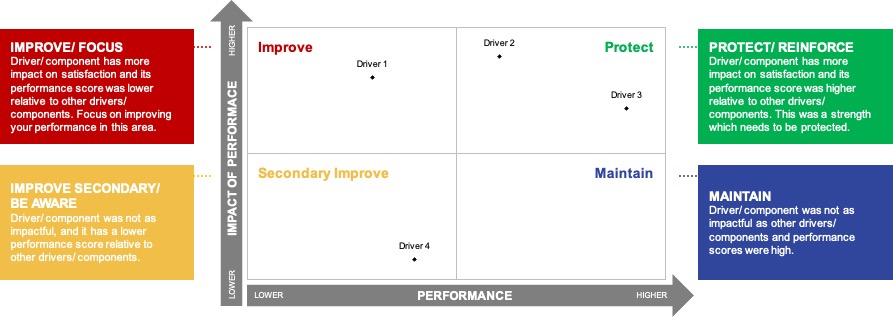
Overall Priority Matrix – Impact vs. Performance
- The greatest opportunities to improve the service experience are improving the helpfulness of Service Canada phone representatives and the timeliness of service. The most prominent secondary areas for improvement include the ease of getting assistance, clarity of process and confidence in issue resolution.
- The provision of service in either Official Language, the ease gained from completing steps online, ease of determining eligibility and ease of finding information about the program are relative strengths for the organization and areas that should be maintained.
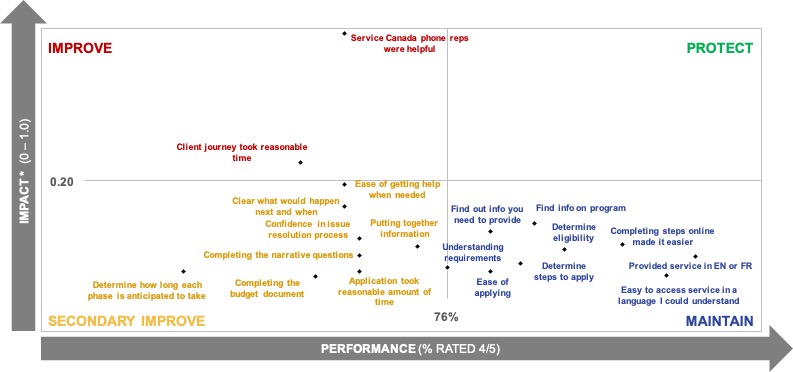
*factors with standardized coefficients below 0.05 were excluded
Pre-Application
Information Gathering about the Program
Channel Use Pre-Application to Learn About the Program
- At nearly six in ten (57%, +6 pts), applicants were most likely to have received an email from the GoC, ESDC, or the program they applied to during the aware stage, followed by half (48%) who went to the Government of Canada website for the program. One quarter (25%, -35 pts) went to the general Government of Canada website, or talked to peers/community network (23%, -6 pts).
- Compared to Year 1, a greater proportion received an email from the GoC, ESDC, or the program, while fewer talked to peers/community network or their MP.
Which of the following did you use to find out about [PROGRAM] before you applied?
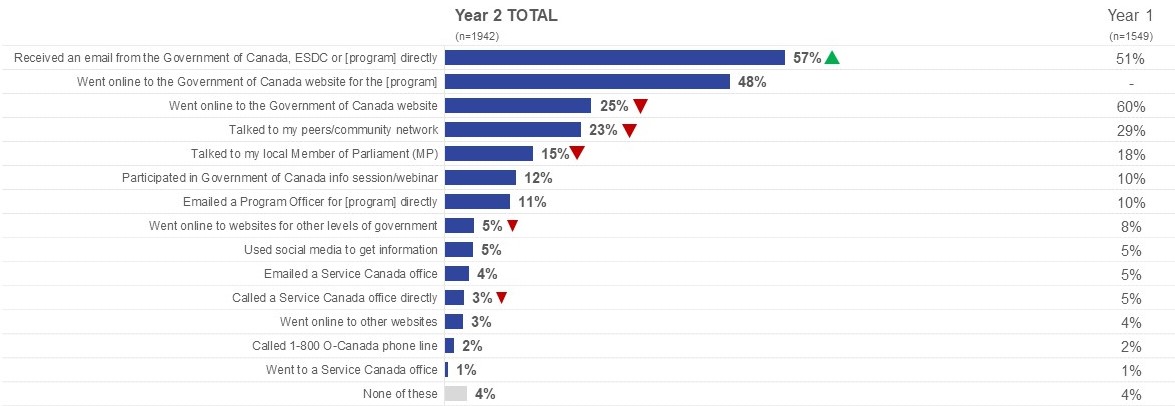
Figure 28: Channel use pre-application- to learn about the program
This horizontal bar chart shows responses to a question about which channels the applicant used to find out about the program before they applied and presents results for Year 1 and Year 2. All the 1942 respondents from Year 2 answered as follows:
- Received an email from the funding program directly: Year 2 57%. Year 1 51%.
- Went online to the Government of Canada website for the [program]: Year 2 48%.
- Went online to the Government of Canada website: Year 2 25%. Year 1 60%.
- Talked to my peers / community network: Year 2 23%. Year 1 29%.
- Talked to my local Member of Parliament (MP): Year 2 15%. Year 1 18%.
- Participated in Government of Canada info session / webinar. Year 2 11%. Year 1 10%.
- Emailed a Program Officer for [program] directly: Year 2 11%. Year 10%.
- Went online to websites for other levels of government: Year 2 5%. Year 1 8%.
- Used social media to get information: Year 2 5%. Year 1 5%.
- Emailed a Service Canada office: Year 2 4%. Year 1 5%.
- Called a Service Canada office directly: Year 2 3%. Year 1 5%.
- Went online to other websites: Year 2 3%. Year 1 4%.
- Called 1 800 O Canada phone line: Year 2 2% Year 1 2%.
- Went to a Service Canada office: Year 2 1% Year 1 1%.
- NONE OF THESE: Year 2 4%. Year 1 4%.
Q2. Which of the following did you use to find out about [INSERT PROGRAM] before you applied? Consider all the methods you used to learn about the program before filling out the application. Please select all that apply.
Base: All respondents
Note: Year 1 wave had the following answer choice wording that did not mention the specific program applied to: “Emailed a program officer directly” and “Received an email from the funding program directly”.
Significantly higher/lower than Year 1
Channel Use Pre-Application to Learn About the Program by Program
- CSJ applicants were more likely to have received an email from the GoC, ESDC, or program directly (+10 pts), while those applying to EAF, SDPP, and SDG were less likely. Applicants to all programs but EAF, NHSP and CSJ were more likely to have gone to the general GoC website, talked to peers/ community network, participated in a GoC website, emailed a program officer directly, used social media or went online to other websites. YESS applicants were also more likely to go to the Government of Canada website for the program. Compared to Year 1, CSJ and NHSP applicants were more likely to receive an email from the GoC.
Which of the following did you use to find out about [PROGRAM] before you applied?
| Total | EAF | NHSP | CSJ | YESS (formerly SL/CF | UT&IP | EL&CCI | SDPP | FCRP | IELC | IWILI | SWP | SDG | All but EAF, NHSP, CSJ | ||||||||||
|---|---|---|---|---|---|---|---|---|---|---|---|---|---|---|---|---|---|---|---|---|---|---|---|
| Year 2 | Year 1 | Year 2 | Year 1 | Year 2 | Year 1 | Year 2 | Year 1 | Year 2 | Year 1 | Year 2 | Year 1 | Year 2 | Year 1 | Year 1 | Year 2 | Year 2 | Year 2 | Year 2 | Year 2 | Year 2 | Year 1 | Year 1 | |
| Base: All respondents – n= | 1942 | 1549 | 207 | 56 | 384 | 431 | 865 | 942 | 152 | 25* | 32 | 26* | 65 | 5** | 153 | 17* | 20* | 8* | 13* | 4* | 39 | 486 | 120 |
| Received an email from the Government of Canada, ESDC or [program] directly | 57% | 51% | 23% | 32% | 57% | 50% | 62% | 52% | 55% | 60% | 25% | 15% | 45% | 40% | 26% | 41% | 20% | 50% | 39% | 50% | 23% | 34% | 41% |
| Went online to the Government of Canada website for the [program] | 48% | n/a | 52% | n/a | 51% | n/a | 47% | n/a | 57% | n/a | 47% | n/a | 49% | n/a | 43% | n/a | 45% | 38% | 31% | 25% | 56% | 49% | n/a |
| Went online to the Government of Canada website (servicecanada.gc.ca) | 25% | 60% | 28% | 66% | 21% | 52% | 24% | 61% | 28% | 60% | 25% | 50% | 28% | 20% | 31% | 53% | 40% | 25% | 23% | 50% | 49% | 33% | 57% |
| Talked to my peers / community network | 23% | 29% | 21% | 30% | 26% | 34% | 21% | 29% | 22% | 24% | 69% | 77% | 39% | 40% | 43% | 24% | 45% | 25% | 15% | 50% | 51% | 40% | 32% |
| Talked to my local Member of Parliament (MP) | 15% | 18% | 8% | 14% | 17% | 15% | 16% | 19% | 7% | - | - | 4% | 5% | - | 5% | - | - | - | - | - | 5% | 5% | 3% |
| Participated in a Government of Canada information session or webinar | 12% | 10% | 6% | 7% | 11% | 20% | 12% | 8% | 28% | 48% | 16% | 35% | 28% | - | 11% | 12% | - | 13% | 23% | 25% | 21% | 18% | 32% |
| Emailed a Program Officer for [program] directly | 11% | 10% | 12% | 7% | 14% | 14% | 10% | 9% | 29% | 24% | 9% | 4% | 17% | - | 11% | - | 20% | - | 23% | 75% | 21% | 18% | 13% |
| Went online to websites for other levels of government (provincial, territorial or municipal) | 5% | 8% | 11% | 7% | 5% | 8% | 5% | 8% | 4% | 8% | 9% | 8% | 5% | - | 4% | 18% | 5% | - | - | 25% | 8% | 5% | 9% |
| Used social media to get information | 5% | 5% | 6% | 5% | 7% | 3% | 4% | 5% | 4% | - | 3% | 4% | 8% | - | 14% | 6% | - | - | - | 25% | 3% | 8% | 4% |
| Emailed a Service Canada office | 4% | 5% | 2% | 5% | 4% | 6% | 5% | 5% | 1% | 8% | - | - | 6% | - | 3% | - | - | - | 8% | 25% | - | 2% | 6% |
| Called a Service Canada office directly | 3% | 5% | 1% | 5% | 3% | 4% | 3% | 5% | 3% | 8% | - | - | 5% | - | 3% | - | - | - | 8% | - | 10% | 4% | 4% |
| Went online to other websites | 3% | 4% | 4% | 11% | 4% | 4% | 3% | 3% | 3% | 8% | 3% | 8% | 2% | - | 9% | 6% | - | - | 8% | 25% | 10% | 6% | 6% |
| Called 1800 O Canada phone line | 2% | 2% | 1% | - | 1% | 3% | 2% | 2% | 2% | 4% | - | - | 3% | - | 2% | - | - | - | - | - | 3% | 2% | 0% |
| Went to a Service Canada office | 1% | 1% | - | - | 1% | 2% | 1% | 1% | - | - | - | - | - | - | 1% | - | - | - | - | - | - | 0% | 0% |
| None of These | 4% | 4% | 9% | 7% | 3% | 5% | 4% | 4% | 5% | 4% | 3% | 8% | 6% | - | 4% | 12% | 5% | 25% | 8% | 25% | 3% | 5% | 8% |
Q2. Which of the following did you use to find out about [INSERT PROGRAM] before you applied? Consider all the methods you used to learn about the program before filling out the application. Please select all that apply.
Base: All respondents
Note: Year 1 had the following answer choice wording that did not mention the specific program applied to: “Emailed a program officer directly” and “Received an email from the funding program directly”.
* small sample size
** very small sample size
Significantly higher / lower than total
Significantly higher/lower than Year 1
Ease of Use of Government of Canada Website
- Of those who used the Government of Canada website at the aware stage, the vast majority felt nearly all aspects of learning about the program were easy. Applicants were most likely to feel it was easy to determine if their organization was eligible for funding (84%), determining when the application period takes place (83%), and finding general information about the program they applied for (82%). Ratings were lowest for the determining the amount of time each phase of the application process is anticipated to take (58%).
- Compared to Year 1, applicants were more likely to feel it was easy to determine the steps to apply and understand information about the program.
How difficult or easy was it to find the following information about [PROGRAM] on the Government of Canada website?
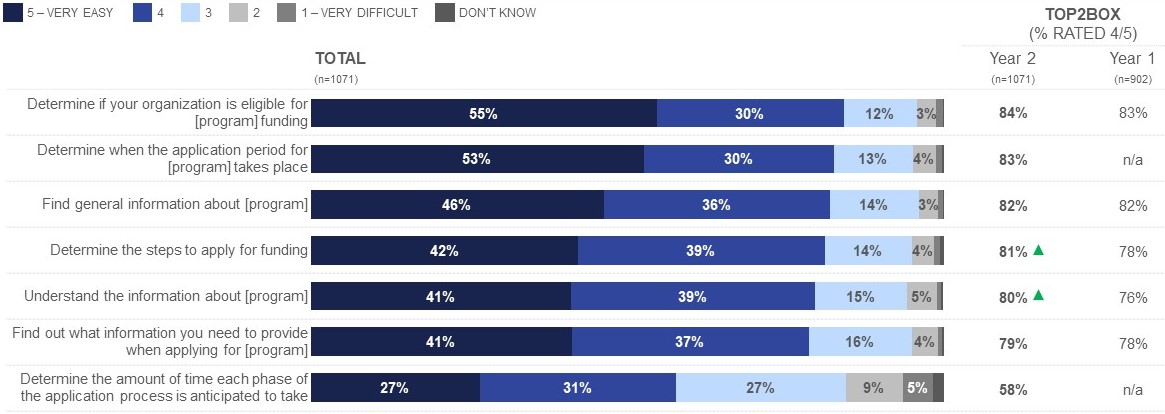
Figure 29: Ease of Use of Government of Canada website
This horizontal bar chart shows responses to a question about how difficult or easy it was for the applicant to find different types of information about the program they applied for on the Government of Canada website and presents results for Year 1 and Year 2. Respondents were asked to provide ratings on a 5-pt scale. All 1,071 respondents from Year 2 who used government of Canada website responded as follows:
- Determine if your organization is eligible for [program] funding: Year 2 55% very easy, 30% somewhat easy, 12% neutral, 3% somewhat difficult, 1% very difficult, 0% Don’t know. 84% easy. Year 1 83% easy.
- Determine when the application period for [program] takes place: Year 2 53% very easy, 30% somewhat easy, 13% neutral, 4% somewhat difficult, 1% very difficult, 0% Don’t know. 83% easy. Year 1 n/a easy.
- Find general information about the [program]: Year 2 46% very easy, 36% somewhat easy, 14% neutral, 3% somewhat difficult, 1% very difficult, 0% Don’t know. 82% easy. Year 1 82% easy.
- Determine the steps to apply for funding: Year 2 42% very easy, 39% somewhat easy, 14% neutral, 4% somewhat difficult, 1% very difficult, 0% Don’t know. 81% easy. Year 1 78% easy.
- Understand the information about the [program]: Year 2 41% very easy, 39% somewhat easy, 15% neutral, 5% somewhat difficult, 1% very difficult, 0% Don’t know. 80% easy. Year 1 76% easy.
- Find out what information they need to provide when applying for the [program]: Year 2 41% very easy, 37% somewhat easy, 16% neutral, 4% somewhat difficult, 1% very difficult, 0% Don’t know. 79% easy. Year 1 78% easy.
- Determine the amount of time each phase of the application process is anticipated to take: Year 2 27% very easy, 31% somewhat easy, 27% neutral, 9% somewhat difficult, 5% very difficult, 2% Don’t know. 58% easy. Year 1 n/a.
Q5. On a scale from 1 to 5, where 1 is very difficult and 5 is very easy, how difficult or easy was it to find the following information about [INSERT PROGRAM] on the Government of Canada website? Select one response per item.
Base: Used Government of Canada website
Note: values less than 3% not labelled
* small sample size
** very small sample size
Significantly higher / lower than total
Significantly higher/lower than Year 1
Ease of Use of Government of Canada Website by Program
- Of those who used the GoC website, applicants to all programs but EAF, NHSP, and CSJ were less likely think it was easy to find all types of information related to their program. EL&CCI, SDPP and SDG applicants, in particular, were less likely to feel it easy to find all types of information.
- Compared to Year 1, CSJ applicants were more likely to feel it was easy to determine the steps to apply and UT&IP applicants were more likely to feel it was easy to determine if they were eligible for funding.
How difficult or easy was it to find the following information about [PROGRAM] on the Government of Canada website?
| TOP2BOX (% RATED 4/5) | |||||||||||||||||||||||
|---|---|---|---|---|---|---|---|---|---|---|---|---|---|---|---|---|---|---|---|---|---|---|---|
| Total | EAF | NHSP | CSJ | YESS (formerly SL/CF | UT&IP | EL&CCI | SDPP | FCRP | IELC | IWILI | SWP | SDG | All but EAF, NHSP, CSJ | ||||||||||
| Year 2 | Year 1 | Year 2 | Year 1 | Year 2 | Year 1 | Year 2 | Year 1 | Year 2 | Year 1 | Year 2 | Year 1 | Year 2 | Year 1 | Year 2 | Year 1 | Year 2 | Year 2 | Year 2 | Year 2 | Year 2 | Year 2 | Year 1 | |
| Base: Used GoC website – n= | 1092 | 902 | 125 | 37 | 203 | 224 | 473 | 573 | 99 | 15* | 17* | 13* | 37 | 1** | 87 | 9* | 12* | 3** | 6** | 2** | 28* | 291 | 68 |
| Determine if your organization is eligible for funding | 84% | 83% | 77% | 84% | 85% | 84% | 87% | 83% | 89% | 80% | 100% | 69% | 57% | - | 65% | 44% | 75% | 67% | 67% | 100% | 39% | 66% | 67% |
| Determine when the application period for takes place | 83% | n/a | 80% | n/a | 83% | n/a | 84% | n/a | 81% | n/a | 100% | n/a | 51% | n/a | 68% | n/a | 75% | 67% | 67% | - | 71% | 71% | n/a |
| Find general information about | 82% | 82% | 82% | 89% | 85% | 85% | 83% | 82% | 84% | 87% | 88% | 69% | 49% | - | 66% | 44% | 58% | 67% | 83% | 100% | 57% | 67% | 64% |
| Determine the steps to apply for funding | 81% | 76% | 78% | 87% | 86% | 82% | 82% | 77% | 82% | 93% | 88% | 77% | 68% | 100% | 63% | 44% | 67% | 33% | 83% | 100% | 57% | 68% | 70% |
| Understand the information about | 80% | 76% | 79% | 78% | 85% | 80% | 81% | 76% | 83% | 73% | 71% | 69% | 62% | - | 69% | 33% | 75% | 67% | 50% | 100% | 43% | 67% | 55% |
| Find out what information you need to provide when applying for | 79% | 78% | 75% | 78% | 80% | 79% | 80% | 79% | 84% | 80% | 82% | 62% | 51% | - | 66% | 33% | 83% | 67% | 67% | 100% | 50% | 67% | 64% |
| Determine the amount of time each phase of the application process is anticipated to take | 58% | n/a | 62% | n/a | 65% | n/a | 59% | n/a | 39% | n/a | 71% | n/a | 19% | n/a | 40% | n/a | 42% | 33% | 67% | - | 18% | 34% | n/a |
Q5. On a scale from 1 to 5, where 1 is very difficult and 5 is very easy, how difficult or easy was it to find the following information about [INSERT PROGRAM] on the Government of Canada website? Select one response per item.
* small sample size
** very small sample size
Significantly higher / lower than total
Significantly higher/lower than Year 1
Application Process
Applying for Funding
Channel Use for Application Preparation
- Applicants were most likely to use the Government of Canada website to prepare and complete their application (43%), though this represents a six-point decrease from Year 1. Approximately a quarter (24%) say they talked to their peers/community network (-2 pts) or emailed a program officer directly (-1 pt).
- Two in ten (21%, -2 pts) applicants say they did none of the things mentioned.
To prepare and complete your application (up until when you submitted) did you consult with any of the following?
Figure 30: Channel Use for Application Preparation
This horizontal bar chart shows responses to a question about which channels the applicant used to prepare and complete their application (up until when they submitted) and presents results for Year 1 and Year 2. All 1942 respondents from Year 2 answered as follows:
- Went online to the Government of Canada website: Year 2 43%.Year 1 49%.
- Talked to my peers / community network: Year 2 24%. Year 1 26%.
- Emailed a Program Officer directly: Year 2 24%. Year 1 23%.
- Participated in a Government of Canada information session or webinar: Year 2 17%Year 1 11%.
- Talked to my local Member of Parliament (MP): Year 2 11%.Year 1 15%.
- Called a Service Canada office directly: Year 2 8%. Year 1 11%.
- Emailed a Service Canada office: Year 2 5%. Year 1 11%.
- Called 1800 O Canada phone line: Year 2 3%. Year 1 4%.
- Used social media to get information: Year 2 3%. Year 1 3%.
- Worked with a private consultant: Year 2 2%. Year 1 n/a.
- Went to a Service Canada office : Year 2 0%. Year 1 1%.
- NONE OF THESE: Year 2 21%. Year 1 19%.
Q6. To prepare and complete your application (up until when you submitted) did you consult with any of the following? Please select all that apply.
Base: All respondents
Note: Year 1 wave had the following answer choice wording that did not mention the specific program applied to: “Emailed a program officer directly”.
Significantly higher/lower than Year 1
Channel Use for Application Preparation by Program
- Applicants to NHSP as well as all programs but EAF, NHSP and CSJ were more likely to have talked to peers, emailed a program officer directly, or participated in a GoC info session/webinar and were less likely to have visited the GoC website. Applicants to all programs but EAF, NHSP and CSJ were also less likely to have talked to their local MP. Applicants to EAF were more likely to emailed a program officer directly or went to other websites and less likely to have participated in a webinar.
- Compared to Year 1, applicants to CSJ were more likely to have participated in a webinar and less likely to have talked to peers, their local MP or call or email a Service Canada office. Applicants to EAF were more likely to have emailed a program officer directly and less likely to have talked to their local MP or emailed a Service Canada office, while applicants to NHSP as well as all programs but EAF, NHSP and CSJ were less likely to have visited the GoC website or participated in a webinar.
Which of the following did you use to find out about [PROGRAM] before you applied?
| Total | EAF | NHSP | CSJ | YESS (formerly SL/CF | UT&IP | EL&CCI | SDPP | FCRP | IELC | IWILI | SWP | SDG | All but EAF, NHSP, CSJ | ||||||||||
|---|---|---|---|---|---|---|---|---|---|---|---|---|---|---|---|---|---|---|---|---|---|---|---|
| Year 2 | Year 1 | Year 2 | Year 1 | Year 2 | Year 1 | Year 2 | Year 1 | Year 2 | Year 1 | Year 2 | Year 1 | Year 2 | Year 1 | Year 1 | Year 2 | Year 2 | Year 2 | Year 2 | Year 2 | Year 2 | Year 1 | Year 1 | |
| Base: All respondents – n= | 1942 | 1549 | 207 | 56 | 384 | 431 | 865 | 942 | 152 | 25* | 32 | 26* | 65 | 5** | 153 | 17* | 20* | 8* | 13* | 4* | 39 | 486 | 120 |
| Went online to the Government of Canada website | 43% | 49% | 41% | 45% | 35% | 47% | 46% | 49% | 41% | 48% | 31% | 54% | 45% | 40% | 32% | 53% | 25% | 25% | 31% | 50% | 36% | 36% | 51% |
| Talked to my peers / community network | 24% | 26% | 26% | 36% | 38% | 36% | 20% | 25% | 26% | 16% | 63% | 77% | 42% | 40% | 33% | 35% | 40% | 25% | 31% | 25% | 41% | 35% | 35% |
| Emailed a Program Officer for [program] directly | 24% | 23% | 33% | 18% | 33% | 27% | 21% | 22% | 42% | 28% | 22% | 8% | 40% | - | 23% | 47% | 55% | 50% | 23% | 50% | 41% | 34% | 35% |
| Participated in a Government of Canada information session or webinar | 17% | 11% | 8% | 4% | 21% | 28% | 15% | 8% | 39% | 68% | 34% | 35% | 32% | 20% | 15% | 41% | 25% | 13% | 31% | - | 18% | 24% | 49% |
| Talked to my local Member of Parliament (MP) | 11% | 11% | 7% | 16% | 12% | 14% | 12% | 15% | 5% | 4% | 3% | 15% | 11% | 20% | 3% | 6% | - | - | - | - | - | 4% | 8% |
| Went online to other websites for information | 11% | 11% | 16% | 11% | 10% | 13% | 9% | 11% | 18% | 8% | 9% | 27% | 28% | 20% | 15% | 6% | 20% | 38% | 23% | 50% | 23% | 19% | 13% |
| Called a Service Canada office directly | 8% | 8% | 5% | 11% | 10% | 12% | 8% | 11% | 9% | 20% | - | - | 3% | - | 4% | - | 5% | - | 8% | - | 8% | 5% | 11% |
| Emailed a Service Canada office | 5% | 5% | 5% | 16% | 8% | 12% | 4% | 10% | 8% | 8% | 3% | 4% | 12% | 20% | 8% | 6% | - | - | 8% | - | 10% | 8% | 9% |
| Called 1-800 O-Canada phone line | 3% | 4% | 3% | 2% | 4% | 4% | 3% | 4% | 1% | - | - | - | 2% | - | 2% | - | - | 13% | - | - | 3% | 2% | 1% |
| Used social media to get information | 3% | 3% | 3% | 2% | 4% | 4% | 2% | 3% | 5% | - | 6% | 4% | 2% | - | 5% | 6% | - | 0% | - | - | 3% | 4% | 2% |
| Worked with a private consultant | 2% | n/a | 3% | n/a | 2% | n/a | 2% | n/a | 6% | n/a | 19% | n/a | 5% | - | 9% | n/a | n/a | 13% | 15% | n/a | 5% | 7% | - |
| Went to a Service Canada office | - | 1% | - | - | 1% | 2% | - | 1% | 1% | - | - | - | - | - | 1% | - | - | - | - | - | - | - | - |
| None of These | 21% | 19% | 20% | 23% | 17% | 14% | 23% | 20% | 16% | 8% | 6% | 8% | 9% | 20% | 25% | 24% | 5% | 0% | 23% | 50% | 10% | 18% | 11% |
Q6. To prepare and complete your application (up until when you submitted) did you consult with any of the following? Please select all that apply.
Note: Year 1 wave had the following answer choice wording that did not mention the specific program applied to: “Emailed a program officer directly”.
* small sample size
** very small sample size
Significantly higher / lower than total
Significantly higher/lower than Year 1
Ease of Application Process
- Improvement has been made on most aspects of the ease of completing the application compared to Year 1. Applicants were most likely to feel it was easy to meet the requirements of the application (80%, +3 pts), understand the requirements of the application (76%, +3 pts), complete the project timeline (75%, unchanged), and put together the information needed to apply (74%, +5 pts). Comparatively to the ease dimensions noted above, ratings were lower for completing the narrative questions (70%, +6 pts) and completing the budget document (67%, unchanged).
How would you rate the following elements of the application for [PROGRAM]?
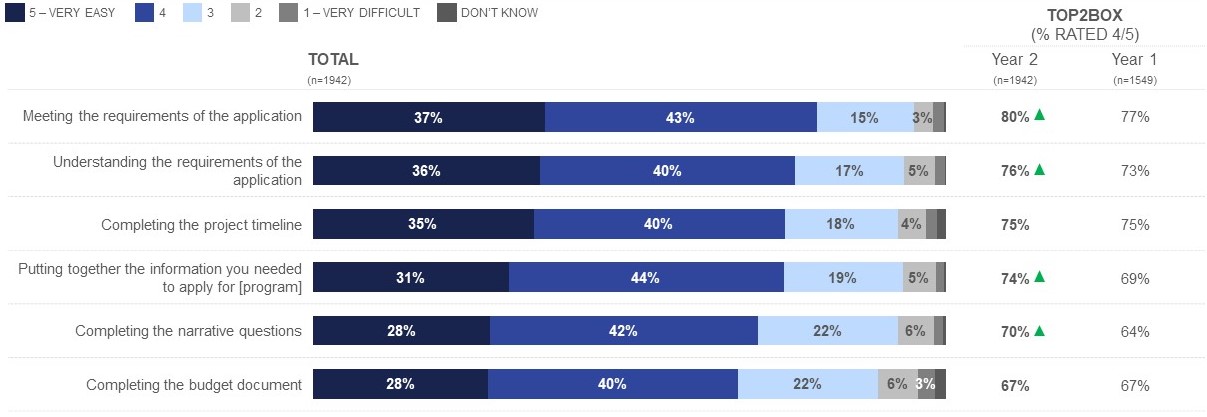
Figure 31: Ease of Application Process
This horizontal bar chart shows responses to a question about how difficult or easy the applicant found different elements of the application process in Year 2. Respondents were asked to provide ratings on a 5-pt scale. All 1942 respondents from Year 2 answered as follows:
- Meeting the requirements of the application: Year 2 37% very easy, 43% somewhat easy, 15% neutral, 3% somewhat difficult, 2% very difficult, 1% Don’t know. 80% easy. Year 1 77% easy.
- Understanding the requirements of the application: Year 2 36% very easy, 40% somewhat easy, 17% neutral, 5% somewhat difficult, 2% very difficult, 0% Don’t know. 76% easy. Year 1 73% easy.
- Completing the project timeline: Year 2 35% very easy, 40% somewhat easy, 18% neutral, 4% somewhat difficult, 2% very difficult, 2% Don’t know. 75% easy. Year 1 75% easy.
- Putting together the information they needed to apply for the program: Year 2 7431% very easy, 44% somewhat easy, 19% neutral, 5% somewhat difficult, 1% very difficult, 0% Don’t know. % easy. Year 1 69% easy.
- Completing the narrative questions: Year 2 28% very easy, 42% somewhat easy, 22% neutral, 6% somewhat difficult, 2% very difficult, 0% Don’t know. 70% easy. Year 1 64% easy.
- Completing the budget document: Year 2 28% very easy, 40% somewhat easy, 22% neutral, 6% somewhat difficult, 3% very difficult, 2% Don’t know. 67% easy. Year 1 67% easy.
Q7. On a scale of 1 to 5, where 1 is very difficult and 5 is very easy, how would you rate the following elements of the application for [INSERT PROGRAM]? Select one response per item.
Base: All respondents
Note: values less than 3% not labelled
* small sample size
** very small sample size
Significantly higher / lower than total
Significantly higher/lower than Year 1
Ease of Application Process by Program
- Applicants to all programs but EAF, NHSP, and CSJ experienced more difficulty with all elements of the application process. EAF applicants had more difficulty with nearly all aspects of the process except for completing the narrative questions, while NHSP applicants provided lower ratings for the ease of meeting the requirements of the application and putting together the information they needed to apply. Those applying to CSJ were more likely to find it easy to complete the project timeline and put together the information needed to apply.
- Compared to Year 1, CSJ applicants were more likely to find it easy to understand the requirements of the application, put together the information they needed to apply and complete the narrative questions (along with NHSP applicants). NHSP applicants were also more likely to say it was easy to meet the requirements of the application). EAF applicants were less likely to feel it was easy to complete the project timeline.
How would you rate the following elements of the application for [PROGRAM]?
| TOP2BOX (% RATED 4/5) | |||||||||||||||||||||||||||||||
|---|---|---|---|---|---|---|---|---|---|---|---|---|---|---|---|---|---|---|---|---|---|---|---|---|---|---|---|---|---|---|---|
| TOTAL | EAF | NHSP | CSJ | YESS (formerly SL/CF) | UT&IP | EL&CCI | SDPP | FCRP | IELC | IWILI | SWP | SDG | All but EAF, NHSP, CSJ | ||||||||||||||||||
| Year 2 | Year 1 | Year 2 | Year 1 | Year 2 | Year 1 | Year 2 | Year 1 | Year 2 | Year 1 | Year 2 | Year 1 | Year 2 | Year 1 | Year 2 | Year 1 | Year 2 | Year 2 | Year 2 | Year 2 | Year 2 | Year 2 | Year 1 | |||||||||
| Base: All respondents – n= | 1942 | 1549 | 207 | 56 | 384 | 431 | 865 | 942 | 152 | 25* | 32 | 26* | 65 | 5** | 153 | 17** | 20* | 8** | 13* | 4** | 39 | 480 | 120 | ||||||||
| Meeting the requirements of the application | 80% | 77% | 69% | 75% | 75% | 68% | 83% | 79% | 77% | 64% | 78% | 54% | 46% | 40% | 68% | 53% | 85% | 50% | 46% | 75% | 56% | 66% | 57% | ||||||||
| Understanding the requirements of the application | 76% | 73% | 68% | 80% | 72% | 68% | 79% | 73% | 71% | 72% | 59% | 39% | 45% | 60% | 67% | 65% | 65% | 50% | 46% | 75% | 51% | 62% | 62% | ||||||||
| Completing the project timeline | 75% | 75% | 60% | 75% | 70% | 70% | 78% | 76% | 55% | 72% | 56% | 42% | 48% | 40% | 56% | 77% | 75% | 38% | 23% | 50% | 54% | 55% | 60% | ||||||||
| Putting together the information you needed to apply for [program] | 74% | 69% | 58% | 61% | 69% | 65% | 78% | 70% | 62% | 68% | 63% | 35% | 46% | 40% | 60% | 41% | 70% | 25% | 39% | 75% | 46% | 57% | 56% | ||||||||
| Completing the narrative questions | 70% | 64% | 69% | 68% | 67% | 60% | 72% | 64% | 71% | 68% | 66% | 42% | 49% | 40% | 67% | 41% | 75% | 38% | 46% | 50% | 56% | 63% | 55% | ||||||||
| Completing the budget document | 67% | 67% | 59% | 66% | 62% | 61% | 71% | 68% | 41% | 60% | 59% | 39% | 46% | 40% | 50% | 29% | 50% | 25% | 31% | 25% | 44% | 46% | 43% | ||||||||
Q7. On a scale of 1 to 5, where 1 is very difficult and 5 is very easy, how would you rate the following elements of the application for [INSERT PROGRAM]? Select one response per item.
* small sample size
** very small sample size
Significantly higher / lower than total
Significantly higher/lower than Year 1
Time it Took to Complete Application was Reasonable
- Seven in ten (70%, +5 pts) applicants felt the application took a reasonable amount of time to complete, higher than in Year 1 (65%).
- Applicants to programs other than EAF, NHSP, and CSJ were less likely to feel the application took a reasonable amount of time to complete.
Please rate the following statement: The application took a reasonable amount of time to complete.
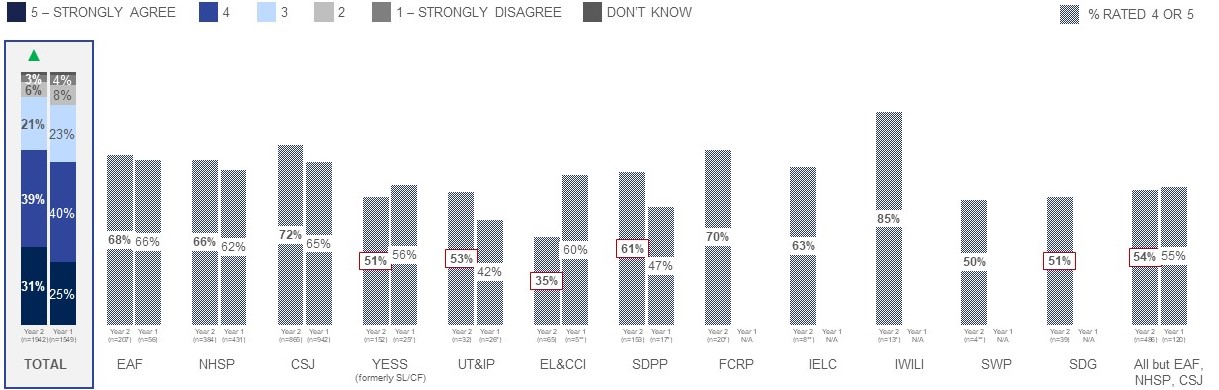
Figure 32: Time It Took to Complete Application Was Reasonable
This vertical bar chart shows responses to a question about the extent to which the applicant would agree or disagree that the application took a reasonable amount of time to complete and presents results for Year 1 and Year 2. Respondents were asked to provide ratings on a 5-pt scale.
- Total: Year 2 31% strongly agree, 39% somewhat agree, 21% neutral, 6% somewhat disagree, 3% strongly disagree, 0% don’t know. A total of 1942 respondents answered this question. Year 1 25% strongly agree, 40% somewhat agree, 23% neutral, 8% somewhat disagree, 4% strongly disagree,1% don’t know.
- EAF: Year 2 68% strongly/somewhat agree. A total of 207 respondents answered this question. Year 1 66% strongly/somewhat agree.
- NHSP: Year 2 66% strongly /somewhat agree. A total of 384 respondents answered this question. Year 1 62% strongly /somewhat agree.
- CSJ: Year 2 72% strongly /somewhat agree. A total of 885 respondents answered this question. Year 1 65% strongly /somewhat agree.
- YESS: Year 2 51% strongly /somewhat agree. A total of 152 respondents answered this question. Year 1 56% strongly /somewhat agree.
- UT&IP: Year 2 53% strongly /somewhat agree. A total of 32 respondents answered this question. Year 1 42% strongly /somewhat agree.
- EL&CCI: Year 2 35% strongly /somewhat agree. A total of 65 respondent answered this question. Year 1 60% strongly /somewhat agree.
- SDPP: Year 2 61% strongly/somewhat agree. A total of 153 respondents answered this question. Year 1 47% strongly/somewhat agree.
- FCRP: Year 2 70% strongly/somewhat agree. A total of 20 respondents answered this question.
- IELC: Year 2 63% strongly/somewhat agree. A total of 8 respondents answered this question.
- IWILI: Year 2 85% strongly/somewhat agree. A total of 13 respondents answered this question.
- SWP: Year 2 50% strongly/somewhat agree. A total of 4 respondents answered this question.
- SDG: Year 2 51% strongly/somewhat agree. A total of 39 respondents answered this question.
- ALL BUT EAF, NHSP, CSJ: Year 2 54% strongly/somewhat agree. A total of 486 respondents answered this question. Year 1 55% strongly/somewhat agree.
Q9. On a scale from 1 to 5, where 1 is strongly disagree and 5 is strongly agree, please rate the following statement: The application took a reasonable amount of time to complete.
Base: All respondents
Note: values less than 3% not labelled
* small sample size
** very small sample size
Significantly higher / lower than total
Significantly higher/lower than Year 1
Channel Use for Application Submission by Program
- Half of the applicants (51%) submitted their application using the online fillable form, followed by just over one-third (35%) who used the GCOS account/web portal. One in ten (10%) downloaded the application documents and submitted by email and 3% downloaded the application documents and then submitted them by mail.
- CSJ and YESS applicants were more likely to submit their application using the GCOS account/web portal, while applicants to all programs except for CSJ were more likely to have downloaded the application documents and submitted them by email.
- Compared to Year 1, NHSP and CSJ applicants were less likely to have downloaded the application and submitted by email or traditional mail.
Which of the following methods did you use to submit your application?
| TOTAL | EAF | NHSP | CSJ | YESS (formerly SL/CF) | UT&IP | EL&CCI | SDPP | FCRP | IELC | IWILI | SWP | SDG | All but EAF, NHSP, CSJ | ||||||||||
|---|---|---|---|---|---|---|---|---|---|---|---|---|---|---|---|---|---|---|---|---|---|---|---|
| Year 2 | Year 1 | Year 2 | Year 1 | Year 2 | Year 1 | Year 2 | Year 1 | Year 2 | Year 1 | Year 2 | Year 1 | Year 2 | Year 1 | Year 2 | Year 1 | Year 2 | Year 2 | Year 2 | Year 2 | Year 2 | Year 2 | Year 1 | |
| Base: All respondents – n= | 1942 | 1549 | 207 | 56 | 384 | 431 | 865 | 942 | 152 | 25* | 32 | 26* | 65 | 5** | 153 | 17** | 20* | 8** | 13* | 4** | 39 | 480 | 120 |
| Submitted an application using the online fillable form | 51% | n/a | 45% | n/a | 52% | n/a | 53% | n/a | 21% | n/a | 25% | n/a | 34% | n/a | 36% | n/a | 30% | 50% | 15% | - | 26% | 30% | n/a |
| Submitted an application using the GCOS account/web portal | 35% | n/a | 11% | n/a | 16% | n/a | 41% | n/a | 57% | n/a | 13% | n/a | 26% | n/a | 12% | n/a | 15% | - | 23% | 75% | 23% | 26% | n/a |
| Downloaded the application documents and then submitted by email | 10% | 13% | 36% | 41% | 21% | 40% | 3% | 9% | 18% | 4% | 50% | 62% | 40% | 60% | 47% | 59% | 55% | 38% | 39% | - | 49% | 40% | 40% |
| Downloaded the application documents and then submitted by mail | 3% | 4% | 4% | 2% | 7% | 15% | 2% | 4% | 1% | - | 6% | - | - | - | 3% | 6% | - | - | 8% | - | - | 2% | 2% |
| Submitted application documents to a Service Canada office | 1% | 2% | 1% | 4% | 2% | 3% | 0% | 2% | 1% | - | - | - | - | 20% | 1% | - | - | - | - | - | 3% | 1% | 4% |
| Submitted on my behalf by my local Member of Parliament | 0% | 0% | 1% | - | 1% | 1% | - | - | - | - | - | - | - | - | - | - | - | - | - | - | - | - | 0% |
| Other | 0% | n/a | 2% | n/a | 0% | n/a | - | n/a | 2% | n/a | 3% | n/a | - | n/a | - | n/a | - | 13% | - | - | - | 1% | n/a |
| None of these | 1% | 1% | 1% | - | 0% | 1% | 1% | 1% | - | - | 3% | - | - | - | 1% | 6% | - | - | 15% | 25% | - | 1% | 3% |
Q10. Which of the following methods did you use to submit your application? Please select only one.
* small sample size
** very small sample size
Significantly higher / lower than total
Significantly higher/lower than Year 1
Reasons for Submission Method by Program
- By far the most common reason for submitting their application through the method used was that it was the easiest/most familiar way to apply (51%, +4 pts), followed by that they felt more confident their application would be submitted properly (21%, +3 pts) or that it was the method they were directed to use (16%, -5 pts).
- Those applying to CSJ (who mostly used either the online fillable form or the GCOS web portal) were more likely to say the way they applied was the easiest/most familiar way to apply. NHSP applicants were more likely to say it was the method they were directed to use, while EAF applicants were more likely to say they did not know any other way. Applicants to all programs but EAF, NHSP and CSJ were more likely to indicate it was the method they were directed to use, they did not know any other way or that it was the only method provided.
- Compared to Year 1, CSJ applicants were more likely to say it was the easiest method and less likely to mention it was the method they were directed to use (along with EAF applicants) or that they didn’t know any other way. NHSP applicants were less likely to say they felt more confident it would be submitted properly.
Why did you choose this method to submit your application?
| TOTAL | EAF | NHSP | CSJ | YESS (formerly SL/CF) | UT&IP | EL&CCI | SDPP | FCRP | IELC | IWILI | SWP | SDG | All but EAF, NHSP, CSJ | ||||||||||
| Year 2 | Year 1 | Year 2 | Year 1 | Year 2 | Year 1 | Year 2 | Year 1 | Year 2 | Year 1 | Year 2 | Year 1 | Year 2 | Year 1 | Year 2 | Year 1 | Year 2 | Year 2 | Year 2 | Year 2 | Year 2 | Year 2 | Year 1 | |
| Base: Excluding ‘None of the above’ at Q10 – n= | 1929 | 1549 | 205 | 56 | 383 | 428 | 861 | 936 | 152 | 25* | 31 | 26* | 65 | 5** | 151 | 16* | 20* | 8** | 11* | 3** | 39 | 480 | 117 |
| It was the easiest / most familiar way to apply | 51% | 47% | 36% | 45% | 39% | 40% | 55% | 47% | 40% | 48% | 45% | 39% | 37% | 40% | 36% | 19% | 45% | 63% | 36% | 100% | 28% | 37% | 40% |
| I felt more confident my application would be submitted properly | 21% | 18% | 23% | 13% | 24% | 30% | 20% | 17% | 17% | 20% | 36% | 42% | 22% | 40% | 22% | 19% | 5% | - | - | - | 15% | 19% | 18% |
| It was the method I was directed to use | 16% | 21% | 14% | 27% | 21% | 17% | 14% | 21% | 24% | 12% | 13% | 12% | 17% | - | 25% | 38% | 25% | 13% | 27% | - | 28% | 24% | 24% |
| I did not know any other way to apply | 6% | 9% | 16% | 7% | 6% | 4% | 6% | 9% | 11% | 4% | - | - | 6% | 20% | 12% | 6% | 10% | 13% | 18% | - | 8% | 10% | 6% |
| It was the only method available | 4% | 5% | 6% | 7% | 6% | 4% | 3% | 5% | 6% | 16% | 3% | 4% | 15% | - | 5% | 19% | 10% | - | 9% | - | 18% | 9% | 11% |
| Other | 2% | 2% | 4% | 2% | 4% | 4% | 2% | 1% | 3% | - | 3% | 4% | 3% | - | - | - | 5% | 13% | 9% | - | 3% | 2% | 2% |
Q11. Why did you choose this method to submit your application? Please select one reason only.
* small sample size
** very small sample size
Significantly higher / lower than total
Significantly higher/lower than Year 1
Reasons for Submission Method by Method
- Regardless of the method selected, most applicants (51%) said they used the method they did because it was the easiest way to apply or the one with which they were most familiar.
- Those who submitted their application using the online fillable form were more likely to do so because it was the easiest way to apply. Those who downloaded the application and submitted by mail were more likely to feel confident that the application would be submitted properly. Those submitting via the GCOS web portal were more likely to say they did so because it was the method they were directed to use, and those who downloaded the application and submitted by email were more likely to say they did so because they didn’t know of another way to apply.
Why did you choose this method to submit your application?
| Total | Submitted using online fillable form | Submitted using GCOS account/web portal | Downloaded docs, then submitted by email | Downloaded docs, then submitted by mail | Submitted to SC office | Submitted by MP | |
|---|---|---|---|---|---|---|---|
| Base: Excluding ‘None of the above’ at Q10 – n= | 1929 | 890 | 585 | 362 | 63 | 16* | 3* |
| It was the easiest/most familiar way to apply | 51% | 56% | 46% | 45% | 41% | 46% | 78% |
| I felt more confident my application would be submitted properly | 21% | 18% | 22% | 23% | 31% | 19% | 22% |
| It was the method I was directed to use | 16% | 13% | 22% | 12% | - | 33% | - |
| I did not know any other way to apply | 6% | 7% | 5% | 10% | 2% | - | - |
| It was the only method available | 4% | 5% | 3% | 6% | 6% | - | - |
| Other | 2% | 2% | 2% | 4% | 20% | 2% | - |
Q11. Why did you choose this method to submit your application? Please select one reason only.
* small sample size
** very small sample size
Significantly higher / lower than total
Significantly higher/lower than Year 1
Ease of Submitting Application Using Web Portal
- Among those who submitted their application online, eight in ten (82%, +10 pts) found the process easy, which is significantly higher than in Year 1 (72%).
- Applicants to NHSP or EL&CCI were to less likely to feel that submitting their application online was easy compared to all applicants.
- Compared to Year 1, CSJ applicants were more likely to say submitting their application online was easy.
How difficult or easy was it to submit your application online?
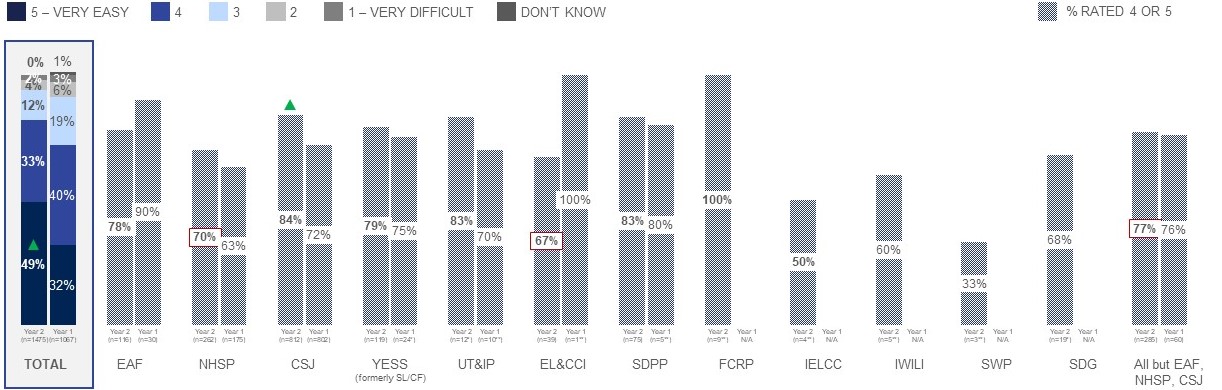
Figure 33: Ease of Submitting Application Using Web Portal
This vertical bar chart shows responses to a question about how difficult or easy it was for the applicant to submit their application using an online web portal and presents results for Year 1 and Year 2. Only those who submitted their application using an online web portal were asked this question. Respondents were asked to provide ratings on a 5-pt scale.
- Total: Year 2 49% very easy, 33% somewhat easy, 12% neutral, 4% somewhat difficult, 2% very difficult, 0% Don’t know. A total of 1475 respondents answered this question. Year 1 32% very easy, 40% somewhat easy, 19% neutral, 6% somewhat difficult, 3% very difficult, 1% Don’t know.
- EAF: Year 2 78% very/somewhat easy. A total of 116 respondents answered this question. Year 1 90% very/somewhat easy.
- NHSP: Year 2 70% very/somewhat easy. A total of 262 respondents answered this question. Year 1 63% very/somewhat easy.
- CSJ: Year 2 84% very/somewhat easy. A total of 812 respondents answered this question. Year 1 72% very/somewhat easy.
- YESS: Year 2 79% very/somewhat easy. A total of 119 respondents answered this question. Year 1 75% very/somewhat easy.
- UT&IP: Year 2 83% very/somewhat easy. A total of 12 respondents answered this question. Year 1 70% very/somewhat easy.
- EL&CCI: Year 2 67% very/somewhat easy. A total of 39 respondent answered this question. Year 1 100% very/somewhat easy.
- SDPP: Year 2 83% very/somewhat easy. A total of 75 respondents answered this question. Year 1 80% very/somewhat easy.
- FCRP: Year 2 100% very/somewhat easy. A total of 9 respondents answered this question
- IELCC: Year 2 50% very/somewhat easy. A total of 4 respondents answered this question
- IWILI: Year 2 60% very/somewhat easy. A total of 5 respondents answered this question
- SWP: Year 2 33% very/somewhat easy. A total of 3 respondents answered this question
- SDG: Year 2 68% very/somewhat easy. A total of 19 respondents answered this question
- ALL BUT EAF, NHSP, CSJ: Year 2 77% very/somewhat easy. A total of 285 respondents answered this question. Year 1 76% very/somewhat easy.
Q12. On a scale from 1 to 5, where 1 means very difficult and 5 means very easy, how difficult or easy was it to submit your application online?
Base: Submitted application using online fillable form or using the Grants and Contributions Online Services (GCOS) online web portal
Note: values less than 3% not labelled
* small sample size
** very small sample size
Significantly higher / lower than total
Significantly higher/lower than Year 1
Contacted by Service Canada to Provide Additional Information – % Yes
- Fewer than four in ten (36%, -5 pts) applicants were contacted by Service Canada to provide additional information to support their application, which is significantly lower than in Year 1 (41%).
- Those applying to SDPP, NHSP, EAF or YESS were more likely to have been contacted, while CSJ or EL&CCI applicants were less likely.
- Compared to Year 1, fewer NHSP or CSJ applicants were contacted to provide additional information.
After you submitted your application, were you contacted by Service Canada to provide additional information to support your application? – % Yes
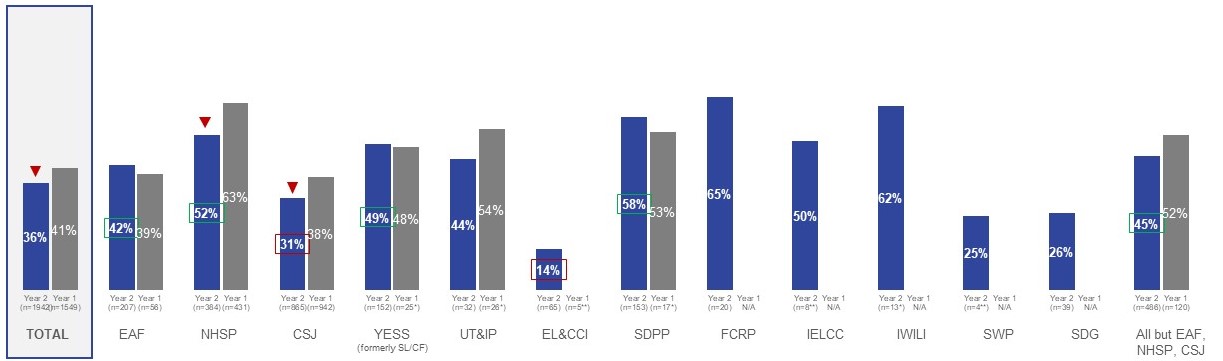
Figure 34: Contacted by Service Canada to Provide Additional Information
This vertical bar chart shows responses to a question about whether the applicant was contacted by Service Canada after they submitted their application to provide additional information to support their application and presents results for Year 1 and Year 2.
- Total: Year 2 41% contacted. A total of 1942 respondents answered this question. Year 1 36% contacted.
- EAF: Year 2 42% contacted. A total of 207 respondents answered this question. Year 1 39% contacted.
- NHSP: Year 2 52% contacted. A total of 384 respondents answered this question. Year 1 63% contacted.
- CSJ: Year 2 31% contacted. A total of 865 respondents answered this question. Year 1 38% contacted.
- YESS: Year 2 49% contacted. A total of 152 respondents answered this question. Year 1 48% contacted.
- UT&IP: Year 2 44% contacted. A total of 32 respondents answered this question. Year 1 54% contacted.
- EL & CCI: Year 2 14% contacted. A total of 65 respondents answered this question. Year 1 0% contacted.
- SDPP: Year 2 58% contacted. A total of 153 respondents answered this question. Year 1 53% contacted.
- FCRP: Year 2 65% contacted. A total of 20 respondents answered this question.
- IELCC: Year 2 50% contacted. A total of 8 respondents answered this question.
- IWILI: Year 2 62% contacted. A total of 13 respondents answered this question.
- SWP: Year 2 25% contacted. A total of 4 respondents answered this question.
- SDG: Year 2 26% contacted. A total of 39 respondents answered this question.
- ALL BUT EAF, NHSP, CSJ: Year 2 45% contacted. A total of 486 respondents answered this question. Year 1 52% contacted.
Q13. After you submitted your application, were you contacted by Service Canada to provide additional information to support your application?
Base: All respondents
* small sample size
** very small sample size
Significantly higher / lower than total
Significantly higher/lower than Year 1
Reason for Contact by Service Canada
- Among those contacted by Service Canada, by far the most common reason was to clarify information on their application (55%, +3 pts), followed by missing documents or information (23%, +2 pts) or that the budget template needed modifications (15%, +8 pts). EAF and NHSP applicants were more likely to have had missing documents or information in their application, while applicants to all programs but EAF, NHSP and CSJ were more likely to have had to make modifications to the budget template or to be notified they were not eligible.
- Compared to Year 1, CSJ applicants were more likely to have been contacted to make budget template modifications, while applicants to all programs but EAF, NHSP and CSJ were less likely (and also less likely to have to clarify information in their application).
Why were you contacted by Service Canada?
| TOTAL | EAF | NHSP | CSJ | YESS (formerly SL/CF | UT&IP | EL&CCI | SDPP | FCRP | IELC | IWILI | SWP | SDG | All but EAF, NHSP, CSJ | ||||||||||
| Year 2 | Year 1 | Year 2 | Year 1 | Year 2 | Year 1 | Year 2 | Year 1 | Year 2 | Year 1 | Year 2 | Year 1 | Year 2 | Year 1 | Year 2 | Year 1 | Year 2 | Year 2 | Year 2 | Year 2 | Year 2 | Year 2 | Year 1 | |
| Base: Contacted by Service Canada for additional information – n= | 776 | 721 | 86 | 22* | 198 | 272 | 861 | 936 | 152 | 25* | 14* | 14* | 9* | 0 | 87 | 9* | 13* | 4** | 8* | 1** | 10* | 221 | 65 |
|---|---|---|---|---|---|---|---|---|---|---|---|---|---|---|---|---|---|---|---|---|---|---|---|
| Clarify information in my application | 55% | 52% | 58% | 64% | 46% | 51% | 59% | 52% | 48% | 58% | 79% | 79% | 44% | - | 46% | 56% | 85% | 50% | 63% | - | 30% | 47% | 71% |
| Missing documents or information in my application | 23% | 21% | 40% | 41% | 44% | 49% | 16% | 16% | 19% | 33% | - | 7% | 11% | - | 38% | 22% | - | 25% | 25% | - | 20% | 27% | 18% |
| Budget template needed modifications | 15% | 7% | 12% | 5% | 20% | 17% | 13% | 4% | 39% | 17% | 29% | 21% | 22% | - | 15% | 56% | 15% | 50% | 50% | - | 20% | 23% | 42% |
| My organization or project was not eligible | 1% | 2% | 2% | 5% | 1% | 1% | 0% | 2% | - | 8% | 7% | - | 33% | - | 6% | - | - | - | - | - | 10% | 5% | 3% |
| An outstanding issue with a previous application | 2% | 1% | 5% | - | 1% | 2% | 3% | 0% | - | - | - | - | 11% | - | 1% | - | - | - | - | - | 10% | 2% | 0% |
| Other reason | 12% | 30% | 9% | - | 8% | 7% | 13% | 35% | 16% | 17 | - | 14% | 11% | - | 16% | 11% | 15% | - | - | 100% | 40% | 17% | 15% |
| Don’t know | 4% | 3% | 1% | 9% | 5% | 1% | 4% | 3% | 4% | - | - | - | - | - | 4% | - | - | 50% | 13% | - | - | 4% | 0% |
Q14. Why were you contacted by Service Canada? Select all that apply.
Base: Those who were contacted by Service Canada to provide additional information
* small sample size
** very small sample size
Significantly higher / lower than total
Significantly higher/lower than Year 1
Post-application
Decision
Channel Use for Follow-up Before Receiving Decision
- Overall, fewer applicants contacted Service Canada before receiving a funding decision compared to Year 1. Of those who did, the most common reason was to check the status of their application (24%, -12 pts), followed by finding out timelines for receiving a funding decision (14%, -11 pts) and modifying their application (9%, -9 pts).
- Those applying to all programs but EAF, NHSP, and CSJ were more likely to say they contacted Service Canada to check the status of their application or to find out timelines for receiving a funding decision. Compared to Year 1, those applying to CSJ and NHSP were less likely to say they contacted Service Canada for any reason before receiving their funding decision.
Did you contact Service Canada for any of the following reasons before receiving your funding decision?
| TOTAL UP | EAF | NHSP | CSJ | YESS (formerly SL/CF | UT&IP | EL&CCI | SDPP | FCRP | IELC | IWILI | SWP | SDG | All but EAF, NHSP, CSJ | ||||||||||
| Year 2 | Year 1 | Year 2 | Year 1 | Year 2 | Year 1 | Year 2 | Year 1 | Year 2 | Year 1 | Year 2 | Year 1 | Year 2 | Year 1 | Year 2 | Year 1 | Year 2 | Year 2 | Year 2 | Year 2 | Year 2 | Year 2 | Year 1 | |
| Base: All respondents – n= | 1942 | 1549 | 207 | 56 | 384 | 431 | 865 | 942 | 152 | 25* | 32 | 26* | 65 | 5** | 153 | 17* | 20* | 8** | 13* | 4** | 39 | 486 | 120 |
|---|---|---|---|---|---|---|---|---|---|---|---|---|---|---|---|---|---|---|---|---|---|---|---|
| To check the status of your application | 24% | 36% | 30% | 29% | 24% | 28% | 21% | 37% | 42% | 52% | 31% | 23% | 52% | 20% | 40% | 53% | 50% | 50% | 39% | 25% | 54% | 44% | 43% |
| To find out timelines for receiving a funding decision | 14% | 25% | 10% | 18% | 12% | 17% | 12% | 26% | 28% | 40% | 16% | 19% | 39% | 20% | 22% | 24% | 30% | 50% | 8% | 50% | 56% | 32% | 38% |
| To modify your application | 9% | 18% | 7% | 5% | 6% | 8% | 11% | 19% | 6% | 4% | 9% | - | 5% | - | 3% | 6% | 5% | 13% | - | - | 3% | 4% | 4% |
| To withdraw your application | 1% | 1% | - | - | 0% | - | 1% | 1% | - | - | - | - | - | - | - | - | - | - | - | - | - | - | 0% |
| Other reason | 13% | 13% | 13% | 11% | 15% | 13% | 13% | 13% | 11% | 16% | - | - | 14% | 20% | 10% | 18% | - | 25% | 15% | 25% | 13% | 11% | 11% |
| Don’t know | 51% | 34% | 47% | 55% | 50% | 43% | 53% | 32% | 32% | 16% | 50% | 62% | 25% | 60% | 41% | 24% | 40% | - | 46% | 25% | 21% | 33% | 30% |
Q15. Did you contact Service Canada for any of the following reasons before receiving your funding decision? Select all that apply.
Base: All respondents
* small sample size
** very small sample size
Significantly higher / lower than total
Significantly higher/lower than Year 1
Ease of Follow-up
- Among those who followed-up with Service Canada before receiving a funding decision, two-thirds (65%, +3 pts) said they found it easy to do so, which is consistent with Year 1.
- Those applying to all programs but EAF, NHSP, and CSJ were less likely to have found it easy to follow-up, in particular those applying to YESS, EL&CCI, and SDG.
How was your experience following up with Service Canada about your application?
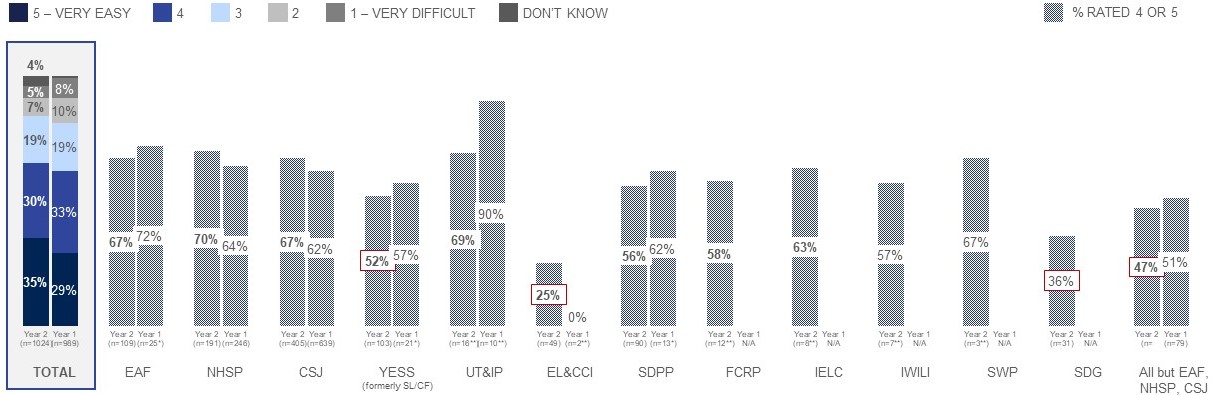
Figure 35: Ease of Follow-up
This vertical bar chart shows responses to a question about how difficult or easy the applicant found the experience of following up with Service Canada about their application and presents results for Year 1 and Year 2. Only those who indicated following up with Service Canada were asked this question. Respondents were asked to provide ratings on a 5-pt scale.
- Total: Year 2 35% very easy, 30% somewhat easy, 19% neutral, 7% somewhat difficult, 5% very difficult, 4% Don’t know. A total of 1024 respondents answered this question. Year 1 29% very easy, 33% somewhat easy, 19% neutral, 10% somewhat difficult, 8% very difficult, 1% Don’t know.
- EAF: Year 2 67% very/somewhat easy. A total of 109 respondents answered this question. Year 1 72% very/somewhat easy.
- NHSP: Year 2 70% very/somewhat easy. A total of 191 respondents answered this question. Year 1 64% very/somewhat easy.
- CSJ: Year 2 67% very/somewhat easy. A total of 405 respondents answered this question. Year 1 62% very/somewhat easy.
- YESS: Year 2 52% very/somewhat easy. A total of 103 respondents answered this question. Year 1 57% very/somewhat easy.
- UT&IP: Year 2 69% very/somewhat easy. A total of 16 respondents answered this question. Year 1 90% very/somewhat easy.
- EL & CCI: Year 2 25% very/somewhat easy. A total of 49 respondents answered this question. Year 1 0% very/somewhat easy.
- SDPP: Year 2 56% very/somewhat easy. A total of 90 respondents answered this question. Year 1 62% very/somewhat easy.
- FCRP: Year 2 58% very/somewhat easy. A total of 12 respondents answered this question.
- IELC: Year 2 63% very/somewhat easy. A total of 8 respondents answered this question.
- IWILI: Year 2 57% very/somewhat easy. A total of 7 respondents answered this question.
- • SWP: Year 2 58% very/somewhat easy. A total of 3 respondents answered this question.
- SDG: Year 2 36% very/somewhat easy. A total of 31 respondents answered this question.
- ALL BUT EAF, NHSP, CSJ: Year 2 47% very/somewhat easy. A total of 319 respondents answered this question. Year 1 51% very/somewhat easy.
Q16. On a scale from 1 to 5, where 1 is very difficult and 5 is very easy, how was your experience following up with Service Canada about your application?
Base: Followed-up with Service Canada before receiving funding decision
* small sample size
** very small sample size
Significantly higher / lower than total
Method of Funding Decision Notification
- Three-quarters (76%) of applicants were notified of their funding decision by email, followed by around two in ten (23%) by their local MP and one in ten by telephone (11%) or through their GCOS account (7%).
- EAF, YESS, and SDPP applicants were more likely to have been notified by telephone and NHSP applicants by mail. Applicants to all programs but EAF, NHSP and CSJ were more likely to have been notified by email (81%) or telephone (17%) and less likely through their local MP or GCOS account.
Did you contact Service Canada for any of the following reasons before receiving your funding decision?
| TOTAL | EAF | NHSP | CSJ | YESS (formerly SL/CF | UT&IP | EL&CCI | SDPP | FCRP | IELC | IWILI | SWP | SDG | All but EAF, NHSP, CSJ | |
| Base: All respondents – n= | 1942 | 207 | 384 | 865 | 152 | 32 | 65 | 152 | 20* | 8* | 13* | 4** | 39 | 486 |
|---|---|---|---|---|---|---|---|---|---|---|---|---|---|---|
| By email | 76% | 72% | 77% | 76% | 68% | 84% | 82% | 86% | 80% | 88% | 85% | 50% | 85% | 81% |
| From my local Member of Parliament (MP) | 23% | 5% | 21% | 26% | 24% | 19% | - | 6% | - | - | - | - | 5% | 9% |
| By telephone | 11% | 35% | 12% | 9% | 27% | 9% | 3% | 18% | 5% | - | 8% | 25% | 13% | 17% |
| Online through your GCOS account | 7% | 2% | 3% | 9% | 7% | 3% | 6% | 3% | 5% | - | 8% | - | - | 4% |
| By mail | 4% | 4% | 7% | 3% | 3% | 3% | 3% | 7% | - | - | - | - | - | 4% |
| By receiving a direct deposit | 2% | 2% | 3% | 2% | - | - | - | 5% | 5% | - | - | - | 3% | 3% |
| I did not receive a funding decision | 8% | 2% | 5% | 9% | 2% | - | 8% | 1% | 5% | 13% | 8% | 25% | 8% | 4% |
Q17. How were you notified of the funding decision about your application for [INSERT PROGRAM]? Please select all that apply.
Note: “Online through [PROGRAM] web portal in 2020 has been changed to “Online through your GCOS account”. *Comparisons to Year 1 cannot be made due to a change in question logic to select all that apply from select one.
* small sample size
** very small sample size
Significantly higher / lower than total
Funding Approval and Satisfaction
- Over eight in ten (82%, +8 pts) applicants who received approval were satisfied with their experience, compared to just under half (47%, +6 pts) of those who did not receive approval. NHSP applicants who received approval were more likely to be satisfied compared to all applicants who were approved, while applicants who received funding from YESS, EL&CCI, SDPP, IWILI and SDG were less likely. Applicants to EAF and CSJ who were not approved were more likely to be satisfied compared to all clients who were denied, while applicants who were not approved from NHSP, YESS, UT&IP, EL&CCI, IELC and IWILI were less likely.
- Overall, more than nine in ten applicants report having received approval for funding (93%, +3 pts) statistically higher than in Year 1. Applicants to all programs other than CSJ and UT&IP were less likely to have received funding approval and in particular EL&CCI, SDG, IELC and IWILI applicants. Compared to Year 1, applicants to NHSP and CSJ were more likely to have been approved, while EL&CCI applicants were less likely.
- Compared to Year 1, overall satisfaction increased among those who were approved for funding due to an increase among NHSP and CSJ applicants. CSJ and YESS applicants who did not receive approval were also more likely to be satisfied with their experience. Applicants to EL&CCI who were denied were less likely to be satisfied.
How satisfied or dissatisfied were you with the overall service you received from Service Canada from getting information about [PROGRAM] to receiving a funding decision? After you submitted your application to [PROGRAM], did you organization receive approval for funding?
| TOTAL DOWN | EAF | NHSP | CSJ | YESS (formerly SL/CF | UT&IP | EL&CCI | SDPP | FCRP | IELC | IWILI | SWP | SDG | |||||||||
| Year 2 | Year 1 | Year 2 | Year 1 | Year 2 | Year 1 | Year 2 | Year 1 | Year 2 | Year 1 | Year 2 | Year 1 | Year 2 | Year 1 | Year 2 | Year 1 | Year 2 | Year 2 | Year 2 | Year 2 | Year 2 | |
| Base: All respondents – n= | 1820 | 1491 | 203 | 56 | 364 | 392 | 784 | 926 | 149 | 25* | 32 | 25* | 60 | 3** | 151 | 17* | 19* | 7** | 12* | 3** | 36 |
|---|---|---|---|---|---|---|---|---|---|---|---|---|---|---|---|---|---|---|---|---|---|
| % top2box satisfaction (% rated 4/5) | |||||||||||||||||||||
| Approved | 82% | 74% | 86% | 90% | 90% | 85% | 81% | 73% | 68% | 75% | 75% | 79% | 50% | 50% | 74% | 62% | 75% | 100% | - | 100% | 47% |
| Denied | 47% | 41% | 56% | 50% | 40% | 39% | 64% | 41% | 25% | 0% | - | 0% | 14% | 100% | 50% | 25% | - | - | - | - | 71% |
| % approved or denied | |||||||||||||||||||||
| Approved | 93% | 90% | 79% | 68% | 88% | 82% | 97% | 92% | 88% | 80% | 94% | 96% | 13% | 67% | 90% | 77% | 95% | 71% | 67% | 100% | 69% |
| Denied | 7% | 10% | 21% | 32% | 12% | 18% | 3% | 8% | 12% | 20% | 5% | 4% | 87% | 33% | 10% | 23% | 5% | 29% | 33% | - | 31% |
Q31. On a scale from 1 to 5, where 1 means very dissatisfied and 5 means very satisfied, how satisfied or dissatisfied were you with the overall service you received from Service Canada from getting information about [INSERT PROGRAM] to receiving a funding decision?
Q18. After you submitted your application to [INSERT PROGRAM], did your organization receive approval for funding?
* small sample size
** very small sample size
Significantly higher / lower than total
Significantly higher/lower than Year 1
Explanation Provided for Not Receiving Funding Approval – % Yes
- Among those who did not receive funding approval, four in ten (42%, -4 pts) were provided with an explanation why, statistically consistent with Year 1.
- Very few statistically significant differences were observed by program due to limited sample sizes– those applying to SDG were less likely to say they did not receive an explanation.
You indicated that your organization did not receive an approval for funding. Did you receive an explanation why? – % Yes
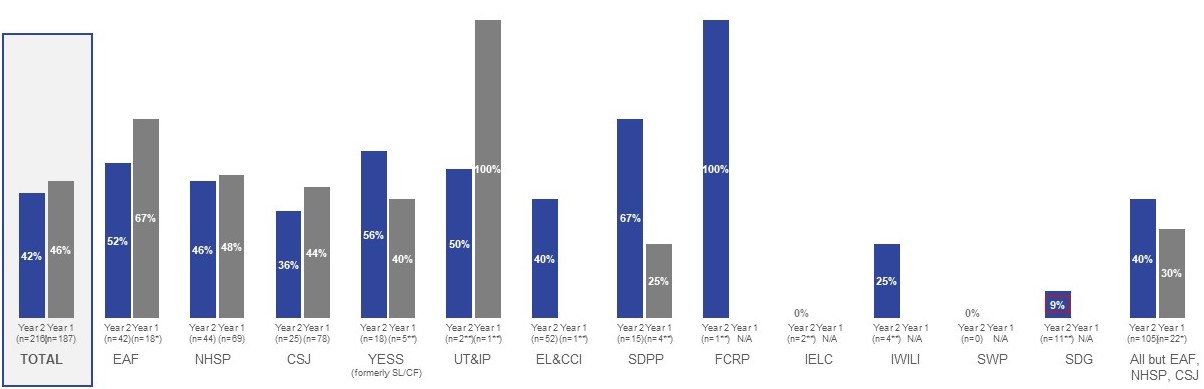
Figure 36: Explanation Provided for Not Receiving Funding Approval
This vertical bar chart shows responses to a question about whether applicants who were denied funding received an explanation why and presents results for Year 1 and Year 2. Only applicants who were denied funding approval were asked this question.
- Total: Year 2 42% yes. A total of 216 respondents answered this question. Year 1 46% yes.
- EAF: Year 2 52%. A total of 42 respondents answered this question. Year 1 67%.
- NHSP: Year 2 46%. A total of 44 respondents answered this question. Year 1 48% yes.
- CSJ: Year 2 36% yes. A total of 25 respondents answered this question. Year 1 44% yes.
- YESS: Year 2 56% yes. A total of 18 respondents answered this question. Year 1 40% yes.
- UT&IP: Year 2 50% yes. A total of 2 respondent answered this question. Year 1 100% yes.
- EL&CCI: Year 2 40% yes. A total of 52 respondent answered this question. Year 1 0% yes.
- SDPP: Year 2 67%. A total of 15 respondents answered this question. Year 1 25% yes.
- FCRP: Year 2 100% yes. A total of 1 respondent answered this question.
- IELC: Year 2 0% yes. A total of 2 respondents answered this question.
- IWILI: Year 2 25% yes. A total of 4 respondents answered this question.
- SWP: Year 2 0% yes. A total of 0 respondents answered this question.
- SDG: Year 2 9% yes. A total of 11 respondents answered this question.
- ALL BUT EAF, NHSP, CSJ: Year 2 40% yes. A total of 105 respondents answered this question. Year 1 30% yes.
Q19. You indicated that your organization did not receive an approval for funding. Did you receive an explanation why? Base: Did not receive funding approval
* small sample size
** very small sample size
Significantly higher / lower than total
Significantly higher/lower than Year 1
Satisfaction with Explanation Provided
- Among those who were provided an explanation for why their organization did not receive funding, one-third (35%, +11 pts) report being satisfied with the explanation. which is statistically consistent with Year 1. Fewer applicants were somewhat dissatisfied (16%, -15 pts), while a directionally higher proportion were very dissatisfied (27%, +8 pts) or somewhat satisfied (24%, +7 pts).
- Applicants to NHSP, EL&CCI and all programs but NHSP, EAF and CSJ were less likely to have been satisfied with the explanation provided. Applicants to EAF and CSJ reported higher levels of satisfaction with the explanation than in Year 1.
How dissatisfied or satisfied were you with the explanation of the decision?
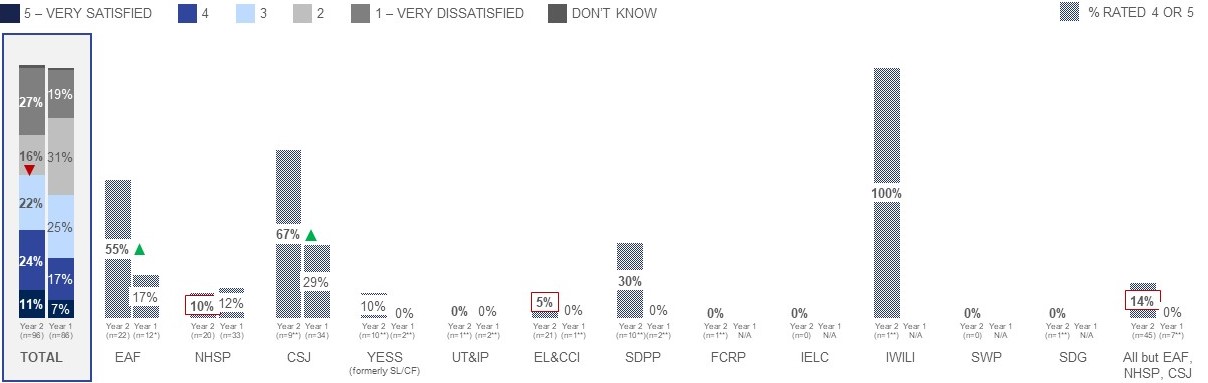
Figure 37: Satisfaction with Explanation Provided
This vertical bar chart shows responses to a question about how satisfied the applicant was with the explanation provided for why their organization did not receive funding approval and presents results for Year 1 and Year 2. Only applicants who were denied funding approval and provided an explanation why were asked this question. Respondents were asked to provide ratings on a 5-pt scale.
- • Total: Year 2 11% very satisfied, 24% somewhat satisfied, 22% neutral, 16% somewhat dissatisfied, 27% very dissatisfied, 1% Don’t know. A total of 96 respondents answered this question. Year 1 7% very satisfied, 17% somewhat satisfied, 25% neutral, 31% somewhat dissatisfied, 19% very dissatisfied, 1% Don’t know.
- EAF: Year 2 55% very/somewhat satisfied. A total of 22 respondents answered this question. Year 1 17% very/somewhat satisfied.
- NHSP: Year 2 10% very/somewhat satisfied. A total of 20 respondents answered this question. Year 1 12% very/somewhat satisfied.
- CSJ: Year 2 67% very/somewhat satisfied. A total of 9 respondents answered this question. Year 1 29% very/somewhat satisfied.
- YESS: Year 2 10% very/somewhat satisfied. A total of 10 respondent answered this question. Year 1 0% very/somewhat satisfied.
- UT&IP: Year 2 0% very/somewhat satisfied. A total of 1 respondent answered this question. Year 1 0% very/somewhat satisfied.
- EL & CCI: Year 2 5% very/somewhat satisfied. A total of 21 respondent answered this question. Year 1 0% very/somewhat satisfied.
- SDPP: Year 2 30% very/somewhat satisfied. A total of 10 respondent answered this question. Year 1 0% very/somewhat satisfied.
- FCRP: Year 2 0% very/somewhat satisfied. A total of 1 respondent answered this question.
- IELC: Year 2 0% very/somewhat satisfied. A total of 0 respondent answered this question.
- IWILI: Year 2 100% very/somewhat satisfied. A total of 1 respondent answered this question.
- SWP: Year 2 0% very/somewhat satisfied. A total of 0 respondent answered this question.
- SDG: Year 2 0% very/somewhat satisfied. A total of 1 respondent answered this question.
- ALL BUT EAF, NHSP, CSJ: Year 2 14% very/somewhat satisfied. A total of 45 respondents answered this question. Year 1 0% very/somewhat satisfied.
Q20. On a scale from 1 to 5, where 1 is very dissatisfied and 5 is very satisfied, how dissatisfied or satisfied were you with the explanation of the decision? Base: Did not receive funding approval and received an explanation why
Note: values less than 3% not labelled
* small sample size
** very small sample size
Significantly higher / lower than total
Significantly higher/lower than Year 1
Changes Made During Negotiation of Funding Agreement
- Among those who received funding approval, more than one-third of applicants (36%) had to make changes to their project timelines and one-quarter had to make changes to their project scope (26%) or make COVID-19-related changes (25%). Fewer applicants had to make changes to project funding (16%) and project activities (13%).
- Those receiving approval for YESS funding were more likely to say they had to make all types of changes and in-particular to the funding and timelines. Those receiving approval for EAF were less likely to say they had to make changes. NHSP recipients were also less likely to say they had to make most changes, except for COVID-19-related changes and changes to project activities.
Once your program began and the details of the funding agreement were finalized with [PROGRAM], did you have to work with a Service Canada Program Officer to make any of the following changes to your project and/or submit an amendment to the funding agreement?
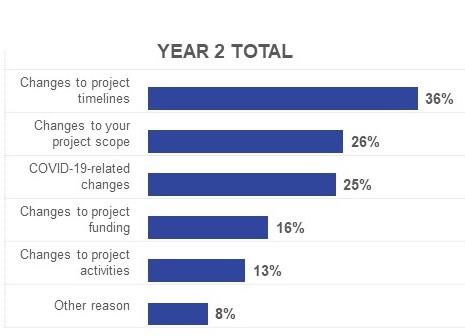
Figure 38: Changes Made During Negotiation of Funding Agreement
This vertical bar chart presents responses to a question about whether the applicant had to make changes to their project and/or submit an amendment to the funding agreement when details of the funding agreement were finalized and presents results for Year 2. Only applicants approved for funding were asked this question.
- Total: 36% changes to their project timeline, 26% changes to your project scope, 25% COVID-19 related changes. 16% changes to project funding. 13% changes to project activities. 8% other. A total of 1604 respondents answered this question.
| EAF | NHSP | CSJ | YESS (formerly SL/CF) | UT&IP | EL&CCI | SDPP | FCRP | IELCC | IWILI | SWP | SDG | All but EAF, NHSP, CSJ | |
| (n=161) | (n=320) | (n=759) | (n=131) | (n=30)* | (n=8)** | (n=136) | (n=18)** | (n=5)** | (n=8)** | (n=3)** | (n=25)* | (n=364) | |
| Changes to project timelines | 13% | 24% | 39% | 66% | 37% | 63% | 29% | 28% | 60% | 63% | 33% | 48% | 43% |
|---|---|---|---|---|---|---|---|---|---|---|---|---|---|
| Changes to your project scope | 13% | 18% | 27% | 47% | 10% | 50% | 19% | 50% | 20% | 75% | 67% | 40% | 31% |
| COVID-19-related changes | 10% | 35% | 25% | 45% | 23% | 25% | 10% | 28% | 60% | 13% | 33% | 32% | 25% |
| Changes to project funding | 9% | 9% | 15% | 67% | 23% | 38% | 27% | 28% | 20% | 75% | 33% | 28% | 38% |
| By Changes to project activities | 11% | 18% | 11% | 32% | 13% | 13% | 9% | 28% | 40% | 13% | 33% | 24% | 19% |
| Other reason | 4% | 3% | 10% | 13% | 7% | 13% | 8% | 6% | 20% | 13% | 33% | 8% | 10% |
Q22. Once your program began and the details of the funding agreement were finalized with [NSERT PROGRAM], did you have to work with a Service Canada Program Officer to make any of the following changes to your project and/or submit an amendment to the funding agreement?
Base: Received approval for program funding (n=1604)
* small sample size
** very small sample size
Significantly higher / lower than total
Amount of Time it Took to Make Changes
- Among those who had to make changes, roughly three-quarters were able to complete them within a week and around half were made in under three days.
- Four in ten (42%) who say they needed to make another type of change said it took more than a week, suggesting that these were more complicated adjustments to implement. Otherwise, there is little variation in the amount of time each type of change took to complete.
Please rate the following statement: The application took a reasonable amount of time to complete.
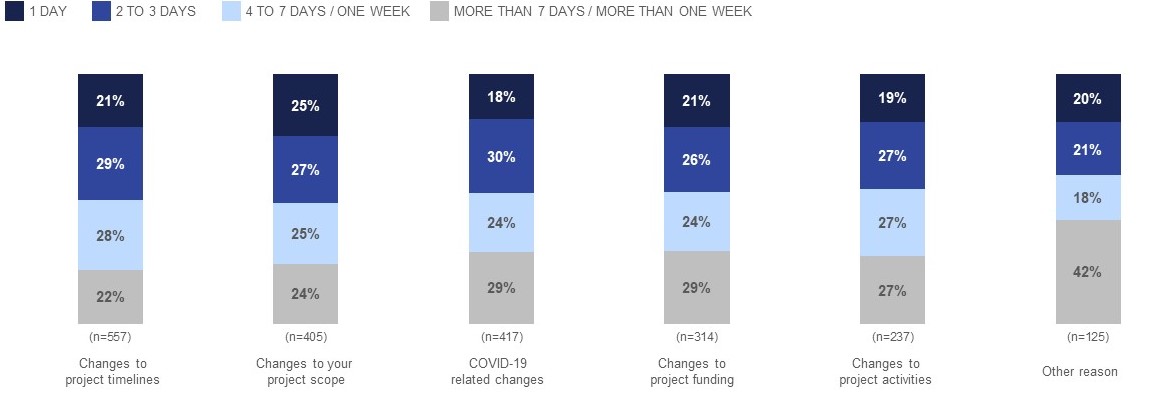
Figure 39: Amount of Time It Took to Make Changes
This horizontal bar chart shows responses to a question about how long it took to the make changes to their project or submit an amendment to the funding agreement. Only applicants who had to made changes to project or submit an amendment to the funding agreement were asked this question. Sample sizes vary by task:
- Changes to project timeline: More than 7 days 22%. 4 to 7 days 28%. 2 to 3 days 29%. 1 day 21%. A total of 557 respondents answered this question.
- Changes to your project scope: More than 7 days 24%. 4 to 7 days 25%. 2 to 3 days 27%. 1 day 25%. A total of 405 respondents answered this question.
- COVID-19 related changes: More than 7 days 29%. 4 to 7 days 24%. 2 to 3 days 30%. 1 day 18%. A total of 417 respondents answered this question.
- Changes to project funding: More than 7 days 29%. 4 to 7 days 24%. 2 to 3 days 26%. 1 day 21%. A total of 314 respondents answered this question.
- Changes to project activities: More than 7 days 27%. 4 to 7 days 27%. 2 to 3 days 27%. 1 day 19%. A total of 237 respondents answered this question.
- Other reasons: More than 7 days 42%. 4 to 7 days 18%. 2 to 3 days 21%. 1 day 20%. A total of 125 respondents answered this question.
Q23. How long did the following take to complete? If you are uncertain, please provide your best guess.
Base: Had to make changes to project or submit an amendment to funding agreement (n=varies)
Day 1 2 to 3 Days 4 to 7 Days/One Week More Than 7 Day/More Than One Week
Amount of Time it Took to Make Changes (cont.)
- Although base sizes were small, changes to EAF projects generally took more time to complete, particularly for changes to project activities and funding.
- Similar to overall trends, the vast majority of changes to NHSP projects were resolved within a week.
Please rate the following statement: The application took a reasonable amount of time to complete.
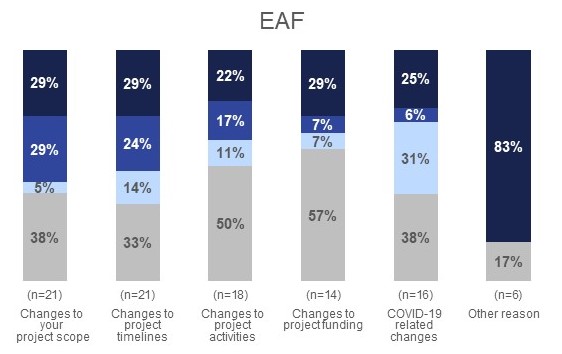
Figure 40: Amount of Time It Took to Make Changes for EAF Applicants
This horizontal bar chart shows responses to a question about how long it took to the make changes to their project or submit an amendment to the funding agreement among EAF applicants. Only applicants who had to made changes to a project or submit an amendment to the funding agreement were asked this question. Sample sizes vary by task:
- Changes to project scope: More than 7 days 38%. 4 to 7 days 5%. 2 to 3 days 29%. 1 day 29%. A total of 21 respondents answered this question.
- Changes to project timeline: More than 7 days 33%. 4 to 7 days 14%. 2 to 3 days 24%. 1 day 29%. A total of 21 respondents answered this question.
- Changes to project activities: More than 7 days 50%. 4 to 7 days 11%. 2 to 3 days 17%. 1 day 22%. A total of 18 respondents answered this question.
- Changes to project funding: More than 7 days 57%. 4 to 7 days 7%. 2 to 3 days 7%. 1 day 29%. A total of 14 respondents answered this question.
- COVID-19 related changes: More than 7 days 38%. 4 to 7 days 31%. 2 to 3 days 6%. 1 day 25%. A total of 16 respondents answered this question.
- Other reasons: More than 7 days 17%. 1 day 83%. A total of 6 respondents answered this question.
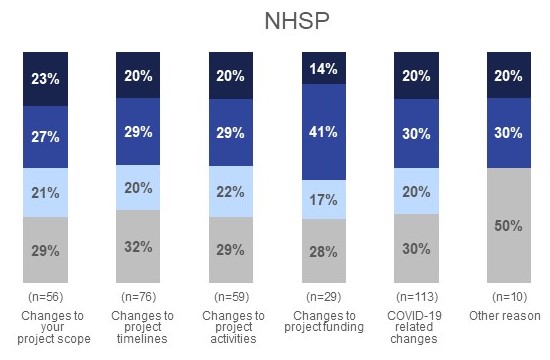
Figure 41: Amount of Time It Took to Make Changes for NHSP Applications
This horizontal bar chart shows responses to a question about how long it took to the make changes to their project or submit an amendment to the funding agreement among NHSP applicants. Only applicants who had to made changes to a project or submit an amendment to the funding agreement were asked this question. Sample sizes vary by task:
- Changes to project scope: More than 7 days 29%. 4 to 7 days 21%. 2 to 3 days 27%. 1 day 23%. A total of 56 respondents answered this question.
- Changes to project timeline: More than 7 days 32%. 4 to 7 days 20%. 2 to 3 days 29%. 1 day 20%. A total of 76 respondents answered this question.
- Changes to project activities: More than 7 days 29%. 4 to 7 days 22%. 2 to 3 days 29%. 1 day 20%. A total of 59 respondents answered this question.
- Changes to project funding: More than 7 days 28%. 4 to 7 days 17%. 2 to 3 days 41%. 1 day 14%. A total of 29 respondents answered this question.
- COVID-19 related changes: More than 7 days 30%. 4 to 7 days 20%. 2 to 3 days 30%. 1 day 20%. A total of 113 respondents answered this question.
- Other reasons: More than 7 days 50%. 2 to 3 days 30%. 1 day 20%. A total of 10 respondents answered this question.
Q23. How long did the following take to complete? If you are uncertain, please provide your best guess. Base: Had to make changes to project or submit an amendment to funding agreement (n=varies)
Day 1 2 to 3 Days 4 to 7 Days/One Week More Than 7 Day/More Than One Week
Amount of Time it Took to Make Changes (cont.)
- Changes to CSJ projects were generally resolved within one week and in about half of cases were resolved within 3 days. Changes to YESS projects took more time to complete, specifically regarding project funding and project scope.
Please rate the following statement: The application took a reasonable amount of time to complete.
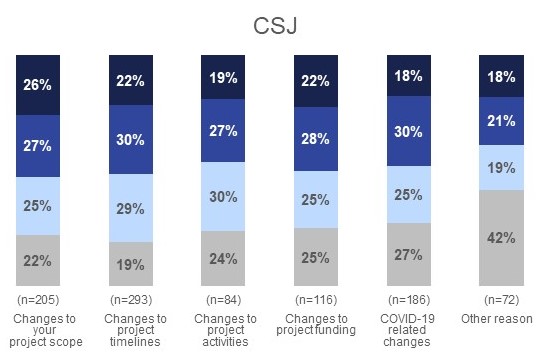
Figure 42: Amount of Time It Took to Make Changes for CSJ Applications
This horizontal bar chart shows responses to a question about how long it took to the make changes to their project or submit an amendment to the funding agreement among CSJ applicants. Only applicants who had to made changes to a project or submit an amendment to the funding agreement were asked this question. Sample sizes vary by task:
- Changes to project scope: More than 7 days 22%. 4 to 7 days 25%. 2 to 3 days 27%. 1 day 26%. A total of 205 respondents answered this question.
- Changes to project timeline: More than 7 days 19%. 4 to 7 days 29%. 2 to 3 days 30%. 1 day 22%. A total of 293 respondents answered this question.
- Changes to project activities: More than 7 days 24%. 4 to 7 days 30%. 2 to 3 days 27%. 1 day 19%. A total of 84 respondents answered this question.
- Changes to project funding: More than 7 days 25%. 4 to 7 days 25%. 2 to 3 days 28%. 1 day 22%. A total of 116 respondents answered this question.
- COVID-19 related changes: More than 7 days 27%. 4 to 7 days 25%. 2 to 3 days 30%. 1 day 18%. A total of 186 respondents answered this question.
- Other reasons: More than 7 days 42%. 4 to 7 days 19%. 2 to 3 days 21%. 1 day 18% A total of 72 respondents answered this question.
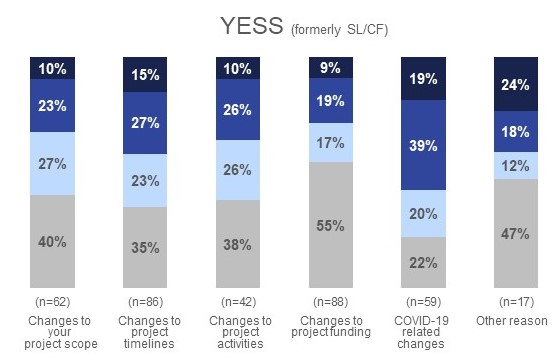
Figure 43: Amount of Time It Took to Make Changes for YESS Applications
This horizontal bar chart shows responses to a question about how long it took to the make changes to their project or submit an amendment to the funding agreement among YESS applicants. Only applicants who had to made changes to a project or submit an amendment to the funding agreement were asked this question. Sample sizes vary by task:
- Changes to project scope: More than 7 days 40%. 4 to 7 days 27%. 2 to 3 days 23%. 1 day 10%. A total of 62 respondents answered this question.
- Changes to project timeline: More than 7 days 35%. 4 to 7 days 23%. 2 to 3 days 27%. 1 day 15%. A total of 86 respondents answered this question.
- Changes to project activities: More than 7 days 38%. 4 to 7 days 26%. 2 to 3 days 26%. 1 day 10%. A total of 42 respondents answered this question.
- Changes to project funding: More than 7 days 55%. 4 to 7 days 17%. 2 to 3 days 19%. 1 day 9%. A total of 88 respondents answered this question.
- COVID-19 related changes: More than 7 days 22%. 4 to 7 days 20%. 2 to 3 days 39%. 1 day 19%. A total of 59 respondents answered this question.
- Other reasons: More than 7 days 47%. 4 to 7 days 12%. 2 to 3 days 12%. 1 day 24%. A total of 17 respondents answered this question.
Q23. How long did the following take to complete? If you are uncertain, please provide your best guess. Base: Had to make changes to project or submit an amendment to funding agreement (n=varies)
Day 1 2 to 3 Days 4 to 7 Days/One Week More Than 7 Day/More Than One Week
Amount of Time it Took to Make Changes (cont.)
- Though both programs have small base sizes, changes to UT&IP projects were generally completed more quickly, while changes to EL&CCI projects took longer.
Please rate the following statement: The application took a reasonable amount of time to complete.
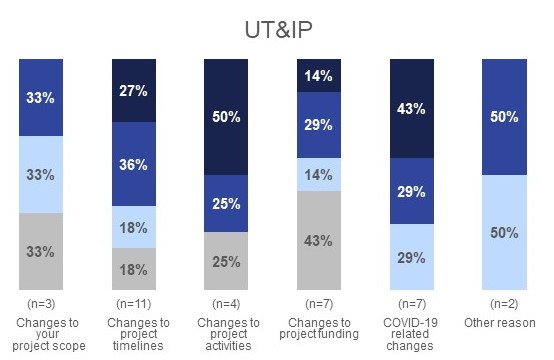
Figure 44: Amount of Time It Took to Make Changes for UT&IP Applications
This horizontal bar chart shows responses to a question about how long it took to the make changes to their project or submit an amendment to the funding agreement among UT&IP applicants. Only applicants who had to made changes to a project or submit an amendment to the funding agreement were asked this question. Sample sizes vary by task:
- Changes to project scope: More than 7 days 33%. 4 to 7 days 33%. 2 to 3 days 33%. A total of 3 respondents answered this question.
- Changes to project timeline: More than 7 days 18%. 4 to 7 days 18%. 2 to 3 days 36%. 1 day 27%. A total of 11 respondents answered this question.
- Changes to project activities: More than 7 days 25%. 2 to 3 days 25%. 1 day 50%. A total of 4 respondents answered this question.
- Changes to project funding: More than 7 days 43%. 4 to 7 days 14%. 2 to 3 days 29%. 1 day 14%. A total of 7 respondents answered this question.
- COVID-19 related changes: 4 to 7 days 29%. 2 to 3 days 29%. 1 day 43%. A total of 7 respondents answered this question.
- Other reasons: 4 to 7 days 50%. 2 to 3 days 50%. A total of 2 respondents answered this question.
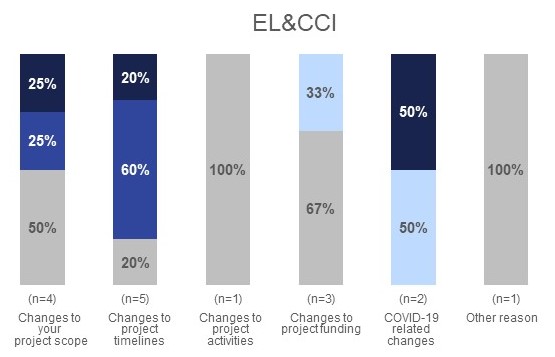
Figure 45: Amount of Time It Took to Make Changes for EL&CCI Applications
This horizontal bar chart shows responses to a question about how long it took to the make changes to their project or submit an amendment to the funding agreement among EL&CCI. Only applicants who had to made changes to an project or submit an amendment to the funding agreement were asked this question. Sample sizes vary by task:
- Changes to project scope: More than 7 days 50%. 2 to 3 days 25%. 1 day 25%. A total of 4 respondents answered this question.
- Changes to project timeline: More than 7 days 20%. 2 to 3 days 60%. 1 day 20%. A total of 5 respondents answered this question.
- Changes to project activities: More than 7 days 100%. A total of 1 respondents answered this question.
- Changes to project funding: More than 7 days 67%. 4 to 7 days 33%. A total of 3 respondents answered this question.
- COVID-19 related changes: 4 to 7 days 50%. 1 day 50%. A total of 2 respondents answered this question.
- Other reasons: More than 7 days 100%. A total of 1 respondents answered this question.
Q23. How long did the following take to complete? If you are uncertain, please provide your best guess.
Base: Had to make changes to project or submit an amendment to funding agreement (n=varies)
Day 1 2 to 3 Days 4 to 7 Days/One Week More Than 7 Day/More Than One Week
Amount of Time it Took to Make Changes (cont.)
- Changes to SDPP and FCRP projects generally took longer to resolve and in particular COVID related changes and changes to project scope for FCRP.
Please rate the following statement: The application took a reasonable amount of time to complete.
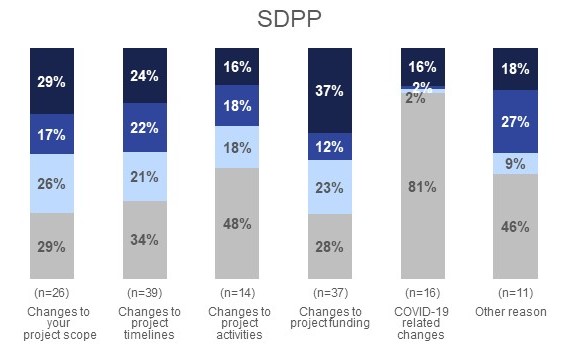
Figure 46: Amount of Time It Took to Make Changes for SDPP Applications
This horizontal bar chart shows responses to a question about how long it took to the make changes to their project or submit an amendment to the funding agreement among SDPP applicants. Only applicants who had to made changes to a project or submit an amendment to the funding agreement were asked this question. Sample sizes vary by task:
- Changes to project scope: More than 7 days 29%. 4 to 7 days 26%. 2 to 3 days 17%. 1 day 29%. A total of 26 respondents answered this question.
- Changes to project timeline: More than 7 days 34%. 4 to 7 days 21%. 2 to 3 days 22%. 1 day 24%. A total of 39 respondents answered this question.
- Changes to project activities: More than 7 days 48%. 4 to 7 days 18%. 2 to 3 days 18%. 1 day 16%. A total of 14 respondents answered this question.
- Changes to project funding: More than 7 days 28%. 4 to 7 days 23%. 2 to 3 days 12%. 1 day 37%. A total of 37 respondents answered this question.
- COVID-19 related changes: More than 7 days 81%. 4 to 7 days 2%. 2 to 3 days 2%. 1 day 16%. A total of 16 respondents answered this question.
- Other reasons: More than 7 days 46%. 4 to 7 days 9%. 2 to 3 days 27%. 1 day 18%. A total of 11 respondents answered this question.
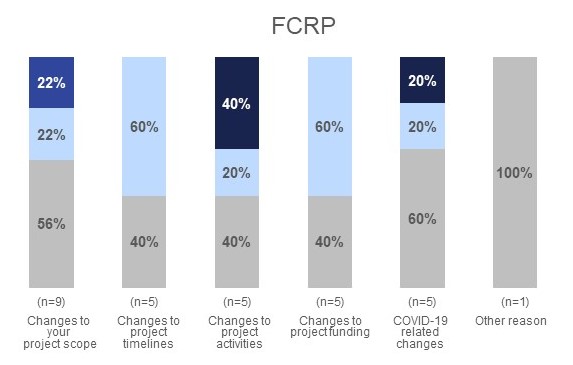
Figure 47: Amount of Time It Took to Make Changes for FCRP Applications
This horizontal bar chart shows responses to a question about how long it took to the make changes to their project or submit an amendment to the funding agreement among FCRP applicants. Only applicants who had to made changes to a project or submit an amendment to the funding agreement were asked this question. Sample sizes vary by task:
- Changes to project scope: More than 7 days 56%. 4 to 7 days 22%. 2 to 3 days 22%. A total of 9 respondents answered this question.
- Changes to project timeline: More than 7 days 40%. 4 to 7 days 60%. A total of 5 respondents answered this question.
- Changes to project activities: More than 7 days 40%. 4 to 7 days 20%. 1 day 40%. A total of 5 respondents answered this question.
- Changes to project funding: More than 7 days 40%. 4 to 7 days 60%. A total of 5 respondents answered this question.
- COVID-19 related changes: More than 7 days 60%. 4 to 7 days 20%. 1 day 20%. A total of 5 respondents answered this question.
- Other reasons: More than 7 days 100%. A total of 1 respondents answered this question.
Q23. How long did the following take to complete? If you are uncertain, please provide your best guess. Base: Had to make changes to project or submit an amendment to funding agreement (n=varies)
Day 1 2 to 3 Days 4 to 7 Days/One Week More Than 7 Day/More Than One Week
Amount of Time it Took to Make Changes (cont.)
- Though caution should be exercised due to very small base sizes, changes to IELCC and IWILI projects were generally resolved more quickly, and none took more than one week.
Please rate the following statement: The application took a reasonable amount of time to complete.
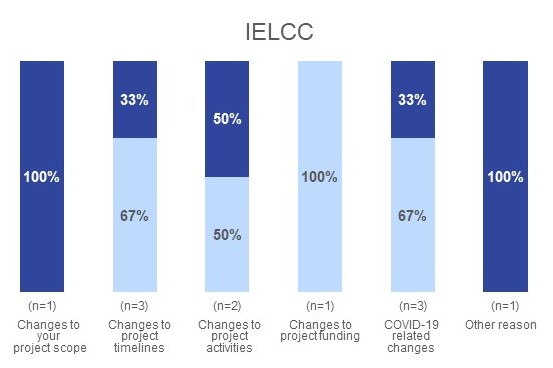
Figure 48: Amount of Time It Took to Make Changes for IELCC Applications
This horizontal bar chart shows responses to a question about how long it took to the make changes to their project or submit an amendment to the funding agreement among IELCC applicants. Only applicants who had to made changes to a project or submit an amendment to the funding agreement were asked this question. Sample sizes vary by task:
- Changes to project scope: 2 to 3 days 100%. A total of 1 respondents answered this question.
- Changes to project timeline: 4 to 7 days 67%. 2 to 3 days 22%. A total of 3 respondents answered this question.
- Changes to project activities: 4 to 7 days 50%. 2 to 3 days 50%. A total of 2 respondents answered this question.
- Changes to project funding: 4 to 7 days 100%. A total of 1 respondents answered this question.
- COVID-19 related changes: 4 to 7 days 67%. 2 to 3 days 33%. A total of 3 respondents answered this question.
- Other reasons: 2 to 3 days 100%. A total of 1 respondents answered this question.
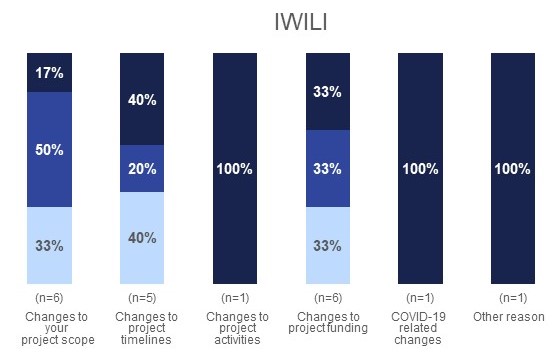
Figure 49: Amount of Time It Took to Make Changes for IWILI Applications
This horizontal bar chart shows responses to a question about how long it took to the make changes to their project or submit an amendment to the funding agreement among IWLIL applicants. Only applicants who had to made changes to a project or submit an amendment to the funding agreement were asked this question. Sample sizes vary by task:
- Changes to project scope: 4 to 7 days 33%. 2 to 3 days 50%. 1 day 17%. A total of 6 respondents answered this question.
- Changes to project timeline: 4 to 7 days 40%. 2 to 3 days 20%. 1 day 40%. A total of 5 respondents answered this question.
- Changes to project activities: 1 day 100%. A total of 1 respondents answered this question.
- Changes to project funding: 4 to 7 days 33%. 2 to 3 days 33%. 1 day 33%. A total of 6 respondents answered this question.
- COVID-19 related changes: 1 day 100%. A total of 1 respondents answered this question.
- Other reasons: 1 day 100%. A total of 1 respondents answered this question.
Q23. How long did the following take to complete? If you are uncertain, please provide your best guess. Base: Had to make changes to project or submit an amendment to funding agreement (n=varies)
Day 1 2 to 3 Days 4 to 7 Days/One Week More Than 7 Day/More Than One Week
Amount of Time it Took to Make Changes (cont.)
- Most changes to SDG projects were resolved within 3 days, with the exception of changes to project funding and COVID related changes which were more likely to take more than a week to complete.
- Though caution should be exercised due to very small base sizes, changes in SWP projects were generally resolved more quickly.
Please rate the following statement: The application took a reasonable amount of time to complete.
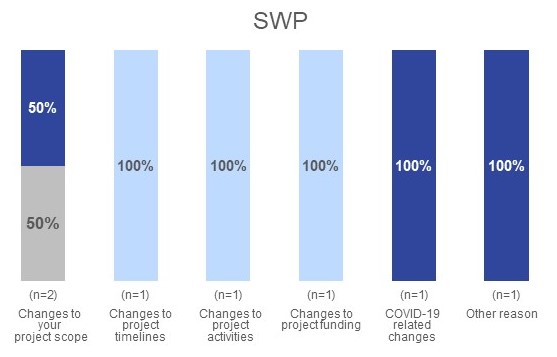
Figure 50: Amount of Time It Took to Make Changes for SWP Applications
This horizontal bar chart shows responses to a question about how long it took to the make changes to their project or submit an amendment to the funding agreement among SWP applicants. Only applicants who had to made changes to a project or submit an amendment to the funding agreement were asked this question. Sample sizes vary by task:
- Changes to project scope: More than 7 days 50%. 2 to 3 days 100%. A total of 2 respondents answered this question.
- Changes to project timeline: 4 to 7 days 100%. A total of 1 respondents answered this question.
- Changes to project activities: 4 to 7 days 100%. A total of 1 respondents answered this question.
- Changes to project funding: 4 to 7 days 100%. A total of 1 respondents answered this question.
- COVID-19 related changes: 2 to 3 days 100%. A total of 1 respondents answered this question.
- Other reasons: 2 to 3 days 100%. A total of 1 respondents answered this question.
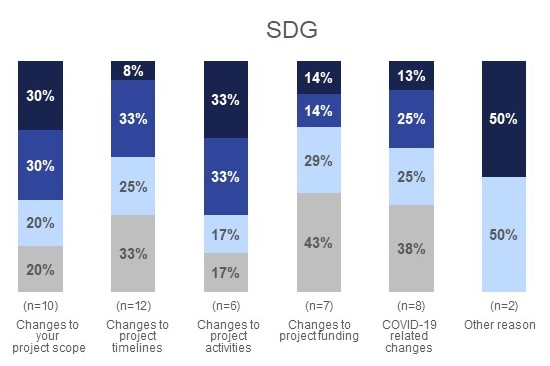
Figure 51: Amount of Time It Took to Make Changes for SDG Applications
This horizontal bar chart shows responses to a question about how long it took to the make changes to their project or submit an amendment to the funding agreement among SDP applicants. Only applicants who had to made changes to a project or submit an amendment to the funding agreement were asked this question. Sample sizes vary by task:
- Changes to project scope: More than 7 days 20%. 4 to 7 days 20%. 2 to 3 days 30%. 1 day 30%. A total of 10 respondents answered this question.
- Changes to project timeline: More than 7 days 33%. 4 to 7 days 25%. 2 to 3 days 33%. 1 day 8%. A total of 12 respondents answered this question.
- Changes to project activities: More than 7 days 17%. 4 to 7 days 17%. 2 to 3 days 33%. 1 day 33%. A total of 6 respondents answered this question.
- Changes to project funding: More than 7 days 43%. 4 to 7 days 29%. 2 to 3 days 14%. 1 day 14%. A total of 7 respondents answered this question.
- COVID-19 related changes: More than 7 days 38 %. 4 to 7 days 25%. 2 to 3 days 25%. 1 day 13%. A total of 8 respondents answered this question.
- Other reasons: 4 to 7 days 50%. 1 day 50%. A total of 2 respondents answered this question.
Q23. How long did the following take to complete? If you are uncertain, please provide your best guess.
Base: Had to make changes to project or submit an amendment to funding agreement (n=varies)
Day 1 2 to 3 Days 4 to 7 Days/One Week More Than 7 Day/More Than One Week
Post-Agreement
Monitoring, Follow-up, and Close-Out
Ease of Funding Agreement Close-Out
- Among applicants approved for funding, a strong majority felt each aspect of the funding agreement close-out was easy and ratings are consistent with Year 1.
- Applicants were most likely to feel that it was easy to submit the final project report (71%, +2 pts), complete the final project report (71%, -1 pt), submit the final budget (70%, -2 pts), and complete the final budget/final claim (69%, -1 pt). Fewer felt it was easy to resolve any outstanding issues with funding (51%, unchanged).
How would you rate the following tasks related to your funding agreement with [PROGRAM]?
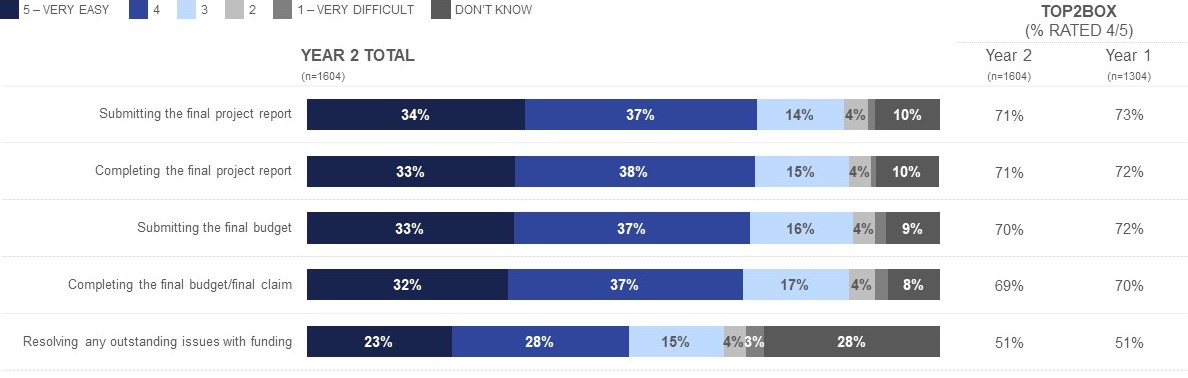
Figure 52: Ease of Funding Agreement Close-out
This horizontal bar chart shows responses to a question about how difficult or easy the applicant found different tasks required to close out their funding agreement and presents results for Year 1 and Year 2. All 1604 Year 2 respondents who received funding approval answered as follows:
- Submitting the final project report: Year 2 34% very easy, 37% somewhat easy, 14% neutral, 4% somewhat difficult, 2% very difficult, 10% not applicable. 71% easy. Year 1 73% easy.
- Completing the final project report: Year 2 33% very easy, 38% somewhat easy, 15% neutral, 4% somewhat difficult, 1% very difficult, 10% not applicable. 71% easy. Year 1 72% easy.
- Submitting the final budget: Year 2 33% very easy, 37% somewhat easy, 16% neutral, 4% somewhat difficult, 2% very difficult, 9% not applicable. 70% easy. Year 1 72% easy.
- Completing the final budget: Year 2 32% very easy, 37% somewhat easy, 17% neutral, 4% somewhat difficult, 2% very difficult, 8% not applicable. 69% easy. Year 1 70% easy.
- Resolving any outstanding issues with funding: Year 2 23% very easy, 28% somewhat easy, 15% neutral, 4% somewhat difficult, 3% very difficult, 28% not applicable. 51% easy. Year 1 51% easy.
Q24. On a scale of 1 to 5, where 1 is very difficult and 5 is very easy, how would you rate the following tasks related to your funding agreement with [INSERT PROGRAM]? Select one response per item. Base: Received approval for program funding (n=1604)
Note: values less than 3% not labelled
*small sample size
**very small sample size
Ease of Funding Agreement Close-Out by Program
- CSJ applicants were more likely to find it easy to complete most aspects of the funding agreement close-out, while applicants of almost all other programs (except for NHSP) were less likely.
- Compared to Year 1, ease of completing the various aspects of close-out has declined those who received funding from EAF and YESS.
How would you rate the following tasks related to your funding agreement with [PROGRAM]?
| Top2box (% rated 4/5) | ||||||||||||||||||||||||||||
| TOTAL UP | EAF | NHSP | CSJ | YESS (formerly SL/CF | UT&IP | EL&CCI | SDPP | FCRP | IELC | IWILI | SWP | SDG | All but EAF, NHSP, CSJ | |||||||||||||||
| Year 2 | Year 1 | Year 2 | Year 1 | Year 2 | Year 1 | Year 2 | Year 1 | Year 2 | Year 1 | Year 2 | Year 1 | Year 2 | Year 1 | Year 2 | Year 1 | Year 2 | Year 1 | Year 2 | Year 1 | Year 2 | Year 1 | Year 2 | Year 1 | Year 2 | Year 1 | Year 2 | Year 1 | |
| Base: Received funding approval – n= | 1604 | 1304 | 161 | 38 | 320 | 323 | 759 | 848 | 131 | 20* | 30 | 24* | 8** | 2** | 136 | 13* | 15* | n/a | 5** | n/a | 8** | n/a | 3** | n/a | 25* | n/a | 364 | 95 |
|---|---|---|---|---|---|---|---|---|---|---|---|---|---|---|---|---|---|---|---|---|---|---|---|---|---|---|---|---|
| Submitting the final project report | 71% | 73% | 33% | 61% | 68% | 67% | 77% | 74% | 49% | 80% | 30% | 38% | 13% | 50% | 32% | 54% | 33% | - | 20% | - | 25% | - | 33% | - | 36% | - | 36% | 56% |
| Completing the final project report | 71% | 72% | 36% | 55% | 65% | 66% | 77% | 73% | 44% | 70% | 27% | 29% | 13% | 50% | 29% | 46% | 33% | - | 40% | - | 25% | - | 33% | - | 32% | - | 33% | 52% |
| Submitting the final budget | 70% | 72% | 42% | 71% | 68% | 67% | 74% | 72% | 42% | 70% | 53% | 54% | 38% | 50% | 41% | 46% | 44% | - | 40% | - | 38% | - | 33% | - | 44% | - | 42% | 53% |
| Completing the final budget/final claim | 69% | 70% | 41% | 66% | 66% | 68% | 74% | 71% | 42% | 65% | 47% | 54% | 25% | 50% | 38% | 39% | 44% | - | 60% | - | 25% | - | 33% | - | 32% | - | 39% | 50% |
| Resolving any outstanding issues with funding | 51% | 51% | 29% | 47% | 46% | 51% | 54% | 51% | 47% | 65% | 37% | 38% | 25% | 50% | 27% | 46% | 50% | - | 20% | - | 38% | - | 33% | - | 32% | - | 34% | 50% |
Q24. On a scale of 1 to 5, where 1 is very difficult and 5 is very easy, how would you rate the following tasks related to your funding agreement with [INSERT PROGRAM]? Select one response per item.
Base: Received approval for program funding (n=1604)
* small sample size
** very small sample size
Significantly higher / lower than total
Significantly higher/lower than Year 1
Service Standards
Awareness of Service Standards
- Nearly half of applicants (48%, +11 pts) were aware of the stated service standards regarding issuing payment once a payment claim has been submitted, followed by just over 4 in 10 (43%, +9 pts) for acknowledging the submission of a funding application and slightly fewer (39%) for issuing a funding decision notification.
- NHSP and UT&IP applicants were more likely to be aware of service standards regarding time to acknowledge the submission and issue a funding decision, while applicants to all programs but EAF, NHSP, and CSJ were less likely to be aware.
- Results for issuing a funding decision notification should be interpreted with caution as this standard was new in fiscal year 2021/22 and may not have been in place when the organization applied.
Before today, were you aware of each of these service standards? – % Yes
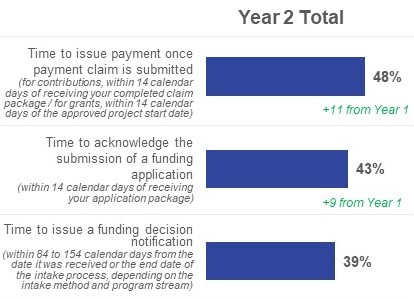
Figure 53: Awareness of Service Standards
This horizontal bar chart shows responses to a question about whether the applicant was aware of service standards related to the time to acknowledge the submission and time to issue payment in. Results were reported based on those who said yes they were aware.
- Total: 48% time to issue payment once payment claim is submitted, 43% time to acknowledge the submission of a funding application, 39% time to issue a funding decision notification. A total of 1942 respondents answered this question.
| % YES | |||||||||||||
| EAF | NHSP | CSJ | YESS (formerly SL/CF | UT&IP | EL&CCI | SDPP | FCRP | IELC | IWILI | SWP | SDG | All but EAF, NHSP, CSJ | |
| (n=207) | (n=384) | (n=865) | (n=152) | (n=32)* | (n=65) | (n=153) | (n=20)* | (n=8)** | (n=13)** | (n=4)** | (n=39)* | (n=486) | |
| Time to issue payment once payment claim is submitted (for contributions, within 14 calendar days of receiving your completed claim package / for grants, within 14 calendar days of the approved project start date) |
47% | 53% | 47% | 46% | 59% | 26% | 42% | 50% | 38% | 39% | 50% | 39% | 41% |
|---|---|---|---|---|---|---|---|---|---|---|---|---|---|
| Time to acknowledge the submission of a funding application (within 14 calendar days of receiving your application package) |
42% | 49% | 42% | 40% | 63% | 40% | 36% | 55% | 38% | 46% | 25% | 44% | 40% |
| Time to issue a funding decision notification (within 84 to 154 calendar days from the date it was received or the end date of the intake process, depending on the intake method and program stream) |
33% | 51% | 38% | 29% | 59% | 20% | 25% | 40% | 50% | 39% | 25% | 33% | 29% |
Q33. Before today, were you aware of each of these service standards?
Base: All respondents (n=1942)
Note: “Time to issue a funding decision notification” was new in fiscal year 2021/22 and may not have been in place when the organization applied.
* small sample size
** very small sample size
Significantly higher / lower than total
Impact of Awareness of Service Standards – Acknowledge Proposal
- Applicants who were aware of the service standard for the time to acknowledge the submission were more likely to be satisfied with their experience overall than those who were not. They were more satisfied with the service channels they used, in particular the Government of Canada website and phone and/or email support from a Service Canada office and were less likely to report having experienced a problem or issue. They were also more likely to provide higher ratings for several aspects of service including the overall timeliness, clarity of the process, confidence in and clarity of the issue resolution process and ease of getting help.
- Compared to Year 1, applicants who were not aware of the service standard for the time to acknowledge the submission were more likely to be satisfied overall and to provide higher ratings for the service provided through the GCOS web portal, GoC website and email support from a Service Canada office and across several aspects of service. Fewer of both groups experienced a problem during their experience and provided higher ratings for the timeliness of service.
| Overall satisfaction (% rated 4/5) |
|||
|---|---|---|---|
| Year 2 | Year 1 | Year 2 | Year 1 |
| Aware | Not Aware | ||
| 83% | 80% | 73% | 64% |
| Aware | Not Aware | |||
|---|---|---|---|---|
| Year 2 | Year 1 | Year 2 | Year 1 | |
| Experienced a problem |
||||
| % Yes |
18% | 26% | 26% | 39% |
| Service channel satisfaction |
||||
| Email support from a Program Officer | 83% | 87% | 75% | 77% |
| GCOS web portal | 78% | 74% | 74% | 63% |
| Government of Canada website | 74% | 75% | 68% | 61% |
| Email support from a Service Canada office | 74% | 74% | 67% | 60% |
| Phone support from a Service Canada office | 67% | 68% | 55% | 58% |
| Aware | Not Aware | |||
|---|---|---|---|---|
| Year 2 | Year 1 | Year 2 | Year 1 | |
| Widest gap in service attributes (% rated 4/5 vs. Total) |
||||
| The amount of time it took, from when I started gathering information to when I got a decision on my application, was reasonable |
76% | 71% | 59% | 49% |
| Throughout the process it was clear what would happen next and when it would happen | 78% | 74% | 63% | 50% |
| It was clear what to do if I had a problem or question | 78% | 75% | 64% | 54% |
| I was confident that any issues or problems would have been easily resolved | 76% | 75% | 66% | 57% |
| It was easy to get help when I needed it | 75% | 73% | 65% | 55% |
Note: Figures for ‘[PROGRAM] web portal’ is reported in Year 1 and compared with ‘GCOS web portal’ in Year 2.
Significantly higher / lower than total
Significantly higher/lower than Year 1
Impact of Awareness of Service Standards – Issue Payment
- Applicants who were aware of the service standard for the time to issue payment were more likely to be satisfied with their experience overall than those who were not. They were more satisfied with the service channels they used, in particular the Government of Canada website and email support from a Program Officer or Service Canada office and were less likely to report having experienced a problem or issue. They were also more likely to provide higher ratings for several aspects of service including the overall timeliness, confidence in and clarity of the issue resolution process, clarity of the process overall and ease of getting help.
- Compared to Year 1, satisfaction has increased among both groups as have ratings for timeliness of service, while fewer experienced a problem. Applicants who were not aware of the service standard for the time to issue payment were also more likely to higher ratings for the service provided through the GCOS web portal and GoC website and across several aspects of service.
| Overall satisfaction (% rated 4/5) |
|||
|---|---|---|---|
| Year 2 | Year 1 | Year 2 | Year 1 |
| Aware | Not Aware | ||
| 84% | 78% | 71% | 65% |
| Aware | Not Aware | |||
|---|---|---|---|---|
| Year 2 | Year 1 | Year 2 | Year 1 | |
| Experienced a problem |
||||
| % Yes |
17% | 26% | 27% | 40% |
| Service channel satisfaction |
||||
| Email support from a Program Officer | 83% | 85% | 73% | 78% |
| GCOS web portal | 79% | 73% | 73% | 63% |
| Email support from a Service Canada office | 77% | 75% | 64% | 59% |
| Government of Canada website | 75% | 75% | 67% | 61% |
| Phone support from a Service Canada office | 65% | 66% | 56% | 59% |
| Aware | Not Aware | |||
|---|---|---|---|---|
| Year 2 | Year 1 | Year 2 | Year 1 | |
| Widest gap in service attributes (% rated 4/5 vs. Total) |
||||
| It was clear what to do if I had a problem or question |
80% | 76% | 62% | 54% |
| The amount of time it took, from when I started gathering information to when I got a decision on my application, was reasonable | 75% | 69% | 58% | 49% |
| I was confident that any issues or problems would have been easily resolved | 79% | 76% | 63% | 56% |
| Throughout the process it was clear what would happen next and when it would happen | 77% | 74% | 62% | 50% |
| It was easy to get help when I needed it | 77% | 74% | 62% | 54% |
Note: Figures for ‘[PROGRAM] web portal’ is reported in Year 1 and compared with ‘GCOS web portal’ in Year 2
Significantly higher / lower than total
Significantly higher/lower than Year 1
Impact of Awareness of Service Standards – Decision Notification
- Applicants who were aware of the service standard for the time to issue a funding decision were more likely to be satisfied with their experience overall than those who were not. They were more satisfied with virtually all service channels they used and were less likely to report having experienced a problem or issue. They were also more likely to provide higher ratings for several aspects of service including clarity of the process, overall timeliness, confidence in and clarity of the issue resolution process, and ease of getting help.
| Overall satisfaction (% rated 4/5) |
|
|---|---|
| Aware | Not Aware |
| 85% | 73% |
| Aware | Not Aware | |
| Experienced a problem |
||
|---|---|---|
| % Yes |
19% | 24% |
| Service channel satisfaction |
||
| Email support from a Program Officer | 84% | 74% |
| GCOS web portal | 82% | 72% |
| Email support from a Service Canada office | 75% | 66% |
| Government of Canada website | 75% | 68% |
| Phone support from a Service Canada office | 65% | 58% |
| Aware | Not Aware | |
| Widest gap in service attributes (% rated 4/5 vs. Total) |
||
|---|---|---|
| Throughout the process it was clear what would happen next and when it would happen |
80% | 63% |
| The amount of time it took, from when I started gathering information to when I got a decision on my application, was reasonable | 77% | 60% |
| It was clear what to do if I had a problem or question | 79% | 65% |
| I was confident that any issues or problems would have been easily resolved | 78% | 66% |
| It was easy to get help when I needed it | 80% | 65% |
NNew question added in Year 2 to measure awareness of service standard for decision notification.
Note: Figures for ‘[PROGRAM] web portal’ is reported in Year 1 and compared with ‘GCOS web portal’ in Year 2.
Significantly higher / lower than total
Significantly higher/lower than Year 1
GBA+
Communities Supported by Funding Application
- Virtually all applicants (97%) reported that the funding they applied for would support at least one of the communities, clients or people outlined. Nearly three-quarters (73%) of applicant organizations said the funding would support those who identify as youth, followed by women (63%), those belonging to a minority racial or ethnic background (62%), low socio-economic status (53%) and Black Canadians (52%). Compared to Year 1, a greater proportion of organizations indicated that funding would support those belonging to a minority racial or ethnic background or Black Canadians, while fewer mentioned those who identify as belonging to a religious group.
- YESS, SDPP and NHSP applicant organizations were more likely to say that funding would support at least once of the groups outlined, while SWP applicants were less likely. Notably, YESS and to a lesser extent UT&IP applicant organizations were more likely to support multiple groups.
Would the funding you applied for assist any of the following communities, clients or people?
| TOTAL UP | EAF | NHSP | CSJ | YESS (formerly SL/CF) | UT&IP | EL&CCI | SDPP | FCRP | IELC | IWILI | SWP | SDG | All but EAF, NHSP, CSJ | ||||||||||
| Year 2 | Year 1 | Year 2 | Year 1 | Year 2 | Year 1 | Year 2 | Year 1 | Year 2 | Year 1 | Year 2 | Year 1 | Year 2 | Year 1 | Year 2 | Year 1 | Year 2 | Year 1 | Year 2 | Year 1 | Year 2 | Year 1 | Year 2 | |
| Base: All respondents – n= | 1942 | 1549 | 207 | 56 | 384 | 431 | 865 | 942 | 152 | 25* | 32 | 26* | 65 | 5** | 153 | 17* | 20* | 8** | 13* | 4** | 39 | 486 | 120 |
|---|---|---|---|---|---|---|---|---|---|---|---|---|---|---|---|---|---|---|---|---|---|---|---|
| At least one (NET) | 97% | - | 98% | - | 99% | - | 96% | - | 100% | - | 100% | - | 95% | - | 100% | - | 95% | 88% | 100% | 75% | 92% | 98% | - |
| Those who identify as youth | 73% | - | 44% | - | 28% | - | 83% | - | 96% | - | 69% | - | 51% | - | 75% | - | 10% | 50% | 62% | 75% | 64% | 72% | - |
| Those who identify as women | 63% | 64% | 47% | 43% | 60% | 63% | 64% | 65% | 75% | 76% | 91% | 96% | 75% | 60% | 65% | 53% | 55% | 63% | 62% | 75% | 72% | 70% | 68% |
| Those who identify as belonging to a minority racial or ethnic background | 62% | 58% | 39% | 32% | 51% | 56% | 64% | 58% | 77% | 76% | 88% | 85% | 77% | 20% | 81% | 47% | 55% | 50% | 62% | 25% | 69% | 76% | 68% |
| Those who identify as a low socio-economic status | 53% | - | 44% | - | 55% | - | 52% | - | 77% | - | 63% | - | 75% | - | 61% | - | 20% | 63% | 31% | 50% | 62% | 65% | - |
| Those who identify as Black Canadians | 52% | 45% | 32% | 29% | 35% | 38% | 54% | 46% | 69% | 64% | 81% | 85% | 59% | 20% | 96% | 18% | 25% | 13% | 85% | 25% | 51% | 74% | 51% |
| Those who identify as Indigenous | 45% | 48% | 33% | 38% | 35% | 41% | 47% | 48% | 77% | 68% | 88% | 100% | 60% | 20% | 21% | 35% | - | 88% | 62% | 50% | 62% | 48% | 60% |
| Those who identify as having a mental or physical disability | 43% | 42% | 84% | 91% | 49% | 51% | 40% | 40% | 71% | 56% | 50% | 54% | 48% | 40% | 28% | 47% | 5% | 13% | 54% | 25% | 44% | 43% | 58% |
| Those who identify as newcomers to Canada | 41% | - | 32% | - | 38% | - | 40% | - | 57% | - | 69% | - | 62% | - | 67% | - | 80% | 25% | 54% | 25% | 41% | 59% | - |
| Those who identify as lesbians, gay, bisexuals, queers or other sexual minorities | 40% | - | 31% | - | 32% | - | 42% | - | 63% | - | 69% | - | 35% | - | 27% | - | 20% | 50% | 31% | 50% | 33% | 39% | - |
Q34. Would the funding you applied for assist any of the following communities, clients or people?
* small sample size
** very small sample size
Significantly higher / lower than total
Significantly higher/lower than Year 1
Communities Supported by Funding Application (cont.)
Would the funding you applied for assist any of the following communities, clients or people?
| TOTAL UP | EAF | NHSP | CSJ | YESS (formerly SL/CF) | UT&IP | EL&CCI | SDPP | FCRP | IELC | IWILI | SWP | SDG | All but EAF, NHSP, CSJ | ||||||||||
| Year 2 | Year 1 | Year 2 | Year 1 | Year 2 | Year 1 | Year 2 | Year 1 | Year 2 | Year 1 | Year 2 | Year 1 | Year 2 | Year 1 | Year 2 | Year 1 | Year 2 | Year 1 | Year 2 | Year 1 | Year 2 | Year 1 | Year 2 | |
| Base: All respondents – n= | 1942 | 1549 | 207 | 56 | 384 | 431 | 865 | 942 | 152 | 25* | 32 | 26* | 65 | 5** | 153 | 17* | 20* | 8** | 13* | 4** | 39 | 486 | 120 |
|---|---|---|---|---|---|---|---|---|---|---|---|---|---|---|---|---|---|---|---|---|---|---|---|
| At least one (NET) | 97% | - | 98% | - | 99% | - | 96% | - | 100% | - | 100% | - | 95% | - | 100% | - | 95% | 88% | 100% | 75% | 92% | 98% | - |
| Those who identify as senior | 37% | - | 71% | - | 96% | - | 26% | - | 8% | - | 31% | - | 12% | - | 43% | 5% | 25% | 23% | 25% | 39% | 29% | - | |
| Those who identify as trans, non-binary, other gender, gender-diverse or queer people | 37% | - | 30% | - | 28% | - | 39% | - | 62% | - | 66% | - | 37% | - | 25% | 20% | 50% | 39% | 50% | 36% | 38% | - | |
| Those who identify as an immigrant or a non-permanent resident | 35% | - | 28% | - | 37% | - | 33% | - | 45% | - | 50% | - | 60% | - | 58% | 80% | 25% | 31% | 25% | 36% | 51% | - | |
| Those who identify as Two-Spirited or Indigenous LGBTQIA+ people | 33% | - | 25% | - | 27% | - | 35% | - | 59% | - | 59% | - | 28% | - | 16% | 10%% | 50% | 31% | 50% | 33% | 32% | - | |
| English or French-language minority community | 29% | - | 24% | - | 31% | - | 29% | - | 32% | - | 56% | - | 43% | - | 29% | 5% | - | 54% | 25% | 31% | 31% | - | |
| Those who identify as belonging to a religious group | 27% | 32% | 30% | 30% | 25% | 34% | 27% | 32% | 24% | 36% | 44% | 62% | 26% | 20% | 36% | 24% | 5% | 13% | 23% | 25% | 21% | 29% | 27% |
| Those who identify as veterans | 17% | - | 31% | - | 34% | - | 13 | - | 5% | - | 63% | - | 6% | - | 15% | 5% | 13% | 8% | 25% | 18% | 13% | - | |
| Those who are experiencing homelessness and/or currently unhoused | 17% | - | 21% | - | 16% | - | 16% | - | 51% | - | 19% | - | 20% | - | 23% | - | 5% | 38% | 15% | 25% | 15% | 27% | - |
| None of the above | 3% | - | 2% | - | 1% | - | 4% | - | - | - | - | - | 5% | - | - | 6% | 5% | 13% | - | 25% | 8% | 2% | - |
Q34. Would the funding you applied for assist any of the following communities, clients or people?
* small sample size
** very small sample size
Significantly higher / lower than total
Significantly higher/lower than Year 1
Profile of Applicants Who Assist GBA+ Communities
- Overall satisfaction is consistent among applicants who assist GBA+ communities and those who do not. In addition, overall satisfaction among those who assist GBA+ communities has increased compared to Year 1.
- While overall satisfaction is consistent between groups, applicants who assist GBA+ communities were more likely to provide high ratings across several aspects of the application process.
- Applicants who assist GBA+ communities also required a greater number of contacts during their experience, were more likely to operate or intend on providing services in the West/ Territories, less likely to be solely responsible for the funding application and were more likely to be a non-for-profit organization and less likely to be in the public or private sector.
| Overall satisfaction (% rated 4/5) |
|||
|---|---|---|---|
| Assist GBA+ | Do Not | ||
| Year 2 | Year 1 | Year 2 | Year 1 |
| 77% | 70% | 73% | 69% |
Prominent Differences Among Applicants Who Assist Gba+ Communities (Compared To Those Who Do Not)
- Those who assist GBA+ communities were more likely to provide high ratings across several service attributes (compared to those who do not):
- It was clear what to do if I had a problem or question (70% vs. 49%)
- Understanding the requirements of the application (77% vs. 59%)
- Overall, it was easy for me to apply for [program] (80% vs. 63%)
- I needed to explain my situation only once (67% vs. 50%)
- It was easy to get help when I needed it (69% vs. 54%)
- I was able to move smoothly through all of the steps related to the [program] application (78% vs. 64%)
- I was provided with service in my choice of English or French (94% vs. 81%)
- It was easy to access service in a language I could speak and understand well (92% vs. 81%)
- Higher number of contacts with Service Canada (31% were in contact 10 times or more vs. 14%)
- More likely to operate (33% vs. 16%) and intend on providing services in the West/ Territories (34% vs. 18%)
- Less likely to be solely responsible for completing the funding application (60% vs. 76%)
- More likely to be not-for-profit (85% vs. 67%) and less likely to be in the public (12% vs. 30%) or private sector (14% vs. 28%)
Experienced Discrimination in Application Process
- Overall, 3% of applicants report having felt discriminated against on the basis of identity during their experience with Service Canada. While still very low, this figure is statistically higher than in Year 1 (2%). Among those who felt discriminated, the most common grounds were race or colour and compared to Year 1 a greater proportion cite race while fewer mention religion or religious identity.
- Applicants to EL&CCI, SDPP and SDG were more likely to have felt discriminated against on the basis of identity.
Thinking about your experience with Service Canada, throughout the entire application process, have you ever felt discriminated against on the basis of your identity?
On which grounds did you feel discriminated against?
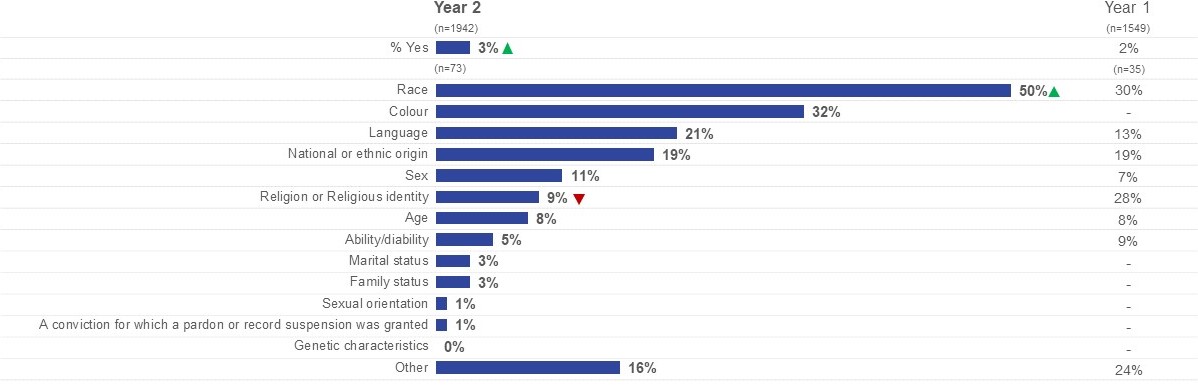
Figure 54: Experienced Discrimination in Application Process.
This horizontal bar chart shows responses to a question about whether the applicant felt discriminated against on the basis of their identity through the application process and presents results for Year 1 and Year 2. A total of 1942 Year 2 respondents answered this question.
- • Total: Year 2 3% of respondents felt discriminated against. Year 1 2%.
- Total: Year 2 3% of respondents felt discriminated against. Year 1 2%.
- Colour: Year 2 32%. Year 1 0%.
- Language: Year 2 21%. Year 1 13%.
- National or ethnic origin: Year 2 19%. Year 1 19%.
- Sex: Year 2 11%. Year 1 7%.
- Religious identity: Year 2 9%. Year 1 28%.
- Age: Year 2 8%. Year 1 8%.
- Ability/disability: Year 2 5%. Year 1 9%.
- Marital status: Year 2 3%. Year 1 0%.
- Family status: Year 2 3%. Year 1 0%.
- Sexual orientation: Year 2 1%. Year 1 0%.
- A conviction for which a pardon or record suspension was granted: Year 2 1%. Year 1 0%.
- Genetic characteristics: Year 2 0%. Year 1 0%.
- Other: Year 2 16%. Year 1 24%.
Q43. Thinking about your experience with Service Canada, throughout the entire application process, have you ever felt discriminated against on the basis of your identity?
Q44. On which grounds did you feel discriminated against? Select all that apply.
Note: these questions were optional and applicants were not required to provide a response.
Significantly higher/lower than Year 1
Analysis By Applicant Groups
Key differences by region, program complexity, application frequency, number of employees and industry sector
Overall Satisfaction by Region (Operate in)
- At more than eight in ten (83%), applicant organizations which operate in Quebec reported the highest level of satisfaction with their experience and were more likely to be satisfied compared to all clients. Eight in ten (81%) organizations in Atlantic Canada were satisfied, followed by three-quarters (76%) of those in Ontario, while closer to seven in ten (72%) applicant organizations in the West or Territories which is lower compared to all client.
- Compared to Year 1, satisfaction has improved among applicant organizations which operate in Quebec, Atlantic Canada and Ontario.
Note: Applicants were asked about the province or territory where their organization operates and where it would deliver project activities to better understand regional variation in results.
Service Canada operates in 5 regions however given applicants would be unaware of where their applications were processed it is difficult to capture regional satisfaction at that level.
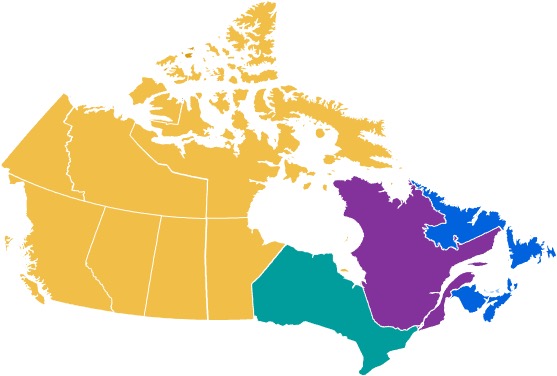
| Overall satisfaction (% rated 4/5) |
|
|---|---|
| Year 2 | 77% |
| Year 1 | 70% |
| West/Territories | |
|---|---|
| Year 2 | 72% |
| Year 1 | 70% |
| Ontario | |
|---|---|
| Year 2 | 76% |
| Year 1 | 62% |
| Atlantic | |
|---|---|
| Year 2 | 81% |
| Year 1 | 70% |
| Quebec | |
|---|---|
| Year 2 | 83% |
| Year 1 | 75% |
Q31. On a scale from 1 to 5, where 1 means very dissatisfied and 5 means very satisfied, how satisfied or dissatisfied were you with the overall service you received from Service Canada from getting information about [INSERT PROGRAM] to receiving a funding decision?
Base: All respondents
Significantly higher / lower than total
Significantly higher/lower than Year 1
Key Differences by Region (Operate in) (cont.)
- Applicant organizations in Atlantic Canada were less likely to feel it was easy to determine the steps to apply and find out what information you need to provide compared to all clients.
- Compared to Year 1, applicant organizations which operate in Ontario were more likely to have been satisfied with the service provided through the GCOS web portal and email support from a Service Canada office, to feel it was easy to understand information about the program and determine the steps to apply and to received funding approval. Applicant organizations in the West/ Territories were more likely to have been satisfied with the service provided through the GCOS web portal and Government of Canada website, while those in Atlantic Canada were less likely to be satisfied with the service provided through telephone support from a Service Canada office.
- Applicant organizations from all regions were less likely to have experienced a problem compared to Year 1.
Would the funding you applied for assist any of the following communities, clients or people?
| TOTAL UP | WEST/TERR | ONTARIO | QUEBEC | ATLANTIC | ||||||
| Year 2 | Year 1 | Year 2 | Year 1 | Year 2 | Year 1 | Year 2 | Year 1 | Year 2 | Year 1 | |
| Experienced a Problem | ||||||||||
|---|---|---|---|---|---|---|---|---|---|---|
| % Yes | 22% | 35 | 25% | 34% | 22% | 45% | 21% | 30% | 19% | 26% |
| Funding Approval | ||||||||||
| % Approved | 93% | 90% | 91% | 90% | 95% | 88% | 95% | 91% | 92% | 91% |
| Service Channel Satisfaction | ||||||||||
| GCOS web portal | 76% | 67% | 73% | 63% | 75% | 64% | 80% | 72% | 82% | 73% |
| Government of Canada website | 71% | 66% | 70% | 63% | 69% | 64% | 71% | 68% | 74% | 70% |
| Email support from SC office | 70% | 65% | 66% | 63% | 69% | 58% | 71% | 66% | 71% | 76% |
| Telephone support from a Service Canada office | 61% | 61% | 55% | 59% | 68% | 59% | 56% | 53% | 58% | 77% |
| Ease of Navigating GoC website (% Rated 4/5) | ||||||||||
| Understand the information about [program] | 80% | 76% | 76% | 76% | 81% | 72% | 78% | 75% | 75% | 77% |
| Determine the steps to apply for funding | 81% | 78% | 82% | 80% | 83% | 76% | 81% | 76% | 74% | 80% |
| Find out what information you need to provide when applying for [program] | 79% | 78% | 77% | 77% | 82% | 77% | 79%% | 79% | 71% | 80% |
Significantly higher / lower than total
Significantly higher/lower than Year 1
- Applicant organizations in Quebec were more likely to have been in contact with Service Canada 1 to 3 times during the process (fewer 10+ times) and less likely to feel it was easy to complete the narrative questions, while those in Atlantic Canada were more likely to report that their organization applies for the same program on an annual basis.
- Compared to Year 1, applicant organizations in Ontario and the West/ Territories were more likely to feel it was easy to complete a number of aspects of the application process (mirroring overall trends), were more likely to have been in contact with Service Canada fewer times (increase in 1 to 3, decrease in 10+) and were more likely to be first time applicants to the program.
- Compared to Year 1, organizations in Quebec were less likely to feel it was easy to put together the information needed and complete the project timelines or to indicate applying for the same program on an annual basis and were more likely to were more likely to have been in contact with Service Canada fewer times (increase in 1 to 3, decrease in 10+).
| TOTAL | WEST/TERR | ONTARIO | QUEBEC | ATLANTIC | ||||||
| Year 2 | Year 1 | Year 2 | Year 1 | Year 2 | Year 1 | Year 2 | Year 1 | Year 2 | Year 1 | |
| Ease of Application Process (% Rated 4/5) | ||||||||||
|---|---|---|---|---|---|---|---|---|---|---|
| Understanding the requirements of the application | 76% | 73 | 76% | 70% | 78% | 71% | 73% | 75% | 80% | 76% |
| Putting together the information you needed to apply for [program] | 74% | 69% | 73% | 64% | 75% | 66% | 72% | 78% | 75% | 68% |
| Completing the narrative questions | 70% | 64% | 72% | 61% | 72% | 65% | 64% | 68% | 72% | 60% |
| Completing the project timeline | 75% | 75% | 74% | 75% | 74% | 72% | 72% | 79% | 77% | 76% |
| Meeting the requirements of the application | 80% | 77% | 79% | 74% | 81% | 77% | 77% | 78% | 84% | 76% |
| Total Number of Times of Contacting SC | ||||||||||
| 1-3 times | 19% | 12% | 15% | 10% | 16% | 10% | 24% | 17% | 20% | 11% |
| 4-6 times | 21% | 19% | 22% | 16% | 18% | 15% | 22% | 24% | 19% | 23% |
| 7-9 times | 13% | 15% | 15% | 18% | 14% | 15% | 11% | 12% | 11% | 15% |
| 10+ times | 28% | 41% | 30% | 44% | 34% | 48% | 23% | 34% | 28% | 37% |
| Application Frequency | ||||||||||
| First application | 19% | 13% | 23% | 13% | 20% | 12% | 18% | 14% | 14% | 13% |
| Applied once or twice before | 19% | 20% | 19% | 20% | 19% | 22% | 21% | 17% | 19% | 18% |
| Applied several times before | 25% | 26% | 25% | 29% | 24% | 26% | 27% | 24% | 21% | 24% |
| Apply for the same program on an annual basis | 35% | 41% | 32% | 38% | 34% | 39% | 35% | 43% | 45% | 46% |
Significantly higher / lower than total
Significantly higher/lower than Year 1
- Applicant organizations in Quebec were more likely to agree that it was clear what would happen next and when, that it was easy to apply, they received consistent information and the amount of time it took was reasonable. Organizations in the West/ Territories were less likely to agree that it was clear what would happen next and when, that they were confident any issues or problems would be easily resolved, that it was easy to get help when needed, easy to apply and they received consistent information, while those from Ontario were less likely to feel the process was clear and that the amount of time it took was reasonable.
- Compared to Year 1, applicant organizations in Ontario were more likely to be satisfied with several aspects of service (mirroring overall trends) and less likely to agree that their personal information was protected. Fewer statistically significant differences were noted in other regions; however all experience the same shifts (at least on a directional basis) as observed among all clients.
| TOTAL | WEST/ TERR | ONTARIO | QUEBEC | ATLANTIC | ||||||
| Year 2 | Year 1 | Year 2 | Year 1 | Year 2 | Year 1 | Year 2 | Year 1 | Year 2 | Year 1 | |
| Widest Gap/ Shifts in Service Attributes (% Rated 4/5) | ||||||||||
|---|---|---|---|---|---|---|---|---|---|---|
| I was able to move smoothly through all of the steps | 78% | 70% | 75% | 69% | 77% | 68% | 82% | 71% | 79% | 72% |
| It was clear what to do if I had a problem or question. | 70% | 62% | 67% | 59% | 68% | 57% | 73% | 67% | 75% | 67% |
| Throughout the process it was clear what would happen next and when it would happen. | 69% | 58% | 62% | 53% | 64% | 51% | 82% | 66% | 72% | 64% |
| I was confident that any issues or problems would have been easily resolved. | 70% | 63% | 65% | 60% | 68% | 55% | 74% | 67% | 74% | 72% |
| I needed to explain my situation only once. | 67% | 62% | 65% | 63% | 64% | 54% | 71% | 69% | 72% | 70% |
| It was easy to get help when I needed it. | 69% | 61% | 64% | 59% | 68% | 53% | 72% | 70% | 72% | 68% |
| Overall, it was easy for me to apply for [program] | 79% | 74% | 75% | 71% | 80% | 71% | 84% | 78% | 79% | 71% |
| I was provided with service in my choice of English or French. | 93% | 96% | 92% | 94% | 92% | 94% | 93% | 99% | 93% | 97% |
| I was confident that my personal information was protected. | 83% | 88% | 83% | 85% | 82% | 90% | 84% | 89% | 85% | 89% |
| I received consistent information | 76% | 72% | 72% | 69% | 73% | 61% | 82% | 83% | 79% | 77% |
| It was easy to access service in a language I could speak and understand well | 91% | 95% | 89% | 95% | 91% | 93% | 92% | 96% | 93% | 96% |
| The amount of time it took was reasonable. | 66% | 56% | 63% | 54% | 62% | 52% | 72% | 59% | 70% | 65% |
Significantly higher / lower than total
Significantly higher/lower than Year 1
Overall Satisfaction by Region (Deliver Project Activities*)
- For Year 2, a new classification question was asked assess which provinces or territories organizations would deliver project activities in related to the program they applied for.
- Responses to the question were nearly identical to provinces or territories which organizations operate in and the same trends were observed across differences in the service experience by region of operation as presented on the previous slides.
- At more than eight in ten (82%), applicant organizations which operate in Quebec reported the highest level of satisfaction with their experience and were more likely to be satisfied compared to all clients. Eight in ten (80%) organizations in Atlantic Canada were satisfied, followed by three-quarters (75%) of those in Ontario, while closer to seven in ten (72%) applicant organizations in the West or Territories which is lower compared to all client.
| Overall satisfaction (Rated 4 or 5) |
|
|---|---|
| Year 2 | 77% |
| West/Territories | |
|---|---|
| Year 2 | 72% |
| Ontario | |
|---|---|
| Year 2 | 75% |
| Atlantic | |
|---|---|
| Year 2 | 80% |
| Quebec | |
|---|---|
| Year 2 | 82% |
Q31. On a scale from 1 to 5, where 1 means very dissatisfied and 5 means very satisfied, how satisfied or dissatisfied were you with the overall service you received from Service Canada from getting information about [INSERT PROGRAM] to receiving a funding decision?
Base: All respondents *classification question regarding which region organizations deliver project activities in was added in Year 2
Significantly higher / lower than total
Key Differences by Program Complexity
- For the purpose of this study, program complexity has been defined by low, moderate and high as outlined in the table below and is based on the length of time to complete the review of an application. Canada Summer Jobs does not fit into these distinct clusters and has been analyzed as a separate group (See also slide 21).
- Overall, applicants for moderate and high complexity programs were less likely to be satisfied with the service experience. Nearly eight in ten applicants to CSJ (79%) and low complexity programs (78%) were satisfied, followed by six in ten (63%) applicants to moderate complexity programs and two in ten (19%) among high complexity programs.
- Compared to Year 1, satisfaction has increased among applicants to CSJ and decreased among applicants to high complexity programs.
| Overall satisfaction (Rated 4 or 5) | |||||||
|---|---|---|---|---|---|---|---|
| CSJ | Low Complexity | Moderate Complexity | High Complexity | ||||
| 79% | 69% | 78% | 74% | 63% | 60% | 19% | 66% |
| Year 2 (n=865) | Year 1 (n=942) | Year 2 (n=817) | Year 1 (n=487) | Year 2 (n=195) | Year 1 (n=93) | Year 2 (n=65) | Year 1 (n=27)* |
| Program Complexity Level | Programs Included |
|---|---|
| CSJ | |
| Low complexity |
|
| Moderate delivery-complexity programs | |
| High-delivery complexity programs |
Significantly higher / lower than total
Significantly higher/lower than Year 1
Key Differences by Program Complexity (cont.)
- Applicants to high complexity programs were more likely to have experienced a problem, provided lower ratings for the service provided through most channels and were less likely to find it easy to navigate the Government of Canada website when looking for information on the program and application process. Applicants to moderate complexity programs were less likely to be satisfied with the service provided online and through email support from a Service Canada office and were less likely to feel it was easy to determine the amount of time each phase of the process was anticipated to take. Applicants to low complexity programs were more likely to have experienced a problem and were less likely to feel it was easy to determine if their organization was eligible for funding.
- Compared to Year 1, nearly identical shifts were observed among applicants to CSJ as seen overall. Applicants to moderate complexity programs were more likely to feel it was easy to understand the information about the program, determine if their organization was eligible and find out what information they need to provide when applying
| TOTAL | CSJ | LOW | MODERATE | HIGH | ||||||
| Year 2 | Year 1 | Year 2 | Year 1 | Year 2 | Year 1 | Year 2 | Year 1 | Year 2 | Year 1 | |
| Experienced a Problem | ||||||||||
|---|---|---|---|---|---|---|---|---|---|---|
| % Yes | 22% | 35% | 20% | 35% | 28% | 30% | 25% | 31% | 52% | 31% |
| Service Channel Satisfaction | ||||||||||
| Government of Canada website | 71% | 66% | 71% | 65% | 71% | 71% | 61% | 50% | 45% | 58% |
| Email support from a Service Canada office | 70% | 65% | 71% | 64% | 71% | 71% | 56% | 58% | 24% | 42% |
| Email support from a program officer | 79% | 80% | 80% | 80% | 78% | 82% | 84% | 82% | 30% | 57% |
| GCOS web portal | 76% | 67% | 77% | 66% | 71% | 70% | 68% | 76% | 44% | 69% |
| Ease of Navigating GoC website (% Rated 4/5) | ||||||||||
| Find general information about [program] | 82% | 82% | 83% | 82% | 79% | 86% | 81% | 87% | 49% | 43% |
| Understand the information about the program | 80% | 76% | 81% | 76% | 78% | 80% | 81% | 58% | 62% | 43% |
| Determine if your organization is eligible for funding | 84% | 83% | 87% | 83% | 77% | 84% | 88% | 69% | 57% | 57% |
| Determine the steps to apply for funding | 81% | 78% | 82% | 77% | 79% | 83% | 80% | 72% | 67% | 64% |
| Find out what information you need to provide when applying for [program] | 79% | 78% | 80% | 79% | 75% | 79% | 84% | 68% | 51% | 43% |
| Determine when the application period for [program] takes place | 83% | - | 84% | - | 79% | - | 81% | - | 51% | - |
| Determine the amount of time each phase of the application process is anticipated to take | 58% | - | 59% | - | 57% | - | 41% | - | 19% | - |
Significantly higher / lower than total
Significantly higher/lower than Year 1
Key Differences by Program Complexity (cont.)
- Applicant to high complexity programs were less likely to find it easy to complete all aspects of the application and provided lower ratings across most aspects of service. Similar trends were observed among applicants to moderate complexity programs, albeit to a lesser degree, while applicants to low complexity programs also had more difficulty with nearly all aspects of the application process and were less likely to feel it was easy to apply or that they were able to move smoothly through all steps. Applicants to CSJ were more likely to feel it was easy to put together the information needed to apply and complete the project timeline.
- Compared to Year 1, nearly identical shifts were observed among applicants to CSJ as seen overall. Applicants to high complexity programs were less likely to agree it was clear what would happen next and when, confident any issues would have been easily resolved, that it was easy to apply and easy to get help when needed. Applicants to moderate complexity programs were more likely to feel it was easy to complete the narrative questions and meet the requirements of the applications.
| TOTAL | CSJ | LOW | MODERATE | HIGH | ||||||
| Year 2 | Year 1 | Year 2 | Year 1 | Year 2 | Year 1 | Year 2 | Year 1 | Year 2 | Year 1 | |
| Ease of Application Process (% Rated 4/5) | ||||||||||
|---|---|---|---|---|---|---|---|---|---|---|
| Understanding the requirements of the application | 76% | 73% | 79% | 73% | 69% | 71% | 69% | 63% | 45% | 56% |
| Putting together the information you needed to apply for [pipe: Q1] | 74% | 69% | 78% | 70% | 64% | 64% | 62% | 57% | 46% | 53% |
| Completing the narrative questions | 70% | 64% | 72% | 64% | 67% | 62% | 71% | 55% | 49% | 53% |
| Completing the budget document | 67% | 67% | 71% | 68% | 59% | 62% | 44% | 44% | 46% | 41% |
| Completing the project timeline | 75% | 75% | 78% | 76% | 65% | 71% | 58% | 63% | 48% | 50% |
| Meeting the requirements of the application | 80% | 77% | 83% | 79% | 72% | 70% | 76% | 557% | 46% | 59% |
| Widest Gap in Service Attributes (% Rated 4/5 vs. Total) | ||||||||||
| Throughout the process it was clear what would happen next and when it would happen. | 69% | 58% | 71% | 57% | 69% | 67% | 46% | 49% | 20% | 56% |
| I was confident that any issues or problems would have been easily resolved. | 70% | 63% | 71% | 62% | 71% | 71% | 53% | 50% | 23% | 50% |
| Overall, it was easy for me to apply for [program] | 79% | 74% | 82% | 74% | 75% | 74% | 62% | 66% | 32% | 59% |
| It was easy to get help when I needed it. | 69% | 61% | 70% | 61% | 71% | 68% | 62% | 65% | 23% | 50% |
| The amount of time it took was reasonable. | 66% | 56% | 68% | 56% | 66% | 61% | 44% | 53% | 22% | 25% |
| It was clear what to do if I had a problem or question. | 70% | 62% | 71% | 61% | 71% | 70% | 62% | 66% | 26% | 53% |
| I received consistent information | 76% | 72% | 77% | 71% | 76% | 76% | 63% | 64% | 34% | 53% |
| I was able to move smoothly through all of the steps. | 78% | 70% | 80% | 69% | 74% | 75% | 77% | 64% | 40% | 50% |
| I needed to explain my situation only once. | 67% | 62% | 67% | 62% | 70% | 67% | 51% | 51% | 31% | 47% |
| Being able to complete steps online made the process easier for me. | 88% | 82% | 89% | 83% | 81% | 79% | 77% | 69% | 61% | 92% |
Significantly higher / lower than total
Significantly higher/lower than Year 1
Key Differences by Program Complexity (cont.)
- Applicants to moderate complexity programs were more likely to have been in contact with Service Canada 10 or more times, while applicants to low complexity programs were less likely. Applicants to low, moderate and high programs were all more likely to report it was their organizations first application to the program or having applied once or twice before among low and moderate complexity program applicants. CSJ applicants were more likely to report having applied for the same program on an annual basis and to have received funding approval. Applicants to moderate and high complexity programs were more likely to have applied for a different Gs&Cs program in the past five years, while low complexity program applicants were less likely.
- Compared to Year 1, nearly identical shifts were observed among applicants to CSJ as seen overall. Applicants to low and high complexity programs were less likely to have been in contact with Service Canada 10 or more times and more likely to report it was their organizations first application to the program. High complexity program applicants were also less likely to have received funding approval, while all other groups are more likely.
| TOTAL | CSJ | LOW | MODERATE | HIGH | ||||||
| Year 2 | Year 1 | Year 2 | Year 1 | Year 2 | Year 1 | Year 2 | Year 1 | Year 2 | Year 1 | |
| Total Number of Times Contacting SC | ||||||||||
|---|---|---|---|---|---|---|---|---|---|---|
| 1-3 times | 19% | 12% | 18% | 12% | 21% | 17% | 10% | 9% | 9% | 7% |
| 4-6 times | 21% | 19% | 21% | 19% | 20% | 23% | 9% | 9% | 22% | 3% |
| 7-9 times | 13% | 15% | 13% | 15% | 14% | 16% | 5% | 4% | 8% | 6% |
| 10+ times | 28% | 41% | 29% | 42% | 23% | 29% | 54% | 60% | 38% | 65% |
| Application Frequency | ||||||||||
| First application | 19% | 13% | 8% | 10% | 51% | 29% | 34% | 42% | 79% | 38% |
| Applied once or twice before | 19% | 20% | 17% | 17% | 26% | 36% | 26% | 26% | 15% | 22% |
| Applied several times before | 25% | 26% | 28% | 26% | 16% | 25% | 26% | 20% | 0% | 19% |
| Apply for the same program on an annual basis | 35% | 41% | 46% | 46% | 5% | 8% | 11% | 9% | 0% | 16% |
| Funding Approval | ||||||||||
| % Approved | 93% | 90% | 97% | 92% | 86% | 79% | 89% | 79% | 13% | 75% |
| Applied to a different Gs&Cs program in the past five years | ||||||||||
| % Yes | 42% | - | 54% | - | 33% | - | 72% | - | 63% | - |
Significantly higher / lower than total
Significantly higher/lower than Year 1
Key Differences by Application Frequency
- Applicants who were applying to the program for the first time were less satisfied with their experience compared to all applicants. Eight in ten applicants who apply to the same program annually (81%) or have applied once or twice before (79%) were satisfied, followed closely by those who have applied several times before (77%), while seven in ten first-time applicants were satisfied (69%). Compared to Year 1, satisfaction has increased among those who apply to the same program annually or have applied once or twice before.
- First-time applicants were more likely to have experienced a problem, less likely to have been approved for funding and were less satisfied with the service provided through email support from a program officer or the GCOS web portal. Those who have applied several times before or annually were more likely to have received funding approval.
- Compared to Year 1, those who have applied at least once before were less likely to have experienced a problem. Applicants who applied once or twice before were more likely to have received funding approval and to be satisfied with GCOS web portal, those who applied several times before were more likely to be satisfied with the Government of Canada website and those who apply to the same program annual were more likely to have received funding approval and to be satisfied with the GCOS web portal and email support from a Service Canada office.
| Overall satisfaction (Rated 4 or 5) | |||||||
|---|---|---|---|---|---|---|---|
| First application | Once or twice before | Several times before | Apply annually | ||||
| 69% | 68% | 79% | 69% | 77% | 71% | 81% | 70% |
| Year 2 (n=649) | Year 1 (n=256) | Year 2 (n=393) | Year 1 (n=378) | Year 2 (n=404) | Year 1 (n=404) | Year 2 (n=454) | Year 1 (n=497) |
| TOTAL | CSJ | LOW | MODERATE | HIGH | ||||||
| Year 2 | Year 1 | Year 2 | Year 1 | Year 2 | Year 1 | Year 2 | Year 1 | Year 2 | Year 1 | |
| Experienced a Problem | ||||||||||
|---|---|---|---|---|---|---|---|---|---|---|
| % Yes | 22% | 35% | 33% | 31% | 21% | 34% | 20% | 33% | 20% | 37% |
| Funding Approval | ||||||||||
| % Approved | 93% | 90% | 83% | 82% | 92% | 87% | 96% | 93% | 97% | 92% |
| Service Channel Satisfaction | ||||||||||
| Email support from a Program Officer | 79% | 80% | 67% | 76% | 84% | 80% | 79% | 85% | 82% | 79% |
| GCOS web portal | 76% | 67% | 65% | 63% | 84% | 64% | 75% | 69% | 77% | 67% |
| Government of Canada website | 71% | 66% | 66% | 62% | 73% | 66% | 70% | 62% | 72% | 69% |
| Email support from a Service Canada office | 70% | 65% | 66% | 63% | 67% | 64% | 69% | 66% | 75% | 66% |
* small sample size
Significantly higher / lower than total
Significantly higher/lower than Year 1
Key Differences by Application Frequency (cont.)
- First-time applicants were less likely to find it easy to navigate the Government of Canada website when looking for information on the program and application process and to complete all aspects of application, while those who apply to the same program annually were more likely across nearly all areas.
- Compared to Year 1, those who have applied to the same program several times or annually were more likely to feel it was easy to understand the requirements of the application, put together the information needed to apply and complete the narrative questions. Those who apply to the same program annually were also more likely to feel it was easy to determine the steps to apply, while those who have applied once or twice before were more likely to feel it was easy to put together the information needed to apply. First-time applicants were less likely to feel it was easy to complete the program timeline.
| TOTAL | FIRST | ONCE OR TWICE | SEVERAL TIMES | ANNUALLY | ||||||
| Year 2 | Year 1 | Year 2 | Year 1 | Year 2 | Year 1 | Year 2 | Year 1 | Year 2 | Year 1 | |
| Ease of Navigating GoC website (% Rated 4/5) | ||||||||||
|---|---|---|---|---|---|---|---|---|---|---|
| Find general information about [program] | 82% | 82% | 72% | 76% | 80% | 84% | 82% | 79% | 88% | 84% |
| Understand the information about the program | 80% | 76% | 72% | 66% | 77% | 77% | 81% | 74% | 85% | 80% |
| Determine if your organization is eligible for funding | 84% | 83% | 73% | 75% | 85% | 82% | 83% | 82% | 91% | 87% |
| Determine the steps to apply for funding | 81% | 78% | 75% | 70% | 81% | 78% | 77% | 77% | 87% | 80% |
| Find out what information you need to provide when applying for [program] | 79% | 78% | 71% | 69% | 77% | 79% | 78% | 75% | 84% | 83% |
| Determine when the application period for [program] takes place | 58% | - | 49% | - | 55% | - | 56% | - | 65% | - |
| Determine the amount of time each phase of the application process is anticipated to take | 83% | - | 74% | - | 81% | - | 83% | - | 87% | - |
| Ease of Application Process (% Rated 4/5) | ||||||||||
| Understanding the requirements of the application | 76% | 73% | 64% | 60% | 74% | 76% | 78% | 72% | 83% | 76% |
| Putting together the information you needed to apply for [program] | 74% | 69% | 62% | 59% | 76% | 66% | 76% | 69% | 80% | 73% |
| Completing the narrative questions | 70% | 64% | 63% | 56% | 69% | 64% | 72% | 63% | 74% | 67% |
| Completing the budget document | 67% | 67% | 56% | 59% | 67% | 65% | 69% | 68% | 72% | 70% |
| Completing the project timeline | 75% | 75% | 60% | 67% | 75% | 74% | 76% | 73% | 81% | 80% |
| Meeting the requirements of the application | 80% | 77% | 69% | 69% | 81% | 77% | 80% | 77% | 85% | 80% |
Significantly higher / lower than total
Significantly higher/lower than Year 1
Key Differences by Application Frequency (cont.)
- First-time applicants were less likely to provide high ratings across nearly all aspects of service, while those who apply annually were more likely to agree they moved smoothly through all steps, it was clear what would happen next and when, it was easy to apply and they received consistent information.
- Compared to Year 1, nearly identical shifts were observed among those who apply annually as seen overall and improvement has been made across most aspects of service.
- All groups were more likely to feel it was clear what would happen next and when and those who have applied at least once before were more likely to agree they moved smoothly through all steps. Those who have applied several times were also more likely to agree the amount of time was reasonable and were less likely to feel it was easy to access service in a language they could understand well and that they were provided service in their choice of English or French. Applicants who have applied once or twice before were more likely to agree it was clear what to do if they had a problem or questions and were less likely to feel it was easy to access service in a language they could understand well and that they were confident their personal information was protected (along with first-time applicants).
| TOTAL | FIRST | ONCE OR TWICE | SEVERAL TIME | ANNUALLY | ||||||
| Year 2 | Year 1 | Year 2 | Year 1 | Year 2 | Year 1 | Year 2 | Year 1 | Year 2 | Year 1 | |
| Gaps/ Shifts in Service Attributes (% Rated 4/5) | ||||||||||
|---|---|---|---|---|---|---|---|---|---|---|
| I was able to move smoothly through all of the steps related to the [program] application. | 78% | 70% | 68% | 70% | 77% | 70% | 78% | 69% | 83% | 70% |
| It was clear what to do if I had a problem or question. | 70% | 62% | 62% | 63% | 71% | 59% | 70% | 66% | 74% | 59% |
| Throughout the process it was clear what would happen next and when it would happen. | 69% | 58% | 59% | 48% | 67% | 58% | 69% | 59% | 77% | 61% |
| I was confident that any issues or problems would have been easily resolved. | 70% | 63% | 63% | 57% | 72% | 66% | 71% | 66% | 73% | 61% |
| I needed to explain my situation only once. | 67% | 62% | 61% | 55% | 69% | 60% | 66% | 67% | 70% | 62% |
| It was easy to get help when I needed it. | 69% | 61% | 64% | 60% | 68% | 57% | 68% | 64% | 73% | 62% |
| Overall, it was easy for me to apply for [program] | 79% | 74% | 69% | 68% | 79% | 74% | 80% | 75% | 85% | 74% |
| I was confident that my personal information was protected. | 83% | 88% | 78% | 86% | 82% | 90% | 85% | 87% | 86% | 88% |
| I received consistent information | 76% | 72% | 67% | 69% | 75% | 70% | 76% | 73% | 82% | 72% |
| It was easy to access service in a language I could speak and understand well | 91% | 95% | 87% | 92% | 91% | 96% | 90% | 95% | 94% | 94% |
| The amount of time it took was reasonable. | 66% | 56% | 60% | 58% | 65% | 64% | 66% | 52% | 71% | 55% |
| I was provided with service in my choice of English or French. | 93% | 96% | 92% | 95% | 92% | 94% | 92% | 98% | 95% | 96% |
Significantly higher / lower than total
Significantly higher/lower than Year 1
Key Differences by Application Frequency (cont.)
- First-time applicants were more likely to report their organization as between 4 or fewer employees and has been in operation for under three years. Those who have applied once or twice before were more likely to report having been in contact with Service Canada 4 to 6 times and that their organization has no employees, while those who apply annually were more likely to indicate their organization has between 10 to 19 employees. Those who have applied several times or annually were more likely to report their organization has been in operation three or more years.
- Compared to Year 1, the proportion of all groups who were in contact with Service Canada 10 times or more has declined, while those who have applied several times or annually were more likely to report being in contact 1 to 3 times and those who have applied once or twice before 4 to 6 times. First-time applicants were more likely to report their organization has no employees, while those who apply annually were less likely.
| TOTAL | FIRST | ONCE OR TWICE | SEVERALTIMES | ANNUALLY | ||||||
| Year 2 | Year 1 | Year 2 | Year 1 | Year 2 | Year 1 | Year 2 | Year 1 | Year 2 | Year 1 | |
| Total Number of Times Contacting SC | ||||||||||
|---|---|---|---|---|---|---|---|---|---|---|
| 1-3 times | 19% | 12% | 17% | 13% | 14% | 13% | 19% | 13% | 22% | 11% |
| 4-6 times | 21% | 19% | 19% | 16% | 26% | 16% | 20% | 17% | 19% | 22% |
| 7-9 times | 13% | 15% | 11% | 15% | 11% | 18% | 14% | 16% | 13% | 14% |
| 10+ times | 28% | 41% | 27% | 39% | 29% | 42% | 29% | 42% | 29% | 41% |
| Number of employees | ||||||||||
| None | 12% | 10% | 24% | 16% | 17% | 13% | 10% | 10% | 4% | 8% |
| 1-4 | 28% | 31% | 36% | 37% | 33% | 32% | 24% | 31% | 24% | 30% |
| 5-9 | 19% | 18% | 13% | 19% | 20% | 16% | 18% | 19% | 22% | 16% |
| 10-19 | 15% | 17% | 8% | 16% | 10% | 17% | 18% | 18% | 20% | 16% |
| 20-49 | 14% | 13% | 8% | 7% | 12% | 12% | 15% | 11% | 16% | 16% |
| 50+ | 12% | 11% | 10% | 6% | 9% | 9% | 15% | 11% | 13% | 13% |
| Years in operation | ||||||||||
| Under three years | 3% | - | 13% | - | 4% | - | 0% | - | 0% | - |
| Three or more years | 97% | - | 87% | - | 97% | - | 100% | - | 100% | - |
Significantly higher / lower than total
Significantly higher/lower than Year 1
Key Differences by Number of Employees
- Overall satisfaction was consistent by numbers of employees, however there were several notable differences across aspects of service specifically among those with no employees who experienced more difficulty with the application process. Eight in ten (79%) organizations with 1 to 9 employees were satisfied with their experience, followed closely by those with either no employees or 10 to 49 (77% for both) while closer to seven in ten (73%) organizations with 50 or more employees were satisfied. Satisfaction has increased among organizations with at least 1 employee compared to Year 1.
- Applicant organizations with no employees (presumably run entirely by volunteers) were more likely to have experienced a problem and were less likely to report having received funding approval compared to all clients.
- Compared to Year 1, fewer organizations with at least 1 employee report having experienced a problem, while those with 1 to 49 employees were more likely to have received funding approval and to be satisfied with the GCOS web portal. Those with 1 to 9 employees were also more likely to be satisfied with the Government of Canada website, while those with 10 or more employees were more likely to be satisfied with email support from a Service Canada office. Organizations with no employees were less likely to be satisfied with email support from a Service Canada office.
| Overall satisfaction (Rated 4/5) | |||||||
|---|---|---|---|---|---|---|---|
| None | 1-9 | 10-49 | 50+ | ||||
| 77% | 74% | 79% | 71% | 77% | 70% | 73% | 59% |
| Year 2 (n=297) | Year 1 (n=245) | Year 2 (n=855) | Year 1 (n=722) | Year 2 (n=498) | Year 1 (n=401) | Year 2 (n=278) | Year 1 (n=173) |
| TOTAL | NONE | 1-9 | 10-49 | 50+ | ||||||
| Year 2 | Year 1 | Year 2 | Year 1 | Year 2 | Year 1 | Year 2 | Year 1 | Year 2 | Year 1 | |
| Experienced a Problem | ||||||||||
|---|---|---|---|---|---|---|---|---|---|---|
| % Yes | 22% | 35% | 30% | 33% | 21% | 33% | 22% | 35% | 21% | 43% |
| Funding Approval | ||||||||||
| % Approved | 93% | 90% | 88% | 90% | 94% | 90% | 94% | 90% | 95% | 90% |
| Service Channel Satisfaction | ||||||||||
| GCOS web portal | 76% | 67% | 73% | 68% | 77% | 66% | 78% | 68% | 69% | 63% |
| Government of Canada website | 71% | 66% | 66% | 68% | 72% | 65% | 70% | 65% | 73% | 64% |
| Email support from a Service Canada office | 70% | 65% | 71% | 80% | 70% | 66% | 69% | 61% | 70% | 56% |
Significantly higher / lower than total
Significantly higher/lower than Year 1
Key Differences by Number of Employees (cont.)
- Organizations with no employees were more likely to have been in contact with Service Canada 1 to 3 times and were less likely to feel it was easy to determine if their organization was eligible, the amount of time each phase is anticipated to take and to complete all aspects of the application. Organizations with 50 or more employees were less likely to have had 1 to 3 contacts with Service Canada and more likely to feel it was easy to determine when the application period takes place and to understand the requirements of the application.
- Compared to Year 1, fewer applicants in all groups had contact with Service Canada 10 or more times and a greater proportion reported 1 to 3 times (except those with 50+). Those with no employees were less likely to feel it was easy to determine if they were eligible, while those with 1 to 9 employees were more likely to feel it was easy to put together the information needed, those with 10 to 49 that it was easy to determine the steps to apply and those with 50 or more that it was easy to understand the requirements. Organizations with at least 1 employee were also more likely to feel it was easy to complete the narrative questions.
| Total | None | 1-9 | 10-49 | 50+ | ||||||
| Year 2 | Year 1 | Year 2 | Year 1 | Year 2 | Year 1 | Year 2 | Year 1 | Year 2 | Year 1 | |
| Total Number of Times Contacting SC | ||||||||||
|---|---|---|---|---|---|---|---|---|---|---|
| 1-3 times | 19% | 12% | 25% | 14% | 19% | 13% | 19% | 10% | 11% | 12% |
| 4-6 times | 21% | 19% | 22% | 30% | 21% | 19% | 21% | 17% | 18% | 16% |
| 7-9 times | 13% | 15% | 15% | 14% | 12% | 14% | 11% | 18% | 15% | 15% |
| 10+ times | 28% | 41% | 20% | 28% | 28% | 41% | 30% | 45% | 33% | 45% |
| Ease of Navigating GoC website (% Rated 4/5) | ||||||||||
| Understand the information about [program] | 80% | 76% | 74% | 74% | 81% | 78% | 80% | 76% | 82% | 70% |
| Determine if your organization is eligible for [program] funding | 84% | 83% | 76% | 89% | 85% | 84% | 85% | 83% | 88% | 79% |
| Determine the steps to apply for funding | 81% | 78% | 75% | 80% | 80% | 77% | 84% | 77% | 83% | 77% |
| Determine the amount of time each phase of the application process is anticipated to take | 58% | - | 49% | - | 58% | - | 59% | - | 64% | - |
| Determine when the application period for [program] takes place | 83% | - | 80% | - | 81% | - | 82% | - | 90% | - |
| Ease of Application Process (% Rated 4/5) | ||||||||||
| Understanding the requirements of the application | 76% | 73% | 69% | 71% | 77% | 75% | 76% | 72% | 82% | 66% |
| Putting together the information you needed to apply for [program] | 74% | 69% | 65% | 61% | 77% | 69% | 76% | 63% | 72% | 65% |
| Completing the narrative questions | 70% | 64% | 62% | 61% | 71% | 66% | 72% | 64% | 73% | 60% |
| Completing the budget document | 67% | 67% | 57% | 64% | 67% | 67% | 70% | 70% | 72% | 64% |
| Meeting the requirements of the application | 80% | 77% | 73% | 72% | 81% | 78% | 79% | 78% | 83% | 77% |
Significantly higher / lower than total
Significantly higher/lower than Year 1
Key Differences by Number of Employees (cont.)
- Organizations with no employees were less likely to feel it was easy to apply.
- Compared to Year 1, nearly identical shifts were observed among organizations with at least one employee as seen overall and improvement has been made across most aspects of service. Organizations with no employees were more likely to agree it was clear what would happen next and when and were less likely to be confident their personal information was protected and to say they were provided service in their choice of English or French.
| Total | None | 1-9 | 10-49 | 50+ | ||||||
| Year 2 | Year 1 | Year 2 | Year 1 | Year 2 | Year 1 | Year 2 | Year 1 | Year 2 | Year 1 | |
| Gaps/ Shifts in Service Attributes (% Rated 4/5) | ||||||||||
|---|---|---|---|---|---|---|---|---|---|---|
| I was able to move smoothly through all of the steps related to the [program] application. | 78% | 70% | 73% | 69% | 79% | 70% | 79% | 70% | 76% | 65% |
| It was clear what to do if I had a problem or question. | 70% | 62% | 72% | 70% | 71% | 62% | 68% | 61% | 70% | 53% |
| Throughout the process it was clear what would happen next and when it would happen. | 69% | 58% | 71% | 61% | 69% | 59% | 71% | 59% | 67% | 51% |
| I was confident that any issues or problems would have been easily resolved. | 70% | 63% | 68% | 73% | 72% | 64% | 69% | 59% | 70% | 58% |
| I needed to explain my situation only once. | 67% | 62% | 69% | 70% | 69% | 63% | 64% | 60% | 67% | 56% |
| It was easy to get help when I needed it. | 69% | 61% | 68% | 63% | 69% | 62% | 70% | 63% | 70% | 52% |
| Overall, it was easy for me to apply for [program] | 79% | 74% | 70% | 73% | 80% | 75% | 83% | 73% | 80% | 68% |
| I was confident that my personal information was protected. | 83% | 88% | 86% | 93% | 81% | 87% | 86% | 88% | 85% | 89% |
| I received consistent information | 76% | 72% | 74% | 78% | 77% | 70% | 77% | 74% | 74% | 65% |
| It was easy to access service in a language I could speak and understand well | 91% | 95% | 94% | 95% | 91% | 95% | 91% | 94% | 90% | 95% |
| The amount of time it took was reasonable. | 66% | 56% | 63% | 62% | 66% | 57% | 68% | 56% | 64% | 48% |
| I was provided with service in my choice of English or French. | 93% | 96% | 94% | 98% | 92% | 96% | 93% | 95% | 93% | 94% |
Significantly higher / lower than total
Significantly higher/lower than Year 1
Key Differences by Number of Employees (cont.)
- Organizations with no employees were more likely to report it was their first application to the program or that they have applied once or twice before, that a team of volunteers completed the funding application and that they are in the not-for-profit sector. Those with 10 to 49 employees were more likely to report that they apply to the same program on an annual basis while those with 50 or more were more likely to have applied several times before and to be in the public sector. Organizations with at least 10 employees were also more likely to indicate that a team of employees were dedicated to completing the funding application. Those with 1 to 9 employees were more likely to be solely responsible for the application and indicate that a team of both employees and volunteers completed the funding application.
| Total | None | 1-9 | 10-49 | 50+ | ||||||
| Year 2 | Year 1 | Year 2 | Year 1 | Year 2 | Year 1 | Year 2 | Year 1 | Year 2 | Year 1 | |
| Application frequency | ||||||||||
|---|---|---|---|---|---|---|---|---|---|---|
| First application | 19% | 13% | 39% | 20% | 20% | 15% | 11% | 10% | 16% | 7% |
| Applied once or twice before | 19% | 20% | 26% | 25% | 21% | 20% | 15% | 19% | 13% | 16% |
| Applied several times before | 25% | 26% | 21% | 24% | 22% | 26% | 29% | 26% | 31% | 26% |
| Apply for the same program on an annual basis | 35% | 41% | 13% | 32% | 35% | 39% | 45% | 45% | 37% | 50% |
| Role in application | ||||||||||
| I am solely responsible | 62% | - | 49% | - | 67% | - | 64% | - | 49% | - |
| A team of employees are dedicated to completing the funding application | 20% | - | 3% | - | 15% | - | 26% | - | 41% | - |
| A team of both employees and volunteers completes the funding application | 5% | - | 2% | - | 7% | - | 3% | - | 2% | - |
| A team of volunteers complete the funding application | 9% | - | 40% | - | 7% | - | 1% | - | 0% | - |
| Sector | ||||||||||
| Not-for-profit (NET) | 83% | 77% | 96% | 94% | 86% | 82% | 77% | 69% | 72% | 67% |
| Public Sector (NET) | 15% | 14% | 10% | 10% | 11% | 9% | 18% | 17% | 25% | 34% |
| Private Sector (NET) | 14% | 19% | 10% | 12% | 15% | 20% | 16% | 23% | 12% | 13% |
Significantly higher / lower than total
Significantly higher/lower than Year 1
Key Differences by Sector
- Overall satisfaction was consistent by sector the applicant organization operates in, however there were some notable differences across aspects of service specifically among private sector organizations.
- Nearly eight in ten (78%) not-for-profit organizations were satisfied, followed closely by public and private sector organizations (76% for both). Satisfaction has increased among organizations in all sectors compared to Year 1.
- Private sector organizations were less likely to feel it was easy to determine if they were eligible, understand the requirements of the application, complete the narrative questions and meet the requirements of the application. They were also less likely to agree it was easy to get help and access service in a language they could understand well and were more likely to report having applied once or twice before and to have been solely responsible for the application.
- Compared to Year 1, organizations in the not-for-profit or public sector were more likely to feel it was easy to complete the narrative questions, to get help when needed and to report it was their first application. Those in the public sector were also more likely to feel it was easy to understand the requirements of the application. Those in the private sector were less likely to agree it was easy to access service in a language they could understand well and were more likely to report that they apply for the same program annually.
| Overall satisfaction (Rated 4/5) | |||||
|---|---|---|---|---|---|
| Not-For-Profit | Public | Private | |||
| 78% | 70% | 76% | 66% | 76% | 67% |
| Year 2 (n=1641) | Year 1 (n=1268) | Year 2 (n=296) | Year 1 (n=220) | Year 2 (n=265) | Year 1 (n=251) |
| Total | Not-For-Profit | Public | Private | |||||
| Year 2 | Year 1 | Year 2 | Year 1 | Year 2 | Year 1 | Year 2 | Year 1 | |
| Gaps/ Shifts in Service Attributes (% Rated 4/5) | ||||||||
|---|---|---|---|---|---|---|---|---|
| Determine if your organization is eligible for [PROGRAM] funding | 84% | 83% | 86% | 85% | 79% | 74% | 73% | 76% |
| Understanding the requirements of the application | 76% | 73% | 77% | 74% | 76% | 65% | 67% | 70% |
| Completing the narrative questions | 70% | 64% | 71% | 66% | 69% | 56% | 62% | 54% |
| It was easy to get help when I needed it. | 69% | 61% | 70% | 63% | 73% | 60% | 62% | 54% |
| Meeting the requirements of the application | 80% | 77% | 80% | 78% | 77% | 73% | 74% | 73% |
| It was easy to access service in a language I could speak and understand well | 91% | 95% | 91% | 94% | 88% | 93% | 86% | 95% |
| Application frequency | ||||||||
| First application | 19% | 13% | 20% | 11% | 17% | 11% | 22% | 23% |
| Applied once or twice before | 19% | 20% | 19% | 17% | 15% | 14% | 27% | 30% |
| Applied several times before | 25% | 26% | 25% | 27% | 24% | 28% | 19% | 25% |
| Apply for the same program on an annual basis | 35% | 41% | 35% | 45% | 41% | 46% | 32% | 22% |
| Role in application | ||||||||
| I am solely responsible | 62% | - | 58% | 67% | 76% | |||
| A team of volunteers complete the funding application | 9% | - | 10% | 3% | 4% | |||
Significantly higher / lower than total
Significantly higher/lower than Year 1
Demographic Profile Of Survey Participants
Demographic Profile of Survey Participants
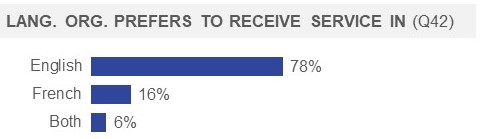
Figure 55: Language organization Prefers to receive service in:
This horizontal bar chart shows responses to a question about which official language the applicant’s organization prefers to be receive service in. All 1942 respondents answered as follows:
- English: 78%
- French: 16%
- Both: 6%
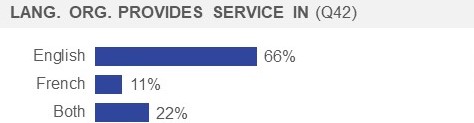
Figure 56: Language organization provides service in:
This horizontal bar chart shows responses to a question about which official language the applicant’s organization provides service in. All 1942 respondents answered as follows:
- English: 66%
- French: 11%
- Both: 22%

Figure 57: Language Client Population Speaks
This horizontal bar chart shows responses to a question about which official language the applicant organization’s client population speaks. All 1942 respondents answered as follows:
- English: 66%
- French: 11%
- Both: 24%
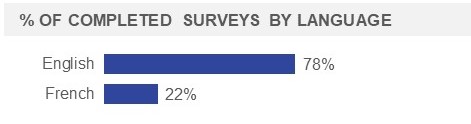
Figure 58: Percentage of Completed Survey’s by Language
This horizontal bar chart shows the proportion of surveys completed by applicants in English and French. All 1942 respondents answered as follows:
- English: 78%
- French: 22%
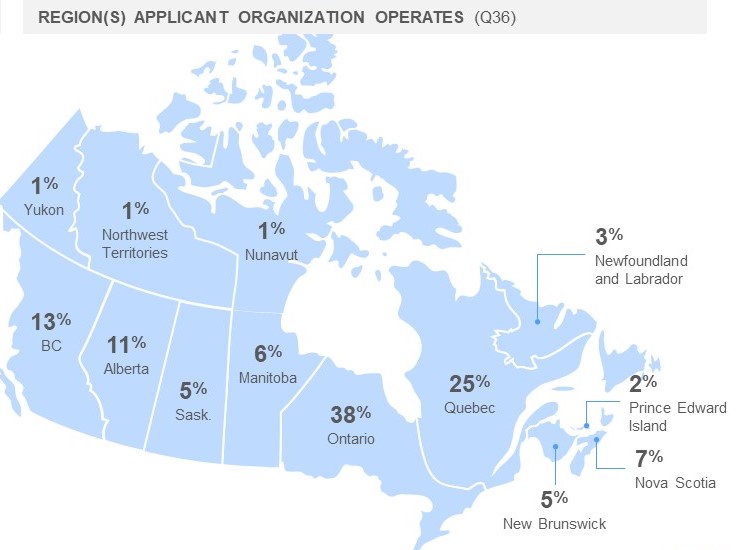
Figure 59: Region(s) applicant organization operates
A map of Canada shows responses to a question about which province the applicant organization operates in. All 1942 respondents answered as follows:
- British Columbia: 13%
- Alberta: 11%
- Saskatchewan: 5%
- Manitoba: 6%
- Ontario: 38%
- Quebec: 25%
- New Brunswick: 5%
- Nova Scotia: 7%
- Prince Edward Island: 2%
- Newfoundland and Labrador: 3%
- Nunavut: 1%
- Northwest Territories: 1%
- Yukon: 1%
Demographic Profile of Survey Participants
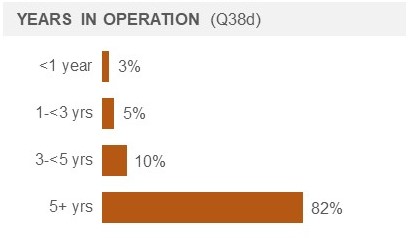
Figure 60: Years in Operation
This horizontal bar chart shows responses to a question about how many years the applicant organization has been in operation. All 1942 respondents answered as follows:
- < year: 3%
- 1 - < 3 years: 5%
- 3 - < 5 years: 10%
- 5+ years: 82%
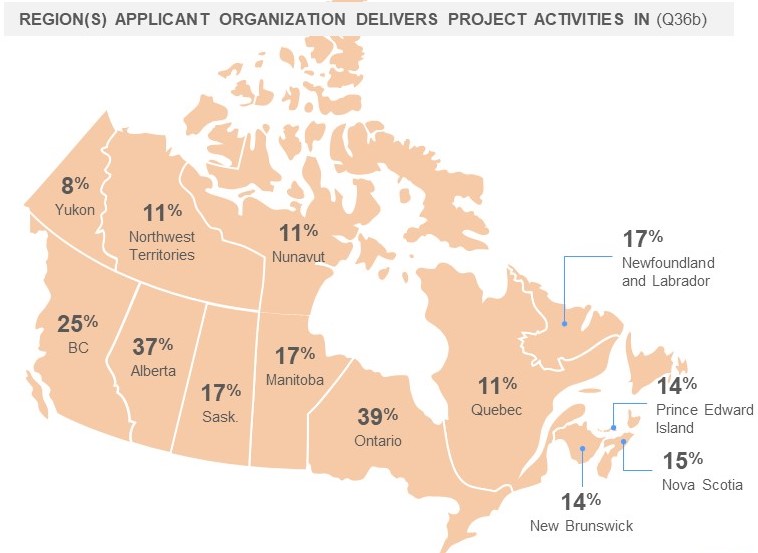
Figure 61: Region(s) the Applicant’s Organization Delivers Project Activities in
A map of Canada shows responses to a question about which province the applicant organization delivers project activities in. All 1942 respondents answered as follows:
- British Columbia: 25%
- Alberta: 37%
- Saskatchewan: 17%
- Manitoba: 17%
- Ontario: 39%
- Quebec: 11%
- New Brunswick: 14%
- Nova Scotia: 15%
- Prince Edward Island: 14%
- Newfoundland and Labrador: 17%
- Nunavut: 11%
- Northwest Territories: 11%
- Yukon: 8%
Frequency of Applying for Other Funding in Last Five Years
- Within the past five years, over three-quarters (77%) of applicant organizations have applied for federal funding on at least an annual basis. Two thirds (65%) say they apply for provincial/territorial funding at least annually and half (49%) say they apply for municipal/local funding at least every year.
- Just over a quarter (27%) say they have applied for international funding on at least an annual basis within the past five years.
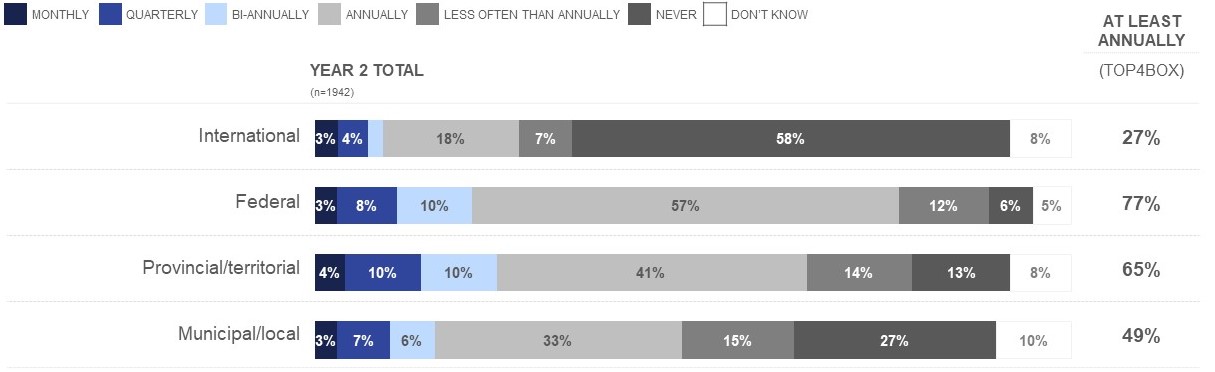
Figure 62: Frequency of Applying for Other Funds in last Five Years
This horizontal bar chart shows responses to a question about how often the applicant organization applies for international, federal, provincial/territorial, and/or municipal/local funding. All 1942 respondents answered as follows:
- International: monthly 3%, quarterly 4%, bi-annually 3%, annually 18%, less often than annually 7%, never 58%, don’t know 8%, at least annually 27%.
- Federal: monthly 3%, quarterly 8%, bi-annually 10%, annually 57%, less often than annually 12%, never 6%, don’t know 5%, at least annually 77%.
- Provincial/territorial: monthly 4%, quarterly 10%, bi-annually 10%, annually 41%, less often than annually 14%, never 13%, don’t know 8%, at least annually 65%.
- Municipal/local: monthly 3%, quarterly 7%, bi-annually 6%, annually 33%, less often than annually 15%, never 27%, don’t know 10%, at least annually 49%.
Q38c. Thinking about the last five years, how often does your organization apply for international, federal, provincial/territorial, and/or municipal/local funding of any kind? Base: All applicants (n=1942)
*values less than 3% not labelled
Who Completes the Application?
- A majority of organizations applying for funding have one person solely responsible for completing the application for funding (62%). Two in ten (20%) said that a team of employees is responsible for completing the application. Fewer said a team of volunteers completes the application (9%), a team of both employees and volunteers completes the application (5%), or that a dedicated in-house proposal writer (2%) or external consultant (2%) completes the application.
- CSJ applicants are more likely to say they are solely responsible, whereas those applying to YESS, UT&IP, SDPP, FCRP, and SDG are more likely to say a team of employees completes the funding application. Over a third (36%) of EL&CCI applicants and a quarter (25%) of NHSP applicants say a team of volunteers completes the application.
Which statement best describes your organization as it relates to completing the application for funding?
| Total | EAF | NHSP | CSJ | YESS (formerly SL/CF) | UT&IP | EL&CCI | SDPP | FCRP | IELCC | IWILI | SWP | SDG | All but EAF, NHSP, CSJ | |
| Base: All respondents (n=) | 1942 | 207 | 384 | 865 | 152 | 65 | 153 | 32* | 20** | 8** | 13** | 4** | 39* | 486 |
|---|---|---|---|---|---|---|---|---|---|---|---|---|---|---|
| I am solely responsible for completing the funding application | 62% | 57% | 48% | 67% | 32% | 37% | 39% | 47% | 15% | 38% | 39% | 75% | 31% | 36% |
| A team of employees are dedicated to completing the funding application | 20% | 15% | 12% | 20% | 58% | 35% | 9% | 38% | 50% | 38% | 39% | 25% | 46% | 32% |
| A dedicated in-house proposal writer completes the funding application | 2% | 2% | 4% | 2% | 5% | 2% | 2% | 3% | - | - | - | - | 3% | 3% |
| A team of both employees and volunteers completes the funding application | 5% | 7% | 8% | 4% | 2% | 14% | 7% | - | 15% | - | 15% | - | 8% | 7% |
| A team of volunteers complete the funding application | 9% | 17% | 25% | 4% | 1% | 5% | 36% | - | 10% | - | 8% | - | 10% | 17% |
| We hire (a) consultant(s) to complete the funding application | 2% | 2% | 3% | 1% | 2% | 5% | 4% | 13% | 5% | 25% | - | - | - | 4% |
| I am not personally involved, although I oversee this or have some awareness | 2% | 1% | 1% | 2% | 1% | 3% | 2% | 3% | 5% | - | - | - | 3% | 2% |
Q37. Which statement best describes your organization as it relates to completing the application for funding? Select one response. Base: All respondents (n=1942)
* small sample size
** very small sample size
Significantly higher / lower than total
Demographic Profile
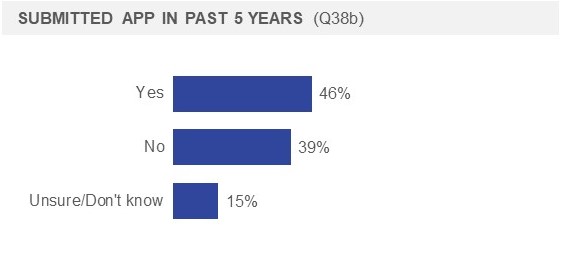
Figure 63: Submitted application in past 5 years
This horizontal bar chart shows responses to a question about whether the applicant organization has submitted an application to a different Grant or Contribution program from Service Canada program in the past five years. All 1942 respondents answered as follows:
- Yes: 46%
- No: 39%
- Unsure/Don’t know: 15%
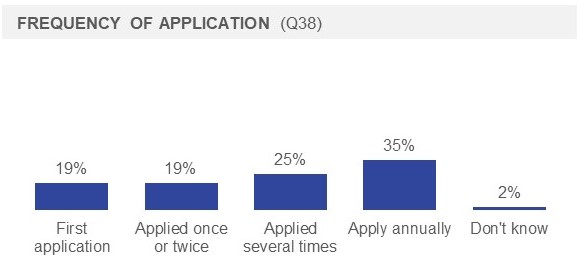
Figure 64: Frequency of Application
This vertical bar chart shows responses to a question about whether this was the applicant organization’s first application or if they had applied to the program in the past. All 1942 respondents answered as follows:
- First application: 19%
- Applied once or twice 19%
- Applied several times: 25%
- Apply annually: 35%
- Don’t know: 2%
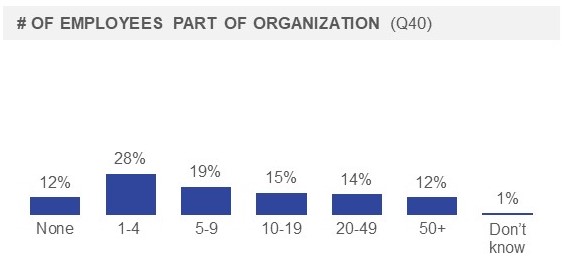
Figure 65: Number of Employees Part of Organization
This vertical bar chart shows responses to a question about how many employees work (full-time or part-time) for the applicant’s organization. All 1942 respondents answered as follows:
- None: 12%
- 1-4: 28%
- 5-9: 19%
- 10-19: 15%
- 20-49: 14%
- 50+: 12%
- Don’t Know: 1%
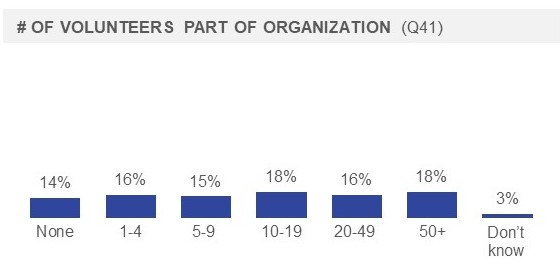
Figure 66: Number of Volunteers Part of Organization
This vertical bar chart shows responses to a question about how many volunteers work (full-time or part-time) for the applicant’s organization. All 1942 respondents answered as follows:
- None: 14%
- 1-4: 28%
- 1-4: 16%
- 5-9: 15%
- 10-19: 18%
- 20-49: 16%
- 50+: 18%
- Don’t Know: 3%
Demographic Profile
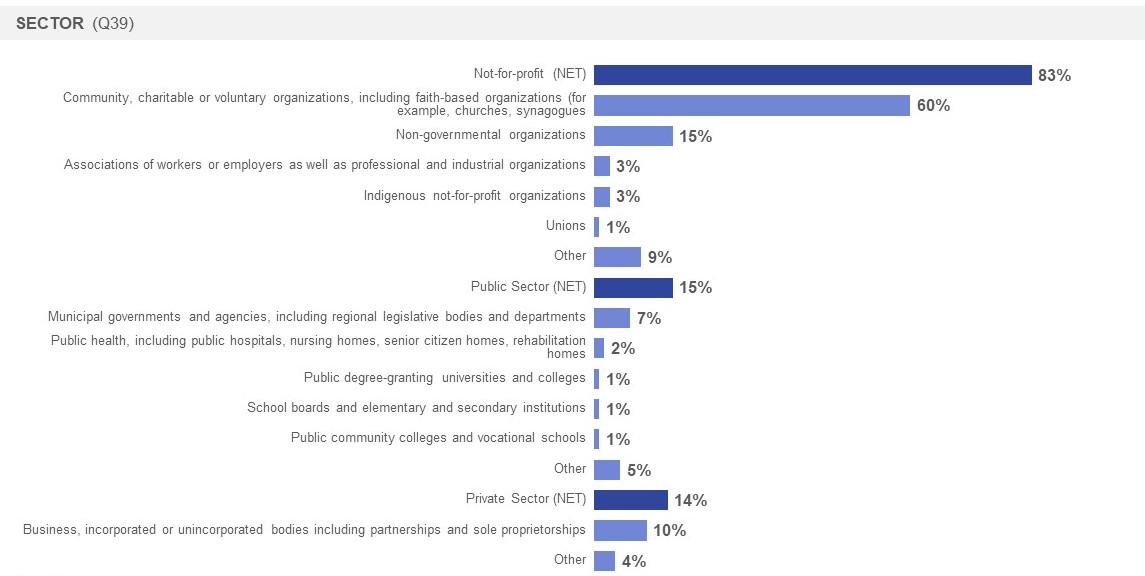
Figure 67: Sector
This horizontal bar chart shows responses to a question about what sector the applicant’s organization operates in. All 1942 respondents answered as follows:
- Not-for-profit (NET): 83%
- Community, charitable or voluntary organizations, including faith-based organizations (for example, churches, synagogues: 60%
- Non-governmental organizations: 15%
- Associations of workers or employers as well as professional and industrial organizations: 3%
- Indigenous not-for-profit organizations: 3%
- Unions: 1%
- Other: 9%
- Public Sector (NET): 15%
- Municipal governments and agencies, including regional legislative bodies and departments: 7%
- Public health, including public hospitals, nursing homes, senior citizen homes, rehabilitation homes: 2%
- Public degree-granting universities and colleges: 1%
- School boards and elementary and secondary institutions: 1%
- Public community colleges and vocational schools: 1%
- Other: 5%
- Private Sector (NET): 14%
- Business, incorporated or unincorporated bodies including partnerships and sole proprietorships: 10%
- Other: 4%
Qualitative Findings
Organizational characteristics
About the Organizations
Who We Spoke To
Most organizations we spoke to in the qualitative research were non-profits and/or registered charities. A few were private enterprises applying for the Canada Summer Jobs or Sustainable Development Goals programs.
- Most did not have any core funding from government.
- Most were dependent on a combination of grants, donations, and other funding sources to fund their programs and operations.
- A few had one primary donor such as a family fund or private foundation which was their biggest source of funding.
- Most tended to be small organizations and there was a mix of volunteers and employees amongst the participants we spoke to – regardless of their status, they were all heavily invested in their organizations and communities.
- Many had different roles within their organization and have to make time to apply for funding even when very busy; they do so as it is crucial to their programming.
Community Profiles
The communities served by participants varied:
- Some were in large city centres, others were in small towns. Regardless, they all felt the larger or smaller (macro or local) communities were underserved and their program would help fill some of that void, providing crucial services and programs
- Many identified a gap or opportunity not previously identified, or based on their own personal experiences, and created programming accordingly.
- There was lots of diversity within the communities served by those who participated in the qualitative research, including high immigrant or newcomer populations, cultural diversity, single parents, economic diversity, low income, Indigenous, seniors, and diverse abilities.
- Those from small towns described a lack of cultural diversity, which in some cases made it difficult to fulfill program requirements, such as hiring quotas or outreach to specific populations.
In Their Own Words | Addressing Service Gaps
Addressing and serving diverse abilities
There was one kid, the day I met him was a Friday, he was coming for a weekend intensive program that we’d put on once every summer called a Sensory Camp, and when he arrived Friday, not only he was having a huge meltdown, which apparently occurred five or six times a day, but the only word he could say was Mama. By Sunday, because the horses got him calmed down enough for them to explain that he has to tell the horse when to start walking and when to stop walking. By Sunday, he was starting to put small sentences together. This is in one weekend. I still get the chills when I think about it, because I would never have believed it if somebody had told me that that could happen, except I witnessed it myself.
Address and serving diverse abilities
But my son was refused service because he’s a lot to handle. He was refused service sometimes just because of his size. He’s a really big guy, and he moves like this. He takes up the whole room. He’s huge. Him being refused for size, services in the youth world tend to stop at 16, and then you're on a waiting list in the adult world until you're in your mid-20s. There’s a huge gap in service, and that transfer, I don’t have the right word right now, but that bridging from youth to adult world is where the ball is dropped. It’s where the services fall through the cracks, and where our guests, our children fall through the cracks, is when services stop and then take forever to restart. That’s when [my son] goes backwards, and other kids as well. So, if I can bridge that gap, help with that transition, things like that, that’s sometimes what we’re doing here, and we also work directly with both school boards in the area.
Addressing and serving immigrants
[…] what we do is, we take something that happens naturally at home, and bring it into a classroom environment, and formalize it. For example, in a lot of immigrant families, children are often teaching skills to parents, so whether it’s English skills, or computer skills, maybe they go to the doctors with them and explain the symptoms, maybe they go to a bank and try to translate what the teller is saying. We take that interaction and flip it into a classroom, so that in a formalized, structured environment, young people are teaching any kind of life skill to an adult, whether it’s their parents, or another adult or senior from their community, often in their own native language […] Pretty much any skill that young people have, we find a way to get them to teach it, and in a more professional capacity.
About the Organizations cont’d
Funding Sources
Based on a lack of core funding, not receiving sufficient donations, or wanting to fund additional/new programs, many were very dependent on other sources of funding, including federal grants and contributions. This included federal funding from other departments, provincial funds, (such as Trillium Foundation in Ontario), private foundations/family funds, other larger organizations such as United Way, and municipal funds and programs.
- Because of the number of programs and funding that clients apply to, it was apparent that there was some lack of or challenges with recall about which ESDC grants or contribution program they had specifically applied to, and the dates during which they had applied.
- Others were more precise in their recollection, or came prepared to the fieldwork or looked up their applications to be sure.
- This was true of both employees and volunteers alike. First-time applicants tended to remember more clearly which program they had applied to.
Likelihood to re-apply for funding
I’m shameless, so I would say given the not-for-profit world, I think it becomes really tricky business not to apply [to funding], because you are looking at supplementing core programs. A lot of times, a three-year funding is a really important supplement. Canada Summer Jobs is a really important supplement.
Lack of core funding
We are an organization that gets no core government funding, but just relies on applications such as these to support our organization, so we apply to government for government grants, we get sponsors, donors, all that stuff, but no core government funding.
Drivers And Barriers
Drivers
Participants with support and resources, be they internal (boards, colleagues, part of a team) or external (other organizations), tended to be more confident and better enabled to apply for federal funding. Those who applied on their own but had a lot of experience were also fairly confident.
Broadly, drivers which enabled applying for federal funding included:
- Experience: Having had significant past experience in applying for grants and contributions over a number of years drove confidence with applying. It was apparent that the perceived ease of completing the application and filling the forms is directly proportional to the experience of the applicant.
- Diversity: Some focused on grants that were geared toward diversity, because these participants were well-versed in helping or working with various diverse demographics through prior experiences, and they were also able to include some metrics within the application to further strengthen it.
- Support: Having access to others in the organization who were able to provide more insight / input on different questions on the application that were outside the area of expertise of the person submitting the application(s). Some turned to their local MP for support or assistance in various ways.
- Collaboration: Collaboration from across various functions within the organization often went into applications – as part of a team that included those who worked on content or contributed ideas, or took care of or helped to put together budgets. Some took a ‘divide and conquer’ approach while others had one person who primarily ‘held the pen’.
In Their Own Words | Drivers
Support from local MP
Peu importe les ministères, même si les demandes ne se ressemblent pas tous, elles se répètent un peu. Inévitablement, on s'enrichit à remplir des demandes.
Support from others
J'en ai parlé avec mon conseil d'administration. Ils m'ont dit : « Oui, c'est une bonne opportunité. Vas-y. » Et puis, avec la présidente, on s'est assises. Tout ce que je pouvais remplir, je l'ai fait. Et puis, là où j'avais des difficultés, elle m'a aidé pour rédiger et on a regardé ensemble le document, tout et tout.
Experience But what I’ve discovered over the years is, [grant writing] is a bit of a special skill. It’s not the kind of thing with our organization you can hire a grant writer for, because you need to understand the programs and processes, even to understanding the biochemistry of what goes on, so that you can explain it to people in applications.
Diversity I think with us, we stick to the diverse part of these grant fundings, so sometimes it has to help BIPOC students or Black students. So, I’m very versed in helping the Black students, so we use our experience in delivering that and writing the grants around that. And then making sure that we have the metrics to show that we’ve actually been doing it, and to deliver it… We do show those data, we do show the metrics, we do show that we understand what’s going on in terms of how to support these students upon completion of the program.
Collaboration
We all look at it, and we brainstorm what it is that we would like to put in as a proposal, what is our capacity, what is the probability that we are going to win the bid, and all of that. And then, the team could write, or we could divide sections, but normally I do that. And the team, depending on who is assigned, they can work on the nitty gritty, the metrics, the results, the logical model, and all of that. And then, afterwards, I read what they have written before we could sign off on it and send it out, and then our CFO normally deals with the nitty gritty of the budgets. She’s very selective of how that has to be done. Also, the government is very specific of how different categories of the budget should look like, so, normally our CFO helps us do that. It’s really a collective, in terms of proposal writing.
Barriers
Participants described many barriers which can make the application process more difficult for them, potentially deter them from applying, and distinctly impact their perceptions of ESDC’s programs and the process through which applications are assessed and organizations are funded.
- Lack of Resources: Many of the non-for-profit programs tended to be under resourced. This made the application process for grants and contributions especially challenging, as the process was deemed labour-intensive, cumbersome, and time-consuming.
- Partnerships: Some grants required collaboration among partnerships / several people in the application process. This heightened the complexity of the application process further, or even acted as a deterrent to applying among some.
- Application Requirements: Applications were described as highly prescriptive and were limited to a narrow definition of what the funds were applicable to:
- Challenging for ‘bare bones’ organizations that have some general / overarching needs for funding, such as equipment upgrade, staffing, programming support.
- Also challenging for non-for-profits that cover a broader scope, such as an item that would address a variety of people and needs.
- Applications and budgets were perceived to be designed for organizations with full-time employees, and lacked recognition that many are now contractors – a shift in the sector which saves organizations money. Seeing this reality reflected in the application and funding process would be a desired outcome.
In Their Own Words | Barriers
Lack of time and resources to apply Ça tombe dans la catégorie : « Je ne suis pas assez riche pour déposer des projets, ça demande trop de temps pour demander de l'argent au gouvernement fédéral. »
Lacking partners Tous les programmes [sur lesquels] on applique, il faut mettre tous les partenaires possibles dans le bateau puis embarquer. Parce que si on n'a pas les politiciens, ou si on n'a pas les Villes, ce sont toujours des questions qui restent nébuleuses.
Needing/Concerns about partners That’s where a lot of us don’t understand what that partnership legally has an implication in. There’s a lot of work that needs to be done on the background in order to even think about applying for that job or that grant, which sometimes is overwhelming, and we just don’t do it, because it’s just going to take too much time […] When it’s those partnerships, it gets pretty difficult.
Lack of recognition for contractors Even in the application form, the way the application form is set up […] it asks you how many employees, but we’re not employees. And so, just starting right from the application process, and then, when you're speaking to your grant officer, just complete lack of understanding of what a contractor is, and how they operate. We were asked, why are you paying that person so much? Well, because they’re one of the most highly skilled people across Canada, and they’re a contractor, and you know that contractors have to self-fund their own benefits […] how does that work out when you're a contractor? You have to include those benefits in your rate. So, does the rate sound high? Yes, it sounds high, but if you take it all into account, it’s not high at all. In fact, you're getting the work cheaper, in all likelihood. So, yeah, every step didn’t seem to have an understanding of what a contractor is and how they work.
Prescriptiveness of application questions
Because the grant is just typical questions; what’s your metrics, what’s your outcomes, you know, description, project, timeline. So, within that, I guess it’s just trying to find where you put those milestones. But we use those… because it’s just recently, like when it’s online, like what we’ve designed is built in with all the analytics and data, so you can actually see a lot of those things…But In terms of describing that and delivering that in within the grant, I don’t think there’s a lot of room to change the grant around and make it more story orientated by putting the milestones and all that. It’s very direct, like what is the outcome, what is the goal, what is that… and then, you can sweeten it. But I think more they look at the strength of the organisation.
Barriers cont’d
Lack of Flexibility: If trying to hire for a role within, the organizations want the flexibility to hire the best person for the job, rather than be pushed to make their candidate selection based on diversity quotas. Or, because of the amount of time that elapses between application and decision, projects may have shifted or changed but there sometimes isn’t any flexibility to adjust accordingly.
Perceptions of Favouritism or Bias: ‘Very small’ non-for-profits believed they were often overlooked in favour of the ‘typical, big’ organizations because they made a better impression on paper or were more well-known, and these were more likely to receive large amounts of funding year after year. There was also a perception of bias towards organizations in urban centres / larger markets, over those in more rural or remote locations. Some were of the opinion that larger organizations are less effective in reaching their communities and truly understanding and serving their needs.
Lack of Soft Metrics: Organizations that relied on ‘soft metrics’ (such as testimonials) as opposed to data-driven ones felt disadvantaged and had a difficult time finding ways to share their story within an application that was so focused on data, goals, outcomes, organizational strength etc.
Lack of Diversity: Some applicants assumed or observed (through information sessions for example) that most people reviewing grant / contribution applications were white (Caucasian), and felt they may be evaluating from a place of privilege, and thus may have lacked sufficient understanding of those their organization serves – i.e., communities who come from marginalized or vulnerable populations, BIPOC, immigrant, very low income etc. This led some applicants to feel they had to explain their need or cause in more depth to ensure it was sufficiently understood.
Vendor Challenges: Concerns emerged for those who were applying for capital improvements or changes to physical locations, such as through the Enabling Accessibility Fund – they consistently explained the difficulty of obtaining good estimates from contractors, as there are limited number due to factors such as location, or the pandemic. Further, they often seem to inflate their prices, or do not want to provide estimates for grant applications.
In Their Own Words | Barriers
Lack of soft metrics: C'est comme si les demandes que les organismes font pour aider les plus vulnérables, ce sont les demandes qui sont refusées. Donc, les fonctionnaires, dans leurs bureaux, là, ils ne regardent même pas : est-ce que ces projets, c'est au bénéfice de quel type de population? C'est au bénéfice de quel type de besoin? Est-ce que ces projets vont répondre à quel besoin? Est-ce que ces gens-là qu'on va aider, ils sont dans quel état? Comme par exemple, les immigrants, ils sont plus vulnérables, il y avait des immigrants qui venaient d'arriver, donc deux mois, et la pandémie a éclaté. Ils étaient vraiment vulnérables. Il fallait travailler sur leur intégration. Si on avait financé, on pouvait plus les aider. Le problème était au niveau du Gouvernement, au niveau des agents qui accordent ces financements-là, pas au niveau de personnes à qui on voulait aider.
Lack of Diversity
In info sessions that we’ve attended for ESDC, it’s usually white people doing them […] we do often feel like we have to explain it in a little bit more depth, and take up more application room, just in case the person doesn't get it. We don’t know who’s going to read the application, so just based on what we’re saying, we have to make that assumption. It’s not just the ESDC, it’s in general, we just have to assume that they won’t get it if they’re not Black, of if they haven't lived in a low-income neighbourhood, or anything like that. Specific to the population we work with, we work with newcomers, with all racialized people, low-income people, deeply low-income people. And so, it’s sometimes difficult to make the argument to someone if they are not familiar with the context or the history.
Lack of flexibility: Présentement, les gens ont peur de me sortir des soumissions, parce qu'ils disent : « Si, toi, ça te prend six mois, moi, mon prix ne me tient plus. » Ça fait que c'est devenu complexe pour tout le monde, y compris les bénévoles, y compris les travailleurs, y compris les compagnies, y compris les fonctionnaires, y compris les programmes : tout coûte plus cher, tout est plus hasardeux.
Perceptions of favouritism […] mostly either the government or other donor organizations rely on these well-established organizations for the grants. But there are so many missing links there. These bigger organizations just may have very limited interaction and the connection with the grassroots communities. It is very, very important for the Canadian government and for the other organizations to consider the grassroots organization like ours. I can talk about what is missing, especially what our community needs.
Service Dimensions
Service Dimensions
Service Dimensions (called Service Areas to be more plain language / participant-friendly) were presented and discussed with participants in the focus groups and in-depth interviews.
- Ease: simplicity, clarity, and convenience of the information and service
- Information was easy to find when needed
- You only had to input your information once
- The information was easy to complete and understand
- The process was easy to determine and it was easy to know the steps, the information needed, how to get help, etc.
- You could get information easily
Service Canada defines EASE as:
- Effectiveness: availability, timeliness, and consistency of help and information; effectiveness of service
- You received the information you needed
- You were able to get help when you needed it
- You received service in the official language of your choice (documents or in-person service)
- You were provided and/or provided feedback easily
- The process was transparent (including the process, stages, status)
- There was a reasonable amount of time to access the service, complete task(s), receive information, resolve an issue, or receive a decision
- You received consistent information throughout the process
- The process was easy to follow to complete the tasks
- You were able to complete tasks/resolve issues
- You knew what to do if you had a problem
- You felt as though you were always advancing/moving forward in the process
Service Canada defines EASE as:
- Emotion: respectful treatment and confidence in service
- (if applicable) Your interaction Service Canada agent(s) was respectful, courteous, and helpful
- Service Canada demonstrated an understanding and ability to address your concerns
- Your personal information was protected
- You were confident that you were following the correct steps
- And you knew that the information/decision will be received and know what steps to take next.
Service Dimensions
Clients’ experiences with Service Canada’s service dimensions varied. Some felt that their experiences aligned along one or two of the service areas/dimensions; very few felt that their experiences aligned with all three.
Opinions varied on which of the three were more important than others, and this was typically directly tied to the experience they had.
In general, participants want to have a relationship with ESDC that recognizes their roles in their communities and the importance of the work that their organizations do, and a service model that reflects this – that is flexible, respectful and allows for some two-way dialogue.[…] that lack of flexibility that they just want us to tow the line of the government […] but we also deliver the service. That insistence that everything has to cross the “Ts” and dot the “i’s” has really driven us crazy when we are working with ESDC, the regional level has been absolutely challenging.
Service Dimensions | Ease
Drivers of perceptions of ease:
- Using the website / portal was straight forward for some once they had some past experience with it.
- For some, the layout of the proposal was easy to navigate.
- FAQ section was available for immediate help online – although it wasn’t always helpful in providing the desired level of clarity and was cumbersome to reference due to being long.
- Application Guidelines page was easy to use.
- For some, ESDC staff was responsive to questions during completion of the application.
- For those participants whose projects were funded, most perceived their Project Officer(s) positively – as being helpful, respectful, courteous, and responsive.
Ease based on experience
Donc, facile, parce que, d'abord, nous trois, les trois personnes qui faisaient la demande, on avait déjà de l'expérience. Comme j'ai dit, moi, je travaille déjà dans un organisme communautaire. Ça fait au moins 20 ans que je suis là. J'ai déjà une expérience dans cette matière-là. C'était facile parce que, dans le programme, il y avait plusieurs aspects.
Ease of application
Everything was fine. It’s a very straightforward, easy process, if you had any questions, there was a contact that you could submit questions. They were very responsive.
Service Dimensions | Ease cont’d
Barriers to perceptions of ease:
- The portal was deemed difficult and cumbersome to navigate and use – especially among first-time users. However, some with past experience with the portal still found it ‘impossible to use’ and opted instead to print out the PDF, fill it out, scan it and email it in instead.
- The questions were commonly viewed as difficult to understand, highly complex, unclear, and/or open to interpretation – such as the term ‘diversity’. This led some to feel concerned that they may have lost out on funding because they didn’t answer the questions accurately due to misinterpreting what was required.
- For some grants, space that was provided in the application was not adequate (whether completed online or in a PDF), making it difficult to provide the optimal details or in some cases to even fit in the full name of the applicant organization.
Difficulty interpreting questions
My brain just exploded. In terms of the proposal itself, if there was a clarifying question on that question, you can go to the booklet that they give you, but the language is sometimes difficult to fully understand. That clarity piece is sometimes difficult, and there’s proof of that when there’s 1000 questions on that FAQ.
Lack of user-friendliness
Ça n'a pas été facile. Premièrement, les formulaires électroniques fonctionnaient drôlement. Après ça, quand est venu le temps, ils disaient qu'il y avait un site pour déposer. Pas capable de le faire, donc c'est pour ça qu'à la fin, ça s'est fait en courriel, mais avec les documents numériques.
Service Dimensions | Ease cont’d
Barriers to perceptions of ease:
- Completing the application(s) was cumbersome, time consuming and labour intensive, and applicants often required input from others in the organization.
- There was a lot of detail and foresight required to complete the application – the process could take weeks or even months before even attempting to enter the information online.
- There were unexplained technical glitches such as work not being saved, resulting in having to re-enter the information, or adopt workarounds such as writing out responses in Word first.
- Some did not understand or had difficulty filling out the budget portion or they found the excel sheet difficult to understand or complete.
Difficulty interpreting questions
My brain just exploded. In terms of the proposal itself, if there was a clarifying question on that question, you can go to the booklet that they give you, but the language is sometimes difficult to fully understand. That clarity piece is sometimes difficult, and there’s proof of that when there’s 1000 questions on that FAQ.
Time required to fill out application
[…] you have five days from the time you get the form; you have to fill it out and get it back in five days. They have a teaching program, which I took, but it didn’t help, and once you start filling out the form, the ‘save’ button did not work. So, if you started filling it out and then you put it on save to do something else, you come back it’s gone, so you have to start all over again. It took me, when I started at 10:15 in the morning, it took me ‘til 3:30 in the afternoon to fill out the form. So, that’s how long it takes. You have to gather all the information ahead of time and you have to do it all in one shot.
Glitches
I did it four times before they received it, so that means like five hours four different times, typing the whole thing because it would not save.
Service Dimensions | Effectiveness
Drivers to perceptions of effectiveness:
- Those who have received a grant or contribution in the past shared a general feeling that the process – albeit cumbersome and at times slow – is effective to some extent, since it has resulted in optimal outcomes for them before.
- A few felt that whenever they had a question during the application process they received a response in a timely manner, i.e., within 24hrs. and received the responses they needed.
- Webinars by Service Canada were helpful – via dialogue during the sessions, and difficult questions or ones that were not covered, were addressed by email following the sessions.
Effective contact with ESDC
Je me souviens que celle qui travaillait avec moi avait contacté Emploi et Développement social. D'ailleurs, je dirais qu'il y a même un numéro qui permet de contacter une personne si on veut avoir plus d'informations ou il y a une question qui nous-- que ce n'est pas clair pour nous, alors, oui, de ce côté-là, je pense qu'on a toute l'information [nécessaire]
Effective information received from ESDC
Yeah, I’d say all the conversations we’ve had, even in different webinars we’ve attended, everyone is pretty understanding. People ask a lot of questions, some difficult questions, even if they can’t answer it at that moment, they’ll respond in an email summarizing all the responses. They do take it pretty carefully, so I would say, pretty high in that regards.
Glitches
I did it four times before they received it, so that means like five hours four different times, typing the whole thing because it would not save.
Service Dimensions | Effectiveness cont’d
Barriers to perceptions of effectiveness:
- Finding and receiving support from Service Canada during the application process. Experiences included:
- Slow response times on application form-related queries. When emailing Service Canada asking for specific information related to the application, many found that responses took a long time, sometimes weeks, resulting in uncertainty.
- Not knowing who to contact, or not being able to find an email address or telephone number of someone they could contact with questions.
- Having decisions changed in terms of the amount of funding being received and being told contradictory information by different individuals.
- Decision dates that were delayed, often multiple times. Organizations had to make programming and staffing decisions that were dependent on whether they would receive the funds from the government. Delayed decisions, at times, resulted in loss of summer employees who found other opportunities.
Confusing and inconsistent communications
So, the whole process was incredibly flawed… we’re very grateful for the funding, the project is rolling, we’re having a lot of success with it. But there was a lot of room for improvement over that period of nine months. And I will say that, just to remind you, the application went in in July of 2019; December of 2020 is when we finally received the funding, so that’s 18 months later, of constant communication back with ESDC with very mixed messages.
Lack of communication about decision
[…] when are we going to start this program, so it affected the start of our program because we had no idea when it’s going to start […] And I am the one who have to initiate asking for status and feedback.
Glitches
I did it four times before they received it, so that means like five hours four different times, typing the whole thing because it would not save.
Service Dimensions | Effectiveness cont’d
- A perceived lack of expertise by those evaluating the grants. A few held the opinion that those who reviewed the applications and reporting were generalists who did not understand the subject matter or what the organization applying for the grant did, or the needs of the community they are serving.
- Communication lacking after submission of application. Some applicants were in the dark once they submitted their proposal into what felt like ‘a black hole’.
- In some cases there was no correspondence sent to applicants at all, not even when the decision date was delayed multiple times. The onus was on the applicant to keep checking the status of their application and many were unaware that this was an option.
- No opportunity for feedback as to why application was not funded. Several applicants described once they found out they were declined for a grant or contribution, there was no process in place through which they could obtain any information or constructive feedback as to why their application was declined.
No clear process for feedback
It was frustrating, because it’s like, okay, what else can I… Because I myself, I do like to know where I can improve, and what I can do differently, so that the next time around when this comes around, what is it exactly you're looking for? Where did I make a mistake, or where could I have enhanced what I was stating? […] it still would be nice for them to say, “You know what? I think I need some more clarification with this. Can you please provide us with some more information, so that we can consider this?” Because if they are just looking at it, and say no just because of the one thing, it’s like, well okay, that was a couple weeks out of my life time-wise, not all at once, but time-wise. It was a lot of time to put that together.
Service Dimensions | Effectiveness cont’d
- No visibility or awareness of which organizations were funded. It would have been helpful for some organizations to be able to engage with, and create synergies with other organizations who also received funding – or to simply understand who was funded and why.
- No visibility on the amount of money available – that is, the size of the whole envelope – and what would be optimal amounts for the organization to request – so they can ensure that the amount is not too high or too low and adjusting their effort on the application accordingly.
- The effort, time, money and resources put into the application process is not worth the results for some who were not funded. Even amongst those who were funded, the small amount of money ultimately allocated also did not seem worthwhile.
Application effort and funding amount
[…] maybe they can have different, I don’t know, levels of funding. Because sometimes you’re filing out something that’s 25-pages long and you may only be looking for $5,000, and somebody that’s looking for $500,000 is filling out the same form, so. And I think that, especially with small volunteer groups like mine, we’re wondering is it worth it, like all of this work, and it’s like the same grant for all levels of funding. Man, because like sometimes, like yeah, and it’s repetitive, you know, is there some way so if you’re only looking for $5,000 to $10,000, then it’s this grant you fill out. And it’s not only the federal government, like the provincial had one, it was 12-pages long for 500 dollars, like I don’t think so. It’s not kind of worth the time and the money.
Service Dimensions | Emotion
Positive emotions:
Negative or neutral emotions:
- Lacking in confidence:
- Completing questions that were deemed highly complex or extremely vague left several applicants lacking in confidence in their submission, questioning whether they interpreted the questions appropriately.
- Not knowing how much detail to provide in a given area, or being limited by the space available for their answer heightened this feeling among some.
- Some were unsure of the type of language they should be using when completing the application.
Perceptions of ESDC staff
The project officers are amazing.
Uncertainty on how to respond to questions
[…] it was really vague what they wanted, and maybe that was purposeful. Maybe they just created something innovative. What does that mean? What are the parameters around that? You sort of went, okay, let’s create something really interesting. I think it was fine […] or it could just be that I suck at writing, so who knows?
Service Dimensions | Emotion cont’d
- Stressed and anxious:
- Completing a complex application in time to meet tight deadlines, and then being held up awaiting clarification on some questions all contributed to stress.
- On occasions when the decision on approval for funding was delayed, there was a sense of anxiety / stress around how to make decisions about their program without knowing whether they will receive the funds needed.
- Frustrated, dismayed and angry:
- Several applicants from ELCC told us their application was denied because it wasn’t focused enough on challenges related to the pandemic. However, this criteria was not mentioned in the request for proposal (RFP) and so the applicant did not know to include or expand on the topic, and as a result, did not get selected for funding. The applicants only found out after-the-fact, from a form letter and had no recourse for a discussion on how their application could be improved.
Complex and stressful process
From start to end, some proposals are more cumbersome, just the nature of what you're trying to do, and the complexity of the project. Sometimes, more time is needed instead of the one month, instead of four weeks, because some projects are very complex. It involves a lot of people, and a lot of organizations, and a whole bunch of stuff. If they can extend those instead of the staple one month, that would be awesome. Getting quicker responses from them, they don’t have to, this is where your proposal is at, we’re at this stage, we’re at this stage. That would be great for you to know where you're at. Even a rejection letter […] then you know that you didn’t get it, so that we were one of those people that weren’t notified, so obviously we didn’t get it.
Service Dimensions | Emotion cont’d
-
- Instead of decision-makers reaching out to them for clarification, they were simply told ‘no’ or told in the form letter that there was no opportunity to ask questions or obtain any constructive feedback.
- Limited in ability to establish connection or relationships with decision-makers:
- Those reviewing the application did not interact with the applicant nor the organization enough to understand them on a deeper level.
- In addition, applicants at times felt limited in their ability to share testimonials or detailed examples of how their program helps others – they felt it was difficult to convey these important elements within the application.
- Disrespected due to perceptions of double standards with regard to timelines – that is, applicants are expected to do things very quickly while the perception is that Service Canada takes its time for any actions on its end.
- From an equity perspective, newcomers are not familiar with the funding system and advocating for themselves can be an emotional process.
Not being treated with respect
Le respect, c'est dans les réponses, là. Parce que quand on fait la demande, on s'attend à avoir une réponse, que ça soit négative ou positive. Mais, comme dans notre cas, on n'a jamais eu la réponse, donc c'est comme s'il n'y a pas un traitement respectueux.
Equity considerations
The emotion piece ties into the equity lens, and a lot of newcomers or folks from cultures that aren’t familiar with systems, and come from maybe very broken systems, and they’re needing to advocate for themselves, it becomes a very emotional process, and managing that is important.
Service Dimensions | Emotion cont’d
- Some felt the process ‘treated people badly’: In some instances the time between the Request for Proposal (RFP) and application submission deadlines was tight (putting undue pressure on the applicants who were hindered by the pandemic), and yet when it came time to make a decision on who would be awarded the funds, there were multiple delays and minimal (if any) communication with applicants.
- Once a decision for funding was made, some felt pressured to very quickly turn around and sign agreements and/or find individuals to hire.
- Not awarding applicants the opportunity to ask questions or obtain feedback as to why were not approved further heightened a feeling of not being treated with respect among some.
- Some felt disrespected because they didn't get an explanation as to why they didn't get the grant.
- Some felt misunderstood because the reasons for refusal evoked a feeling of irrelevance.
Process Integrity
Moi, je me suis demandé sérieusement si j'avais été lue, si notre projet avait été lu. Alors, je me suis dit : « Ceux qui étudient notre dossier, comme [redacted] l'a expliqué, ils ont des mots-clés. » Parce que moi, j'ai eu ma réponse en retard, puis tout ce que ça disait, ce n'était pas en relation avec le projet Nouveaux Horizons pour l'aîné. Puis toutes les questions, toutes les réponses, ça a été étudié par d'autres, on était un groupe, on avait toutes les lettres de soutien. Ce sont toutes des personnes âgées, c'est impossible que ça n'était pas en relation. Mais c'est la seule phrase qu'ils ont mis : « Votre projet, il n'est pas en relation avec programme les Nouveaux aînés. » Alors, on s'est dit : « Voyons, on n'a pas été lus. Ils n'ont pas lu notre projet. »
Service Dimensions | Emotion cont’d
- There were feelings of treated as a service provider rather than a trusted collaborative partner in fulfilling important programs and meeting the needs of their community, and a lack of recognition of the importance of the work they do.
- A lack of flexibility by the government in program fulfillment – and not being able to adapt to current needs and on the ground realities – left some feeling frustrated and feeling as though there was a lack of trust in the relationship.
Lack of flexibility
It’s just really hard for people to attend anything; the price of gasoline, the cost of rent, everyday living expenses, and access to culture, traditions, traditional food, like wild game and everything, is really difficult in the city as well. So, there are a whole host of barriers that we see, and we try to provide services and programs that meet those needs and fill those gaps […] it’s not even a consideration in the funding actually, like it’s not a whole lot of money and we don’t even have a full-time staff […] associated with that program. It’s kind of just added on to the responsibilities of another staff person who’s funded through another program, or a combination of different programs. And so, we kind of have to be creative like that in order to meet all of the needs of the community, and it was very challenging […]
Client Needs And Expectations
Feedback on GCOS
Satisfaction With Experience
Feedback was received on various aspects of the application process and whether these were satisfactory.
For those who applied using GCOS – opinions were mixed. Those who considered themselves web or technology savvy, and those had previous experiences with GCOS or similar portals, were satisfied with their experience and did not believe that there were any improvements or adjustments that could be made.
However, many others had high levels of dissatisfaction with GCOS. It should be noted, there were some participants who use several different portals for funding, and so any comments that are not related to GCOS could be about these other portals.
Lack of user-friendliness of GCOS
[GCOS is] very intimidating. And that’s why I’ve been doing it myself, because it’s going to take a while to teach somebody to go through those steps, even to find what you’re looking for. It’s not very, I’ll put it, user friendly, that’s how we used to use it in the records management world. It’s not user friendly, so if you’re trying to look for something to change something, it’s going, drilling down and you’re clicking here and you’re clicking there. But I’d rather the uploading of the form, but since they went to that, I figured it out myself.
In Their Own Words | Feedback on GCOS
Lack of user-friendliness of GCOS
Quand j'ai rempli ma demande, j'ai tout fait sur Word [rire] pour pouvoir remplacer des mots, faire les changements facilement, mais quand ça a été le temps de la mettre sur la formule pour l'envoyer, c'était trop compliqué pour moi.
Lack of user-friendliness of GCOS
On nous demandait de faire un budget pour la prochaine année, sur quelque chose d'innovation avec plein de détails. Le gabarit n'était pas facile. Je le sais, parce que j'ai aidé d'autres organisations qui était prises avec ça, puis qui maîtrisaient moins la finance.
Lack of a collaborative online system
One of the things that I have said over and over again, where it comes to projects that repeat and call for the same information every year, is that really, these organizations, our organizations deserve to be elevated to more of a portal system. The portal system is good because people that replace other people get to see what’s already there, what information is already there that the organization has put in. We shouldn’t have to be rewriting the same things year after year, only refresh where there’s been changes in the executors, or if there have been changes in the mandate. I would really like to see a portal system […] we have created files in Google Drive that are more user-friendly, but it still means that we’re trying to get people up to a level. The amount of technology awareness that people have is pretty low. Intolerance for technology.
Feedback on GCOS
Satisfaction With Experience
Their concerns included:
- A perceived general lack of being user-friendly.
- Not being able to save their progress within the application as they go.
- Losing responses / disappearing; having to re-enter responses multiple times.
- Having a time limit on their responses. A workaround was to write their responses first in Word before entering them into the platform.
- Not being able to have multiple users work on the document at once (as with Google Drive).
- Character minimums and limits.
- Confusing language / legalese.
- Confusion around logging in, and keeping track of multiple logins across various portals (not just ESDC).
- A general lack of technical savvy / support and limited resources to help with this.
An ideal experience would improve on the items above by directly addressing these concerns including: saving progress in the application; not losing responses when completing the application; entering information only one time; etc.
Feedback on GCOS cont’d
Satisfaction With Application
Among those who did not use GCOS, some had attempted to do so and gave up in frustration, and so they opted to use the online application or the email-able PDF. The PDF also received mixed reactions – some found that it worked well, while others felt that it was not user-friendly.
Some felt that the application itself could be improved. Concerns included:
- Being too long and complex;
- Having too many repetitive questions; participants felt compelled to provide slightly different answers each time.
- Being too vague about what content is required, or what content is most likely to be successful.
- Needing to fill in the same information year after year repetitively (such as basic organization information), project-specific information, or in the case of Canada Summer Jobs, having to fill in information on each position individually
Long and repetitive application
Il y a des fois que, honnêtement, on se répète, on a l'impression qu'on se répète. En tout cas, on a l'impression que nos réponses se ressemblent. Alors, peut-être que ça pourrait être moins long. Moi, je marche beaucoup avec les puces, parce que ça me permet d'être directe : « Voici ma réponse et voici avec les puces le pourquoi. » Fait que ça évite de développer des textes à ne plus finir.
Long and repetitive application
Well, I found that they were very repetitive […] I found that it was the same answer, but I had to do it two or three different times and say the same things in different words. And it was just really time consuming, and I’m a volunteer, so I don’t get paid.
Feedback on GCOS cont’d
Satisfaction With Application
Some participants felt that issues could be mitigated as follows:
- provide information that is much more clear upfront;
- a format that is user-friendly – less complex and time-consuming;
- information sessions should be run by those who both knowledgeable, and have the authority to answer questions on the spot; and
- provide information on the impetus for the program and what types of projects or criteria the program is seeking
That said, almost all clients intended to continue applying for programs, as they are dependent on funding for their organizations, and point to their own tenacity, persistence and passion for the work they do as drivers.
Lack of information on program
[…] we did look into the history more around why this grant came up. It wasn’t necessarily in the guidelines. We just looked at old news releases to try to get an idea of what they funded in the past, and what other types of programs they would fund over the years. If I recall, I think at the beginning, the first round, there were a lot of research-type applications, and our guess was over the years they would look at more project delivery type of applications. That was just our wild guess. We don’t know if that’s accurate or not, but that was just our inference based on what we were looking at. I still think the project that we proposed is very much in demand.
The Ideal Experience

Timelines:
- Decisions to be made and communicated to the applicant organizations in advance of their fiscal year start, so that they can plan their budgets accordingly.
- Shorter timelines for decisions – rather than having participants wait for months – and mitigating changes in circumstances that may affect their eligibility or project plans.
- Allowing longer submission windows for complex / lengthy applications – extending these to be mindful of the reality that organizations face in terms of limited time and resources, the amount of time it takes to discuss and decide on their submission, and to gather any necessary documents, vendor quotes, or a budget.
- The government adhering to the promised decision timing as outlined from the outset; allowing successfully funded participants more time to sign agreements and hire summer students, vendors and gather resources.
We applied, as I said, and then waited, and we knew normally things take at least three months before we hear back, and we say, okay, 90 days we’ll hear back. We heard back once to say that they were looking at it, then didn’t hear anything for forever. I will have to go back to my emails to check my exact dates, but it was internal with fiscal. We got another email saying, “Still looking at it,” and then, nothing. Nothing, nothing, nothing. So, once you tell me you're still looking at a file, there’s a hopefulness on my end to say, okay, I’m not pushing any buttons, but you need to hear something. And then, when you get nothing, you think, okay. We’ve got tons of applications on the go, just to be able to meet top-up programming needs across different programs. So, my awareness or flag of, wait a minute here, we didn’t hear back from this. And then, by the time you look at it, there is nothing. I don’t know, to me, that was, something somewhere fell short, because if you were telling me twice that you're looking at it, it gives me an indication that there is some weight or validity to the proposal.
The Ideal Experience cont’d

Communication:
- Proactively keeping applicants up-to-date on the process and providing more precise details on their applications, i.e.; application received, application reviewed, etc.
- Notifying applicants even if they are not selected, rather than only notifying those who are approved.
- Allowing applicants the ability to obtain feedback on why they were not funded, so they can learn from the experience and improve future chances of approval.
- Proactively reaching out to applicants to provide more clarity and guidance around what type of information, or what key criteria is important to include.
- Providing a dedicated contact person to address questions – someone who understands the relevant dynamics of the applying organization.
- Ability for others whose name is not on the application in cases where someone else submitted it – to communicate with Service Canada about the grant or contribution.
Lack of direct communication and dialogue with ESDC
[…] we like to talk to the person who deals with the application. We have this kind of experience with two, three organizations. One was with the Alberta Government organization. They declined our application two, three times. And then, finally, we wrote to them and wanted to ask them to sit down with us and understand our perspective. So, they sat down with us, we discussed, and they just realized a lot of things […] they misunderstood the name, and they just told us, they undermined our application at the first glance. And then, they finally once they learned it and they gave closer attention to our services, and they liked it, and they granted us, they just gave us a grant. We don’t know if that [is the same with] our application with the ESDC […] We liked that. We asked for that. Nobody responded so far.
The Ideal Experience cont’d

Desire for longer programs
Well, why not commit to four years for the organization? You've got a good project. Why are we beating our heads against the wall trying to come up with, okay, maybe another idea that they might go for, and it was an idea that they dropped that was a good idea that would have really engaged seniors, but they dropped it, so you don’t know if they put it back on. […] Who came up with 12 months? Where did 12 months come from? It goes so fast. In 12 months, you're applying again, and that’s a lot of energy that has to go into that.
Other Ideas:
- A better understanding of the eligibility criteria and the decision process – to help participants understand if applying for funding is a good fit and worth their time, energy and resources.
- If criteria such as pandemic-related projects are considered in the decision over funding, the Request For Proposal (RFP) needs to communicate that information.
- Ability for applicants to submit a letter of intent, to enhance transparency in the process.
- Making it easier for applicants to access educational information related to the grant or contribution
- Instead of limiting education sessions to a single one, offering weekly online information sessions / webinars during the application window to provide ongoing related education.
- Providing alternate ways to access the information for those who cannot make the session(s): dedicated contact person who address questions as they come up, recorded webinars, info sheets etc.
- Knowing what questions will be posed within the application so participants can prepare accordingly and not have to come up with responses on the spot, and risk losing them due to technical issues.
- Being able to renew their grant, and/or having multi-year grants, instead of replying repetitively to the same program with the same information year after year.
Exploring Selected Quantitative Findings
Early Learning and Childcare Innovation (ELCC) and Sustainable Development Goals (SDG) Application Feedback
Based on results from the quantitative survey, we recruited participants from ELCC and SDG to understand lower rates of satisfaction for these programs. Multiple participants had similar experiences in applying to ELCC, which drove the lower satisfaction for this program.
- Applicants to this program were excited about the prospect of the transformational changes that such a project could make to their community, and of the positive impacts it could have. These were innovative programs which in some cases had unique or new components.
- Applicants put a great deal of time, effort and energy into writing and submitting their applications, including content, budget and other requirements – often sacrificing their own personal time – because they felt that the need and opportunity were so great.
- Many submitted what they felt was a strong application which clearly outlined the needs of the community for their projects or programs.
Experience with ELCC
However, there were significant delays on decisions and experiences were mixed in terms of receiving proactive communications from ESDC – most heard nothing, there were some who followed up or found out through the website.
Most were unsuccessful in obtaining funding. Having applied in January, many received a form letter on December 24 telling them that: a) they were unsuccessful as their application did not sufficiently address COVID-19 pandemic considerations; and b) the decision was final, and there was no recourse or opportunity for further discussion. Mention was made by a few that a letter was not received and so these clients simply assumed that they were unsuccessful.
This experience was extremely disappointing to many, and described feelings of disappointment, anger, or even feeling ‘betrayed’. They felt that the COVID-19 pandemic component was not made clear upfront; that the timing of the decision letter was poor; and that they should have the opportunity to discuss their applications in more detail, to understand how it can be improved and more successful in future.
Experience with ELCC
On this call for proposals, it was due in January. After getting an automatic response saying, ‘Thanks we received your proposal’ there was not one word until other people I knew at Christmas Eve last year, and I didn’t, but a lot of people got letters saying ‘We didn’t fund your proposal’ which was due last January. That's unconscionable. I didn’t get anything. It sounds like a joke that you say to people on Christmas Eve...And they did fund a couple. But between January 6th...it was almost a year later. Everyone assumed they had just been dumped.
Emotional experience of ELCC
I think I was betrayed. I think it was a sense of betrayal that was the worst […] that was at the expense of the future of our children, in this case.
Experience with ELCC and SDG
Many stated that they understand that they will not be successful for every application they submit, and that this is a reality in their sector / organization. What was most upsetting was the manner in which the information was conveyed.
The long delays created significant uncertainty for these organizations, as there were project, resourcing and other decisions and considerations that were delayed or made uncertain as a result.
For SDG, feedback was mixed. Funded organizations were satisfied with the experience and were happy to fulfill their projects using the funding provided, in alignment with SDGs. Others felt that there needed to be more ‘modern’ funding made available, which considers and includes social enterprise. There was desire by non profits to see social enterprise programs developed by the federal government in recognition of social enterprise’s evolving role in the sector.
Desire for social enterprise program
My business is set up as a social enterprise. Generally, the government bids when they come out, they’re either most of them, many of them are for not-for-profit. I’m not a not-for-profit, so I didn’t even ever pay attention, because most of them disqualified because I’m not a non-profit. However, the SDG, what I thought was progressive, and they were looking at organizations that could help facilitate and advance the SDGs in Canada. They weren’t looking for non-profit only. I do have an issue. I don’t understand why non-profit has to be, the majority of the funding goes to a non-profit, as opposed to social enterprise. I would think that social enterprise is very, very progressive, but it doesn't seem to be accounted for.
Appendix 1
Change in Quality of Service Received (Among Repeat Applicants)
Change in Quality of Service Received (Repeat Applicants)
- Roughly 3 in 10 of those who have applied to the same program previously said that their experience has improved in some way. The highest ratings were for improvement in the ease of submitting the application (39%), the ease of completing the application (38%), and overall satisfaction with the service received (38%).
- Fewer repeat applicants said that the quality of the service they received declined and most felt that the service level remained the same.
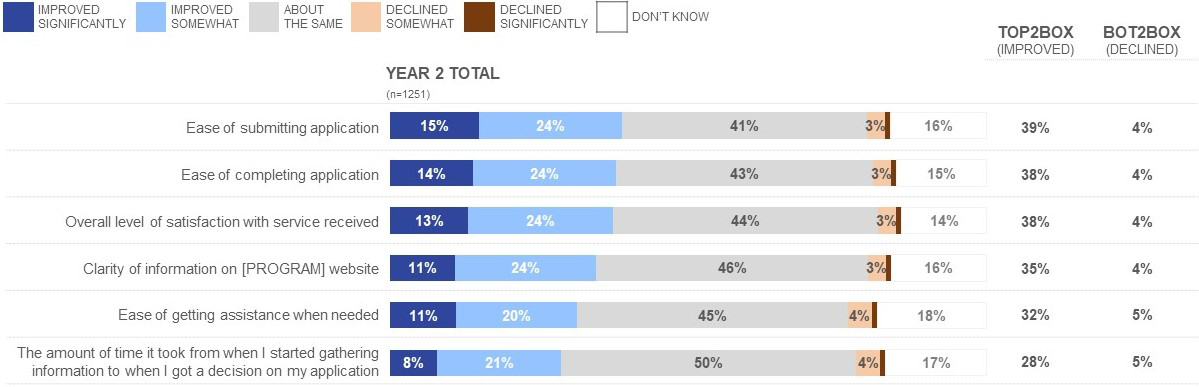
Figure 68: Change in Quality of Service Received (Repeat Applicants)
This horizontal bar chart shows responses to a question about whether the quality of services improved or declined among repeat applicants. Only those who have applied in the past were asked this question. A total of 1251 respondents answered as follows:
- • Ease of submitting application: improved significantly 15%, improved somewhat 24%, about the same 41%, declined somewhat 3%, declined significantly 1%, don’t know 16%. Improved 39%. Declined 4%.
- • Ease of completing application: improved significantly 14%, improved somewhat 24%, about the same 43%, declined somewhat 3%, declined significantly 1%, don’t know 15%. Improved 38%. Declined 4%.
- • Overall level of satisfaction with service received: improved significantly 13%, improved somewhat 24%, about the same 44%, declined somewhat 3%, declined significantly 1%, don’t know 14%. Improved 38%. Declined 4%.
- • Clarity of information on [program] website: improved significantly 11%, improved somewhat 24%, about the same 46%, declined somewhat 3%, declined significantly 1%, don’t know 16%. Improved 35%. Declined 4%.
- • Ease of getting assistance when needed: improved significantly 11%, improved somewhat 20%, about the same 45%, declined somewhat 4%, declined significantly 1%, don’t know 18%. Improved 32%. Declined 5%.
- • The amount of time it took from when I started gathering information to when I got a decision on my application: improved significantly 8%, improved somewhat 21%, about the same 50%, declined somewhat 4%, declined significantly 1%, don’t know 17%. Improved 28%. Declined 5%.
Volunteer-based Organization
[…] I guess that they need to also think about for small organizations, which for example, you don’t have staff, but the need is there […] So, the person who is writing the grants probably will be us, as volunteers, myself, and the person who is helping the seniors, also myself. So, you wrote it, you help them, and people ask me, why are you doing this? You wrote it, you got approval, then you have to do the implementation with them, and you have to do the final report, everything. So, I don’t really have time for anything for the whole whatever year, okay? […] Imagine on the summer, I could only have that four months to implement all the items. I myself, my summer will be like hell, myself. I can’t go anywhere. probably will be us, as volunteers, myself, and the person who is helping the seniors, also myself. So, you wrote it, you help them, and people ask me, why are you doing this? You wrote it, you got approval, then you have to do the implementation with them, and you have to do the final report, everything. So, I don’t really have time for anything for the whole whatever year, okay? […] Imagine on the summer, I could only have that four months to implement all the items. I myself, my summer will be like hell, myself. I can’t go anywhere.