It is available upon request in multiple formats (large print, MP3, braille, e-text, DAISY), by contacting 1 800 O-Canada (1-800-622-6232). By teletypewriter (TTY), call 1-800-926-9105.
Service Canada sondage sur l'expérience client 2020-2021
Ce document offert sur demande en médias substituts (gros caractères, MP3, braille, fichiers de texte, DAISY) auprès du 1 800 O-Canada (1-800-622-6232).
Si vous utilisez un téléscripteur (ATS), composez le 1-800-926-9105.
I hereby certify as Senior Officer of Ipsos that the deliverables fully comply with the Government of Canada political neutrality requirements outlined in the Policy on Communications and Federal Identity and the Directive on the Management of Communications. Specifically, the deliverables do not include information on electoral voting intentions, political party preferences, standings with the electorate or ratings of the performance of a political party or its leaders.
President
Ipsos Public Affairs
Additional information
Supplier Name: Ipsos Limited Partnership
PSPC Contract Number: g9292-217650/001/cy
Contract Award Date: 2021-02-18
Executive Summary
Service Canada CX Survey 2020-21 — Results at a Glance
4,200 interviews conducted (between 700-1100 per program)
Methodology: Telephone survey
Fieldwork: June 26 to Aug 9 2021
Client experiences that reached initial decision Jan-March 2021
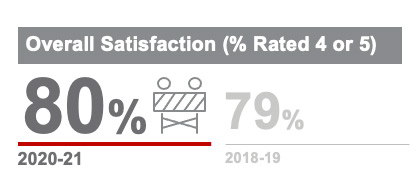
Explain only once: 77%, 2020-21; 78%, 2019-20; 77%, 2018-19
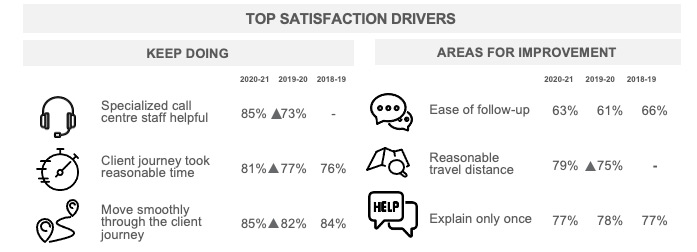
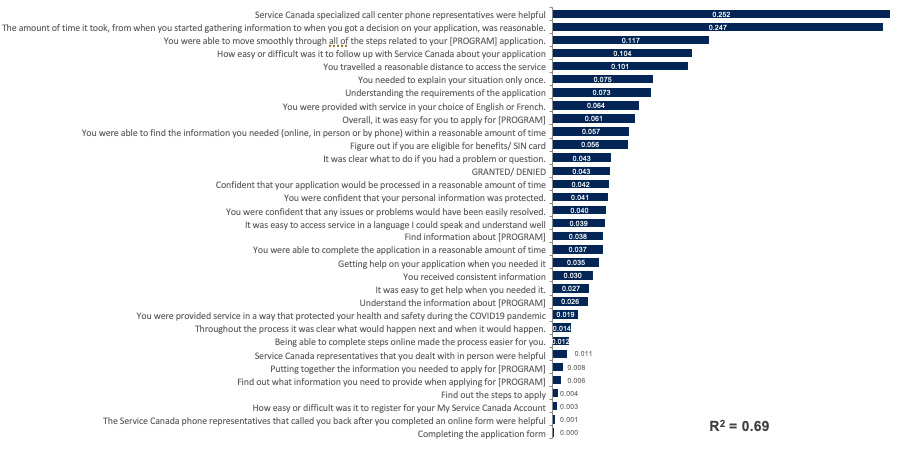
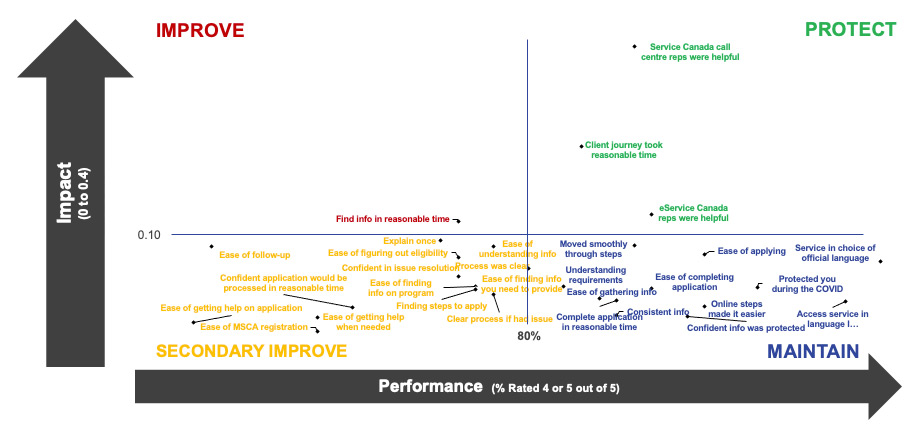
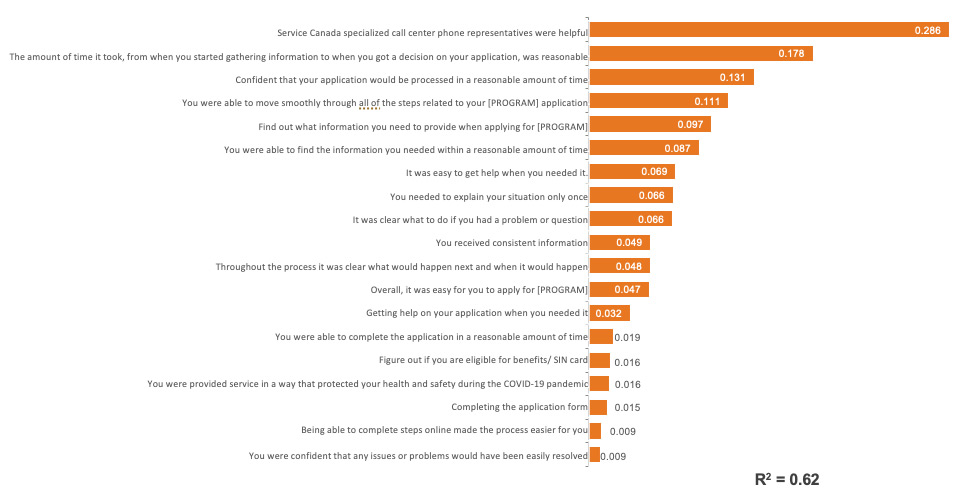
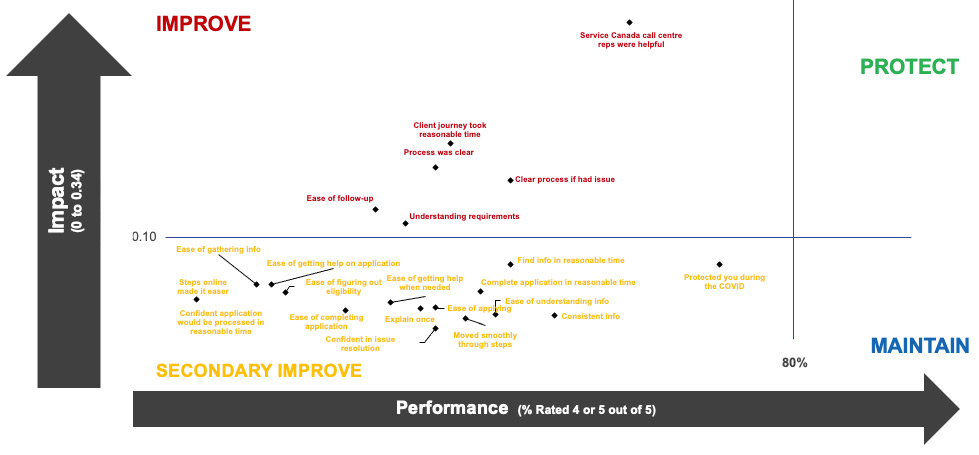
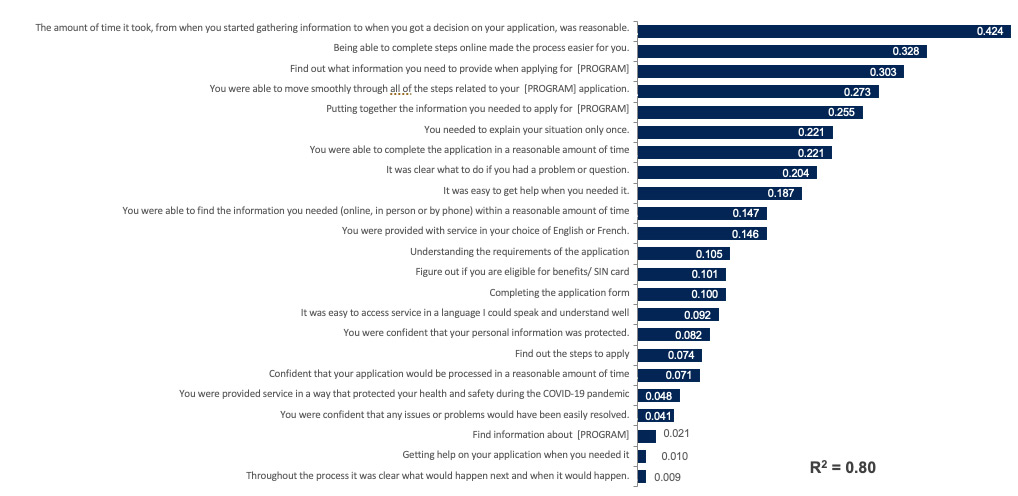
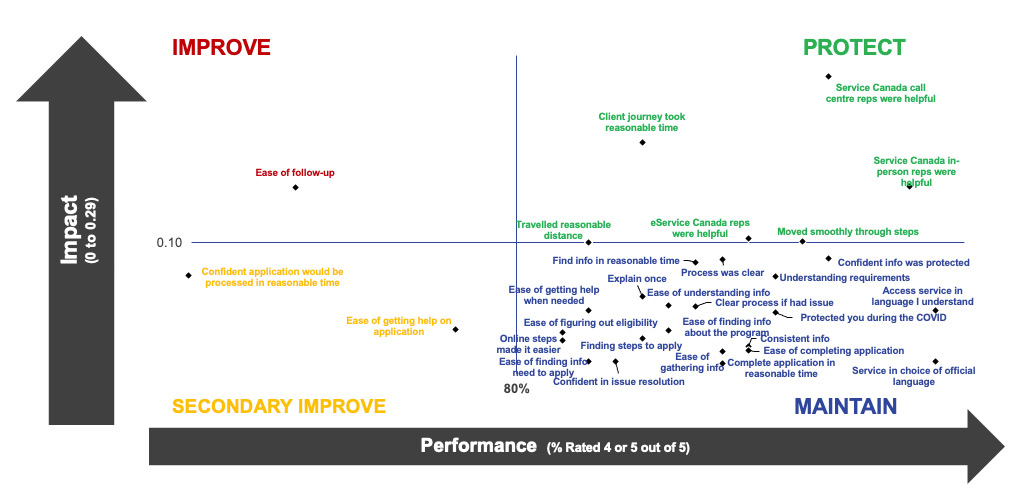
Top satisfaction drivers are attributes that have the strongest impact on overall satisfaction, listed above either as attributes to reinforce/protect or as attributes with the greatest opportunity for improvement.
Ref. Service Canada CX Survey report 2020-21 - Overall Priority Matrix: Impact vs. Performance.
Background and Objectives
The annual Service Canada Client Experience (CX) Survey tracks the impact of service delivery change on clients’ ability to access federal programs, particularly as delivery is increasingly e-enabled over time.
The 2020-21 Client Experience (CX) Survey Project is the fourth wave of the annual survey and the first to be administered with clients since the beginning of the COVID pandemic affected the way services are delivered, since March 2020.
The 2020-2021 CX Survey provides tracking of satisfaction with the client journey among Service Canada clients, tracks take-up of self-service and assisted self-service and assesses the ease, effectiveness and emotion of Service Canada clients by service channel, program and client group.
The Client Experience Measurement Project is conducted in two phases: an initial quantitative survey followed by a qualitative phase of research.
The qualitative phase was used to better understand the service experience among those who a experienced a barrier or expressed dissatisfaction with their overall experience. Due to the timing of the Federal Election (held Sept. 20th 2021), the qualitative phase of research was delayed into Fall 2021.
Methodology
A telephone survey was conducted with a sample of 4,200 Service Canada clients across the six major programs.
Old Age Security (OAS)/ Guaranteed Income Supplement (GIS): (n=845) +/- 3.4 percentage points
Social Insurance Number (SIN): (n=749) +/- 3.6 percentage points
Oversamples were collected with two client groups: those living in remote areas and Indigenous clients.
The interviews were conducted between June 23 and Aug 9, 2021.
Clients who completed a client journey, that received an initial decision, benefit or Social Insurance Number, in January, February or March 2021 were sampled.
The survey sample size has a margin of error of +/-1.5%.
Results were weighted by age, gender, region, program and benefit receipt (approved/denied) using administrative data on clients who completed a client journey from April 2020 to March 2021 (except for CPP where the timeframe was January to March 2021). Program weights were held constant with 2017-18 to allow the results to highlight any change due to the service experience.
Comparisons to 2019-20 results reflect service delivery changes made after October 2019, while comparisons to 2018-19 results reflect changes made after October 2018, and 2017-18 results reflect changes made after June 2017.
A series of 3 qualitative online focus groups were conducted in English (20 participants in total), 24 in-depth interviews in English, and 6 in-depth interviews in French between November 16 and December 3, 2021. All sessions were 90 minutes in length and hosted on Ipsos’ Recollective platform.
The 2020-21 Client Experience Survey Detailed Methodology document is available under separate cover.
Executive Summary: Change in Channel Use
The 2020-21 CX Survey represents the first to have been administered with clients during the pandemic. For the first time, more clients self-served online with no assistance than utilized in-person service, while the proportion using assisted self-service has gradually increased over time.
Overall, clients were considerably less likely to have used in person service compared to previous waves. The proportion of clients who utilized self-service during their client journey doubled and usage of assisted self-service increased marginally.
Self-service online without assistance increased at the apply stage among EI and OAS/GIS clients, while fewer clients in all programs used in person when applying or following-up. EI, CPP and CPP-D also used in person less during the aware stage. EI clients more likely to have used assisted self service during the aware or apply stages and CPP and CPP-D clients mail only when applying.
The largest proportion of clients self-serviced online only (34%) during the client journey, while three in ten used in person service (30%) at some point and around one in ten assisted self service (13%). Fewer used touchless person to person (7%), were auto-enrolled and did not contact Service Canada (4%) or accessed service by mail only (1%).
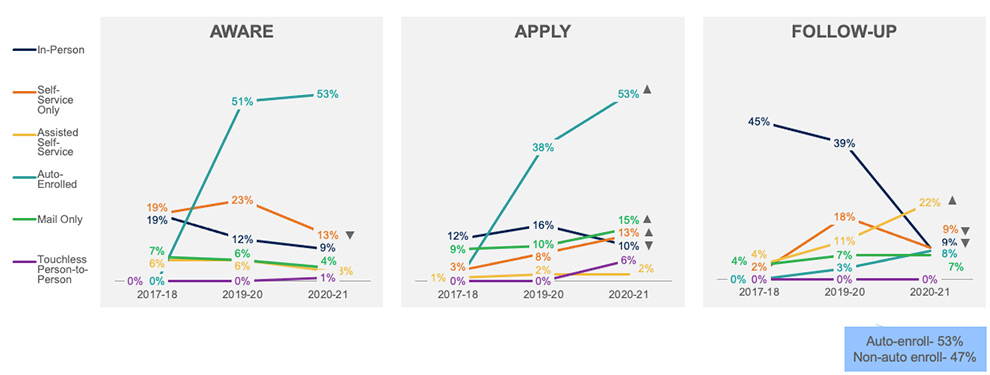
Overall, clients were less likely to use in-person service at any stage during the journey, and were more likely to self serve during the apply or follow-up stages. Use of assisted self-service increased at the aware and apply stages, as did the use of mail only and auto-enroll at the apply stage.
EI clients were more likely to self serve at the apply and follow-up stages and less likely at the aware stage. Use of assisted self service increased at the aware and apply stages, while use of in person service declined at all stages.
CPP clients were more likely to apply using mail only and were less likely to self-serve or use assisted self-service at the aware stage. Like other client groups, use of in-person has declined across all stages.
OAS/GIS clients were more likely to self serve, be auto-enrolled or use mail only at the apply stage. Use of assisted self service increased at the follow up stage, while fewer used in person at the apply or follow up stages and self served during the aware or apply stages.
CPP-D clients were more likely to apply using mail only or assisted self service when applying, while use of in-person has declined across all stages.
Executive Summary: Channel Use By Stage
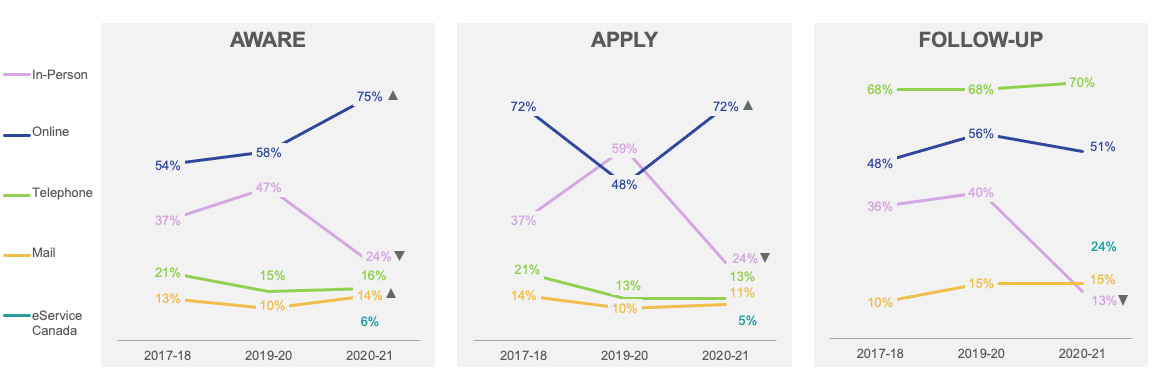
Online is now the most commonly used channel at the aware and apply stage, while telephone remains the preferred channel at the follow-up stage. Use of the in person channel has declined at all stages.
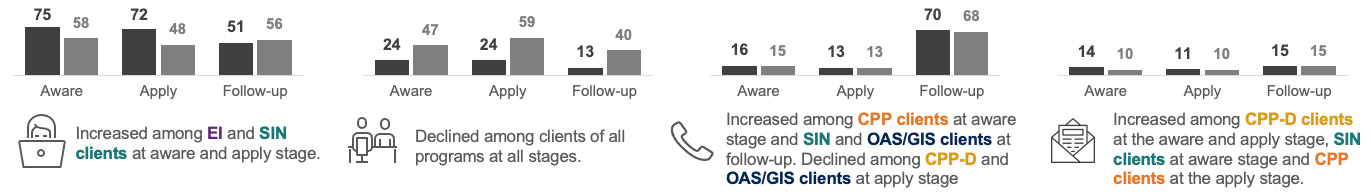
During the aware stage, clients continued to be most likely to use online government sources (75%), followed by in-person service (24%) while around one in ten used either telephone (16%) or mail (14%) and 6% eServiceCanada. Use of in-person has decreased compared to 2019-20, while use of both online and mail have increased.
During the apply stage, clients were most likely to use the online channel (72%), followed by in-person service (24%) while around one in ten used either telephone (13%) or mail (11%) and 5% eServiceCanada. Use of in-person service decreased compared to 2019-20, while online increased.
Among those clients who followed-up, they continued to be most likely to use the telephone channel (70%), followed by online (51%). One quarter (24%) utilized eServiceCanada, while one in ten followed-up by mail (15%), or in-person (13%). Use of in-person services decreased compared to 2019-20 (40% 2019-20 vs. 13% 2020-21).
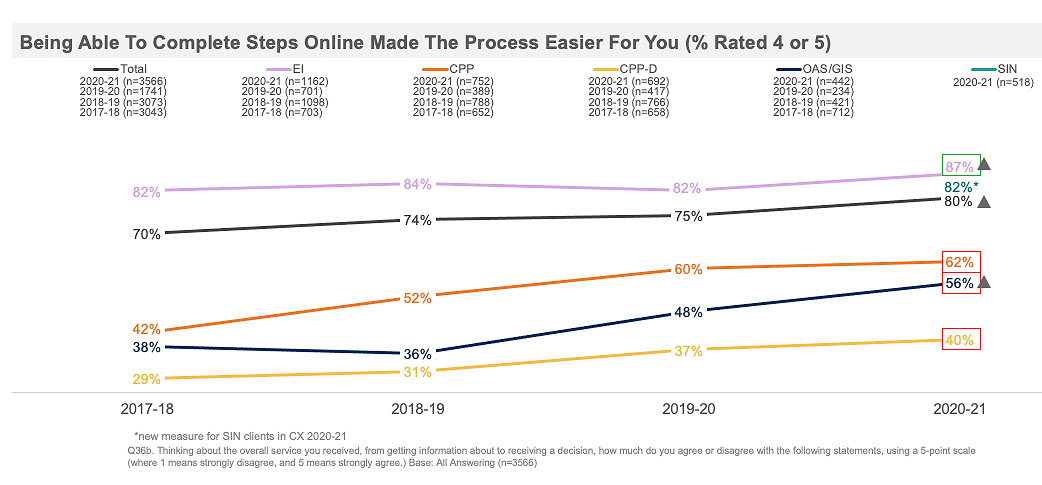
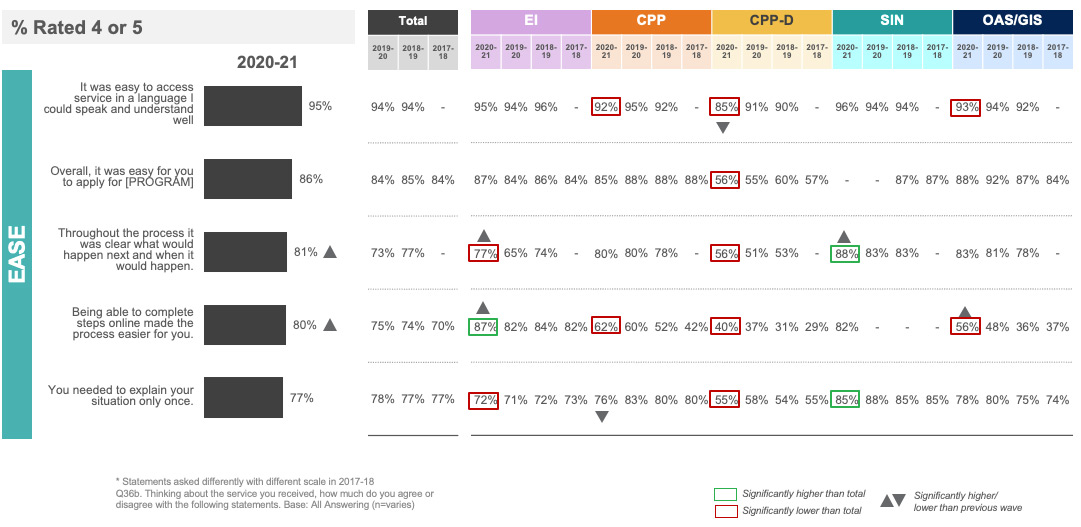
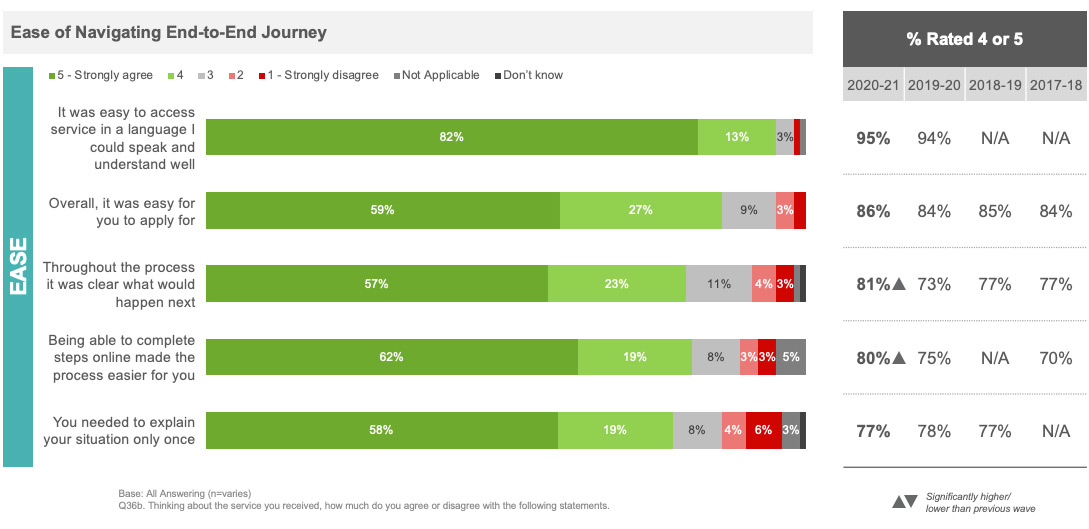
Being able to complete steps online made the process easier for the vast majority of clients and progress was made improving ease of use among EI and OAS/GIS clients.
Compared to three out of four clients (75%) last year, eight in ten clients (80%) agreed that being able to complete steps online made the process easier. EI clients (87%) were more likely to agree compared to all clients while CPP (62%), CPP-D (40%) and OAS/GIS (56%) clients were less likely to agree. Compared to 2019-20, reported ease has increased among EI and OAS/GIS clients.
Executive Summary: Number of Channels and Multi-Channel Use
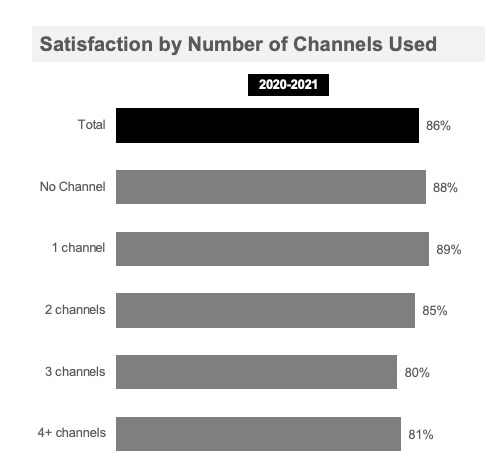
Consistent with previous waves, satisfaction with the service experience declines with the number of channels clients contacted during the service experience and was notably lower among those who had three or more channels used.
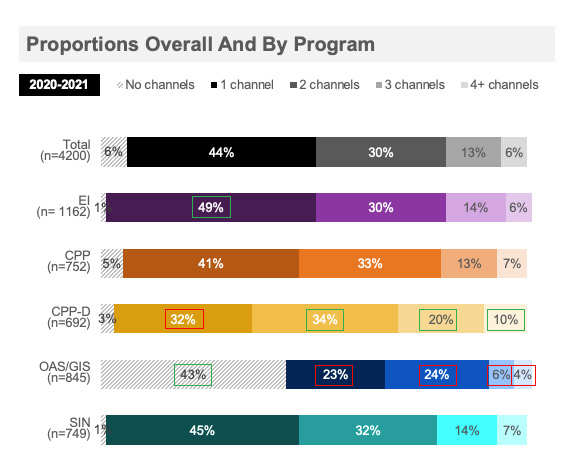
Overall, more than four in ten (44%) clients used one channel during their client journey, followed by three in ten (30%) who used two, around one in ten (13%) who used three and 6% who used 4 or more.
Clients who utilized more channels, in particular 3 or more, had lower overall satisfaction with their service experience than those who used fewer channels.
EI clients were more likely to have used only one channel, while CPP-D were more likely to have two or more channels. OAS/GIS clients were much more likely to have used no channels due to the proportion who were auto-enrolled.
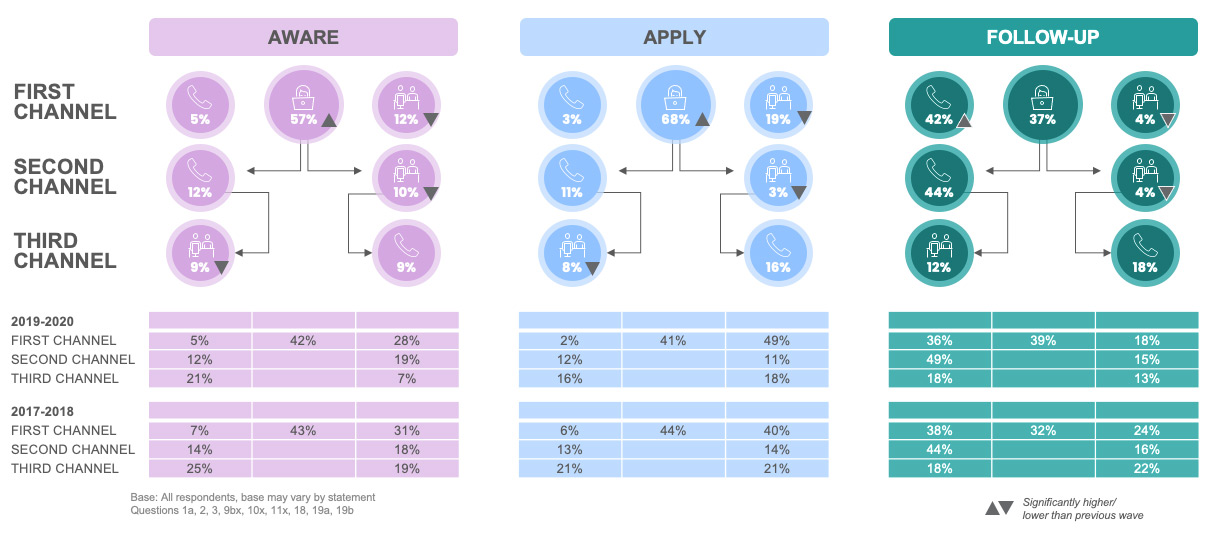
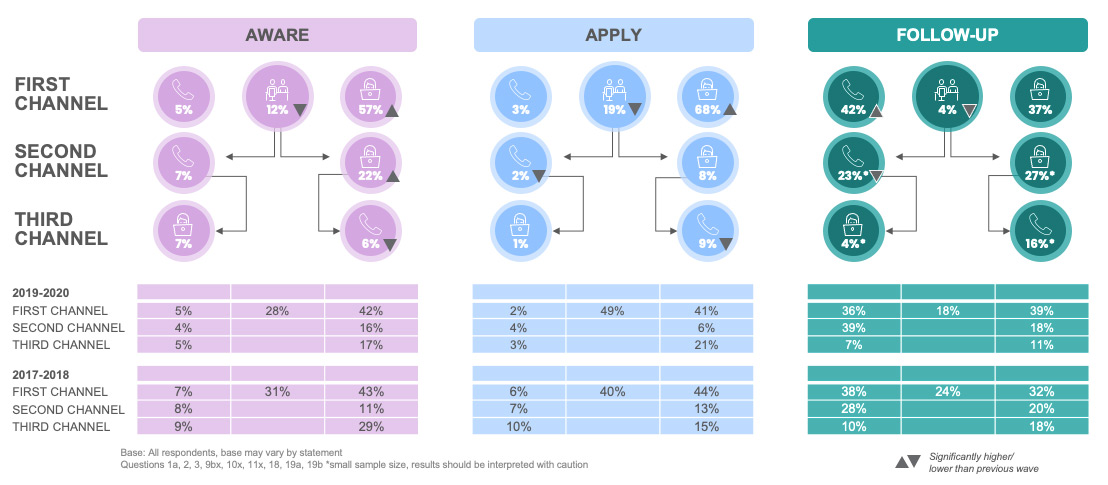
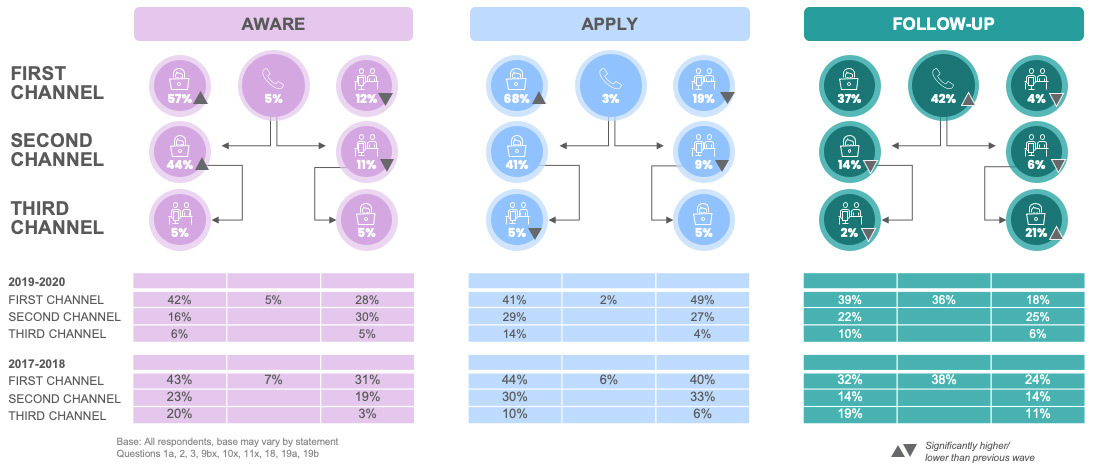
The vast majority of clients continued to use only one channel during each stage of the client journey. Online has become the preferred first point of contact for the majority of clients at both the aware and apply phases while the telephone is the preferred method for following up. Use of in person has declined as the first point of contact for all stages.
Clients who used online or in person first were less likely to use a second channel than those who used the telephone first. Clients were more likely to go online after beginning on the phone at the aware and apply stages but no more likely at the follow up stage.
Compared to 2019-20, more clients chose to use online first at both the aware and apply stage while telephone has become the preferred choice for following-up. In person is no longer the first choice for any stage of the journey.
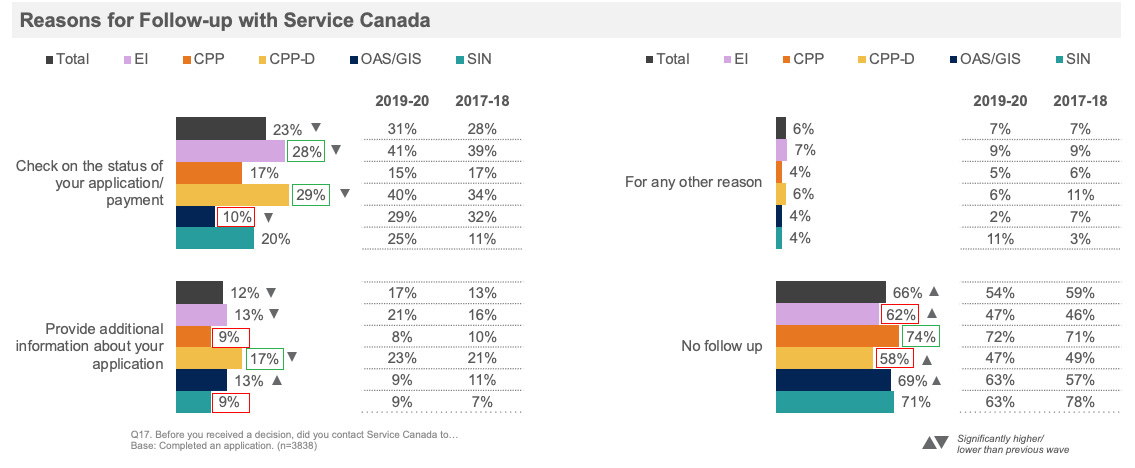
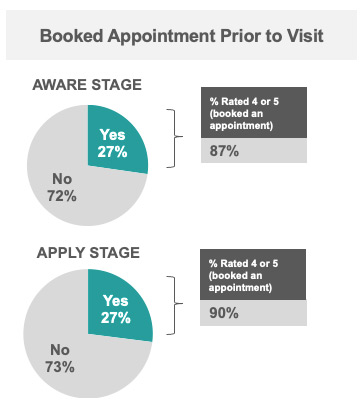
Fewer clients followed up with Service Canada prior to receiving a decision than last year. Among those who did, the primary reason was to check on the status of their application/payment, and, to a lesser extent to provide additional information.
EI or CPP-D clients were more likely to follow-up than clients of other programs, while CPP clients were less likely.
Compared to 2019-20, EI, CPP-D and OAS/GIS clients were less likely to have followed-up.
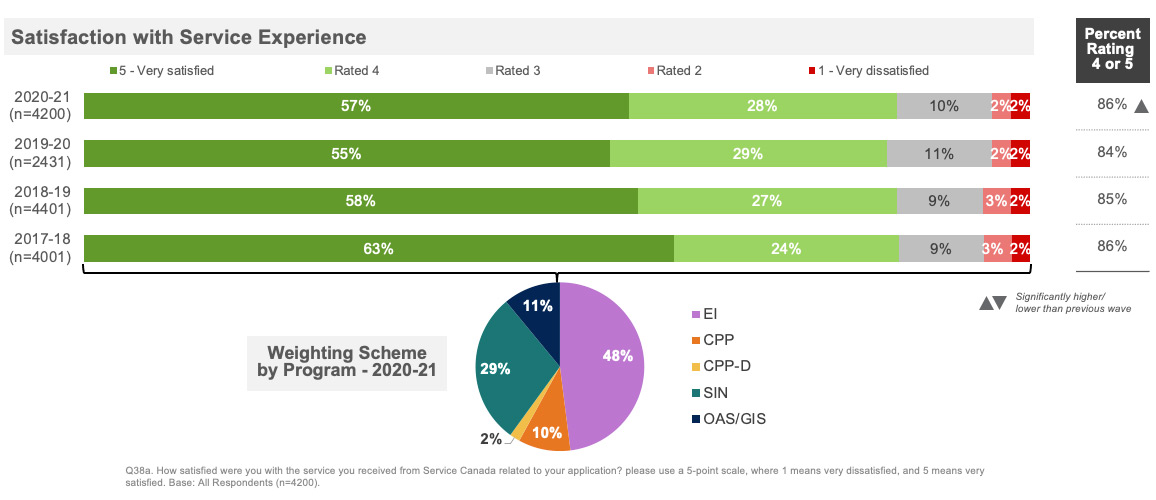
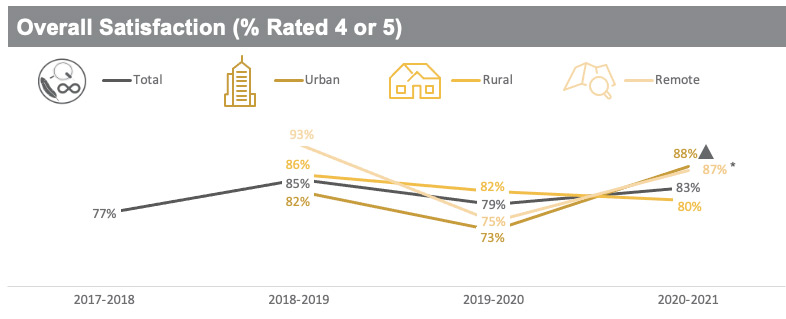
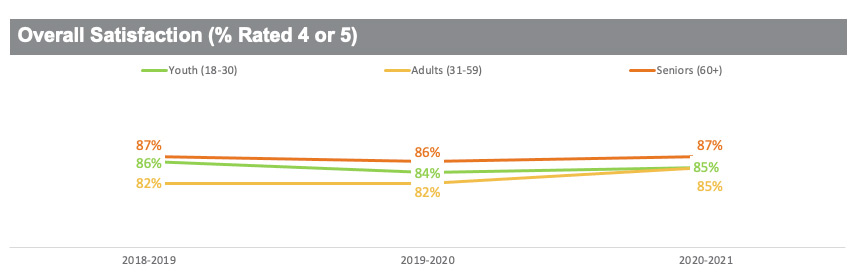
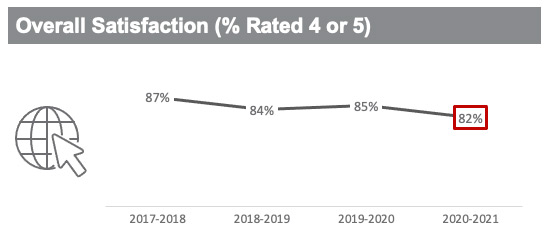
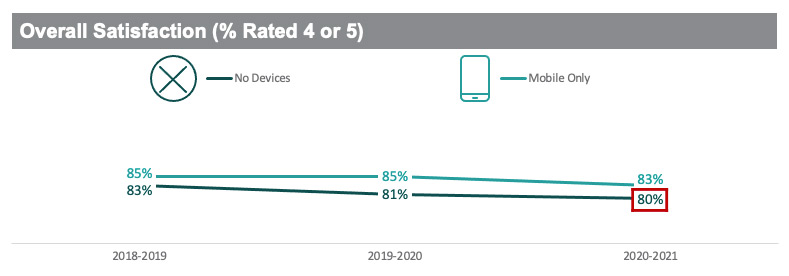
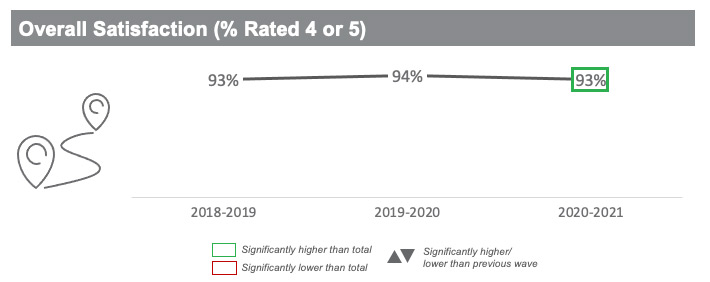
Executive Summary: Overall Satisfaction
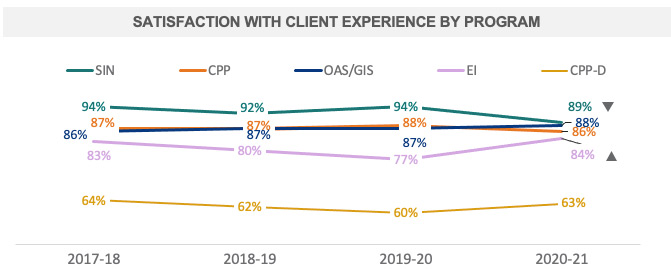
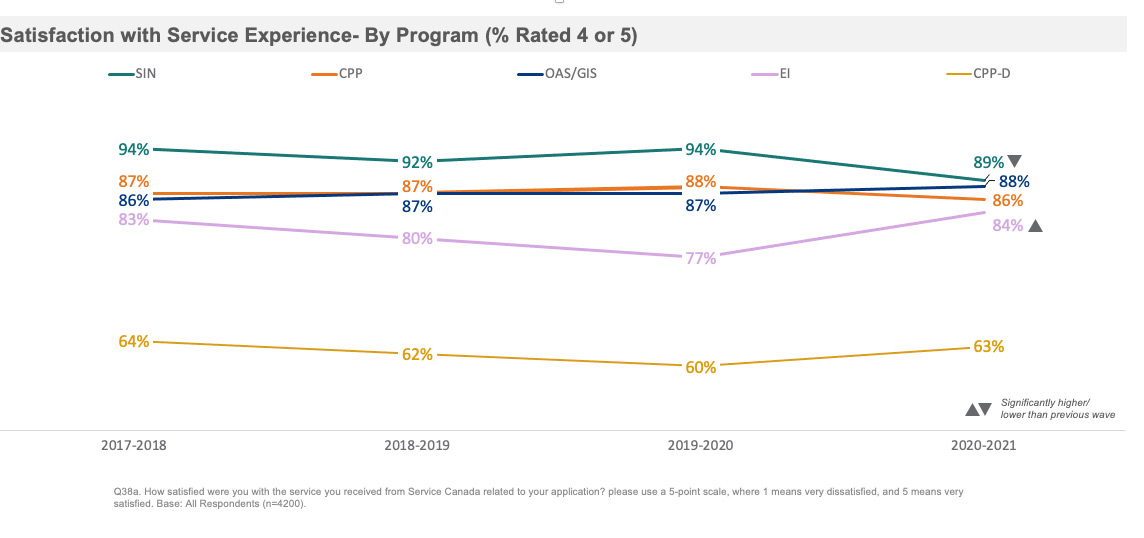
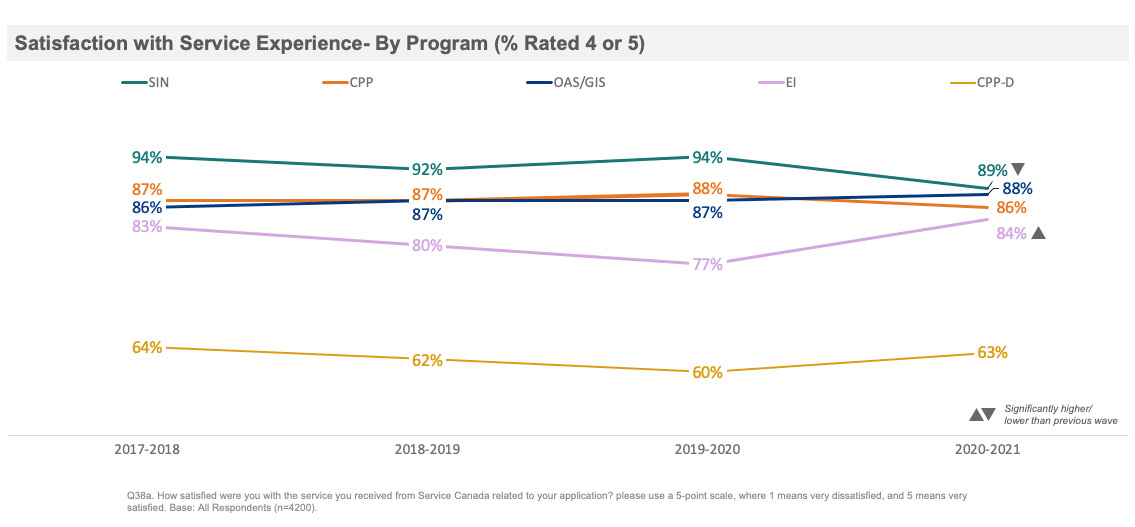
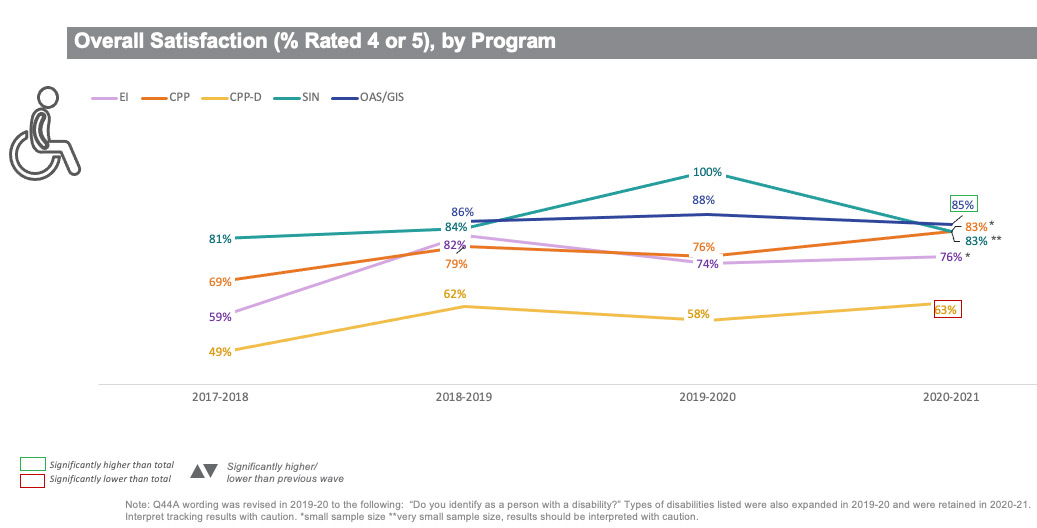
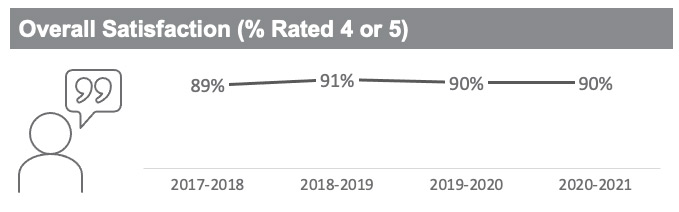
Satisfaction with the overall service experience has increased compared to 2019-20, returning to levels observed in 2017-18. Satisfaction among EI clients increased compared to the previous wave and declined among SIN clients. Satisfaction continues to be lower for CPP-D clients.
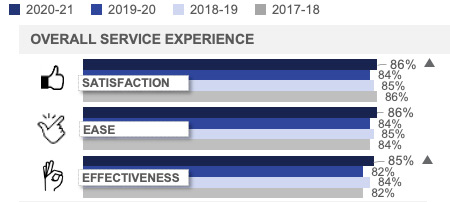
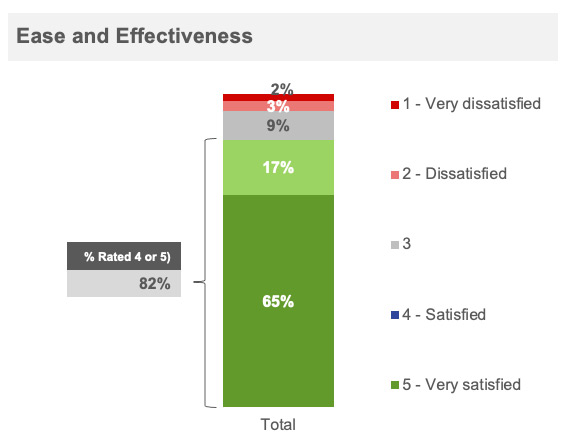
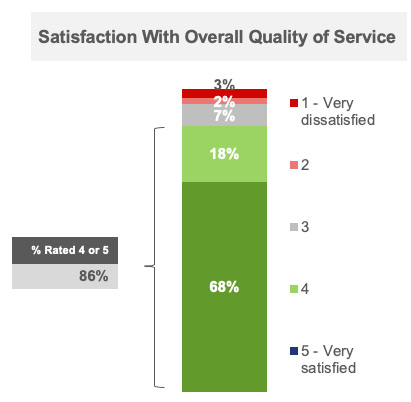
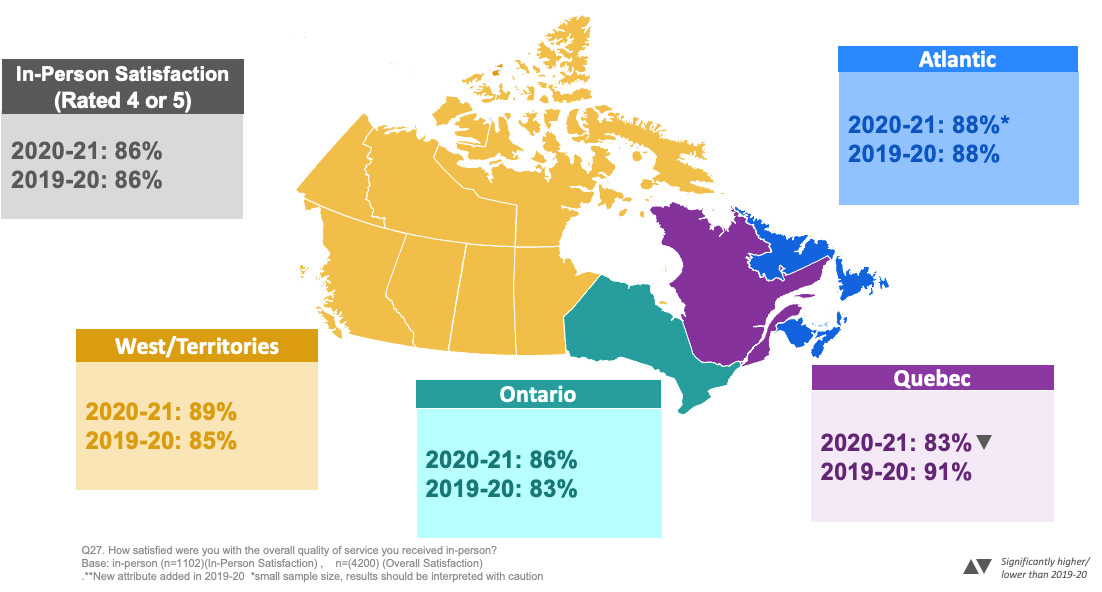
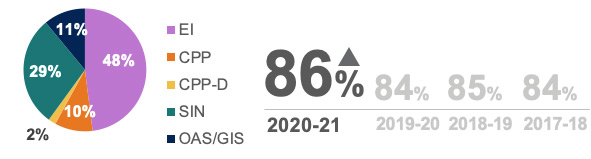
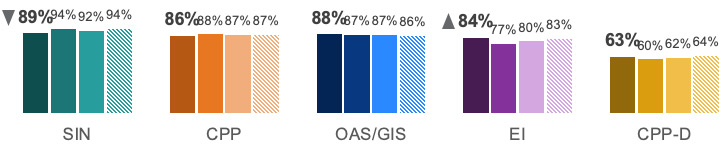
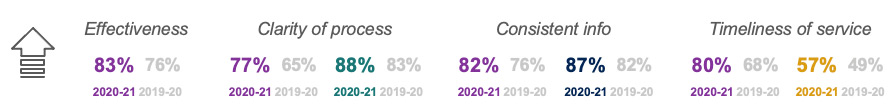
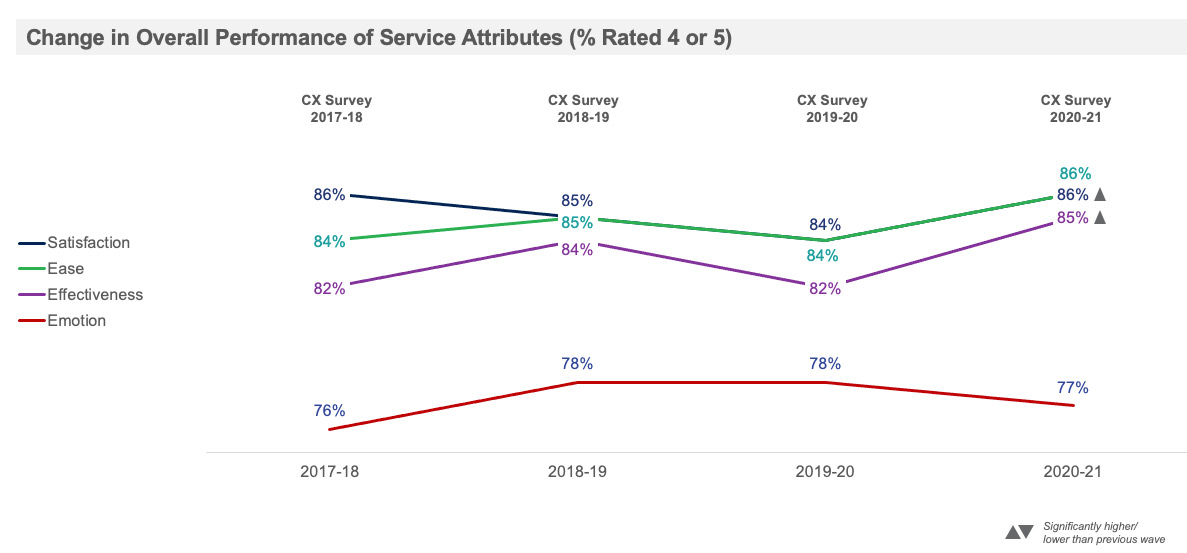
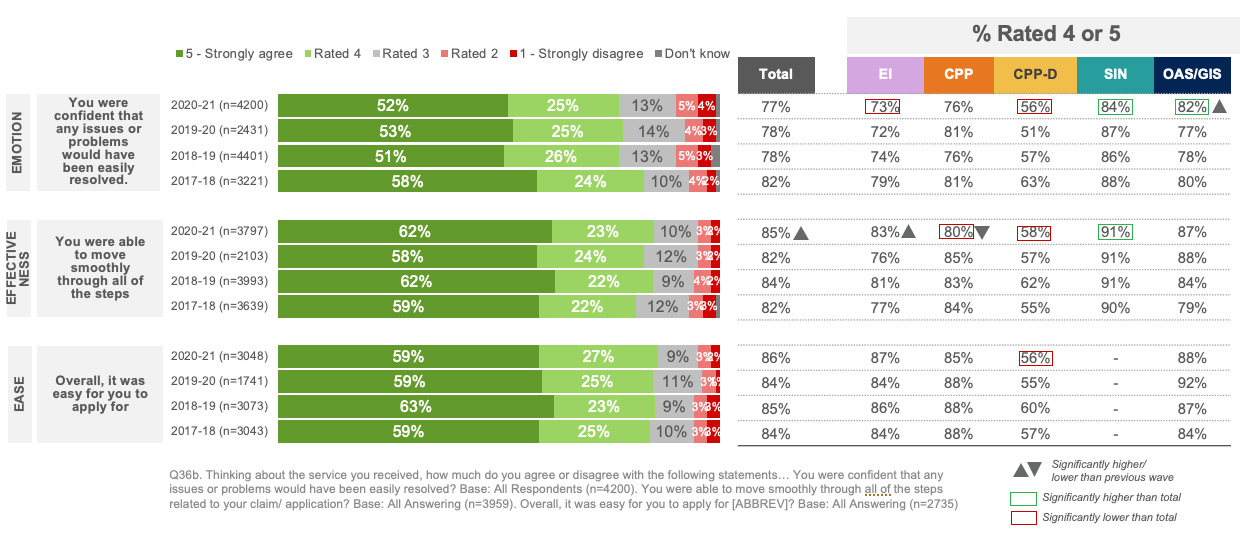
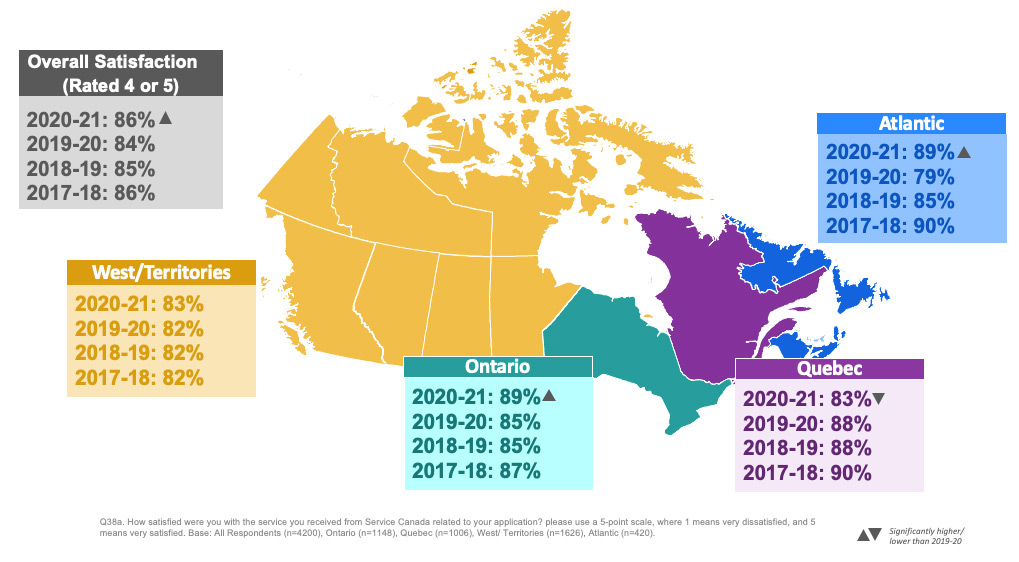
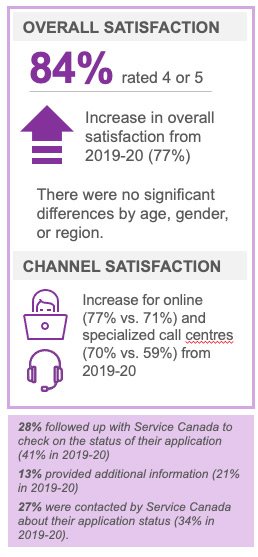
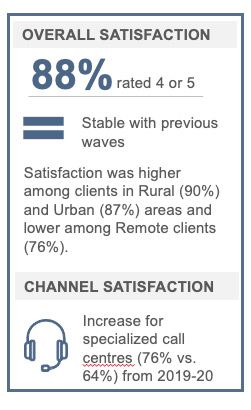
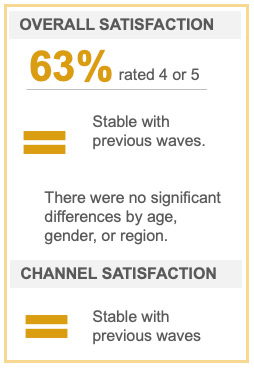
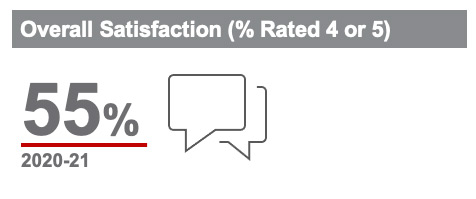
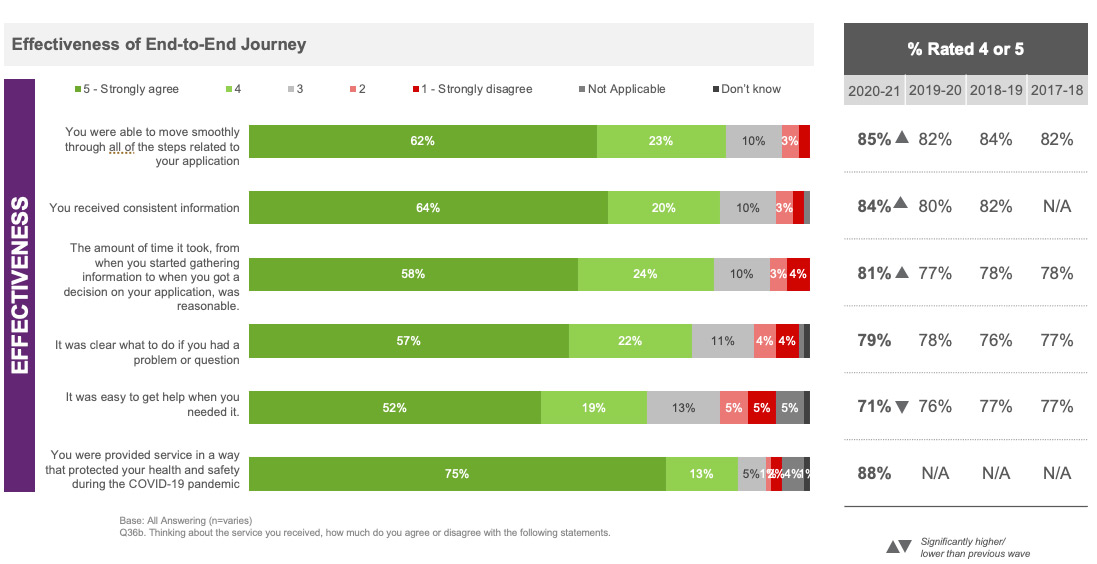
The vast majority of Service Canada’s clientele continue to be satisfied with the service experience (86%) and found it easy (86%) and effective (85%). Compared to 2019-20, satisfaction (86% vs. 84%) and effectiveness (85% vs. 82%) have increased, while ease has remained stable (86% vs. 84%). Satisfaction has returned to levels observed in 2017-18 (86%) and effectiveness has rebounded after declining last year (85% vs. 82% in 2019-20 and 84% in 2018-19).
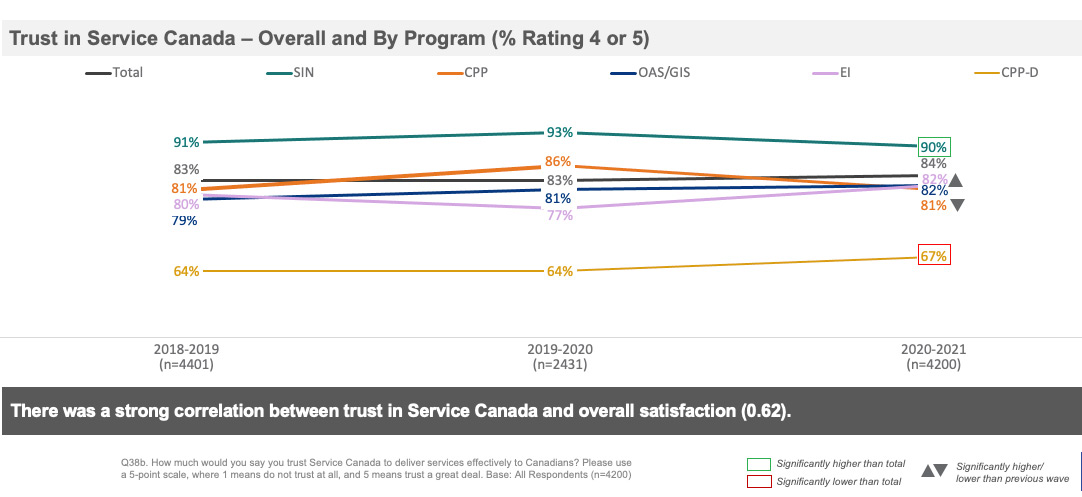
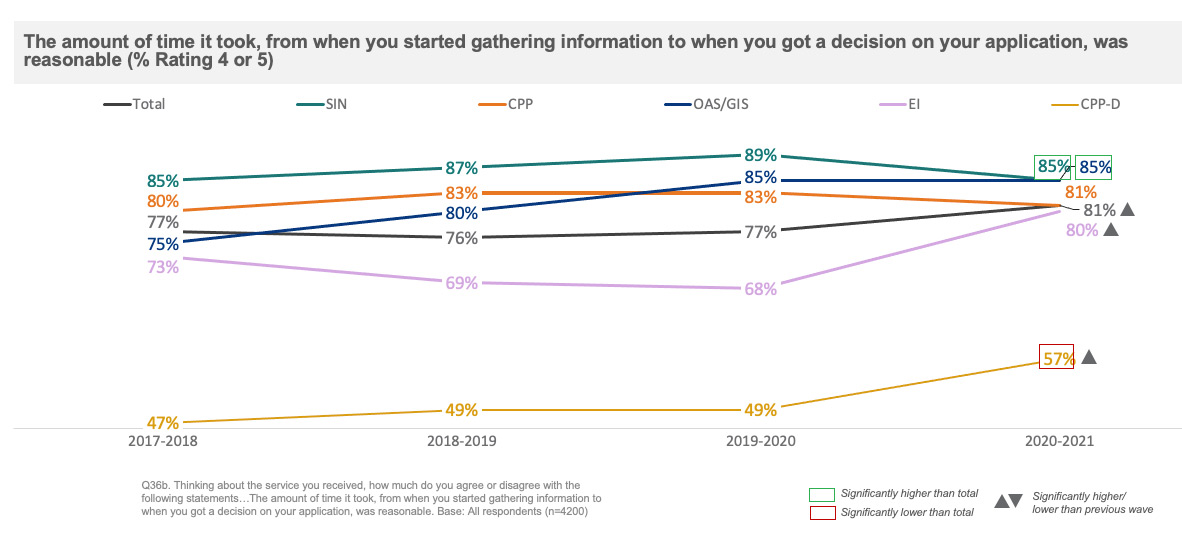
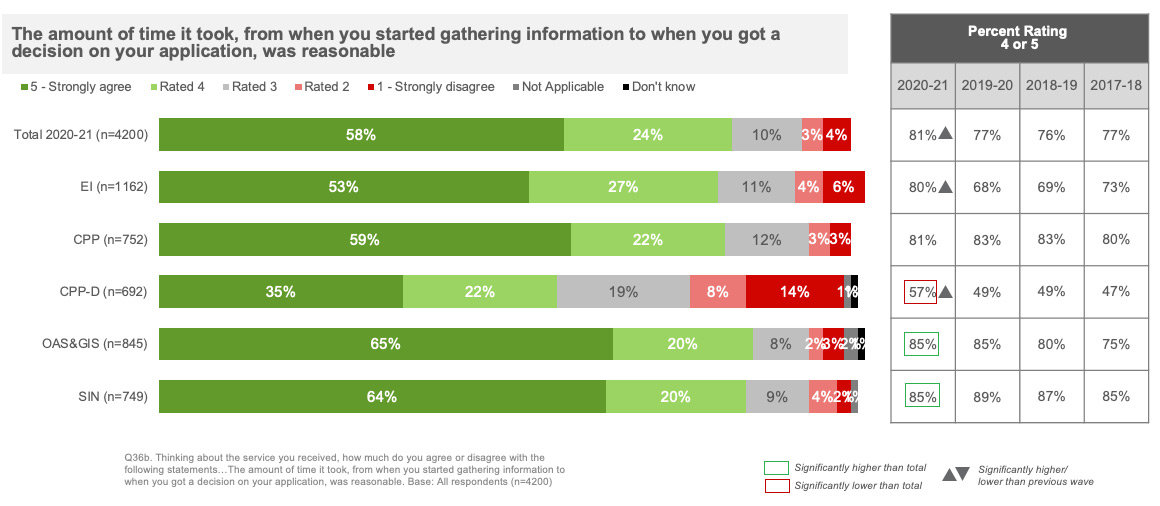
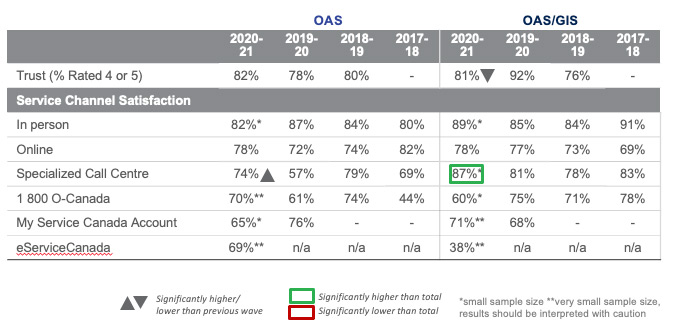
A strong majority of clients expressed a high degree of trust (84%) in Service Canada to deliver services effectively to Canadians, had confidence in the issue resolution process (77%) and felt the timeliness of service was reasonable (81%). Year over year, ratings for the timeliness of service have improved (81% vs. 77% in 2019-20).
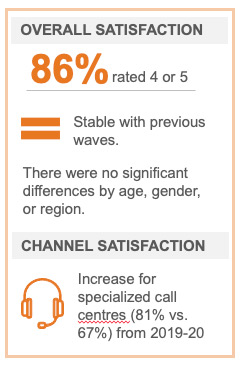
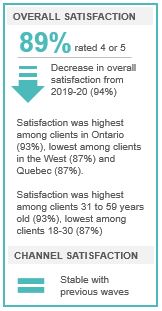
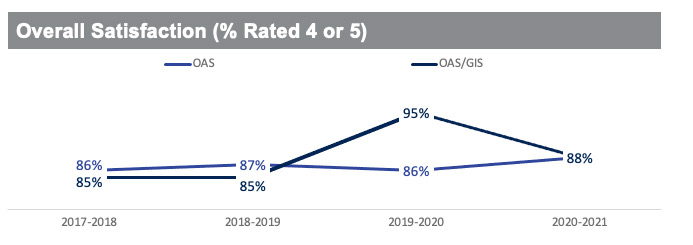
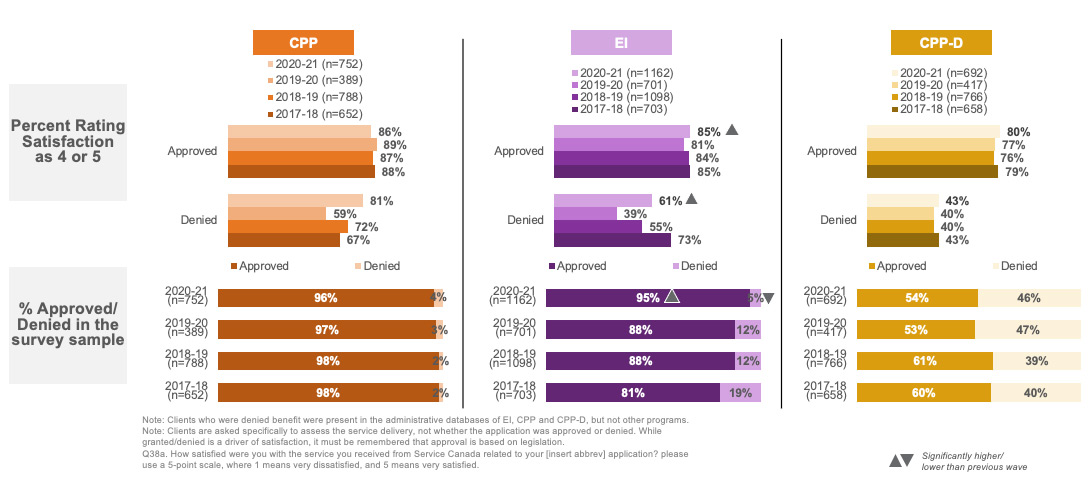
Nine in ten (89%) SIN clients expressed satisfaction with the service experience, the highest of any program but lower than in 2019-20 (94%). Nearly nine in ten OAS/GAS clients (88%) were satisfied, followed by CPP (86%) and EI clients (84%), while closer to six in ten CPP-D clients (63%) were satisfied, lower than other programs. EI clients were more satisfied than they were in 2019-20 (77%).
SIN clients were more likely to express trust (90%), to have found the process effective (91%), to have had confidence in issue resolution (84%) and to have rated the timeliness of service as reasonable (85%), while OAS/GIS clients were more likely to have had confidence in issue resolution (82%) and to have rated the timeliness of service as reasonable (85%).
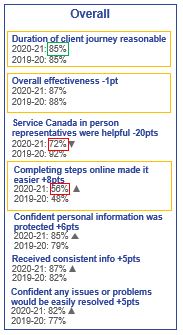
CPP-D clients were less likely to express trust (67%), to have found the process effective (58%), that it easy to apply (56%), to have confidence in issue resolution (56%) or to have to have rated the timeliness of service as reasonable (57%). EI clients were less likely to have confidence in issue resolution (73%), while CPP clients were less likely to have found the process effective (80%).
Compared to 2019-20, EI clients were more likely to express trust (82% vs. 77%), to have found the process effective (83% vs. 76%), and to have rated the timeliness of service as reasonable (80% vs. 68%). OAS/GIS clients were more likely to have had confidence in the issue resolution (82% vs. 77%), while CPP-D clients were more likely to agree that the timeliness of service was reasonable (57% vs. 49%). CPP clients were less likely to express trust (81% vs. 86%) and to have confidence in issue resolution (80% vs. 85%).
Overall satisfaction was consistent between those clients who had applied for CERB (85%) and those who did not (84%) and there was very little variation in performance across specific service attributes. These findings are consistent across all programs.
Executive Summary: Service Attribute Performance
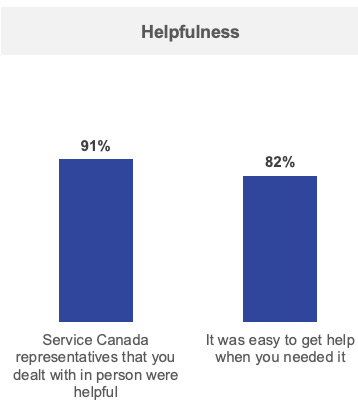
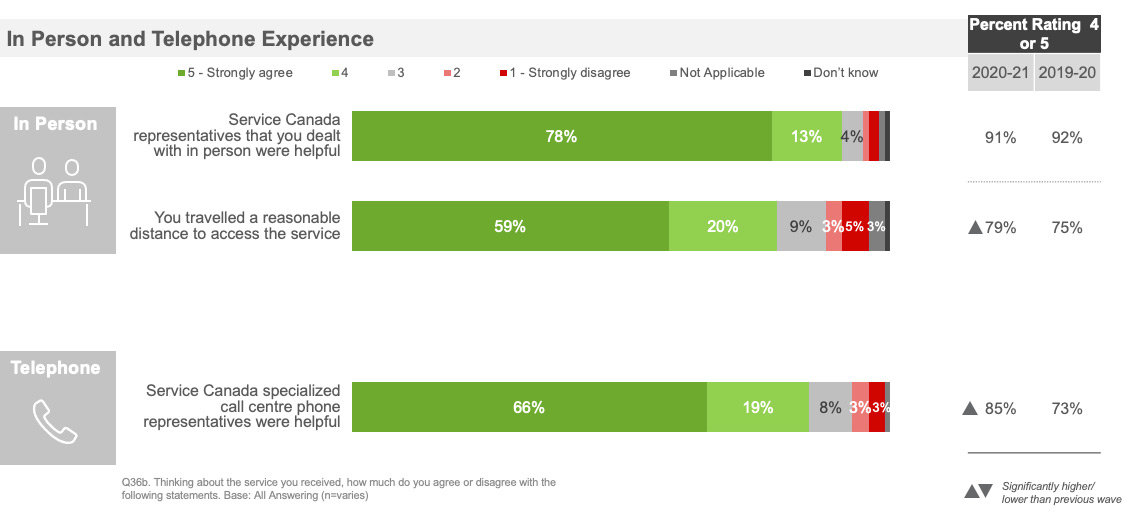
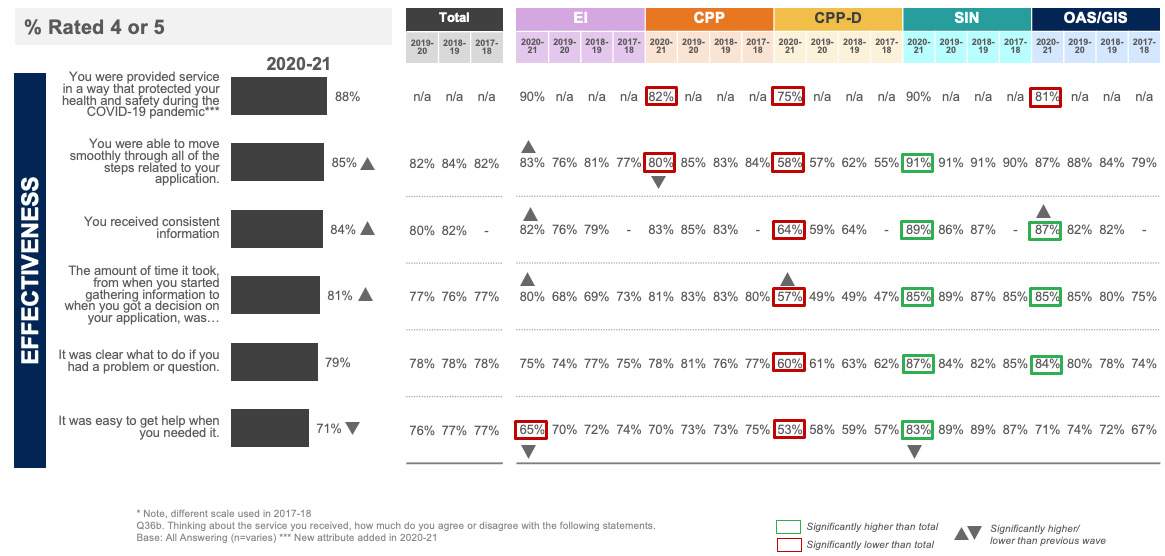
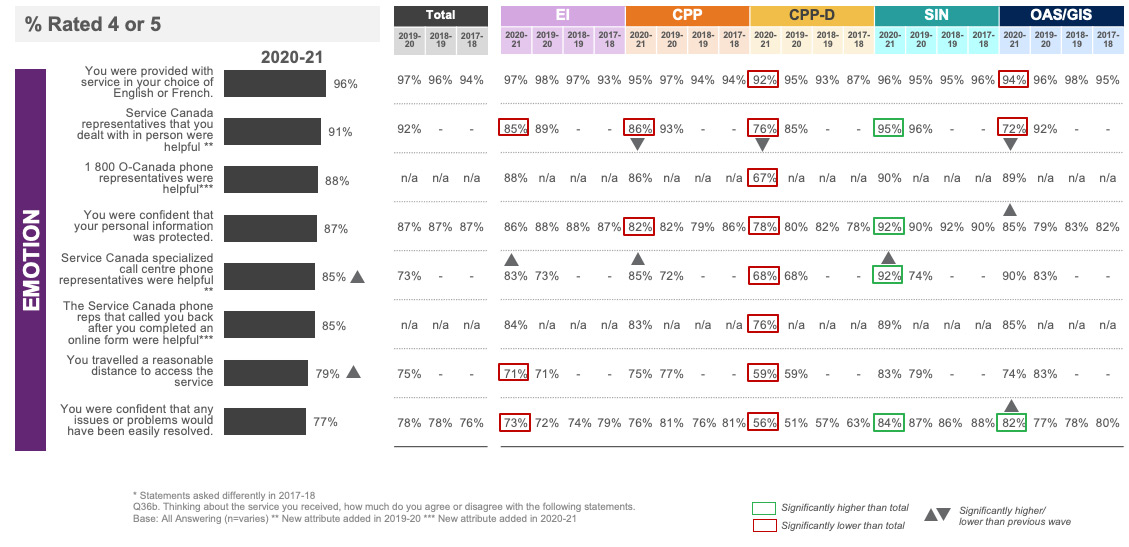
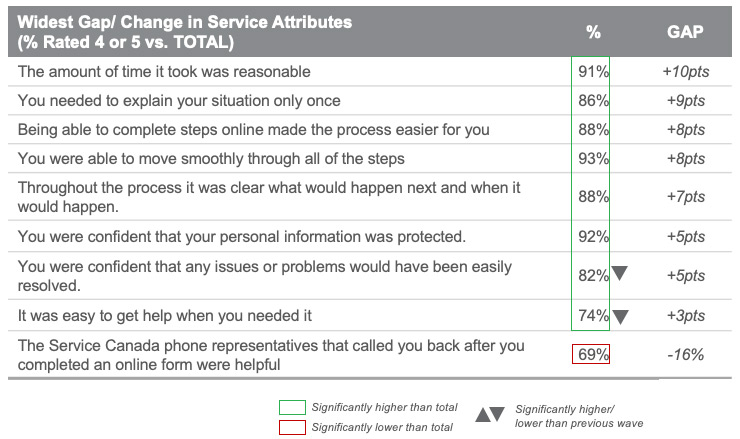
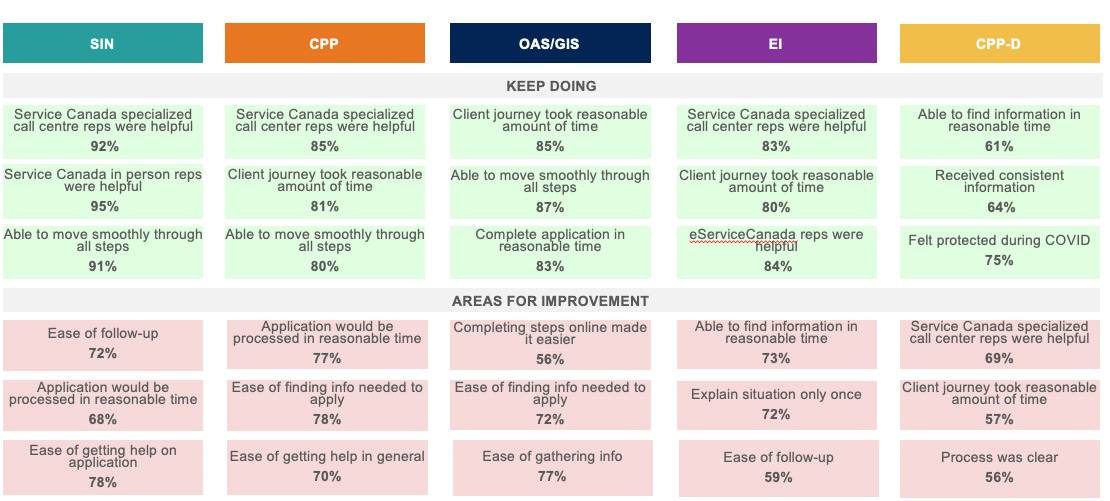
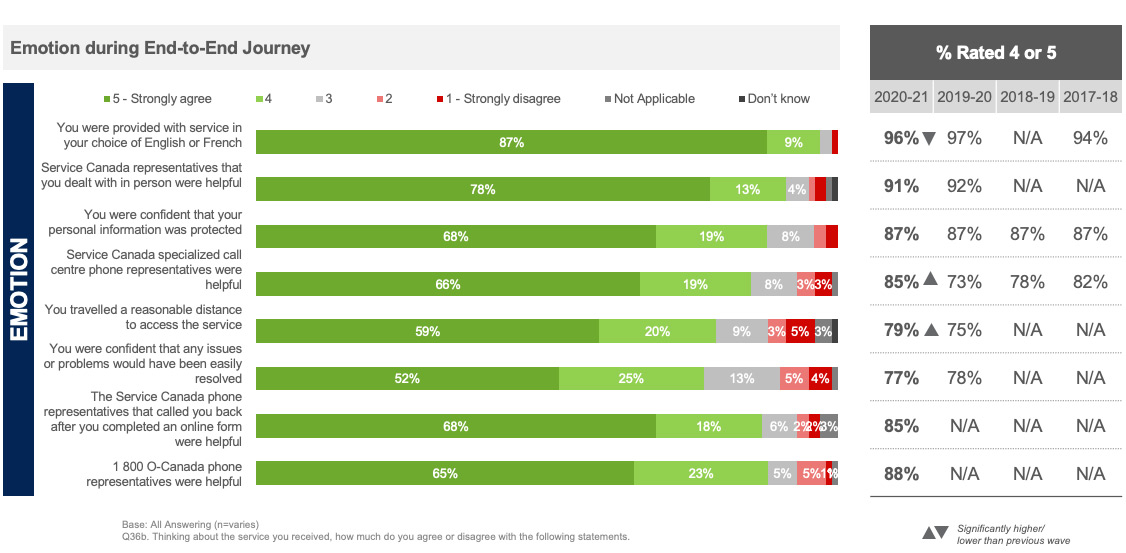
Service Canada clients provided the highest ratings for the helpfulness of staff (in person, 1 800 O-Canada, specialized call centre and eServiceCanada), confidence in information security, the process being easy and effective.
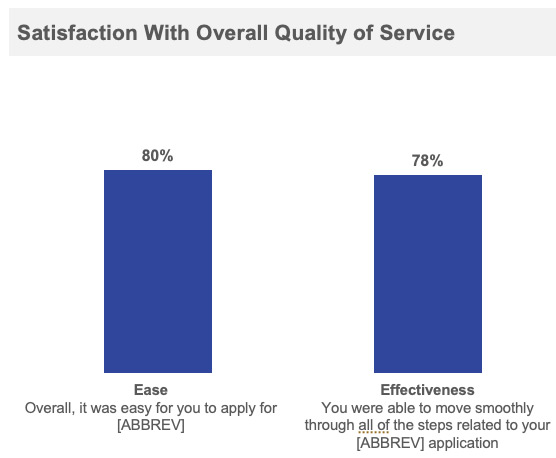
The vast majority found Service Canada staff helpful including in-person (91%), 1 800 O-Canada (88%), specialized call centres (85%) and eServiceCanada (85%), were confident their personal information was protected (87%), found it easy to apply (86%) and were able to move smoothly through all steps (85%).
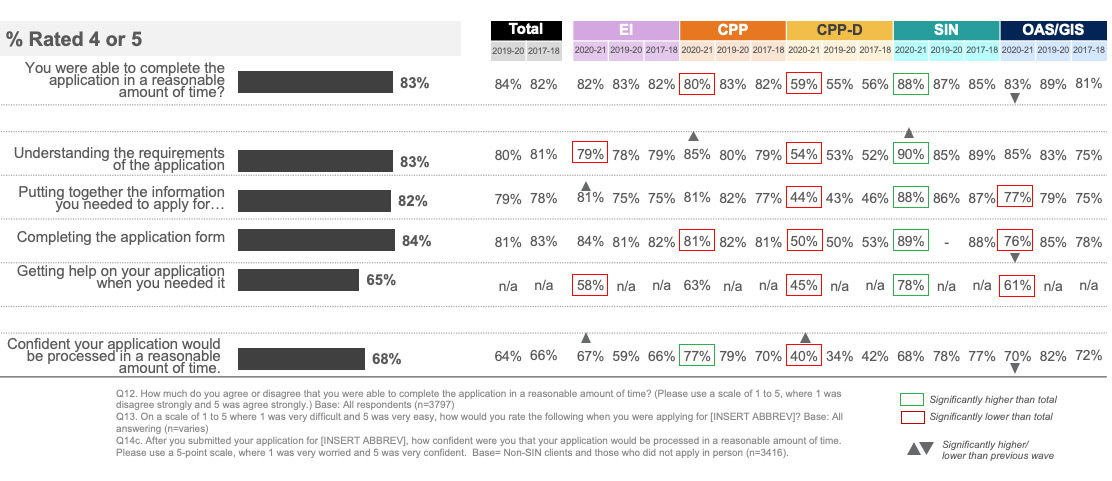
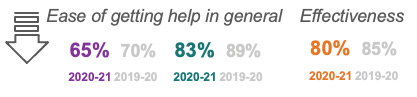
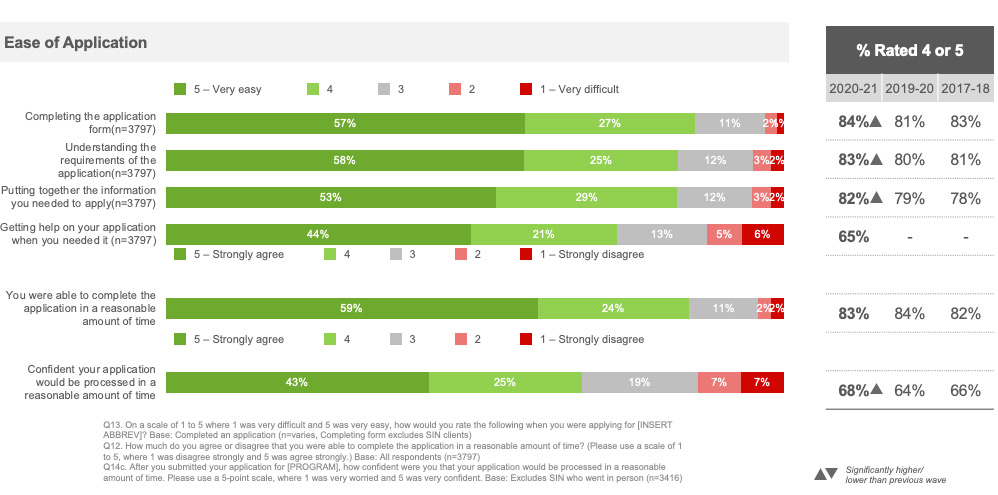
Service attributes with lower ratings were ease of follow-up, ease of getting help on the application when needed, confidence the application would be processed in a reasonable amount of time and ease of getting help in general.
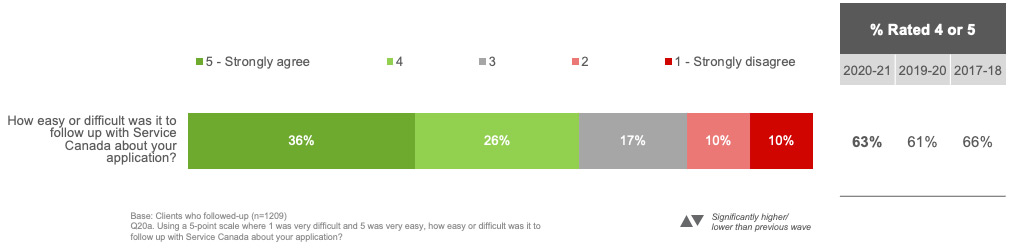
Fewer than three quarters provided high ratings for the ease of following-up on their application (63%), confidence the application would be processed in a reasonable amount of time (68%), ease of getting help on the application when needed (65%) and ease of getting help in general (71%).
The helpfulness of Service Canada staff and protection of personal information were rated consistently high across all programs, while ease of follow-up was consistently rated low.
The helpfulness of Service Canada staff whether in-person, 1 800 O-Canada, specialized call centre or eServiceCanada and confidence their personal information was protected were consistently the highest rated areas. Ease of follow-up was consistently the lowest rated area.
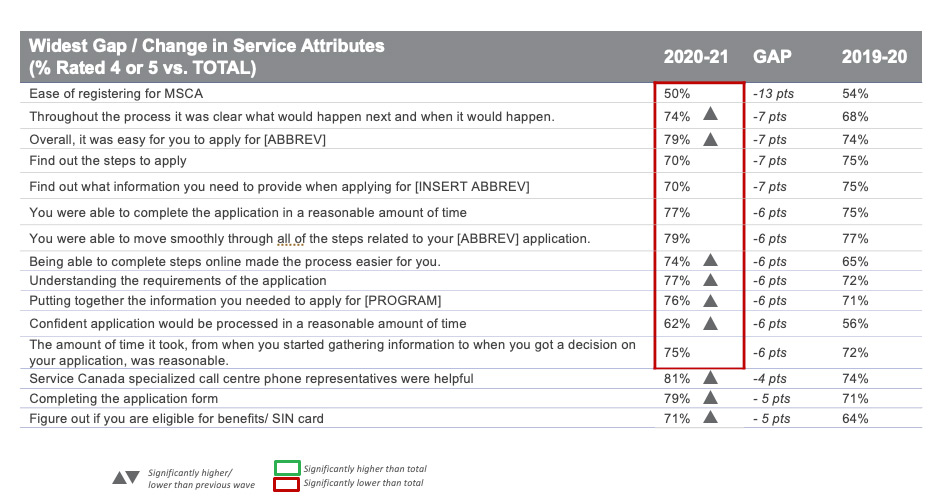
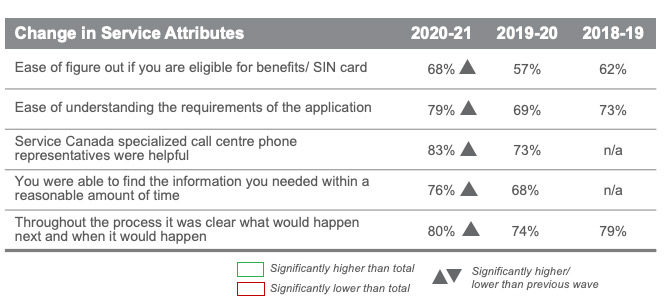
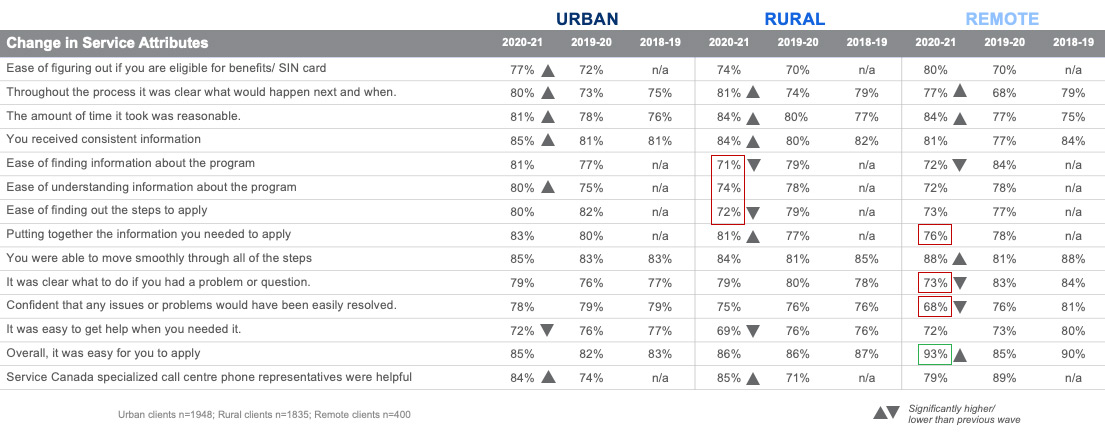
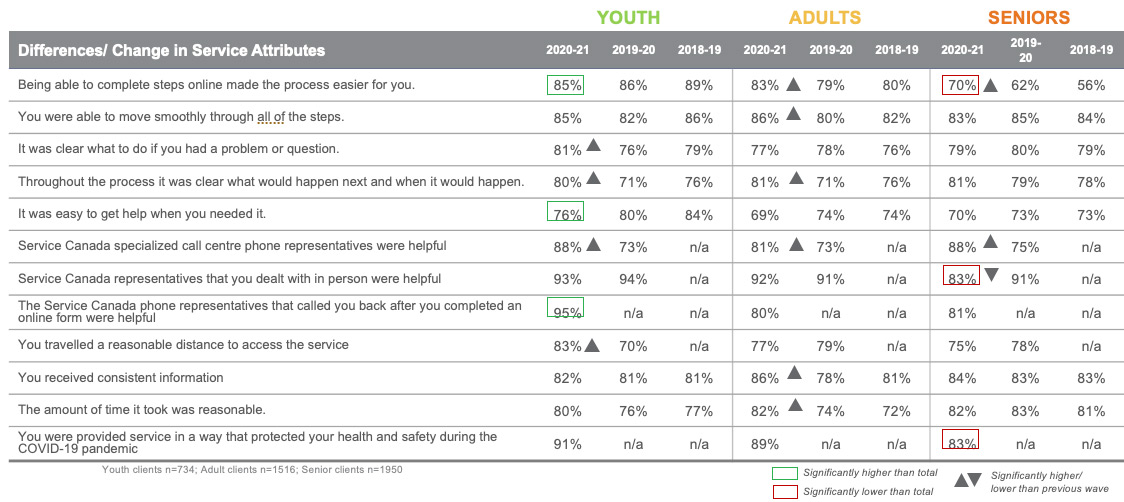
There have been a number of positive shifts for service attributes related to ease, effectiveness and emotion year over year.
Clients were more likely to agree that it was clear through the process what would happen next and when, that they were able to move smoothly through all steps, received consistent information, timeliness of service was reasonable, Service Canada call centre staff were helpful and that they travelled a reasonable distance to access service (in person), ease of figuring out if you are eligible for benefits, .
There was a notable decline in the ease of getting help in general and ease of finding out the steps to apply.
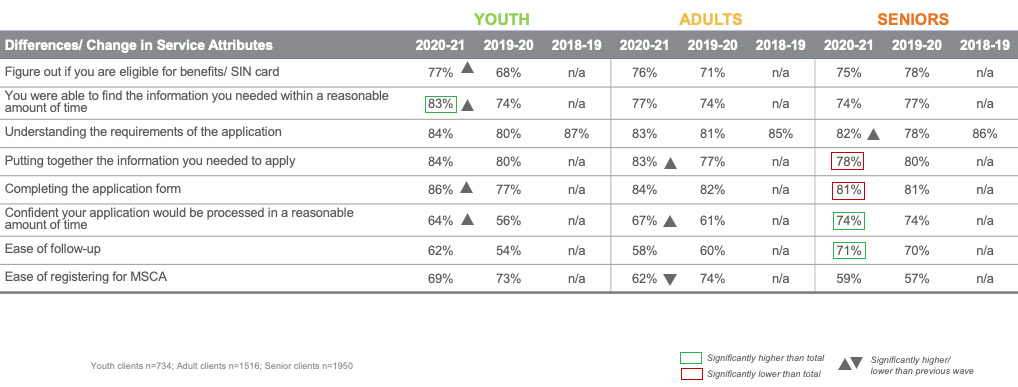
Executive Summary: Service Attribute Performance By Program
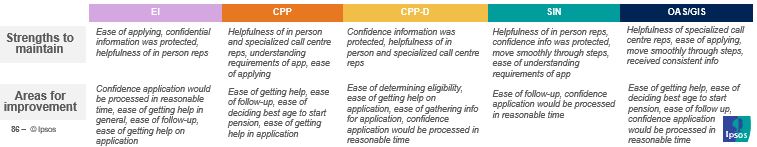
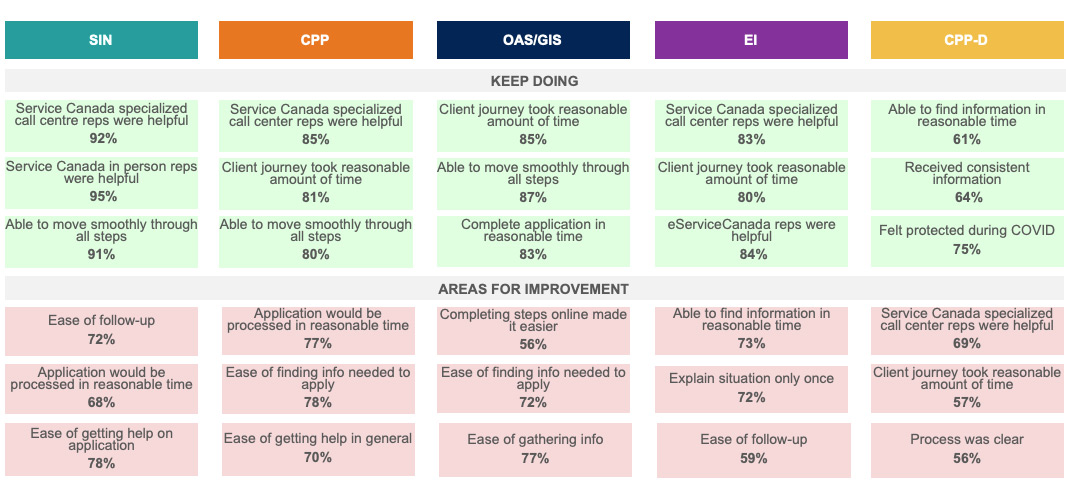
SIN clients continue to provide the highest ratings across all service attributes except for confidence their application would be processed in a reasonable time.
The vast majority of SIN clients provided positive ratings for all service attributes and found the service experience easy and effective; Service Canada staff helpful and the timeliness of service reasonable. Lower scoring areas include confidence their application would be processed in a reasonable time and ease of follow-up.
EI, CPP and OAS/GIS clients provided similar ratings across several service attributes and strong majorities rate most areas highly. OAS/GIS clients were more likely to provide higher ratings for aspects of effectiveness, while EI clients provided lower ratings for aspects of ease and confidence.
The consistently strongest performing areas included the ease of applying and helpfulness of 1800 O-Canada staff.
EI clients also performed more strongly for confidence their personal information was protected and helpfulness of Service Canada in person staff.
CPP clients also performed more strongly for and helpfulness of Service Canada in person and specialized call centre staff.
OAS/GIS clients also performed more strongly for overall effectiveness, receiving consistent information and helpfulness of Service Canada specialized call centre staff.
Key Findings: Service Attribute Performance By Program
The consistently lowest rated areas were the ease of getting assistance when needed, ease of getting help on their application and ease of follow-up.
EI and OAS/GIS clients also provided lower ratings for confidence their application would be processed in a reasonable time and travelling a reasonable distance to access service (in person).
CPP and OAS/GIS client also experienced more difficult deciding the best age to start their pension, while OAS/GIS clients also provided lower ratings for the helpfulness of specialized call centre staff.
Consistent with previous years, CPP-D clients continued to experience the most difficulty during the service experience.
CPP-D clients provided considerably poorer ratings across nearly all service attributes. Lowest rated service attributes included the ease of gathering the information needed to apply, getting assistance on the application when needed, ease of figuring out eligibility and confidence the application would be processed in a reasonable time.
The CPP-D service experience was rated highest for confidence in protection of personal information and helpfulness of Service Canada in-person and eServiceCanada staff.
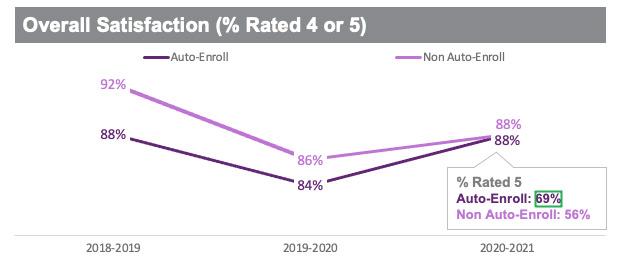
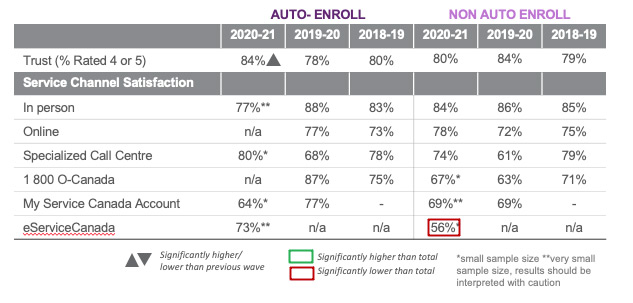
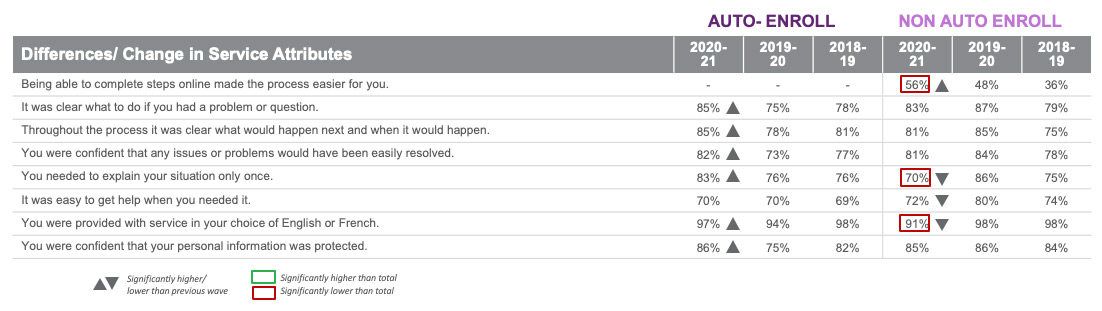
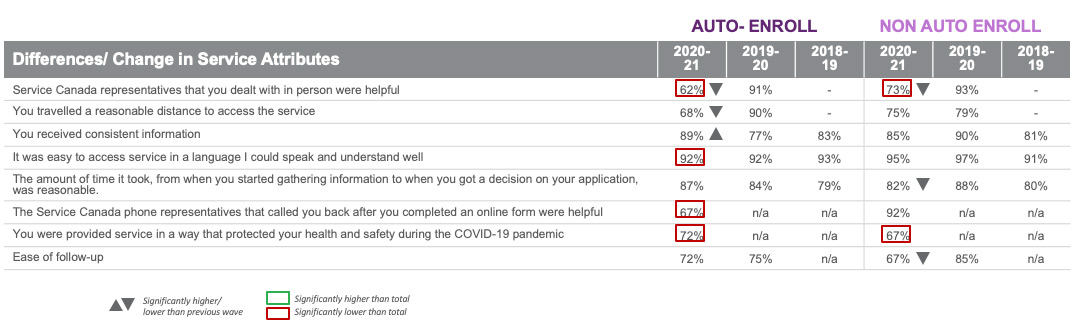
For the OAS and GIS programs, overall satisfaction among Auto-Enroll and Non Auto-Enroll clients was consistent compared to all clients. However, Auto-Enroll clients were more likely to have been completely satisfied due to increases across a number of service attributes.
Compared to 2019-20, Auto-Enroll clients were more likely to express trust in Service Canada and provided higher ratings for several measures related to ease, effectiveness and confidence, while Non Auto-Enroll clients were less satisfied with the timeliness of service and provided lower ratings for aspects of ease and confidence.
Similar trends were observed when comparing clients receiving both OAS and GIS and those receiving only OAS. While overall satisfaction is consistent between clients receiving both OAS and GIS and those receiving only OAS, there were increases across a number of service attributes. OAS/GIS clients were predominantly non auto-enrolled while the majority of OAS clients were auto-enrolled.
Key Findings: Change in Service Experience By Program
EI clients were more satisfied with a number of aspects of service year over year.
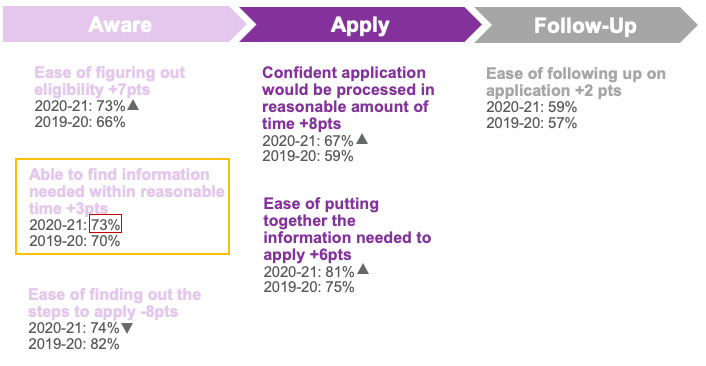
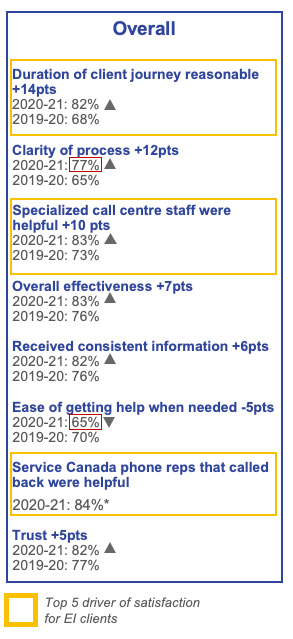
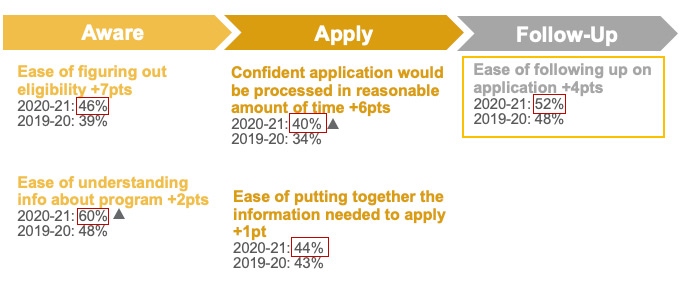
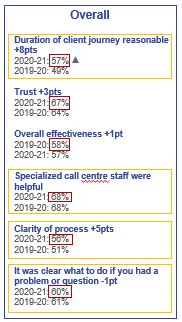
Compared to 2019-20, EI clients were more likely to express trust (82% vs. 77%) and to be satisfied with the effectiveness (83% vs. 76%), the timeliness of service (80% vs. 68%), receiving consistent information (82% vs. 76%), clarity of process (77% vs. 65%), helpfulness of specialized call centre staff (83% vs. 73%), being able to complete steps online made it easer (87% vs. 82%), ease of figuring out if you’re eligible for benefits (73% vs. 66%), ease of putting together the information needed to apply (81% vs. 75%) and confidence application would be processed in reasonable amount of time (67% vs. 59%).
EI clients were less satisfied with the ease of getting help in general (65% vs. 70%) and the ease of finding out the steps to apply (74% vs. 82%).
CPP clients expressed lower trust in Service Canada and rated aspects of ease and effectiveness lower than previous years.
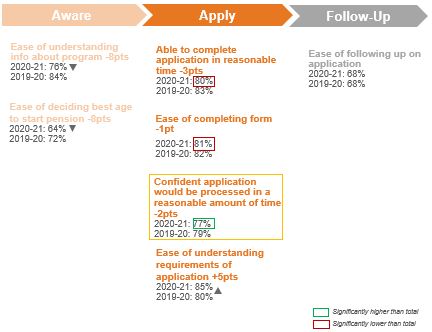
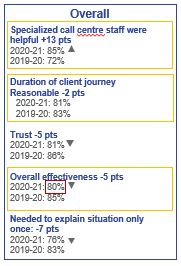
Compared to 2018-19, CPP clients were less likely to express trust (81% vs. 86%) and to be satisfied with the effectiveness (80% vs. 85%), ease of understanding info about program (76% vs. 84%), ease of deciding the best age to start your pension (65% vs. 72%), needing to explain your situation only once (76% vs. 83%) and confidence any issues or problems would be easily resolved (76% vs. 81%).
CPP clients were more likely to be satisfied with the helpful of specialized call centre staff (85% vs. 72%) and the ease of understanding requirements of the application (85% vs. 80%).
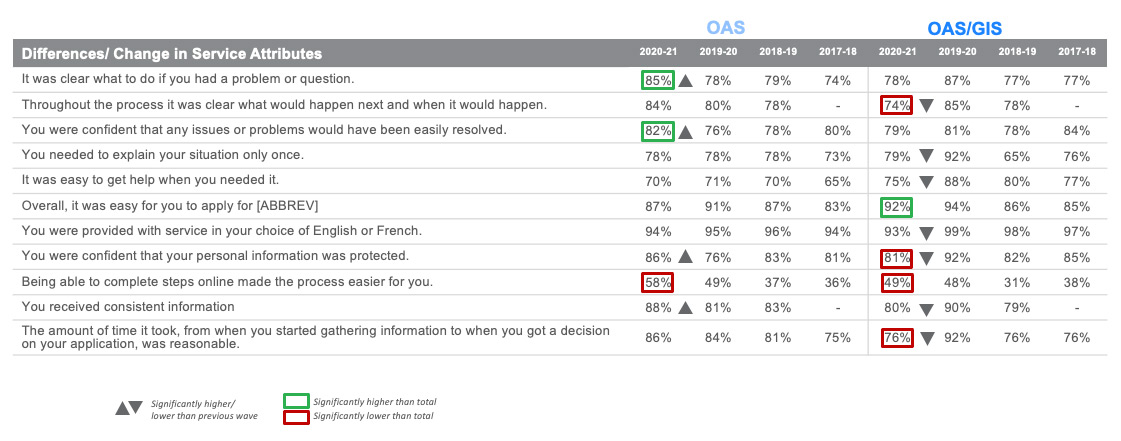
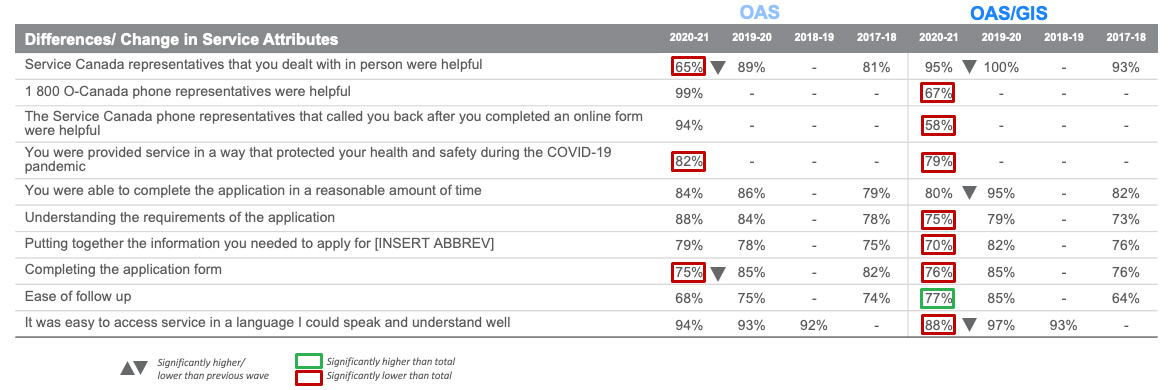
OAS/GIS clients were more satisfied with aspects of service related to effectiveness and emotion year over year while declines were also observed related to the ease of the application stage.
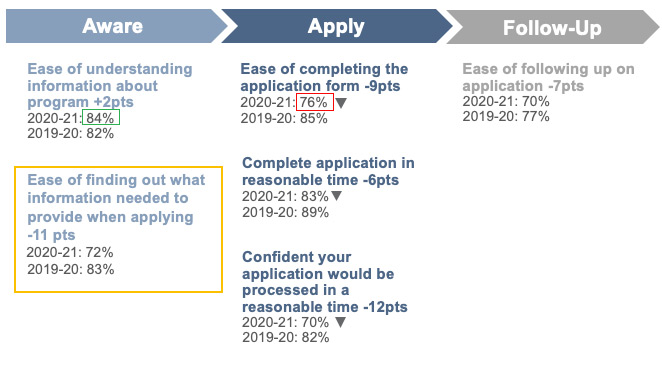
Compared to 2019-20, OAS/GIS clients were more likely to express confidence in the issue resolution process (82% vs. 77%) and to be satisfied with receiving consistent information (87% vs. 82%) and confidence their personal information was protected (85% vs. 79%) and to agree that completing steps online made it easier (56% vs. 48%).
OAS/GIS clients were less likely to be satisfied with the ease of completing the application form (76% vs. 85%), confident your application would be processed in a reasonable time (70% vs. 82%), being able to find info needed in reasonable amount of time during aware stage (83% vs. 90%) and the helpfulness of Service Canada in person staff (72% vs. 92%).
Overall satisfaction among clients receiving OAS and GIS has declined marginally year over year and declines have been observed on trust in Service Canada, timeliness of service and a number of aspects of ease, effectiveness of confidence. Similar shifts were observed among the subgroup of non-auto enroll clients due to the high proportion of overlap between the two groups- 71% of the OAS/GIS clients were non-auto-enrolled.
CPP-D clients were more satisfied year over year with the timeliness of service however ratings on other measures have changed little over time.
Compared to the 2019-20, CPP-D clients were more likely to be satisfied with the timeliness of service (57% vs. 49%), the ease of understanding information about the program (60% vs. 48%) and confidence their application would be processed in a reasonable time (40% vs. 34%).
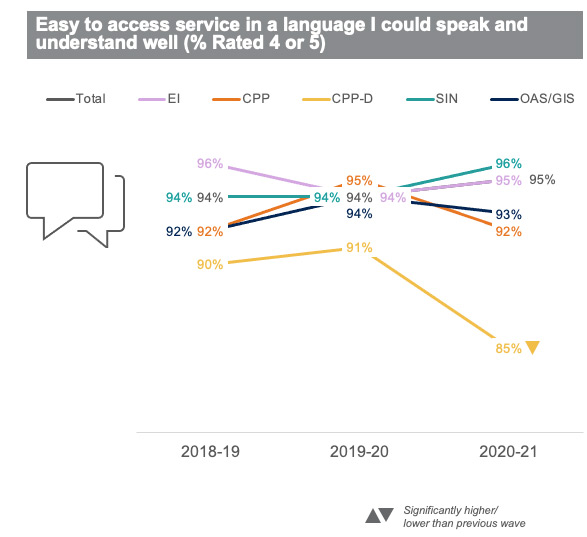
CPP-D clients were less satisfied with the ease of accessing service in a language they could speak and understand well (85% vs. 91%).
SIN clients were more satisfied with certain aspects of service while fewer were satisfied with the ease of getting help in general.
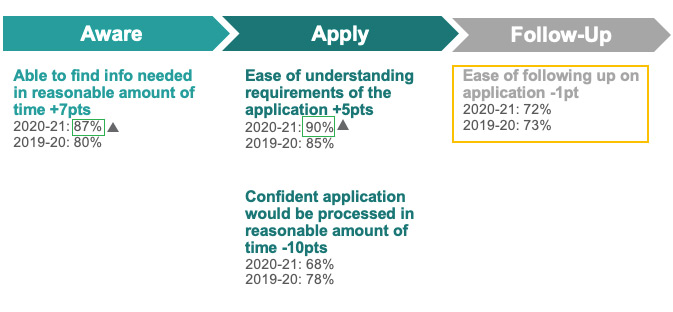
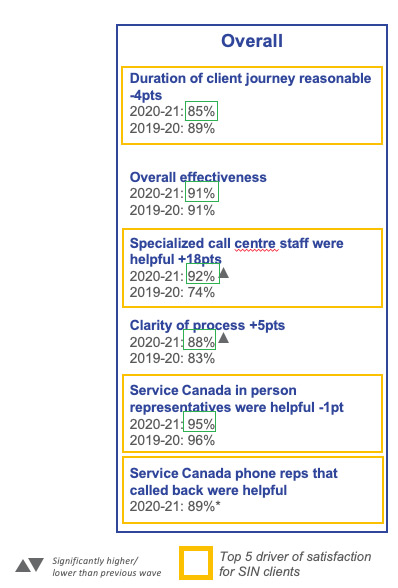
Compared to the 2019-20, SIN clients were more likely to be satisfied with the clarity of process (88% vs. 83%), being able to find info needed in reasonable amount of time during aware stage (87% vs. 80%), ease of understanding requirements of the application (90% vs. 85%) and the helpfulness of specialized call centre staff (92% vs. 74%).
SIN clients were less satisfied with the ease of getting help in general (83% vs. 89%).
Key Findings: Overall Drivers of Satisfaction
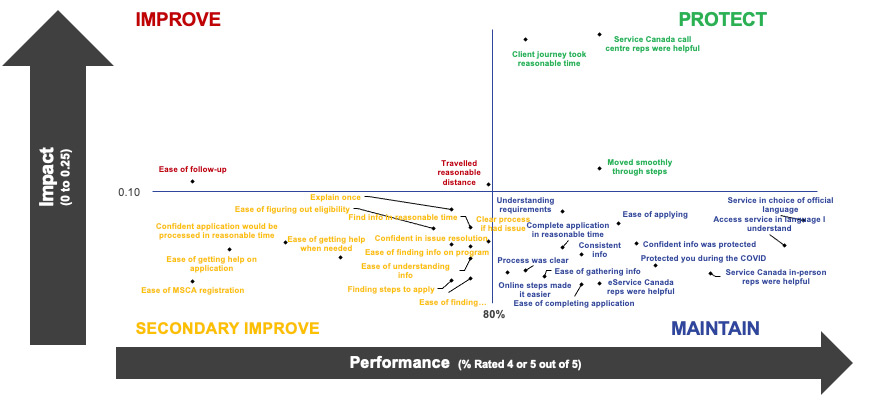
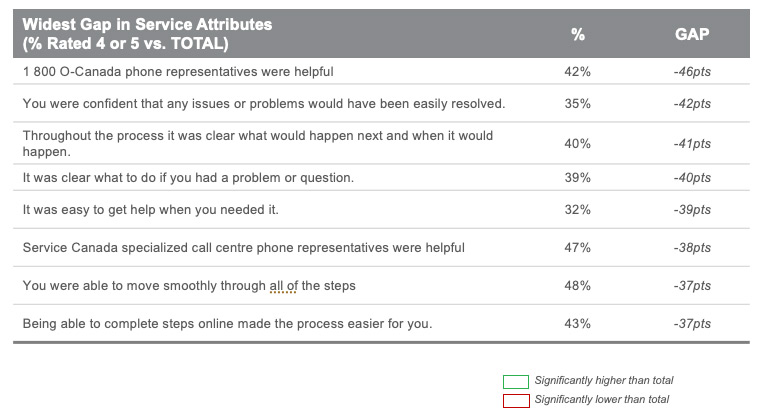
The most important drivers of satisfaction were: the helpfulness of Service Canada call centre phone representatives and the amount of time it took from start and to finish was reasonable. Performance on both measures has improved since last year and have emerged as strengths for the organization.
To improve the service experience for Service Canada clientele as a whole, focus should be placed primarily on improving the ease of follow-up which is among the top drivers of satisfaction but an area where performance is relatively weak. Areas of secondary importance for improvement include the ease of MSCA registration, the ease of getting help on the application when needed and confidence the application would be processed in a reasonable time.
This year the helpfulness of Service Canada call centre phone representatives has taken on increased importance and due to improved performance on this measure has become a strength for the organization. Further, the impact of the overall effectiveness of the process, the ease of follow-up and travelling a reasonable distance to access service (for in-person) have also taken on increased importance in driving satisfaction.
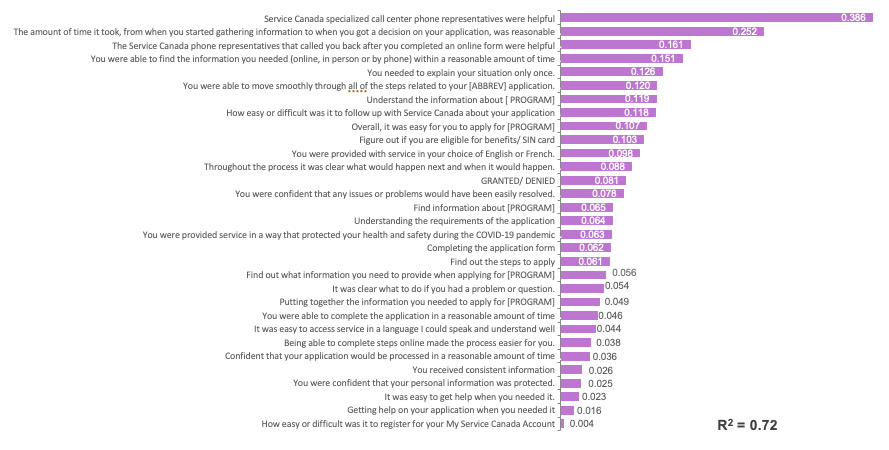
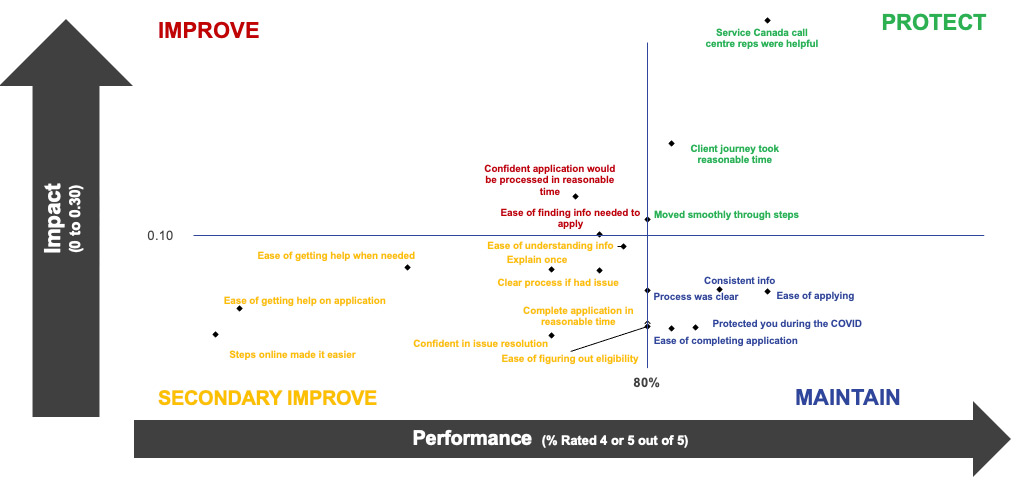
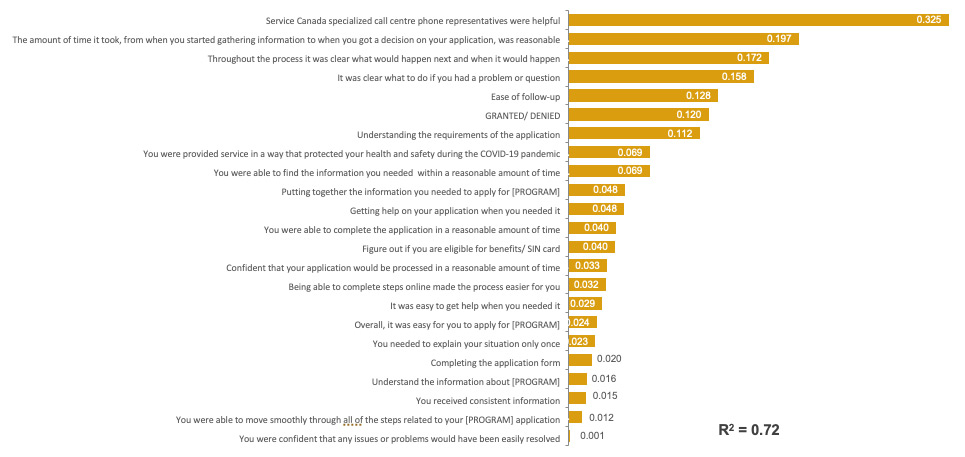
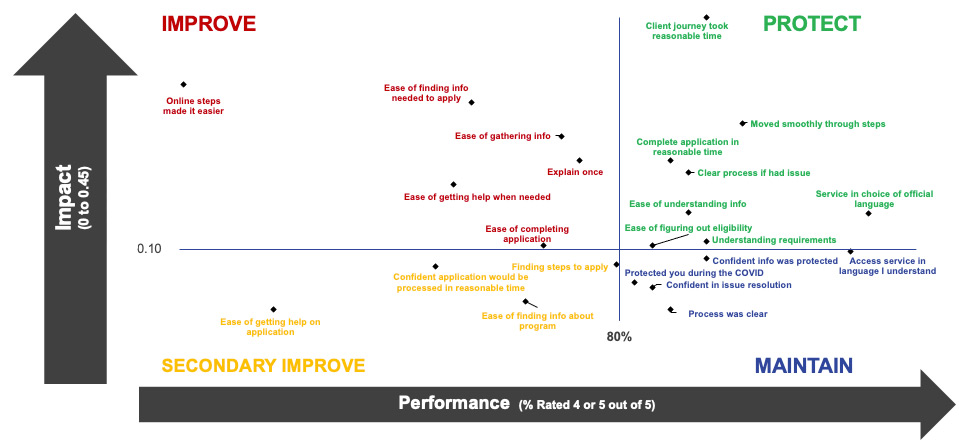
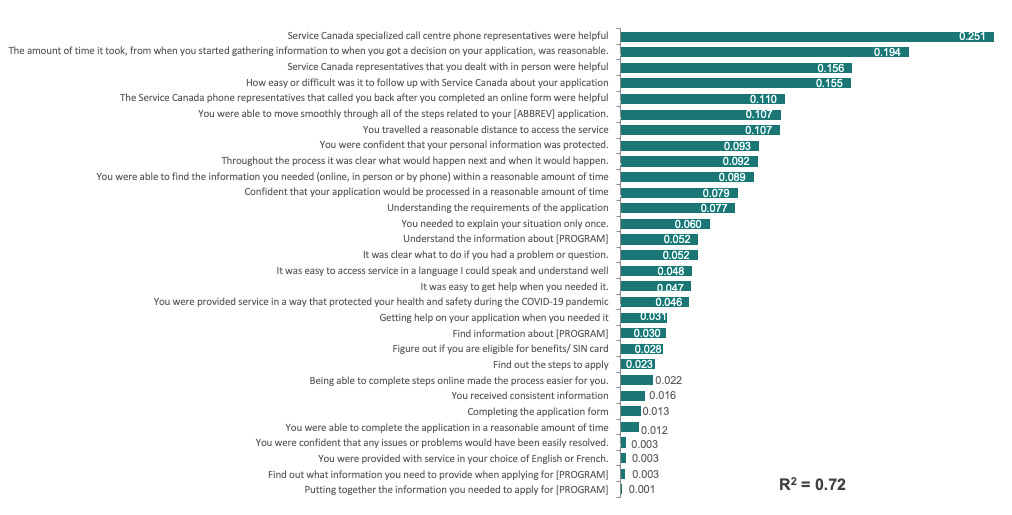
Key Findings: Drivers of Satisfaction By Program
Drivers of satisfaction continue to differ significantly by program. The most common top drivers were consistent with Service Canada clientele as a whole and include the timeliness of service for all programs and the helpfulness of call centre representatives for all programs except OAS/GIS clients.
Current areas that were performing strongly and were correlated to satisfaction include the top two drivers of satisfaction- the helpfulness of Service Canada call centre phone representatives and the amount of time it took from start and to finish was reasonable. These attributes should be maintained moving forward to protect these strengths.
The greatest opportunities to improve service across programs which represent areas strongly correlated to satisfaction where performance was lower to other areas differ significantly by program.
For CPP and OAS&GIS clients, it will be important to improve the ease of finding what information is needed to apply.
For CPP clients, it will also be important to improve confidence the application would be processed in a reasonable time.
For OAS & GIS, clients it will also be important to improve the ease of completing steps online and the ease of getting help in general.
For EI clients, it will be important to improve the ability for clients to find the information needed (during the aware stage) in a reasonable amount of time.
For CPP-D clients, it will be important to improve the timeliness of service, the overall clarity of process, the helpfulness of call centre representatives and the clarity of the issue resolution process.
For SIN clients, it will be important to improve the ease of follow-up.
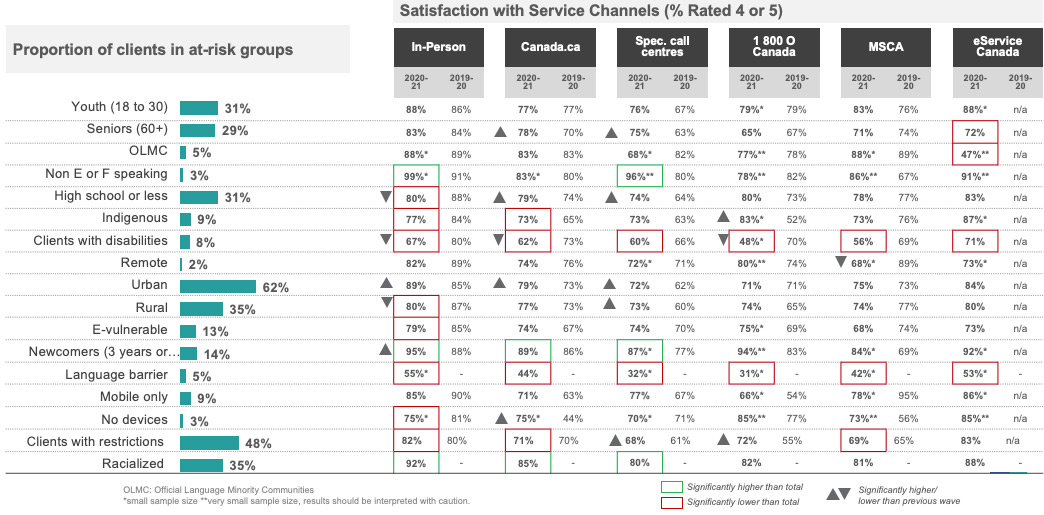
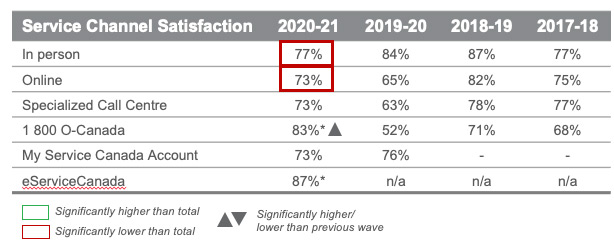
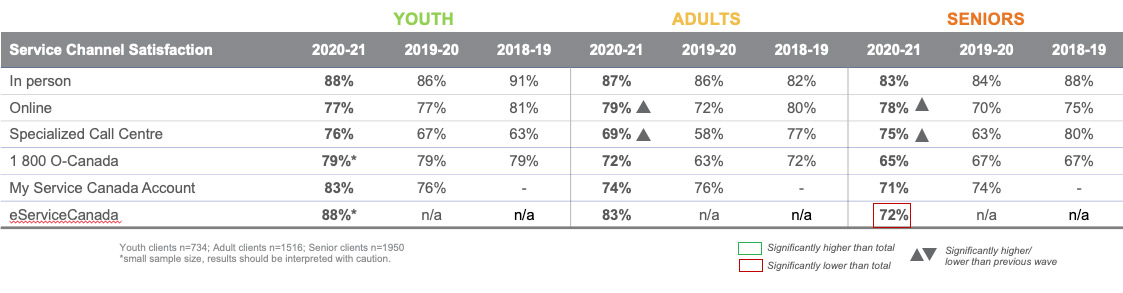
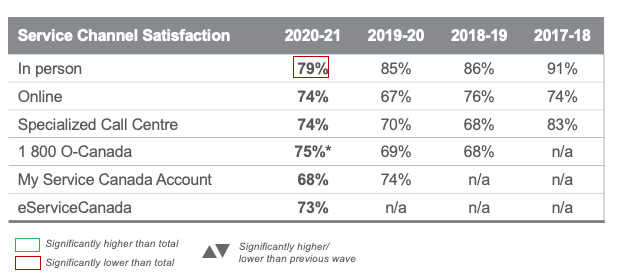
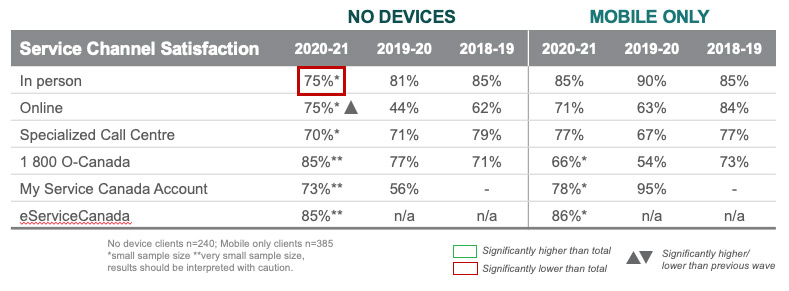
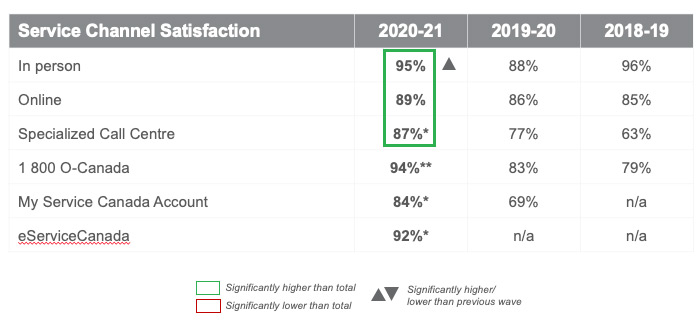
Key Findings: Service Channel Assessment
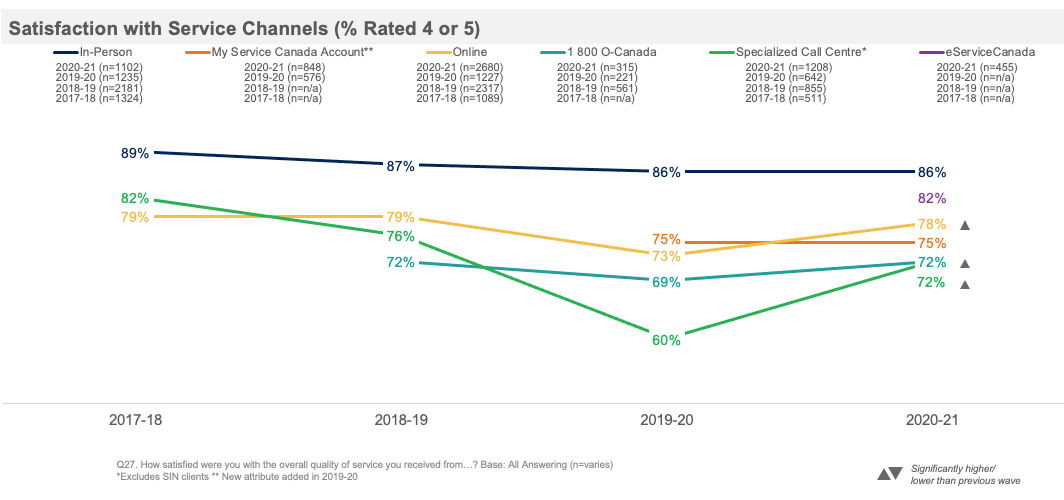
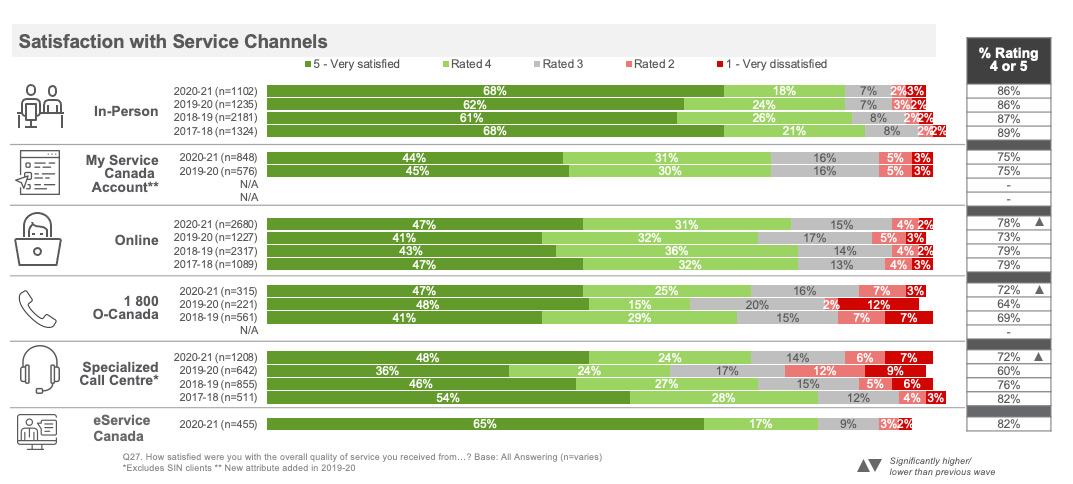
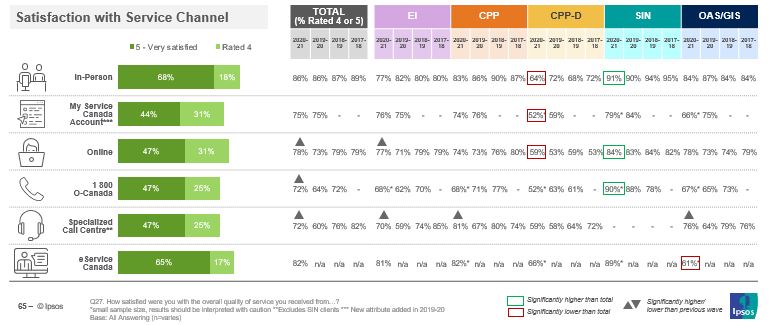
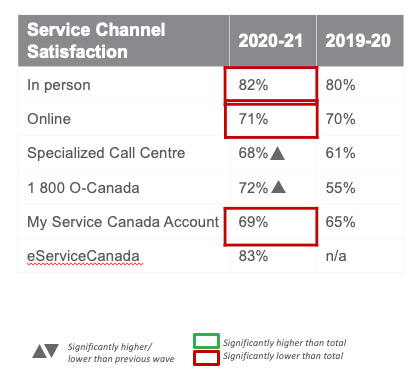
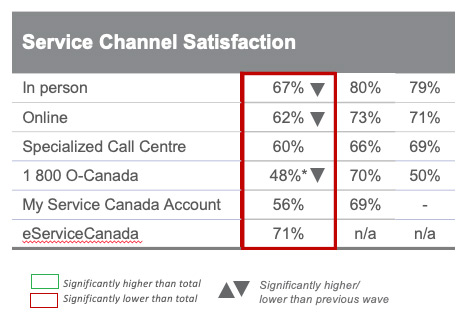
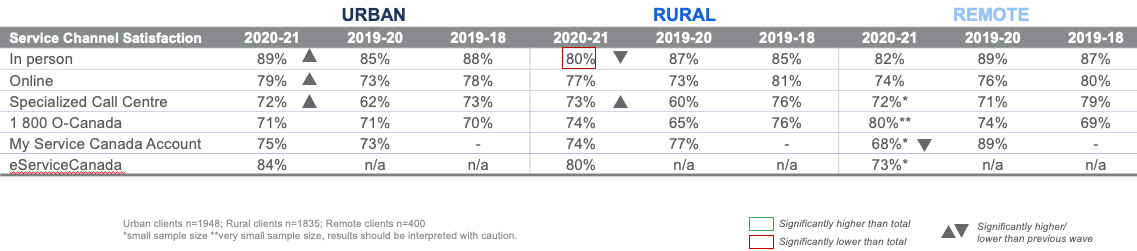
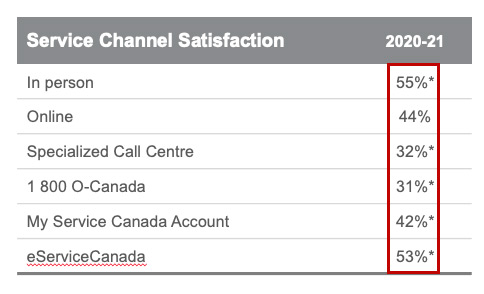
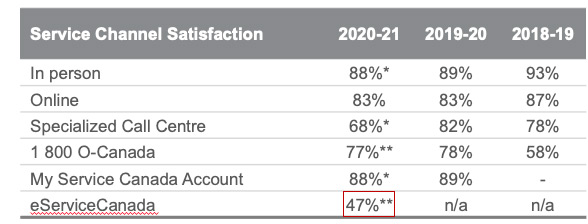
Clients continued to be most satisfied with the in-person experience, while satisfaction remained lowest for specialized call centres, although it has increased compared to 2019-20. Satisfaction with online and 1 800 O-Canada also increased year over year. The new eServiceCanada channel sees strong satisfaction that falls between the satisfaction levels for in-person and online.
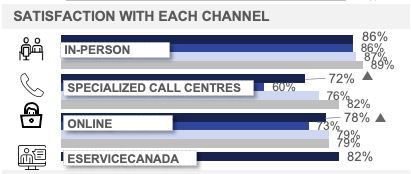
As in previous years, the large majority of clients remained satisfied with each service channel. Satisfaction with in-person service continued to be the highest (86%),followed by eServiceCanada (82%), online (78%), MSCA (75%), 1 800 O-Canada (72%) and specialized call centres (72%).
Satisfaction among those who used specialized call centres has improved following two consecutive years of decline. Clients were also more likely to express satisfaction with online and 1 800 O-Canada compared to the previous year.
Satisfaction with service channels differed somewhat by program. CPP-D clients rated their satisfaction with in-person service, online and MSCA lower compared to all clients, while SIN clients were more satisfied with in-person, online and 1 800 O-Canada. OAS/GIS clients rated their satisfaction with eServiceCanada lower than other clients.
Compared to 2019-20, EI clients provided higher ratings for online (77% vs. 71%) and specialized call centres (70% vs. 59%), while CPP (81% vs. 67%) and OAS/GIS clients (76% vs. 64%) were more satisfied with the quality of service provided by specialized call centres.
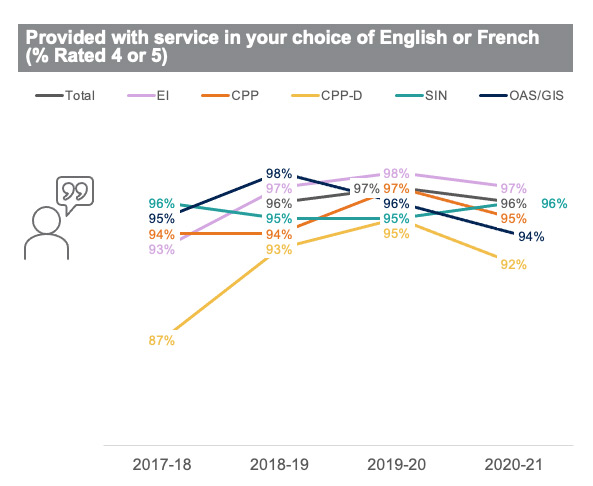
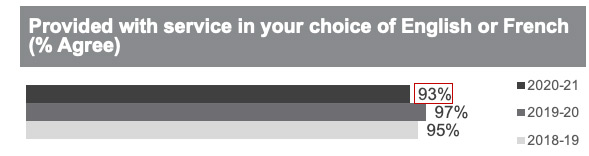
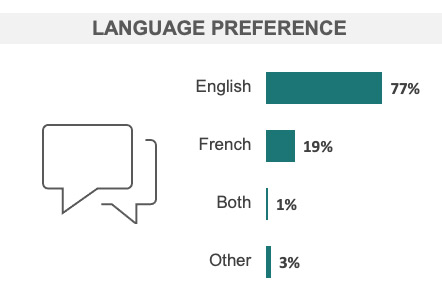
Nearly all of Service Canada clientele agreed they were provided service in their choice of English or French (97%) or that it was easy to access service in a language they could speak and understand well (95%).
Key Findings: Service Channel Assessment
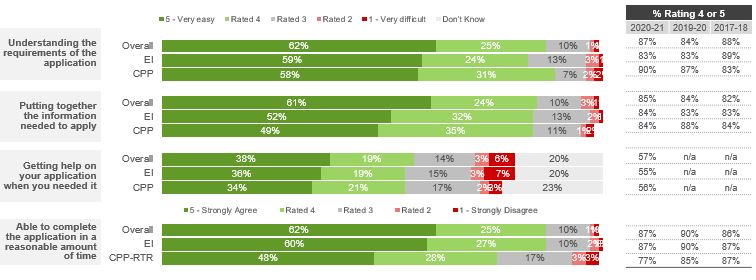
Self-service clients continued to be well served by the online application process but experienced more difficulty getting assistance on their application when they needed it.
The vast majority of self-service clients found it easy to understand the requirements of the application, put together the information needed, and to complete the application in a reasonable amount of time. At nearly six in ten, fewer found it was easy for them to get help on their application when they needed it.
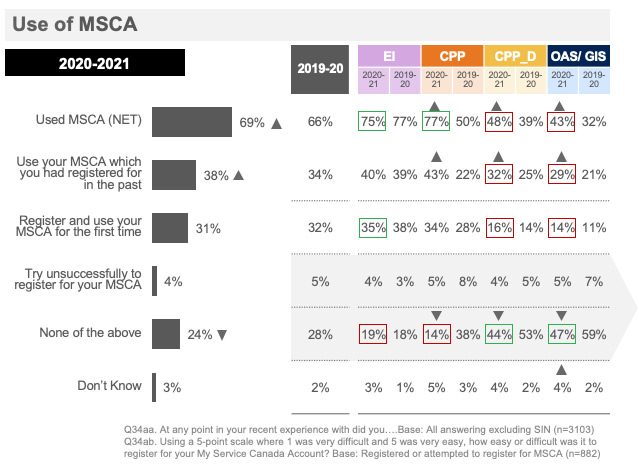
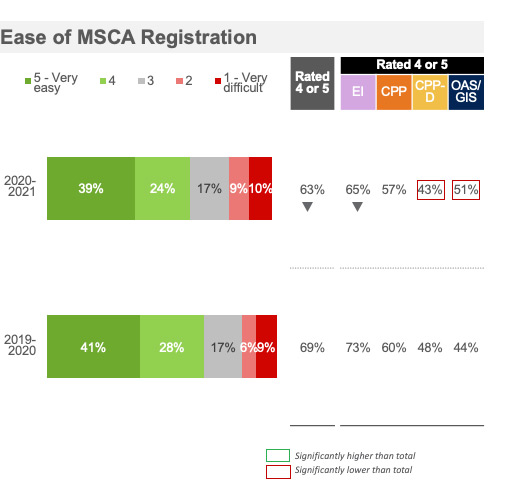
MSCA was utilized by the vast majority of EI and CPP clients, half of CPP-D clients and four in ten OAS/GIS clients. CPP, CPP-D and OAS/GIS clients were more likely to have used MSCA than in previous years. CPP-D and OAS/GIS clients felt it was more difficult to register compared to all clients.
Three-quarters of EI clients (75%) and CPP clients (77%), half of CPP-D clients (48%) and four in ten (43%) OAS/GIS clients used MSCA during their experience. The majority of those registered for MSCA for the first time felt the process was easy (63%), although this declined since 2019-20 driven by fewer EI clients expressing ease with the process.
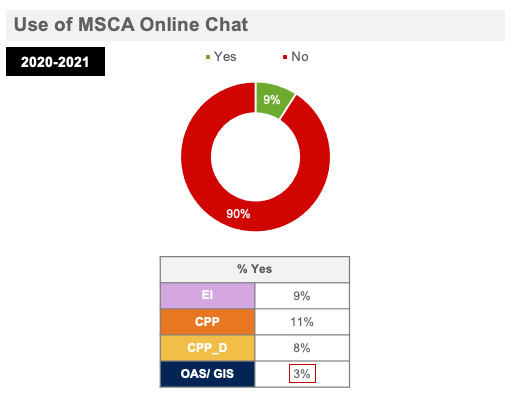
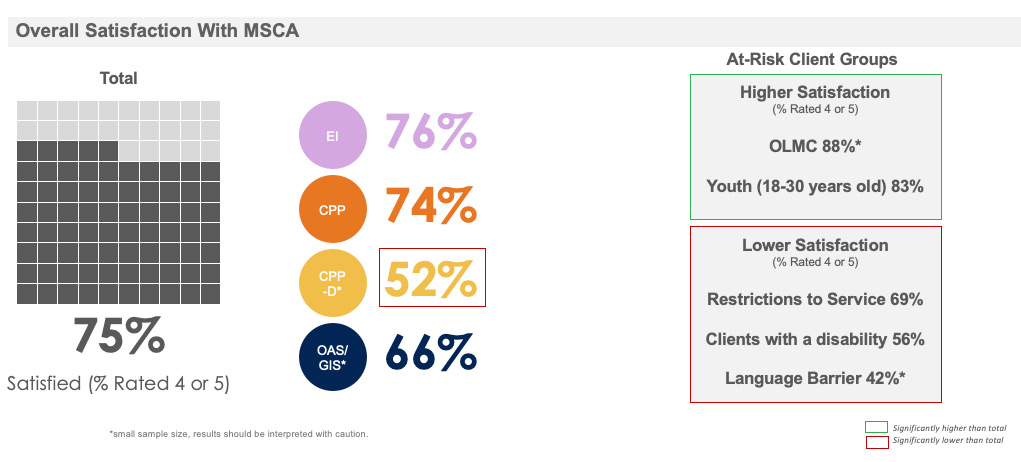
Overall, three-quarters (75%) of clients who utilized MSCA were satisfied. Satisfaction was notably lower among CPP-D, clients who experience restrictions to service (69%), who have a disability (56%), or who experience a language barrier (42%).
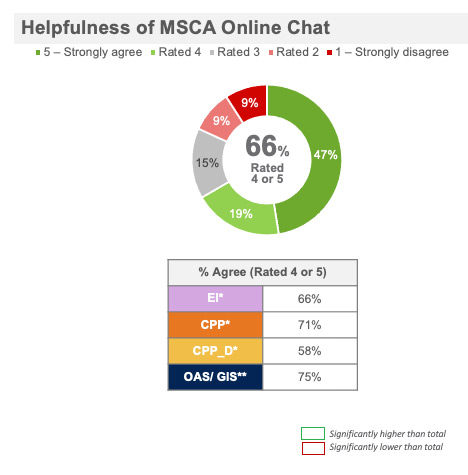
Among those who utilized MSCA at any point during the process, one in ten (9%) used the MSCA online chat function. Two thirds (66%) of those who used the online chat function found it helpful.
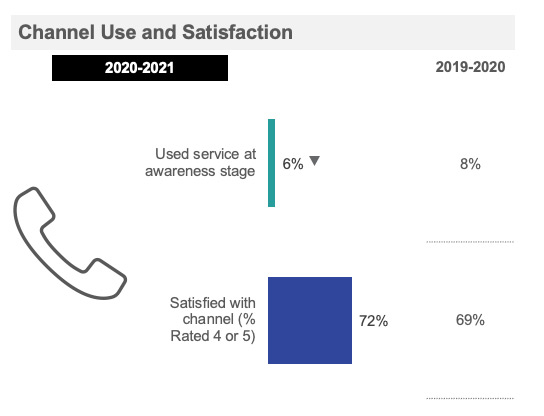
1 800 O-Canada was utilized by a limited proportion of clients at the awareness stage and usage did not differ significantly across most at-risk client groups.
Fewer than one in ten (6%) clients used 1 800 O-Canada at the aware stage. Usage was consistent among most at-risk groups but was higher among e-vulnerable clients, those who have a language barrier, clients who only have a mobile phone and those with no devices (no computer, smartphone or tablet). At seven in ten (72%), a strong majority of clients were satisfied with their experience with 1 800 O-Canada. Satisfaction with the channel was higher among newcomers.
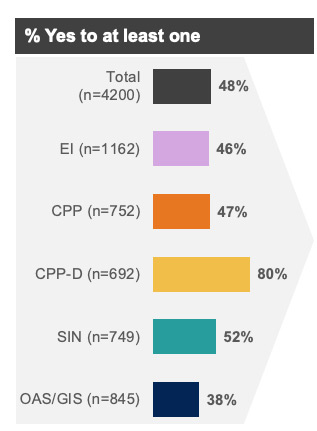
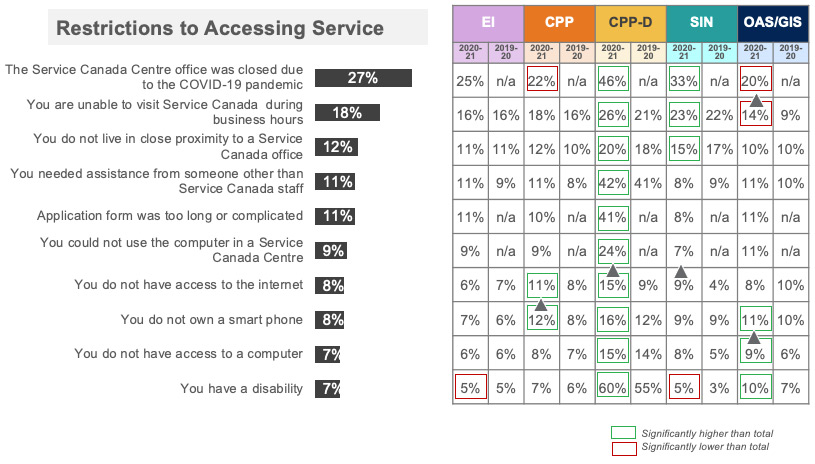
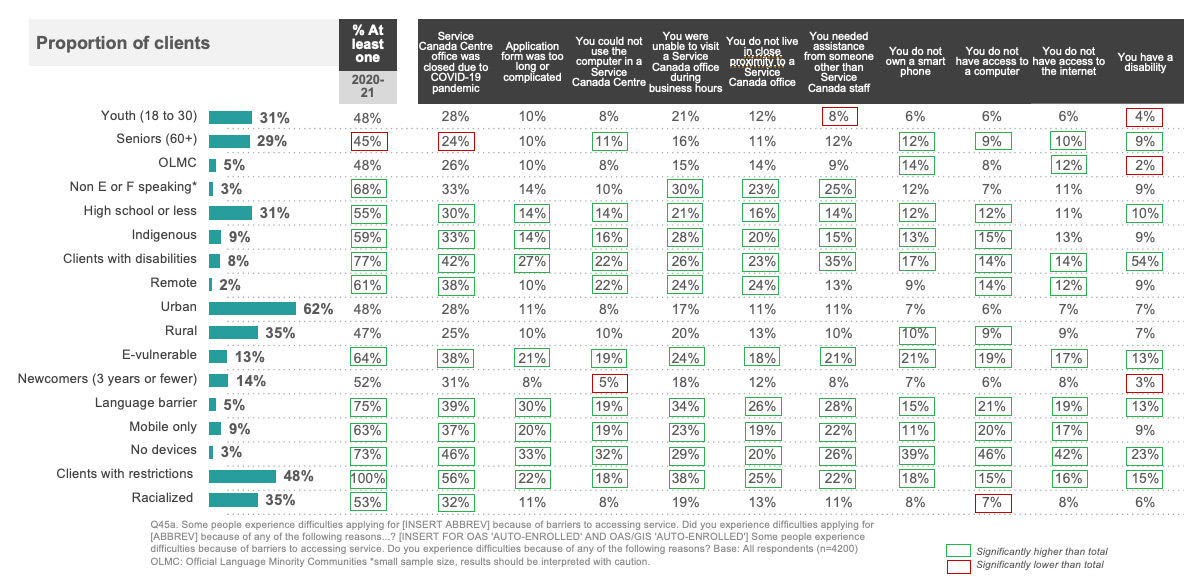
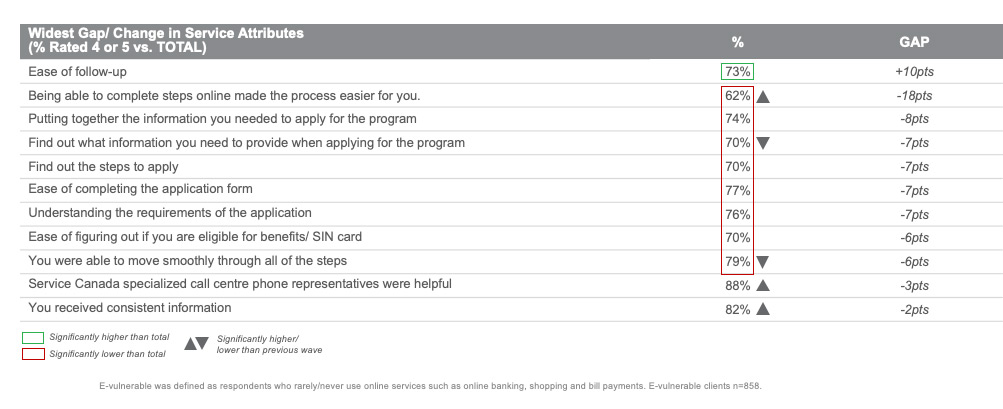
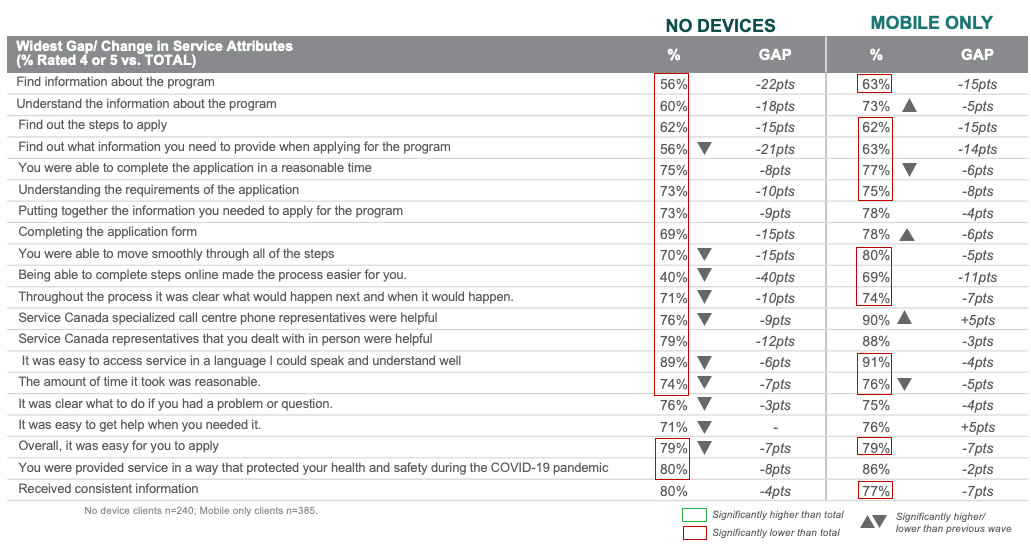
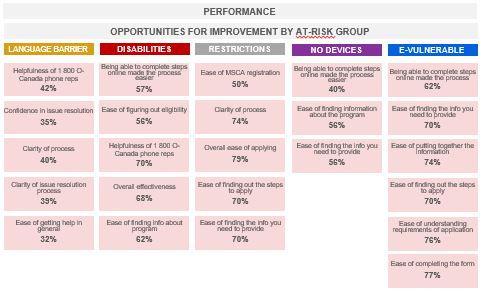
Key Findings: Barriers to Accessing Service
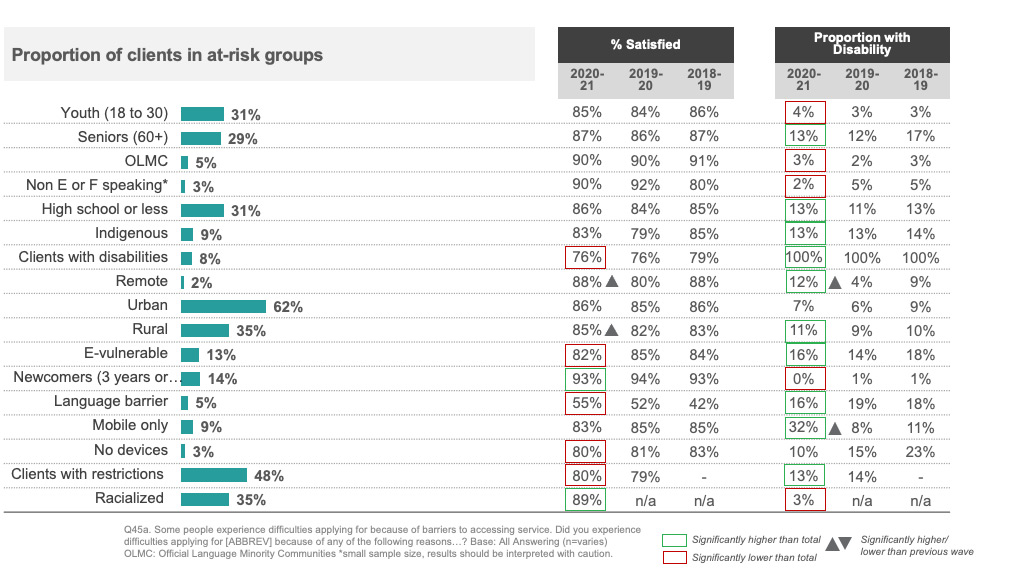
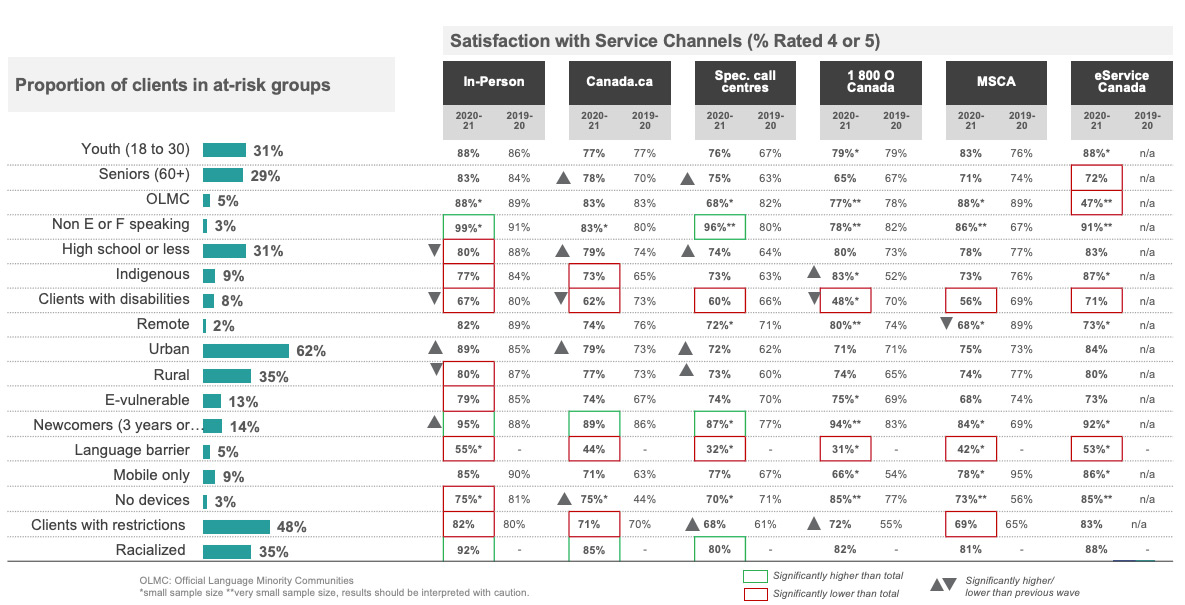
Clients with restrictions that make it more difficult to access service have lower satisfaction than other clients. Use of MSCA, the clarity of process and ease of finding information on the program to which they are applying present particular challenges for this client group.
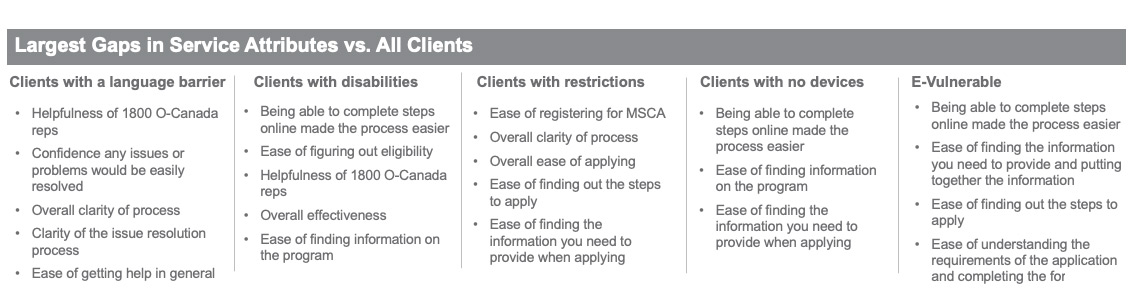
Clients who experienced a restriction to accessing service (48% of the client population) had lower satisfaction with the service provided in-person, online or through MSCA. They were also less satisfied with several service attributes with the largest gaps for ease of registering for MSCA, overall clarity of process, ease of applying, ease of finding out the steps to apply and ease of finding the information needed to apply.
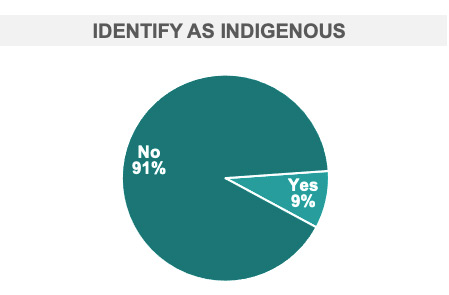
Restrictions to accessing service were more prevalent among several at-risk client groups, in particular clients with disabilities, those with a language barrier, clients with no devices and non-English for French speaking clients. Incidence of restrictions were also higher among e-vulnerable clients, mobile-only clients, clients who live in remote areas, Indigenous clients and those with a high school education or less.
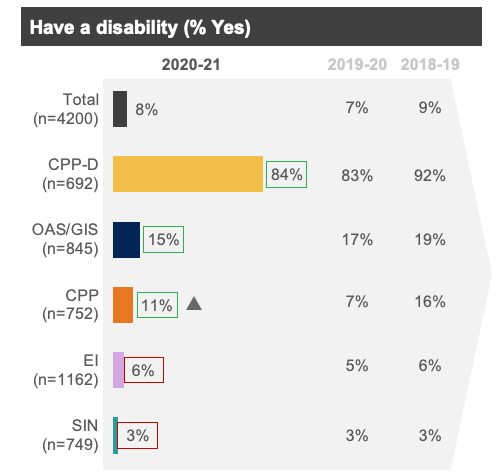
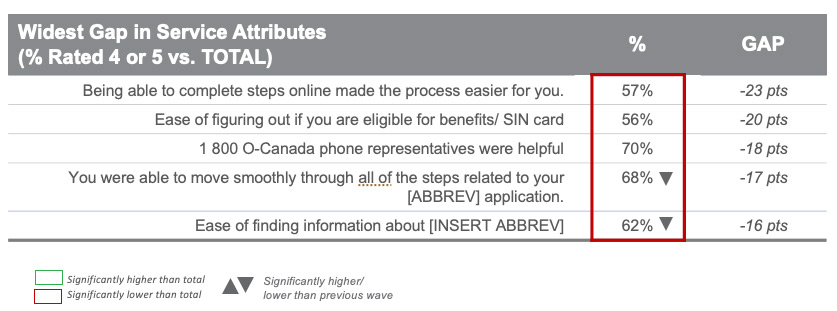
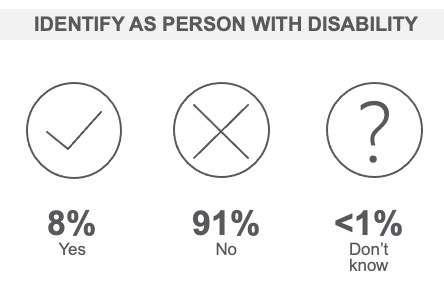
Clients who self identify as having a disability (8% of the sample population) provided lower ratings for the level of service provided through all channels. They were also less satisfied with several service attributes with the largest gaps for being able to complete steps online made the process easier, ease of figuring out if you are eligible for benefits, the helpfulness of 1 800 O-Canada representatives, being able to move smoothly through all the steps and ease of finding information about the program.
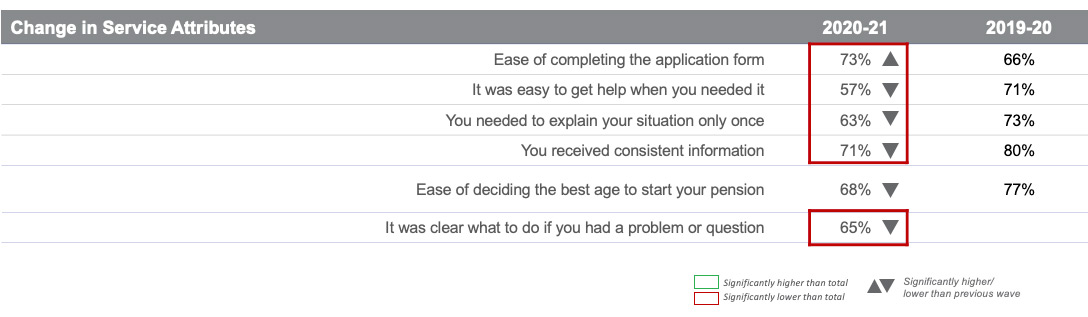
Compared to 2019-20, lower ratings were provided for the quality of service provided in person, online and through 1 800 O-Canada. Ratings have increased for the ease of completing the application form while declines were also observed across several attributes. The largest negative shifts were for ease of getting help in general, needing to explain your situation only once, receiving consistent information, ease of deciding the best age to start your pension, the clarity of the issue resolution process, being able to move smoothly through the steps and ease of finding information about the program.
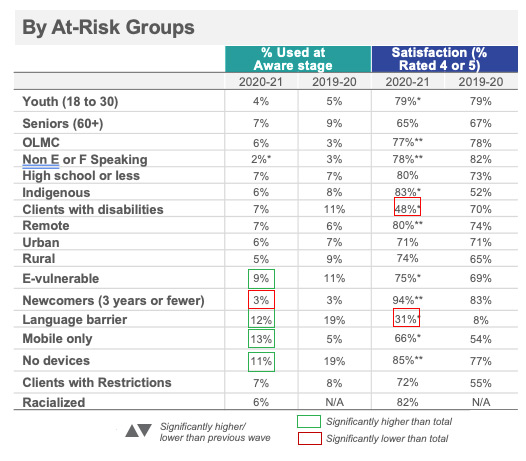
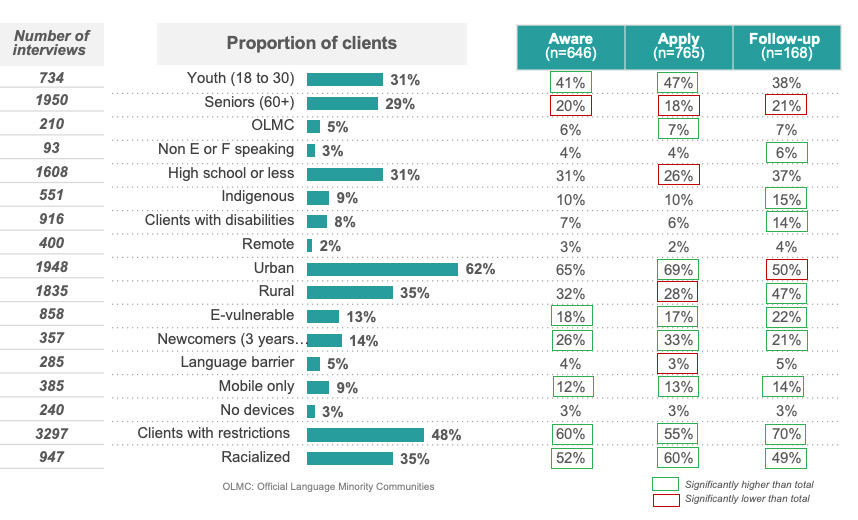
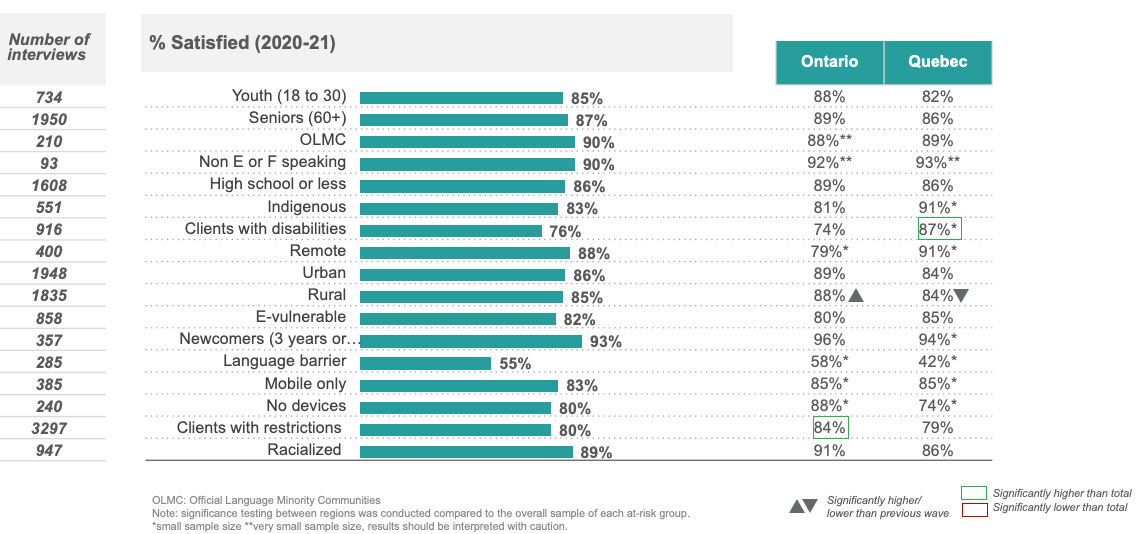
Key Findings: At-Risk Groups
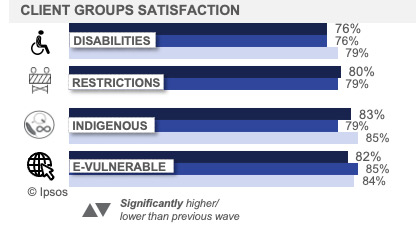
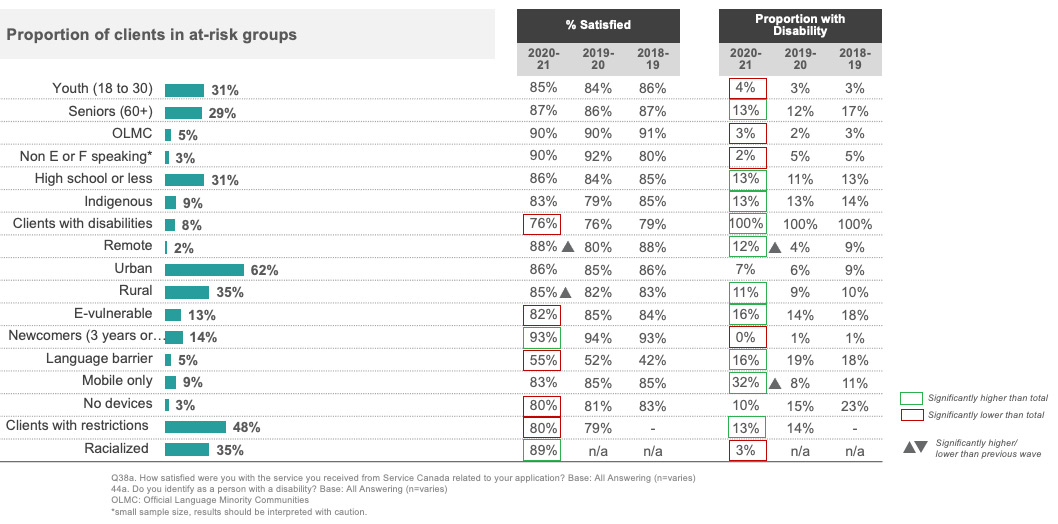
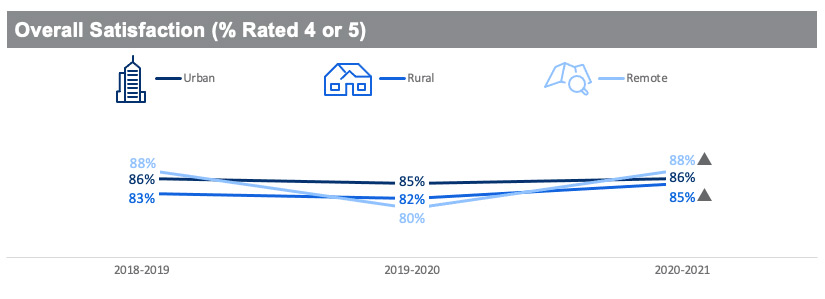
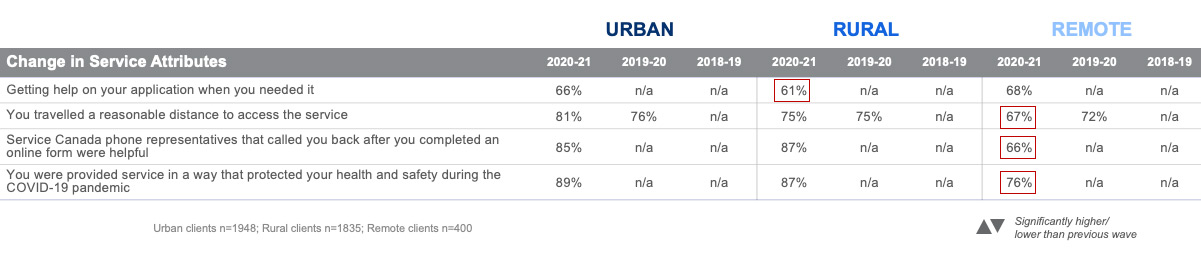
Among the 17 at-risk client groupings, most provided high ratings of the service experience. Satisfaction among rural clients and those living in remote areas increased year over year.
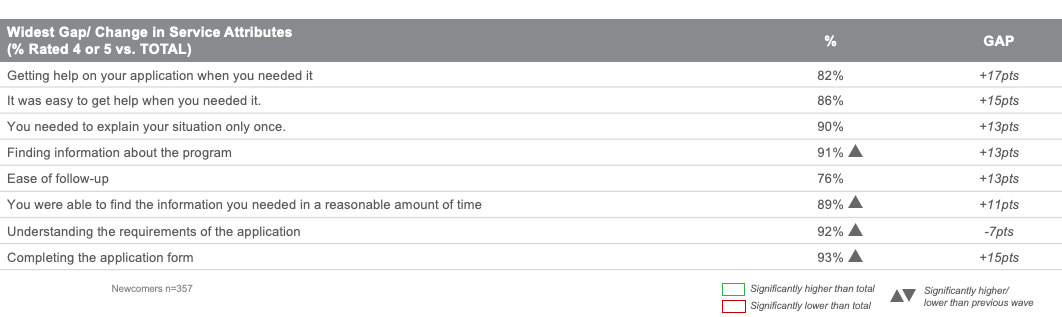
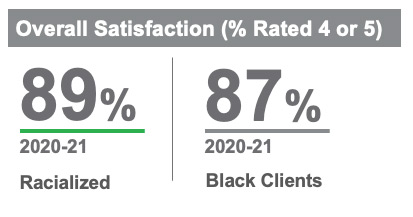
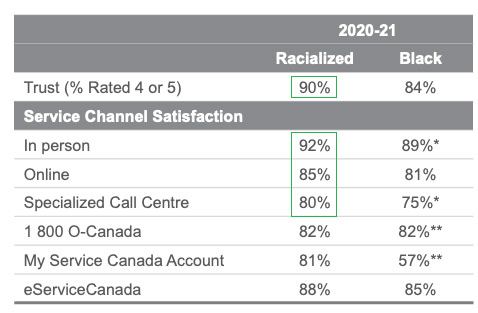
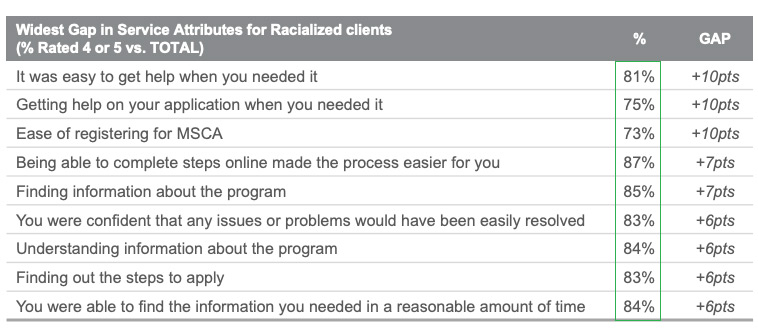
Satisfaction with the service experience remained strong and the vast majority of clients in at-risk groups rated it positively. Satisfaction among newcomers and racialized clients was higher than compared to all clients.
Overall satisfaction among rural clients and clients living in remote areas increased compared to 2019-20 and is consistent with all clients. There have been no significant shifts in overall satisfaction among any other at-risk groups compared to 2019-20.
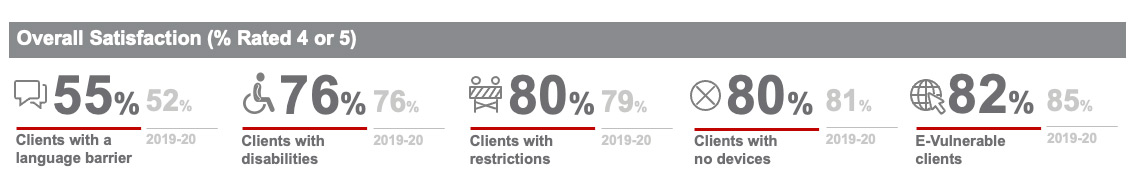
Satisfaction was lower compared to all clients among those with a language barrier, clients with disabilities, those with restrictions to accessing service, clients with no devices and e-vulnerable clients.
Ratings of the service experience were considerably lower among those with a language barrier including the service provided through all channels and across all service attributes. The largest gaps on service attributes compared to all clients were for the helpfulness of 1 800 O-Canada phone representatives, confidence any issues would be easily resolved, clarity of process, clarity of the issue resolution process, ease of getting help in general.
Background and Objectives
Research Background and Objectives
In line with both the Treasury Board Policy on Service and Digital, which outlines the key principles to achieve better and more efficient design and delivery of Government of Canada services, and ESDC’s Service Strategy and Service Transformation Plan, the Department required data on its service experience from the client’s perspective to assist in effectively managing service delivery.
In 2017, the Citizen Service Branch launched the annual Client Experience (CX) Survey as part of a structured approach to collecting feedback from clients to track how well Service Canada was delivering federal programs through its service channels. The CX Survey was conducted again in 2018-19 and 2019-20.
The survey assessed the extent to which the service design worked for clients as they went through the process of accessing programs through Service Canada’s service delivery system.
The CX Survey project is conducted in two phases, an initial quantitative survey followed by a qualitative phase of research. Due to the timing of the Federal Election (held Sept. 20th 2021), the qualitative phase of research was delayed into late Fall 2021.
Having fielded the survey in 2017-18, 2018-19 and 2019-20, the CX Survey in 2020-21 collected trend data to contribute to monitoring the service delivery performance of Service Canada, and to report annual satisfaction to meet service standards on the client experience. The survey also tracked take-up of self-service and assisted self-service among Service Canada clients to inform service changes over time.
Results from the CX Survey are used for:
Reporting the Department’s overall client satisfaction rate for the programs in the Departmental Results Report;
Informing service management decisions based on client feedback as reported to Treasury Board annually under the Management Accountability Framework;
Assessing the impact of service transformation on clients over time; and
Improving service delivery to respond to client needs.
The research objectives for the quantitative phase were to:
Provide tracking on key service performance measures, primarily overall satisfaction and ease, effectiveness and emotion with the service experience by program, client group, and service channels used.
Track take-up of self-service and assisted self-service among Service Canada clients to inform Service Transformation over time.
Service Canada Client Experience Survey Model
Service Canada Client Experience (CX) Survey Measurement Model
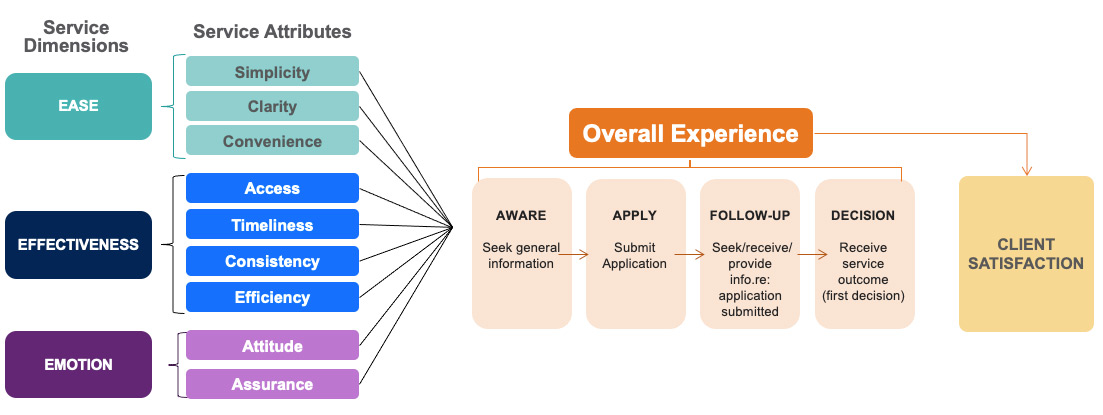
Service Canada developed the survey model below as a consistent framework for assessing the service experience of its clients.
The methodology for the Client Experience Survey was initially implemented in 2017-18. In the 2018-19 wave of the survey, the questionnaire was limited to the overall experience to allow for measures to gather data to inform service transformation. In the 2019-20 and 2020-21 waves, the questionnaire took the approach utilized in 2017-18 to allow for assessment of tracking of each stage of the client journey
Aware, seek general information; connected by arrow to Apply, submit application; connected by arrow to Follow-up, seek/receive, info. re: application submitted; connected by arrow to Decision, receive service outcome (first decision)
Overall Experience covering Aware, Apply and Follow-up Stages connected by arrow pointing to Client Satisfaction
Note: The Model was drawn from a combination of existing models to suit Service Canada context, and validated through consultation with internal stakeholders. The existing models include: The Common Measurements Tool (CMT), owned and licensed by the Institute for Citizen-Centred Service (ICCS), the client survey model used by the Government of Quebec, and Forrester’s approach to client experience measurement.
Service Canada CX Survey Measurement Model: Service Attributes
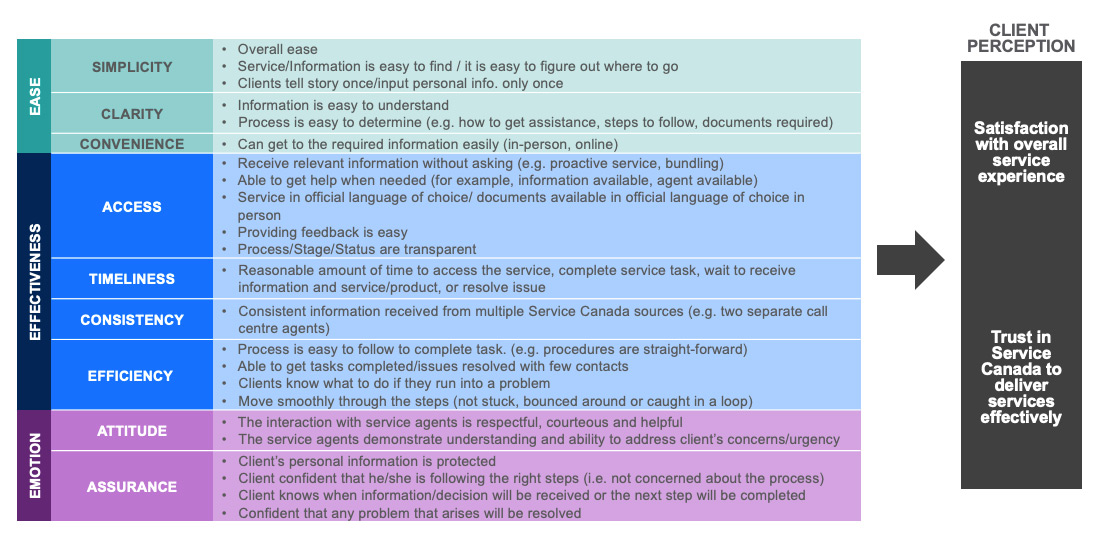
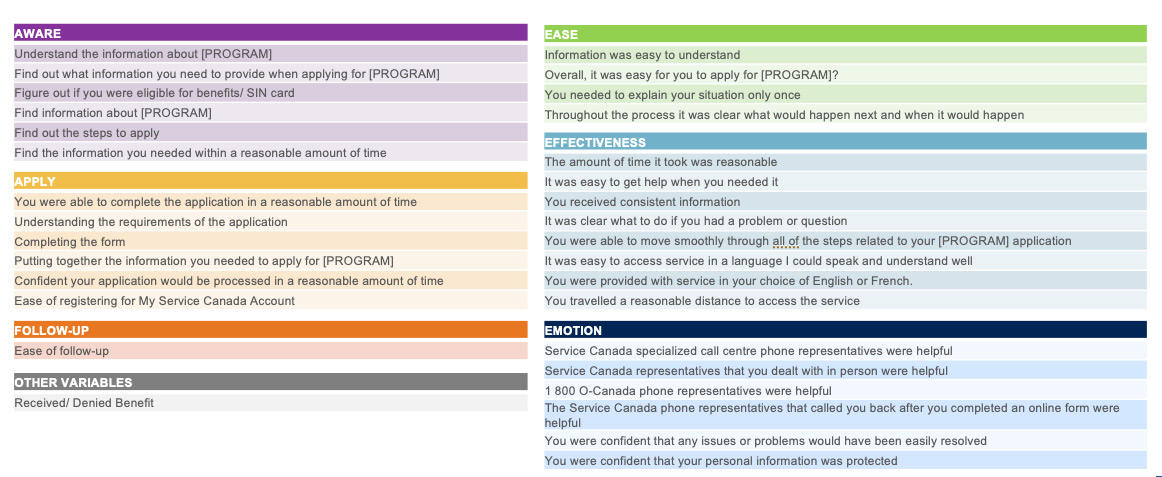
The following was the full set of detailed service attributes in the model that guided the development of the baseline questionnaire.
Figure long description
Service Canada CX Survey Measurement Model: Service Attributes
EASE
SIMPLICITY
Overall ease
Service/Information is easy to find / it is easy to figure out where to go
Clients tell story once/input personal info. only once
CLARITY
Information is easy to understand
Process is easy to determine (e.g. how to get assistance, steps to follow, documents required)
CONVENIENCE
Can get to the required information easily (in-person, online)
EFFECTIVENESS
ACCESS
Receive relevant information without asking (e.g. proactive service, bundling)
Able to get help when needed (for example, information available, agent available)
Service in official language of choice/ documents available in official language of choice in person
Providing feedback is easy
Process/Stage/Status are transparent
TIMELINESS
Reasonable amount of time to access the service, complete service task, wait to receive information and service/product, or resolve issue
CONSISTENCY
Consistent information received from multiple Service Canada sources (e.g. two separate call
centre agents)
EFFICIENCY
Process is easy to follow to complete task. (e.g. procedures are straight-forward)
Able to get tasks completed/issues resolved with few contacts
Clients know what to do if they run into a problem
Move smoothly through the steps (not stuck, bounced around or caught in a loop)
Confidence
ATTITUDE
The interaction with service agents is respectful, courteous and helpful
The service agents demonstrate understanding and ability to address client’s concerns/urgency
ASSURANCE
Client’s personal information is protected
Client confident that he/she is following the right steps (i.e. not concerned about the process)
Client knows when information/decision will be received or the next step will be completed
Confident that any problem that arises will be resolved
Client perception
Satisfaction with overall service experience
Trust in Service Canada to deliver services effectively
Research Approach
Overview: Quantitative Approach
A telephone survey was conducted with a sample of 4,200 Service Canada clients across the six major programs, with between approximately 700 and 1,100 respondents interviewed about their experience with each program. The interviews were conducted from June 23 and Aug 9, 2021.
In order to examine the overall service experience, including how clients used the various channels to complete the steps of their client journeys, the clientele was defined as clients who had recently completed a client journey, up to initial decision.
The sample of clients who had received a service outcome during January, February and March 2021 were randomly selected from program administrative databases. Comparisons of findings to the baseline data must take into account that the 2017-18 survey wave largely sampled clients who received a service outcome in April, May, or June 2017.
The sample was stratified by program. Weighting adjustments were made to bring the sample into proportion with the universe by age, gender, and region within each program, and to bring the over-sampled groups back to their proportion among clients.
Data based on the total population have a margin of error of +/-1.5% at the 95% confidence interval, while data based on sub-groups have a larger margin of error. For example, the margin of error for data for each program was between +/-2.9% to +/-3.7%.
The data was weighted in proportion to age, gender, region and program volume.
Small sample sizes have been identified throughout the report. Caution should be used when interpreting these results. *small sample size (less than n=100) **very small sample size (less than n=30)
Data Collection: Quantitative Approach
The questionnaire was developed based on the Service Canada Client Experience Survey Measurement Model. The 2019-20 CX Survey was used as the basis for developing the questionnaire design. Modifications were made to incorporate the new eServiceCanada channel in survey questions, and to align with elements of the baseline 2017-18 survey to allow for assessment of each stage of the client journey as well as tracking service levels over that time.
The questionnaire was pretested on June 23 and 24 and fieldwork took place between June 25 and Aug 9, 2021.
Experienced, trained interviewers were specifically briefed on the requirements of this study. A minimum of 10% of each interviewer’s calls were monitored by a team leader.
Respondents were interviewed in their choice of English or French. For those who could not respond in either language, a proxy respondent (who had assisted them in contacting Service Canada) could respond on their behalf. In addition, respondents who could not speak either official language were provided an option of using an on-demand translation service. No respondents utilized the service this wave.
To better reach Deaf or Hard of Hearing clients, those clients were actively offered the SVR Canada VRS telephone service to complete the survey. No respondents utilized the SVR Canada VRS service.
Oversamples were conducted with two at-risk client groups: those living in remote areas and Indigenous clients (See Appendix A for the definitions of at-risk client groups). This was done to provide a minimum of 400 completed interviews with each group.;
Calibration of the Data: Quantitative Approach
A multi-tiered approach has been used to weight the data from the sample for the Client Experience survey into proportion with the universe of ESDC clients. Steps in the weighting comprised:
Adjust to the universe proportions of age, gender, and region for each program.
Weight over-sampled populations back into proportion to their presence in the universe.
Weight the number of respondents in each program in proportion to the total number of clients.
Weight the number respondents by each region in proportion to the total number of clients.
Adjust to the universe proportions of benefits received for each program.
OAS and GIS have been combined into one client group and weighted according to age, gender, region, and benefit receipt were applied based on combined program figures. The proportion of clients in each program were weighted separately.
The universe proportions used to develop the targets were based on data extracts provided by the Department.
Additional details on the methodology are provided in Appendix A. A description of the sampling strategy, weighting and limitations are provided under separate cover, together with the survey questionnaire.
To ensure comparability of results between 2017-18, 2018-19, 2019-20 and 2020-21 the proportions of clients by program were held consistent and based on composition of the clientele in May of 2017-18.
Overview: Qualitative Research Approach
Clients who were screened into the qualitative research were those who had lower satisfaction and/or experienced a barrier to accessing service.
A series of in-depth interviews and focus groups were conducted as outlined below to gain deeper insight and understanding into their experiences and barriers, to better understand various aspects of their client journey, and to hear about these in an open discussion setting.
30 In-depth interviews took place between November 16 and December 3, 2021, as follows:
5 in-depth interviews with CPP clients
6 in-depth interviews with CPP-D clients
6 in-depth interviews with EI clients
4 in-depth interviews with GIS clients
4 in-depth interviews with OAS clients
5 in-depth interviews with SIN clients
3 Online focus groups took place on November 17 and 18, 2021, as follows:
1 online focus group with 8 EI clients
1 online focus group with 6 SIN clients
1 online focus group with 1 CPP client, 3 OAS clients, and 2 CPP-D clients
Detailed Findings
Service Transformation
Service Transformation: Impact on Multi-Channel Use
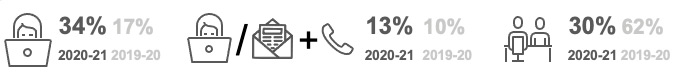
Clients were more likely to utilize self-service only or assisted self-service during the client journey compared to before the pandemic, while considerably fewer used the in-person channel service at any point.
Figure long description
Self-service only versus assisted self-service compared to before pandemic
Self-service; icon, person at computer
2020-21, 34%
2019-20, 17%
Assisted self-service; icon, person at computer and mail and telephone
2020-21, 13%
2019-20, 10%
In-person
2020-21, 30%
2019-20, 62%
One in ten clients used the new touchless person-to-person service (use of eService Canada for an online application with no in-person). The proportion of clients auto-enrolled only or only used mail as a service channel remained consistent.
Figure long description
Touchless person-to-person
eServiceCanada; icon, person on a computer screen
2020-21, 7%
Auto-enroll; icon, a computer
2020-21, 4%
2019-20, 4%
Mail, icon, envelope
2020-21, 1%
2019-20, 1%
Use of the online channel increased at the aware and apply stage, while use of the in-person channel declined at all stages. Telephone usage is unchanged and remains the preferred channel at the follow-up stage, while use of mail increased at the aware stage.
Figure long description
Channel usage by stage of client journey
Online
Aware
2020-21, 75%
2019-20, 58%
Apply
2020-21, 72%
2020-21, 48%
Follow-up
2020-21, 51%
2020-21, 56%
In-person
Aware
2020-21, 24%
2019-20, 47%
Apply
2020-21, 24%
20219-20, 59%
Follow-up
2020-21, 13%
2019-20, 40%
Phone
Aware
2020-21, 16%
2019-20, 15%
Apply
2020-21, 13%
2019-20, 13%
Follow-up
2020-21, 70%
2019-20, 68%
Mail
Aware
2020-21, 14%
2019-20, 10%
Apply
2020-21, 11%
2019-20, 10%
Follow-up
2020-21, 15%
2019-20, 15%
Clients who utilized more channels had lower overall satisfaction (80% satisfied with 3+ channels vs. 86% overall)
EI clients were more likely to have used only one channel (49%), while CPP-D clients were more likely to have two or more channels (64%).
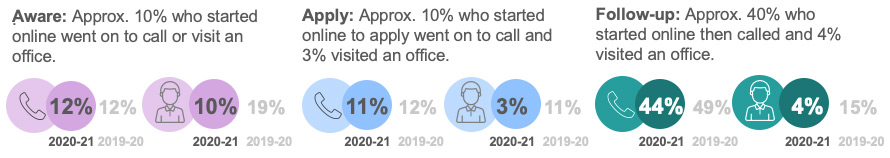
Clients who started online were less likely to go in person as a second point of contact across all stages. Use of telephone as a second point of contact remained consistent.
Clients who started online were less likely to go in person as a second point of contact across all stages. Use of telephone as a second point of contact remained consistent.
Figure long description
Second point of contact
Aware: Approx. 10% who started online went on to call or visit an office.
Apply: Approx. 10% who started online to apply went on to call and 3% visited an office.
Follow-up: Approx. 40% who started online then called and 4% visited an office.
Aware
Phone
2020-21, 12%
2019-20, 12%
In-person
2020-21, 10%
2019-20, 19%
Apply
Phone
2020-21, 11%
2019-20, 12%
In-person
2020-21, 3%
2019-20, 11%
Follow-up
Phone
2020-21, 44%
2019-20, 49%
In-person
2020-21, 4%
2019-20, 15%
Self-Service and Assistance
Change in Multiple Channel Use Over Time
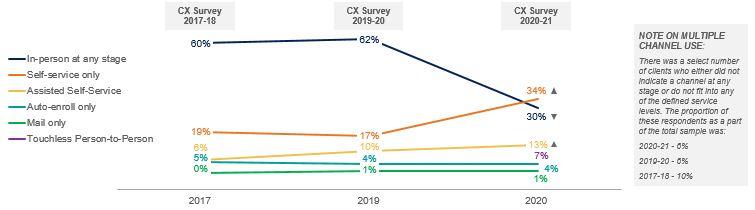
Overall, clients were more likely to utilize self-service only or assisted self-service during the entire client journey compared to 2019-20, while considerably fewer used in person channel service.
For the first time, more clients used self-service only than in-person service, while assisted self-service has continued to see gradual increases in usage year-over-year. Seven percent utilized the new touchless person-to-person service, while four percent continued to be auto-enrolled only. Although there was an increase in mail usage, one percent of clients used mail only. The balance of clients, around one in twenty (6%), either indicated using no channels throughout their experience or did not fit a defined level of service. This figure is stable with the year previous.
Figure long description
Change in multiple channel use over time chart:
In-person at any stage: 60%, 2017-18; 62%, 2019-20; 30%, 2020-21, significantly lower than previous wave
Multiple Channel Use definitions were mutually exclusive paths that track the client journey. The Multiple Channel Use variables were used to assess whether there has been an increase or decrease in a particular method of contact with Service Canada. Please note that the definitions used are based on those set in CX3.
In Person: If a respondent goes into a Service Canada centre at any stage of their journey, they were considered to have used the “in person” service level
Self Service Only: These respondents use online offerings including the Government of Canada website and their My Service Canada Account. They engage online at all stages.
Assisted Self Service: These respondents use an online or mail, but also contact Service Canada by phone, or a combination of phone and online or mail throughout their journey.
Auto-Enroll Only: These respondents were auto-enrolled in their program/benefit and made no additional contact with Service Canada.
Mail Only: These were respondents who only contact Service Canada by mail at every stage, making no use of the online, in person, or telephone services.
Touchless Person-to-Person: These respondents used an online application and had a service interaction with eServiceCanada at any point (no in-person at any point).
Service Levels by Stage in the Client Journey: Overall
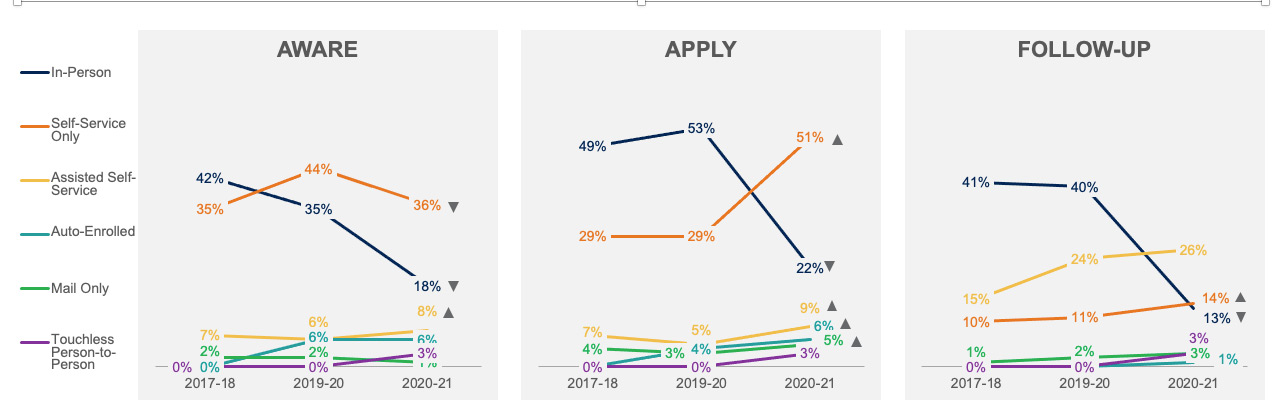
In person use significantly declined at all stages of the client journey, while self-service increased at the apply and follow-up stage. Clients were also more likely to have used assisted-self-service at the aware and apply stage, mail only at the apply stage or to be auto-enrolled at the apply stage.
Figure long description
Service Levels by Stage in the Client Journey: Overall
Aware
In-person at any stage: 42%, 2017-18; 35%, 2019-20; 18%, 2020-21 significantly lower than previous wave
Proportion who completed the client journey using only self-service (without assistance by phone or in-person): 34%
Proportion who used high-touch service (in-person and may have used other channels) at some point in the client journey: 30%
Columns may not add to 100% due to rounding and not all clients choosing to follow-up
* It should be noted that there was missing data for contact by auto-enrolled clients in the baseline survey
Note: In 2018-19 the channel use question was asked once at the beginning of the survey and pertaining to the apply stage. Caution should be used in making comparisons between years at the apply stage.
Base 2020-21 :Total : AWARE (n=4200), APPLY (4200), FOLLOW-UP (1208)
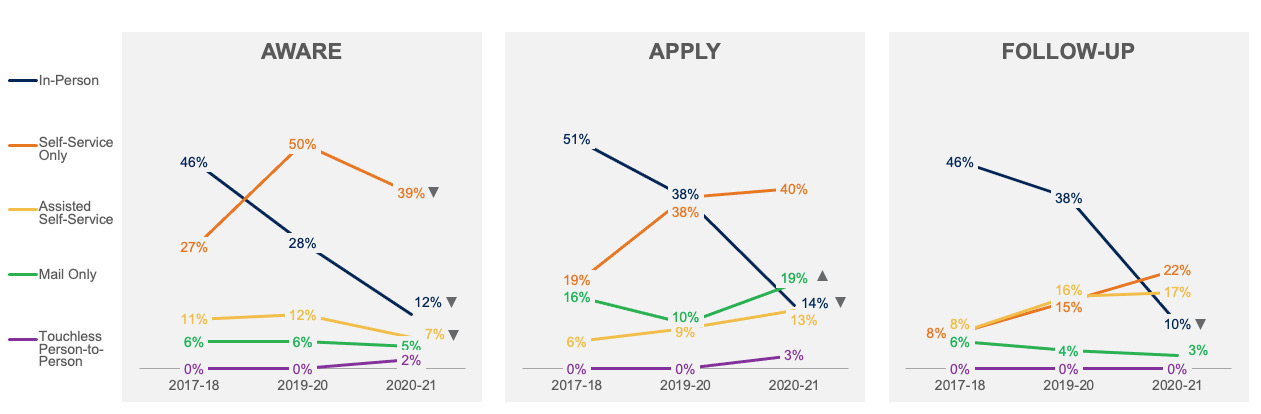
Service Levels by Stage in the Client Journey: EI
EI clients were less likely to have used in person service at all stages and were more likely to have used self-service only at the apply and follow-up stages. EI clients were also more likely to have used assisted self-service at the aware or apply stages.
Figure long description
Service Levels by Stage in the Client Journey: EI
Aware
In-person at any stage: 35%, 2017-18; 34%, 2019-20; 10%, 2020-21 significantly lower than previous wave
Proportion who completed the client journey using only self-service (without assistance by phone or in-person): 51%
Proportion who used high-touch service (in-person and may have used other channels) at some point in the client journey:15%
Columns may not add to 100% due to rounding and not all clients choosing to follow-up
Note: In 2018-19 the channel use question was asked once at the beginning of the survey and pertaining to the apply stage. Caution should be used in making comparisons between years at the apply stage.
Base 2020-21 :EI : AWARE (n=1162), APPLY (1162), FOLLOW-UP (425)
Service Levels by Stage in the Client Journey: CPP
CPP clients were less likely to use in-person service at all stages of the client journey and were more likely to utilize mail at the apply stage (returning to levels seen in the baseline wave).
Figure long description
Service Levels by Stage in the Client Journey: CPP
Aware
In-person at any stage: 46%, 2017-18; 28%, 2019-20; 12%, 2020-21, significantly lower than previous wave
Proportion who completed the client journey using only self-service (without assistance by phone or in-person): 31%
Proportion who used high-touch service (in-person and may have used other channels) at some point in the client journey: 20%
Columns may not add to 100% due to rounding and not all clients choosing to follow-up
Note: In 2018-19 the channel use question was asked once at the beginning of the survey and pertaining to the apply stage. Caution should be used in making comparisons between years at the apply stage.
Base 2020-21 :CPP : AWARE (n=752), APPLY (752), FOLLOW-UP (169)
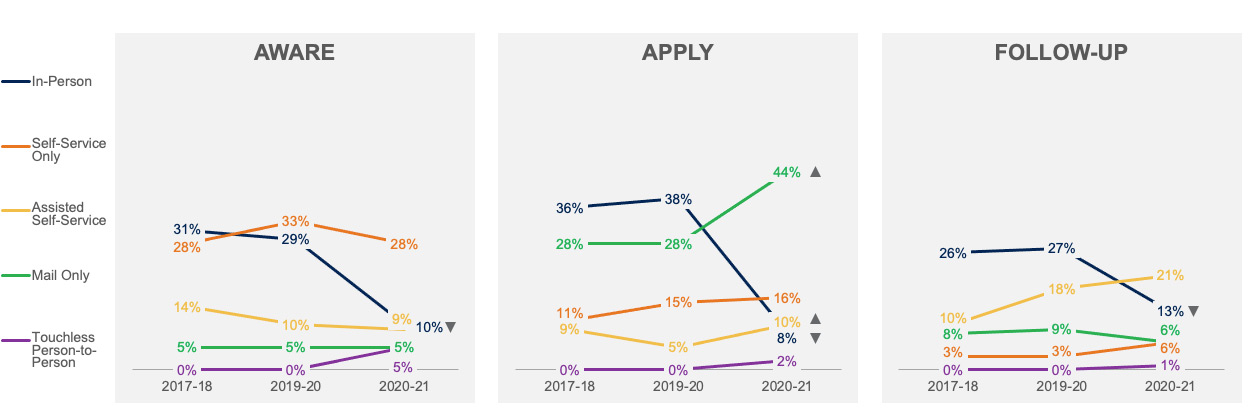
Service Levels by Stage in the Client Journey: CPP-D
CPP-D clients were less likely to have used in-person service at any stage and were more likely to have used mail only or assisted self service at the apply stage.
Figure long description
Service Levels by Stage in the Client Journey: CPP-D
Aware
In-person at any stage: 31%, 2017-18; 29%, 2019-20; 10%, 2020-21, significantly lower than previous wave
Proportion who completed the client journey using only self-service (without assistance by phone or in-person): 9%
Proportion who used high-touch service (in-person and may have used other channels) at some point in the client journey: 18%
Columns may not add to 100% due to rounding and not all clients choosing to follow-up
Note: In 2018-19 the channel use question was asked once at the beginning of the survey and pertaining to the apply stage. Caution should be used in making comparisons between years at the apply stage.
Base 2020-21 :CPP-D : AWARE (n=692), APPLY (692), FOLLOW-UP (264)
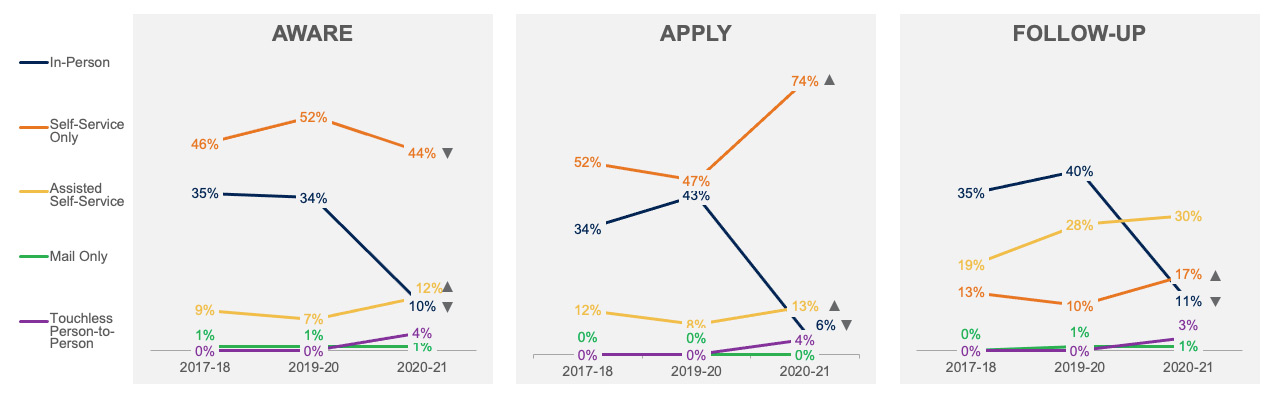
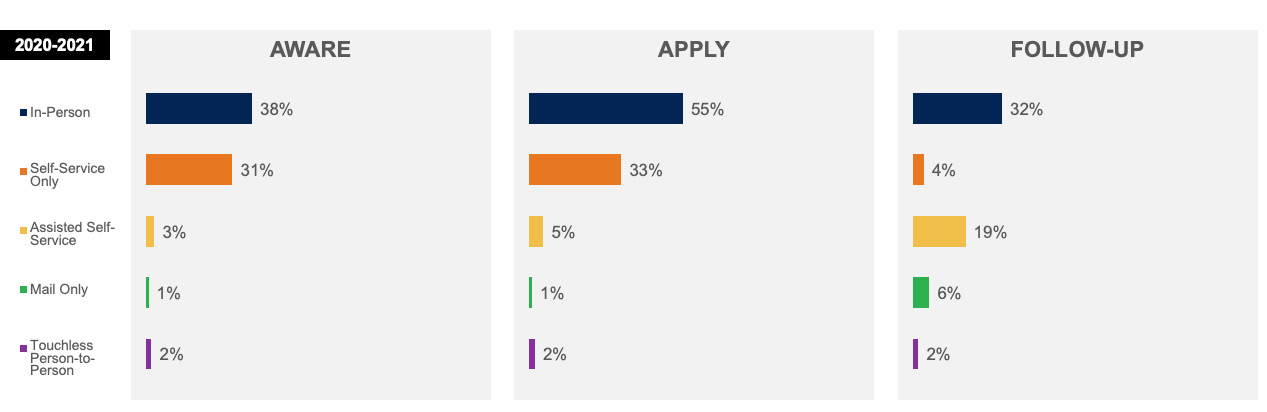
Service Levels by Stage in the Client Journey: SIN
In person was the preferred service for SIN clients at all stages of the client journey, followed by self-service only at the aware and apply stages and assisted self-service at the follow-up stage. Few SIN clients used other service levels.
Figure long description
Service Levels by Stage in the Client Journey: SIN
Aware:
In-Person, 38%
Self-Service Only, 31%
Assisted Self-Service, 3%
Mail only, 1%
Touchless Person-to-Person, 2%
Apply:
In-Person, 55%
Self-Service Only, 33%
Assisted Self-Service, 5%
Mail only, 1%
Touchless Person-to-Person, 2%
Follow-up:
In-Person, 32%
Self-Service Only, 4%
Assisted Self-Service, 19%
Mail only, 6%
Touchless Person-to-Person, 2%
Proportion who completed the client journey using only self-service (without assistance by phone or in-person): 20%
Proportion who used high-touch service (in-person and may have used other channels) at some point in the client journey: 66%
Note: Service levels were not reported for SIN clients in previous years due to differences in service delivery and results are only shown for 2020-21.
Columns may not add to 100% due to rounding and not all clients choosing to follow-up
Base 2020-21 :SIN : AWARE (n=749), APPLY (749), FOLLOW-UP (108)
Service Levels by Stage in the Client Journey: OAS/GIS
OAS/GIS clients were more likely to have been auto-enrolled or to have used mail only or self-service only at the apply stages, while fewer used in person service. OAS/GIS clients were more likely to have used of assisted self-service at the follow up stage, while considerably fewer used in person service or self-service only.
Figure long description
Service Levels by Stage in the Client Journey: OAS/GIS
Aware
In-person at any stage: 19%, 2017-18; 12%, 2019-20; 9%, 2020-21
Proportion who completed the client journey using only self-service (without assistance by phone or in-person): 9%
Proportion who used high-touch service (in-person and may have used other channels) at some point in the client journey: 14%
Columns may not add to 100% due to rounding and not all clients choosing to follow-up
* It should be noted that there was missing data for contact by auto-enrolled clients in the baseline survey
Base 2020-21 :OAS/GIS : AWARE (n=845), APPLY (845), FOLLOW-UP (242)
Note: In 2018-19 the channel use question was asked once at the beginning of the survey and pertaining to the apply stage. Caution should be used in making comparisons between years at the apply stage.
Prevalence of Receiving EI E-mail or CPP-D Proactive Call (Reported)
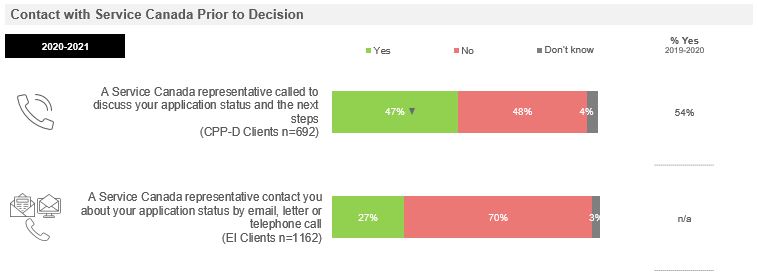
Less than half (47%) of CPP-D clients received a call from Service Canada to discuss their application status and next steps prior to receiving a decision, lower than the previous year.
Three in ten (27%) EI clients received a letter, email, or telephone call from Service Canada about their application status prior to receiving a decision.
Figure long description
Contact with Service Canada Prior to Decision
Icon of a phone, A Service Canada representative call to discuss your application status and the next steps (CPP-D clients n=692): 47% Yes, significantly lower than previous wave; 48% No; 4% Don't know; %Yes 2019-20, 54%
Icon of a letter in an envelope and a phone, Service Canada representative contact you about your application status by email, letter, or telephone call (EI Clients n=1162): 27% Yes, 70% No, 3% Don't know; % Yes 2019-20, n/a
Q20bx. Before you received a decision about your application to [ABBREV], did…Base: CPP-D or EI Clients (n= varies).
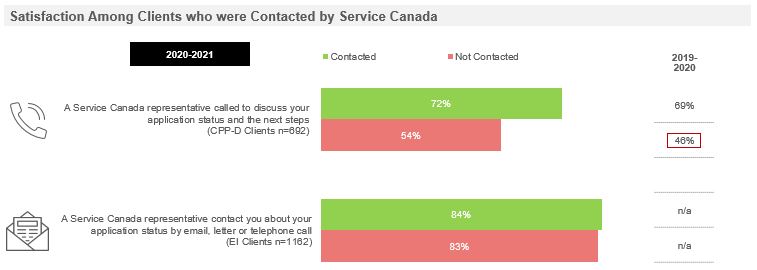
Impact of Receiving EI E-mail or CPP-D Proactive Call on Satisfaction
Satisfaction was significantly higher among CPP-D clients who were contacted by Service Canada before receiving a decision, compared to those who were not. For EI clients, contact by Service Canada did not make a significant different in their satisfaction.
Figure long description
Satisfaction Among Clients who were Contacted by Service Canada
A Service Canada representative call to discuss your application status and the next steps (CPP-D clients who received a call n=225):
A Service Canada representative contact you about your application status by email, letter, or telephone call (EI clients who received a letter n=1162):
2020-21: 84% Contacted, 82% Not contacted;
2019-20: n/a contacted, m/a not contacted
Q20bx. Before you received a decision about your application to [ABBREV], did…Base: CPP-D or EI Clients (n= varies).
Channel Use by Stage and Program
Qualitative Insights on Client Journey
Many clients participating in groups or interviews mentioned that they go first to the government website to get information. The online channel is the preferred source for “official” information, although there were other non-government websites mentioned by a few. Some mentioned that the government website was difficult to navigate and they were not able to find the information they were looking for, that it took a long time to find, or that it was difficult to find the application for the program within the site.
Amongst those who called Service Canada or the program call centre, they did so at the point when they needed a question answered that they could not find online. It was rare to call Service Canada from the outset for the purpose of gathering information. When asked which number they called, some struggled to remember whether it was 1 800 O-Canada or the program call centre, and a few also thought they might be thinking of calls they made to the CRA.
Historically, government websites are not the easiest ones to navigate. You can pretty much anybody I ever question on this agrees, they can be fairly difficult, moving from one segment to another. But the information is all there. You just got to follow the steps to make sure that you don’t end up going around in a circle. It’s all there. If you want to rate the government website on a scale of 1 to 10 on user-friendly, they really are about a 3 or a 4…I have no trouble at all with some websites, because they’re constructed properly, and then the government ones have so many checks and balances I think, that it kind of weighs them down on their user-friendly aspect. I do understand that part too, because they have to be super secure, and you don’t want them crashing. Anyways, that’s hopped on a different tangent there anyways, but yeah, no, the information is all there when you go to look, it’s just sometimes the information can be difficult to access.
I applied through online, but somebody did walk me through over the phone, because I really needed to understand what I’m doing, and how I need to approach it. They did help me a great deal to understand why is it so important for me to do what I need to do. Through online, if I did it by myself, I wouldn't have had any idea why is it so important to do it this way or that way. They were really patient with me, and they helped me walk through really nicely. I was really pleased with the service that way.
I did call the 800 number. It was helpful, gave me an idea when things were gonna happen and eventually when I was...found out I was accepted, that...and it was just a matter of waiting until the end of February.
Channel Use: Overall
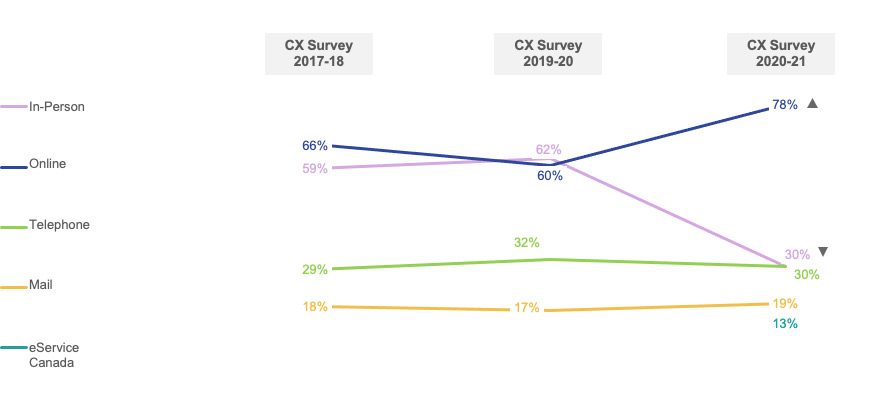
Across all stages of the client journey, nearly seven in ten (78%) client used the online channel at some point, while three in ten used either in-person or telephone (30% for both). Two in ten (19%) used mail and around one in ten (13%) eService Canada at some point during their client journey.
Use of the in-person channel declined, while use of the online channel increased.
Figure long description
Channel Use: Overall
In-person
2017-18, 59%
2019-20, 62%
2020-21, 30%, significantly lower than previous wave
Online
2017-18, 66%
2019-20, 60%
2020-21, 78%, significantly higher than previous wave
Use of the in-person channel declined at all stages of the client journey, while use of the online channel increased at the apply and follow-up stage. Clients were also more likely to have used mail at the aware stage.
Figure long description
Channel Use by Stage: Overall
Aware
In person
2017-18, 37%
2018-19, 47%
2020-21, 24%, significantly lower than previous wave
Online
2017-18, 54%
2019-20, 58%
2020-21, 75%, significantly higher than previous wave
Telephone
2017-18, 21%
2019-20, 15%
2020-21, 16%
Mail
2017-18, 13%
2019-20, 10%
2020-21, 14%, significantly higher than previous wave
eServiceCanada
2020-21, 6%
Apply
In person
2017-18, 37%
2018-19, 59%
2020-21, 24%, significantly lower than previous wave
Online
2017-18, 72%
2019-20, 48%
2020-21, 72%, significantly higher than previous wave
Telephone
2017-18, 21%
2019-20, 13%
2020-21, 13%
Mail
2017-18, 14%
2019-20, 10%
2020-21, 11%
eServiceCanada
2020-21, 5%
Follow-up
In person
2017-18, 36%
2018-19, 40%
2020-21, 13%, significantly lower than previous wave
Channel Use at Aware Stage: Overall and by Program
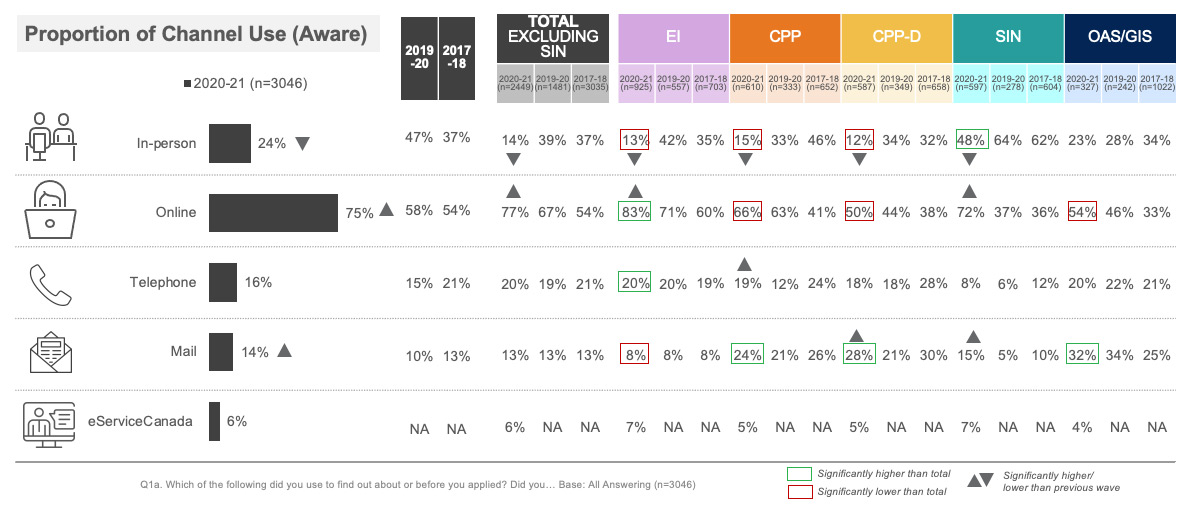
Clients continued to be most likely to use online government sources to find out about the program they applied for and were more likely to have done so than in the previous year. In-person was the second most commonly used source at the aware stage, although this channel has declined year over year.
Compared to 2019-20, use of the in-person channel declined for all programs except OAS/GIS, while use of online increased for EI and SIN clients.
EI clients were more likely to use online and telephone compared to all clients, SIN clients were more likely to use the in-person channel and CPP, CPP-D and OAS/GIS clients to use the mail channel.
Figure long description
Proportion of Channel Use (Aware)
In-person
total
2020-21, n=3046, 24%, significantly lower than previous wave
2019-20, 47%
2017-18, 37%
Total Excluding SIN
2020-21, n=2449, 14%, significantly lower than previous wave
2019 – 20, n=1481, 39%
2017 – 18, n=3035, 37%
EI
2020-21, n=925, 13%, significantly lower than previous wave, significantly lower than total
2019 – 20, n=557, 42%
2017 – 18, n=703, 35%
CPP
2020-21, n=610, 15%, significantly lower than previous waves, significantly lower than total
2019 – 20, n=333, 33%
2017 – 18, n=652, 46%
CPP-D
2020-21, n=587, 12%, significantly lower than previous wave, significantly lower than total
2019 – 20, n=349, 34%
2017 – 18, n=658, 32%
SIN
2020-21, n=597, 48%, significantly lower than previous wave, significantly lower than total
2019 – 20, n=278, 64%
2017 – 18, n=604, 62%
OAS/GIS
2020-21, n=327, 23%
2019 – 20, n=242, 28%
2017 – 18, n=1022, 34%
Online
total
2020-21, 75%, significantly lower than previous wave
2019-20, 58%
2017-18, 54%
Total Excluding SIN
2020-21, n=2449, 77%, significantly lower than previous wave
2019 – 20, n=1481, 67%
2017 – 18, n=3035, 54%
EI
2020-21, n=925, 83%, significantly higher than previous wave, significantly higher than total
2019 – 20, n=557, 71%
2017 – 18, n=703, 60%
CPP
2020-21, n=610, 66%, significantly lower than total
2019 – 20, n=333, 63%
2017 – 18, n=652, 41%
CPP-D
2020-21, n=587, 50%, significantly lower than total
2019 – 20, n=349, 44%
2017 – 18, n=658, 38%
SIN
2020-21, n=597, 72%, significantly lower than previous wave
2019 – 20, n=278, 37%
2017 – 18, n=604, 36%
OAS/GIS
2020-21, n=327, 54%, significantly lower than the total
2019 – 20, n=242, 46%
2017 – 18, n=1022, 33%
Telephone
total
2020-21, 16%
2019-20, 15%
2017-18, 21%
Total Excluding SIN
2020-21, n=2449, 20%,
2019 – 20, n=1481, 19%
2017 – 18, n=3035, 21%
EI
2020-21, n=925, 20%, significantly higher than total
2019 – 20, n=557, 20%
2017 – 18, n=703, 19%
CPP
2020-21, n=610, 19%, significantly higher than previous wave
2019 – 20, n=333, 12%
2017 – 18, n=652, 24%
CPP-D
2020-21, n=587, 18%
2019 – 20, n=349, 18%
2017 – 18, n=658, 28%
SIN
2020-21, n=597, 8%
2019 – 20, n=278, 6%
2017 – 18, n=604, 12%
OAS/GIS
2020-21, n=327, 20%
2019 – 20, n=242, 22%
2017 – 18, n=1022, 21%
Mail
total
2020-21, 14%, significantly higher than previous wave
2019-20, 10%
2017-18, 13%
Total Excluding SIN
2020-21, n=2449, 13%
2019 – 20, n=1481, 13%
2017 – 18, n=3035, 13%
EI
2020-21, n=925, 8%, significantly lower than total
2019 – 20, n=557, 8%
2017 – 18, n=703, 8%
CPP
2020-21, n=610, 24%, significantly higher than total
2019 – 20, n=333, 21%
2017 – 18, n=652, 26%
CPP-D
2020-21, n=587, 28%, significantly higher than previous wave, significantly higher than total
2019 – 20, n=349, 21%
2017 – 18, n=658, 30%
SIN
2020-21, n=597, 15%, significantly higher than previous wave
2019 – 20, n=278, 5%
2017 – 18, n=604, 10%
OAS/GIS
2020-21, n=327, 32%, significantly higher than the total
2019 – 20, n=242, 34%
2017 – 18, n=1022, 25%
eServiceCanada
total
2020-21, 6%
2019-20, n/a
2017-18, n/a
Total Excluding SIN
2020-21, n=2449, 6%
2019 – 20, n=1481, n/a
2017 – 18, n=3035, n/a
EI
2020-21, n=925, 7%
2019 – 20, n=557, n/a
2017 – 18, n=703, n/a
CPP
2020-21, n=610, 5%,
2019 – 20, n=333, n/a
2017 – 18, n=652, n/a
CPP-D
2020-21, n=587, 5%
2019 – 20, n=349, n/a
2017 – 18, n=658, n/a
SIN
2020-21, n=597, 7%
2019 – 20, n=278, n/a
2017 – 18, n=604, n/a
OAS/GIS
2020-21, n=327, 4%
2019 – 20, n=242, n/a
2017 – 18, n=1022, n/a
Q1a. Which of the following did you use to find out about or before you applied? Did you… Base: All Answering (n=3046)
Channel Use at Apply Stage: Overall and by Program
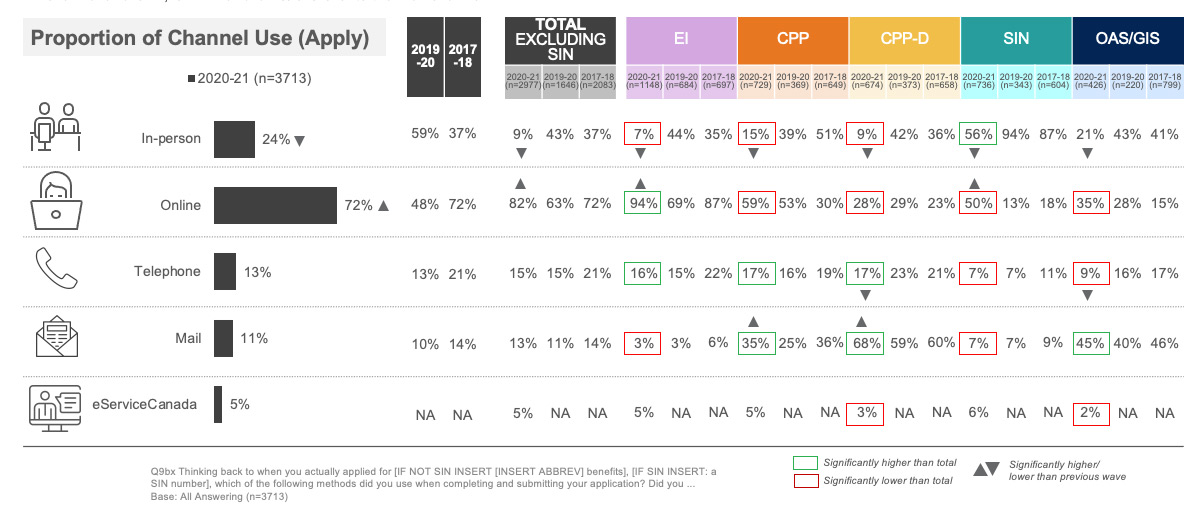
Clients were most likely to use the online channel when applying and were considerably more likely to do so than in 2019-20. The in-person channel was the next most used and experienced a significant decrease in usage from the year previous. One in ten used the telephone or mail channel at the application stage, while 5% used eServiceCanada. Compared to 2019-20, use of the in-person channel declined for all programs. EI clients and SIN clients were more likely to use the online channel, CPP and CPP-D the mail channel, while CPP-D and OAS/GIS clients were less likely to have used the telephone channel.
EI clients were more likely to have used the online channel compared to all clients, SIN clients the in-person channel, EI, CPP and CPP-D clients the telephone channel and CPP, CPP-D and OAS/GIS clients the mail channel.
Figure long description
Proportion of Channel Use (Apply)
Sample size
Total
2020-21, 2977
2019-20, 1646
2017-18, 2083
EI
2020-21, 1148
2019-20, 684
2017-18, 697
CPP
2020-21, 729
2019-20, 369
2017-18, 649
CPP-D
2020-21, 674
2019-20, 372
2017-18, 658
SIN
2020-21, 736
2019-20, 343
2017-18, 604
OAS/GIS
2020-21, 426
2019-20, 220
2017-18, 799
In-person
total
2020-21, 24%, significantly lower than previous wave
2019-20, 59%
2017-18, 37%
Total Excluding SIN
2020-21, 9%, significantly lower than previous wave
2019 – 20, 43%
2017 – 18, 37%
EI
2020-21, 7%, significantly lower than previous wave, significantly lower than total
2019 – 20, 44%
2017 – 18, 35%
CPP
2020-21, 15%, significantly lower than previous wave, significantly lower than total
2019 – 20, 39%
2017 – 18, 51%
CPP-D
2020-21, 9%, significantly lower than previous wave, significantly lower than total
2019 – 20, 42%
2017 – 18, 36%
SIN
2020-21, 56%, significantly higher than previous wave, significantly higher than total
2019 – 20, 94%
2017 – 18, 87%
OAS/GIS
2020-21, 21%, significantly lower than previous wave
2019 – 20, 43%
2017 – 18, 41%
Online
total
2020-21, 72%, significantly higher than previous wave
2019-20, 48%
2017-18, 72%
Total Excluding SIN
2020-21, 82%, significantly higher than previous wave
2019 – 20, 63%
2017 – 18, 72%
EI
2020-21, 94%, significantly higher than previous wave, significantly higher than total
2019 – 20, 69%
2017 – 18, 87%
CPP
2020-21, 59%, significantly lower than total
2019 – 20, 53%
2017 – 18, 30%
CPP-D
2020-21, 28%, significantly lower than total
2019 – 20, 29%
2017 – 18, 23%
SIN
2020-21, 50%, significantly lower than previous wave, significantly lower than the total
2019 – 20, 13%
2017 – 18, 18%
OAS/GIS
2020-21, 35%, significantly lower than the total
2019 – 20, 28%
2017 – 18, 15%
Telephone
total
2020-21, 13%
2019-20, 13%
2017-18, 21%
Total Excluding SIN
2020-21, 15%,
2019 – 20, 15%
2017 – 18, 21%
EI
2020-21, 16%, significantly higher than the total
2019 – 20, 15%
2017 – 18, 22%
CPP
2020-21, 17%, significantly higher than total
2019 – 20, 16%
2017 – 18, 19%
CPP-D
2020-21, 17%, significantly higher than total
2019 – 20, 23%
2017 – 18, 21%
SIN
2020-21, 7%, significantly lower than total
2019 – 20, 7%
2017 – 18, 11%
OAS/GIS
2020-21, 9%
2019 – 20, 16%
2017 – 18, 17%
Mail
total
2020-21, 11%
2019-20, 10%
2017-18, 14%
Total Excluding SIN
2020-21, 13%
2019 – 20, 11%
2017 – 18, 14%
EI
2020-21, 3%, significantly lower than total
2019 – 20, 3%
2017 – 18, 6%
CPP
2020-21, 35%, significantly higher than total, significantly higher than previous wave
2019 – 20, 25%
2017 – 18, 36%
CPP-D
2020-21, 68%, significantly higher than previous wave, significantly higher than total
2019 – 20, 59%
2017 – 18, 60%
SIN
2020-21, 7%, significantly lower than previous waves
2019 – 20, 7%
2017 – 18, 9%
OAS/GIS
2020-21, 45%, significantly higher than the total
2019 – 20, 40%
2017 – 18, 46%
eServiceCanada
total
2020-21, 5%
2019-20, n/a
2017-18, n/a
Total Excluding SIN
2020-21, 5%
2019 – 20, n/a
2017 – 18, n/a
EI
2020-21, 5%
2019 – 20, n/a
2017 – 18, n/a
CPP
2020-21, 5%,
2019 – 20, n/a
2017 – 18, n/a
CPP-D
2020-21, 3%, significantly lower than the total
2019 – 20, n/a
2017 – 18, n/a
SIN
2020-21, 6%
2019 – 20, n/a
2017 – 18, n/a
OAS/GIS
2020-21, 2%
2019 – 20, n/a
2017 – 18, n/a
Q9bx Thinking back to when you actually applied for [IF NOT SIN INSERT [INSERT ABBREV] benefits], [IF SIN INSERT: a SIN number], which of the following methods did you use when completing and submitting your application? Did you ...
Base: All Answering (n=3713)
Channel Use at Follow Up Stage: Overall and by Program
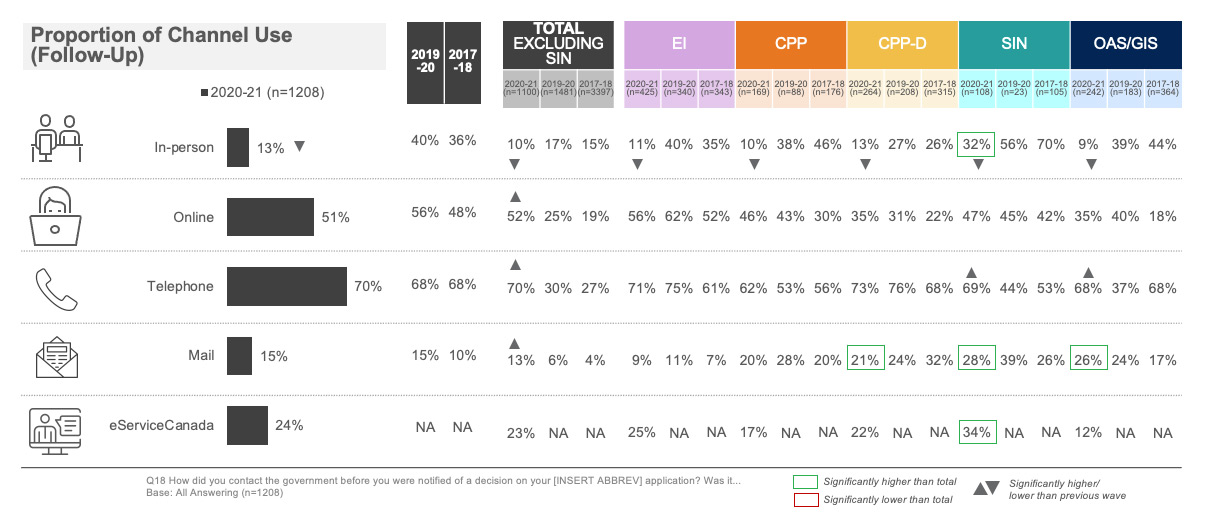
Clients continued to be most likely to use the telephone channel when following up on their application, followed by half who used the online channel. One quarter of clients utilized the new eServiceCanada channel, followed by those who used the mail channel or in-person. The proportion of clients who used the in-person channel to follow-up declined compared to the previous year. Compared to 2019-20, clients from all programs were less likely to use the in-person channel, while SIN and OAS/GIS clients were more likely to have used the telephone channel.
SIN clients were more likely to have used the in person, mail or eServiceCanada channel compared to all clients, while CPP-D and OAS/GIS clients were more likely to have used the mail channel.
Figure long description
Proportion of Channel Use (Follow-up)
Sample size
Total
2020-21, 1208
Total excluding SIN
2020-21, 1100
2019-20, 1481
2017-18, 3397
EI
2020-21, 425
2019-20, 340
2017-18, 343
CPP
2020-21, 169
2019-20, 88
2017-18, 176
CPP-D
2020-21, 264
2019-20, 208
2017-18, 315
SIN
2020-21, 108
2019-20, 23
2017-18, 105
OAS/GIS
2020-21, 242
2019-20, 183
2017-18, 364
In-person
total
2020-21, 13%, significantly lower than previous wave
2019-20, 40%
2017-18, 36%
Total Excluding SIN
2020-21, 10%, significantly lower than previous wave
2019 – 20, 17%
2017 – 18, 15%
EI
2020-21, 11%
2019 – 20, 40%
2017 – 18, 35%
CPP
2020-21, 10%, significantly lower than previous waves
2019 – 20, 38%
2017 – 18, 46%
CPP-D
2020-21, 13%, significantly lower than previous waves
2019 – 20, 27%
2017 – 18, 26%
SIN
2020-21, 32%, significantly higher than previous waves, significantly higher than total
2019 – 20, 56%
2017 – 18, 70%
OAS/GIS
2020-21, 9%, significantly lower than previous waves
2019 – 20, 39%
2017 – 18, 44%
Online
total
2020-21, 51%
2019-20, 56%
2017-18, 48%
Total Excluding SIN
2020-21, 52%, significantly higher than previous wave
2019 – 20, 25%
2017 – 18, 19%
EI
2020-21, 56%
2019 – 20, 62%
2017 – 18, 52%
CPP
2020-21, 46%
2019 – 20, 43%
2017 – 18, 30%
CPP-D
2020-21, 35%
2019 – 20, 31%
2017 – 18, 22%
SIN
2020-21, 47%
2019 – 20, 45%
2017 – 18, 42%
OAS/GIS
2020-21, 35%
2019 – 20, 40%
2017 – 18, 18%
Telephone
total
2020-21, 70%
2019-20, 68%
2017-18, 68%
Total Excluding SIN
2020-21, 70%, significantly higher than previous wave
2019 – 20, 30%
2017 – 18, 27%
EI
2020-21, 71%
2019 – 20, 75%
2017 – 18, 61%
CPP
2020-21, 62%
2019 – 20, 53%
2017 – 18, 56%
CPP-D
2020-21, 73%
2019 – 20, 76%
2017 – 18, 68%
SIN
2020-21, 69%, significantly higher than previous wave
2019 – 20, 44%
2017 – 18, 53%
OAS/GIS
2020-21, 68%, significantly higher than previous wave
2019 – 20, 37%
2017 – 18, 68%
Mail
total
2020-21, 15%
2019-20, 15%
2017-18, 10%
Total Excluding SIN
2020-21, 13%, significantly higher than previous wave
2019 – 20, 6%
2017 – 18, 4%
EI
2020-21, 9%
2019 – 20, 11%
2017 – 18, 7%
CPP
2020-21, 20%
2019 – 20, 28%
2017 – 18, 20%
CPP-D
2020-21, 21%, significantly higher than total
2019 – 20, 24%
2017 – 18, 32%
SIN
2020-21, 28%, significantly higher than total
2019 – 20, 39%
2017 – 18, 26%
OAS/GIS
2020-21, 26%, significantly higher than the total
2019 – 20, 24%
2017 – 18, 17%
eServiceCanada
total
2020-21, 24%
2019-20, n/a
2017-18, n/a
Total Excluding SIN
2020-21, 23%
2019 – 20, n/a
2017 – 18, n/a
EI
2020-21, 25%
2019 – 20, n/a
2017 – 18, n/a
CPP
2020-21, 17%,
2019 – 20, n/a
2017 – 18, n/a
CPP-D
2020-21, 22%
2019 – 20, n/a
2017 – 18, n/a
SIN
2020-21, 34%, significantly higher than the total
2019 – 20, n/a
2017 – 18, n/a
OAS/GIS
2020-21, 12%
2019 – 20, n/a
2017 – 18, n/a
Q18 How did you contact the government before you were notified of a decision on your [INSERT ABBREV] application? Was it...
Base: All Answering (n=1208)
Sequence of Channel Use
Multi-Channel Use: Online Channel Usage In-Depth
Clients most often used the online channel first at the aware and apply stages. Online contact is the second most used option at follow-up.
Year over year, clients were more likely to have used online first at the aware and apply stages. There was also a decline among those who used in-person as a first, second or third points of contact at all stages.
Figure long description
Multi-Channel Use: Online Channel Usage In-Depth
Aware
First channel
Telephone, 5%
Online, 57%, significantly higher than previous wave
In-person, 12%, significantly lower than previous wave
Second channel
online to telephone, 12%
Online to in-person, 10%, significantly lower than previous wave
Third channel
Telephone to in-person, 9%, significantly lower than previous wave
In-person to telephone, 9%
Apply
First channel
Telephone, 3%
Online, 58%, significantly higher than previous wave
In-person, 19%, significantly lower than previous wave
Second channel
online to telephone, 11%
Online to in-person, 3%, significantly lower than previous wave
Third channel
Telephone to in-person, 8%, significantly lower than previous wave
In-person to telephone, 16%
Follow-up
First channel
Telephone, 42%, significantly higher than previous wave
Online, 37%
In-person, 4%, significantly lower than previous wave
Second channel
online to telephone, 44%
Online to in-person, 4%, significantly lower than previous wave
Third channel
Telephone to in-person, 12%
In-person to telephone, 18%
Multi-channel Use: Online Channel Usage In-Depth
Aware:
2019-20
First channel, 5% phone, 42% online, 28% In-person;
Second channel, 12% phone, 19% in-person;
third channel, 21% in-person, 7% phone
2017 - 18
First channel, 7% phone, 43% online, 31% In-person;
Second channel, 14% phone, 18% in-person;
third channel, 25% in-person, 19% phone
Apply:
2019-20
First channel, 2% phone, 41% online, 49% In-person;
Second channel, 12% phone, 11% in-person;
third channel, 16% in-person, 18% phone
2017-18
First channel, 6% phone, 44% online, 40% In-person;
Second channel, 13% phone, 14% in-person;
third channel, 21% in-person, 18% phone
Follow-up:
2019-20
First channel, 36% phone, 39% online, 18% In-person;
Second channel, 49% phone, 15% in-person;
third channel, 18% in-person, 13% phone
2017-18
First channel, 38% phone, 32% online, 24% In-person;
Second channel, 44% phone, 16% in-person;
third channel, 18% in-person, 22% phone
Multi-Channel Use: In Person Channel Usage In-Depth
In-person was the second most used channel as a first point of contact at the aware or apply stage and among the least used as a first point of contact at the follow-up stage. Among those who used in-person first, clients were more likely to have used online as a second channel at all stages.
Year over year, clients were less likely to have used the in-person channel as a first point of contact at all stages, while use of online as a second point of contact during the aware stage has increased and use of the telephone channel as a second point of contact at the apply or follow up stage has declined and as a third point of contact at the aware or apply stages after using the online channel.
Figure long description
Multi-Channel Use: In Person Channel Usage In-Depth
Aware
First channel
Telephone, 5%
Online, 12%, significantly lower than previous wave
In-person, 57%, significantly higher than previous wave
Second channel
in person to telephone, 7%
In-person to online, 22%, significantly higher than previous wave
Third channel
Telephone to online, 7%
online to telephone, 6%, significantly lower than previous wave
Apply
First channel
Telephone, 3%
Online, 19%, significantly lower than previous wave
In-person, 68%, significantly higher than previous wave
Second channel
In-person to telephone, 2%
In-person to online, 8%
Third channel
Telephone to online, 1%
online to telephone, 9%, significantly lower than previous wave
Follow-up
First channel
Telephone, 42%, significantly higher than previous wave
Online, 37%
In-person, 4%, significantly lower than previous wave
Second channel
In-person to telephone, 23%
In-person to online, 27%, significantly lower than previous wave
Third channel
Telephone to online, 4%
Online to telephone, 16%
Multi-channel Use: Online Channel Usage In-Depth
Aware:
2019-20
First channel, 5% phone, 43% online, 28% In-person;
Second channel, 12% phone, 19% in-person;
third channel, 21% in-person, 7% phone
2017 - 18
First channel, 7% phone, 43% online, 31% In-person;
Second channel, 14% phone, 18% in-person;
third channel, 25% in-person, 19% phone
Apply:
2019-20
First channel, 2% phone, 41% online, 49% In-person;
Second channel, 12% phone, 11% in-person;
third channel, 16% in-person, 18% phone
2017-18
First channel, 6% phone, 44% online, 40% In-person;
Second channel, 13% phone, 14% in-person;
third channel, 21% in-person, 18% phone
Follow-up:
2019-20
First channel, 36% phone, 39% online, 18% In-person;
Second channel, 49% phone, 15% in-person;
third channel, 18% in-person, 13% phone
2017-18
First channel, 38% phone, 32% online, 24% In-person;
Telephone continues to be the least used channel for the first point of contact at the aware and apply stages and the most common used first channel at the follow-up stage. Among those who used telephone first, clients were more likely to use the online channel as a second channel at all stages.
Year over year, clients were more likely to have used the telephone channel first at the follow-up stage. Among those who used telephone first, clients were more likely to use online at the aware stage as a second channel and less likely at the follow-up stage. Fewer used in-person as a second or third channel at any stage.
First channel, 42% online, 5% telephone, 28% in-person;
Second channel, 16% online, 30% in-person;
third channel, 6% in-person, 5% online
2017 - 18
First channel, 43% online, 7% telephone, 31% in-person;
Second channel, 23% online, 19% in-person;
third channel, 20% in-person, 3% online
Apply:
2019-20
First channel, 41% online, 2% telephone, 49% in-person;
Second channel, 29% online, 27% in-person;
third channel, 14% in-person, 4% online
2017-18
First channel, 44% online, 6% telephone, 40% in-person;
Second channel, 30% online, 33% in-person;
third channel, 10%, 6% online
Follow-up:
2019-20
First channel, 39% online, 36% telephone, 18% in-person;
Second channel, 22% online, 25% in-person;
third channel, 10% in-person, 6% online
2017-18
First channel, 32% online, 38% telephone, 24% in-person;
Second channel, 14% online, 14% in-person;
third channel, 19% in-person, 11% online
Reason for Follow-up
Fewer clients followed up with Service Canada for any reason before receiving a decision compared to 2019-20. Among those who did, the primary reason was to check on the status of their application/payment, and, to a lesser extent to provide additional information. Notably, clients who did not follow-up had higher overall satisfaction than clients who followed up for any reason (88% satisfied those who did not follow up vs. 76% among those who did).
EI or CPP-D clients were more likely to follow-up than clients of other programs, while OAS/GIS clients were less likely.
Compared to 2017-18 CPP-D and CPP clients were less likely to have followed-up.
Overall, more than four in ten clients used one channel during their client journey, followed by three in ten who used two, around one in ten who used three and 6% who used 4 or more. EI clients were more likely to have used only one channel, OAS/GIS clients used no channels (auto-enrolled), while CPP-D clients were more likely to have used two or more channels.
Clients who utilized more channels, in particular 3 or more, had lower overall satisfaction with their service experience than those who used fewer channels. This finding is consistent with previous years where analysis was conducted by the number of contacts clients had with Service Canada which demonstrated that a greater number of contacts results in lower satisfaction.
Figure long description
Proportions Overall and by Program
Total, n=4200
No channels, 6%
1 channel, 44%
2 channels, 30%
4 channels ,13%
+4 channels, 6%
EI, n=1162
No channels, 1%
1 channel, 49%, significantly higher than total
2 channels, 30%
4 channels ,14%
+4 channels, 6%
CPP, n=752
No channels, 5%
1 channel, 41%
2 channels, 33%
4 channels ,13%
+4 channels, 7%
CPP-D n=692
No channels, 3%
1 channel, 32%, significantly lower than total
2 channels, 34%, significantly higher than total
4 channels ,20%, significantly higher than total
+4 channels, 10%, significantly higher than total
OAS/GIS, n=692
No channels, 43%, significantly higher than total
1 channel, 23%, significantly lower than total
2 channels, 24%, significantly lower than total
4 channels ,6%, significantly lower than total
+4 channels, 4%, significantly lower than total
SIN n=749
No channels, 1%
1 channel, 45%
2 channels, 32%
4 channels ,14%
+4 channels, 7%
Figure long description
Satisfaction by Number of channels used
Total, 86%
No channel, 88%
1 channel, 89%
2 channels, 85%
3 channels, 80%
+4 channels, 81%
Client Experience with Service Channels
Satisfaction by Service Channel
Satisfaction with in-person service remained the highest, followed by eServiceCanada, online, MSCA, 1 800 O-Canada and specialized call centres.
Compared to 2019-20, satisfaction increased among those who used online, 1800 O-Canada and specialized call centres.
Figure long description
Satisfaction with Service Channels (% Rated 4 or 5)
In-person
2017-18 (n=1324), 89%
2018-19 (n=2181), 87%
2019-20 (n=1235), 86%
2020-21 (n=1102), 86%
My Service Canada Account, new attribute added in 2019-20
2017-18 (n=n/a), n/a
2018-19 (n=n/a), n/a
2019-20 (n=576), 75%
2020-21 (n=848), 75%
Online
2017-18 (n=1089), 79%
2018-19 (n=2317), 79%
2019-20 (n=1227), 73%
2020-21 (n=2680), 78%, significantly higher than previous wave
1 800 O-Canada
2017-18 (n=n/a), n/a
2018-19 (n=561), 72%
2019-20 (n=221), 69%
2020-21 (n=315), 72%, significantly higher than previous wave
Specialized Call Centre, excludes SIN clients
2017-18 (n=511), 82%
2018-19 (n=855), 76%
2019-20 (n=642), 60%
2020-21 (n=1208), 72%, significantly higher than previous wave
eServiceCanada
2017-18 (n=n/a), n/a
2018-19 (n=n/a), n/a
2019-20 (n=n/a), n/a
2020-21 (n=455), 82%
Satisfaction by Service Channel
Satisfaction with in-person service remained the highest, followed by eServiceCanada, online, MSCA, 1 800 O-Canada and specialized call centres.
Compared to 2019-20, satisfaction increased among those who used online, 1 800 O-Canada and specialized call centres.
Trends over time indicate that the proportion of clients who were satisfied with each channel is consistent with the baseline year. The exception is clients who contacted specialised call centres. There were fewer clients satisfied than in previous years but considerable progress was made in 2020-21 to move towards baseline levels.
Q27. How satisfied were you with the overall quality of service you received from…?
Base: All Answering (n=varies)
*Excludes SIN clients ** New attribute added in 2019-20
Satisfaction with Service Channels by Program
Satisfaction with service channels differs by program: CPP-D clients rated their satisfaction with in-person service, MSCA, and online lower compared to all clients, while SIN clients provided higher ratings for in-person, online and 1 800 O-Canada. OAS/GIS clients rated their satisfaction with eServiceCanada lower than other clients.
Compared to 2019-20, EI clients provided higher ratings for online and specialized call centres, while CPP and OAS/GIS clients were more satisfied with the quality of service provided by specialized call centres.
Figure long description
Satisfaction with Service Channel
In-person
68% very satisfied, 18% Rated 4
Total (% Rated 4 or 5)
2020-21, 86%
2019-20, 86%
2018-19, 87%
2017-28, 89%
EI
2020-21, 77%
2019-20, 82%
2018-19, 80%
2017-28, 80%
CPP
2020-21, 83%
2019-20, 86%
2018-19, 90%
2017-28, 87%
CPP-D
2020-21, 64%, significantly lower than total
2019-20, 72%
2018-19, 68%
2017-28, 72%
SIN
2020-21, 91%, significantly higher than total
2019-20, 90%
2018-19, 94%
2017-28, 95%
OAS/GIS
2020-21, 84%
2019-20, 87%
2018-19, 84%
2017-28, 84%
My Service Canada Account
44% very satisfied, 31% Rated 4
Total (% Rated 4 or 5)
2020-21, 75%
2019-20, 75%
2018-19, n/a
2017-28, n/a
EI
2020-21, 76%
2019-20, 75%
2018-19, n/a
2017-28, n/a
CPP
2020-21, 74%
2019-20, 76%
2018-19, n/a
2017-28, n/a
CPP-D
2020-21, 52% significantly lower than total
2019-20, 59%
2018-19, n/a
2017-28, n/a
SIN
2020-21, 79%
2019-20, 84%
2018-19, n/a
2017-28, n/a
OAS/GIS
2020-21, 66%
2019-20, 75%
2018-19, n/a
2017-28, n/a
Online
47% very satisfied, 31% Rated 4
Total (% Rated 4 or 5)
2020-21, 78%, significantly higher than previous wave
2019-20, 73%
2018-19, 79%
2017-28, 79%
EI
2020-21, 77%, significantly higher than previous wave
2019-20, 71%
2018-19, 79%
2017-28, 79%
CPP
2020-21, 74%
2019-20, 73%
2018-19, 76%
2017-28, 80%
CPP-D
2020-21, 59%, significantly lower than total
2019-20, 53%
2018-19, 59%
2017-28, 53%
SIN
2020-21, 84% significantly higher than total
2019-20, 83%
2018-19, 84%
2017-28, 82%
OAS/GIS
2020-21, 78%
2019-20, 73%
2018-19, 74%
2017-28, 79%
1 800 O-Canada
47% very satisfied, 25% Rated 4
Total (% Rated 4 or 5)
2020-21, 72%, significantly higher than previous wave
2019-20, 64%
2018-19, 72%
2017-28, n/a
EI
2020-21, 68%
2019-20, 62%
2018-19, 70%
2017-28, n/a
CPP
2020-21, 68%
2019-20, 71%
2018-19, 77%
2017-28, n/a
CPP-D
2020-21, 52%
2019-20, 63%
2018-19, 61%
2017-28, n/a
SIN
2020-21, 90% significantly higher than total
2019-20, 88%
2018-19, 78%
2017-28,
OAS/GIS
2020-21, 67%
2019-20, 65%
2018-19, 73%
2017-28, n/a
Specialized Call Centre
47% very satisfied, 25% Rated 4
Total (% Rated 4 or 5)
2020-21, 72%, significantly higher than previous wave
2019-20, 60%
2018-19, 76%
2017-28, 82%
EI
2020-21, 70%, significantly higher than previous wave
2019-20, 59%
2018-19, 74%
2017-28, 85%
CPP
2020-21, 81%, significantly higher than previous wave
2019-20, 67%
2018-19, 80%
2017-28, 74%
CPP-D
2020-21, 59%
2019-20, 58%
2018-19, 64%
2017-28, 72%
SIN
2020-21, n/a
2019-20, n/a
2018-19, n/a
2017-28, n/a
OAS/GIS
2020-21, 76%, significantly higher than previous wave
2019-20, 64%
2018-19, 79%
2017-28, 76%
eSERVICECANADA
65% very satisfied, 17% Rated 4
Total (% Rated 4 or 5)
2020-21, 82%
2019-20, n/a
2018-19, n/a
2017-28, n/a
EI
2020-21, 81%
2019-20, n/a
2018-19, n/a
2017-28, n/a
CPP
2020-21, 82%
2019-20, n/a
2018-19, n/a
2017-28, n/a
CPP-D
2020-21, 66%
2019-20, n/a
2018-19, n/a
2017-28, n/a
SIN
2020-21, 89%
2019-20, n/a
2018-19, n/a
2017-28, n/a
OAS/GIS
2020-21, 61%, significantly lower than total
2019-20, n/a
2018-19, n/a
2017-28, n/a
Q27. How satisfied were you with the overall quality of service you received from…?
*small sample size, results should be interpreted with caution **Excludes SIN clients *** New attribute added in 2019-20 ****New attribute in 2020-21
Base: All Answering (n=varies)
Ease of Navigating Government of Canada Website
Clients were most likely to find it easy to find information about the program, understand the information, find out the steps to apply and find out what information they need to provide when applying. SIN clients were more likely to provide high ratings for all aspects compared to all clients, while CPP-D clients were less likely. EI clients were less likely to find it easy to find information about the program, while OAS/GIS clients were more likely to feel it was easy to understand the information.
Compared to 2019-20, ratings for the ease of figuring out eligibility have improved while the ease of finding the steps to apply have declined. EI clients were less likely to provide high ratings for the ease of finding the steps to apply, CPP clients for understanding the information and deciding the best age to start your pension. EI clients provided higher ratings for the ease of figuring out eligibility, CPP-D clients for the ease of understanding the information about the program and SIN clients for finding the information they were seeking in a reasonable amount of time.
Figure long description
Ease of Navigating Government of Canada Website
Find Information about
Total
2020-21, 78%
2019-20, 78%
2017-18, 79%
EI
2020-21, 74%, significantly lower than the total
2019-20, 77%
2017-18, 78%
CPP
2020-21, 76%
2019-20, 82%
2017-18, 76%
CPPD
2020-21, 63%, significantly lower than total
2019-20, 57%
2017-18, 58%
SIN
2020-21, 86%, significantly higher than total
2019-20, 81%
2017-18, 85%
OAS/GIS
2020-21, 75%
2019-20, 76%
2017-18, 72%
Understand the information about
Total
2020-21, 78%
2019-20, 76%
2017-18, 76%
EI
2020-21, 75%
2019-20, 72%
2017-18, 75%
CPP
2020-21, 76%, significantly lower than previous wave
2019-20, 84%
2017-18, 73%
CPPD
2020-21, 60%, significantly higher than previous wave, significantly lower than total
2019-20, 48%
2017-18, 52%
SIN
2020-21, 86% significantly higher than total
2019-20, 86%
2017-18, 84%
OAS/GIS
2020-21, 84%
2019-20, 82%
2017-18, 69%
Find out the steps to apply
Total
2020-21, 77%, significantly lower than previous waves
2019-20, 81%
2017-18, 80%
EI
2020-21, 74%
2019-20, 82%
2017-18, 80%
CPP
2020-21, 77%
2019-20, 81%
2017-18, 78%
CPPD
2020-21, 60%, significantly lower than total
2019-20, 58%
2017-18, 62%
SIN
2020-21, 85%, significantly higher than total
2019-20, 81%
2017-18, 83%
OAS/GIS
2020-21, 80%
2019-20, 76%
2017-18, 76%
Find out what information you need to provide when applying for
Total
2020-21, 77%
2019-20, 80%
2017-18, 78%
EI
2020-21, 75%
2019-20, 80%
2017-18, 76%
CPP
2020-21, 78%
2019-20, 81%
2017-18, 78%
CPPD
2020-21, 62%, significantly lower than total
2019-20, 55%
2017-18, 57%
SIN
2020-21, 83%, significantly higher than total
2019-20, 81%
2017-18, 84%
OAS/GIS
2020-21, 72%
2019-20, 83%
2017-18, 75%
Figure out if you are eligible for benefits/SIN card
Total
2020-21, 76%, significantly higher than previous wave
2019-20, 71%
2017-18, 75%
EI
2020-21, 73%, significantly higher than previous wave
2019-20, 66%
2017-18, 72%
CPP
2020-21, 80%
2019-20, 83%
2017-18, 79%
CPPD
2020-21, 46%, significantly lower than total
2019-20, 39%
2017-18, 43%
SIN
2020-21, 82%, significantly higher than total
2019-20, 81%
2017-18, 80%
OAS/GIS
2020-21, 82%
2019-20, 84%
2017-18, 72%
Decide the best age to start your pension
Total
2020-21, 66%
2019-20, 72%
2017-18, n/a
EI
2020-21, n/a
2019-20, n/a
2017-18, n/a
CPP
2020-21, 64%, significantly lower than previous wave
2019-20, 72%
2017-18, n/a
CPPD
2020-21, n/a
2019-20, n/a
2017-18, n/a
SIN
2020-21, n/a
2019-20, n/a
2017-18, n/a
OAS/GIS
2020-21, 71%
2019-20, 74%
2017-18, -
Q6. When you were looking for information about on the Government of Canada website, how easy or difficult was it to…? Please use a scale of 1 to 5, where 1 was very difficult and 5 was very easy, how would you rate…? Base: All Answering (n=varies)
Q7. How much do you agree or disagree that you were able to find the information you needed (online, in person or by phone) within a reasonable amount of time? Please use a scale of 1 to 5, where 1 was disagree strongly and 5 was agree strongly. Base= All Respondents (n=2630).
Reported Increased Ease Provided by Digital Services
Eight in ten clients agreed that being able to complete steps online made the process easier, higher than last year. EI clients were more likely to agree than all clients, while CPP, OAS/GIS and CPP-D clients were less likely.
Compared to 2019-20, reported ease increased among EI and OAS/GIS clients. Notably, while CPP and CPP-D clients do not see a statistically significant increase in their level of ease, both programs have observed a significant increase since the baseline wave.
Figure long description
Being able to complete steps online made the process easier for you (% rated 4 or 5)
Total
2017-18 (n=3043), 70%
2018-19 (n=3073), 74%
2019-20 (n=1741), 75%
2020-21 (n=3566), 80%, significantly higher than previous wave
EI
2017-18 (n=703), 82%
2018-19 (n=1098), 84%
2019-20 (n=701), 82%
2020-21 (n=1162), 87%, significantly higher than previous wave, significantly higher than total
CPP
2017-18 (n=652), 42%
2018-19 (n=788), 52%
2019-20 (n=389), 60%
2020-21 (n=752), 62%, significantly lower than total
CPPD
2017-18 (n=658), 29%
2018-19 (n=766), 31%
2019-20 (n=417), 37%
2020-21 (n=692), 40%, significantly lower than total, significantly higher than previous wave
OAS/GIS
2017-18 (n=712), 38%
2018-19 (n=421), 36%
2019-20 (n=234), 48%
2020-21 (n=442), 56%, significantly higher than previous wave, significantly lower than total
SIN, new measure for SIN clients in 2020-21
2020-21 (n=518), 82%
*new measure for SIN clients in CX 2020-21
Q36b. Thinking about the overall service you received, from getting information about to receiving a decision, how much do you agree or disagree with the following statements, using a 5-point scale (where 1 means strongly disagree, and 5 means strongly agree.) Base: All Answering (n=3566)
Online Channel
Among those who went online at the aware stage, the vast majority were able to find the information they were looking for on the Government of Canada Website. Six in ten were able to completely find the information they sought, one-third somewhat while only 6% indicate they didn’t find what they were looking for.
Compared to 2019-20, clients were more likely to report they were able to find the information they were looking for.
Figure long description
Online Channel
Able to Find information on Government of Canada Website
Yes, completely, 60%
Yes, somewhat, 33%
No, 6%
%Yes (NET)
2020-21, 93%
2019-20, 86%
2018-19, 86%
Q4. Did you get what you wanted from the Government of Canada website when you were looking for information on [INSERT ABBREV] before you applied?
Base: All Answering (n=2016).
Note: in waves prior to 2020-21, response options included Yes or No only.
Ease, Timeliness and Confidence during Application Stage
Clients were most likely to find it easy to complete the application form, to understand the requirements, and to be able to complete the application in a reasonable time. SIN clients were more likely to provide high ratings for nearly all aspects compared to all clients, while CPP-D clients were less likely. EI clients were less likely to find it easy to understand the requirements or find it easy to get help when needed, CPP clients were less likely to be able to complete the application in a reasonable time or find it easy to complete the application form, while OAS/GIS clients were less likely to feel it was easy to gather the information required, complete the application form or get help when needed.
Compared to 2019-20, EI clients were more likely to find it easy to gather the information required or to be confident their application would be processed in a reasonable time. CPP and SIN clients were more likely to find it easy to understanding the requirements and CPP-D clients found it easier to have confidence their application would be processed in a reasonable time. This year, OAS/GIS clients provided lower ratings for being able to complete their application in a reasonable time, the ease of completing the application form or confidence their application would be processed in a reasonable time.
Figure long description
% Rated 4 or 5:
You were able to complete the application in a reasonable amount of time?
Total:
2020-21, 83%
2019-20, 84%;
2017-18, 82%;
EI:
2020-21, 82%
2019-20, 83%;
2017-18, 82%;
CPP:
2020-21, 80%, significantly lower than total
2019-20, 83%;
2017-18, 82%;
CPP-D:
2020-21, 59%, significantly lower than total
2019-20, 55%, significantly lower than total;
2017-18, 56%;
SIN:
2020-21, 88%, significantly higher than total
2019-20, 87%;
2017-18, 85%;
OAS/GIS:
2020-21, 83%, significantly lower than previous waves
2019-20, 89%
2017-18, 81%;
Understand the requirements of the application
Total:
2020-21, 83%
2019-20, 80%;
2017-18, 81%;
EI:
2020-21, 79%, significantly lower than the total
2019-20, 78%;
2017-18, 79%;
CPP:
2020-21, 85%, significantly higher than previous wave
2019-20, 80%;
2017-18, 79%;
CPP-D:
2020-21, 54%, significantly lower than total
2019-20, 53%
2017-18, 52%;
SIN:
2020-21, 90%, significantly higher than total, significantly higher than previous wave
2019-20, 85%
2017-18, 89%;
OAS/GIS:
2020-21, 85%
2019-20, 83%
2017-18, 75%;
Putting together the information you needed to apply for…:
Total:
2020-21, 82%
2019-20, 79%;
2017-18, 78%;
EI:
2020-21, 81%, significantly higher than previous wave
2019-20, 75%,
2017-18, 75%;
CPP:
2020-21, 81%
2019-20, 82%;
2017-18, 77%;
CPP-D:
2020-21, 44%, significantly lower than total
2019-20, 43%
2017-18, 46%;
SIN:
2020-21, 88%, significantly higher than total
2019-20, 86%,
2017-18, 87%;
OAS/GIS
2020-21, 77%, significantly lower than total
2019-20, 79%
2017-18, 75%;
Completing the application form:
Total:
2020-21, 84%
2019-20, 81%;
2017-18, 83%;
EI:
2020-21, 84%
2019-20, 81%;
2017-18, 82%;
CPP:
2020-21, 81%, significantly lower than total
2019-20, 82%;
2017-18, 81%;
CPP-D:
2020-21, 50%, significantly lower than total
2019-20, 50%
2017-18, 53%;
SIN:
2020-21, 89%, significantly higher than total
2019-20, N/A;
2017-18, 88%;
OAS/GIS:
2020-21, 76%, significantly lower than total, significantly lower than previous wave
2019-20, 85%
2017-18, 78%;
Getting help on you application when you needed it
Total:
2020-21, 65%
2019-20, n/a;
2017-18, n/a;
EI:
2020-21, 58%, significantly lower than total;
2019-20, n/a;
2017-18, n/a;
CPP:
2020-21, 63%
2019-20, n/a
2017-18, n/a;
CPP-D:
2020-21, 45%
2019-20, n/a;
2017-18, n/a;
SIN:
2020-21, 78%, significantly higher than total
2019-20, n/a
2017-18, 78%;
OAS/GIS:
2020-21, 61%, significantly lower than previous wave;
2019-20, n/a
2017-18, n/a;
Confident your application would be processed in a reasonable amount of time
Total:
2020-21, 68%
2019-20, 64%;
2017-18, 66%;
EI:
2020-21, 67%, significantly higher than previous wave;
2019-20, 59%;
2017-18, 66%;
CPP:
2020-21, 77%, significantly higher than total
2019-20, 79%
2017-18, 70%
CPP-D:
2020-21, 40%, significantly higher than previous wave, significantly lower than total
2019-20, 34%;
2017-18, 42%;
SIN:
2020-21, 68%
2019-20, 78%
2017-18, 77%;
OAS/GIS:
2020-21, 70%, significantly lower than previous wave;
2019-20, 82%
2017-18, 72%
Q12. How much do you agree or disagree that you were able to complete the application in a reasonable amount of time? (Please use a scale of 1 to 5, where 1 was disagree strongly and 5 was agree strongly.) Base: All respondents (n=3797)
Q13. On a scale of 1 to 5 where 1 was very difficult and 5 was very easy, how would you rate the following when you were applying for [INSERT ABBREV]? Base: All answering (n=varies) Q14c. After you submitted your application for [INSERT ABBREV], how confident were you that your application would be processed in a reasonable amount of time. Please use a 5-point scale, where 1 was very worried and 5 was very confident. Base= Non-SIN clients and those who did not apply in person (n=3416).
Ease of Application Process among Self-Service Clients
The majority of self-serve clients found it easy to understand the requirements of the application, put together the information needed, and to complete the application in a reasonable amount of time. At nearly six in ten, fewer found it was easy for them to get help on their application when they needed it.
Year over year, ratings on all metrics are consistent.
Figure long description
Understanding the requirements of the application:
Q13. How would you rate the following when you were applying for [insert abbrev]? Base: Self Service Clients (Overall n=4200, EI n=1162, n CPP-RTR n=600).
Use of My Service Canada Account (MSCA)
Three-quarters of EI and CPP clients, half of CPP-D clients and four in ten OAS/GIS clients used MSCA during their experience. Compared to 2019-20, CPP, CPP-D and OAS/GIS clients were more likely to have used MSCA which they had registered for in the past.
EI clients were equally as likely to have registered for MSCA for the first time as they were to have registered in the past, while CPP, CPP-D and OAS/GIS clients were more likely to have registered in the past.
Two thirds of those who had to register for MSCA for the first time felt the process was easy, lower than in 2019-20, driven by a decline among EI users. CPP-D and OAS/GIS clients felt it was more difficult to register compared to all clients.
Figure long description
Use of MSCA
Used MSCA (NET)
Total
2020-21, 69%, significantly higher than previous wave
2019-20, 66%
EI
2020-21, 75%, significantly higher than total
2019-20, 77%
CPP
2020-21, 77%, significantly higher than previous wave, significantly higher than total
2019-20, 50%
CPPD
2020-21, 48%, significantly higher than previous wave, significantly lower than total
2019-20, 39%
OAS/GIS
2020-21, 43%, significantly higher than previous wave, significantly lower than total
2019-20, 32%
Use your MSCA which you had registered for in the past
Total
2020-21, 38%, significantly higher than previous wave
2019-20, 34%
EI
2020-21, 40%
2019-20, 39%
CPP
2020-21, 43%, significantly higher than previous wave
2019-20, 22%
CPPD
2020-21, 32%, significantly higher than previous wave, significantly lower than total
2019-20, 25%
OAS/GIS
2020-21, 29%, significantly higher than previous wave, significantly lower than total
2019-20, 21%
Register and use your MSCA for the first time
2020-21, 31%
2019-20, 32%
EI
2020-21, 35%, significantly higher than total
2019-20, 38%
CPP
2020-21, 34%
2019-20, 28%
CPPD
2020-21, 16%, significantly lower than total
2019-20, 14%
OAS/GIS
2020-21, 14%, significantly lower than total
2019-20, 11%
Try unsuccessfully to register for your MSCA
2020-21, 4%
2019-20, 5%
EI
2020-21, 4%
2019-20, 3%
CPP
2020-21, 5%
2019-20, 8%
CPPD
2020-21, 4%
2019-20, 5%
OAS/GIS
2020-21, 5%
2019-20, 7%
None of the above
2020-21, 24%, significantly lower than previous wave
2019-20, 28%
EI
2020-21, 19%
2019-20, 18%
CPP
2020-21, 14%, significantly lower than previous wave, significantly lower than total
2019-20, 38%
CPPD
2020-21, 44%, significantly lower than previous wave, significantly higher than total
2019-20, 53%
OAS/GIS
2020-21, 47%, significantly lower than previous wave, significantly higher than total
2019-20, 59%
Don’t know
2020-21, 3%
2019-20, 2%
EI
2020-21, 3%
2019-20, 1%
CPP
2020-21, 5%
2019-20, 3%
CPPD
2020-21, 4%
2019-20, 2%
OAS/GIS
2020-21, 4%
2019-20, 2%
Figure long description
Ease of Registration
2020-21
39%, Rated 5 – very easy
24%, Rated 4
17%, Rated 3
9%, Rated 2
10%, Rated 1 –Very difficult
Rated 4 or 5
Total, 63%, significantly lower than previous wave
EI, 65%, significantly lower than previous wave
CPP, 57%
CPPD, 43%, significantly lower than total
OAS/GIS, 51%, significantly lower than total
2019-20
41%, Rated 5 – very easy
28%, Rated 4
17%, Rated 3
6%, Rated 2
9%, Rated 1 –Very difficult
Rated 4 or 5
Total, 69%
EI, 73%
CPP, 60%
CPPD, 48%
OAS/GIS, 44%
Q34aa. At any point in your recent experience with did you….Base: All answering excluding SIN (n=3103)
Q34ab. Using a 5-point scale where 1 was very difficult and 5 was very easy, how easy or difficult was it to register for your My Service Canada Account? Base: Registered or attempted to register for MSCA (n=882)
Qualitative Insights on Authentication
Most participants had not heard of Verify.Me which was set up after participants had received their initial decision in January, February or March 2021. Interest in using Verify.Me to sign up for an MSCA were mixed. Some were comfortable with using their banking information, as they are already using it for their CRA account, and/or they figure since the government already has their banking information for deposits, Verify.Me would not be any different. Some expressed resignation about online authentication requirements in general, and/or felt that hackers are quite sophisticated and can get your information no matter what type of login authentication is used. Others felt that they would not feel comfortable using their banking information and would prefer instead to receive a PIN code in the mail – a feeling expressed especially among clients who had previously used this type of authentication to sign up.
In general, most felt that the government does a good job of securing their personal information, and that any breaches or concerns are more about those who are determined to find a way to hack and steal information, and that little can be done to prevent these individuals. Most believed that multi-factor authentication and other security measures provide a sense of security and confidence.
The only reason is, is I would do it through the bank account that you would have your EI submitted to anyway. Otherwise, if it was just to use the bank to verify who you were, and you didn’t need the banking information, then I wouldn't have done it. But because you utilize the bank information to submit payments to me directly, then I felt there’s less risk because you would need that information regardless somehow. That’s my logic."
I was going to say, I think when you initially sign in, you have to have a bunch of security questions that you have to fill in as part of the verification process. And I think that there’s also a choice of two-factor authentication. I think that’s another piece of it that you can choose. Whenever you login, you answer either a security question or get a code sent to your phone, to further verify that it’s you. I think that’s much better than maybe historically where you only have one step. I feel that my end, it should be fine.
Among those who utilized MSCA at any point during the process, one in ten used the MSCA online chat function. Usage was lower among OAS/GIS clients compared to all clients.
Among those who utilized the chat tool, two thirds found it helpful with no significant differences found by program.
Figure long description
Use of MSCA Online Chate
2020-21
Yes, 9%
No, 90%
% Yes
EI, 9%
CPP, 11%
CPPD, 8%
OAS/GIS, 3%, significantly lower than the total
34c. Did you use the online chat on the MSCA website (also called ‘virtual assistant’) at any point during the process of getting information about [INSERT PROGRAM] and completing and submitting the application form? Base: All answering excluding SIN (n=1963)
34d. How much do you agree or disagree that the online chat on the MSCA website was helpful? (Please use a scale of 1 to 5, where 1 is disagree strongly and 5 is agree strongly.) Base: Registered or attempted to register for MSCA (n=172)
*small sample size **very small sample size, results should be interpreted with caution
Figure long description
Helpfulness of MSCA Online Chat
5 – strongly agree, 47%
Rated 4, 19%
Rated 3, 15%
Rated 2, 9%
1 – Strongly disagree, 9%
% Agree (Rated 4 or 5)
EI (small sample size), 66%
CPP (small sample size), 71%
CPPD, (small sample size), 58%
OAS/GIS (very small sample size, interpreted with caution), 75%
Three quarters of clients who used MSCA said they were satisfied with the overall quality of service they received. CPP-D clients were less likely to be satisfied compared to all clients.
When looking at results by group, youth (18-30) and OLMC (Official language minority communities) were more likely to be highly satisfied with MSCA, while clients who have restrictions, those with a disability, or a language barrier provided lower ratings.
Figure long description
Overall Satisfaction With MSCA
Overall Satisfaction with MSCA (satisfied % Rated 4 or 5)
Total, 75%
EI, 76%
CPP, 74%
CPPD, 52%, significantly lower than total
OAS/GIS (small sample size), 66%
At-Risk Client Groups
Higher satisfaction (% Rated 4 or 5)
OLMC (small sample size), 88%
Youth (18 – 30), 83%
Lower satisfaction (% rated 4 or 5)
Restrictions to service, 69%
Clients with a disability, 56%
Language barrier (small sample size), 42%
*small sample size, results should be interpreted with caution.
Use of 1 800 O-Canada at Aware Stage and Channel Satisfaction - Overall and by At-Risk Group
Overall, fewer than one in ten of all clients used 1 800 O-Canada at the aware stage to learn about the program they applied for, lower than in 2019. Usage at the aware stage was higher among e-vulnerable clients, those who experience a language barrier, and those with no devices (no computer, smartphone or tablet) or mobile only.
At seven in ten, a strong majority of clients were satisfied with their experience with 1 800 O-Canada, consistent with last year. Satisfaction with the channel was lower among clients with disabilities and those with a language barrier.
Figure long description
Channel Use and Satisfaction
Used Service at awareness stage
2020-21, 6%, significantly lower than previous waves
2019-20, 8%
Satisfied with channel (% Rated 4 or 5)
2020-21, 72%
2019-20, 69%
Q1a. Which of the following did you use to find out about [INSERT PROGRAM] or [INSERT ABBREV] before you applied? Did you ...
Q27. How satisfied were you with the overall quality of service you received from…? Base: All Answering (n=varies)
*small sample size **very small sample size, results should be interpreted with caution
Figure long description
By At-Risk Groups
Youth (18 to 30)
% Used at Aware stage
2020-21, 4%
2019-20, 5%
Satisfaction (% Rated 4 or 5)
2020-21, 79%, small sample size
2019-20, 79%
Seniors (60+)
% Used at Aware stage
2020-21, 7%
2019-20, 9%
Satisfaction (% Rated 4 or 5)
2020-21, 65%
2019-20, 67%
OLMC
% Used at Aware stage
2020-21, 6%
2019-20, 3%
Satisfaction (% Rated 4 or 5)
2020-21, 77%, very small sample size
2019-20, 78%
Non E or F Speaking
% Used at Aware stage
2020-21, 2%, small sample size
2019-20, 3%
Satisfaction (% Rated 4 or 5)
2020-21, 78%, very small sample size
2019-20, 82%
High school or less
% Used at Aware stage
2020-21, 7%
2019-20, 7%
Satisfaction (% Rated 4 or 5)
2020-21, 80%
2019-20, 73%
Indigenous
% Used at Aware stage
2020-21, 6%
2019-20, 8%
Satisfaction (% Rated 4 or 5)
2020-21, 83%, small sample size
2019-20, 52%
Clients with disabilities
% Used at Aware stage
2020-21, 7%
2019-20, 11%
Satisfaction (% Rated 4 or 5)
2020-21, 48%, small sample size, significantly lower than total
2019-20, 70%
Remote
% Used at Aware stage
2020-21, 7%
2019-20, 6%
Satisfaction (% Rated 4 or 5)
2020-21, 80%, very small sample size
2019-20, 74%
Urban
% Used at Aware stage
2020-21, 6%
2019-20, 7%
Satisfaction (% Rated 4 or 5)
2020-21, 71%
2019-20, 71%
Rural
% Used at Aware stage
2020-21, 5%
2019-20, 9%
Satisfaction (% Rated 4 or 5)
2020-21, 74%
2019-20, 65%
E-vulnerable
% Used at Aware stage
2020-21, 9%, significantly higher than total
2019-20, 11%
Satisfaction (% Rated 4 or 5)
2020-21, 75%, small sample size
2019-20, 69%
Newcomers (3 years or fewer)
% Used at Aware stage
2020-21, 3%, significantly lower than total
2019-20, 3%
Satisfaction (% Rated 4 or 5)
2020-21, 94%, very small sample size
2019-20, 83%
Language barrier
% Used at Aware stage
2020-21, 12%
2019-20, 19%
Satisfaction (% Rated 4 or 5)
2020-21, 31%, small sample size, significantly lower than total
2019-20, 8%
Mobile only
% Used at Aware stage
2020-21, 13%, significantly higher than total
2019-20, 5%
Satisfaction (% Rated 4 or 5)
2020-21, 66%, small sample size
2019-20, 54%
No devices
% Used at Aware stage
2020-21, 11%, significantly higher than total
2019-20, 19%
Satisfaction (% Rated 4 or 5)
2020-21, 85%, very small sample size
2019-20, 77%
Clients with Restrictions
% Used at Aware stage
2020-21, 7%
2019-20, 8%
Satisfaction (% Rated 4 or 5)
2020-21, 72%
2019-20, 55%
Racialized
% Used at Aware stage
2020-21, 6%
2019-20, n/a
Satisfaction (% Rated 4 or 5)
2020-21, 82%
2019-20, n/a
eService Canada
More than one in ten (13%) of all clients used eService Canada and 7% of all clients had their service interaction resolved over the phone which meant they did not require an appointment at a Service Canada Centre.
At eight in ten, the vast majority of eService Canada users were satisfied with the overall quality of service received.
Eight in ten found the process to be easy, while closer to three-quarters found it effective.
Figure long description
Ease and Effectiveness
5 – very satisfied, 65%
4 – satisfied, 17%
3, 9%
2 – dissatisfied, 3%
1 – very dissatisfied, 2%
% Rated 4 or 5, 82%
Figure long description
Satisfaction with Overall Quality of Service
Overall, it was easy for you to apply for [ABBREV], 80%
You were able to move smoothly through all of the steps related to your [ABBREV] application, 78%
Q36b. Thinking about the overall service you received, from getting information about [INSERT ABBREV] to receiving a decision, how much do you agree or disagree with the following statements, using a 5-point scale (where 1 means strongly disagree, and 5 means strongly agree.)
Q27. How satisfied were you with the overall quality of service you received from…?
Qualitative Insights on eService Canada
A few participants had experiences with eServiceCanada. Of those who received a callback, they described the interaction as very positive because they received answers to their questions. However, one participant stated that they did not receive a callback after submitting an eServiceCanada form.
Among those who had not used or were unaware of eServiceCanada, some thought it a great idea and were open to using the service, while others were concerned about having to wait two business days to receive a callback, or that they would miss the call, and their opportunity to speak with a representative.
But I did use the eService and I was pleasantly surprised when a delightful representative called me back. At that time people were working from home but she made it clear that she was dealing with my request and was very helpful, particularly regarding OAS and whether I'd qualify not being in the country for the full 40 years. That service met my needs at the time based on the time that it was March 2020 and I couldn’t go to an office and get my questions answered.
I remember I was looking at the website, I had a few questions, so it gave me an option to leave my phone number and that someone would call me back in I think it was 48 hours. So then, I remember the guy called me back. I had asked him my questions. It was actually really easy. I definitely like the callback service. It’s better than sitting there on wait the whole time, because I hate waiting on the phone. That was definitely one of my favourite things this time around. I’ve never experienced it before.
Yeah, it will be nice, but just if they have the time available that I have, if I can put my time availability, because I’m at work, so I will feel very bad if I need to call that I’m waiting for two, three days.
I don’t like that. I wouldn’t use it. I need to know...I work so I'm busy. Even if I'm laid off, I'm still super busy. I don’t want to have to wait two days for that call. The bank does that too, so I walk to the bank. […] I'd rather wait or for them to call me back that day, or to wait on hold [in case they call] when I'm busy.
In Person
At more than eight in ten, the vast majority of clients who used the in-person channel were satisfied with the quality of service received, while nine in ten felt that Service Canada representatives were helpful and eight in ten found it easy to get help when they needed it.
Only a quarter of clients who utilized in person services at the aware or apply stage booked an appointment prior to their visit.
Clients who booked an appointment at either the aware or apply stage have consistent levels of satisfaction with their experience compared to those who did not. The only notable difference was that clients who booked an appointment at the aware stage were more likely to feel it was easy to get help in general than those who did not book an appointment.
Figure long description
Satisfaction with Overall Quality of Service
5 – very satisfied, 68%
4 – satisfied, 18%
3, 7%
2 – dissatisfied, 2%
1 – very dissatisfied, 3%
% Rated 4 or 5, 86%
Figure long description
Booked Appointment Prior to Visit
Aware Stage
Yes, 27%
No, 72%
% Rated 4 or 5 (booked an appointment), 87%
Apply Stage
Yes, 27%
No, 73%
% Rated 4 or 5 (booked an appointment), 90%
Figure long description
Helpfulness
Service Canada representatives that you dealt with in person were helpful, 91%
It was easy to get help when you needed it, 82%
Q27. How satisfied were you with the overall quality of service you received from…?
Q36b. Thinking about the overall service you received, from getting information about [INSERT ABBREV] to receiving a decision, how much do you agree or disagree with the following statements, using a 5-point scale (where 1 means strongly disagree, and 5 means strongly agree.)
Q1c. You indicated that you went to a government office before you applied. Did you book an appointment prior to your visit? (n=646)
Q9d. You indicated that you went to a government office when completing and submitting your application. Did you book an appointment prior to your visit? (n=757)
“In-person" satisfaction results do not include the person-to-person touchless service, eService Canada.
Profile of In-Person Clientele- Proportion of At-Risk Client Groups
The proportion of vulnerable groups among in-person clientele varied with certain groups having relied more on in-person service.
Newcomers, racialized clients, clients with restrictions to accessing service, e-vulnerable and mobile only clients were more prevalent among those who used in-person at any stage of the client journey. The proportion of Youth were higher among those who used in-person at the aware or apply stages, while the proportion of Urban clients and OLMC were higher among those who applied in-person. Non-English or French speaking, Indigenous clients, clients with disabilities and rural clients were more prominent among those who followed-up in-person.
Figure long description
Profile of In-Person Clientele- Proportion of At-Risk Client Groups
Number of Interviews
Youth (18-30)
n=734;
Proportion of clients, 31%
Aware, 41%, significantly higher than total
Apply, 47%, significantly higher than total
Follow-up, 38%
Seniors (60+)
n=1950
Proportion of clients, 29%
Aware, 20%, significantly lower than total
Apply, 18%, significantly lower than total
Follow-up, 21%, significantly lower than total
OLMC;
n= 210
Proportion of clients, 5%
Aware, 6%
Apply, 7%, significantly higher than total
Follow-up, 7%
Non E or F speaking;
n=93
Proportion of clients, 3%
Aware, 4%
Apply, 4%
Follow-up, 6%, significantly higher than total
high school or less;
n= 1608
Proportion of clients, 31%
Aware, 31%
Apply, 26%, significantly lower than total
Follow-up, 37%
Indigenous;
n= 551
Proportion of clients, 9%
Aware, 10%
Apply, 10%
Follow-up, 15%, significantly higher than total
clients with disabilities;
n= 916
Proportion of clients, 8%
Aware, 7%
Apply, 6%
Follow-up, 14%, significantly higher than total
remote;
n=400
Proportion of clients, 2%
Aware, 3%
Apply, 2%
Follow-up, 4%
urban;
n=1948
Proportion of clients, 62%
Aware, 65%
Apply, 69%, significantly higher than total
Follow-up, 50%, significantly lower than total
rural;
n=1835
Proportion of clients, 35%
Aware, 32%
Apply, 28%, significantly lower than total
Follow-up, 47%, significantly higher than total
E-vulnerable;
n=858
Proportion of clients, 13%
Aware, 18%, significantly higher than total
Apply, 17%, significantly higher than total
Follow-up, 22%, significantly higher than total
newcomers (3 years or less);
n=357
Proportion of clients, 14%
Aware, 26%, significantly higher than total
Apply, 33%, significantly higher than total
Follow-up, 21%, significantly higher than total
language barrier;
n=285
Proportion of clients, 5%
Aware,4%
Apply, 3%, significantly lower than total
Follow-up, 5%
mobile only;
n=385
Proportion of clients, 9%
Aware, 12%, significantly higher than total
Apply,13%, significantly higher than total
Follow-up, 14%, significantly higher than total
no device;
n=240
Proportion of clients, 3%
Aware, 3%
Apply, 3%
Follow-up, 3%
clients with restrictions;
n= 3297
Proportion of clients, 48%
Aware, 60%
Apply, 55%
Follow-up, 70%
Racialized;
n= 947
Proportion of clients, 35%
Aware, 52%
Apply, 60%
Follow-up, 49%
OLMC:
Official Language Minority Communities
In-Person Satisfaction by Region
Overall, 86% of clients who utilized in-person services were satisfied with the service provided.
Satisfaction ratings were consistent by region, though satisfaction has significantly declined in Quebec compared to last year.
Figure long description
In-person satisfaction by region (rated 4 or 5)
Total
2020-21, 86%
2019-20, 86%
Atlantic
2020-21, 88%, small sample size
2019-20, 88%
Quebec
2020-21, 83%, significantly lower than previous wave
2019-20, 91%
Ontario
2020-21, 86%
2019-20, 83%
West/Territories
2020-21, 89%
2019-20, 85%
Q27. How satisfied were you with the overall quality of service you received in-person?
*small sample size, results should be interpreted with caution
In-Person and Telephone Experience
Clients who used in-person services were nearly unanimous in their agreement that in-person Service Canada representatives were helpful, with 91% providing a rating of 4/5. Eight in ten respondents agreed that they travelled a reasonable distance to access the service, a significant increase from last year.
More than eight in ten respondents who used telephone services agreed that Service Canada specialized call centre phone representatives were helpful, a significant increase from 2019-20.
Figure long description
In-Person and Telephone Experience
In-person:
Service Canada representative that you dealt with in-person were helpful:
78%, 5-strongly agree;
13%, 4;
4%, 3;
1%, 2;
2%, 1-strongly disagree;
1%, Not applicable
1%, Don’t know
% Rating 4 or 5
2020 -21, 91%
2019-20, 92%
You travelled a reasonable distance to access the service:
59%, 5-strongly agree;
20%, 4;
9%, 3;
3%, 2;
5%, 1-strongly disagree;
3%, Not applicable
1%, Don’t know
% Rating 4 or 5
2020 -21, 79%, significantly higher than previous wave
2019-20, 75%
Telephone:
Service Canada specialized call centre phone representatives were helpful:
66%, 5-strongly agree;
19%, 4;
8%, 3;
3%, 2;
3%, 1-strongly disagree;
1%, Not applicable
% Rating 4 or 5
2020 -21, 85%, significantly higher than previous wave
2019-20, 73%
Q36b. Thinking about the service you received, how much do you agree or disagree with the following statements. Base: All Answering (n=varies)
Reasons for Low Satisfaction with Specialized Call Centre Service
Among those who reported low satisfaction scores (ratings of 1 to 3 out of 5) regarding the service provided by specialized call centres, the most common reason was long wait times, with over half (54%) feeling it was too long. Following this, in addition to other, miscellaneous responses (23%), those with low satisfaction felt the information they were provided was inconsistent or unclear (12%) or that their questions were not answered (5%).
CPP-D and SIN clients were more likely to cite their questions not being sufficiently answered, while CPP-D clients were less likely than all clients to feel wait times were too long. By region, Atlantic Canadians were more likely than all clients to feel wait times were too long, while those in the West and Territories were more likely to feel they got inconsistent or unclear information.
Figure long description
Reasons for Rating of 1 – 3
The telephone wait times were too long, 54%
By Program
EI, 59%
CPP (small sample size), 52%
CPPD (small sample size), 27%, significantly lower than total
SIN (very small sample size), 42%
OAS/GIS (small sample size), 50%
By region
West/Territories, 45%
Ontario (small sample size), 57%
Quebec (small sample size), 57%
Atlantic (very small sample size), 75%, significantly higher than total
Other, 23%
By Program
EI, 23%
CPP (small sample size), 28%
CPPD (small sample size), 28%
SIN (very small sample size), 17%
OAS/GIS (small sample size), 34%
By region
West/Territories, 23%
Ontario (small sample size), 27%
Quebec (small sample size), 23%
Atlantic (very small sample size), 6%, significantly lower than total
Inconsistent or unclear information, 12%
By Program
EI, 12%
CPP (small sample size), 12%
CPPD (small sample size), 16%
SIN (very small sample size), 14%
OAS/GIS (small sample size), 11%
By region
West/Territories, 20%, significantly higher than total
Ontario (small sample size), 10%
Quebec (small sample size), 8%
Atlantic (very small sample size), 12%
Your questions were not answered, 5%
By Program
EI, 4%
CPP (small sample size), 4%
CPPD (small sample size), 13%, significantly higher than total
SIN (very small sample size), 15%, significantly higher than total
OAS/GIS (small sample size), 2%
By region
West/Territories, 6%
Ontario (small sample size), 2%
Quebec (small sample size), 8%
Atlantic (very small sample size), 3%
DK/NS, 3%
By Program
EI, 1%
CPP (small sample size), n/a
CPPD (small sample size), 4%
SIN (very small sample size), n/a
OAS/GIS (small sample size), 2%
By region
West/Territories, 4%
Ontario (small sample size), 4%
Quebec (small sample size), 3%
Atlantic (very small sample size), 3%
Did not like the outcome of the call(s), 1%
By Program
EI, 2%
CPP (small sample size), 4%
CPPD (small sample size), 8%, significantly higher than total
SIN (very small sample size), 12%, significantly higher than total
OAS/GIS (small sample size), n/a
By region
West/Territories, 2%
Ontario (small sample size), n/a
Quebec (small sample size), n/a
Atlantic (very small sample size), n/a
Service Canada representatives were disrespectful, 0%
By Program
EI, n/a
CPP (small sample size), n/a
CPPD (small sample size), 4%, significantly higher than total
SIN (very small sample size), n/a
OAS/GIS (small sample size), 2%
By region
West/Territories, n/a
Ontario (small sample size), n/a
Quebec (small sample size), n/a
Atlantic (very small sample size), 1%
Q27a. You provided a rating of [INSERT RATING FOR 'AN [INSERT ABBREV] CALL CENTRE' AT Q27] out of 5 for the service provided by the [INSERT ABBREV] Call Centre. What would you say most contributed to your lower satisfaction with the overall quality of the service you received from the [PROGRAM ABREV] call centre? Base: Those who provided a rating of 1-3./10 on Q27 (n=315) *small sample size **very small sample size, results should be interpreted with caution
Qualitative Insights on Channel Performance
Many participants believed being able to reach more quickly a live person on the phone – particularly for program call centres – would be the service improvement of greatest interest across all programs and at every stage of the client journey. If there is a long wait on the phone, some participants said they would prefer that Service Canada offers the option of a callback. Awareness of eServiceCanada is low. Those participants who have used callback services with telecommunications and other private sector companies have found them to be quite helpful; however there were concerns for some that the callback would need to be scheduled at a convenient time, citing fears of missing the callback when it comes.
Participants who like the idea of online application with live chat support find this option easy and convenient, and they have used it for other services with success, although there is a stronger preference to connect with a live agent vs. having a bot answer common questions. Those who dislike live chat “don’t use it/ haven’t tried it,” “don’t like the amount of typing/writing involved,” feel that something gets “lost in translation” compared to speaking to someone on the phone or in person. Some participants said they do not write well enough in English or French. It should be noted that the expectation for live chat is that it would be faster than phone and available after hours, service attributes that appeal for some. Mention was made that the chat support option tends to be better for simple questions and less preferable for complex ones.
[…] not having to wait on hold and having the option for callback numbers, so it’s less inconvenient to be hanging on the phone for an hour or two.
[…] if I wanted to ask a question about a discrepancy on my bill, I’ve used live chat to ask questions that way. Usually, if it’s a simple question, you can get a simple answer. If you have something that’s a little more complex, then again, you can’t describe it effectively. You might not get the answer you want, and then you get frustrated.
In terms of service channel preference for completing and submitting an application, many participants said they like the idea of an online application with the option of phone support. Online is considered easy, fast and convenient, but they like knowing that they can speak to an actual person to get the answer they need. Some participants also liked the idea of phone support because they felt the agent could call them back if the line unexpectedly disconnected. Amongst those who do not like phone support, they feel that it is more difficult to communicate on the phone vs. in-person or chat, “something gets lost”. They also anticipate long wait times, which is true both of previous experiences with government services, and in general with having to dial into call centres for various services.
The in-person service channel was preferred by participants who want a very thorough and step-by-step explanation or walk-through of the application process; it was also preferred for those who might have unique cultural needs or require more contextual information in terms of navigating the “system” – notably, first-time applicants to SIN. For participants whom English or French is not a first language, the in-person channel is perceived to be the most effective.
[I prefer] the online plus the phone support […] I’m pretty competent in navigating using Google, and figuring things out on the webpages and what not. But if you stumble about and run into a problem, then you can at least contact somebody […] it’s easier to contextualize your problem when you're actually talking with somebody directly, as opposed to say, online chat, where you have to be especially descriptive in your problem for the other person to not misunderstand or misinterpret what you're talking about. And then, you go in circles a lot. Talking with a human, sometimes you can get to I think a better place maybe a little quicker […]
Like when I came to Canada, I came with the working holiday visa. So, for example, the SIN number, I did it at the airport, so whatever the person at the airport told me, ‘You have to do it, do you want to do it here?’’; and I said yes. But after that, when I applied for the PR, I did it by myself, so online. […] In that situation, yeah it was helpful because when you come to a country, you don’t know how the system works. So, at the airport they explained pretty much everything. But after that, when whatever, like the working holiday visa, it’s like one year, so after one year you understand how it works and what you need to do.
End-To-End Client Experience by Program
Impact of Service Changes on the Client Experience
Overall satisfaction with the service experienced increased since 2019-20 due to higher satisfaction among EI clients (and the high proportion of Service Canada clientele they represented*). Notably, lower satisfaction was reported among SIN clients this year.
Figure long description
Proportion by program
EI, 48%
CPP, 10%
CPPD, 2%
SIN, 29%
OAS/GIS. 11%
Overall satisfaction over time
2020-21, 86%, significantly higher than previous wave
2019-20, 84%
2018-19. 85%
2017-18, 84%
Figure long description
Satisfaction by program
SIN
2020-21, 89%, significantly lower than previous wave
2019-20, 94%
2018-19, 92%
2017-18, 94%
CPP
2020-21, 86%
2019-20, 88%
2018-19, 87%
2017-18, 87%
OAS/GIS
2020-21, 88%
2019-20, 87%
2018-19, 87%
2017-18, 86%
EI
2020-21, 84%, significantly higher than previous wave
2019-20, 77%
2018-19, 80%
2017-18, 83%
CPPD
2020-21, 63%
2019-20, 60%
2018-19, 62%
2017-18, 64%
Increase in satisfaction was driven by improvement on overall effectiveness among EI clients, clarity of process among EI and SIN clients, receiving consistent information among EI and OAS/GIS clients and timeliness of service among EI and CPP-D clients.
Figure long description
Effectiveness
EI
2020-21, 83%
2019-20, 76%
Clarity of process
EI
2020-21, 77%
2019-20, 65%
SIN
2020-21, 88%
2019-20, 83%
Consistent info
EI
2020-21, 82%
2019-20, 76%
OAS/GIS
2020-21, 87%
2019-20, 82%
Timeliness of Service
EI
2020-21, 80%
2019-20, 68%
CPPD
2020-21, 57%
2019-20, 49%
However, there was a decline in ease of getting help in general for EI and SIN clients and overall effectiveness for CPP clients.
Figure long description
Ease of getting help in general
EI
2020-21, 65%
2019-20, 70%
SIN
2020-21, 83%
2019-20, 89%
Effectiveness
CPP
2020-21, 80%
2019-20, 85%
Figure long description
EI
CPP
CPP-D
SIN
OAS/GIS
Strengths to maintain
Ease of applying, confidential information was protected, helpfulness of in person reps
Helpfulness of in person and specialized call centre reps, understanding requirements of app, ease of applying
Confidence information was protected, helpfulness of in person and specialized call centre reps
Helpfulness of in person reps, confidence info was protected, move smoothly through steps, ease of understanding requirements of app
Helpfulness of specialized call centre reps, ease of applying, move smoothly through steps, received consistent info
Areas for improvement
Confidence application would be processed in reasonable time, ease of getting help in general, ease of follow-up, ease of getting help on application
Ease of getting help, ease of follow-up, ease of deciding best age to start pension, ease of getting help in application
Ease of determining eligibility, ease of getting help on application, ease of gathering info for application, confidence application would be processed in reasonable time
Ease of follow-up, confidence application would be processed in reasonable time
Easy of getting help, ease of deciding best age to start pension, ease of follow up, confidence application would be processed in reasonable time
*the proportion of clients by program was held consistent vs. the baseline wave to ensure comparability of results and that any changes observed over time were not as a result of client distribution.
Overall Satisfaction
Satisfaction, Ease and Effectiveness Over Time
The vast majority of clients were satisfied with their experience and found it easy and effective.
Compared to 2019-20, overall satisfaction and effectiveness have increased, while ease has remained stable over time. Overall satisfaction has returned to levels observed in 2017-18 and effectiveness has rebounded after declining last year and stands at the highest level observed.
Figure long description
Change in Overall Performance at Service Attributes (% Rated 4 or 5):
Satisfaction:
86%, 2017-18;
85%, 2018-19;
84%, 2019-20;
86%, 2020-21, significantly higher than previous wave
Ease:
84%, 2017-18;
85%, 2018-19;
84%, 2019-20;
86%, 2020-21;
Effectiveness:
82%, 2017-18;
84%, 2018-19;
82%, 2019-20,
85%, 2020-21, significantly higher than previous wave
Emotion
76%, 2017-18;
78%, 2018-19;
78%, 2019-20;
77%, 2020-21;
Satisfaction with Service Experience
Overall, the majority of clients remained satisfied with the service experience, higher than in 2019-20 and consistent with the levels observed in 2017-18.
After softening for two consecutive years, the proportion of clients who provided a ratings of 5 for their overall experiences has strengthen somewhat and returned to 2018-19 levels.
This finding reflects the composition of the clientele, half of which were EI clients, and nearly a third of which were SIN clients.
Figure long description
Satisfaction with Service Experience
Satisfaction with Service Experience
2019-20, (n=4200):
5-very satisfied, 57%,
Rated 4, 28%;
Rated 3, 10%;
Rated 2, 2%;
1-very dissatisfied, 2%
2019-20, (n=2431):
5-very satisfied, 55%,
Rated 4, 29%;
Rated 3, 11%;
Rated 2, 2%;
1-very dissatisfied, 2%
2018-19, (n=4401):
5-very satisfied, 58%;
Rated 4, 27%;
Rated 3, 9%;
Rated 2, 3%;
1-very dissatisfied, 2%
2017-18, (n=4001):
5-very satisfied, 63%;
Rated 4, 24%;
Rated 3, 9%;
Rated 2, 3%;
1-very dissatisfied, 2%
Percent Rating 4 or 5
86%, 2020-21, significantly higher than previous wave
84%, 2019-20;
85%, 2018-19;
86%, 2017-18;
Proportion of Clients by Program 2019-20:
EI, 48%;
CPP, 10%;
CPP-D, 2%;
SIN, 29%;
OAS/GIS, 11%
Q38a. How satisfied were you with the service you received from Service Canada related to your application? please use a 5-point scale, where 1 means very dissatisfied, and 5 means very satisfied. Base: All Respondents (n=4200).
Ease, Effectiveness and Emotion
A strong majority of clients found the process effective, easy and had confidence in the issue resolution process.
CPP-D clients were less likely to have found the process effective, that it was easy to apply, or to agree they had confidence in issue resolution compared to all clients. EI clients were less likely to have confidence in issue resolution, while CPP clients were less likely to have found the process effective. SIN clients were more likely to have found the process effective and to have had confidence in issue resolution, while OAS/GIS clients were more likely to have had confidence in issue resolution.
Compared to 2019-20, EI clients were more likely to have found the process effective, while CPP clients were less likely. OAS/GIS clients were more likely to have had confidence in the issue resolution process than the previous year.
Figure long description
You were confident that any issues or problems would have been easily resolved.
2020-21(n=4200)
5-strongly agree, 52%
Rated 4, 25%
Rated 3, 13%
Rated 2, 5%
1-strongly disagree, 4%
Don’t know, 1%
2019-20(n=2431)
5-strongly agree, 53%
Rated 4, 25%
Rated 3, 14%
Rated 2, 4%
1-strongly disagree, 3%
Don’t know%1
2018-19, (n=4401)
5-strongly agree, 51%
Rated 4, 26%
Rated 3, 13%
Rated 2, 5%
Rated 1, 3%
Don’t know, 2%
2017-18, (n=3221)
5-Stongly agree, 58%
Rated 4, 24%
Rated 3, 10%
Rated 2, 4%
1-strongly disagree, 2%
Don’t know, 1%
You were able to move smoothly through all of the steps
2020-21(n=3797)
5-strongly agree, 62%
Rated 4, 23%
Rated 3, 10%
Rated 2, 3%
1-strongly disagree, 2%
Don’t know, 0%
2019-20(n=2103)
5-strongly agree, 58%, significantly lower than previous wave
Rated 4, 24%
Rated 3, 12%
Rated 2, 3%
1-strongly disagree, 2%
2018-19, (n=3993)
5-strongly agree, 62%
Rated 4, 22%
Rated 3, 9%
Rated 2, 4%
Rated 1, 2%
2017-18, (n=3639)
5-Stongly agree, 59%
Rated 4, 22%
Rated 3, 12%
Rated 2, 3%
1-strongly disagree, 3%
Don’t know, 1%
Overall, it was easy for you to apply for
2020-21(n=3048)
5-strongly agree, 59%
Rated 4, 27%
Rated 3, 9%
Rated 2, 3%
1-strongly disagree, 2%
Don’t know, 0%
2019-20(n=1741)
5-strongly agree, 59%
Rated 4, 25%
Rated 3, 11%
Rated 2, 3%
1-strongly disagree, 1%
2018-19, (n=3073)
5-strongly agree, 63%
Rated 4, 23%
Rated 3, 9%
Rated 2, 3%
Rated 1, 3%
2017-18, (n=3043)
5-Stongly agree, 59%
Rated 4, 25%
Rated 3, 10%
Rated 2, 3%
1-strongly disagree, 3%
You were confident that any issue or problems would have been easily resolved
2019-20
Total, 78%
EI, 72%
CPP, 81%
CPP-D, 51%
SIN, 87%
OAS/GIS, 77%
2018-19
Total, 78%
EI, 74%
CPP,76%
CPP-D, 57%
SIN, 86%
OAS/GIS, 78%
2017-18
Total,82%
EI, 79%
CPP, 81%
CPP-D, 63%
SIN, 88%
OAS/GIS, 80%
You were able to move smoothly through all the steps
2020-21
Total, 85%
EI, 83%
CPP, 80%, significantly higher than previous wave, significantly lower than total
CPP-D, 58%, significantly lower than total
SIN, 91%
OAS/GIS, 87%
2019-20
Total, 82%
EI, 76%
CPP, 85%
CPP-D, 57%
SIN, 91%
OAS/GIS, 88%
2018-19
Total, 84%
EI, 81%
CPP, 83%
CPP-D, 62%
SIN, 91%
OAS/GIS, 84%
2017-18
Total, 82%
EI, 77%
CPP, 84%
CPP-D, 55%
SIN, 90%
OAS/GIS, 79%
Overall, it was easy for you to apply for
2020-21
Total, 86%
EI,87%
CPP, 85%
CPP-D, 56%, significantly lower than total
OAS/GIS, 88%
2019-20
Total, 84%
EI,84%
CPP, 88%
CPP-D, 55%
OAS/GIS, 92%
2018-19
Total, 85%
EI, 86%
CPP, 88%
CPP-D, 60%
OAS/GIS, 87%
2017-18
Total, 84%
EI, 84%
CPP, 88%
CPP-D, 57%
OAS/GIS, 84%
Q36b. Thinking about the service you received, how much do you agree or disagree with the following statements… You were confident that any issues or problems would have been easily resolved? Base: All Respondents (n=4200). You were able to move smoothly through all of the steps related to your claim/ application? Base: All Answering (n=3959). Overall, it was easy for you to apply for [ABBREV]? Base: All Answering (n=2735)
Satisfaction with Service Experience by Program
Compared to 2019-20, satisfaction among EI clients increased and declined among SIN clients. Satisfaction was stable for all other programs.
Consistent with previous years, satisfaction remained lower for CPP-D clients.
Figure long description
Satisfaction with Service Experience- By Program (% Rated 4 or 5)
SIN:
2020-21, 89%, significantly lower than previous wave
2019-20,94%;
2018-19,92%;
2017-18,94%
CPP:
2020-21, 86%
2019-20,88%;
2018-19,87%;
2017-18,87%
OAS/GIS:
2020-21, 88%,
2019-20,87%;
2018-19,87%;
2017-18,86%
EI:
2020-21, 84%, significantly higher than previous wave
2019-20,77%;
2018-19,80%;
2017-18,83%
CPP-D:
2020-21. 63%
2019-20,60%;
2018-19,62%;
2017-18,64%
Q38a. How satisfied were you with the service you received from Service Canada related to your application? please use a 5-point scale, where 1 means very dissatisfied, and 5 means very satisfied. Base: All Respondents (n=4200).
Overall Satisfaction by Region
Figure long description
Satisfaction by Region, map:
Overall Satisfaction (Rated 4 or 5):
2020-21, 86%, significantly higher than previous wave
2019-20, 84%;
2018-19, 85%;
2017-18, 86%
West/Territories:
2020-21, 83%,
2019-20, 82%;
2018-19, 82%;
2017-18, 82%
Ontario:
2020-21, 89%, significantly higher than previous wave
2019-20, 85%;
2018-19, 85%;
2017-18, 87%
Quebec:
2020-21, 83%, significantly lower than previous wave
2019-20, 88%;
2018-19, 88%;
2017-18, 90%
Atlantic:
2020-21, 89%, significantly higher than previous wave
2019-20, 79%;
2018-19, 85%;
2017-18, 90%
Q38a. How satisfied were you with the service you received from Service Canada related to your application? please use a 5-point scale, where 1 means very dissatisfied, and 5 means very satisfied. Base: All Respondents (n=4200), Ontario (n=1148), Quebec (n=1006), West/ Territories (n=1626), Atlantic (n=420).
Trust in Service Canada
Consistent with previous years, the vast majority of clients expressed trust in Service Canada to deliver services effectively to Canadians. CPP-D clients were less likely to express trust compared to all clients, while SIN clients were more likely.
Compared to 2019-20, ratings have improved among EI clients and declined among CPP clients (returning to levels observed in 2018-19).
This measure remained strongly correlated to overall satisfaction
Figure long description
Trust in Service Canada – Overall and By Program (% Rated 4 or 5)
Total
2018-19, 83%
2019-20, 83%
2020-21, 84%
SIN
2018-19, 91%
2019-20, 93%
2020-21, 90%, significantly higher than total
CPP
2018-19, 81%
2019-20, 86%
2020-21, 81%, significantly lower than previous wave
OAS/GIS
2018-19, 79%
2019-20, 81%
2020-21, 82%
EI
2018-19, 80%
2019-20, 77%
2020-21, 82%, significantly higher than previous wave
CPPD
2018-19, 64%
2019-20, 64%
2020-21, 67%, significantly lower than total
There was a strong correlation between trust in Service Canada and overall satisfaction (0.62).
Q38b. How much would you say you trust Service Canada to deliver services effectively to Canadians? Please use a 5-point scale, where 1 means do not trust at all, and 5 means trust a great deal. Base: All Respondents (n=4200)
Assessment of Duration of End-to-End Journey
At eight in ten, the majority of clients found the timeliness of service reasonable, higher than in 2019-20 and the highest level observed. SIN and OAS/GIS clients were more likely to have rated the timeliness of service as reasonable, while CPP-D clients were less likely.
Compared to 2019-20, EI and CPP-D clients were more likely to agree that the timeliness of service was reasonable.
Figure long description
The amount of time it took, from when you started gathering information to when you got a decision on your application, was reasonable (% Rating 4 or 5)
Total
2017-18, 77%
2018-19, 76%
2019-20, 77%
2020-21, 81%, significantly higher than previous wave
SIN
2017-18, 85%
2018-19, 87%
2019-20, 89%
2020-21, 85%, significantly higher than total
CPP
2017-18, 80%
2018-19, 83%
2019-20,83%
2020-21, 81%
OAS/GIS
2017-18, 75%
2018-19, 80%
2019-20, 85%
2020-21, 85%, significantly higher than total
EI
2017-18, 73%
2018-19, 69%
2019-20, 68%
2020-21, 80%, significantly higher than previous wave
CPPD
2017-18, 47%
2018-19, 49%
2019-20, 49%
2020-21, 57%, significantly lower than total, significantly higher than previous wave
Q36b. Thinking about the service you received, how much do you agree or disagree with the following statements…The amount of time it took, from when you started gathering information to when you got a decision on your application, was reasonable. Base: All respondents (n=4200)
Assessment of Duration of End-to-End Journey
SIN and OAS/GIS clients were more likely to have rated the timeliness of service as reasonable, while CPP-D clients were less likely.
Compared to 2019-20, EI and CPP-D clients were more likely to agree that the timeliness of service was reasonable.
Figure long description
The amount of time it took, from when you started gathering information to when you got a decision was reasonable
Total 2020-21 (n=4200)
5-strongly agree, 58%
Rated 4, 24%
Rated 3, 10%
Rated 2, 3%
1-strongly disagree, 4%
EI (n=1162)
5-strongly agree, 53%
Rated 4, 27%
Rated 3, 11%
Rated 2, 4%
1-strongly disagree, 6%
CPP (n=752)
5-Strongly agree, 59%
Rated 4, 22%
Rated 3, 12%
Rated 2, 3%
1 – Strongly disagree, 3%
CPP-D (n=692)
5-Strongly agree, 35%
Rated 4, 22%
Rated 3, 19%
Rated 2, 8%
1-strongly disagree, 14%
Not applicable, 1%
Don’t know, 1%
OAS&GIS (n=842)
5-Strongly agree, 65%
Rated 4, 20%
Rated 3, 8%
Rated 2 2%
1-strongly disagree, 3%
Not applicable, 2%
Don’t know, 1%
SIN (n=749)
5-strongly agree, 64%
Rated 4, 20%
Rated 3, 9%
Rated 2, 4%
1-Strongly disagree, 2%
Not applicable, 1%
Percent Rating 4 or 5
Total
2020-21, 81%, significantly higher than previous wave
2019-20, 77%
2018-19, 76%
2017-18, 77%
EI
2020-21, 80%, significantly higher than previous wave
2019-20, 68%
2018-19, 69%
2017-18, 73%
CPP
2020-21, 81%
2019-20, 83%,
2018-19, 83%
2017-18, 80%
CPP-D
2020-21, 57%, significantly higher than previous wave, significantly lower than total
2019-20, 49%
2018-19, 49%
2017-18, 47%
OAS/GIS
2020-21, 85%, significantly higher than total
2019-20, 85%
2018-19, 80%
2017-18, 75%
SIN
2020-21, 85%, significantly higher than total
2019-20, 89%
2018-19, 87%
2017-18, 85%
Highlights By Program
Satisfaction with Service Experience by Program
Compared to 2019-20, satisfaction among EI clients increased and declined among SIN clients. Satisfaction was stable for all other programs.
Consistent with previous years, satisfaction remained lower for CPP-D clients.
Figure long description
Satisfaction with Service Experience – by Program (% Rated 4 or 5)
SIN
2017-18, 94%
2018-19, 92%
2019-20, 94%
2020-21, 89%, significantly lower than previous wave
CPP
2017-18, 87%
2018-19, 87%
2019-20, 88%
2020-21, 86%
OAS/GIS
2017-18, 86%
2018-19, 87%
2019-20, 87%
2020-21, 88%
EI
2017-18, 83%
2018-19, 80%
2019-20, 77%
2020-21, 84%, significantly higher than previous wave
CPPD
2017-18, 64%
2018-19, 62%
2019-20, 60%
2020-21, 63%
Q38a. How satisfied were you with the service you received from Service Canada related to your application? please use a 5-point scale, where 1 means very dissatisfied, and 5 means very satisfied. Base: All Respondents (n=4200).
CX Performance and Service Attributes – EI
Figure long description
Overall Satisfaction
84% rated 4 or 5
Arrow pointing up, increase in overall satisfaction from 2019-20 (77%)
There were no significant difference by age, gender, or region
Channel satisfaction
Increase for online (77% vs 71% and specialized call centres (70% vs 59%) from 2019-20
28% followed up with Service Canada to check on the status of their application (41% in 2019-20)
13% provided additional information (21% in 2019-20)
27% were contacted by Service Canada about their application status (34% in 2019-20).
Figure long description
Aware
Ease of figuring out eligibility +7pts
2020-21: 73%, significantly higher than previous waves
2019-20: 66%
Able to find information needed within reasonable time +3pts, top 5 drive of satisfaction for EI clients
2020-21: 73%, significantly lower than previous waves
2019-20: 70%
Apply
Confident application would be processed in reasonable amount of time +8pts
2020-21: 67%, significantly higher than previous waves
2019-20: 59%
Ease of putting together the information needed to apply +6pts
2020-21: 81%, significantly higher than previous waves
2019-20: 75%
Follow-up
Ease of following up on application +2 pts
2020-21: 59%
2019-20: 57%
Figure long description
Overall
Duration of client journey reasonable +14pts, top 5 driver of satisfaction for EI clients
2020-21: 82% , significantly higher than previous wave
2019-20: 68%
Clarity of process +12pts
2020-21: 77%, significantly higher than previous wave, significantly lower than total
2019-20: 65%
Specialized call centre staff were helpful +10 pts, top 5 driver of satisfaction for EI clients
2020-21: 83%, significantly higher than previous wave
2019-20: 73%
Overall effectiveness +7pts
2020-21: 83%, significantly higher than previous wave
2019-20: 76%
Received consistent information +6pts
2020-21: 82%, significantly higher than previous wave
2019-20: 76%
Ease of getting help when needed -5pts
2020-21: 65%, significantly lower than previous wave, significantly lower than total
2019-20: 70%
Service Canada phone reps that called back were helpful
2020-21: 84%, new attribute this year
Trust +5pts
2020-21: 82%, significantly higher than previous wave
2019-20: 77%
Base: EI-clients, n=1162. Margin of Error +/- 2.9 percentage points. Within this, sample size varies by statement.
*New attribute this year.
CX Performance and Service Attributes – CPP
Figure long description
Overall Satisfaction
85% rated 4 or 5
Stable with previous waves
There were no significant differences by age, gender, or region
Channel satisfaction
Increase for specialized call centres (81% vs. 67%) from 2019-20
Figure long description
Aware
Ease of understanding info about program -8pts
2020-21: 76%, significantly lower than previous wave
2019-20: 84%
Ease of deciding best age to start pension -8pts
2020-21: 64%, significantly lower than previous wave
2019-20: 72%
Apply
Able to complete application in reasonable time -3pts
2020-21: 80%, significantly lower than the total
2019-20: 83%
Ease of completing form -1pt
2020-21: 81%, significantly lower than the total
2019-20: 82%
Confident application would be processed in a reasonable amount of time, Top 5 driver of satisfaction for CPP clients
2020-21: 77%, significantly higher than total
2019-20: 79%
Ease of understanding requirements of application +5pts
2020-21: 85%, significantly higher than previous waves
2019-20: 80%
Follow-up
Ease of following up on application
2020-21: 68%
2019-20: 68%
Figure long description
Overall
Specialized call centre staff were helpful +13 pts, top 5 driver of satisfaction for CPP clients
2020-21: 85%, significantly higher than previous waves
2019-20: 72%
Duration of client journey Reasonable -2 pts, top 5 driver of satisfaction for CPP clients
2019-20: 81%
2020-21: 83%
Trust -5 pts
2020-21: 81%, significantly lower than previous waves
2019-20: 86%
Overall effectiveness -5 pts, top 5 driver of satisfaction for CPP clients
2020-21: 80%, significantly lower than previous waves, significantly lower than total
2019-20: 85%
Needed to explain situation only once: -7 pts
2020-21: 76%, significantly lower than previous wave
2019-20: 83%
Base: CPP-clients, n=752. Margin of Error +/- 3.6 percentage points. Within this, sample size varies by statement.
*
New attribute this year.
CX Performance and Service Attributes – OAS/GIS
Figure long description
Overall Satisfaction
88% rated 4 or 5
Stable with previous waves
Satisfaction was higher among clients in Rural (90%) and Urban (87%) areas and lower among Remote clients (76%).
Channel Satisfaction
Increase for specialized call centres (76% vs. 64%) from 2019-20
Figure long description
Aware
Ease of understanding information about program +2pts
2020-21: 84%, significantly higher than total
2019-20: 82%
Ease of finding out what information needed to provide when applying -11 pts, Top 5 drivers of satisfaction for OAS/GIS clients
2020-21: 72%
2019-20: 83%
Apply
Ease of completing the application form -9pts
2020-21: 76%, significantly lower than previous waves, significantly lower than total
2019-20: 85%
Complete application in reasonable time -6pts
2020-21: 83%, significantly lower than previous waves
2019-20: 89%
Confident your application would be processed in a reasonable time -12pts
2020-21: 70%, significantly lower than previous waves
2019-20: 82%
Follow-up
Ease of following up on application -7pts
2020-21: 70%
2019-20: 77%
Figure long description
Overall
Duration of client journey reasonable, top 5 drivers of satisfaction for OAS/GIS clients
2019-20: 85%, significantly higher than total
2020-21: 85%
Overall effectiveness -1pt, top 5 driver of satisfaction for OAS/GIS clients
2020-21: 87%
2019-20: 88%
Service Canada in person representatives were helpful -20pts
2020-21: 72%, significantly lower than previous waves, significantly lower than total
2019-20: 92%
Completing steps online made it easier +8pts, top 5 driver of satisfaction for OAS/GIS clients
2020-21: 56%, significantly higher than previous waves, significantly lower than total
2019-20: 48%
Confident personal information was protected +6pts
2020-21: 85% , significantly higher than previous waves
2019-20: 79%
Received consistent info +5pts
2020-21: 87%, significantly higher than previous waves
2019-20: 82%
Confident any issues or problems would be easily resolved +5pts
2020-21: 82%, significantly higher than pervious waves
2019-20: 77%
Base: OAS/GIS-clients, n=845. Margin of Error +/- 3.4 percentage points Within this, sample size varies by statement.
CX Performance and Service Attributes – CPP-D
Figure long description
Overall satisfaction
63% rated 4 or 5
stable with previous waves
There was no significant differences by age, gender, or region
Channel Satisfaction
Stable with previous waves
Figure long description
Aware
Ease of figuring out eligibility +7pts
2020-21: 46%, significantly lower than total
2019-20: 39%
Ease of understanding info about program +2pts
2020-21: 60%, significantly higher than previous wave, significantly lower than total
2019-20: 48%
Apply
Confident application would be processed in reasonable amount of time +6pts
2020-21: 40%, significantly lower than total, significantly higher than previous waves
2019-20: 34%
Ease of putting together the information needed to apply +1pt
2020-21: 44%, significantly lower than total
2019-20: 43%
Follow-up
Ease of following up on application +4pts, top 5 driver of satisfaction for CPPD clients
2020-21: 52%, significantly lower than total
2019-20: 48%
Figure long description
Overall
Duration of client journey reasonable +8pts, top[ 5 driver of satisfaction for CPPD clients
2019-20: 57%, significantly lower than total, significantly higher than previous waves
2020-21: 49%
Trust +3pts
2020-21: 67%, significantly lower than total
2019-20: 64%
Overall effectiveness +1pt
2019-20: 58%, significantly lower than total
2020-21: 57%
Specialized call centre staff were helpful, top 5 drivers of satisfaction for CPPD clients
2020-21: 68%, significantly lower than total
2019-20: 68%
Clarity of process +5pts, top 5 driver of satisfaction for CPPD clients
2020-21: 56%, significantly lower than total
2019-20: 51%
It was clear what to do if you had a problem or question -1pt, top 5 drivers of satisfaction for CPPD clients
2020-21: 60%, significantly lower than total
2019-20: 61%
Base: CPP-D-clients n=692. Margin of Error +/- 3.7 percentage points. Within this, sample size varies by statement.
Qualitative Insights on the CPP-D Client Journey
A key factor of the overall client experience that emerged unaided in discussions about applications across all programs was the role of outside influences and supports – for some participants, clients rely on family members or community members/friends (mostly CPP-D applicants) to help them navigate “the system” – primarily in finding information and helping complete applications. Insurance companies were mentioned by CPP-D clients as playing a role, which was sometimes considered a negative experience in terms of being treated poorly, lacking empathy and the threat of discontinuing benefits if the client did not apply for CPP-D benefits.
Participants who were CPP-D clients noted that mental and/or physical conditions meant that they delayed in applying for CPP-D benefits, and then their difficulties were exacerbated by the long wait time for a decision.
Unprompted, CPP-D participants noted that the program representatives they spoke to were very helpful and kind in terms of tone and issue resolution; it was more the overall process or “the system” that was a point of frustration.
Frustrating. It was intense trying to find things. I can't sit and scroll all day. I had to have my daughter help me because I can't do the physical part of it. Show me any government website that's user friendly. It doesn’t exist. It was vague. A lot of the information I needed wasn’t there. I talked to someone and told them to put this specific information on the website or in the letter to the applicant. Not all the scenarios are on there. I also spoke with a CPPD lawyer, agency, whatever...they didn’t have their information accurate either. No one knows what the hell they're talking about.
For me, with my disability, I struggled for months just to fill out the paperwork. I had no one to go to and sit down to help me and kinda push me to get it done. With the depression and anxiety I would start it and I would put it away.
The Government side [of service representative] was amazing. They were empathetic. When you talked to them they cared. They really cared about what was going on with you. Where [name of Insurance Company], it was like it was just a job to them. They didn’t have the empathy.
CX Performance and Service Attributes – SIN
Figure long description
Overall satisfaction
89% rated 4 or 5
Decrease in overall satisfaction from 2019-20 (94%)
Satisfaction was highest among clients in Ontario (93%), lowest among clients in the West (87%) and Quebec (87%).
Satisfaction was highest among clients 31 to 59 years old (93%), lowest among clients 18-34 (87%)
Channel satisfaction
Stable with previous waves
Figure long description
Aware
Able to find info needed in reasonable amount of time +7pts
2020-21: 87%, significantly higher than total, significantly higher than previous wave
2019-20: 80%
Apply
Ease of understanding requirements of the application +5pts
2020-21: 90%, significantly higher than total, significantly higher than previous waves
2019-20: 85%
Confident application would be processed in reasonable amount of time -10pts
2020-21: 68%
2019-20: 78%
Follow-up
Ease of following up on application -1pt, top 5 driver of satisfaction for SIN clients
2020-21: 72%
2019-20: 73%
Figure long description
Overall
Duration of client journey reasonable -4pts, top 5 driver of satisfaction for SIN clients
2020-21: 85% , significantly higher than total
2019-20: 89%
Overall effectiveness
2020-21: 91%, significantly higher than total
2019-20: 91%
Specialized call centre staff were helpful +18pts, top 5 driver of satisfaction for SIN clients
2020-21: 92%, significantly higher than total. Significantly higher than previous waves
2019-20: 74%
Clarity of process +5pts
2020-21: 88%, significantly higher than total, significantly higher than previous waves
2019-20: 83%
Service Canada in person representatives were helpful -1pt, top 5 driver of satisfaction for SIN clients
2020-21: 95% , significantly higher than total
2019-20: 96%
Service Canada phone reps that called back were helpful, top 5 driver of satisfaction for SIN clients
2020-21: 89%*
Base: SIN-clients, n=749. Margin of Error +/- 3.6 percentage points Within this, sample size varies by statement.
*New attribute this year/
Qualitative Insights on SIN Journey
For SIN applicants, some went in person because it was the fastest way to get their number – as applying online would mean having to wait for their number in the mail and this would result in a delay in being able to work. The in-person channel is less appealing for those who have to travel long distances, pay for parking, or anticipate a long wait/lineup.
SIN applicants had program-specific ideas including better communication outreach to newcomers at land borders, airports, community centres and other places newcomers frequent; being made aware that their SIN number is expiring; being given sufficient time and notice to put their documents together prior to expiration; and having documents better vetted so that they don’t need to be re-submitted.
Yeah, so if you really, badly need it on the same… like you need it in a day, you need to go to in person. But if you have the time to wait for a week, I think online will be okay too.
I think that [if] the [SIN] brochure is just handed to someone at the airport, ‘Here, this is what you need’, that would help. Because trust me, when you… come into Canada, when you apply to come to Canada, for instance, I was coming to meet family friends, and everyone. My mind was just, I was in a la-la land, so I wasn’t thinking of SIN number at that time, you know what I mean, until I actually had to get a job. And my job said, ‘Hey, you need your SIN number’; I said, ‘Oh yes, thank you, I’ll got get it’, you know. […] when you come over by land, on the land border, they don’t give you any information. There is absolutely nobody there. Border Patrol, or Border Services, and Immigration are two different entities, and they don’t communicate. So, when I was crossing the border, they did not care what my immigration status was or even ask me for any of that.
[…] if still an option could be provided where these things can be generated online once you fill out the application form, and then you receive like an encrypted e-mail […] that one could just open, you know, and access the SIN number, and maybe print it off or maybe save it secure elsewhere, that would help
Key Differences Between OAS and OAS/GIS Clients
Figure long description
Overall Satisfaction (% Rated 4 or 5)
OAS:
2020-21, 88%;
2019-20, 86%;
2018-19, 87%;
2017-18, 86%;
OAS/GIS:
2020-21, 88%;
2019-20, 95%;
2018-19, 85%;
2017-18, 85%;
Figure long description
Trust (% Rated 4 or 5):
OAS:
2020-21, 82%;
2019-20, 78%;
2018-19, 80%;
2017-18, N/A;
OAS/GIS:
2020-21, 81%, significantly lower than previous wave;
2019-20, 92%;
2018-19, 76%;
2017-18, N/A;
Service Channel Satisfaction:
In person:
OAS:
2020-21, 82%, small sample size;
2019-20, 87%;
2018-19, 84%;
2017-18, 80%;
OAS/GIS:
2020-21, 89%, small sample size;
2019-20, 85%;
2018-19, 84%;
2017-18, 91%;
Online:
OAS:
2020-21, 78%;
2019-20, 72%;
2018-19, 74%;
2017-18, 82%;
OAS/GIS:
2020-21, 78%;
2019-20, 77%;
2018-19, 73%;
2017-18, 69%;
Specialized Call Centre:
OAS:
2020-21, 74%, significantly higher than previous wave
2019-20, 57%;
2018-19, 79%;
2017-18, 69%;
OAS/GIS:
2020-21, 87%, small sample size, significantly higher than total;
2019-20, 81%;
2018-19, 78%;
2017-18, 83%;
1 800 O-Canada
OAS:
2020-21, 70%, very small sample size;
2019-20, 61%;
2018-19, 74%;
2017-18, 44%;
OAS/GIS:
2020-21, 60%, small sample size
2019-20, 75%;
2018-19, 71%;
2017-18, 78%;
My Service Canada Account:
OAS:
2020-21, 65%, small sample size;
2019-20, 76%;
2018-19, N/A;
2017-18, N/A;
OAS/GIS:
2020-21, 71%, very small sample size
2019-20, 68%;
2018-19, N/A;
2017-18, N/A;
eSERVICECANADA:
OAS:
2020-21, 69%, small sample size;
2019-20, N/A;
2018-19, N/A;
2017-18, N/A;
OAS/GIS:
2020-21, 38%, very small sample size
2019-20, N/A;
2018-19, N/A;
2017-18, N/A;
Overall satisfaction was consistent among OAS and OAS/GIS compared to all clients.
Compared to 2019-20, satisfaction among OAS clients was consistent and unchanged, while satisfaction declined marginally among OAS/GIS clients returning to levels observed in 2018-19.
OAS and OAS/GIS clients were equally as likely to express trust in Service Canada as all clients, however ratings have declined among OAS/GIS clients compared to 2019-20.
OAS/GIS clients had higher satisfaction with specialized call centres compared to all clients, while satisfaction among OAS clients increased compared to 2019-20.
Notably, the majority of OAS clients were auto-enrolled (57%), while the opposite was true for OAS/GIS clients (71% non-auto-enrolled). Due to the significant difference in composition by program, findings from comparisons between these client groups were heavily influenced by whether the client was auto-enrolled or not.
Key Differences Between OAS and OAS/GIS Clients cont'd
OAS clients provided higher ratings for clarity and confidence in the issue resolution process compared to all clients. OAS/GIS clients provided higher ratings for the overall ease of applying and lower ratings for overall clarity of process, confidence personal information was protected and that the amount of time from start to finish was reasonable. Both OAS and OAS/GIS gave lower ratings for agreement that completing steps online made it easier.
Compared to 2019-20, OAS clients provided higher ratings for clarity and confidence in the issue resolution process, confidence personal information was protected and that they received consistent information. For OAS/GIS clients, there were declines across several measures including the overall clarity of process, needing to explain your situation only once, ease of getting help in general, provided service in choice of English or French, confidence personal information was protected, received consistent information and the amount of time was reasonable.
Figure long description
It was clear what to do if you had a problem or question.
OAS
2020-21, 85%, significantly higher than previous wave, significantly higher than total
2019-20, 78%
2018-19, 79%
2017-18, 74%
OAS/GIS
2020-21, 78%
2019-20, 87%
2018-19, 77%
2017-18, 77%
Throughout the process it was clear what would happen next and when it would happen.
OAS
2020-21, 84%
2019-20, 80%
2018-19, 78%
2017-18, -
OAS/GIS
2020-21, 74%, significantly lower than previous wave, significantly lower than total
2019-20, 85%
2018-19, 78%
2017-18, -
You were confident that any issues or problems would have been easily resolved.
OAS
2020-21, 82%, significantly higher than previous wave, significantly higher than total
2019-20, 76%
2018-19, 78%
2017-18, 80%
OAS/GIS
2020-21, 79%
2019-20, 81%
2018-19, 78%
2017-18, 84%
You needed to explain your situation only once.
OAS
2020-21, 78%
2019-20, 78%
2018-19, 78%
2017-18, 73%
OAS/GIS
2020-21, 79%, significantly lower than previous wave
2019-20, 92%
2018-19, 65%
2017-18, 76%
It was easy to get help when you needed it.
OAS
2020-21, 70%
2019-20, 71%
2018-19, 70%
2017-18, 65%
OAS/GIS
2020-21, 75%, significantly lower than previous wave
2019-20, 88%
2018-19, 80%
2017-18, 77%
Overall, it was easy for you to apply for [ABBREV]
OAS
2020-21, 87%
2019-20, 91%
2018-19, 87%
2017-18, 83%
OAS/GIS
2020-21, 92%, significantly higher than total
2019-20, 94%
2018-19, 86%
2017-18, 85%
You were provided with service in your choice of English or French.
OAS
2020-21, 94%
2019-20, 95%
2018-19, 96%
2017-18, 94%
OAS/GIS
2020-21, 93%, significantly lower than previous wave
2019-20, 99%
2018-19, 98%
2017-18, 97%
You were confident that your personal information was protected.
OAS
2020-21, 86%, significantly higher than previous wave
2019-20, 76%
2018-19, 83%
2017-18, 81%
OAS/GIS
2020-21, 81%, significantly lower than total, significantly lower than previous wave
2019-20, 92%
2018-19, 82%
2017-18, 85%
Being able to complete steps online made the process easier for you.
OAS
2020-21, 58%, significantly lower than total
2019-20, 49%
2018-19, 37%
2017-18, 36%
OSA/GIS
2020-21, 49%, significantly lower than total
2019-20, 48%
2018-19, 31%
2017-18, 38%
You received consistent information
OAS
2020-21, 88%, significantly higher than previous wave
2019-20, 81%
2018-19, 83%
2017-18, -
OAS/GIS
2020-21, 80%, significantly lower than previous wave
2019-20, 90%
2018-19, 79%
2017-18, -
The amount of time it took, from when you started gathering information to when you got a decision on your application, was reasonable.
OAS
2020-21, 86%
2019-20, 84%
2018-19, 81%
2017-18, 75%
OAS/GIS
2020-21, 76%, significantly lower than total, significantly lower than previous wave
2019-20, 92%
2018-19, 76%
2017-18, 76%
OAS clients provided lower ratings for the helpfulness of Service Canada in person reps compared to all clients. OAS/GIS clients provided higher ratings for the ease of follow up and lower ratings for the helpfulness of 1 800 O-Canada phone reps and eServiceCanada reps, understanding the requirements of the application and gathering the information needed to apply. Both OAS and OAS/GIS gave lower ratings for being provided service in a way that protected their health and safety during the COVID-19 pandemic and ease of completing the application form.
Compared to 2019-20, OAS clients provided lower ratings for the ease of completing the application form, while OAS/GIS clients provided lower ratings for being able to complete the application in a reasonable time and that it was easy to access service in a language they could speak and understand well. Both OAS and OAS/GIS clients provided lower ratings for the helpfulness of Service Canada in person reps.
Figure long description
Differences/ Change in Service Attributes
Service Canada representatives that you dealt with in person were helpful
OAS
2020-21, 65%, significantly lower than total, significantly lower than previous wave
2019-20, 89%
2017-18, 81%
OAS/GIS
2020-21, 95%, significantly lower than previous wave
2019-20, 100%
2017-18, 93%
1 800 O-Canada phone representatives were helpful
OAS
2020-21, 99%
OAS/GIS
2020-21, 67%, significantly lower than total
The Service Canada phone representatives that called you back after you completed an online form were helpful
OAS
2020-21, 94%
OAS/GIS
2020-21, 58%, significantly lower than total
You were provided service in a way that protected your health and safety during the COVID-19 pandemic
OAS
2020-21, 82%, significantly lower than total
OAS/GIS
2020-21, 79%, significantly lower than total
You were able to complete the application in a reasonable amount of time
OAS
2020-21, 84%
2019-20, 86%
2017-18, 79%
OAS/GIS
2020-21, 80%
2019-20, 95%
2017-18, 82%
Understanding the requirements of the application
OAS
2020-21, 88%
2019-20, 84%
2017-18, 78%
OAS/GIS
2020-21, 75%, significantly lower than total
2019-20, 79%
2017-28, 73%
Putting together the information you needed to apply for [INSERT ABBREV]
OAS
2020-21, 79%
2019-20, 78%
2017-18, 75%
OAS/GIS
2020-21, 70%, significantly lower than total
2019-20, 82%
2017-18, 76%
Completing the application form
OAS
2020-21, 75%, significantly lower than total, significantly lower than previous wave
2019-20, 85%
2017-18, 82%
OAS/GIS
2020-21, 76%, significantly lower than total
2019-20, 85%
2017-18, 76%, significantly lower than total
Ease of follow up
OAS
2020-21, 68%
2019-20, 75%
2017-18, 74%
OAS/GIS
2020-219, 77%, significantly higher than total
2019-20, 85%
2017-18, 64%
It was easy to access service in a language I could speak and understand well
OAS
2020-21, 94%
2019-20, 93%
2018-19, 92%
OAS/GIS
2020-21, 88%, significantly lower than total, significantly lower than previous wave
2019-20, 97%
2018-19, 93%
Key Differences Between Auto-Enroll and Non Auto-Enroll Clients
Figure long description
Overall Satisfaction (% Rated 4 or 5)
Auto-enroll
2020-21, 88%
2019-20, 84%
2018-19, 88%
Non auto-enroll
2020-21, 88%
2019-20, 86%
2018-19, 92%
% Rated 5
Auto-enroll, 69%
Non auto-enroll, 56%
Figure long description
Trust (% rated 4 or 5)
Auto-enroll:
2020-21, 84%, significantly higher than previous wave
2019-20, 78%
2018-19, 80%
Non-Auto-Enroll:
2020-21, 80%
2019-20, 84%
2018-19, 79%
Service Channel Satisfaction
In person:
Auto-enroll:
2020-21, 77%, very small sample size
2019-20,88%
2018-19, 83%
Non-Auto-Enroll:
2020-21, 84%
2019-20, 86%
2018-19, 85%
Online:
Auto-enroll:
2020-21, n/a
2019-20,77%
2018-19, 73%
Non-Auto-Enroll:
2020-21, 78%
2019-20, 72%
2018-19, 75%
Specialized Call Centre:
Auto-enroll:
2020-21, 80%, small sample size
2019-20,68%
2018-19, 78%
Non-Auto-Enroll:
2020-21, 74%
2019-20, 61%
2018-19, 79%
1 800 O-Canada:
Auto-enroll:
2020-21, n/a
2019-20, 87%
2018-19, 75%
Non-Auto-Enroll:
2020-21, 67%, small sample size
2019-20, 63%
2018-19, 71%
My Service Canada Account:
Auto-enroll:
2020-21, 64%, small sample size
2019-20,77%
2018-19, N/A
Non-Auto-Enroll:
2020-21, 69%, very small sample size
2019-20, 69%
2018-19, N/A
eSERVICECANADA:
Auto-enroll:
2020-21, 73%, very small sample size
2019-20, n/a
2018-19, N/A
Non-Auto-Enroll:
2020-21, 56%, significantly lower than total, small sample size
2019-20, n/a
2018-19, N/A;
Overall satisfaction was consistent among Auto-Enroll and Non Auto-Enroll clients compared to all clients, however Auto-Enroll clients were more likely to provide a rating of 5 out of 5.
Satisfaction among both Auto-Enroll and Non Auto-Enroll clients was consistent and unchanged compared to 2019-20.
Auto-Enroll and Non Auto-Enroll clients were equally as likely to express trust in Service Canada as all clients, although ratings have improved among Auto-Enroll clients compared to 2019-20.
Non Auto-Enroll clients were less satisfied with eServiceCanada compared to all clients.
Non Auto-enroll clients provided lower ratings compared to all clients for agreement that completing steps online made it easier, needing to explain their situation only once and being provided service in their choice of English or French.
Compared to 2019-20, Auto-Enroll clients provided higher ratings for several measures including clarity and confidence in the issue resolution process, overall clarity of process, needing to explain their situation only once, being provided service in their choice of English or French and confidence personal information was protected. Non Auto-Enroll clients provided higher ratings for agreement that completing steps online made it easier and lower ratings for needing to explain their situation only once, ease of getting help in general and being provided service in their choice of English or French.
Figure long description
Differences/ Change in Service Attributes
Being able to complete steps online made the process easier for you.
non auto-enroll
2020-21, 56%, significantly higher than previous wave, significantly lower than total
2019-20, 48%
2018-19, 36%
It was clear what to do if you had a problem or question.
Auto-enroll
2020-21, 85%, significantly higher than previous wave
2019-20, 75%
2018-19, 78%
non auto-enroll
2020-21, 83%
2019-20, 87%
2018-19, 79%
Throughout the process it was clear what would happen next and when it would happen.
Auto-enroll
2020-21, 85%, significantly higher than previous wave
2019-20, 78%
2018-19, 81%
non auto-enroll
2020-21, 81%
2019-20, 85%
2018-19, 75%
You were confident that any issues or problems would have been easily resolved.
Auto-enroll
2020-21, 82%, significantly higher than previous wave
2019-20, 73%
2018-19, 77%
non auto-enroll
2020-21, 81%
2019-20, 84%
2018-19, 78%
You needed to explain your situation only once.
Auto-enroll
2020-21, 83%, significantly higher than previous wave
2019-20, 76%
2018-19, 76%
non auto-enroll
2020-21, 70%, significantly lower than total, significantly lower than previous wave
2019-20, 86%
2018-19, 75%
It was easy to get help when you needed it.
Auto-enroll
2020-21, 70%
2019-20, 70%
2018-19, 69%
non auto-enroll
2020-21, 72%, significantly lower than previous wave
2019-20, 80%
2018-19, 74%
You were provided with service in your choice of English or French.
Auto-enroll
2020-21, 97%, significantly higher than previous wave
2019-20, 94%
2018-19, 98%
non auto-enroll
2020-21, 91%, significantly lower than previous wave, significantly lower than total
2019-20, 98%
2018-19, 98%
You were confident that your personal information was protected.
Auto-enroll
2020-21, 86%, significantly higher than previous wave
2019-20, 75%
2018-19, 82%
non auto-enroll
2020-21, 85%
2019-20, 86%
2018-19, 84%
Auto-Enroll clients provided lower ratings compared to all clients for the ease of accessing service in a language they could speak and understand well and the helpfulness of eServiceCanada reps. Both Auto-Enroll and Non Auto-Enroll clients provided lower ratings for the helpfulness of Service Canada in person reps and being provided service in a way that protected your health and safety during the COVID-19 pandemic compared to all clients .
Compared to 2019-20, Auto-Enroll clients provided higher ratings for receiving consistent information and lower ratings for having travelled a reasonable distance to access service (in person). Non Auto-Enroll clients provided lower ratings for the amount of time was reasonable and the ease of follow-up. Both Auto-Enroll and Non Auto-Enroll clients provided lower ratings for the helpfulness of Service Canada in person reps.
Figure long description
Differences/ Change in Service Attributes
Service Canada representatives that you dealt with in person were helpful
Auto-enroll
2020-21, 62%, significantly lower than total, significantly lower than previous wave
2019-20, 91%
Non Auto-enroll
2020-21, 73%, significantly lower than total, significantly lower than previous wave
2019-20, 93%
You travelled a reasonable distance to access the service
Auto-enroll
2020-21, 68%, significantly lower than previous wave
2019-20, 90%
Non Auto-enroll
2020-21, 75%
2019-20, 79%
You received consistent information
Auto-enroll
2020-21, 89%, significantly higher than previous wave
2019-20, 77%
2018-19, 83%
Non auto-enroll
2020-21, 85%
2019-20, 90%
2018-19, 81%
It was easy to access service in a language I could speak and understand well
Auto-enroll
2020-21, 92%, significantly lower than total
2019-20, 92%
2018-19, 93%
Non auto-enroll
2020-21, 95%
2019-20, 97%
2018-19, 91%
The amount of time it took, from when you started gathering information to when you got a decision on your application, was reasonable.
Auto-enroll
2020-21, 87%
2019-20, 84%
2018-19, 79%
Non auto-enroll
2020-21, 82%, significantly lower than previous wave
2019-20, 88%
2018-19, 80%
The Service Canada phone representatives that called you back after you completed an online form were helpful
Auto-enroll
2020-21, 67%, significantly lower than total
Non auto-enroll
2020-21, 92%
You were provided service in a way that protected your health and safety during the COVID-19 pandemic
Auto-enroll
2020-21, 72%, significantly lower than total
Non auto-enroll
2020-21, 67%, significantly lower than total
Ease of follow-up
Auto-enroll
2020-21, 72%
2019-20, 75%
Non auto-enroll
2020-21, 67%, significantly lower than previous wave
2019-20, 85%
Ease Service Attributes: Overall and By Program
Figure long description
% Rated 4/5:
It was easy to access service in a language I could speak and understand well
Total
2020-21, 95%
2019-20, 94%
2018-19, 94%
2017-18, N/A
EI
2020-21, 95%
2019-20, 94%
2018-19, 96%
2017-18, N/A
CPP
2020-21, 92%, significantly lower than total
2019-20, 95%
2018-19, 92%
2017-18, N/A
CPP-D
2020-21, 85%, significantly lower than total, significantly lower than previous wave
2019-20, 91%
2018-19, 90%
2017-18, N/A
SIN
2020-21, 96%
2019-20, 94%
2018-19, 94%
2017-18, N/A
OAS/GIS
2020-21, 93%, significantly lower than total
2019-20, 94%
2018-19, 92%
2017-18, N/A
Overall, it was easy for you to apply for
Total
2020-21, 86%
2019-20, 84%
2018-19, 85%
2017-18, 84%
EI
2020-21, 87%
2019-20, 84%
2018-19, 86%
2017-18, 84%
CPP
2020-21, 85%
2019-20, 88%
2018-19, 88%
2017-18, 88%
CPP-D
2020-21, 56%, significantly lower than total
2019-20, 55%
2018-19, 60%
2017-18, 57%
SIN
2020-21, N/A
2019-20, N/A
2018-19, 87%
2017-18, 87%
OAS/GIS
2020-21, 88%
2019-20, 92%
2018-19, 87%
2017-18, 84%
Throughout the process it was clear what would happen next and when it would happen.
Total:
2020-21, 81%
2019-20, 73%
2018-19, 77%;
2017-18, N/A;
EI:
2020-21, 77%, significantly lower than total, significantly higher than previous waves
2019-20, 65%
2018-19, 74%
2017-18, N/A
CPP:
2020-21, 80%
2019-20, 80%
2018-19, 78%
2017-18, N/A
CPP-D:
2020-21, 56%, significantly lower than total
2019-20, 51%
2018-19, 53%
2017-18, N/A
SIN:
2020-21, 88%, significantly higher than total, significantly higher than previous wave
2019-20, 83%
2018-19, 83%
2017-18, N/A
OAS/GIS
2020-21, 83%
2019-20, 81%
2018-19, 78%
2017-18, N/A
Being able to complete steps online made the process easier for you
Total
2020-21, 80%
2019-20, 75%
2018-19, 74%
2017-18, 70%
EI
2020-21, 87%, significantly higher than total, significantly higher than previous wave
2019-20, 82%
2018-19, 84%
2017-18, 82%
CPP
2020-21, 62%, significantly lower than total
2019-20, 60%
2018-19, 52%
2017-18, 42%
CPP-D
2020-21, 40%, significantly lower than total
2019-20, 37%
2018-19, 31%
2017-18, 29%
SIN:
2020-21, 82%
2019-20, N/A
2018-19, N/A
2017-18, N/A
OAS/GIS:
2020-21, 56%, significantly lower than total, significantly higher than previous wave
2019-20, 48%
2018-19, 36%
2017-18, 37%
You needed to explain your situation only once.
Total
2020-21, 77%
2019-20, 78%
2018-19, 77%
2017-18, 77%
EI
2020-21, 72%, significantly lower than total
2019-20, 71%
2018-19, 72%
2017-18, 73%
CPP:
2020-21, 76%, significantly lower than previous wave
2019-20, 83%
2018-19, 80%
2017-18, 80%
CPP-D:
2020-21, 55%, significantly lower than total
2019-20, 58%
2018-19, 54%
2017-18, 55%
SIN
2020-21, 85%, significantly higher than total
2019-20, 88%
2018-19, 85%
2017-18, 85%
OAS/GIS:
2020-21, 78%
2019-20, 80%
2018-19, 75%
2017-18, 74%
* Statements asked differently with different scale in 2017-18
Q36b. Thinking about the service you received, how much do you agree or disagree with the following statements.
Base: All Answering (n=varies)
Effectiveness Service Attributes: Overall and By Program
Figure long description
% Rated 4/5
You were provided service in a way that protected your health and safety during the COVID-19 pandemic
Total
2020-21, 88%
EI
2020-21, 90%
CPP
2020-21, 82%, significantly lower than total
CPPD
2020-21, 75%, significantly lower than total
SIN
2020-21, 90%
OAS/GIS
2020-21, 81%, significantly lower than total
You were able to move smoothly through all of the steps related to your application.
Total
2020-21, 85%, significantly higher than previous wave
2019-20, 82%
2018-19, 84%
2017-18, 82%
EI
2020-21, 83%, significantly higher than previous wave
2019-20, 76%
2018-19, 81%
2017-18, 77%
CPP
2020-21, 80%, significantly lower than total, significantly lower than previous wave
2019-20, 85%
2018-19, 83%
2017-18, 84%
CPPD
2020-21, 58%, significantly lower than total
2019-20, 57%
2018-19, 62%
2017-18, 55%
SIN
2020-21, 91%, significantly higher than total
2019-20, 91%
2018-19, 91%
2017-18, 90%
OAS/GIS
2020-21, 87%
2019-20, 88%
2018-19, 84%
2017-18, 79%
You received consistent information
Total
2020-21, 84%, significantly higher than previous wave
2019-20, 80%
2018-19, 82%
2017-18, -
EI
2020-21, 82%, significantly higher than previous wave
2019-20, 76%
2018-19, 79%
2017-18, -
CPP
2020-21, 83%
2019-20, 85%
2018-19, 83%
2017-18, -
CPP-D
2020-21, 64%, significantly lower than total
2019-20, 59%
2018-19, 64%
2017-18, -
SIN
2020-21, 89%, significantly higher than total
2019-20, 86%
2018-19, 87%
2017-18, -
OAS/GIS
2020-21, 87%, significantly higher than total, significantly higher than previous wave
2019-20, 82%
2018-19, 82%
2017-18, -
The amount of time it took, from when you started gathering information to when you got a decision on your application, was reasonable.
Total
2020-21, 81%, significantly higher than previous wave
2019-20, 77%
2018-19, 76%
2017-18, 77%
EI
2020-21, 80%, significantly higher than previous wave
2019-20, 68%
2018-19, 69%
2017-18, 73%
CPP
2020-21, 81%
2019-20, 83%
2018-19, 83%
2017-18, 80%
CPP-D
2020-21, 57%, significantly lower than total, significantly higher than previous wave
2019-20, 49%
2018-19, 49%
2017-18, 47%
SIN
2020-21, 85%, significantly higher than total
2019-20, 89%
2018-19, 87%
2017-18, 85%
OAS/GIS
2020-21, 85%, significantly higher than total
2019-20, 85%
2018-19, 80%
2017-18, 75%
It was clear what to do if you had a problem or question.
Total
2020-21, 79%
2019-20, 78%
2018-19, 78%
2017-18, 78%
EI
2020-21, 75%
2019-20, 74%
2018-19, 77%
2017-18, 75%
CPP
2020-21, 78%
2019-20, 81%
2018-19, 76%
2017-18, 77%
CPP-D
2020-21, 60%, significantly lower than total
2019-20, 61%
2018-19, 63%
2017-18, 62%
SIN
2020-21, 87%, significantly higher than total
2019-20, 84%
2018-19, 82%
2017-18, 85%
OAS/GIS
2020-21, 84%, significantly higher than total
2019-20, 80%
2018-19, 78%
2017-18, 74%
It was easy to get help when you needed it.
Total
2020-21, 71%, significantly lower than previous wave
2019-20, 76%
2018-19, 77%
2017-18, 77%
EI
2020-21, 75%, significantly lower than total, significantly lower than previous wave
2019-20, 70%
2018-19, 72%
2017-18, 74%
CPP
2020-21, 70%
2019-20, 73%
2018-19, 73%
2017-18, 75%
CPP-D
2020-21, 53%, significantly lower than total
2019-20, 58%
2018-19, 59%
2017-18, 57%
SIN
2020-21, 83%, significantly higher than total, significantly lower than previous wave
2019-20, 89%
2018-19, 89%
2017-18, 87%
OAS/GIS
2020-21, 71%
2019-20, 74%
2018-19, 72%
2017-18, 67%
* Note, different scale used in 2017-18
Q36b. Thinking about the service you received, how much do you agree or disagree with the following statements.
Base: All Answering (n=varies) *** New attribute added in 2020-21
Emotion Service Attributes: Overall and By Program
Figure long description
% Rated 4 or 5
You were provided with service in your choice of English or French,
Total
2020-21, 96%
2019-20, 97%
2018-19, 96%
2017-18, 94%
EI
2020-21, 97%
2019-20, 98%
2018-19, 97%
2017-18, 93%
CPP
2020-21, 95%
2019-20, 97%
2018-19, 94%
2017-18, 94%
CPP-D
2020-21, 92%, significantly lower than total
2019-20, 95%
2018-19, 93%
2017-18, 87%
SIN
2020-21, 96%
2019-20, 95%
2018-19, 95%
2017-18, 96%
OAS/GIS
2020-21, 94%, significantly lower than total
2019-20, 96%
2018-19, 98%
2017-18, 95%
Service Canada reps that you dealt with in-person were helpful,
Total
2020-21, 91%
2019-20, 92%
EI
2020-21, 85%, significantly lower than total
2019-20, 89%
CPP
2020-21, 86%, significantly lower than total, significantly lower than previous wave
2019-20, 93%
CPP-D
2020-21, 76%, significantly lower than total, significantly lower than previous wave
2019-20, 85%
SIN
2020-21, 95%, significantly higher than total
2019-20, 96%
OAS/GIS
2020-21, 72%, significantly lower than total, significantly lower than previous wave
2019-20, 92%
1 800 O-Canada phone representatives were helpful, new attribute added in 2020-21
Total
2020-21, 88%
EI
2020-21, 88%
CPP
2020-21, 86%
CPPD
2020-21, 67%, significantly lower than total
SIN
2020-21, 90%
OAS/GIS
2020-21, 89%
You were confident that your personal information was protected,
Total
2020-21, 87%
2019-20, 87%
2018-19, 87%
2017-18, 87%
EI
2020-21, 86%
2019-20, 88%
2018-19, 88%
2017-18, 87%
CPP
2020-21, 82%, significantly lower than total
2019-20, 82%
2018-19, 79%
2017-18, 86%
CPP-D
2020-21, 78%, significantly lower than total
2019-20, 80%
2018-19, 82%
2017-18, 78%
SIN
2020-21, 92%, significantly higher than total
2019-20, 90%
2018-19, 92%
2017-18, 90%
OAS/GIS
2020-21, 85%, significantly higher than previous wave
2019-20, 79%
2018-19, 83%
2017-18, 82%
Service Canada specialized call centre phone reps were helpful, new attribute added in 2019-20
Total
2020-21, 85%, significantly higher than previous waves
2019-20, 73%
EI
2020-21, 83%, significantly higher than previous wave
2019-20, 73%
CPP
2020-21, 85%, significantly higher than previous wave
2019-20, 72%
CPP-D
2020-21, 68%, significantly lower than total
2019-20, 68%
SIN
2020-21, 92%, significantly higher than total, significantly higher than previous wave
2019-20, 74%
OAS/GIS
2020-21, 90%
2019-20, 83%
The Service Canada phone reps that called you back after you completed an online form were helpful, new attribute added in 2020-21
Total
2020-21, 85%
EI
2020-21, 84%
CPP
2020-21, 83%
CPPD
2020-21, 76%, significantly lower than total
SIN
2020-21, 89%
OAS/GIS
2020-21, 85%
You travelled a reasonable distance to access the service,
Total
2020-21, 79%, significantly higher than previous wave
2019-20, 75%
EI
2020-21, 71%, significantly lower than total
2019-20, 71%
CPP
2020-21, 75%
2019-20, 77%
CPP-D
2020-21, 59%, significantly lower than total
2019-20, 59%
SIN
2020-21, 83%
2019-20, 79%
OAS/GIS
2020-21, 74%
2019-20, 83%
You were confident that any issues or problems would have been easily resolved
Total
2020-21, 77%
2019-20, 78%
2018-19, 78%
2017-18, 76%
EI
2020-21, 73%, significantly lower than total
2019-20, 72%
2018-19, 74%
2017-18, 79%
CPP
2020-21, 76%
2019-20, 81%
2018-19, 76%
2017-18, 81%
CPP-D
2020-21, 56%, significantly lower than total
2019-20, 51%
2018-19, 57%
2017-18, 63%
SIN
2020-21, 84%, significantly higher than total
2019-20, 87%
2018-19, 86%
2017-18, 88%
OAS/GIS
2020-21, 82%, significantly higher than total, significantly higher than previous wave
2019-20, 77%
2018-19, 78%
2017-18, 80%
* Statements asked differently in 2017-18
Q36b. Thinking about the service you received, how much do you agree or disagree with the following statements.
Base: All Answering (n=varies) ** New attribute added in 2019-20 *** New attribute added in 2020-21
Ease of Follow-Up with Service Canada
More than six in ten clients found it easy to follow-up with Service Canada about their application. CPP-D clients were less likely to have felt it was easy to follow-up compared to all clients.
Ratings are consistent with previous waves.
Figure long description
Easy to follow up with Service Canada about your application?
Total
2017-18, 66%
2019-20, 61%
2020-21, 63%
SIN
2017-18, 62%
2019-20, 73%
2020-21, 72%
CPP
2017-18, 66%
2019-20, 68%
2020-21, 68%
OAS/GIS
2017-18, 66%
2019-20, 77%
2020-21, 70%
EI
2017-18, 68%
2019-20, 57%
2020-21, 59%
CPPD
2017-18, 50%
2019-20, 48%
2020-21, 52%, significantly lower than total
Q20a. Using a 5-point scale where 1 was very difficult and 5 was very easy, how easy or difficult was it to follow up with Service Canada about your application? Base= All Respondents (n=1209).
Satisfaction Levers: Driver Analysis
Programs: Drivers of Satisfaction by Program
Figure long description
Programs: Drivers of Satisfaction by Program
SIN
Keep Doing
Service Canada specialized call centre reps were helpful, 92%
Service Canada in person reps were helpful, 95%
Able to move smoothly through all steps, 91%
Areas for improvement
Ease of follow-up, 72%
Application would be processed in reasonable time, 68%
Ease of getting help on application, 78%
CPP
Keep Doing
Service Canada specialized call center reps were helpful, 85%
Client journey took reasonable amount of time, 81%
Able to move smoothly through all steps, 80%
Areas for improvement
Application would be processed in reasonable time, 77%
Ease of finding info needed to apply, 78%
Ease of getting help in general, 70%
OAS/GIS
Keep Doing
Client journey took reasonable amount of time, 85%
Able to move smoothly through all steps , 87%
Complete application in reasonable time, 83%
Areas for improvement
Completing steps online made it easier, 56%
Ease of finding info needed to apply, 72%
Ease of gathering info, 77%
EI
Keep Doing
Service Canada specialized call center reps were helpful, 83%
Client journey took reasonable amount of time, 80%
eServiceCanada reps were helpful, 84%
Areas for improvement
Able to find information in reasonable time, 73%
Explain situation only once, 72%
Ease of follow-up, 59%
CPPD
Keep Doing
Able to find information in reasonable time, 61%
Received consistent information, 64%
Felt protected during COVID, 75%
Areas for improvement
Service Canada specialized call center reps were helpful, 69%
Client journey took reasonable amount of time, 57%
Process was clear, 56%
Summary: Drivers of Satisfaction, Overall
The top two (2) most prominent drivers of satisfaction in the service experience remained consistent year over year, although the helpfulness of Service Canada call centre phone representatives took on increased importance. Further, the impact of the overall effectiveness of the process, the ease of follow-up, and travelling a reasonable distance to access service (for in-person) also took on increased importance in driving satisfaction.
The primary drivers of satisfaction in the service experience were: the helpfulness of Service Canada call centre phone representatives and the amount of time it took from start and to finish was reasonable. Other prominent drivers included the ability to move smoothly through all steps (i.e. effectiveness), the ease of follow-up and travelling a reasonable distance to access service (for in-person).
The timeliness of service and helpfulness of specialized call centre reps have remained consistent as top drivers. This year, the overall effectiveness, ease of follow-up, travelled a reasonable distance to access service and able to find info in reasonable amount of time (during aware stage) took on increased importance in driving satisfaction.
The greatest opportunities for potential improvement for Service Canada clientele as a whole were improving the ease of follow-up.
In order to summarize what potential changes could result in an increase in overall satisfaction, the service attributes that most strongly drove satisfaction for Service Canada clients were determined and compared to Service Canada’s performance against these attributes.
The resulting analysis found that common areas for potential improvement include improving the ease of follow-up. Areas of secondary importance for improvement included the ease of MSCA registration, the ease of getting help on the application and confidence the application would be processed in a reasonable time.
The overall timeliness of service, the helpfulness of call centre representatives and the overall effectiveness of the process (i.e. ability to move smoothly through all steps) emerged as prominent strengths for the organization this year and areas that should be protected.
Summary: Drivers of Satisfaction, By Program
EI Clients
Top drivers included: the helpfulness of Service Canada call centre representatives and the amount of time it took from start to finish was reasonable, followed by the helpfulness of the eServiceCanada reps and being able to find the information needed (during the aware stage) in a reasonable amount of time.
The greatest opportunities to improve the service experience for EI clients are improving the ability of clients to find the information needed(during the aware stage) in a reasonable amount of time which is among the top drivers of satisfaction and an area with relatively weaker performance. Areas of secondary importance for improvement include the ease of follow-up, the ease of getting help on the application, the ease of MSCA registration and the ease of getting help in general.
The overall timeliness of service, the helpfulness of call centre representatives and the helpfulness of eServiceCanada representatives emerged as prominent strengths for the organization this year and an area that should be protected.
The timeliness of service, helpfulness of specialized call centre reps and overall effectiveness have remained consistent as top drivers.
This year, being able to find info in a reasonable amount of time (during the aware stage), needing to explain your situation only once, ease of understanding program information and ease of follow-up took on increased importance in driving satisfaction.
CPP Clients
Top drivers included: the helpfulness of Service Canada call centre phone representatives, the amount of time it took from start to finish was reasonable, confidence the application would be processed in a reasonable time, being able to move smoothly through all steps (i.e. effectiveness) and the ease of finding out the information needed to apply.
The greatest opportunities to improve the service experience for CPP clients are improving confidence the application would be processed in a reasonable time and ease of finding info needed to apply which are among the top drivers of satisfaction but have relatively weaker performance than other areas.
The helpfulness of Service Canada call centre reps, the timeliness of service and being able to move smoothly through all steps (i.e. effectiveness) represent prominent strengths and areas that should be protected.
The helpfulness of specialized call centre reps and overall effectiveness have remained consistent as top drivers
This year, the timeliness of service, confidence their application would be processed in reasonable amount of time, being able to find information in reasonable amount of time (during aware stage) and ease of getting help took on increased importance driving satisfaction.
CPP-D Clients
Top drivers included: the helpfulness of Service Canada call centre phone representatives, the amount of time it took from start to finish was reasonable, overall clarity of process, clarity of the issue resolution process, ease of follow-up and whether the application for benefits was approved or denied.
The greatest opportunities to improve the service experience for CPP-D clients are improving the timeliness of service, the overall clarity of process, the helpfulness of call centre representatives and the clarity of the issue resolution process. These represent the strongest overall drivers of satisfaction and areas where performance is weaker when compared to all clients.
The timeliness of service, helpfulness of specialized call centre reps, whether they were approved or denied benefits and the ease of follow-up remained consistent as top drivers.
This year, the clarity of process and clarity of what to do if you had a problem or question as well as being able to find info in reasonable amount of time (during the aware stage) took on increased importance driving satisfaction.
OAS/GIS Clients
Top drivers included: the amount of time it took from start to finish was reasonable followed by being able to complete steps online made the process easier, ease of finding the information needed to apply, the ability to move smoothly through all steps (i.e. effectiveness) and the ease of putting together the information needed to apply.
The greatest opportunities to improve the service experience for OAS//GIS clients are improving the ease of completing steps online, the ease of finding what information they need to provide when applying and the ease of pulling together the information which are among the top drivers of satisfaction but have relatively weaker performance than other areas. Areas of secondary importance include the ease of getting help in general, only needing to explain your situation once and the ease of completing the application form.
The timeliness of service, overall effectiveness, ability to complete the application in a reasonable time, clarity of process if they had an issue, ease of understanding the information about the program, ease of figuring out eligibility, ease of understanding the requirements of the application and being provided service in their choice of official language represent strengths and areas that should be protected.
The ease of finding out what information you needed to provide when applying remained a consistent top driver.
This year, the timeliness of service, the ease of being able to complete steps online, overall effectiveness, the ease of putting together information needed to apply and being able to complete application in reasonable time took on increased importance driving satisfaction.
SIN Clients
Top drivers included: the helpfulness of Service Canada call centre representatives and the amount of time it took from start to finish was reasonable, followed by the helpfulness of Service Canada in-person reps and the ease of follow-up.
The greatest opportunities to improve the service experience for SIN clients are improving the ease of follow-up which is among the top drivers of satisfaction but has relatively weaker performance than most other areas. Areas of secondary importance for improvement include confidence the application would be processed in a reasonable time and ease of getting help on the application.
The timeliness of service, helpfulness of Service Canada call centre reps, in person reps and eServiceCanada reps, overall effectiveness and travelling a reasonable distance to access in-person service are prominent strengths and areas that should be protected.
The prominent drivers of satisfaction among SIN clients changed year over year.
The timeliness of service, helpfulness of specialized call centre and in person reps, ease of follow-up, overall effectiveness and travelled a reasonable distance to access service all took on increased importance driving satisfaction.
Drivers of Satisfaction: Overall
The primary drivers of satisfaction in the service experience were: the helpfulness of Service Canada call centre phone representatives and the amount of time it took from start and to finish was reasonable, followed by the ability to move smoothly through all steps (i.e. effectiveness), the ease of follow-up and travelling a reasonable distance to access service (for in-person).
Compared to 2019-20, the top two most important drivers remained consistent, however the helpfulness of Service Canada call centre phone representatives took on increased importance. Further, the impact of the overall effectiveness of the process, the ease of follow-up and travelling a reasonable distance to access service (for in-person) have also taken on increased importance in driving satisfaction.
The strength of the drivers’ analysis has remained consistent compared to 2019-20 (R2 of 0.69 compared to 0.72).
Figure long description
Drivers of Satisfaction: Overall
Service Canada specialized call centre phone representatives were helpful, 0.252
The amount of time it took, from when you started gathering information to when you got a decision on your application, was reasonable, 0.247
You were able to move smoothly through all of the steps related to your [ABBREV] application, 0.117
How easy or difficult was it to follow up with Service Canada about your application, 0.104
You travelled a reasonable distance to access the service, 0.101
You needed to explain your situation only once, 0.075
Understanding the requirements of the application, 0.073
You were provided with service in your choice of English or French, 0.064
Overall, it was easy for you to apply for [ABBREV], 0.061
How much do you agree or disagree that you were able to find the information you needed within a reasonable amount of time, 0.057
Figure out if you are eligible for benefits/ SIN card, 0.056
It was clear what to do if you had a problem or question., 0.043
GRANTED/ DENIED, 0.043
After you submitted your application for PROGRAM, how confident were you that your application would be processed, 0.042
You were confident that your personal information was protected, 0.041
You were confident that any issues or problems would have been easily resolved, 0.040
It was easy to access service in a language I could speak and understand well, 0.039
Find information about [INSERT ABBREV], 0.038
How much do you agree or disagree that you were able to complete the application in a reasonable amount of time, 0.037
Getting help on your application when you needed it, 0.035
You received consistent information, 0.030
It was easy to get help when you needed it., 0.027
Understand the information about [INSERT PROGRAM], 0.026
You were provided service in a way that protected your health and safety during the COVID19 pandemic, 0.019
Throughout the process it was clear what would happen next and when it would happen., 0.014
Being able to complete steps online made the process easier for you, 0.012
Service Canada representatives that you dealt with in person were helpful, 0.011
Putting together the information you needed to apply for [INSERT ABBREV], 0.008
Find out what information you need to provide when applying for [INSERT ABBREV], 0.006
Find out the steps to apply, 0.004
How easy or difficult was it to register for your My Service Canada Account, 0.003
The Service Canada phone representatives that called you back after you completed an online form were helpful, 0.001
Completing the application form, 0.000
Priority Matrix: Overview
READER’S NOTE: This slide was intended to assist the reader in interpreting data shown in a priority matrix. A priority matrix has been used to identify priority improvement areas with respect to service interactions with clients.
A priority matrix allows for decision makers to identify priorities for improvement by comparing how well clients feel you have performed in an area with how much impact that area has on clients’ overall satisfaction. It helps to answer the question ‘what can we do to improve satisfaction’. Each driver or component will fall into one of the quadrants explained below, depending on its impact on overall satisfaction and its performance score (provided by survey respondents).
Figure long description
4-quadrant priority matrix:
Vertical scale, Impact of performance, lower to higher impact;
Horizontal scale, Performance, lower to higher
1st quadrant, top-left, high impact/lower performance;
IMPROVE / FOCUS;
Driver/ component has more impact on satisfaction, and its performance score was lower relative to other drivers/ components. Focus on improving your performance in this area.;
Driver 1
2nd quadrant, top-right, high impact/high performance
PROTECT / REINFORCE
Driver/ component has more impact on satisfaction, and its performance score was higher relative to other drivers/ components. This was a strength which needs to be protected.
Driver/ component was not as impactful as other drivers/ components and performance scores were high.
Overall Priority Matrix: Impact vs. Performance
The greatest opportunities to improve the service experience for Service Canada clientele as a whole are improving the ease of follow-up and to a lesser extent reducing the distance clients must travel to access in person service. Areas of secondary importance for improvement include the ease of MSCA registration, the ease of getting help on the application and confidence the application would be processed in a reasonable time.
The overall timeliness of service, the helpfulness of call centre representatives and the overall effectiveness of the process (i.e. ability to move smoothly through all steps) emerged as prominent strengths for the organization this year and areas that should be protected.
Figure long description
Priority matrix:
Vertical axis, Impact;
Low impact to high impact;
Quad division at 0.10
Horizontal axis, Performance;
Low performance to high performance;
Scale, % rated 4 or 5;
Quad division at 80%
1st quadrant, top-left, high impact/lower performance, Improve
Ease of follow-up;
Travelled reasonable distance
2nd quadrant, top-right, high impact/high performance;
The primary drivers of satisfaction in the service experience for EI clients were: the helpfulness of Service Canada call centre representatives and the amount of time it took from start to finish was reasonable, followed by the helpfulness of the eServiceCanada reps and being able to find the information needed (during the aware stage) in a reasonable amount of time.
Compared to 2019-20, the top two most important drivers remained consistent, however the helpfulness of Service Canada call centre phone representatives took on increased importance. Further, the impact of being able to find the information needed (during the aware stage) in a reasonable amount of time and needing to explain your situation only once have also taken on increased importance in driving satisfaction.
The strength of the drivers’ analysis has remained consistent compared to 2019-20 (R2 of 0.72 compared to 0.76).
Figure long description
Drivers of satisfaction EI clients
Service Canada specialized call centre phone representatives were helpful, 0.386
The amount of time it took, from when you started gathering information to when you got a decision on your application, was reasonable, 0.252
The Service Canada phone representatives that called you back after you completed an online form were helpful, 0.161
How much do you agree or disagree that you were able to find the information you needed within a reasonable amount of time, 0.151
You needed to explain your situation only once., 0.126
You were able to move smoothly through all of the steps related to your [ABBREV] application, 0.120
Understand the information about [ PROGRAM], 0.119
How easy or difficult was it to follow up with Service Canada about your application, 0.118
Overall, it was easy for you to apply for [PROGRAM], 0.107
Figure out if you are eligible for benefits/ SIN card, 0.103
You were provided with service in your choice of English or French, 0.098
Throughout the process it was clear what would happen next and when it would happen, 0.088
GRANTED/ DENIED, 0.081
You were confident that any issues or problems would have been easily resolved, 0.078
Find information about [PROGRAM], 0.065
Understanding the requirements of the application, 0.064
You were provided service in a way that protected your health and safety during the COVID-19 pandemic, 0.063
Completing the application form, 0.062
Find out the steps to apply, 0.061
Find out what information you need to provide when applying for [PROGRAM], 0.056
It was clear what to do if you had a problem or question, 0.054
Putting together the information you needed to apply for [PROGRAM], 0.049
How much do you agree or disagree that you were able to complete the application in a reasonable amount of time, 0.046
It was easy to access service in a language I could speak and understand well, 0.044
Being able to complete steps online made the process easier for you, 0.038
After you submitted your application for PROGRAM, how confident were you that your application would be processed, 0.036
You received consistent information, 0.026
You were confident that your personal information was protected, 0.025
It was easy to get help when you needed it, 0.023
Getting help on your application when you needed it, 0.016
How easy or difficult was it to register for your My Service Canada Account, 0.004
Overall Priority Matrix: Impact vs. Performance, EI Clients
The greatest opportunities to improve the service experience for EI clients are improving the ability of clients to find the information needed (during the aware stage) in a reasonable amount of time. Areas of secondary importance for improvement include the ease of follow-up, the ease of getting help on the application, the ease of MSCA registration and the ease of getting help in general.
The overall timeliness of service, the helpfulness of call centre representatives and the helpfulness of eServiceCanada representatives have emerged as prominent strengths for the organization this year and areas that should be protected.
Figure long description
Priority matrix
Vertical axis, Impact
Low impact to high impact
Quad division at 0.10
Horizontal axis, Performance
Low performance to high performance
Scale, % rated 4 or 5
Quad division at 80%
1st quadrant, top-left, high impact/lower performance, Improve
Find info in reasonable time
2nd quadrant, top-right, high impact/high performance, Protect
The primary drivers of satisfaction in the service experience for CPP clients were: the helpfulness of Service Canada call centre phone representatives, the amount of time it took from start to finish was reasonable, confidence the application would be processed in a reasonable time, being able to move smoothly through all steps (i.e. effectiveness) and the ease of finding out the information needed to apply.
Compared to 2019-20, the timeliness of service and confidence the application would be processed in a reasonable time have taken on increased importance in driving satisfaction.
The strength of the drivers’ analysis has declined compared to 2019-20 but remains strong (R2 of 0.62 compared to 0.92).
Figure long description
Drivers of Satisfaction: CPP Clients
Service Canada specialized call centre phone representatives were helpful, 0.286
The amount of time it took, from when you started gathering information to when you got a decision on your application, was reasonable, 0.178
After you submitted your application for &qabbrev, how confident were you that your application would be processed , 0.131
You were able to move smoothly through all of the steps related to your [PROGRAM] application, 0.111
Find out what information you need to provide when applying for [PROGRAM], 0.097
You were able to find the information you needed within a reasonable amount of time, 0.087
It was easy to get help when you needed it, 0.069
You needed to explain your situation only once, 0.066
It was clear what to do if you had a problem or question, 0.066
You received consistent information, 0.049
Throughout the process it was clear what would happen next and when it would happen, 0.048
Overall, it was easy for you to apply for [PROGRAM], 0.047
Getting help on your application when you needed it, 0.032
How much do you agree or disagree that you were able to complete the application in a reasonable amount of time, 0.019
Figure out if you are eligible for benefits/ SIN card, 0.016
You were provided service in a way that protected your health and safety during the COVID-19 pandemic, 0.016
Completing the application form, 0.015
Being able to complete steps online made the process easier for you, 0.009
You were confident that any issues or problems would have been easily resolved, 0.009
Overall Priority Matrix: Impact vs. Performance, CPP Clients
The greatest opportunities to improve the service experience for CPP clients are improving confidence the application would be processed in a reasonable time and ease of finding info needed to apply.
The helpfulness of Service Canada call centre reps, the timeliness of service and being able to move smoothly through all steps (i.e. effectiveness) represent prominent strengths and areas that should be protected.
Figure long description
Priority matrix
Vertical axis, Impact
Low impact to high impact
Quad division at 0.10
Horizontal axis, Performance
Low performance to high performance
Scale, % rated 4 or 5
Quad division at 80%
1st quadrant, top-left, high impact/lower performance, Improve
Confident application would be processed in reasonable time
2nd quadrant, top-right, high impact/high performance, Protect
The primary drivers of satisfaction in the service experience for CPP-D clients were: the helpfulness of Service Canada call centre phone representatives, the amount of time it took from start to finish was reasonable, overall clarity of process, clarity of the issue resolution process, ease of follow-up and whether the application for benefits was approved or denied.
Compared to 2019-20, the overall clarity of process and clarity of the issue resolution process have taken on increased importance in driving satisfaction.
The strength of the drivers’ analysis has remained unchanged compared to 2019-20 (R2 of 0.72 compared to 0.72).
Figure long description
Drivers of Satisfaction: CPP-D Clients
Service Canada specialized call centre phone representatives were helpful, 0.325
The amount of time it took, from when you started gathering information to when you got a decision on your application, was reasonable, 0.197
Throughout the process it was clear what would happen next and when it would happen, 0.172
It was clear what to do if you had a problem or question, 0.158
Ease of follow-up, 0.128
GRANTED/ DENIED, 0.120
Understanding the requirements of the application, 0.112
You were provided service in a way that protected your health and safety during the COVID-19 pandemic, 0.069
You were able to find the information you needed within a reasonable amount of time, 0.069
Putting together the information you needed to apply for [PROGRAM], 0.048
Getting help on your application when you needed it, 0.048
You were able to complete the application in a reasonable amount of time, 0.040
Figure out if you are eligible for benefits/ SIN card, 0.040
After you submitted your application for [PROGRAM], how confident were you that your application would be processed, 0.033
Being able to complete steps online made the process easier for you, 0.032
It was easy to get help when you needed it, 0.029
Overall, it was easy for you to apply for [PROGRAM], 0.024
You needed to explain your situation only once, 0.023
Completing the application form, 0.020
Understand the information about [PROGRAM], 0.016
You received consistent information, 0.015
You were able to move smoothly through all of the steps related to your [PROGRAM] application, 0.012
You were confident that any issues or problems would have been easily resolved, 0.001
Overall Priority Matrix: Impact vs. Performance, CPP-D Clients
The greatest opportunities to improve the service experience for CPP-D clients are improving the timeliness of service, the overall clarity of process, the helpfulness of call centre representatives and the clarity of the issue resolution process.
Figure long description
Priority matrix
Vertical axis, Impact
Low impact to high impact
Quad division at 0.10
Horizontal axis, Performance
Low performance to high performance
Scale, % rated 4 or 5
Quad division at 80%
1st quadrant, top-left, high impact/lower performance, Improve
Confident application would be processed in reasonable time
Steps online made it easer
Ease of getting help when needed
Ease of applying
Explain once
Ease of completing application
Ease of understanding info
Consistent info
Moved smoothly through steps
Confident in issue resolution
Drivers of Satisfaction: OAS/GIS Clients
The primary drivers of satisfaction in the service experience for OAS/GIS clients were: the amount of time it took from start to finish was reasonable followed by being able to complete steps online made the process easier, ease of finding the information needed to apply, the ability to move smoothly through all steps (i.e. effectiveness) and the ease of putting together the information needed to apply.
Compared to 2019-20, the timeliness of service, overall effectiveness and the ease of putting together the information needed to apply have taken on increased importance in driving satisfaction.
The strength of the drivers’ analysis has declined compared to 2019-20 but remains strong (R2 of 0.80 compared to 0.99).
Figure long description
Drivers of Satisfaction: OAS/GIS Clients
The amount of time it took, from when you started gathering information to when you got a decision on your application, was reasonable, 0.424
Being able to complete steps online made the process easier for you, 0.328
Find out what information you need to provide when applying for [PROGRAM], 0.303
You were able to move smoothly through all of the steps related to your [PROGRAM] application, 0.273
Putting together the information you needed to apply for [PROGRAM], 0.255
You needed to explain your situation only once, 0.221
How much do you agree or disagree that you were able to complete the application in a reasonable amount of time, 0.221
It was clear what to do if you had a problem or question, 0.204
It was easy to get help when you needed it, 0.187
How much do you agree or disagree that you were able to find the information you needed within a reasonable amount of time?, 0.147
You were provided with service in your choice of English or French, 0.146
Understanding the requirements of the application, 0.105
Figure out if you are eligible for benefits/ SIN card, 0.101
Completing the application form, 0.100
It was easy to access service in a language I could speak and understand well, 0.092
You were confident that your personal information was protected, 0.082
Find out the steps to apply, 0.074
After you submitted your application for [PROGRAM], how confident were you that your application would be processed, 0.071
You were provided service in a way that protected your health and safety during the COVID-19 pandemic, 0.048
You were confident that any issues or problems would have been easily resolved, 0.041
Find information about [PROGRAM], 0.021
Getting help on your application when you needed it, 0.010
Throughout the process it was clear what would happen next and when it would happen, 0.009
Overall Priority Matrix: Impact vs. Performance, OAS/GIS Clients
The greatest opportunities to improve the service experience for OAS/GIS clients are improving the ease of completing steps online, the ease of finding the information needed to apply, the ease of getting help in general, only needing to explain your situation once, and the ease of completing the application form.
The timeliness of service, overall effectiveness, ability to complete the application in a reasonable time, clarity of process if they had an issue, ease of understanding the information about the program, ease of figuring out eligibility, ease of understanding the requirements of the application and being provided service in their choice of official language represent strengths and areas that should be protected.
Figure long description
Priority matrix
Vertical axis, Impact
Low impact to high impact
Quad division at 0.10
Horizontal axis, Performance
Low performance to high performance
Scale, % rated 4 or 5
Quad division at 80%
1st quadrant, top-left, high impact/lower performance, Improve
Online steps made it easier
Ease of finding info needed to apply
Ease of gathering info
Explain once
Ease of getting help when needed
Ease of completing application
2nd quadrant, top-right, high impact/high performance, Protect
The primary drivers of satisfaction in the service experience for SIN clients were: the helpfulness of Service Canada call centre representatives and the amount of time it took from start to finish was reasonable, followed by the helpfulness of Service Canada in-person reps and the ease of follow-up
Compared to 2019-20, there has been significant change in the drivers of satisfaction and all primary drivers have taken on increased importance in driving satisfaction.
The strength of the drivers’ analysis has increased compared to 2019-20 (R2 of 0.72 compared to 0.61).
Figure long description
Drivers of Satisfaction: SIN Clients
Service Canada specialized call centre phone representatives were helpful, 0.251
The amount of time it took, from when you started gathering information to when you got a decision on your application, was reasonable, 0.194
Service Canada representatives that you dealt with in person were helpful, 0.156
All respondents, 0.155
The Service Canada phone representatives that called you back after you completed an online form were helpful, 0.110
You were able to move smoothly through all of the steps related to your [ABBREV] application, 0.107
You travelled a reasonable distance to access the service, 0.107
You were confident that your personal information was protected, 0.093
Throughout the process it was clear what would happen next and when it would happen, 0.092
How much do you agree or disagree that you were able to find the information you needed within a reasonable amount of time, 0.089
After you submitted your application for [PROGRAM], how confident were you that your application would be processed, 0.079
Understanding the requirements of the application, 0.077
You needed to explain your situation only once, 0.060
Understand the information about [PROGRAM], 0.052
It was clear what to do if you had a problem or question, 0.052
It was easy to access service in a language I could speak and understand well, 0.048
It was easy to get help when you needed it, 0.047
You were provided service in a way that protected your health and safety during the COVID-19 pandemic, 0.046
Getting help on your application when you needed it, 0.031
Find information about [PROGRAM], 0.030
Figure out if you are eligible for benefits/ SIN card, 0.028
Find out the steps to apply, 0.023
Being able to complete steps online made the process easier for you, 0.022
You received consistent information, 0.016
Completing the application form, 0.013
How much do you agree or disagree that you were able to complete the application in a reasonable amount of time, 0.012
You were confident that any issues or problems would have been easily resolved, 0.003
You were provided with service in your choice of English or French, 0.003
Find out what information you need to provide when applying for [PROGRAM], 0.003
Putting together the information you needed to apply for [PROGRAM], 0.001
Overall Priority Matrix: Impact vs. Performance, SIN Clients
The greatest opportunities to improve the service experience for SIN clients are improving the ease of follow-up. Areas of secondary importance for improvement include confidence the application would be processed in a reasonable time and ease of getting help on the application.
The timeliness of service, helpfulness of Service Canada call centre reps, in person reps and eServiceCanada reps, overall effectiveness, and travelling a reasonable distance to access in-person service are prominent strengths and areas that should be protected.
Figure long description
Priority matrix
Vertical axis, Impact
Low impact to high impact
Scale, Standardized ẞ coefficient
Quad division at 0.10
Horizontal axis, Performance
Low performance to high performance
Scale, % rated 4 or 5
Quad division at 80%
1st quadrant, top-left, high impact/lower performance, Improve
Ease of follow-up
2nd quadrant, top-right, high impact/high performance, Protect
The service outcome, that is being granted or denied benefits, has become a less prominent driver of satisfaction with the service delivery this year, after increasing in importance last year. Notably, the proportion of EI clients who were granted benefits increased compared to 2019-20.
Satisfaction among EI clients who were either approved or denied a benefit increased year over year. The majority of CPP and EI clients who were denied benefits were satisfied with their experience, only four in ten CPP-D clients were satisfied.
Figure long description
CPP
Percent Rating Satisfaction 4 or 5
Approved
2020-21, 86%
2019-20, 89%
2018-19, 87%
2017-18, 88%
Denied
2020-21, 81%
2019-20, 59%
2018-19, 72%
2017-18, 67%
% Approved/Denied in the survey sample
2020-21 (n=752)
Approved, 96%
Denied, 4%
2019-20 (n=389)
Approved, 97%
Denied, 3%
2018-19 (n=788)
Approved, 98%
Denied, 2%
2017-18 (n=652)
Approved, 98%
Denied, 2%
EI
Percent Rating Satisfaction 4 or 5
Approved
2020-21, 85%, significantly higher than previous wave
2019-20, 81%
2018-19, 84%
2017-18, 85%
Denied
2020-21, 61%, significantly higher than previous wave
2019-20, 39%
2018-19, 55%
2017-18, 73%
% Approved/Denied in the survey sample
2020-21 (n=1162)
Approved, 95%, significantly higher than previous wave
Denied, 5%, significantly lower than previous waves
2019-20 (n=701)
Approved, 88%
Denied, 12%
2018-19 (n=1098)
Approved, 88%
Denied, 12%
2017-18 (n=703)
Approved, 81%
Denied, 19%
CPPD
Percent Rating Satisfaction 4 or 5
Approved
2020-21, 80%
2019-20, 77%
2018-19, 76%
2017-18, 79%
Denied
2020-21, 43%
2019-20, 40%
2018-19, 40%
2017-18, 43%
% Approved/Denied in the survey sample
2020-21 (n=692)
Approved, 54%
Denied, 46%
2019-20 (n=417)
Approved, 53%
Denied, 47%
2018-19 (n=766)
Approved, 61%
Denied, 39%
2017-18 (n=658)
Approved, 60%
Denied, 40%
Note: Clients who were denied benefit were present in the administrative databases of EI, CPP and CPP-D, but not other programs.
Note: Clients are asked specifically to assess the service delivery, not whether the application was approved or denied. While granted/denied is a driver of satisfaction, it must be remembered that approval is based on legislation.
Q38a. How satisfied were you with the service you received from Service Canada related to your [insert abbrev] application? please use a 5-point scale, where 1 means very dissatisfied, and 5 means very satisfied.
At-Risk Client Groups
At-Risk Groups With Lower Satisfaction
Satisfaction was lower among clients with a language barrier, clients with disabilities, those with restrictions to accessing service, clients with no devices and e-vulnerable compared to all clients.
Figure long description
Overall Satisfaction (% Rated 4 or 5)
Clients with a language barrier
2020-21, 55%
2019-20, 52%
Clients with disabilities
2020-21, 76%
2019-20, 76%
Clients with restrictions
2020-21, 80%
2019-20, 79%
Clients with no devices
2020-21, 80%
2019-20, 81%
E-vulnerable clients
2020-21, 82%
2019-20, 85%
To improve the client experience among these groups focus should be placed on the service areas with the largest gaps compared to all clients.
Figure long description
Largest Gaps in Service Attributes vs. All Clients
Clients with a language barrier
Helpfulness of 1800 O-Canada reps
Confidence any issues or problems would be easily resolved
Overall clarity of process
Clarity of the issue resolution process
Ease of getting help in general
Clients with disabilities
Being able to complete steps online made the process easier
Ease of figuring out eligibility
Helpfulness of 1800 O-Canada reps
Overall effectiveness
Ease of finding information on the program
Clients with restrictions
Ease of registering for MSCA
Overall clarity of process
Overall ease of applying
Ease of finding out the steps to apply
Ease of finding the information you need to provide when applying
Clients with no devices
Being able to complete steps online made the process easier
Ease of finding information on the program
Ease of finding the information you need to provide when applying
E-Vulnerable
Being able to complete steps online made the process easier
Ease of finding the information you need to provide and putting together the information
Ease of finding out the steps to apply
Ease of understanding the requirements of the application and completing the form
At-Risk Client Groups: Summary
Figure long description
Proportion of clients in vulnerable groups:
Youth (18-30), 31%
% satisfied
2020-21, 85%
2019-20, 84%
2018-19, 86%
Proportion with a disability
2020-21, 4%, significantly lower than total
2019-20, 3%
2018-19, 3%
Seniors (60+), 29%
% satisfied
2020-21, 87%
2019-20, 86%
2018-19, 87%
Proportion with a disability
2020-21, 13%, significantly higher than total
2019-20, 12%
2018-19, 17%
OLMC, 5%
% satisfied
2020-21, 90%
2019-20, 90%
2018-19, 91%
Proportion with a disability
2020-21, 3%, significantly lower than total
2019-20, 2%
2018-19, 3%
Non English or French speaking, 3%
% satisfied
2020-21, 90%
2019-20, 92%
2018-19, 80%
Proportion with a disability
2020-21, 2%, significantly lower than total
2019-20, 5%
2018-19, 5%
High school or less, 31%
% satisfied
2020-21, 86%
2019-20, 84%
2018-19, 85%
Proportion with a disability
2020-21, 13%, significantly higher than total
2019-20, 11%
2018-19, 13%
Indigenous, 9%
% satisfied
2020-21, 83%
2019-20, 79%
2018-19, 85%
Proportion with a disability
2020-21, 13%, significantly higher than total
2019-20, 13%
2018-19, 14%
Clients with disabilities, 8%
% satisfied
2020-21, 76%, significantly lower than total
2019-20, 76%
2018-19, 79%
Proportion with a disability
2020-21, 100%, significantly higher than total
2019-20, 100%
2018-19, 100%
Remote, 2%
% satisfied
2020-21, 88%, significantly higher than previous wave
2019-20, 80%
2018-19, 88%
Proportion with a disability
2020-21, 12%, significantly higher than total, significantly higher than previous wave
2019-20, 4%
2018-19, 9%
Urban, 62%
% satisfied
2020-21, 86%
2019-20, 85%
2018-19, 86%
Proportion with a disability
2020-21, 7%
2019-20, 6%
2018-19, 9%
Rural, 35%
% satisfied
2020-21, 85%, significantly higher than previous waves
2019-20, 82%
2018-19, 83%
Proportion with a disability
2020-21, 11%, significantly higher than total
2019-20, 9%
2018-19, 10%
E-vulnerable, 13%
% satisfied
2020-21, 82%, significantly lower than total
2019-20, 85%
2018-19, 84%
Proportion with a disability
2020-21, 16%, significantly higher than total
2019-20, 14%
2018-19, 18%
Newcomers (3 years or fewer), 14%
% satisfied
2020-21, 93%, significantly higher than total
2019-20, 94%
2018-19, 93%
Proportion with a disability
2020-21, 0%, significantly lower than total
2019-20, 1%
2018-19, 1%
Language barrier, 5%
% satisfied
2020-21, 55%, significantly lower than total
2019-20, 52%
2018-19, 42%
Proportion with a disability
2020-21, 16%, significantly higher than total
2019-20, 19%
2018-19, 18%
Mobile only, 9%
% satisfied
2020-21, 83%
2019-20, 85%
2018-19, 85%
Proportion with a disability
2020-21, 32%, significantly lower than total, significantly higher than previous waves
2019-20, 8%
2018-19, 11%
No devices, 3%
% satisfied
2020-21, 80%, significantly lower than total
2019-20, 81%
2018-19, 83%
Proportion with a disability
2020-21, 10%
2019-20, 15%
2018-19, 23%
Clients with restrictions, 48%
% satisfied
2020-21, 80%, significantly lower than total
2019-20, 79%,
Proportion with a disability
2020-21, 13%, significantly higher than total
2019-20, 14%
Racialized, 35%
% satisfied
2020-21, 89%, significantly higher than total
Proportion with a disability
2020-21, 3%, significantly lower than total
Q45a. Some people experience difficulties applying for because of barriers to accessing service. Did you experience difficulties applying for [ABBREV] because of any of the following reasons…? Base: All Answering (n=varies)
OLMC: Official Language Minority Communities *small sample size, results should be interpreted with caution.
CX Client Groups: At-Risk Client Groups by Channel
Figure long description
Portion of clients in at-risk groups
Youth (18 to 30), 31%
In-person
2020-21, 88%
2019-20, 86%
Canada.ca
2020-21, 77%
2019-20, 77%
Specialized Call Centres
2020-21, 76%
2019-20, 67%
1 800 O-Canada
2020-21, 79%, small sample size
2019-20, 79%
MSCA
2020-21, 83%
2019-20, 76%
eSERVICECANADA
2020-21, 88%, small sample size
Seniors (60+). 29%
In-person
2020-21, 83%
2019-20, 84%
Canada.ca
2020-21, 78%
2019-20, 70%
Specialized Call Centres
2020-21, 75%
2019-20, 63%
1 800 O-Canada
2020-21, 65%
2019-20, 67%
MSCA
2020-21, 71%
2019-20, 74%
eSERVICECANADA
2020-21, 72%
OLMC, 5%
In-person
2020-21, 88%, small sample size
2019-20, 89%
Canada/ca
2020-21, 83%
2019-20, 83%
Specialized Call Centres
2020-21, 68%, small sample size
2019-20,82%
1 800 O-Canada
2020-21, 77%
2019-20, 78%, very small sample size
MSCA
2020-21, 88%, small sample size
2019-20, 89%
eSERVICECANADA
2020-21, 47%, very small sample size
Non E or F speaking, 3%
In-person
2020-21, 99%, small sample size
2019-20, 91%
Canada/ca
2020-21, 83%
2019-20, 80%
Specialized Call Centres
2020-21, 96%, very small sample size
2019-20, 80%
1 800 O-Canada
2020-21, 78%, very small sample size
2019-20, 92%
MSCA
2020-21, 86%, very small sample size
2019-20, 67%
eSERVICECANADA
2020-21, 91%, very small sample size
High school or less, 31%
In-person
2020-21, 80%, significantly lower than total
2019-20, 88%
Canada.ca
2020-21, 79%
2019-20, 74%
Specialized Call Centres
2020-21, 74%
2019-20, 64%
1 800 O-Canada
2020-21, 80%
2019-20, 73%
MSCA
2020-21, 78%
2019-20, 77%
eSERVICECANADA
2020-21, 83%
Indigenous, 9%
In-person, 9%
2020-21, 77%
2019-20, 84%
Canada.ca
2020-21, 73%
2019-20, 65%
Specialized Call Centres
2020-21, 73%
2019-20, 63%
1 800 O-Canada
2020-21, 83%
2019-20, 52%
MSCA
2020-21, 73%
2019-20, 76%
eSERVICECANADA
2020-21, 87%, small sample size
Client with disabilities, 8%
In-person
2020-21, 67%
2019-20, 80%
Canada/ca
2020-21, 62%
2019-20, 73%
Specialized Call Centres
2020-21, 60%
2019-20, 66%
1 800 O-Canada
2020-21, 48%
2019-20, 70%
MSCA
2020-21, 56%
2019-20, 69%
eSERVICECANADA
2020-21, 71%
Remote, 2%
In-person
2020-21, 82%
2019-20, 89%
Canada.ca
2020-21, 74%
2019-20, 76%
Specialized Call Centres
2020-21, 72%, small sample size
2019-20, 71%
1 800 O-Canada
2020-21, 80%, very small sample size
2019-20, 74%
MSCA
2020-21, 68%, small sample size
2019-20, 89%
eSERVICECANADA
2020-21, 73%
Urban, 62%
In-person
2020-21, 89%
2019-20, 85%
Canada.ca
2020-21, 79%
2019-20, 73%
Specialized Call Centres
2020-21, 72%
2019-20, 62%
1 800 O-Canada
2020-21, 71%, very small sample size
2019-20, 71%
MSCA
2020-21, 75%
2019-20, 73%
eSERVICECANADA
2020-21, 84%
Rural, 35%
In-person
2020-21, 80%
2019-20, 87%
Canada.ca
2020-21, 77%
2019-20, 73%
Specialized Call Centres
2020-21, 73%
2019-20, 60%
1 800 O-Canada
2020-21, 74%
2019-20, 65%
MSCA
2020-21, 74%
2019-20, 77%
eSERVICECANADA
2020-21, 80%
E-vulnerable, 13%
In-person
2020-21, 79%
2019-20, 85%
Canada.ca
2020-21, 74%
2019-20, 67%
Specialized Call Centres
2020-21, 74%
2019-20, 70%
1 800 O-Canada
2020-21, 75%, small sample size
2019-20, 69%
MSCA
2020-21, 68%
2019-20, 74%
eSERVICECANADA
2020-21, 73%
Newcomers (3 years or less), 14%
In-person
2020-21, 95%
2019-20, 88%
Canada.ca
2020-21, 89%
2019-20, 86%
Specialized Call Centres
2020-21, 87%, small sample size
2019-20, 77%
1 800 O-Canada
2020-21, 94%, very small sample size
2019-20, 83%
MSCA
2020-21, 84%, small sample size
2019-20, 69%
eSERVICECANADA
2020-21, 92%
Language barrier, 5%
In-person
2020-21, 55%
Canada.ca
2020-21, 44%
Specialized Call Centres
2020-21, 32%, small sample size
1 800 O-Canada
2020-21, 31%, small sample size
MSCA
2020-21, 42%, small sample size
eSERVICECANADA
2020-21, 53%, small sample size
No devices, 3%
In-person
2020-21, 75%. Small sample size
2019-20, 81%
Canada.ca
2020-21, 75%, small sample size
2019-20, 44%
Specialized Call Centres
2020-21, 70%, small sample size
2019-20, 71%
1 800 O-Canada
2020-21, 85%
2019-20, 77%
MSCA
2020-21, 73%, very small sample size
2019-20, 56%
eSERVICECANADA
2020-21, 85%, very small sample size
Clients with restrictions, 48%
In-person
2020-21, 82%
2019-20, 80%
Canada/ca
2020-21, 71%
2019-20, 70%
Specialized Call Centres
2020-21, 68%
2019-20, 61%
1 800 O-Canada
2020-21, 72%
2019-20, 55%
MSCA
2020-21, 69%
2019-20, 65%
eSERVICECANADA
2020-21, 83%
Racialized, 35%
In-person
2020-21, 92%
Canada.ca
2020-21, 85%
Specialized Call Centres
2020-21, 80%
1 800 O-Canada
2020-21, 82%
MSCA
2020-21, 81%
eSERVICECANADA
2020-21, 88%
OLMC
Official Language Minority Communities
*small sample size **very small sample size, results should be interpreted with caution.
Barriers/ Restrictions to Accessing Service
Clients with Restrictions that Affect Accessing Service by Program
Nearly half of all clients felt they had restrictions that made it more difficult to access services.
The most common type of restriction experienced pertained to accessing a Service Canada centre including: the Service Canada Centre office being closed due to the COVID-19 pandemic, being unable to visit SC offices during business hours, and not living in close proximity to a Service Canada Office. CPP-D clients were more likely to have all restrictions, while SIN clients were more likely to say they were restricted by the office closure due to the COVID-19 pandemic.
Figure long description
% Yes to at least one
Total, n=4200, 48%
EI, n=1162, 46%
CPP, n=752, 47%
CPP-D, n=4692, 80%
SIN, n=749, 52%
OAS/GIS, n=845, 38%
Figure long description
Restrictions to Accessing Service
The Service Canada Centre was closed due to the COVID-19 pandemic, 27%
EI
2020-21, 25%
CPP
2020-21, 22%
CPP-D
2020-21, 46%, significantly higher than total
SIN
2020-21, 33%
OAS/GIS
2020-21, 20%
You are unable to visit a service Canada office during business hours, 18%
EI
2020-21, 16%
2019-20, 16%
CPP
2020-21, 18%
2019-20, 16%
CPP-D
2020-21, 26%, significantly higher than total
2019-20, 21%
SIN
2020-21, 23%
2019-20, 22%
OAS/GIS
2020-21, 14%
2019-20, 9%
You do not live in close proximity to a service Canada office, 12%
EI
2020-21, 11%
2019-20, 11%
CPP
2020-21, 12%
2019-20, 10%
CPP-D
2020-21, 20%, significantly higher than total
2019-20, 18%
SIN
2020-21, 15%
2019-20, 17%
OAS/GIS
2020-21, 10%
2019-20, 10%
You needed assistance form someone other than service Canada staff, 11%
EI
2020-21, 11%
2019-20, 9%
CPP
2020-21, 11%
2019-20, 8%
CPP-D
2020-21, 42%, significantly higher than total
2019-20, 41%
SIN
2020-21, 8%
2019-20, 9%
OAS/GIS
2020-21, 11%
2019-20, 10%
Application form was too long or complicated, 11%
EI
2020-21, 11%
CPP
2020-21, 10%
CPP-D
2020-21, 41%, significantly higher than total
SIN
2020-21, 8%
OAS/GIS
2020-21, 11%
You could not use the computer in a Service Canada Centre, 9%
EI
2020-21, 9%
CPP
2020-21, 9%
CPP-D
2020-21, 24%, significantly higher than total
SIN
2020-21, 7%
OAS/GIS
2020-21, 11%
You do not have access to the internet, 8%
EI
2020-21, 6%
2019-20, 7%
CPP
2020-21, 11%
2019-20, 8%
CPP-D
2020-21, 15%, significantly higher than total
2019-20, 9%
SIN
2020-21, 9%
2019-20, 4%
OAS/GIS
2020-21, 8%
2019-20, 10%
You do not own a smart phone, 8%
EI
2020-21, 7%
2019-20, 6%
CPP
2020-21, 12%
2019-20, 8%
CPP-D
2020-21, 16%
2019-20, 12%
SIN
2020-21, 9%
2019-20, 9%
OAS/GIS
2020-21, 11%
2019-20, 10%
You do not have access to a computer, 7%
EI
2020-21, 6%
2019-20, 6%
CPP
2020-21, 8%
2019-20, 7%
CPP-D
2020-21, 15%, significantly higher than total
2019-20, 14%
SIN
2020-21, 8%
2019-20, 5%
OAS/GIS
2020-21, 9%
2019-20, 6%
You have a disability, 7%
EI
2020-21, 5%
2019-20, 5%
CPP
2020-21, 7%
2019-20, 6%
CPP-D
2020-21, 60%, significantly higher than total
2019-20, 55%
SIN
2020-21, 5%
2019-20, 3%
OAS/GIS
2020-21, 10%
2019-20, 7%
Q45a. Some people experience difficulties applying for [INSERT ABBREV] because of barriers to accessing service. Did you experience difficulties applying for [ABBREV] because of any of the following reasons...? [INSERT FOR OAS 'AUTO-ENROLLED' AND OAS/GIS 'AUTO-ENROLLED'] Some people experience difficulties because of barriers to accessing service. Do you experience difficulties because of any of the following reasons? Base: All respondents (n=2431)
Clients with Restrictions that Affect Accessing Service
Figure long description
Overall satisfaction (% rated 4 or 5)
2020-21, 80%
2018-19, 79%
Figure long description
Service Channel Satisfaction
In-person
2020-21, 82%, significantly lower than total
2019-20, 80%
Online
2020-21, 71%, significantly lower than total
2019-20, 70%
Specialized Call Centre
2020-21, 68%, significantly higher than previous waves
2019-20, 61%
1 800 O-Canada
2020-21, 72%, significantly higher than previous wave
2019-20, 55%
MSCA
2020-21, 69%, significantly lower than total
2019-20, 65%
eServiceCanada
2020-21, 83%
Clients with restrictions had lower overall satisfaction compared to all clients and results are consistent compared to 2019-20.
Clients with restrictions had lower satisfaction with the service provided in-person, online, or through MSCA.
Compared to 2019-20, satisfaction has increased for the service provided by specialized call centres and 1 800 O-Canada.
There were also many significant gaps on service attributes between clients with restrictions and clients overall. The largest gaps were for ease of registering for MSCA, overall clarity of process, ease of applying, ease of finding out the steps to apply and ease of finding the information needed to apply.
Compared to 2019-20, ratings increased for overall clarity of process, ease of applying, being able to complete steps online made the process easier, understanding the requirements of the application, gathering the information needed to apply, confidence the application would be processed in a reasonable time, helpfulness of Service Canada call centre staff, ease of completing the application, and ease of figuring out if you are eligible for benefits/SIN cad.
Figure long description
Widest Gap / Change in Service Attributes (% Rated 4 or 5 vs. TOTAL)
Ease of registering for MSCA
2020-21, 50%
GAP, -13 pts
2019-20, 54%
Throughout the process it was clear what would happen next and when it would happen
2020-21, 74%
GAP, -7 pts
2019-20, 68%
Overall, it was easy for you to apply for [ABBREV]
2020-21, 79%
GAP, -7 pts
2019-20, 74%
Find out the steps to apply
2020-21, 70%
GAP, -7 pts
2019-20, 75%
Find out what information you need when applying for [INSET ABBREV]
2020-21, 70%
GAP, -7 pts
2019-20, 75%
You were able to complete the application in a reasonable amount of time
2020-21, 75%
GAP, -6 pts
2019-20, 77%
You were able to move smoothly through all of the steps related to your [ABBREV] application.
2020-21, 79%
GAP, -6 pts
2019-20, 77%
Being able to complete steps online made the process easier for you.
2020-21, 74%
GAP, -6 pts
2019-20, 65%
Understanding the requirements you needed to apply for [PROGRAM]
2020-21, 77%
GAP, -6 pts
2019-20, 72%
Confident application would be processed in a reasonable amount of time
2020-21, 62%
GAP, -6 pts
2019-20, 56%
The amount of time it took was reasonable
2020-21, 75%
GAP, -6 pts
2019-20, 72%
Service Canada specialized call centre phone representatives were helpful
2020-21, 81%
GAP, -4 pts
2019-20, 74%
Completing the application form
2020-21, 79%
GAP, -5 pts
2019-20, 71%
Figures out if you are eligible for benefits/SIN card
2020-21, 71%
GAP, -5 pts
2019-20, 64%
Proportion of At-Risk Client Groups with Restrictions
Figure long description
Proportion of clients:
Youth (18 to 30), 31%:
% at least one, 48%;
Service Canada Centre office was closed due to COVID-19 pandemic, 28%
Application form was too long or complicated, 10%
You could not use the computer in a Service Canada Centre, 8%
You were unable to visit a Service Canada office during business hours, 21%
You do not live in proximity to a Service Canada office, 12%
You needed assistance from someone other than Service Canada staff, 8%
You do not own a smart phone, 6%
You do not have access to a computer 6%
You do not have access to the internet, 6%
You have a disability, 4%
Seniors (60+) 29%:
% at least one, 45%;
Service Canada Centre office was closed due to COVID-19 pandemic, 24%
Application form was too long or complicated, 10%
You could not use the computer in a Service Canada Centre, 11%
You were unable to visit a Service Canada office during business hours, 16%
You do not live in proximity to a Service Canada office, 11%
You needed assistance from someone other than Service Canada staff, 12%
You do not own a smart phone, 12%
You do not have access to a computer, 9%
You do not have access to the internet, 10%
You have a disability, 9%;
OLMC, 5%:
% at least one, 48%;
Service Canada Centre office was closed due to COVID-19 pandemic, 26%
Application form was too long or complicated, 10%
You could not use the computer in a Service Canada Centre, 8%
You were unable to visit a Service Canada office during business hours, 15%
You do not live in proximity to a Service Canada office, 14%
You needed assistance from someone other than Service Canada staff, 9%
You do not own a smart phone, 14%
You do not have access to a computer; 8%
You do not have access to the internet, 12%
You have a disability, 2%
Non E or F speaking, 3%:
% at least one, 68%, significantly higher than total;
Service Canada Centre office was closed due to COVID-19 pandemic, 33%
Application form was too long or complicated, 14%
You could not use the computer in a Service Canada Centre, 10%
You were unable to visit a Service Canada office during business hours, 30%
You do not live in proximity to a Service Canada office, 23%;
You needed assistance from someone other than Service Canada staff, 25%
You do not own a smart phone, 12%, significantly higher than total;
You do not have access to a computer; 7%
You do not have access to the internet, 11%
You have a disability, 9%;
High school or less, 31%:
% at least one, 55%;
Service Canada Centre office was closed due to COVID-19 pandemic, 30%
Application form was too long or complicated, 14%
You could not use the computer in a Service Canada Centre, 14%
You were unable to visit a Service Canada office during business hours, 21%
You do not live in proximity to a Service Canada office, 16%
You needed assistance from someone other than Service Canada staff, 14%
You do not own a smart phone, 12%
You do not have access to a computer; 12%
You do not have access to the internet, 11%
You have a disability, 10%
Indigenous, 9%:
% at least one, 59%
Service Canada Centre office was closed due to COVID-19 pandemic, 33%
Application form was too long or complicated, 14%
You could not use the computer in a Service Canada Centre, 16%
You were unable to visit a Service Canada office during business hours, 28%
You do not live in proximity to a Service Canada office, 20%
You needed assistance from someone other than Service Canada staff, 15%
You do not own a smart phone, 13%
You do not have access to a computer, 15%
You do not have access to the internet, 13%
You have a disability, 9%
Clients with disabilities, 8%:
% At least one, 77%
Service Canada Centre office was closed due to COVID-19 pandemic,42%
Application form was too long or complicated, 27%
You could not use the computer in a Service Canada Centre, 22%
You were unable to visit a Service Canada office during business hours, 26%
You do not live in proximity to a Service Canada office, 23%
You needed assistance from someone other than Service Canada staff, 35%
You do not own a smart phone, 17%
You do not have access to a computer, 14%
You do not have access to the internet, 14%
You have a disability, 54%
Remote, 2%:
% At least one, 61%
Service Canada Centre office was closed due to COVID-19 pandemic, 38%
Application form was too long or complicated, 10%
You could not use the computer in a Service Canada Centre, 22%
You were unable to visit a Service Canada office during business hours, 24%
You do not live in proximity to a Service Canada office, 24%
You needed assistance from someone other than Service Canada staff, 13%
You do not own a smart phone, 9%
You do not have access to a computer, 14%
You do not have access to the internet, 12%
You have a disability, 9%
Urban, 62%:
% At least one, 48%
Service Canada Centre office was closed due to COVID-19 pandemic,28%
Application form was too long or complicated, 11%
You could not use the computer in a Service Canada Centre, 8%
You were unable to visit a Service Canada office during business hours, 17%
You do not live in proximity to a Service Canada office, 11%
You needed assistance from someone other than Service Canada staff, 11%
You do not own a smart phone, 7%
You do not have access to a computer, 6%
You do not have access to the internet, 7%
You have a disability, 7%
Rural, 35%:
% At least one, 47%
Service Canada Centre office was closed due to COVID-19 pandemic, 25%
Application form was too long or complicated, 10%
You could not use the computer in a Service Canada Centre, 10%
You were unable to visit a Service Canada office during business hours, 20%
You do not live in proximity to a Service Canada office, 13%
You needed assistance from someone other than Service Canada staff, 10%
You do not own a smart phone, 10%
You do not have access to a computer, 9%
You do not have access to the internet, 9%
You have a disability, 7%
E-vulnerable, 13%:
% At least one, 64%
Service Canada Centre office was closed due to COVID-19 pandemic, 38%
Application form was too long or complicated, 21%
You could not use the computer in a Service Canada Centre, 19%
You were unable to visit a Service Canada office during business hours, 24%
You do not live in proximity to a Service Canada office, 18%
You needed assistance from someone other than Service Canada staff, 21%
You do not own a smart phone, 21%
You do not have access to a computer, 19%
You do not have access to the internet, 17%
You have a disability, 13%
Newcomers (3 years or fewer), 14%:
% At least one, 52%
Service Canada Centre office was closed due to COVID-19 pandemic, 31%
Application form was too long or complicated, 8%
You could not use the computer in a Service Canada Centre, 5%
You were unable to visit a Service Canada office during business hours, 18%
You do not live in proximity to a Service Canada office, 12%
You needed assistance from someone other than Service Canada staff, 8%
You do not own a smart phone, 7%
You do not have access to a computer, 6%
You do not have access to the internet, 8%
You have a disability, 3%
Language barrier, 5%:
% At least one, 75%
Service Canada Centre office was closed due to COVID-19 pandemic, 39%
Application form was too long or complicated, 30%
You could not use the computer in a Service Canada Centre, 19%
You were unable to visit a Service Canada office during business hours, 34%
You do not live in proximity to a Service Canada office, 26%
You needed assistance from someone other than Service Canada staff, 28%
You do not own a smart phone, 15%
You do not have access to a computer, 21%
You do not have access to the internet, 19%
You have a disability, 13%
Mobile only, 9%:
% At least one, 63%
Service Canada Centre office was closed due to COVID-19 pandemic,37%
Application form was too long or complicated, 20%
You could not use the computer in a Service Canada Centre, 19%
You were unable to visit a Service Canada office during business hours, 23%
You do not live in proximity to a Service Canada office, 19%
You needed assistance from someone other than Service Canada staff, 22%
You do not own a smart phone, 11%
You do not have access to a computer, 20%
You do not have access to the internet, 17%
You have a disability, 9%
No devices, 3%:
% At least one, 73%
Service Canada Centre office was closed due to COVID-19 pandemic, 46%
Application form was too long or complicated, 33%
You could not use the computer in a Service Canada Centre, 32%
You were unable to visit a Service Canada office during business hours, 29%
You do not live in proximity to a Service Canada office, 20%
You needed assistance from someone other than Service Canada staff, 26%
You do not own a smart phone, 39%
You do not have access to a computer, 46%
You do not have access to the internet, 42%
You have a disability, 23%
Clients with restrictions , 48%
% At least one, 100%
Service Canada Centre office was closed due to COVID-19 pandemic, 56%
Application form was too long or complicated, 22%
You could not use the computer in a Service Canada Centre, 18%
You were unable to visit a Service Canada office during business hours, 38%
You do not live in proximity to a Service Canada office, 25%
You needed assistance from someone other than Service Canada staff, 22%
You do not own a smart phone, 18%
You do not have access to a computer, 15%
You do not have access to the internet, 16%
You have a disability, 15%
Racialized, 35%
% At least one, 53%
Service Canada Centre office was closed due to COVID-19 pandemic, 32%
Application form was too long or complicated, 11%
You could not use the computer in a Service Canada Centre, 8%
You were unable to visit a Service Canada office during business hours, 19%
You do not live in proximity to a Service Canada office, 13%
You needed assistance from someone other than Service Canada staff, 11%
You do not own a smart phone, 8%
You do not have access to a computer, 7%
You do not have access to the internet, 8%
You have a disability, 6%
Q45a. Some people experience difficulties applying for [INSERT ABBREV] because of barriers to accessing service. Did you experience difficulties applying for [ABBREV] because of any of the following reasons...? [INSERT FOR OAS 'AUTO-ENROLLED' AND OAS/GIS 'AUTO-ENROLLED'] Some people experience difficulties because of barriers to accessing service. Do you experience difficulties because of any of the following reasons? Base: All respondents (n=4200)
OLMC
Official Language Minority Communities
*small sample size, results should be interpreted with caution.
At-Risk Groups
At-Risk Client Groups: Introduction
At-risk clients* make up 95% of the total sample universe, and as such were a high priority for Service Canada
Service Canada aims to assess whether it has improved service to client groups with low satisfaction and who encounter barriers to service. Clients may encounter barriers to accessing service for a number of reasons, and it was of high priority for Service Canada that these clients receive equal levels of service as clients who face no barriers.
Figure long description
Newcomers
Not born in Canada and arrived within the previous 3 years
Non English or French speakers
Identify “other” as preferred language of service
Lower Education
High school or less
Youth
Aged 18 to 30
Seniors
Aged 60 and over
Clients with disabilities
Self-identified
Clients with restrictions
Self-identified
Indigenous people
Self-identified as First Nations, Inuit, or Métis
E-vulnerable
Clients who rarely or never use online services
Mobile only
Self-reported as clients with only a smartphone, no computer or tablet
No devices
Self-reported as clients with no devices (mobile, tablet, computer)
Remote clients
Sample variable
Rural clients
Sample variable
Urban clients
Sample variable
Official language minorities (OLMC)
Clients in Quebec who prefer service in English, and clients outside Quebec who prefer service in French (sample variable and (Q41b)
Language barrier
It was easy to access service in a language I could speak and understand well (Rated 1 or 2)
Racialized
Clients who identify as a racial or cultural group other than White (Can be in addition to also identifying as white)
*This calculation considers all clients who were a part of at least one At-Risk group, excluding residents of urban areas. If we were to consider residents of urban areas, 100% of the sample falls into at least one At-Risk category. Q45a. Some people experience difficulties applying for because of barriers to accessing service. Did you experience difficulties applying for [ABBREV] because of any of the following reasons…?” Base: All Answering (n=varies)
At-Risk Client Groups: Summary
Figure long description
Proportion of clients in at-risk groups:
Youth (18-30), 31%
% satisfied
2020-21, 85%
2019-20, 84%
2018-19, 86%
Proportion with a disability
2020-21, 4%, significantly lower than total
2019-20, 3%
2018-19, 3%
Seniors (60+)29%
% satisfied
2020-21, 87%
2019-20, 86%
2018-19, 87%
Proportion with a disability
2020-21, 13%, significantly higher than total
2019-20, 12%
2018-19, 17%
OLMC, 5%
% satisfied
2020-21, 90%
2019-20, 90%
2018-19, 91%
Proportion with a disability
2020-21, 3%, significantly lower than total
2019-20, 2%
2018-19, 3%
Non English or French speaking, 3%
% satisfied
2020-21, 90%
2019-20, 92%
2018-19, 80%
Proportion with a disability
2020-21, 2%, significantly lower than total
2019-20, 5%
2018-19, 5%
High school or less, 31%
% satisfied
2020-21, 86%
2019-20, 84%
2018-19, 85%
Proportion with a disability
2020-21, 13%, significantly higher than total
2019-20, 11%
2018-19, 13%
Indigenous, 9%
% satisfied
2020-21, 83%
2019-20, 79%
2018-19, 85%
Proportion with a disability
2020-21, 13%, significantly higher than total
2019-20, 13%
2018-19, 14%
Clients with disabilities, 8%
% satisfied
2020-21, 76%, significantly lower than total
2019-20, 76%
2018-19, 79%
Proportion with a disability
2020-21, 100%, significantly higher than total
2019-20, 100%
2018-19, 100%
Remote, 2%
% satisfied
2020-21, 88%, significantly higher than previous waves
2019-20, 80%
2018-19, 88%
Proportion with a disability
2020-21, 12%, significantly higher than total, significantly higher than previous waves
2019-20, 4%
2018-19, 9%
Urban, 62%
% satisfied
2020-21, 86%
2019-20, 85%
2018-19, 86%
Proportion with a disability
2020-21, 7%
2019-20, 6%
2018-19, 9%
Rural, 35%
% satisfied
2020-21, 85%, significantly higher than previous waves
2019-20, 82%
2018-19, 83%
Proportion with a disability
2020-21, 11%, significantly higher than total
2019-20, 9%
2018-19, 10%
E-vulnerable, 13%
% satisfied
2020-21, 82%, significantly lower than total
2019-20, 85%
2018-19, 84%
Proportion with a disability
2020-21, 16%, significantly higher than total
2019-20, 14%
2018-19, 18%
Newcomers (3 years or fewer), 14%
% satisfied
2020-21, 93%, significantly higher than total
2019-20, 94%
2018-19, 93%
Proportion with a disability
2020-21, 0%, significantly lower than total
2019-20, 1%
2018-19, 1%
Language barrier, 5%
% satisfied
2020-21, 55%, significantly lower than total
2019-20, 52%
2018-19, 42%
Proportion with a disability
2020-21, 16%, significantly higher than total
2019-20, 19%
2018-19, 18%
Mobile only, 9%
% satisfied
2020-21, 83%
2019-20, 85%
2018-19, 85%
Proportion with a disability
2020-21, 32%, significantly lower than total, significantly higher than previous waves
2019-20, 8%
2018-19, 11%
No devices, 3%
% satisfied
2020-21, 80%, significantly lower than total
2019-20, 81%
2018-19, 83%
Proportion with a disability
2020-21, 10%
2019-20, 15%
2018-19, 23%
Clients with restrictions, 48%
% satisfied
2020-21, 80%, significantly lower than total
2019-20, 79%,
Proportion with a disability
2020-21, 13%, significantly higher than total
2019-20, 14%
Racialized, 35%
% satisfied
2020-21, 89%, significantly higher than total
Proportion with a disability
2020-21, 3%, significantly lower than total
Proportion of At-Risk Client Groups
Presence of at-risk client groups differed significantly by program due in large part to program design.
Figure long description
Proportion of At-Risk Client Groups
Youth (18 to 30), 31%, n=734
EI, 29%
CPP, 0%
CPPD, 3%
SIN, 57%
Seniors (60+), 29%, n=1950
EI, 15%
CPP, 96%
CPPD, 25%
SIN, 4%
OAS/GIS, 100%
OLMC, 5%, n=210
EI, 4%
CPP, 2%
CPPD, 2%
SIN, 9%
OAS/GIS, 5%
Non E or F speaking, 3%, n=93, small sample size
EI, 2%
CPP, 1%
CPPD, 3%
SIN, 6%
OAS/GIS, 1%
High school or less, 31%, n=1608
EI, 33%
CPP, 41%
CPPD, 41%
SIN, 19%
OAS/GIS, 43%
Indigenous, 9%, n=551
EI, 12%
CPP, 5%
CPPD, 8%
SIN, 7%
OAS/GIS, 3%
Clients with disabilities, 8%, n=916
EI, 6%
CPP, 11%
CPPD, 84%
SIN, 3%
OAS/GIS, 15%
Remote, 2%, n=400
EI, 3%
CPP, 2%
CPPD, 3%
SIN, 1%
OAS/GIS, 2%
Urban, 62%, n=1948
EI, 56%
CPP, 54%
CPPD, 53%
SIN, 79%
OAS/GIS, 52%
Rural, 35%, n=1835
EI, 41%
CPP, 44%
CPPD, 44%
SIN, 18%
OAS/GIS, 46%
E-vulnerable, 13%, n=858
EI, 11%
CPP, 26%
CPPD, 26%
SIN, 9%
OAS/GIS, 22%
Newcomers (3 years or fewer), 14%, n=357
EI, 2%
SIN, 44%
Language barrier, 5%, n=285
EI, 4%
CPP, 7%
CPPD, 13%
SIN, 4%
OAS/GIS, 5%
Mobile only, 9%, n=385
EI, 9%
CPP, 5%
CPPD, 11%
SIN, 9%
OAS/GIS, 9%
No devices, 3%, n=240
EI, 2%
CPP, 8%
CPPD, 7%
SIN, 1%
OAS/GIS, 9%
Clients with restrictions, 48%, n=3297
EI, 46%
CPP, 47%
CPPD, 80%
SIN, 52%
OAS/GIS, 38%
Racialized, 35%, n=947
EI, 24%
CPP, 11%
CPPD, 16%
SIN, 72%
OAS/GIS, 9%
OLMC
Official Language Minority Communities
*small sample size, results should be interpreted with caution.
Proportion of At-Risk Client Groups By Region
Among clients in the West and the Territories, there was a higher portion of those with a high school education or less, with a disability, remote clients, those with only a mobile device and those with restrictions compared to all clients.
Among clients in Ontario, there was a higher portion of urban clients, racialized clients and newcomers compared to all clients.
Among clients in Quebec, there was a higher proportion of OLMC. Among clients in Atlantic Canada, there was also a higher proportion of OLMC, rural and remote clients.
Figure long description
Youth (18 to 30), 31%, n=734
West/Territories, 30%
Ontario, 34%
Quebec, 28%
Atlantic, 26%
Seniors (60+), 29%, n=1950
West/Territories, 29%
Ontario, 29%
Quebec, 28%
Atlantic, 33%
OLMC, 5%, n=210
West/Territories, 1%
Ontario, 2%
Quebec, 17%
Atlantic, 8%
Non E or F speaking, 3%, small sample size, n=93
West/Territories, 3%
Ontario, 3%
Quebec, 2%
Atlantic, 2%
High school or less, 31%, n=1608
West/Territories, 35%
Ontario, 27%
Quebec, 30%
Atlantic, 35%
Indigenous, 9%, n=551
West/Territories, 10%
Ontario, 7%
Quebec, 8%
Atlantic, 10%
Clients with disabilities, 8%, n=916
West/Territories, 11%
Ontario, 9%
Quebec, 4%
Atlantic, 6%
Remote, 2%, n=400
West/Territories, 4%
Ontario, 1%
Quebec, 1%
Atlantic, 4%
Urban, 62%, n=1948
West/Territories, 62%
Ontario, 69%
Quebec, 65%
Atlantic, 30%
Rural, 35%, n=1835
West/Territories, 33%
Ontario, 30%
Quebec, 33%
Atlantic, 67%
E-vulnerable, 13%, n=858
West/Territories, 14%
Ontario, 13%
Quebec, 13%
Atlantic, 16%
Newcomers (3 years or fewer), 14%, n=357
West/Territories, 14%
Ontario, 18%
Quebec, 11%
Atlantic, 9%
Language barrier, 5%, n=285
West/Territories, 5%
Ontario, 3%
Quebec, 6%
Atlantic, 5%
Mobile only, 9%, n=385
West/Territories, 11%
Ontario, 8%
Quebec, 9%
Atlantic, 5%
No devices, 3%, n=240
West/Territories, 3%
Ontario, 3%
Quebec, 3%
Atlantic, 4%
Clients with restrictions , 48%, n=3297
West/Territories, 51%
Ontario, 49%
Quebec, 46%
Atlantic, 38%
Racialized, 35%, n=947
West/Territories, 35%
Ontario, 44%
Quebec, 26%
Atlantic, 18%
OLMC
Official Language Minority Communities
*small sample size, results should be interpreted with caution.
At-Risk Client Groups, ON & QC
Clients with restrictions in Ontario are more likely to be satisfied compared to all clients with restrictions, while clients with disabilities in Quebec are more likely to be satisfied compared to all clients with disabilities.
Satisfaction among rural clients in Ontario increased compared to last year, while it decreased among rural clients in Quebec.
Figure long description
% Satisfied (2020-21)
Youth (18 to 30), 85%, n=734
Ontario, 88%
Quebec, 82%
Seniors (60+), 87%, n=1950
Ontario, 89%
Quebec, 86%
OLMC, 90%, n=210
Ontario, 88%, very small sample size
Quebec, 89%
Non E or F speaking, 90%, n=93
Ontario, 92%, very small sample size
Quebec, 93%, very small sample size
High school or less, 86%, n=1608
Ontario, 89%
Quebec, 86%
Indigenous, 83%, n=551
Ontario, 81%
Quebec, 91%, small sample size
Clients with disabilities, 76%, n=916
Ontario, 74%
Quebec, 87%
Remote, 88%, n=400
Ontario, 79%
Quebec, 91%
Urban, 86%, n=1948
Ontario, 89%
Quebec, 84%
Rural, 85%, n=1835
Ontario, 88%
Quebec, 84%
E-vulnerable, 82%, n=858
Ontario, 80%
Quebec, 85%
Newcomers (3 years or fewer), 93%, n=357
Ontario, 96%
Quebec, 94%, small sample size
Language barrier, 55%, n=285
Ontario, 58%, small sample size
Quebec, 42%, small sample size
Mobile only, 83%, n=385
Ontario, 85%, small sample size
Quebec, 85%, small sample size
No devices, 80%, n=240
Ontario, 88%, small sample size
Quebec, 74%, small sample size
Clients with restrictions, 80%, n=3297
Ontario, 84%
Quebec, 79%
Racialized, 89%, n=947
Ontario, 91%
Quebec, 86%
OLMC
Official Language Minority Communities
Note: significance testing between regions was conducted compared to the overall sample of each at-risk group.
*small sample size **very small sample size, results should be interpreted with caution.
Proportion of Clients with Disabilities Overall and by Program
Fewer than one in ten clients reported they have a disability, on par with last year. CPP-D clients remain by far most likely, OAS/GIS and CPP clients also have a higher presence of disability compared to the proportion among all clients, while SIN and EI clients have a lower proportion.
The most common disability is a mobility restriction, followed by mental health-related disabilities. CPP and OAS/GIS clients are more likely to have a mobility disability, while CPP-D and SIN clients are most likely to have a mental health-related disability.
Figure long description
% Yes Have a disability:
Total, n=4200
2020-21, 8%
2019-20, 7%
2018-19, 9%
CPP-D, n=692
2020-21, 84%, significantly higher than total
2019-20, 83%
2018-19, 92%
OAS/GIS, n=845
2020-21, 15%, significantly higher than total
2019-20, 17%
2018-19, 19%
CPP, n=752,
2020-21, 11%, significantly higher than total, significantly higher than previous waves
2019-20, 7%
2018-19, 16%
EI, n=1162,
2020-21, 6%, significantly lower than total
2019-20, 5%,
2018-19, 6%
SIN, n=749,
2020-21, 3%, significantly lower than total
2019-20, 3%
2018-19, 3%
Figure long description
Type of disability:
Mobility, 50%
EI, 38%, significantly lower than total
CPP, 65%, significantly higher than total
CPP-D, 55%
SIN, 24%
OAS/GIS, 72%
Mental health, 21%
EI, 22%
CPP, 13%
CPP-D, 30%
SIN, 45%
OAS/GIS, 2%
Cognitive, 13%
EI, 19%
CPP, 14%
CPP-D, 16%
SIN, 10%
OAS/GIS, 2%
Hearing, 9%
EI, 10%
CPP, 11%
CPP-D, 5%
SIN, 4%
OAS/GIS, 10%
Seeing, 8%
EI, 5%;
CPP, 6%
CPP-D, 6%
OAS/GIS, 19%
Communication, 2%
EI, 1%
CPP, 1%
CPP-D, 3%
SIN, 10%
OAS/GIS, 1%
Q44A. Do you identify as a person with a disability? Base: All respondents (n=4200)
Q46A. What type of disability do you have? Base: Have a disability (n=916)
*small sample size **very small sample size, results should be interpreted with caution.
Clients with Disabilities
Clients who identified as a person with a disability had lower overall satisfaction compared to all clients and lower satisfaction with all channels.
Compared to 2019-20, clients with disabilities provided lower ratings for the quality of service provided in person, online and through 1 800 O-Canada.
There were also many significant gaps on service attributes between clients with disabilities and clients overall. The largest gaps were for being able to complete steps online made the process easier, ease of figuring out if you are eligible for benefits, the helpfulness of 1 800 O-Canada representatives, being able to move smoothly through all the steps and ease of finding information about the program. Year over year, ratings have declined for being able to move smoothly through the steps and ease of finding information about the program.
Figure long description
Overall Satisfaction (% Rated 4 or 5)
2020-21, 76%, significantly lower than total
2019-20, 76%
2018-19, 79%
Figure long description
Service Channel Satisfaction
In person
2020-21, 67%
2019-20, 80%
2018-19, 79%
Online
2020-21, 62%
2019-20, 73%
2018-19, 71%
Specialized Call Centre
2020-21, 60%
2019-20,66%
2018-19,69%
1 800 O-Canada
2020-21, 48%
2019-20,70%
2018-19,50%
My Service Canada Account
2020-21, 56%
2019-20,69%
2018-19,-
eSERVICECANADA
2020-21, 71%
Figure long description
Widest Gap in Service Attributes (% Rated 4 or 5 vs. TOTAL)
Being able to complete steps online made the process easier for you.
57%
-23 pts
Ease of figuring out if you are eligible for benefits/ SIN card
56%
-20 pts
1 800 O-Canada phone representatives were helpful
70%
-18 pts
You were able to move smoothly through all of the steps related to your [ABBREV] application.
68%
-17 pts
Ease of finding information about [INSERT ABBREV]
62%
-16 pts
Note: Q44A wording was revised in 2019-20 to the following: “Do you identify as a person with a disability?” Types of disabilities listed were also expanded in 2019-20 and were retained in 2020-21. Interpret tracking results with caution. *small sample size, results should be interpreted with caution.
Compared to 2019-20, ratings have increased for the ease of completing the application form while declines were also observed across several attributes.
The largest negative shifts were for it being easy to get help when you needed it, needing to explain your situation only once, receiving consistent information, ease of deciding the best age to start your pension and the clarity of the issue resolution process.
Figure long description
Change in Service Attributes
Ease of completing the application form
2020-21, 73%
2019-20, 66%
It was easy to get help when you needed it
2020-21, 57%
2019-20, 71%
You needed to explain your situation only once
2020-21, 63%
2019-20, 73%
You received consistent information
2020-21, 71%
2019-20, 80%
Ease of deciding the best age to start your pension
2020-21, 68%
2019-20, 77%
It was clear what to do if you had a problem or question
2020-21, 65%
Among clients those with disabilities, OAS/GIS clients were more likely to be satisfied while CPP-D clients were less likely to be satisfied compared to all clients with disabilities.
There have been no statistically significant shifts year over year.
Figure long description
Overall Satisfaction (%rated 4 or 5), by program
EI
2017-18, 59%
2018-19, 82%
2019-20, 74%
2020-21, 76%, small sample size
CPP
2017-18, 69%
2018-19, 79%
2019-20, 76%
2020-21, 83%, small sample size
CPPD
2017-18, 49%
2018-19, 62%
2019-20, 58%
2020-21, 63%, significantly lower than total
SIN
2017-18, 81%
2018-19, 84%
2019-20, 100%
2020-21, 85%, very small sample size
OAS/GIS
2018-19, 86%
2019-20, 88%
2020-21, 83%, significantly higher than total
Note: Q44A wording was revised in 2019-20 to the following: “Do you identify as a person with a disability?” Types of disabilities listed were also expanded in 2019-20 and were retained in 2020-21. Interpret tracking results with caution. *small sample size **very small sample size, results should be interpreted with caution.
At-Risk Client Groups: Indigenous Clients
Overall satisfaction among Indigenous clients was consistent compared to all clients . Notably, satisfaction among Indigenous clients specifically in urban areas increased year over year.
Indigenous clients were less satisfied with service provided in person or online compared to all clients.
Compared to 2019-20, Indigenous clients had higher satisfaction with service provided through 1 800 O-Canada. There has also been improvement made on several service attributes including the ease of figuring out if you’re eligible for benefits, ease of understanding the requirements, the helpfulness of call centre representatives, being able to find the info needed in a reasonable amount of time and clarity of process.
Figure long description
Overall Satisfaction (% Rated 4 or 5):
Indigenous
2020-21, 83%
2019-20, 79%
2018-19, 85%
2017-18, 77%
Urban
2020-21, 88%, significantly higher than previous wave
2019-20, 73%
2018-19, 82%
Rural
2020-21, 80%
2019-20, 82%
2018-19, 86%
Remote
2020-21, 87%, small sample size
2019-20, 75%
2018-19, 93%
Figure long description
Service Channel Satisfaction
In person
2020-21, 77%, significantly lower than total
2019-20, 84%
2018-19, 87%
2017-1877%
Online
2020-21, 73%, significantly lower than total
2019-20,65%
2018-19, 82%
2017-18, 75%
Specialized Call Centre
2020-21, 73%
2019-20, 63%
2018-19, 78%
2017-18, 77%
1 800 O-Canada
2020-21, 83%, small sample size, significantly higher than previous waves
2019-20, 52%
2018-19, 71%
2017-18, 68%
My Service Canada Account
2020-21, 73%
2019-20, 76%
eSERVICECANADA
2020-21, 87%, small sample size
Figure long description
Change in Service Attributes
Ease of figure out if you are eligible for benefits/ SIN card
2020-21, 68%, significantly higher than previous waves
2019-20, 57%
2018-19, 62%
Ease of understanding the requirements of the application
2020-21, 79%, significantly higher than previous waves
2019-20, 69%
2018-19, 73%
Service Canada specialized call centre phone representatives were helpful
2020-21, 83%, significantly higher than previous waves
2019-20, 73%
You were able to find the information you needed within a reasonable amount of time
2020-21, 76%, significantly higher than previous waves
2019-20, 68%
Throughout the process it was clear what would happen next and when it would happen
2020-21, 80%, significantly higher than previous waves
2019-20, 74%
2018-19, 79%
Indigenous clients n=551
*small sample size, results should be interpreted with caution.
At-Risk Client Groups: Indigenous Clients
Compared to all clients, Indigenous clients were less likely to feel it was easy to understand the information about their program, figure out eligibility, say they received consistent information, feel it was easy to find information about their program, that it was easy to complete their application form and that it was easy to put together the information needed to apply.
Figure long description
Widest Gap in Service Attributes (% Agree vs. TOTAL)
Understand the information about [PROGRAM]
69%
-9pts
Figure out if you were eligible for benefits/ SIN card
68%
-8pts
You received consistent information
77%
-7pts
Ease of finding information about [PROGRAM]
72%
-6pts
Completing the form
79%
-5pts
Putting together the information you needed to apply.
77%
Indigenous clients n=551
Figure long description
Profile of Indigenous Clients
First nations
2018-19, 58%
2019-20, 78%
2020-21, 62%
Metis
2018-19, 34%
2019-20, 16%
2020-21, 32%
Inuit:
2018-19, 10%
2019-20, 6%
2020-21, 6%
At-Risk Client Groups: Urban, Rural and Remote
Overall satisfaction was consistent among urban, rural or remote clients compared to all clients.
Year over year, satisfaction increased among remote and rural clients.
Rural clients were less satisfied with service received in person compared to all clients.
Compared to 2019-20, urban clients’ provided higher ratings for the quality of service provided in-person, online and through specialized call centre.
Rural clients were more satisfied with the quality of service provided through specialized call centre and less satisfied with in person service. Remote clients were less satisfied with MSCA.
Figure long description
Overall Satisfaction (% Rated 4 or 5)
Urban:
2020-21, 86%
2019-20, 85%
2018-19, 86%
Rural:
2020-21, 85%, significantly higher than previous wave
2019-20, 82%
2018-19, 83%
Remote:
2020-21, 88%, significantly higher than previous wave
2019-20, 80%
2018-19, 88%
Figure long description
Service Channel Satisfaction
In person
Urban
2020-21, 89%, significantly higher than previous wave
2019-20, 85%
2018-19, 88%
Rural
2020-21, 80%, significantly lower than previous wave, significantly lower than total
2019-20, 87%
2018-19, 85%
Remote
2020-21, 82%
2019-20, 89%
2018-19, 87%
Online
Urban
2020-21, 79%, significantly higher than previous wave
2019-20, 73%
2018-19, 78%
Rural
2020-21, 77%
2019-20, 73%
2018-19, 81%
Remote
2020-21, 74%
2019-20, 76%
2018-19, 80%
Specialized Call Centre
Urban
2020-21, 72%, significantly higher than previous wave
2019-20, 62%
2018-19, 73%
Rural
2020-21, 73%
2019-20, 60%
2018-19, 76%
Remote
2020-21, 72%, small sample size
2019-20, 71%
2018-19, 79%
1 800 O-Canada
Urban
2020-21, 71%
2019-20,71%
2018-19,70%
Rural
2020-21, 74%
2019-20, 65%
2018-19,76%
Remote
2020-21, 80%, very small sample size
2019-20, 74%
2018-19, 69%
My Service Canada Account
Urban
2020-21, 75%
2019-20, 73%
Rural
2020-21, 74%
2019-20, 77%
Remote
2020-21, 68%, small sample size, significantly lower than previous waves
*small sample size **very small sample size, results should be interpreted with caution.
At-Risk Client Groups: Urban, Rural and Remote
Rural clients provided lower ratings compared to urban and remote clients for the ease of finding information about the program, finding out the steps to apply and understanding the information about the program. Remote clients provided higher ratings for the overall ease of applying and lower ratings for putting together the information needed to apply and clarity and confidence in the issue resolution process.
Compared to 2019-20, satisfaction increased among all groups for the clarity of the process and timeliness of service. Rural clients were also more likely to agree they received consistent information and provided higher ratings for putting together the information needed to apply and the helpfulness of specialized call centre staff, while they provided lower ratings for the ease of finding information about the program, finding the steps to apply and ease of getting help in general. Remote clients also provided higher ratings for overall effectiveness and overall ease of applying, while they provided lower ratings for the ease of finding information about the program and for the clarity and confidence in the issue resolution process. Urban clients provided higher ratings for the ease of understanding information about the program and helpfulness of specialized call centre reps, while they provided lower ratings for the ease of getting help in general.
Figure long description
Change in Service Attributes
Ease of figuring out if you are eligible for benefits/ SIN card
Urban
2020-21, 77%
2019-20, 72%
Rural
2020-21, 74%
2019-20, 70%
Remote
2020-21, 80%
2019-20, 70%
Throughout the process it was clear what would happen next and when.
Urban
2020-21, 80%, significantly higher than previous wave
2019-20, 73%
2018-19, 75%
Rural
2020-21, 81%, significantly higher than previous wave
2019-20, 74%
2018-19, 79%
Remote
2020-21, 77%, significantly higher than previous wave
2019-20, 68%
2018-19, 79%
The amount of time it took was reasonable.
Urban
2020-21, 81%, significantly higher than previous wave
2019-20, 78%
2018-19, 76%
Rural
2020-21, 84%, significantly higher than previous wave
2019-20, 80%
2018-19, 77%
Remote
2020-21, 84%, significantly higher than previous wave
2019-20, 77%
2018-19, 75%
You received consistent information
Urban
2020-21, 85%, significantly higher than previous wave
2019-20, 81%
2018-19, 81%
Rural
2020-21, 84%, significantly higher than previous wave
2019-20, 80%
2018-19, 82%
Remote
2020-21, 81%
2019-20, 77%
2018-19, 84%
Ease of finding information about the program
Urban
2020-21, 81%
2019-20, 77%
Rural
2020-21, 71%, significantly lower than previous wave
2019-20, 79%
Remote
2020-21, 72%, significantly lower than previous wave
2019-20, 84%
Ease of understanding information about the program
Urban
2020-21, 80%, significantly higher than previous wave
2019-20, 75%
Rural
2020-21, 74%
2019-20, 78%
Remote
2020-21, 72%
2019-20, 78%
Ease of finding out the steps to apply
Urban
2020-21, 80%,
2019-20, 82%
Rural
2020-21, 72%, significantly lower than previous wave
2019-20, 79%
Remote
2020-21, 73%
2019-20, 77%
Putting together the information you needed to apply
Urban
2020-21, 83%
2019-20, 80%
Rural
2020-21, 81%, significantly higher than previous wave
2019-20, 77%
Remote
2020-21, 76%
2019-20, 78%
You were able to move smoothly through all of the steps
Urban
2020-21, 85%
2019-20, 83%
2018-19, 83%
Rural
2020-21, 84%
2019-20, 81%
2018-19, 85%
Remote
2020-21, 88%
2019-20, 81%
2018-19, 88%
It was clear what to do if you had a problem or question.
Urban
2020-21, 79%
2019-20, 76%
2018-19, 77%
Rural
2020-21, 79%
2019-20, 80%
2018-19, 78%
Remote
2020-21, 73%, significantly lower than previous wave
2019-20, 83%
2018-19, 84%
Confident that any issues or problems would have been easily resolved.
Urban
2020-21, 78%
2019-20, 79%
2018-19, 79%
Rural
2020-21, 75%
2019-20, 76%
2018-19, 76%
Remote
2020-21, 68%, significantly lower than previous wave
2019-20, 76%
2018-19, 81%
It was easy to get help when you needed it.
Urban
2020-21, 72%, significantly lower than previous wave
2019-20, 76%
2018-19, 77%
Rural
2020-21, 69%, significantly higher than previous wave
2019-20, 76%
2018-19, 76%
Remote
2020-21, 72%
2019-20, 73%
2018-19, 80%
Overall, it was easy for you to apply
Urban
2020-21, 85%
2019-20, 82%
2018-19, 83%
Rural
2020-21, 86%
2019-20, 86%
2018-19, 87%
Remote
2020-21, 93%, significantly higher than previous wave
2019-20, 85%
2018-19, 90%
Service Canada specialized call centre phone representatives were helpful
Urban
2020-21, 84%, significantly higher than previous wave
2019-20, 74%
Rural
2020-21, 85%, significantly higher than previous wave
Rural clients provided lower ratings compared to all clients for getting help on your application when needed, while remote clients provided lower ratings for travelling a reasonable distance to access service, the helpfulness of eServiceCanada reps and being provided service in a way that protected their health and safety during the pandemic.
Figure long description
Change in Service Attributes
Getting help on your application when you needed it
Urban
2020-21, 66%
Rural
2020-21, 61%, significantly lower than the total
Remote
2020-21, 68%
You travelled a reasonable distance to access the service
Urban
2020-21, 81%
2019-20, 76%
Rural
2020-21, 75%
2019-20, 75%
Remote
2020-21, 67%, significantly lower than the total
2019-20, 72%
Service Canada phone representatives that called you back after you completed an online form were helpful
Urban
2020-21, 85%
Rural
2020-21, 87%
Remote
2020-21, 66%, significantly lower than the total
You were provided service in a way that protected your health and safety during the COVID-19 pandemic
*small sample size, results should be interpreted with caution.
Youth were more likely to provide high ratings compared to adults and seniors for being able to complete steps online made the process easier, ease of getting help in general and the helpfulness of eServiceCanada reps. Seniors provided lower ratings for being able to complete steps online made the process easier, helpfulness of Service Canada in person reps and that were provided service in a way that protected your health and safety during the COVID-19 pandemic.
Compared to 2019-20, all groups provided higher ratings for the helpfulness of Service Canada specialized call centre reps. Seniors were also more likely to agree that being able to complete steps online made the process easier and provided lower ratings for the helpfulness of Service Canada in person reps. Adults also provided higher ratings for overall effectiveness, clarity of process, receiving consistent information and timeliness of service. Youth also provided higher ratings for clarity of process, clarity of the issue resolution process and travelling a reasonable distance to access service.
Figure long description
Differences/change in service attributes
Being able to complete steps online made the process easier for you.
Youth
2020-21, 85%
2019-20, 86%
2018-19, 89%
Adults
2020-21, 83%, significantly higher than previous wave
2019-20, 79%
2018-19, 80%
Seniors
2020-21, 70%
2019-20, 62%
2018-19, 56%
You were able to move smoothly through all of the steps.
Youth
2020-21, 85%
2019-20, 82%
2018-19, 86%
Adults
2020-21, 86%, significantly higher than previous wave
2019-20, 80%
2018-19, 82%
Seniors
2020-21, 83%
2019-20, 85%
2018-19, 84%
It was clear what to do if you had a problem or question.
Youth
2020-21, 81%, significantly higher than previous wave
2019-20, 76%
2018-19, 79%
Adults
2020-21, 77%
2019-20, 78%
2018-19, 76%
Seniors
2020-21, 79%
2019-20, 80%
2018-19, 79%
Throughout the process it was clear what would happen next and when it would happen.
Youth
2020-21, 80%, significantly higher than previous wave
2019-20, 71%
2018-19, 76%
Adults
2020-21, 81%, significantly higher than previous wave
2019-20, 71%
2018-19, 76%
Seniors
2020-21, 81%
2019-20, 79%
2018-19, 78%
It was easy to get help when you needed it.
Youth
2020-21, 76%
2019-20, 80%
2018-19, 84%
Adults
2020-21, 69%
2019-20, 74%
2018-19, 74%
Seniors
2020-21, 70%
2019-20, 73%
2018-19, 73%
Service Canada specialized call centre phone representatives were helpful
Youth
2020-21, 88%, significantly higher than previous wave
2019-20, 73%
Adults
2020-21, 81%, significantly higher than previous wave
2019-20, 73%
Seniors
2020-21, 88%, significantly higher than previous wave
2019-20, 75%
Service Canada representatives that you dealt with in person were helpful
Youth
2020-21, 93%
2019-20, 94%
Adults
2020-21, 92%
2019-20, 91%
Seniors
2020-21, 83%, significantly lower than previous wave
2019-20, 91%
The Service Canada phone representatives that called you back after you completed an online form were helpful
Youth
2020-21, 95%
Adults
2020-21, 80%
Seniors
2020-21, 81%
You travelled a reasonable distance to access the service
Youth
2020-21, 83%, significantly higher than previous wave
2019-20, 70%
Adults
2020-21, 77%
2019-20, 79%
Seniors
2020-21, 75%
2019-20, 78%
You received consistent information
Youth
2020-21, 82%
2019-20, 81%
2018-19, 81%
Adults
2020-21, 86%, significantly higher than previous wave
2019-20, 78%
2018-19, 81%
Seniors
2020-21, 84%
2019-20, 83%
2018-19, 83%
The amount of time it took was reasonable.
Youth
2020-21, 80%
2019-20, 76%
2018-19, 77%
Adults
2020-21, 82%, significantly higher than previous wave
2019-20, 74%
2018-19, 72%
Seniors
2020-21, 82%
2019-20, 83%
2018-19, 81%
You were provided service in a way that protected your health and safety during the COVID-19 pandemic
Youth were also more likely to provide high ratings compared to adults and seniors for being able to find the information needed (during aware stage) in a reasonable time. Seniors were also more likely to provide high ratings for confidence their application would be processed in a reasonable time and ease of follow-up, while they provided lower ratings for the ease of putting together the information needed to apply and completing the application form.
Compared to 2019-20, Youth provided higher ratings for the ease of figuring out eligibility, being able to find the information needed (during aware stage) in a reasonable time, ease of completing the application form and confidence their application would be processed in a reasonable time. Adults provided higher ratings for the ease of putting together the information needed to apply and confidence their application would be processed in a reasonable time, while they provided lower ratings for the ease of follow-up. Seniors provided higher ratings for the ease of understanding the requirements of the application.
Figure long description
Differences/ Change in Service Attributes
Figure out if you are eligible for benefits/ SIN card
Youth
2020-21, 77%, significantly higher than previous wave
2019-20, 68%
Adults
2020-21, 76%
2019-20, 71%
Seniors
2020-21, 75%
2019-20, 78%
You were able to find the information you needed within a reasonable amount of time
Youth
2020-21, 83%, significantly higher than previous wave
2019-20, 74%
Adults
2020-21, 77%
2019-20, 74%
Seniors
2020-21, 74%
2019-20, 77%
Understanding the requirements of the application
Youth
2020-21, 84%
2019-20, 80%
2018-19, 87%
Adults
2020-21, 83%
2019-20, 81%
2018-19, 85%
Seniors
2020-21, 82%, significantly higher than previous wave
2019-20, 78%
2018-19, 86%
Putting together the information you needed to apply
Youth
2020-21, 84%
2019-20, 80%
Adults
2020-21, 83%, significantly higher than previous wave
2019-20, 77%
Seniors
2020-21, 78%
2019-20, 80%
Completing the application form
Youth
2020-21, 86%, significantly higher than previous wave
2019-20, 77%
Adults
2020-21, 84%
2019-20, 82%
Seniors
2020-21, 81%
2019-20, 81%
Confident your application would be processed in a reasonable amount of time
Youth
2020-21, 64%, significantly higher than previous wave
2019-20, 56%
Adults
2020-21, 67%, significantly higher than previous wave
2019-20, 61%
Seniors
2020-21, 74%
2019-20, 74%
Ease of follow-up
Youth
2020-21, 62%
2019-20, 54%
Adults
2020-21, 58%
2019-20, 60%
Seniors
2020-21, 71%
2019-20, 70%
Ease of registering for MSCA
Youth
2020-21, 69%
2019-20, 73%
Adults
2020-21, 62%, significantly lower than previous wave
Satisfaction among e-vulnerable clients was lower compared to all clients.
E-vulnerable clients were less satisfied with the quality of service provided in person compared to all clients.
Figure long description
Overall Satisfaction (% Rated 4 or 5)
2017-18, 87%
2018-19, 84%
2019-20, 85%
2020-21, 82%
Figure long description
Service Channel Satisfaction
In person
2020-21, 79%
2019-20, 85%
2018-19, 86%
2017-18, 91%
Online
2020-21, 74%
2019-20, 67%
2018-19, 76%
2017-18, 74%
Specialized Call Centre
2020-21, 74%
2019-20, 70%
2018-19, 68%
2017-18, 83%
1 800 O-Canada
2020-21, 75%, small sample size
2019-20, 69%
2018-19, 68%
My Service Canada Account
2018-19, 68%
2017-18, 74%
eServiceCanada
2017-18, 73%
E-vulnerable was defined as respondents who rarely/never use online services such as online banking, shopping and bill payments. E-vulnerable clients n=858.
*small sample size, results should be interpreted with caution.
E-vulnerable clients provided lower ratings compared to all clients for being able to complete steps online made the process easier, ease of putting together the information needed to apply, ease of finding out what information they needed to provide, ease of finding out the steps to apply, ease of completing the application form, ease of understanding the requirements of the application, ease of figuring out eligibility and overall effectiveness. They provided higher ratings for the ease of follow-up.
Compared to 2019-20, E-vulnerable clients provided higher ratings for being able to complete steps online made the process easier, the helpfulness of Service Canada call centre reps and receiving consistent information. They provided lower ratings for the ease of finding out what information they needed to provide when applying and overall effectiveness.
Figure long description
Widest Gap/ Change in Service Attributes
(% Rated 4 or 5 vs. TOTAL)
%
GAP
Ease of follow-up
73%
+10pts
Being able to complete steps online made the process easier for you.
62%, significantly higher than previous wave
-18pts
Putting together the information you needed to apply for the program
74%
-8pts
Find out what information you need to provide when applying for the program
70%, significantly lower than previous wave
-7pts
Find out the steps to apply
70%
-7pts
Ease of completing the application form
77%
-7pts
Understanding the requirements of the application
76%
-7pts
Ease of figuring out if you are eligible for benefits/ SIN card
70%
-6pts
You were able to move smoothly through all of the steps
79%, significantly lower than previous wave
-6pts
Service Canada specialized call centre phone representatives were helpful
88%, significantly higher than previous wave
-3pts
You received consistent information
82%, significantly higher than previous wave
-2pts
E-vulnerable was defined as respondents who rarely/never use online services such as online banking, shopping and bill payments. E-vulnerable clients n=858.
At-Risk Client Groups: Clients with No Devices or Mobile only
Figure long description
Overall Satisfaction (% Rated 4 or 5)
No Devices
2020-21, 80%, significantly lower than total
2019-20, 81%;
2018-19, 83%
Mobile Only
2020-21, 83%
2019-20, 85%
2018-19, 85%
Figure long description
Service Channel Satisfaction
In person:
No Devices:
2020-21, 75%
2019-20, 81%
2018-19, 85%
Mobile Only:
2020-21, 85%
2019-20, 90%
2018-19, 85%
Online
No Devices:
2020-21, 75%, significantly higher than previous wave
2019-20, 44%
2018-19, 62%
Mobile Only:
2020-21, 71%
2019-20, 63%
2018-19, 84%
Specialized Call Centre
No Devices:
2020-21, 70%, small sample size
2019-20, 71%
2018-19, 79%
Mobile Only:
2020-21, 77%
2019-20, 67%
2018-19, 77%
1 800 O-Canada
No Devices:
2020-21, 85%, very small sample size
2019-20, 77%
2018-19, 71%
Mobile Only:
2020-21, 66%, small sample size
2019-20, 54%
2018-19, 73%
My Service Canada Account
No Devices:
2020-21, 73%, very small sample size
2019-20, 56%
Mobile Only:
2020-21, 78%, small sample size
2019-20, 95%
eSERVICECANADA
No Devices:
2020-21, 85%, very small sample size
Mobile Only:
2020-21, 86%, small sample size
No device clients n=240; Mobile only clients n=385
*small sample size **very small sample size, results should be interpreted with caution.
Overall satisfaction was lower among clients with no devices and consistent among those with mobile only compared to all clients.
Clients who no devices were less satisfied with the quality of service provided in-person. They were more satisfied with the online channel than in the previous wave.
At-Risk Client Groups: Clients with No Devices or Mobile only
Clients with no devices and those with mobile only provided lower ratings compared to all clients on most service attributes. For clients with no devices, the largest gaps were for being able to complete steps online made the process easier, ease of finding info about the program and finding out what info they needed when applying. For mobile only clients, the largest gaps were for being able to complete steps online made the process easier, ease of finding info about the program, ease of finding out the steps to apply and finding out what info they needed when applying.
Compared to 2019-20, clients with no devices provided lower ratings across several service attributes including overall ease of applying, ease of getting help in general and timeliness of service. Mobile only clients provided higher ratings for the ease of understanding information about the program and completing the application form and the helpfulness of specialized call centre reps and provided lower ratings for being able to complete the application in a reasonable time and timeliness of service.
Figure long description
Widest Gap/ Change in Service Attributes (% Rated 4 or 5 vs. TOTAL)
Find information about the program
No Device
56%
-22pts
Mobile only
63%
-15pts
Understand the information about the program
No Device
60%
-18pts
Mobile only
73%, significantly higher than previous wave
-5pts
Find out the steps to apply
No Device
62%
-15pts
Mobile only
62%
-15pts
Find out what information you need to provide when applying for the program
No Device
56%, significantly lower than previous wave
-21pts
Mobile only
63%
-14pts
You were able to complete the application in a reasonable time
No Device
75%
-8pts
Mobile only
77%, significantly lower than previous wave
-6pts
Understanding the requirements of the application
No Device
73%
-10pts
Mobile only
75%
-8pts
Putting together the information you needed to apply for the program
No Device
73%
-9pts
Mobile only
78%
-4pts
Completing the application form
No Device
69%
-15pts
Mobile only
78%
-6pts
You were able to move smoothly through all of the steps
No Device
70%, significantly lower than previous wave
-15pts
Mobile only
80%
-5pts
Being able to complete steps online made the process easier for you.
No Device
40%, significantly lower than previous wave
-40pts
Mobile only
69%
-11pts
Throughout the process it was clear what would happen next and when it would happen.
No Device
71%, significantly lower than previous wave
-10pts
Mobile only
74%
-7pts
Service Canada specialized call centre phone representatives were helpful
No Device
76%, significantly lower than previous wave
-9pts
Mobile only
90%
+5pts
Service Canada representatives that you dealt with in person were helpful
No Device
79%
-12pts
Mobile only
88%
-3pts
It was easy to access service in a language I could speak and understand well
No Device
89%, significantly lower than previous wave
-6pts
Mobile only
91%
-4pts
The amount of time it took was reasonable.
No Device
74%
-7pts
Mobile only
76%, significantly lower than previous wave
-5pts
It was clear what to do if you had a problem or question.
No Device
76%, significantly lower than previous wave
-3pts
Mobile only
75%
-4pts
It was easy to get help when you needed it.
No Device
71%, significantly lower than previous wave
-
Mobile only
76%
+5pts
Overall, it was easy for you to apply
No Device
79%, significantly lower than previous wave
-7pts
Mobile only
79%
-7pts
You were provided service in a way that protected your health and safety during the COVID-19 pandemic
No Device
80%
-8pts
Mobile only
86%
-2pts
Received consistent information
No Device
80%
-4pts
Mobile only
77%
-7pts
No device clients n=240; Mobile only clients n=385.
Access to Service via Mobile
Among the overall sample of clients, 83% report owning or having access to a personal computer, and 80% report owning or having access to a smartphone. Just under half (45%) of clients report owning or having access to a tablet.
Only 3% of clients do not own nor have access to any devices.
Figure long description
% Own or have access to
Personal computer, 83%
Smartphone, 80%
Tablet, 45%
No device, 3%
Base: All respondents (n=4200)
Q39d. Which of the following [IF NOT PROXY: do you] / [INSERT IF PROXY: does [INSERT CUSTOMER’S NAME FROM SAMPLE FILE]] own or have access to? (READ LIST. SELECT ALL THAT APPLY.)
At-Risk Client Groups: Language Barrier
Figure long description
Overall satisfaction (% rated 4 or 5), 55%
Figure long description
Service channel satisfaction
In-person, 55%, small sample size, significantly lower than total
Online, 44%, significantly lower than total
Specialized call centre, 32%, small sample size, significantly lower than total
1 800 O-Canada, 31%, small sample size, significantly lower than total
MSCA, 42%, small sample size, significantly lower than total
eSERVICECANADA, 53%, small sample size, significantly lower than total
Figure long description
Widest Gap in Service Attributes (% Rated 4 or 5 vs. TOTAL)
1 800 O-Canada phone representatives were helpful
42%
-46pts
You were confident that any issues or problems would have been easily resolved.
35%
-42pts
Throughout the process it was clear what would happen next and when it would happen.
40%
-41pts
It was clear what to do if you had a problem or question.
39%
-40pts
It was easy to get help when you needed it.
32%
-39pts
Service Canada specialized call centre phone representatives were helpful
47%
-38pts
You were able to move smoothly through all of the steps
48%
-37pts
Being able to complete steps online made the process easier for you.
43%
-37pts
Language Barrier clients n=285
*small sample size, results should be interpreted with caution.
Overall satisfaction was lower among those with a language barrier compared to all clients
Clients with a language barrier provided lower ratings for the quality of service provided through all channels and lower ratings on all service attributes.
The largest gaps on service attributes were for the helpfulness of 1 800 O-Canada phone representatives, confidence any issues would be easily resolved, clarity of process, clarity of the issue resolution process, ease of getting help in general, the helpful of specialized call centre representatives, overall effectiveness and being able to complete steps online made the process easier.
Provision of Language Services
Nearly all clients agreed they were provided service in their choice of English or French, and that it was easy to access service in a language they could speak and understand well.
Compared to 2019-20, overall agreement remained unchanged. However, fewer CPP-D clients felt it was easy for them to access service in a language they could speak and understand well than in the previous wave.
Figure long description
Total
2017-18, 95%
2018-19, 96%
2019-20, 97%
2020-21, 96%
EI
2017-18, 93%
2018-19, 97%
2019-20, 98%
2020-21, 97%
CPP
2017-18, 94%
2018-19, 94%
2019-20, 97%
2020-21, 95%
CPPD
2017-18, 87%
2018-19, 93%
2019-20, 95%
2020-21, 92%
SIN
2017-18, 96%
2018-19, 95%
2019-20, 95%
2020-21, 96%
OAS
2017-18, 95%
2018-19, 98%
2019-20, 96%
2020-21, 94%
Figure long description
Easy to access service in a language I could speak and understand well (% rated 4 or 5)
Total
2018-19, 94%
2019-20, 94%
2020-21, 95%
EI
2018-19, 96%
2019-20, 94%
2020-21, 95%
CPP
2018-19, 92%
2019-20, 95%
2020-21, 92%
CPPD
2018-19, 90%
2019-20, 91%
2020-21, 85%, significantly lower than previous waves
SIN
2018-19, 94%
2019-20, 94%
2020-21, 96%
OAS
2018-19, 92%
2019-20, 94%
2020-21, 93%
Q36b. Thinking about the service you received, how much do you agree or disagree with the following statements. Base: All Answering (n=varies)
At-Risk Client Groups: Official Language Minority Community
Overall satisfaction among OLMC clients was consistent with all clients. More than nine in ten OLMC clients were provided service in their choice of English or French lower compared to all clients.
OLMC clients provided lower ratings for the quality of service provided through eServiceCanada compared to all clients.
OLMC clients provided higher ratings compared to all clients of which the largest gaps were for the timeliness of service and needing to explain yourself only once, while they provided lower ratings for the helpfulness of eServiceCanada reps. Compared to 2019-20, OLMC clients provided lower ratings for confidence of the issue resolution process and ease of getting help in general.
Figure long description
Overall satisfaction (% rated 4 or 5)
2017-18, 89%
2018-19, 91%
2019-20, 90%
2020-21, 90%
Figure long description
Service channel satisfaction
In-person
2020-21, 88%, small sample size
2019-20, 89%
2018-19, 93%
Online
2020-21, 83%
2019-20, 83%
2018-19, 87%
Specialized call centre
2020-21, 68%, small sample size
2019-20, 82%
2018-19, 78%
1 800 O-Canada
2020-21, 77%, very small sample size
2019-20, 78%
2018-19, 58%
MSCA
2020-21, 88%, small sample size
2019-20, 89%
eSERVICECANADA
2020-21, 47%, very small sample size, significantly lower than total
Figure long description
Provided with service in your choice of English or French (% agree)
2020-21. 93%, significantly lower than total
2019-20, 97%
2018-19, 95%
Figure long description
Widest Gap/ Change in Service Attributes (% Rated 4 or 5 vs. TOTAL)
The amount of time it took was reasonable
91%
+10pts
You needed to explain your situation only once
86%
+9pts
Being able to complete steps online made the process easier for you
88%
+8pts
You were able to move smoothly through all of the steps
93%
+8pts
Throughout the process it was clear what would happen next and when it would happen.
88%
+7pts
You were confident that your personal information was protected.
92%
+5pts
You were confident that any issues or problems would have been easily resolved.
82%, significantly lower than previous wave
+5pts
It was easy to get help when you needed it
74%, significantly lower than previous wave
+3pts
The Service Canada phone representatives that called you back after you completed an online form were helpful
69%
-16%
OLMC clients n=210 *small sample size **very small sample size, results should be interpreted with caution.
At-Risk Client Groups: Newcomers (Arrived in Past 3 Years)
Overall satisfaction among Newcomers continued to be higher than all clients and results were consistent with last year.
Newcomers were more satisfied with the service they received in-person, online and through specialized call centres compared to all clients. Satisfaction increased for service received in person compared to last year.
Figure long description
Overall Satisfaction (% Rated 4 or 5)
2018-19, 93%
2019-20, 94%
2020-21, 93%, significantly higher than total
Figure long description
Service channel satisfaction
In-person
2020-21, 95%, significantly higher than total, significantly higher than previous wave
2019-20, 88%
2018-19, 96%
Online
2020-21, 89%, significantly higher than total
2019-20, 86%
2018-19, 85%
Specialized call centre
2020-21, 87%, small sample size, significantly higher than total
2019-20, 77%
2018-19, 63%
1 800 O-Canada
2020-21, 94%, very small sample size
2019-20, 83%
2018-19, 79%
MSCA
2020-21, 84%, small sample size
2019-20, 69%
eSERVICECANADA
2020-21, 92%, small sample size
Newcomers n=357 *small sample size **very small sample size, results should be interpreted with caution.
Newcomers were also more likely to provide high ratings on several service attributes. The largest gaps were for getting help on your application when needed, ease of getting help in general, having to explain your situation only once, ease of finding information about the program, ease of follow-up and being able to find the information needed (during aware stage) in a reasonable time.
Compared to 2019-20, they were more likely to provide high ratings for ease of finding information about the program, being able to find the information needed (during aware stage) in a reasonable time, ease of understanding the requirements of the application and completing the application form.
Figure long description
Widest Gap/ Change in Service Attributes (% Rated 4 or 5 vs. TOTAL)
Getting help on your application when you needed it
82%
+17pts
It was easy to get help when you needed it.
86%
+15pts
You needed to explain your situation only once.
90%
+13pts
Finding information about the program
91%, significantly higher than previous wave
+13pts
Ease of follow-up
76%
+13pts
You were able to find the information you needed in a reasonable amount of time
89%
+11pts
Understanding the requirements of the application
92%, significantly higher than previous wave
-7pts
Completing the application form
93%, significantly higher than previous wave
+15pts
Newcomers n=357
CX Client Groups: At-Risk Client Groups by Channel
Figure long description
Portion of clients in at-risk groups
Youth (18 to 30), 31%
In-person
2020-21, 88%
2019-20, 86%
Canada.ca
2020-21, 77%
2019-20, 77%
Specialized Call Centres
2020-21, 76%
2019-20, 67%
1 800 O-Canada
2020-21, 79%, small sample size
2019-20, 79%
MSCA
2020-21, 83%
2019-20, 76%
eSERVICECANADA
2020-21, 88%, small sample size
2019-20,
Seniors (60+). 29%
In-person
2020-21, 83%
2019-20, 84%
Canada.ca
2020-21, 78%, significantly higher than previous wave
2019-20, 70%
Specialized Call Centres
2020-21, 75%, significantly higher than previous wave
2019-20, 63%
1 800 O-Canada
2020-21, 65%
2019-20, 67%
MSCA
2020-21, 71%
2019-20, 74%
eSERVICECANADA
2020-21, 72%
OLMC, 5%
In-person
2020-21, 88%, small sample size
2019-20, 89%
Canada.ca
2020-21, 83%
2019-20, 83%
Specialized Call Centres
2020-21, 68%, small sample size
2019-20,82%
1 800 O-Canada
2020-21, 77%, small sample size
2019-20, 78%
MSCA
2020-21, 88%, small sample size
2019-20, 89%
eSERVICECANADA
2020-21, 47%, very small sample size
Non E or F speaking, 3%
In-person
2020-21, 99%, small sample size
2019-20, 91%
Canada.ca
2020-21, 83%, small sample size
2019-20, 80%
Specialized Call Centres
2020-21, 96%, very small sample size
2019-20, 80%
1 800 O-Canada
2020-21, 78%, very small sample size
2019-20, 82%
MSCA
2020-21, 86%, very small sample size
2019-20, 67%
eSERVICECANADA
2020-21, 91%, very small sample size
High school or less, 31%
In-person
2020-21, 80%, significantly lower than previous wave
2019-20, 88%
Canada.ca
2020-21, 79%, significantly higher than previous wave
2019-20, 74%
Specialized Call Centres
2020-21, 74%, significantly higher than previous wave
2019-20, 64%
1 800 O-Canada
2020-21, 80%
2019-20, 73%
MSCA
2020-21, 78%
2019-20, 77%
eSERVICECANADA
2020-21, 83%
Indigenous, 9%
In-person, 9%
2020-21, 77%
2019-20, 84%
Canada.ca
2020-21, 73%
2019-20, 65%
Specialized Call Centres
2020-21, 73%
2019-20, 63%
1 800 O-Canada
2020-21, 83%, significantly higher than previous wave
2019-20, 52%
MSCA
2020-21, 73%
2019-20, 76%
eSERVICECANADA
2020-21, 87%, small sample size
Client with disabilities, 8%
In-person
2020-21, 67%
2019-20, 80%
Canada/ca
2020-21, 62%
2019-20, 73%
Specialized Call Centres
2020-21, 60%
2019-20, 66%
1 800 O-Canada
2020-21, 48%
2019-20, 70%
MSCA
2020-21, 56%
2019-20, 69%
eSERVICECANADA
2020-21, 71%
Remote, 2%
In-person
2020-21, 82%
2019-20, 89%
Canada.ca
2020-21, 74%
2019-20, 76%
Specialized Call Centres
2020-21, 72%, small sample size
2019-20, 71%
1 800 O-Canada
2020-21, 80%, very small sample size
2019-20, 74%
MSCA
2020-21, 68%, small sample size
2019-20, 89%
eSERVICECANADA
2020-21, 73%
Urban, 62%
In-person
2020-21, 89% , significantly higher than previous wave
2019-20, 85%
Canada.ca
2020-21, 79%, significantly higher than previous wave
2019-20, 73%
Specialized Call Centres
2020-21, 72%, significantly higher than previous wave
2019-20, 62%
1 800 O-Canada
2020-21, 71%
2019-20, 71%
MSCA
2020-21, 75%
2019-20, 73%
eSERVICECANADA
2020-21, 84%
Rural, 35%
In-person
2020-21, 80%
2019-20, 87%
Canada.ca
2020-21, 77%
2019-20, 73%
Specialized Call Centres
2020-21, 73%
2019-20, 60%
1 800 O-Canada
2020-21, 74%
2019-20, 65%
MSCA
2020-21, 74%
2019-20, 77%
eSERVICECANADA
2020-21, 80%
E-vulnerable, 13%
In-person
2020-21, 79%
2019-20, 85%
Canada.ca
2020-21, 74%
2019-20, 67%
Specialized Call Centres
2020-21, 74%
2019-20, 70%
1 800 O-Canada
2020-21, 75%, small sample size
2019-20, 69%
MSCA
2020-21, 68%
2019-20, 74%
eSERVICECANADA
2020-21, 73%
Newcomers (3 years or less), 14%
In-person
2020-21, 95%, significantly higher than previous wave
2019-20, 88%
Canada.ca
2020-21, 89%
2019-20, 86%
Specialized Call Centres
2020-21, 87%, small sample size
2019-20, 77%
1 800 O-Canada
2020-21, 94%, very small sample size
2019-20, 83%
MSCA
2020-21, 84%, small sample size
2019-20, 69%
eSERVICECANADA
2020-21, 92%
Language barrier, 5%
In-person
2020-21, 55%
Canada.ca
2020-21, 44%
Specialized Call Centres
2020-21, 32%, small sample size
1 800 O-Canada
2020-21, 31%, small sample size
MSCA
2020-21, 42%, small sample size
eSERVICECANADA
2020-21, 53%, small sample size
No devices, 3%
In-person
2020-21, 75%. Small sample size
2019-20, 81%
Canada.ca
2020-21, 75%, small sample size
2019-20, 44%
Specialized Call Centres
2020-21, 70%, small sample size
2019-20, 71%
1 800 O-Canada
2020-21, 85%
2019-20, 77%
MSCA
2020-21, 73%, very small sample size
2019-20, 56%
eSERVICECANADA
2020-21, 85%, very small sample size
Clients with restrictions, 48%
In-person
2020-21, 82%
2019-20, 80%
Canada/ca
2020-21, 71%
2019-20, 70%
Specialized Call Centres
2020-21, 68%
2019-20, 61%
1 800 O-Canada
2020-21, 72%
2019-20, 55%
MSCA
2020-21, 69%
2019-20, 65%
eSERVICECANADA
2020-21, 83%
Racialized, 35%
In-person
2020-21, 92%
Canada.ca
2020-21, 85%
Specialized Call Centres
2020-21, 80%
1 800 O-Canada
2020-21, 82%
MSCA
2020-21, 81%
eSERVICECANADA
2020-21, 88%
OLMC
Official Language Minority Communities
*small sample size **very small sample size, results should be interpreted with caution.
At-Risk Client Groups: Racialized/ Black Clients
Overall satisfaction and trust in Service Canada were higher among Racialized clients compared to all clients. Racialized clients also had higher satisfaction with in-person, online and specialized call centres. Overall satisfaction, trust and satisfaction with service channels among clients who identify as ‘Black’ specifically was consistent compared to all clients.
Racialized clients were also more likely to provide high ratings for ease of getting help in general, getting help on your application, being able to complete steps online made the process easier, ease of finding information about the program, confidence in issue resolution, ease of understanding the information about the program and finding the steps to apply and being able to find the information needed (during aware stage) in a reasonable amount of time.
Figure long description
Overall Satisfaction (% Rated 4 or 5)
Racialized, 2020-21, 89%
Black clients, 2020-21, 87%
Figure long description
Trust (% rated 4 or 5)
Racialized, 2020-21, 90%, significantly higher than total
Black clients, 2020-21, 84%
Service channel satisfaction
In person
Racialized, 92%, significantly higher than total
Black, 89%, small sample size
Online
Racialized, 85%, significantly higher than total
Black, 81%
Specialized Call Centre
Racialized, 80%, significantly higher than total
Black, 75%, small sample size
1 800 O-Canada
Racialized, 82%
Black, 82%, very small sample size
My Service Canada Account
Racialized, 81%
Black, 57%, very small sample size
eServiceCanada
Racialized, 88%
Black, 85%
Figure long description
Widest Gap in Service Attributes for Racialized clients (% Rated 4 or 5 vs. TOTAL)
It was easy to get help when you needed it
81%, significantly higher than total
+10pts
Getting help on your application when you needed it
75%, significantly higher than total
+10pts
Ease of registering for MSCA
73%, significantly higher than total
+10pts
Being able to complete steps online made the process easier for you
87%, significantly higher than total
+7pts
Finding information about the program
85%, significantly higher than total
+7pts
You were confident that any issues or problems would have been easily resolved
83%, significantly higher than total
+6pts
Understanding information about the program
84%, significantly higher than total
+6pts
Finding out the steps to apply
83%, significantly higher than total
+6pts
You were able to find the information you needed in a reasonable amount of time
84%, significantly higher than total
+6pts
Racialized clients n=947
Identify as Black n=188
*small sample size **very small sample size, results should be interpreted with caution.
Conclusions
Clients were twice as likely to have used self-service than last year, prior to the pandemic, while half as many relied on in person service. EI and OAS/GIS clients utilized self-service at higher rates which drove the overall increase.
Overall, clients were more likely to self serve during the apply or follow-up stages than they were prior to the pandemic. Other changes compared to before the pandemic included an increase in the use of assisted self-service at the aware and apply stages and the use of mail only and auto-enroll at the apply stage. Use of in-person service declined at all stages of the client journey.
This year saw EI clients more likely to self serve at the apply and follow-up stages, and OAS/GIS clients self-serving at the apply stage. Use of assisted self service increased among EI clients at the aware and apply stages and among OAS/GIS clients at the follow up stage. Use of mail only increased among CPP, OAS/GIS and CPP-D clients.
EI clients were more likely to be satisfied with the effectiveness of the client journey, namely the timeliness of service, clarity of process and confidence their application would be processed in reasonable amount of time. OAS/GIS clients while more satisfied with aspects of confidence experienced more challenges with the ease of the application process and helpfulness of in person staff. CPP clients rated aspects of the effectiveness and ease of navigating the Government of Canada website lower than previous years.
The vast majority of clients now agree that being able to complete steps online made the process easier and use of MSCA has increased and satisfaction remains strong. Registration continues to be more difficult for CPP-D and OAS/GIS clients who were also less likely to use the platform.
Progress continues to be made on improving the ease of being able to complete steps online. Reported ease increased for EI and OAS/GIS compared to last year, while agreement has steadily increased among CPP and CPP-D clients since the baseline wave.
The vast majority of EI and CPP clients used MSCA, while CPP-D and OAS/GIS clients did not. Usage increased among all programs except for EI which remained consistent. Notably, few MSCA users made use of the online chat.
The vast majority of those who used MSCA were satisfied with their experience, however satisfaction was notably lower among CPP-D clients, clients with restrictions, those who have a disability, or experience a language barrier.
Despite the significant changes in the service environment caused by the COVID-19 pandemic and the subsequent changes in channel use, Service Canada clientele remain highly satisfied with the service experience (86%), found the process easy (86%) and effective (85%) and expressed a high degree of trust (84%).
Effectiveness (85% vs. 82%) and timeliness of service (83% vs. 77%) have increased compared to last year, helping drive an overall increase in satisfaction with the service experience (86% vs. 84%). Improvement has also been made in ensuring clarity of process and that clients received consistent information.
Maintaining the increased ratings for aspects of effectiveness, timeliness of service and service channel performance as well improving the ease of follow-up would help to maintain or improve satisfaction as these areas have the greatest impact on clients’ impressions of their experience. The ease of getting assistance also represents an area for improvement and one of the only measures where impressions have declined compared to last year. Further, ratings for a new measure specific to getting assistance on their application were much lower compared to other areas.
The overall rise in satisfaction was driven by an increase among EI clients and due to improved quality of service provided online, through specialized call centres and 1 800 O-Canada.
Clients continued to be most satisfied with the in-person experience, while satisfaction remained lowest for specialized call centres, although it has increased compared to 2019-20. Satisfaction with online and 1 800 O-Canada also increased year over year. The new eServiceCanada channel sees strong satisfaction.
SIN program delivery continued to receive the highest ratings, while CPP-D continued to receive the lowest ratings.
Service Canada clients provided the highest ratings for helpfulness of staff (whether in person, 1 800 O-Canada, specialized call centre and eServiceCanada), confidence in information security, the process being easy and effective. The greatest opportunities to improve satisfaction include:
Making it easier for clients to follow-up on the status of their application before receiving a decision.
Providing more clarity on how to get assistance when needed, particularly during the application stage.
Clients continued to experience difficulty getting assistance in general, particularly when completing their application.
Despite improvement in the quality of service and helpfulness of Service Canada call centre staff and 1 800 O-Canada, clients provided lower ratings for ease of getting help on the application when needed and ease of getting help in general than last year.
Identifying ways to more clearly communicate how to get assistance specifically for those clients who rely on online channels will be important to improving satisfaction.
Findings show that most at-risk client groups continued to provide high ratings of the service experience, particularly Newcomers and Racialized clients who were more satisfied compared to all clients.
Satisfaction among rural clients increased compared to 2019-20 .
Although satisfaction was higher among most at-risk groups, satisfaction was lower compared to all clients among those with a language barrier, clients with disabilities, those with restrictions to accessing service, clients with no devices and e-vulnerable clients. Notably, ratings of the service experience were considerably lower among those with a language barrier including the service provided through all channels and across all service attributes.
To help improve satisfaction among at-risk client groups, focus should be placed on improving the clarity of how to get assistance when needed and the clarity of information available online.
Consistent with all clients, improving the ease of getting assistance in general will help to improve the client experience among these groups.
It will also be important to improve the ease of finding and understanding information on programs available on the Government of Canada website which remains a prominent challenge for these groups.
University certificate/diploma below bachelor's level, 4%
Bachelor's degree, 21%
Post graduate degree, 13%
Demographics Part 2
Figure long description
Language Preference
English, 77%
French, 19%
Both, 1%
Other, 3%
Figure long description
Identify as person with disability
Yes, 8%
No, 91%
Don’t know, <1%
Figure long description
Use of online Services
Routinely/All the time, 65%
Sometimes, 20%
Rarely, 6%
Never, 7%
Figure long description
Identify as Indigenous
Yes, 9%
No, 91%
Figure long description
Indigenous groups
First nations, 5%
Metis, 3%
Inuk, 1%
None of the above, 88%
Don’t know, 4%
Figure long description
Racial/cultural groups
White 55%
South
Asian 9%
Black 7%
Chinese 4%
Latin American 4%
Southeast Asian 3%
Filipino 3%
Arab 2%
West Asian 1%
Other 5%
Don't know 8%
Appendix A
Details On Methodology
Call Disposition
Up to seven calls were placed in an effort to reach a selected respondent. The overall response rate achieved was 16% which was strong compared to the industry average. The response rate was higher than in 2019-20 (12%) and consistent with the response rate achieved in 2018-19 (16%). The final call outcomes are as follows.
Figure long description
Call Disposition
CALL OUTCOME
COUNT OF DISPOSITION
Call backs
2625
Completed Interviews
4200
Disqualified
590
Language Barriers
520
No Answers
10122
Not In Service (Out of Scope)
2774
Over quota
12
Refusals
8523
Terminations
950
TOTAL IN SCOPE
30316
TOTAL RESPONDING
4790
OVERALL RESPONSE RATE
16%
Drivers of Satisfaction – Background on Analysis
The key drivers analysis was conducted by regression overall among all clients and by each of the five programs. All key service attributes were included in the analysis in addition to benefit approval/denial. All specific statements included were outlined below. Not all variables were included in regression by program due to an insignificant relationship to overall satisfaction or strong inter-collinearity with another variable (in the latter instance, the variable more strongly related to overall satisfaction was kept).
Compared to 2019-20, the strength of the drivers analysis has remained consistent (R2 of 0.69 compared to 0.72).
Figure long description
Drivers of Satisfaction – Background on Analysis
AWARE
Understand the information about [PROGRAM]
Find out what information you need to provide when applying for [PROGRAM]
Figure out if you were eligible for benefits/ SIN card
Find information about [PROGRAM]
Find out the steps to apply
Find the information you needed within a reasonable amount of time
APPLY
You were able to complete the application in a reasonable amount of time
Understanding the requirements of the application
Completing the form
Putting together the information you needed to apply for [PROGRAM]
Confident your application would be processed in a reasonable amount of time
Ease of registering for My Service Canada Account
FOLLOW-UP
Ease of follow-up
OTHER VARIABLES
Received/ Denied Benefit
EASE
Information was easy to understand
Overall, it was easy for you to apply for [PROGRAM]?
You needed to explain your situation only once
Throughout the process it was clear what would happen next and when it would happen
EFFECTIVENESS
The amount of time it took was reasonable
It was easy to get help when you needed it
You received consistent information
It was clear what to do if you had a problem or question
You were able to move smoothly through all of the steps related to your [PROGRAM] application
It was easy to access service in a language I could speak and understand well
You were provided with service in your choice of English or French.
You travelled a reasonable distance to access the service
EMOTION
Service Canada specialized call centre phone representatives were helpful
1 800 O-Canada phone representatives were helpful
The Service Canada phone representatives that called you back after you completed an online form were helpful
Service Canada representatives that you dealt with in person were helpful
You were confident that any issues or problems would have been easily resolved
You were confident that your personal information was protected
Definition of At-Risk Client Groups
Figure long description
Newcomers
Not born in Canada (Q47c) and arrived within the previous 3 years ((Q47d)
Non English or French speakers
Identify “other” as preferred language of service (Q41b)
Lower Education
High school or less (Q41)
Youth
Aged 18 to 30 (sample variable)
Seniors
Aged 60 and over (sample variable)
Clients with disabilities
Self-identified (Q44a)
Clients with restrictions
Self-identified (Q45- At least one restriction)
Indigenous people
Self-identified as First Nations, Inuit, or Métis (Q44)
E-vulnerable
Clients who rarely or never use online services (Q40)
Mobile only
Self-reported as clients with only a smartphone, no computer or tablet (Q39d)
No devices
Self-reported as clients with no devices (mobile, tablet, computer) (Q39d)
Remote clients
Sample variable
Official language minorities (OLMC)
Clients in Quebec who prefer service in English, and clients outside Quebec who prefer service in French (sample variable and (Q41b)
Language barrier
It was easy to access service in a language I could speak and understand well (Q36 rated 1 OR 2)
Racialized
Clients who identify as a racial or cultural group other than White (Can be in addition to also identifying as white) (Q47e)
Appendix B
Summarized results
Programs: Drivers of Satisfaction by Program
Figure long description
Programs: Drivers of Satisfaction by Program
SIN
Keep Doing
Service Canada specialized call centre reps were helpful, 92%
Service Canada in person reps were helpful, 95%
Able to move smoothly through all steps, 91%
Areas for improvement
Ease of follow-up, 72%
Application would be processed in reasonable time, 68%
Ease of getting help on application, 78%
CPP
Keep Doing
Service Canada specialized call center reps were helpful, 85%
Client journey took reasonable amount of time, 81%
Able to move smoothly through all steps, 80%
Areas for improvement
Application would be processed in reasonable time, 77%
Ease of finding info needed to apply, 78%
Ease of getting help in general, 70%
OAS/GIS
Keep Doing
Client journey took reasonable amount of time, 85%
Able to move smoothly through all steps , 87%
Complete application in reasonable time, 83%
Areas for improvement
Completing steps online made it easier, 56%
Ease of finding info needed to apply, 72%
Ease of gathering info, 77%
EI
Keep Doing
Service Canada specialized call center reps were helpful, 83%
Client journey took reasonable amount of time, 80%
eServiceCanada reps were helpful, 84%
Areas for improvement
Able to find information in reasonable time, 73%
Explain situation only once, 72%
Ease of follow-up, 59%
CPPD
Keep Doing
Able to find information in reasonable time, 61%
Received consistent information, 64%
Felt protected during COVID, 75%
Areas for improvement
Service Canada specialized call center reps were helpful, 69%
Client journey took reasonable amount of time, 57%
Process was clear,56%
Service Canada CX Survey 2020-21: Summarized Results
Figure long description
Service Canada CX Survey 2020-21: Summarized Results
Language Barrier
Helpfulness of 1 800 O-Canada phone reps
42%
Confidence in issue resolution
35%
Clarity of process
40%
Clarity of issue resolution process
39%
Ease of getting help in general
32%
Disabilities
Being able to complete steps online made the process easier
57%
Ease of figuring out eligibility
56%
Helpfulness of 1 800 O-Canada phone reps
70%
Overall effectiveness
68%
Ease of finding info about program
62%
Restriction
Ease of MSCA registration
50%
Clarity of process
74%
Overall ease of applying
79%
Ease of finding out the steps to apply
70%
Ease of finding the info you need to provide
70%
No device
Being able to complete steps online made the process easier
40%
Ease of finding information about the program
56%
Ease of finding the info you need to provide
56%
E-vulnerable
Being able to complete steps online made the process
62%
Ease of finding the info you need to provide
70%
Ease of putting together the information
74%
Ease of finding out the steps to apply
70%
Ease of understanding requirements of application
76%
Ease of completing the form
77%
Appendix C
Detailed findings by service attribute
Ease of Using Government of Canada Website
Figure long description
Ease of Using Government of Canada Website
Find information about program
Very easy, 44%
Easy, 334%
Neutral, 16%
Difficult, 4%
Very difficult, 1%
Rated 4 or 5
2020-21, 78%
2019-20, 78%
2017-18, 79%
Understand the information about program
Very easy, 45%
Easy, 33%
Neutral, 15%
Difficult, 5%
Very difficult, 2%
Rated 4 or 5
2020-21, 78%
2019-20, 76%
2017-18, 76%
Find out the steps to apply
Very easy, 48%
Easy, 30%
Neutral, 15%
Difficult, 6%
Very difficult, 2%
Rated 4 or 5
2020-21, 77%, significantly lower than previous wave
2019-20, 81%
2017-18, 80%
Find out what information you need to provide when applying for program
Very easy, 48%
Easy, 30%
Neutral, 16%
Difficult, 4%
Very difficult, 2%
Rated 4 or 5
2020-21, 77%
2019-20, 80%
2017-18, 78%
Figure out if you were eligible for benefits
Very easy, 51%
Easy, 25%
Neutral, 14%
Difficult, 4%
Very difficult, 3%
Rated 4 or 5
2020-21, 76%, significantly higher than previous wave
2019-20, 71%
2017-18, 75%
Decide the best age to start your pension
Very easy, 44%
Easy, 22%
Neutral, 21%
Difficult, 3%
Very difficult, 5%
Rated 4 or 5
2020-21, 66%
2019-20, 72%
2017-18,
Online Application Completion
Figure long description
Completing the application form(n=3797)
5 – Very Easy, 57%
4, 27%
3, 11%
2, 2%
1 – very difficult, 1%
% Rated 4 or 5
2020-21, 84%, significantly higher than previous wave
2019-20, 81%
2017-18, 83%
Understanding the requirements of the application(n=3797)
5-very easy, 58%
4, 25%
3, 12%
2, 3%
1-very difficult, 2%
% Rated 4 or 5
2020-21, 83%, significantly higher than previous wave
2019-20, 80%
2017-18, 81%
Putting together the information you needed to apply(n=3797)
5-very easy, 53%
4, 29%
3, 12%
2, 3%
1-very difficult, 2%
% Rated 4 or 5
2020-21, 82%, significantly higher than previous wave
23019-20, 79%
2017-18, 78%
Getting help on your application when you needed it (n=3797)
5-very easy, 44%
4, 21%
3, 13%
2, 5%
1-very difficult, 6%
% Rated 4 or 5
2020-21, 65%
You were able to complete the application in a reasonable amount of time
5-strongly agree, 44%
4, 21%
3, 13%
2, 5%
1-strongly disagree, 6%
% Rated 4 or 5
2020-21, 83%
2019-20, 84%
2017-18, 82%
Confident your application would be processed in a reasonable amount of time
5-strongly agree, 43%
4, 25%
3, 19%
2, 7%
1-strongly disagree, 7%
% Rated 4 or 5
2020-21, 68%, significantly higher than previous wave
2019-20, 64%
2017-18, 65%
Q13. On a scale of 1 to 5 where 1 was very difficult and 5 was very easy, how would you rate the following when you were applying for [INSERT ABBREV]? Base: Completed an application (n=varies, Completing form excludes SIN clients)
Q12. How much do you agree or disagree that you were able to complete the application in a reasonable amount of time? (Please use a scale of 1 to 5, where 1 was disagree strongly and 5 was agree strongly.) Base: All respondents (n=3797)
Q14c. After you submitted your application for [PROGRAM], how confident were you that your application would be processed in a reasonable amount of time. Please use a 5-point scale, where 1 was very worried and 5 was very confident. Base: Excludes SIN who went in person (n=3416)
Ease of Follow-Up
Figure long description
Ease of Follow-Up
How easy or difficult was it to follow up with Service Canada about your application?
5-strongly agree, 36%
4, 26%
3, 17%
2, 10%
1, 10%
Don’t know,10%
% Rated 4 or 5
2020-21, 63%
2019-20, 61%
2017-18, 66%
Base: Clients who followed-up (n=1209)
Q20a. Using a 5-point scale where 1 was very difficult and 5 was very easy, how easy or difficult was it to follow up with Service Canada about your application?
Ease of End-to-end Client Journey
Figure long description
Ease of Navigating End-to-End Journey
It was easy to access service in a language I could speak and understand well
5 – Strongly agree, 82%
4, 13%
3, 3%
2, 0%
1 – strongly disagree, 1%
Not applicable, 1%
% Rated 4/5
2020-21, 95%
2019-20, 94%
Overall, it was easy for you to apply for
5 – Strongly agree, 59%
4, 27%
3, 9%
2, 3%
1 – strongly disagree, 2%
% Rated 4/5
2020-21, 86%
2019-20, 84%
2018-19, 85%
2017-18, 84%
Throughout the process it was clear what would happen next and when it would happen.
5 – Strongly agree, 57%
4, 23%
3, 11%
2, 4%
1 – strongly disagree, 3%
Not applicable, 1%
Don’t know, 1%
% Rated 4/5
2020-21, 81%, significantly higher than previous wave
2019-20, 73%
2018-19, 77%;
2017-18, 77%;
Being able to complete steps online made the process easier for you
5 – Strongly agree, 62%
4, 19%
3, 8%
2, 3%
1 – strongly disagree, 3%
Not applicable, 5%
% Rated 4/5
2020-21, 80%, significantly higher than previous wave
2019-20, 75%
2017-18, 70%
You needed to explain your situation only once.
5 – Strongly agree, 58%
4, 19%
3, 8%
2, 4%
1 – strongly disagree, 6%
Not applicable, 3%
Don’t know, 1%
% Rated 4/5
2020-21, 77%
2019-20, 78%
2018-19, 77%
Effectiveness of End-to-end Client Journey
Figure long description
% Rated 4/5
You were able to move smoothly through all of the steps related to your application.
5-strongly agree, 62%
4, 23%
3, 10%
2, 3%
1-strongly disagree, 2%
% Rated 4/5
2020-21, 85%, significantly higher than previous wave
2019-20, 82%
2018-19, 84%
2017-18, 82%
You received consistent information
5-strongly agree, 64%
4, 20%
3, 10%
2, 3%
1-strongly disagree, 2%
Not applicable, 1%
% Rated 4/5
2020-21, 84%, significantly higher than previous wave
2019-20, 80%
2018-19, 82%
2017-18, -
The amount of time it took, from when you started gathering information to when you got a decision on your application, was reasonable.
5-strongly agree, 58%
4, 24%
3, 10%
2, 3%
1-strongly disagree, 4%
% Rated 4/5
2020-21, 81%, significantly higher than previous wave
2019-20, 77%
2018-19, 76%
2017-18, 78%
It was clear what to do if you had a problem or question.
5-strongly agree, 57%
4, 22%
3, 11%
2, 4%
1-strongly disagree, 4%
Not applicable, 1%
Don’t know, 1%
% Rated 4/5
2020-21, 79%
2019-20, 78%
2018-19, 76%
2017-18, 77%
It was easy to get help when you needed it.
5-strongly agree, 52%
4, 19%
3, 13%
2, 5%
1-strongly disagree, 5%
Not applicable, 5%
Don’t know, 1%
% Rated 4/5
2020-21, 71%, significantly lower than previous wave
2019-20, 76%
2018-19, 77%
2017-18, 77%
You were provided service in a way that protected your health and safety during the COVID-19 pandemic
5-strongly agree, 75%
4, 13%
3, 5%
2, 1%
1-strongly disagree, 2%
Not applicable, 4%
Don’t know, 1%
% Rated 4/5
2020-21, 88%
Base: All Answering (n=varies)
Q36b. Thinking about the service you received, how much do you agree or disagree with the following statements.
Emotion during End-to-end Client Journey
Figure long description
You were provided with service in your choice of English or French,
5-strongly agree, 87%
4, 9%
3, 3%
2, 0%
1-strongly disagree, 1%
% Rated 4/5
2020-21, 96%, significantly lower than previous wave
2019-20, 97%
2017-18, 94%
Service Canada reps that you dealt with in-person were helpful,
5-strongly agree, 78%
4, 13%
3, 4%
2, 1%
1-strongly disagree, 2%
Not applicable, 1%
Don’t know, 1%
% Rated 4/5
2020-21, 91%
2019-20, 92%
You were confident that your personal information was protected,
5-strongly agree, 68%
4, 19%
3, 8%
2, 2%
1-strongly disagree, 2%
% Rated 4/5
2020-21, 87%
2019-20, 87%
2018-19, 87%
2017-18, 87%
Service Canada specialized call centre phone reps were helpful
5-strongly agree, 66%
4, 19%
3, 8%
2, 3%
1-strongly disagree, 3%
% Rated 4/5
2020-21, 85%, significantly higher than previous wave
2019-20, 73%
2018-19, 78%
2017-18, 82%
You travelled a reasonable distance to access the service,
5-strongly agree, 59%
4, 20%
3, 9%
2, 3%
1-strongly disagree, 5%
Not applicable, 3%
Don’t know, 1%
% Rated 4/5
2020-21, 79%, significantly higher than previous wave
2019-20, 75%
You were confident that any issues or problems would have been easily resolved,
5-strongly agree, 52%
4, 25%
3, 13%
2, 5%
1-strongly disagree, 4%
Not applicable, 1%
Total
2020-21, 77%
2019-20, 78%
The Service Canada phone reps that called you back after you completed an online form were helpful
5-strongly agree, 68%
4, 18%
3, 6%
2, 2%
1-strongly disagree, 2%
Not applicable, 3%
% Rated 4/5
2020-21, 85%
1 800 O-Canada phone representatives were helpful, new attribute added in 2020-21
5-strongly agree, 65%
4, 23%
3, 5%
2, 5%
1-strongly disagree, 1%
Not applicable, 1%
% Rated 4/5
2020-21, 88%
Base: All Answering (n=varies)
Q36b. Thinking about the service you received, how much do you agree or disagree with the following statements.