This public opinion research report presents the results of a telephone survey conducted on behalf of Service Canada with a sample of 4,200 Service Canada clients across the five major programs. The study was conducted between June 23 and July 26, 2022.
It is available upon request in multiple formats (large print, MP3, braille, e-text, DAISY), by contacting 1 800 O-Canada (1-800-622-6232). By teletypewriter (TTY), call 1-800-926-9105.
Service Canada sondage sur l'expérience client 2021-2022
Ce rapport de recherche sur l’opinion publique présente les résultats d’un sondage téléphonique mené pour le compte de Service Canada auprès d’un échantillon de 4 200 clients de Service Canada dans les cinq principaux programmes. L’étude a été menée entre le 23 juin et le 26 juillet 2022.
Ce document offert sur demande en médias substituts (gros caractères, MP3, braille, fichiers de texte, DAISY) auprès du 1 800 O-Canada (1-800-622-6232).
Si vous utilisez un téléscripteur (ATS), composez le 1-800-926-9105.
I hereby certify as Senior Officer of Ipsos that the deliverables fully comply with the Government of Canada political neutrality requirements outlined in the Policy on Communications and Federal Identity and the Directive on the Management of Communications. Specifically, the deliverables do not include information on electoral voting intentions, political party preferences, standings with the electorate or ratings of the performance of a political party or its leaders.
President
Ipsos Public Affairs
Additional information
Supplier Name: Ipsos Limited Partnership
PSPC Contract Number: CW2234002 (G9292-23-1233)
Contract Award Date: 2022-05-17
Executive Summary
Service Canada CX Survey 2021-22 – Results at a Glance
4,200 interviews conducted (between 760 and 990 per program)
Methodology: Telephone survey
Fieldwork: June 23 to July 26, 2022
Client experiences that reached initial decision: Jan to Mar 2022
Figure long description
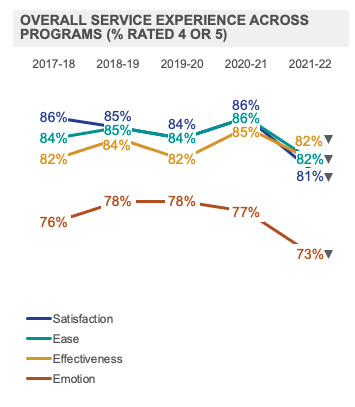
Overall Service Experience Across Programs (% Rated 4 or 5)
Satisfaction
2017-18, 86%
2018-19, 85%
2019-20, 84%
2020-21, 86%
2021-22, 81%, significantly lower than last year
Ease
2017-18, 84%
2018-19, 85%
2019-20, 84%
2020-21, 86%
2021-22, 82%, significantly lower than last year
Effectiveness
2017-18, 82%
2018-19, 84%
2019-20, 82%
2020-21, 85%
2021-22, 82%, significantly lower than last year
Emotion
2017-18, 76%
2018-19, 78%
2019-20, 78%
2020-21, 77%
2021-22, 73%, significantly lower than last year
Figure long description
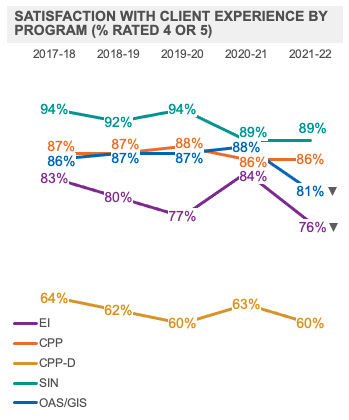
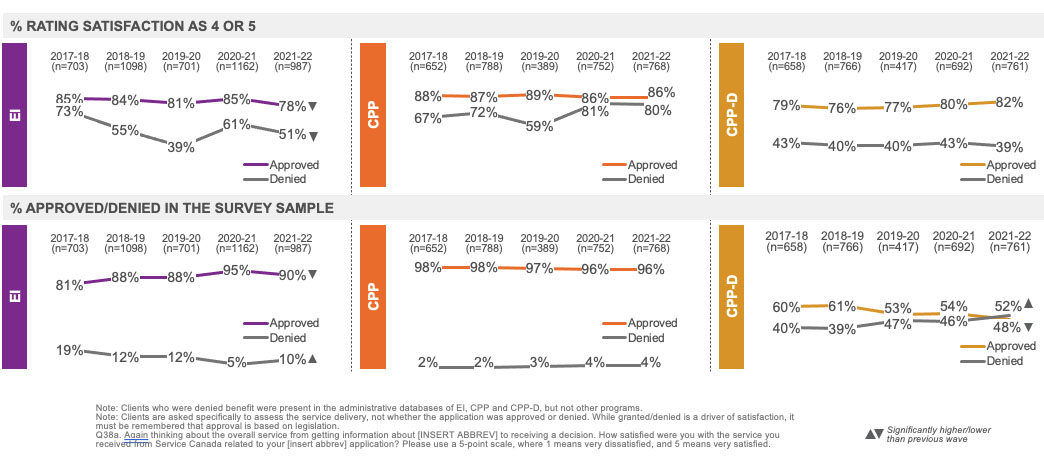
Satisfaction with clients Experience by Program (% rated 4 or 5)
EI
2017-18, 83%
2018-19, 80%
2019-20, 77%
2020-21, 84%
2021-22, 76%, significantly lower than previous wave
CPP
2017-18, 87%
2018-19, 87%
2019-20, 88%
2020-21, 86%
2021-22, 86%
CPP-D
2017-18, 64%
2018-19, 62%
2019-20, 60%
2020-21, 63%
2021-22, 60%
SIN
2017-18, 94%
2018-19, 92%
2019-20, 94%
2020-21, 89%
2021-22, 89%
OAS/GIS
2017-18, 86%
2018-19, 87%
2019-20, 87%
2020-21, 88%
2021-22, 81%, significantly lower than previous wave
Figure long description
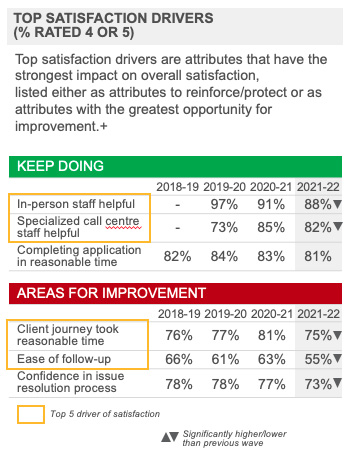
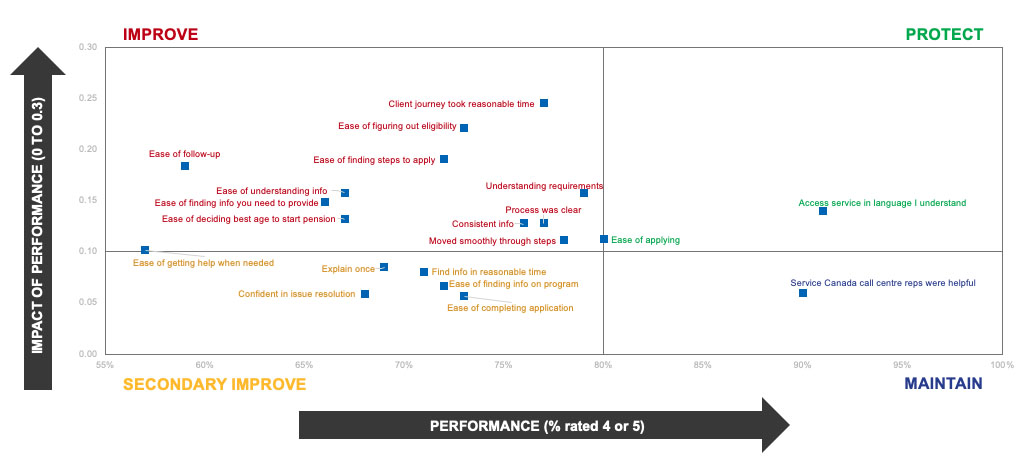
Top Satisfaction Drivers
Top satisfaction drivers are attributes that have the strongest impact on overall satisfaction, listed either as attributes to reinforce/protect or as attributes with the greatest opportunity for improvement.+
Keep doing
In –person staff helpful
2018-19, N/A
2019-20, 97%
2020-21, 91%
2021-22, 88%, significantly lower than previous wave, top 5 driver of satisfaction
Specialized call centre staff helpful
2018-19, N/A
2019-20, 73%
2020-21, 85%
2021-22, 82%, significantly lower than previous wave, top 5 driver of satisfaction
Completing application in reasonable time
2018-19, 82%
2019-20, 84%
2020-21, 83%
2021-22, 81%
Areas for improvement
Client journey took reasonable time
2018-19, 76%
2019-20, 77%
2020-21, 81%
2021-22, 75%, significantly lower than previous wave, top 5 driver of satisfaction
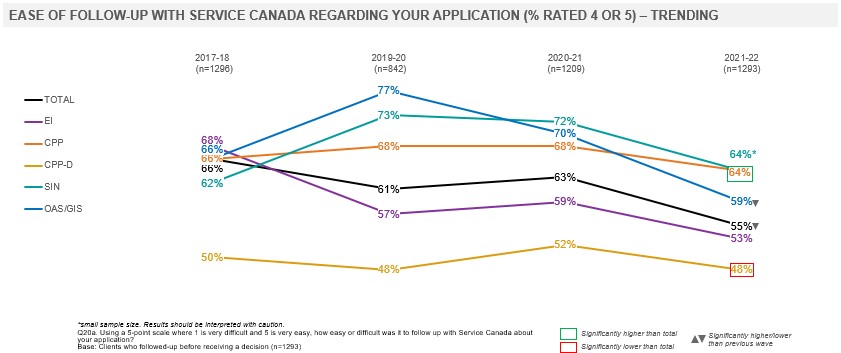
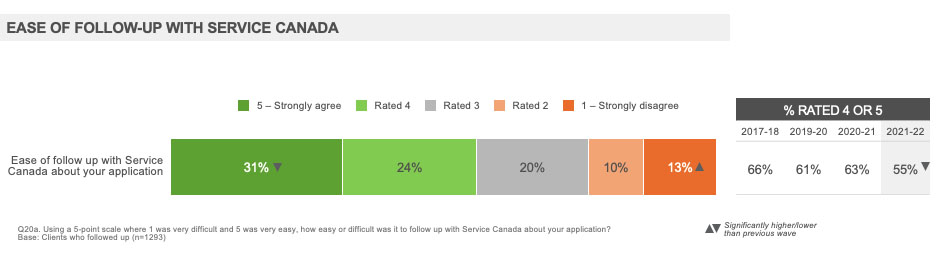
Ease of follow-up
2018-19, 66%
2019-20, 61%
2020-21, 63%
2021-22, 55%, significantly lower than previous wave, top 5 driver of satisfaction
Confidence in issue resolution process
2018-19, 78%
2019-20, 78%
2020-21, 77%
2021-22, 73%, significantly lower than previous wave
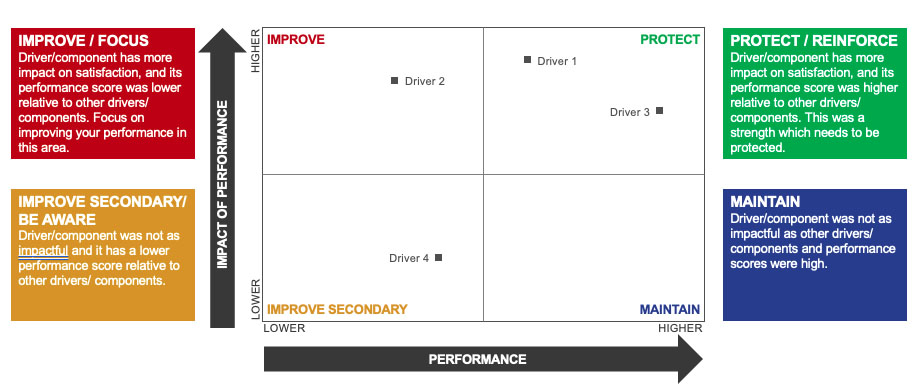
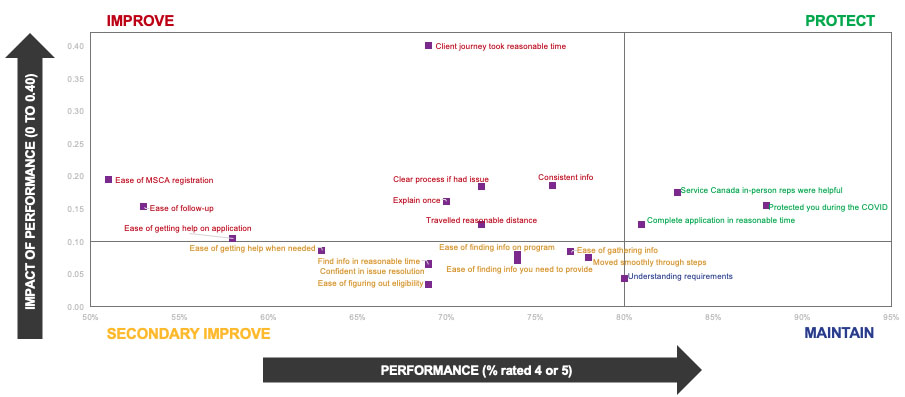
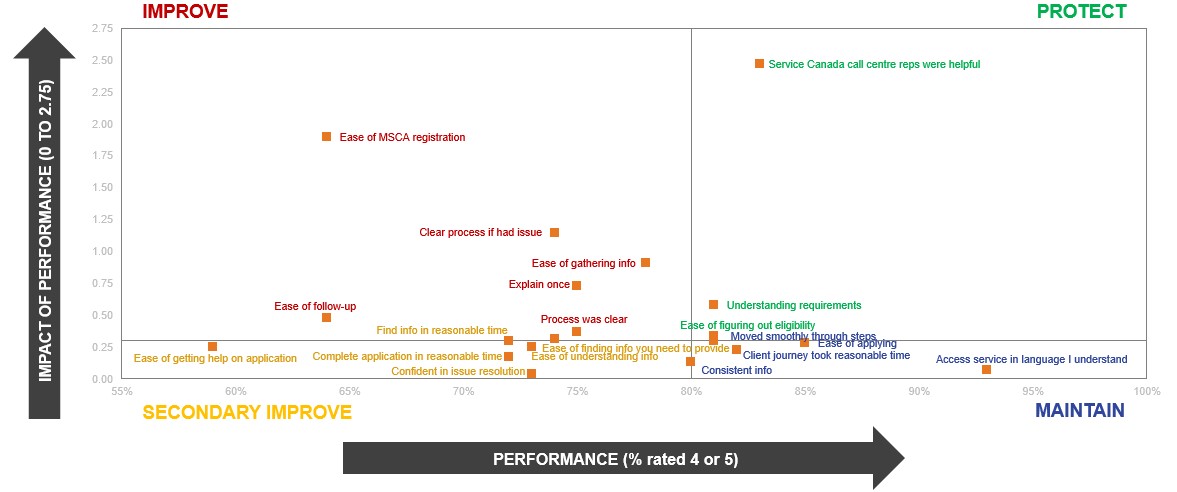
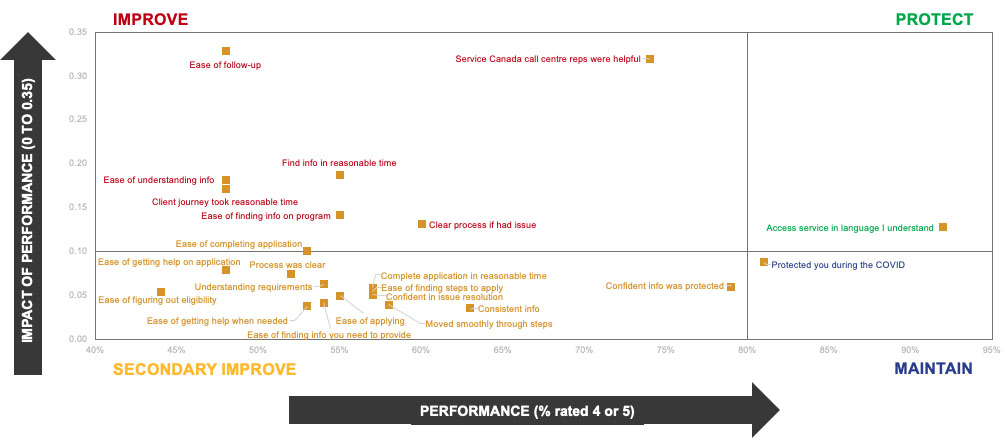
+Ref. Service Canada CX Survey report 2021-22 / Overall Priority Matrix: Impact vs. Performance
Figure long description
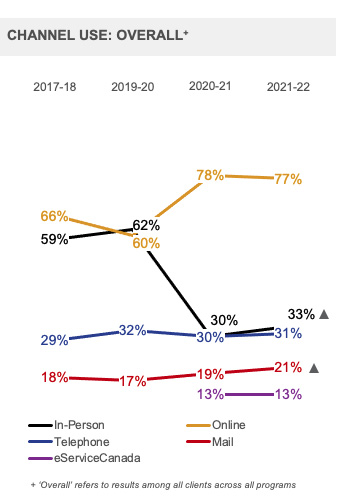
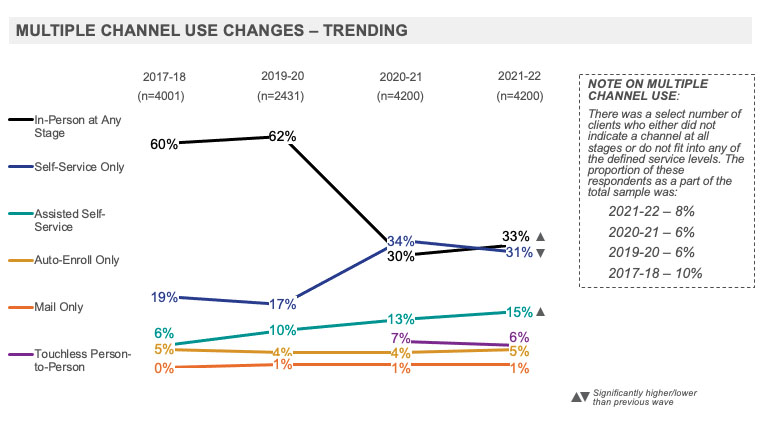
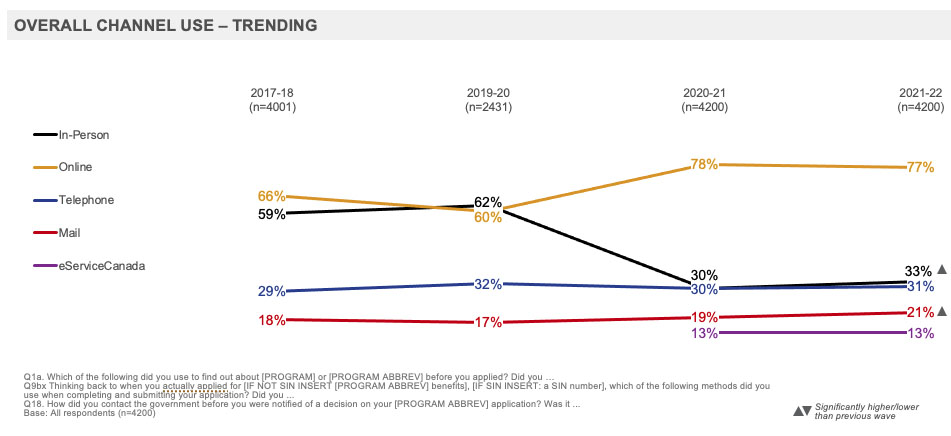
Channel use: Overall
In-person
2017-18, 59%
2019-20, 62%
2020-21, 30%
2021-22, 33%, significantly higher than last wave
Telephone
2017-18, 29%
2019-20, 32%
2020-21, 30%
2021-22, 31%
eServiceCanada
2020-21, 13%
2021-22, 13%
Online
2017-18, 66%
2019-20, 60%
2020-21, 78%
2021-22, 77%
Mail
2017-18, 18%
2019-20, 17%
2020-21, 19%
2021-22, 21%, significantly higher than last wave
Figure long description
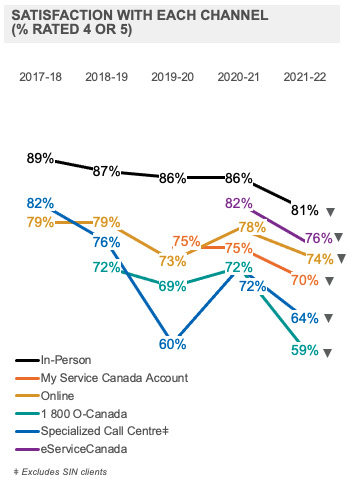
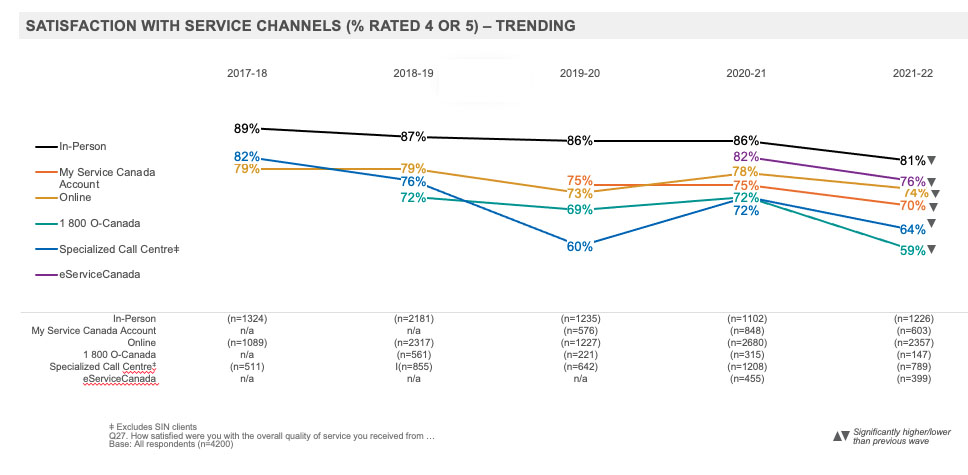
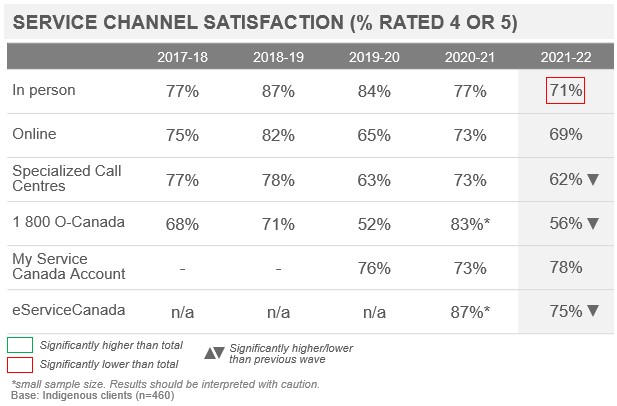
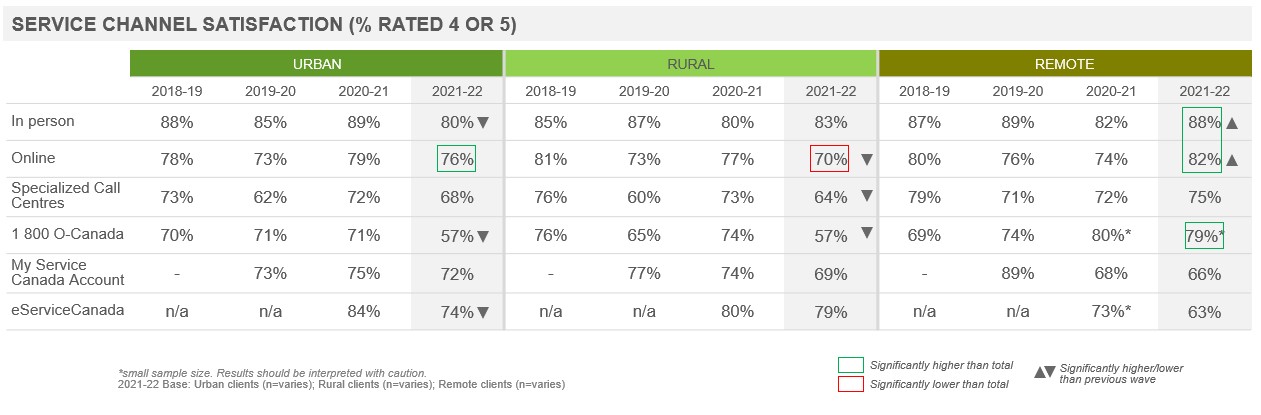
Satisfaction with each channel (% Rated 4 or 5)
In-person
2017-18, 89%
2018-19, 87%
2019-20, 86%
2020-21, 86%
2021-22, 81%, significantly lower than previous wave
My Service Canada Account
2019-20, 75%
2020-21, 75%
2021-22, 70%, significantly lower than previous wave
Online
2017-18, 79%
2018-19, 79%
2019-20, 73%
2020-21, 78%
2021-22, 74%, significantly lower than previous wave
1 800 O-Canada
2018-19, 72%
2019-20, 69%
2020-21, 72%
2021-22, 59%, significantly lower than previous wave
Specialized Call Centre
2017-18, 82%
2018-19, 76%
2019-20, 60%
2020-21, 72%
2021-22, 64%, significantly lower than previous wave
eServiceCanada
2020-21, 82%
2021-22, 76%, significantly lower than previous wave
Figure long description
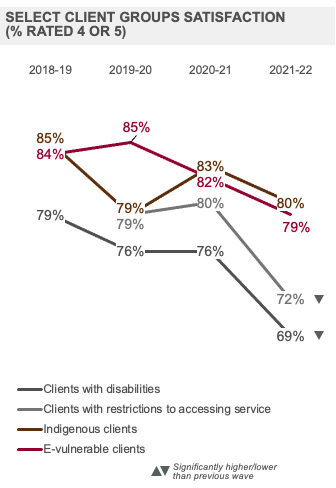
Client Groups Satisfaction
Clients with disabilities
2018-19, 79%
2019-20, 76%
2020-21, 76%
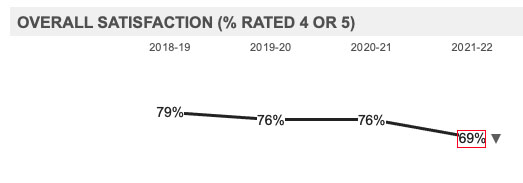
2021-22, 69%, significantly lower than previous wave
Client with restrictions to accessing service
2019-20, 79%
2020-21, 80%
2021-22, 72%, significantly lower than previous wave
Indigenous clients
2018-19, 85%
2019-20, 79%
2020-21, 83%
2021-22, 80%
E-vulnerable clients
2018-19, 84%
2019-20, 85%
2020-21, 82%
2021-22, 79%
+ ‘Overall’ refers to results among all clients across all programs
Background and Objectives
The annual Service Canada Client Experience (CX) Survey measures the end-to-end service experience delivered by Service Canada and tracks the impact of service delivery change on clients’ ability to access federal programs.
The 2021-22 Client Experience (CX) Survey is the fifth annual wave and provides trend data to contribute to monitoring the service delivery performance of Service Canada, and allows measuring the impact of the significant pandemic service delivery changes on the client needs.
The CX Survey provides tracking of satisfaction with the client journey among Service Canada clients, measures changes in use and satisfaction of service channels and assesses the ease, effectiveness and emotion of Service Canada clients by service channel and program.
The Client Experience Measurement Project is conducted in two phases: an initial quantitative survey followed by a qualitative phase of research.
The qualitative phase was used to explore opportunities for improvement in service delivery and channel use where clients were not satisfied and/or faced barriers to access. Highlights have been embedded throughout and the detailed results of the qualitative research are available under separate cover.
The contract value ($298,613.80 (including HST)) for this research includes both the qualitative and quantitative phases.
To comply with the Treasury Board Secretariat’s Policy on Service and Digital, Citizen Service Branch (CSB) conducts the Client Experience (CX) Survey to collect client feedback to assist in effectively managing service delivery across the service channels and to help ensure client-centric service design and delivery that is accessible and inclusive.
The Citizen Service Branch launched the annual Client Experience (CX) Survey in 2017 as part of a structured approach to collecting feedback from clients to track how well Service Canada was delivering federal programs through its service channels. The CX Survey was conducted again in 2018-19, 2019-20 and 2020-21.
The CX Survey is conducted in two phases, an initial quantitative survey followed by a qualitative phase of research.
Having fielded the survey in 2017-18, 2018-19, 2019-20 and 2020-21, the CX Survey in 2021-22 collected trend data to contribute to monitoring the service delivery performance of Service Canada, and to report annual satisfaction to meet reporting requirements on the client experience.
Results from the 2021-22 CX Survey project will be used to:
Improve service delivery and access to programs;
Respond to clients’ evolving service needs;
Measure performance and impacts of service changes over time (e.g. pre-pandemic vs. pandemic vs. post-pandemic);
Contribute to evaluating the overall success of the Client Experience Management (CXM) function and service transformation; and,
Inform service management decisions as reported to Treasury Board under the Management Accountability Framework.
The research objectives for the quantitative phase were to:
Provide tracking on overall satisfaction with end-to-end service experience of Service Canada clients (including EI, CPP, CPP-D, OAS/GIS and SIN) and measure changes over time in the use and satisfaction of service channels.
Utilize the Client Experience Measurement Model and assess ease, effectiveness and emotion of clients accessing the five major programs.
Methodology
A telephone survey was conducted with a sample of 4,200 Service Canada clients across the five major programs.
Old Age Security (OAS) / Guaranteed Income Supplement (GIS): (n=809) +/- 3.4 percentage points
Social Insurance Number (SIN): (n=875) +/- 3.3 percentage points
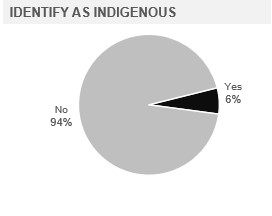
Oversamples were collected with two client groups: those living in remote areas and Indigenous clients.
The interviews were conducted between June 23 and July 26, 2022.
Clients who were sampled had completed a client journey and received an initial decision, benefit or Social Insurance Number in January, February or March 2022.
The survey sample size has a margin of error of +/-1.5%.
Results were weighted by age, gender, region, program and benefit receipt (approved/denied) using administrative data on clients who completed a client journey from April 2021 to March 2022. Program weights were held constant with 2017-18 to allow the results to highlight any change due to the service experience.
Comparisons to 2019-20 results reflect service delivery changes made after October 2019, while comparisons to 2018-19 results reflect changes made after October 2018, and 2017-18 results reflect changes made after June 2017.
The 2021-22 Client Experience Survey Detailed Methodology document, which includes the research instruments, is available under separate cover.
The qualitative research, which comprised a mix of in-depth interviews (32) and online focus groups (8), was conducted between September 7 and October 7, 2022. Participants who were screened into the focus groups or in-depth interviews were those who had lower satisfaction and/or experienced a barrier to accessing service. A total of 76 clients participated in the qualitative research. The findings presented are qualitative in nature, meaning that they provide an in-depth exploration of the research issues and at no point is the intention to produce results that are statistically representative of the population at large.
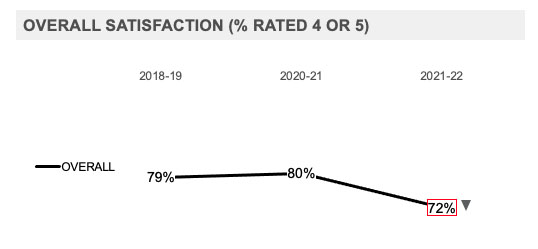
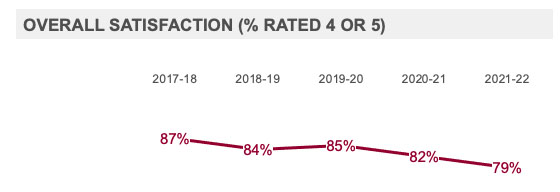
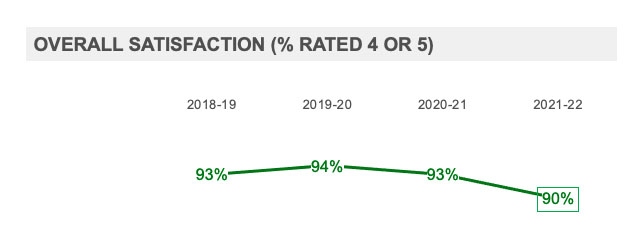
Executive Summary: Overall Satisfaction
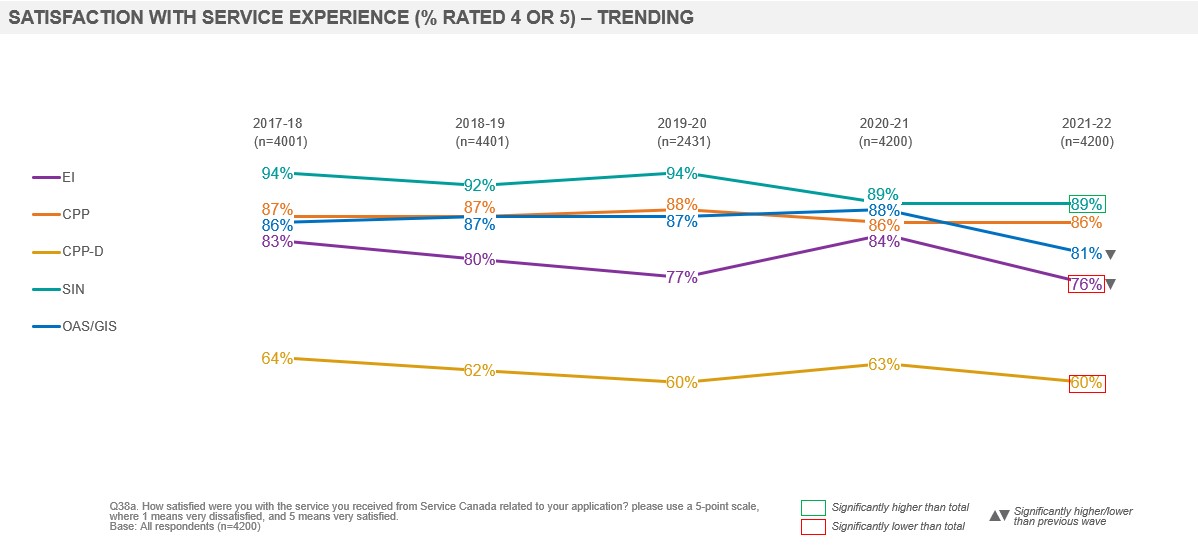
Satisfaction with the overall service experience has declined compared to 2020-21. Satisfaction among EI and OAS/GIS clients decreased compared to the previous wave. Satisfaction was higher among SIN clients compared to all clients, lower among EI clients and, consistent with previous years, remained the lowest for CPP-D clients.
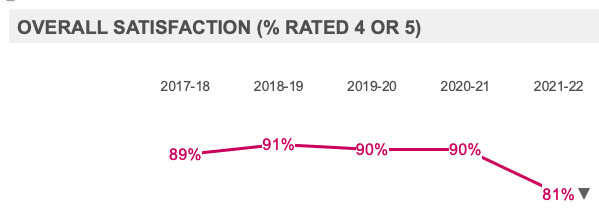
At just over eight in ten, the vast majority of clients were satisfied with their experience (81%) and found it easy (82%) and effective (82%). Nearly three quarters (73%) were confident that any issues or problems would have been easily resolved. Compared to 2020-21, ratings on overall satisfaction (81% vs. 86%), ease (82% vs. 86%), effectiveness (82% vs. 85%) and emotion (73% vs. 77%) have decreased. Overall effectiveness has returned to levels observed in 2019-20, while overall satisfaction, ease and emotion stand at the lowest levels observed.
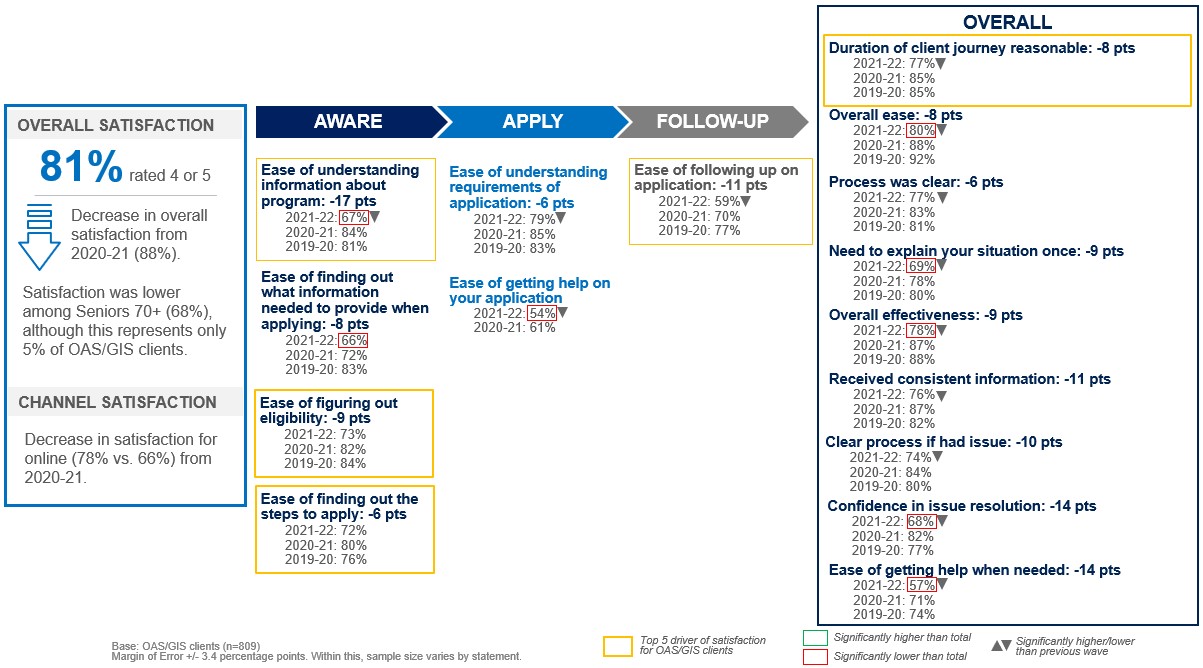
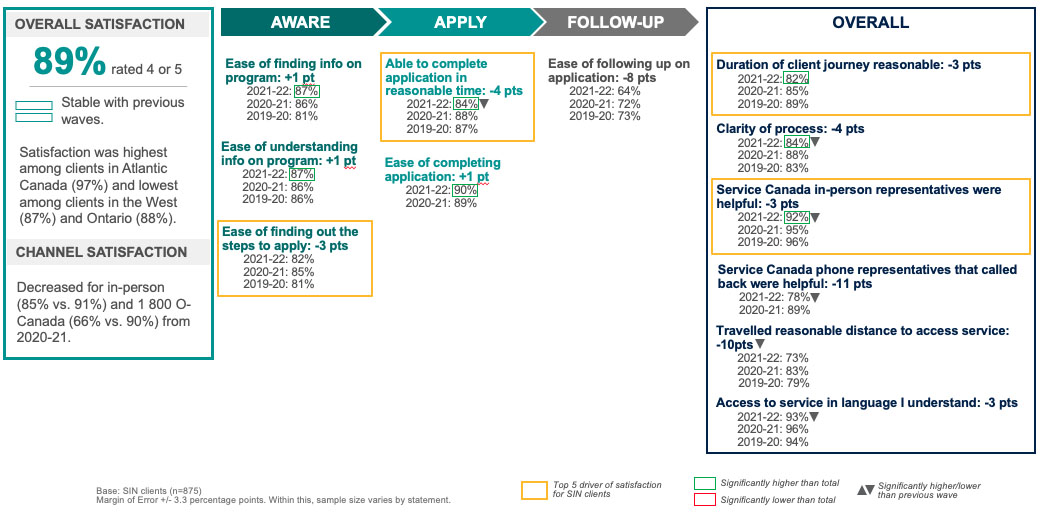
Nine in ten (89%) SIN clients expressed satisfaction with the service experience, the highest of any program. Over eight in ten CPP clients (86%) were satisfied, followed by eight in ten OAS/GIS clients (81%) and three quarters of EI clients (76%), while six in ten CPP-D clients (60%) were satisfied, lower than other programs. Satisfaction has decreased among EI (76% vs. 84%) and OAS/GIS clients (81% vs. 88%) compared to 2020-21.
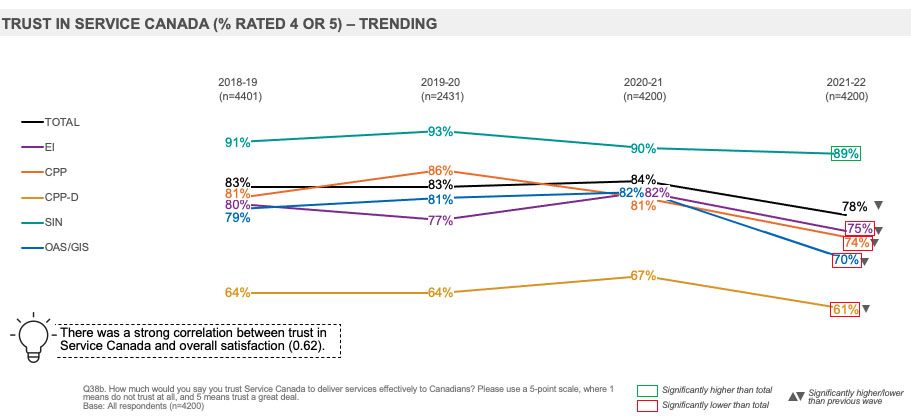
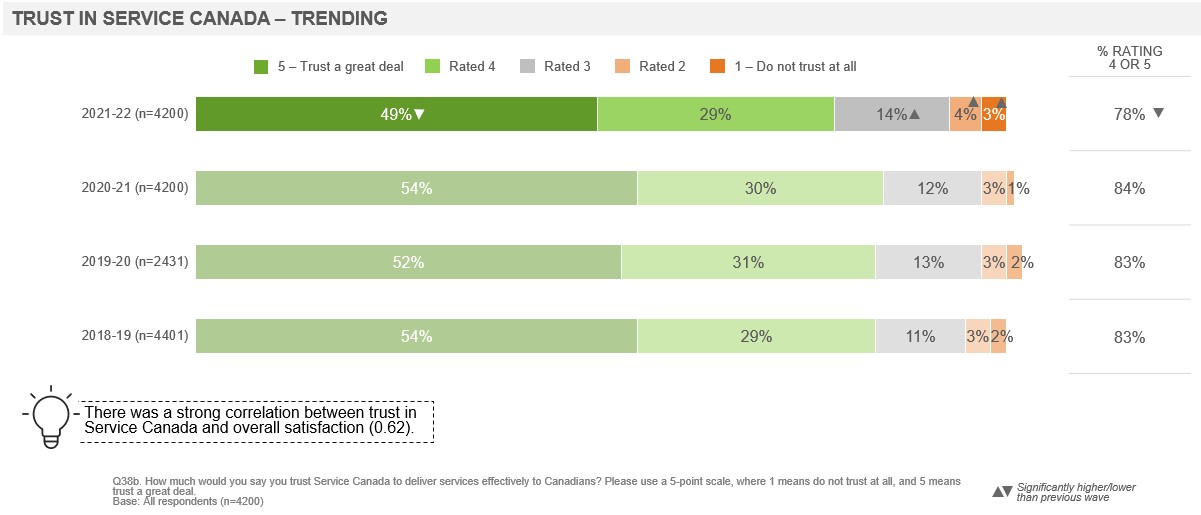
Compared to 2020-21, ratings on trust in Service Canada to deliver services have declined among clients of all programs except for SIN, while EI and OAS/GIS clients also provided lower ratings for ease, effectiveness, confidence in issue resolution and timeliness of service. CPP-D clients were less likely to agree that the timeliness of service was reasonable, while CPP clients provided lower ratings for confidence in issue resolution.
SIN clients were more likely to express trust (89%), to have found the process easy (90%), effective (91%) and to have had confidence in issue resolution (85%) compared to all clients. They were also more likely to have rated the timeliness of service as reasonable (82%) and to have reported their client journey took 2 weeks or less (66%) and in particular that it took one day (30%).
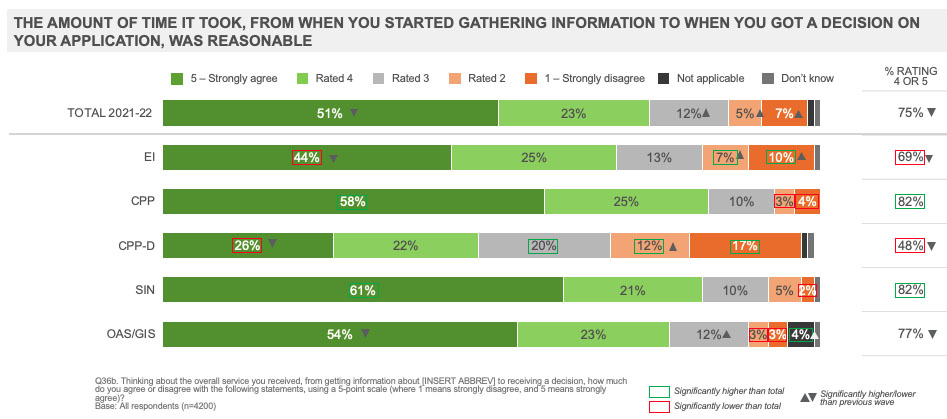
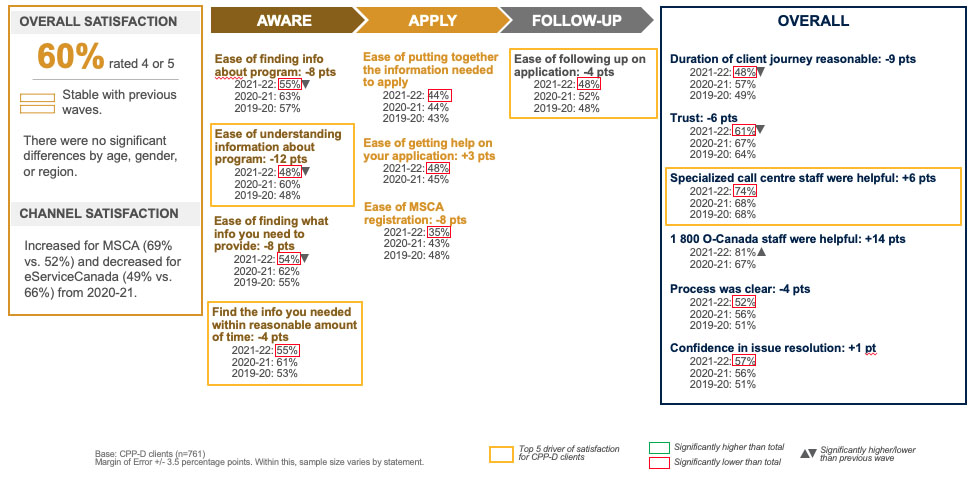
CPP-D clients were less likely to express trust (61%), to have found the process easy (55%), effective (58%) and to have confidence in issue resolution (57%) compared to all clients. They were also much less likely to have to have rated the timeliness of service as reasonable (48%) and reported the longest client journey of any program with CPP-D clients more likely to say it took between 8 weeks to 6 months (40%) or more than 6 months (25%).
OAS/GIS clients were less likely to express trust (70%), to have found the process effective (78%) and to have confidence in issue resolution (68%) compared to all clients. They were more likely to say their client journey took between 8 weeks to 6 months (20%) or more than 6 months (10%) and ratings on timeliness of service were consistent with overall levels.
EI clients were less likely to express trust (75%), to have found the process effective (78%) and to have confidence in issue resolution (69%) compared to all clients. They were also less likely to have to have rated the timeliness of service as reasonable (69%) and to have reported their client journey took between one day to 4 weeks (64%).
CPP were less likely to express trust (74%) compared to all clients but were more likely to have rated the timeliness of service as reasonable (82%) and to have reported their client journey took between 4 weeks to 6 months (54%).
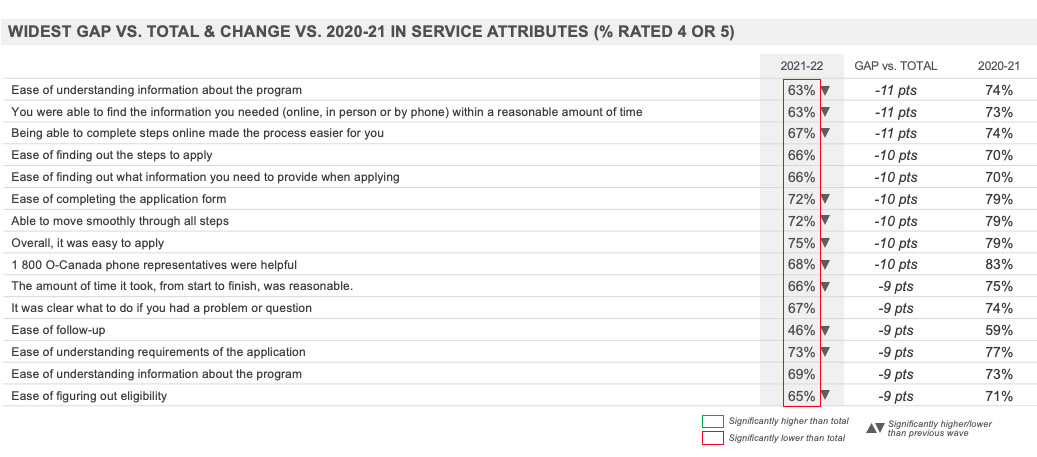
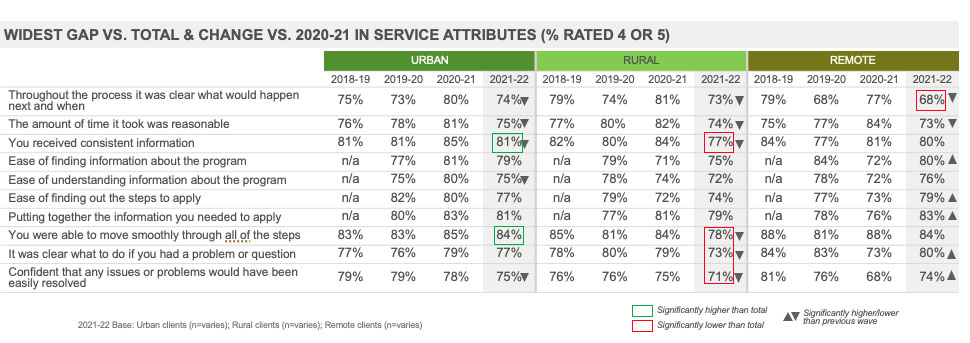
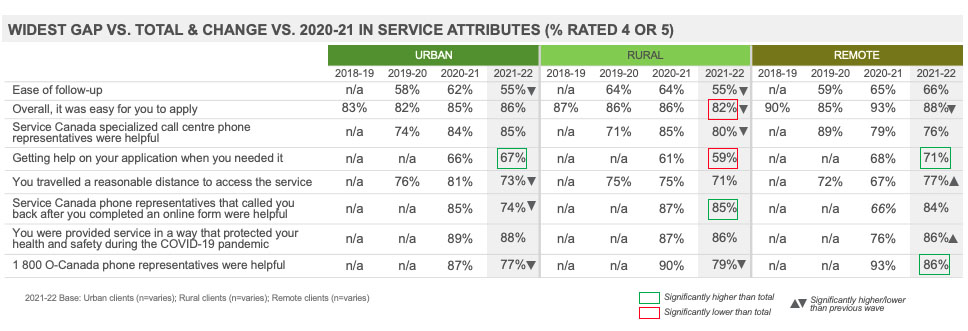
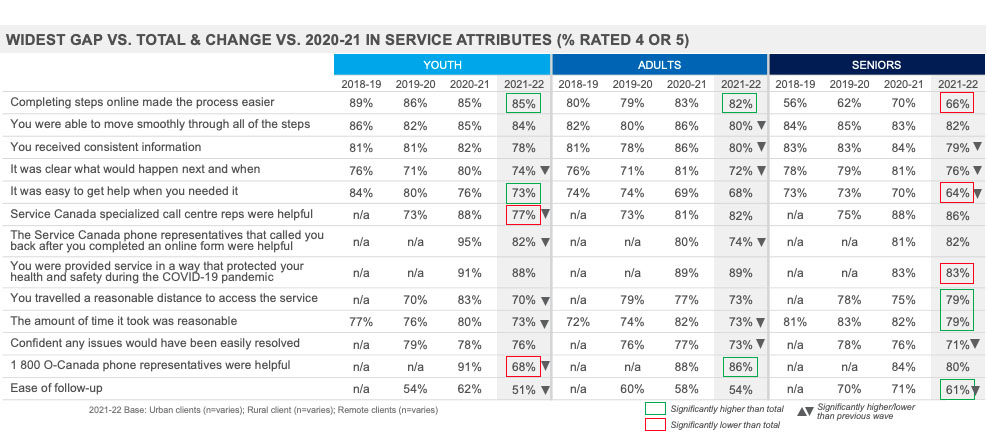
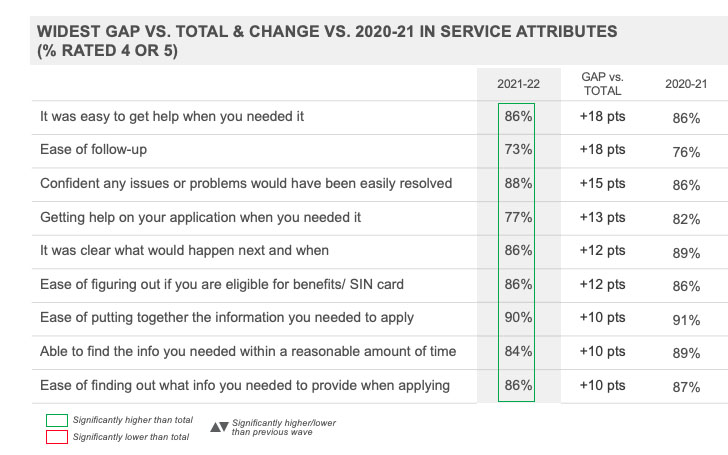
Executive Summary: Service Attribute Performance
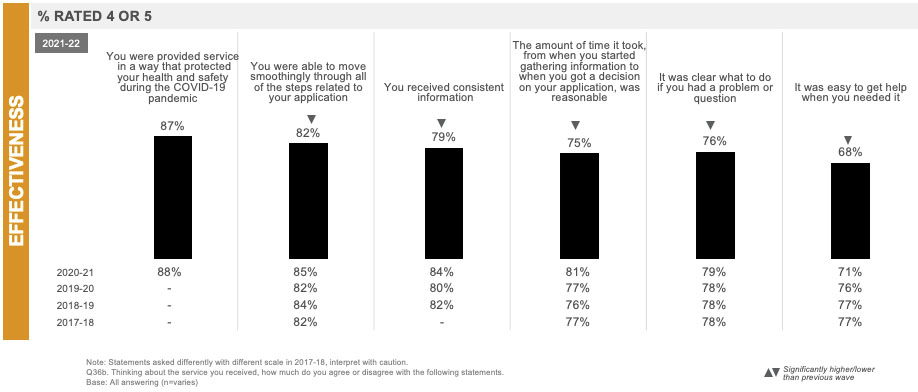
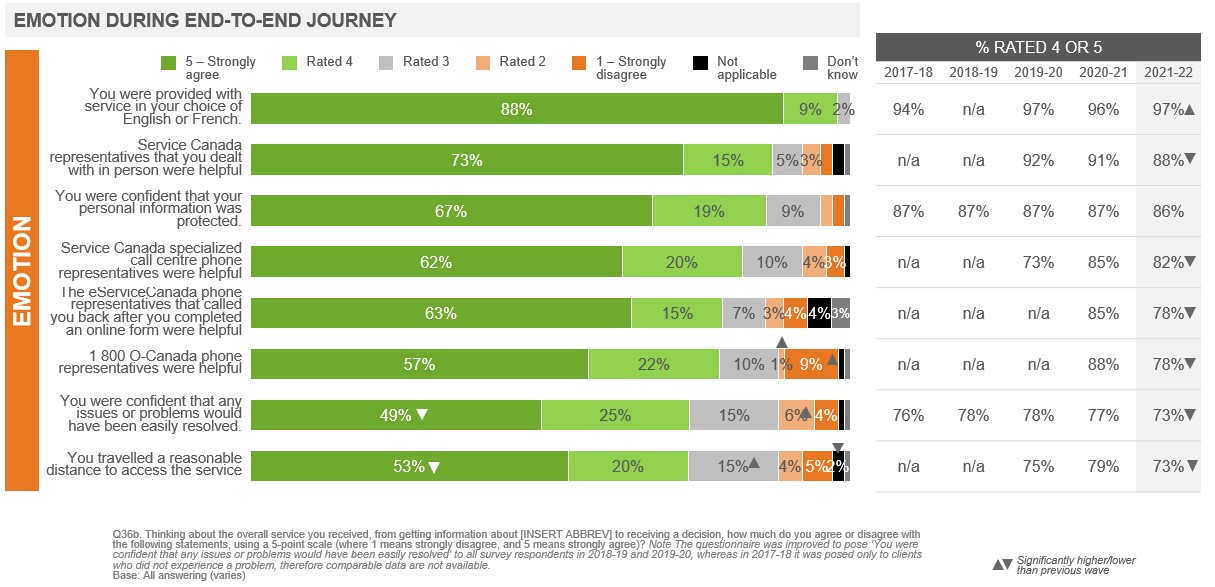
Ratings across nearly all service attributes related to ease, effectiveness and emotion of the end-to-end client journey have declined year over year.
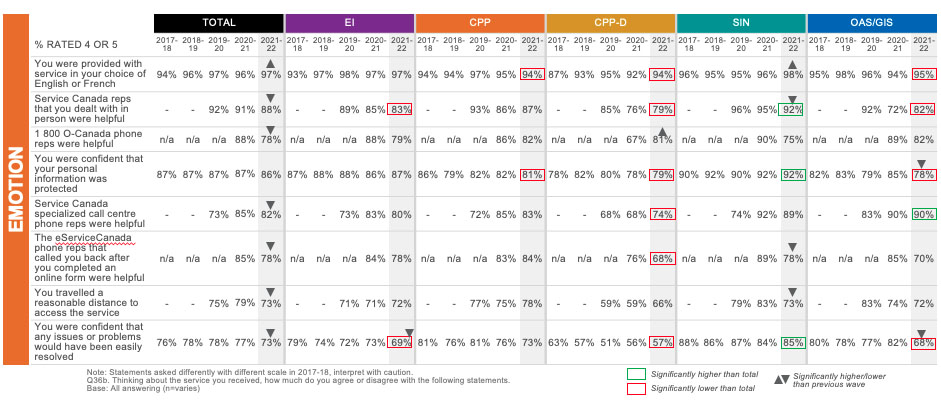
Clients were less likely to agree it was easy to apply; they were able to move smoothly through all steps; it was clear what would happen next and when; they needed to explain their situation only once; they received consistent information; timeliness of service was reasonable; it was clear what to do if they had a problem or question; it was easy to get help when needed; Service Canada in-person; specialized call centre; 1 800 O-Canada and eServiceCanada staff were helpful; they were confident any issues or problems would have been easily resolved; and that they travelled a reasonable distance to access service.
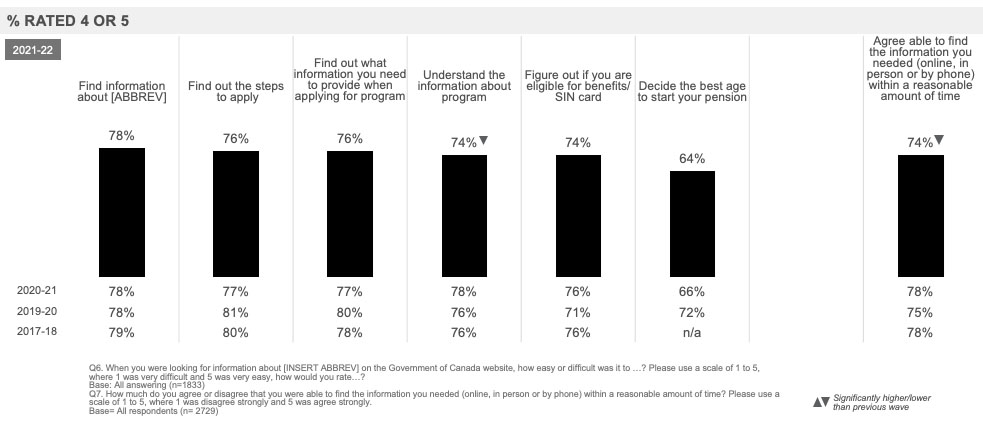
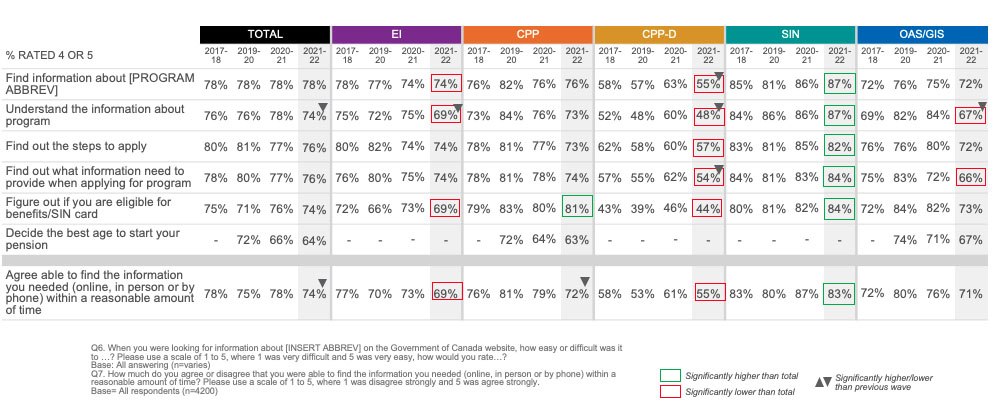
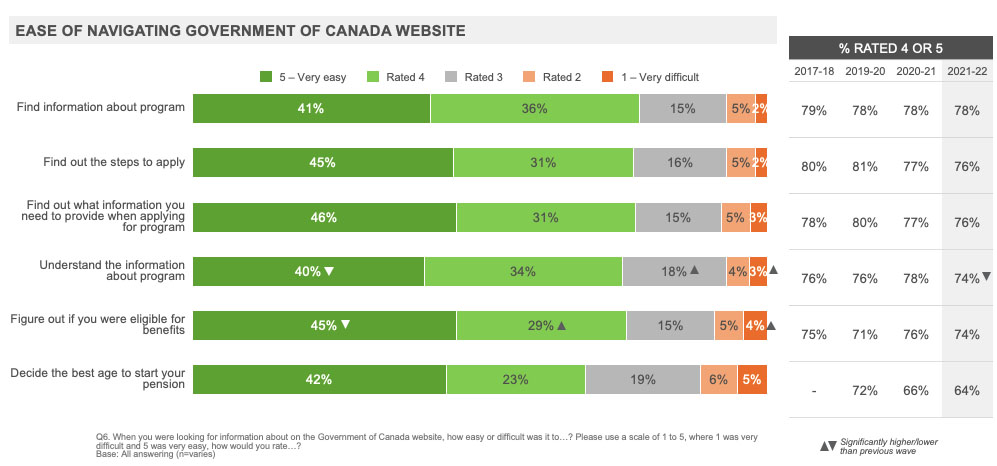
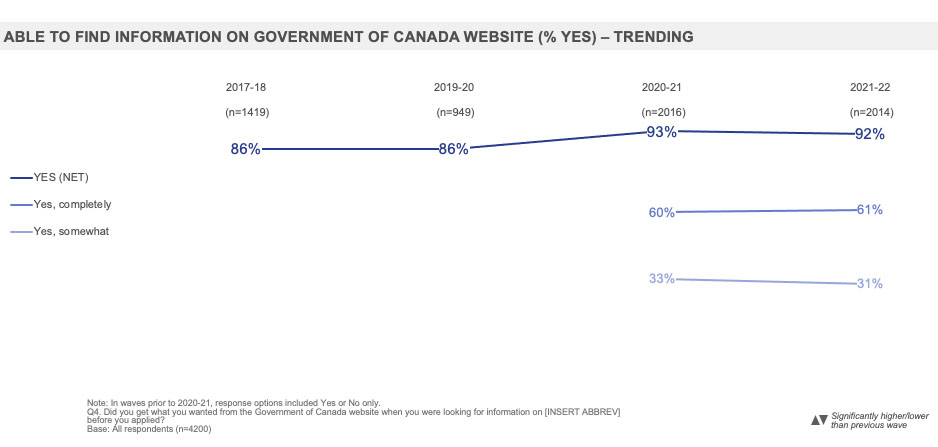
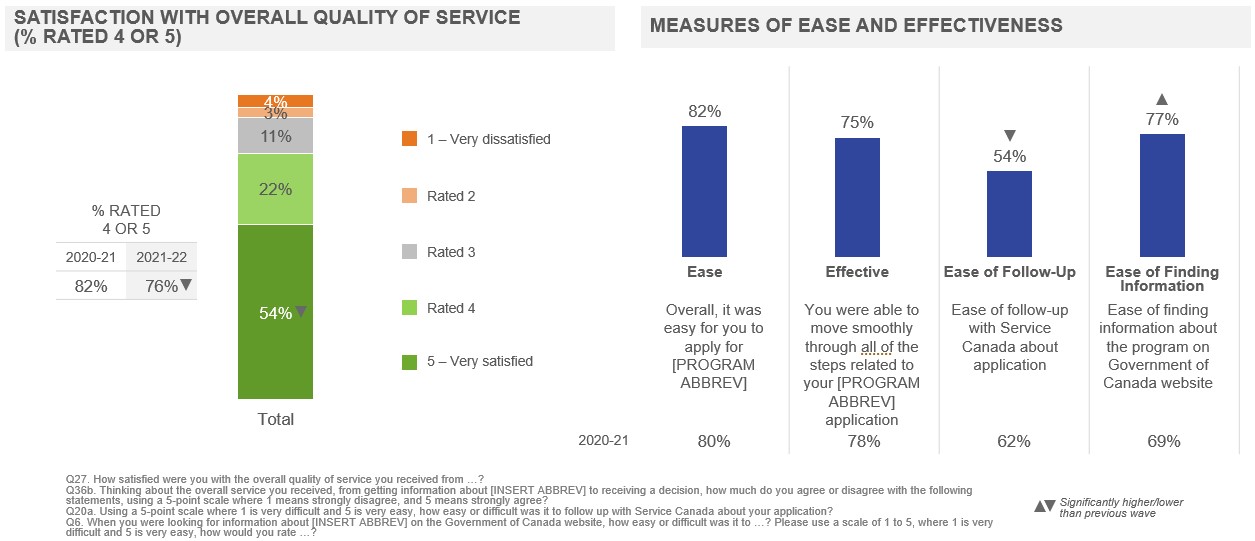
Impressions of the ease of the application process specifically and in finding information about the program on the Government of Canada website were generally consistent with the previous year, however fewer found it easy to understand information about the program and to be able to find the information they needed when learning about the program in a reasonable amount of time.
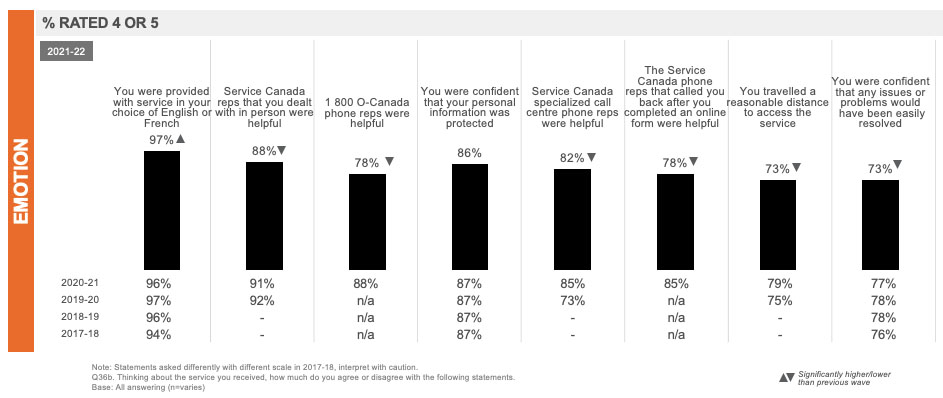
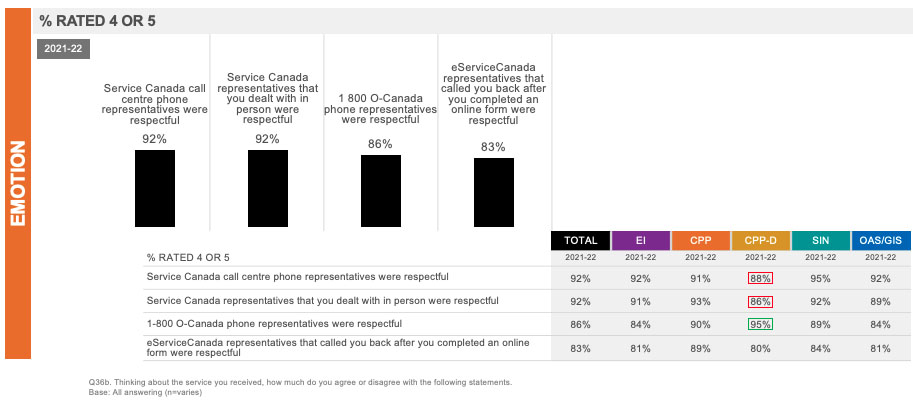
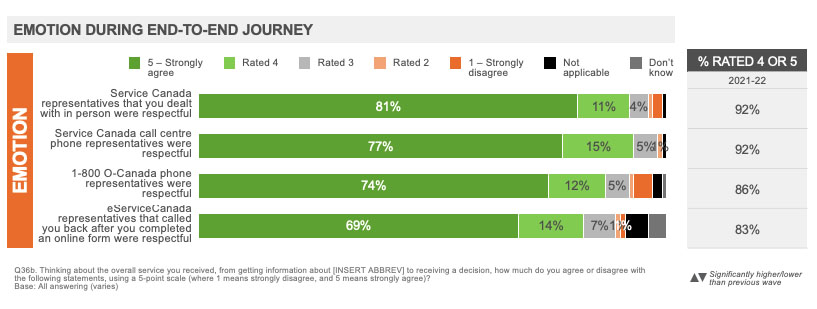
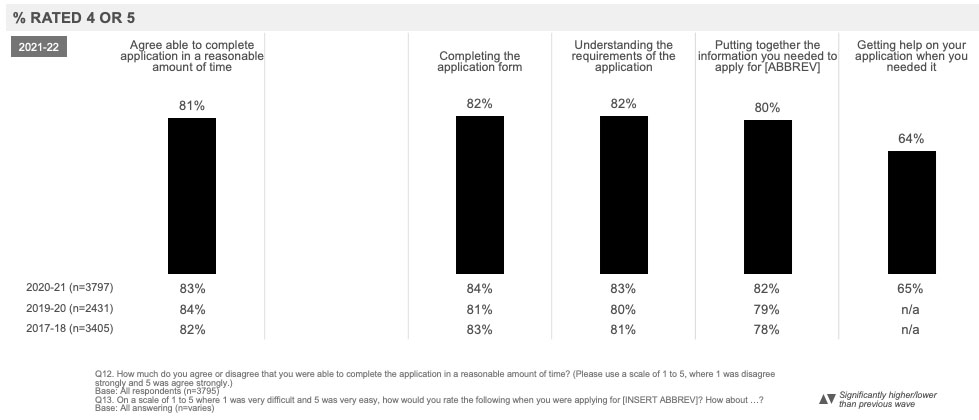
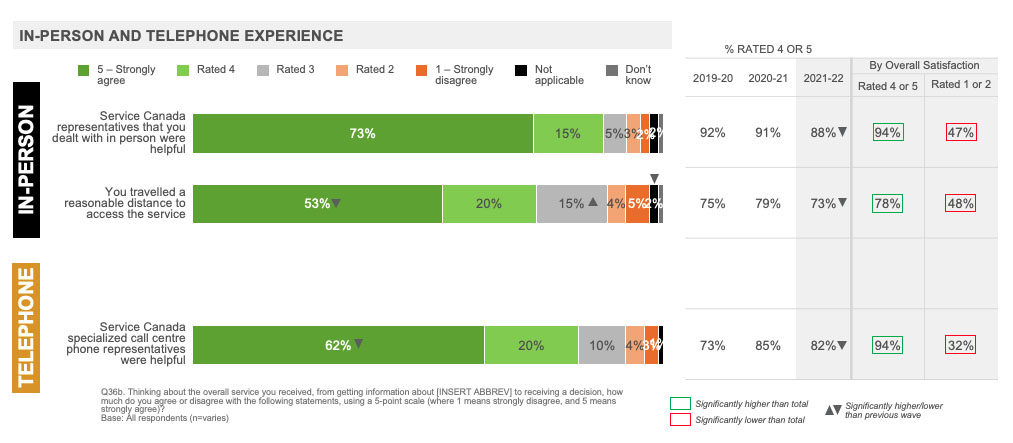
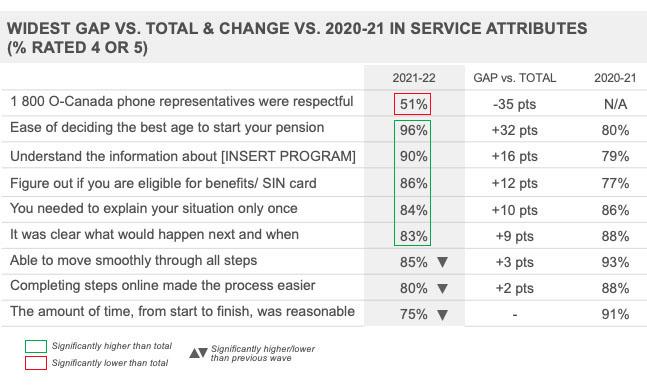
Service Canada clients provided the highest ratings for the respectfulness and helpfulness of in person and specialized call centre staff, confidence in information security, the overall ease and effectiveness of the process including ease of understanding the requirements of the application and completing the application form.
The vast majority found Service Canada in-person and specialized call centre staff respectful (92% for both) and helpful (88% and 82% respectively), were confident their personal information was protected (86%), found it easy to apply (82%), including that it was easy to understand the requirements (82%) and complete the application form (82%), and were able to move smoothly through all steps (82%).
Service attributes with lower ratings were ease of follow-up, ease of getting help on the application when needed, ease of getting help in general and ease of deciding the best age to start their pension.
Just over half provided high ratings for the ease of following-up on their application (55%) and closer to two thirds for the ease of getting help on the application when needed (64%), ease of getting help in general (68%) and ease of deciding the best age to start their pension (64%).
The respectfulness and helpfulness of Service Canada staff and protection of personal information continued to be rated consistently high across all programs, while ease of follow-up was consistently rated low.
Executive Summary: Service Attribute Performance by Program
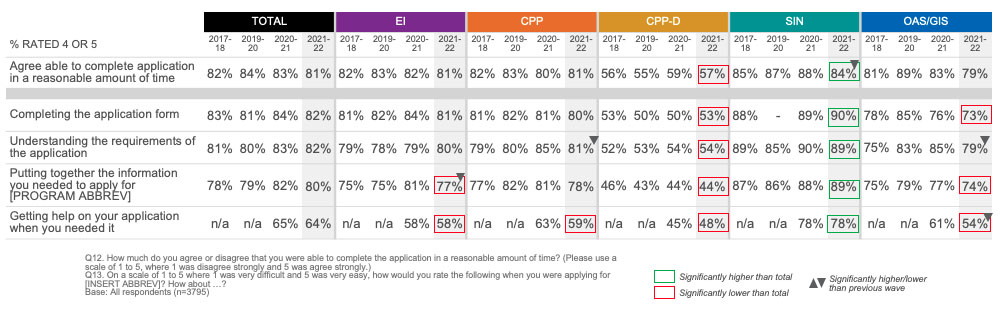
SIN clients continued to provide the highest ratings across all service attributes except the ease of follow-up and respectfulness of Service Canada staff where ratings were consistent with all clients.
The vast majority of SIN clients provided high ratings for all service attributes and in particular the ease and effectiveness of the process, and helpfulness of Service Canada in-person and specialized call centre staff. Ratings were lower for the ease of follow-up.
A strong majority of EI, CPP and OAS/GIS clients provided high ratings across several service attributes, however ratings were generally lower among EI and OAS/GIS clients.
EI clients were less likely to feel it was easy to find and understand information about the program, to figure out eligibility, to put together the information they needed to apply or to find it easy to get help when needed. They were also less likely to provide high ratings on nearly all aspects of effectiveness, to feel it was clear what would happen next and when, that they needed to explain their situation only once, for the helpfulness of in-person reps and confidence any issues or problems would have been easily resolved. EI clients provided higher ratings for being able to complete steps online made the process easier.
OAS/GIS clients were less likely to understand information about the program, to feel it was easy to find out what information they need to apply, to gather the information required, complete the application form and to get help when needed. They were also less likely to provide high ratings on nearly all aspects of ease, to feel they were provided service in a way that protected them during the pandemic, were able to move smoothly through all steps, that it was easy to get help when needed, that in-person reps were helpful, to have confidence any issues or problems would have been easily resolved, were provided service in their choice of English or French and to have confidence their personal information was protected
CPP clients were less likely feel it was easy to get help on their application when needed, that being able to complete steps online made the process easier, to feel they were provided service in a way that protected them during the pandemic, were provided service in their choice of English or French and to have confidence their personal information was protected. CPP clients were more likely to feel the timeliness was service was reasonable and that it was easy to follow-up.
As observed since the baseline wave, CPP-D clients experienced the most difficulty during the service experience.
CPP-D clients continued to provide much lower ratings across nearly all service attributes. The lowest rated service attributes included being able to complete steps online made the process easier, ease of figuring out eligibility, ease of understanding information about the program, timeliness of service and ease of follow-up.
The CPP-D service experience was rated highest for the helpfulness of Service Canada in-person, 1 800 O-Canada and specialized call centre staff and for confidence in protection of personal information.
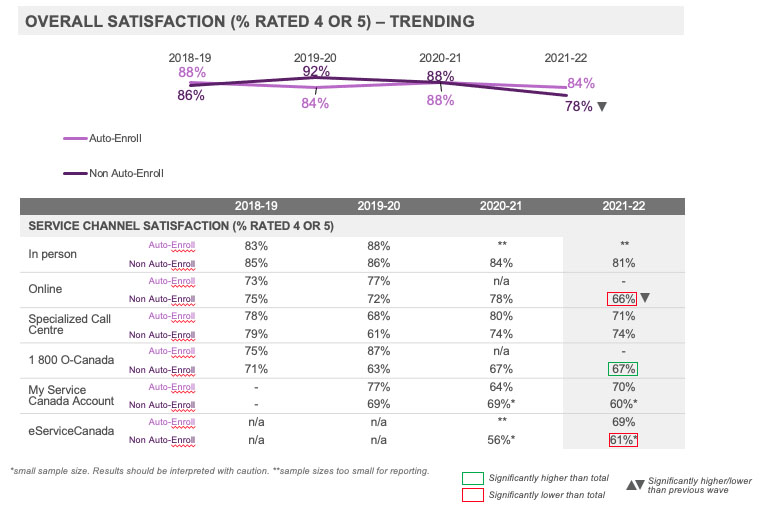
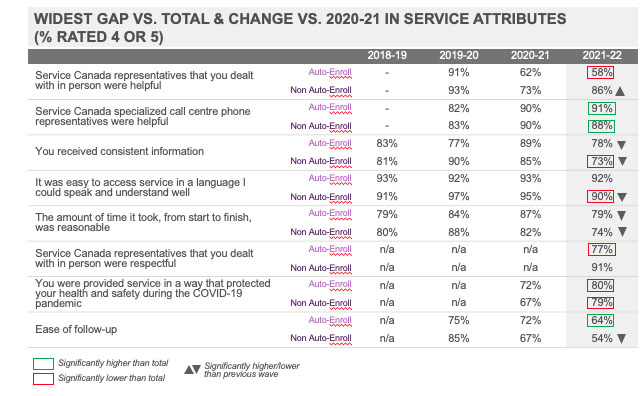
Among OAS/GIS clients, satisfaction was statistically consistent among Auto-Enroll and Non Auto-Enroll clients but directionally higher among Auto-Enroll. Non Auto-Enroll clients were less satisfied year over year contributing to the overall decline observed for the program.
Overall satisfaction was consistent among Auto-Enroll and Non Auto-Enroll clients compared to all clients. Compared to 2020-21, satisfaction has decreased among Non Auto-Enroll clients continuing the downward trend first observed in the CX4 Survey.
Non Auto-Enroll clients provided lower ratings for online and eServiceCanada and higher ratings for 1 800 O-Canada, as compared to all clients. Compared to 2020-21, Non Auto-Enroll clients provided lower ratings for the service provided online.
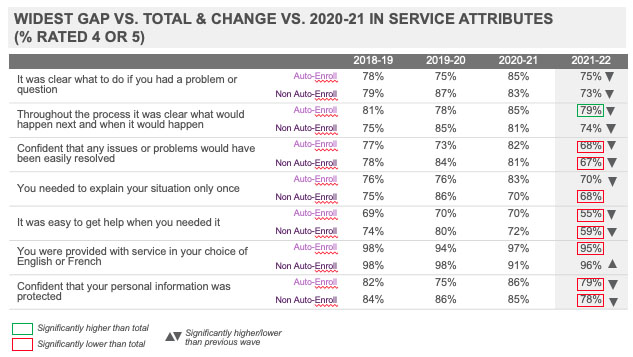
Consistent with overall program results, ratings were lower across a number of service attributes for both Auto-Enroll and Non Auto-Enroll clients compared to all clients. There were also some areas where ratings were higher or lower compared to all clients for one group but not the other. Non-Auto Enroll clients also provided lower ratings compared to all clients for needing to explain their situation only once, receiving consistent information and access to service in a language they would understand well. Auto-Enroll clients provided higher ratings compared to all clients for clarity of process and the ease of follow-up and lower ratings for the provision of service in their choice of official language and the helpfulness of in-person staff.
Compared to 2020-21, both Auto-Enroll and Non-Auto Enroll clients provided lower ratings for clarity of and confidence in the issue resolution process, clarity of process overall, ease of getting help when needed, confidence their personal information was protected, receiving consistent information and timeliness of service. Auto-Enroll clients also provided lower ratings for needing to explain their situation only once, while Non-Auto Enroll clients also provided lower ratings for access to service in a language they would understand well and ease of follow-up. Non Auto-Enroll clients provided higher ratings for the helpfulness of in person reps and provision of service in their choice of official language
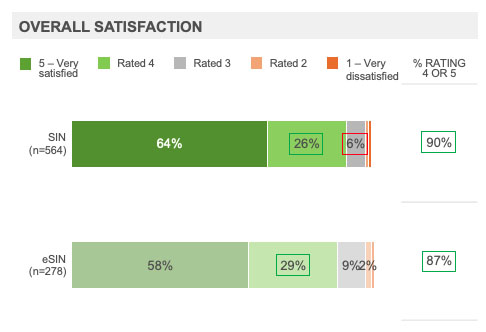
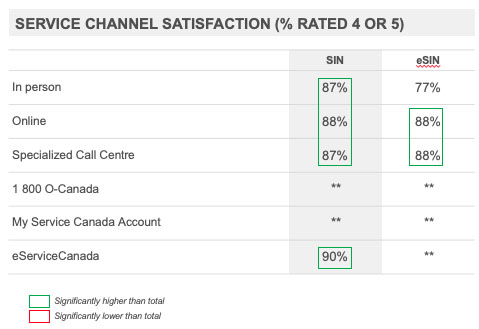
SIN and eSIN clients were equally as satisfied with their experience and, consistent with overall results for the program, SIN and eSIN clients were more satisfied compared to all clients.
Overall satisfaction was consistent between SIN and eSIN clients and higher compared to all clients.
Both SIN and eSIN clients provided higher ratings for the quality of service provided online and through specialized call centres. SIN clients also provided higher ratings for in-person service and eServiceCanada.
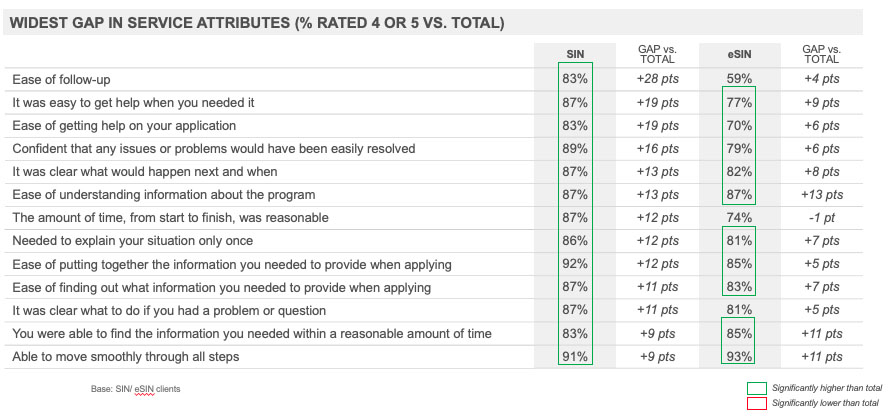
Consistent with overall results for the program, SIN and eSIN clients provided higher ratings across several service attributes compared to all clients. SIN clients provided notably higher ratings across most service attributes and also provided higher ratings for the ease of follow-up, timeliness of service and clarity of the issue resolution process. The largest gaps among eSIN clients were for ease of follow-up, ease of getting help when needed and on their application and confidence in issue resolution. The largest gaps among eSIN clients were for the ease of understanding information about the program, being able to find the information they needed when learning about the program in a reasonable amount of time and being able to move smoothly through all steps.
Executive Summary: Change in Service Experience by Program
EI clients were less satisfied with a number of aspects of ease and effectiveness year over year.
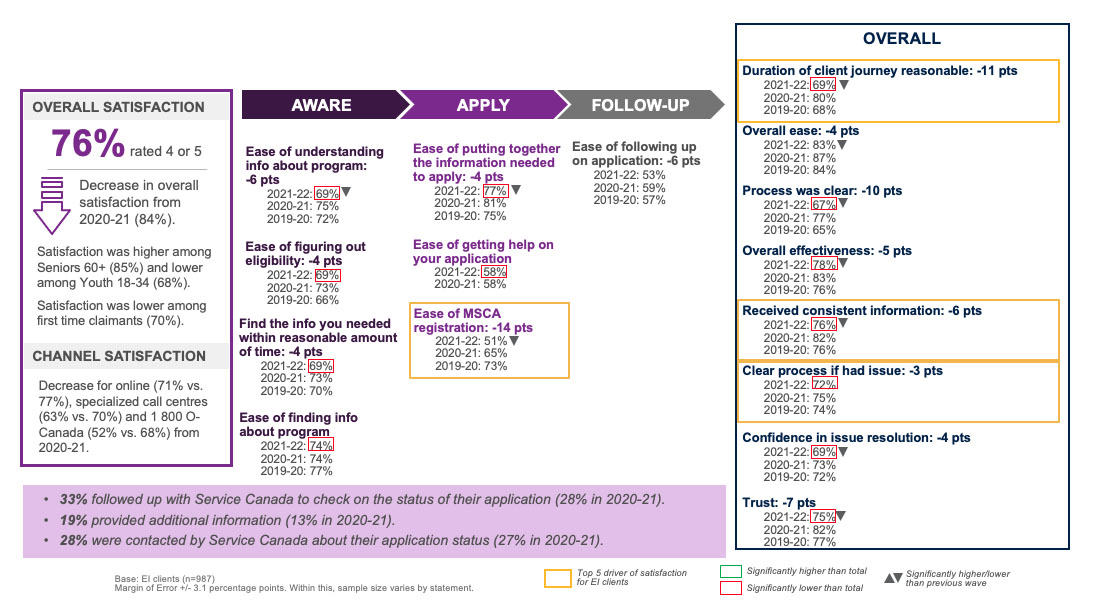
Compared to 2020-21, EI clients were less likely to express trust (75% vs. 82%) and to provide high ratings for the ease of understanding information about the program (69% vs. 75%), ease of gathering the information required (77% vs. 81%), it was clear what would happen next and when (67% vs. 77%), overall it was easy to apply (83% vs. 87%), being able to move smoothly through all steps (73% vs. 78%), receiving consistent information (76% vs. 82%), timeliness of service (69% vs. 80%) and confidence in issue resolution (69% vs. 73%).
OAS/GIS clients were less satisfied with several aspects of service year over year including most measures related to the ease and effectiveness of the process.
Compared to 2020-21, OAS/GIS clients were less likely to express trust (70% vs. 82%) and to provide high ratings for the ease of understanding information about the program (67% vs. 84%), ease of understanding the requirements of the application (79% vs. 85%), getting help on their application when needed (54% vs. 61%), overall ease of applying (80% vs. 88%), it was clear what would happen next and when (77% vs. 83%), needing to explain their situation only once (69% vs. 78%), able to move smoothly through all steps (78% vs. 87%), received consistent information (76% vs. 87%), timeliness of service (77% vs. 85%), it was clear what to do if you had a problem or question (74% vs. 84%), ease of getting help in general (57% vs. 71%), confidence in issue resolution (68% vs. 82%), confidence their personal information was protected (78% vs. 85%) and ease of follow-up (59% vs. 70%).
CPP clients expressed lower trust in Service Canada than last year but provided generally consistent ratings across most aspects of service except for a few select measures of ease.
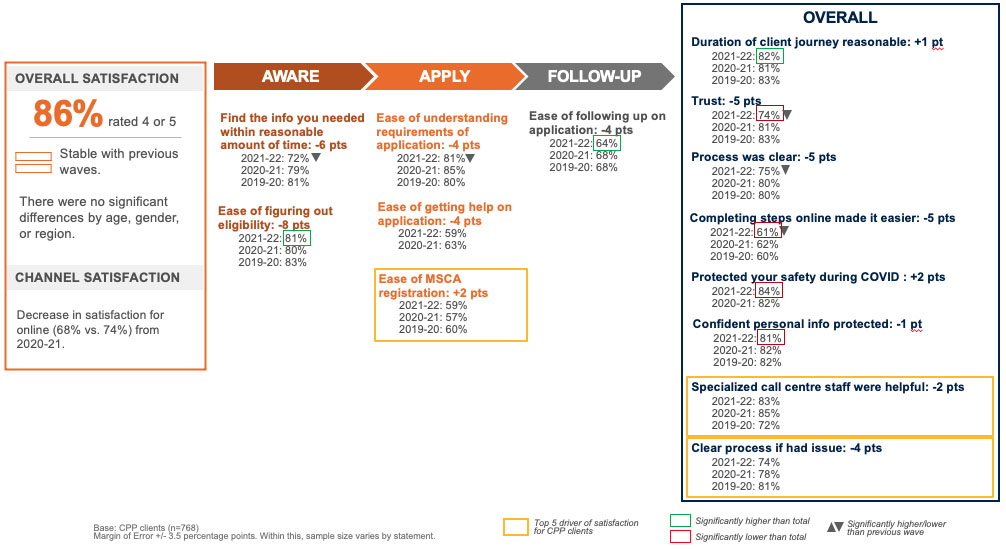
Compared to 2020-21, CPP clients were less likely to express trust (74% vs. 81%) and to provide high ratings for being able to find the information they needed when learning about the program in a reasonable amount of time ( 72% vs. 79%), the ease of understanding the requirements of the application (81% vs. 85%), and that it was clear what would happen next and when (75% vs. 80%).
CPP-D clients were less satisfied year over year with the timeliness of service and for the ease of finding and understanding information about the program on the Government of Canada website.
Compared to 2020-21, CPP-D clients were less likely to express trust (61% vs. 67%) and to provide high ratings for the ease of understanding information about the program (48% vs. 60%), finding information about the program (55% vs. 63%), finding out what information they need to apply (54% vs. 62%), and timeliness of service (48% vs. 57%).
CPP-D clients provided higher ratings for the ease of accessing service in a language they could speak and understand well (92% vs. 85%), being provided service in a way that protected them during the pandemic (81% vs. 75%) and the helpfulness of 1 800 O-Canada reps (81% vs. 67%).
SIN clients were less satisfied with certain aspects of service such as completing the application, clarity of process, helpfulness of Service Canada staff and reasonableness of the distance travelled to access service.
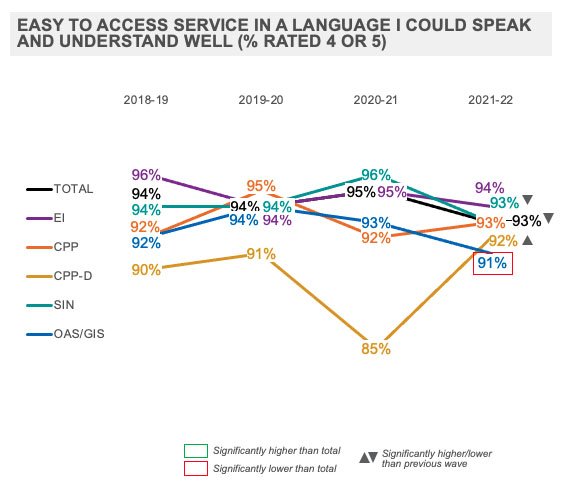
Compared to 2020-21, SIN clients provided lower ratings for being able to complete the application in a reasonable amount of time (84% vs. 88%), it was clear what would happen next and when (84% vs. 88%), it was easy to access service in a language they could speak and understand well (93% vs. 96%), the helpfulness of in-person (92% vs. 95%) and eServiceCanada reps (78% vs. 89%) and for travelling a reasonable distance to access service (73% vs. 83%).
SIN clients provided higher ratings for being provided service in their choice of English or French (96% vs. 98%).
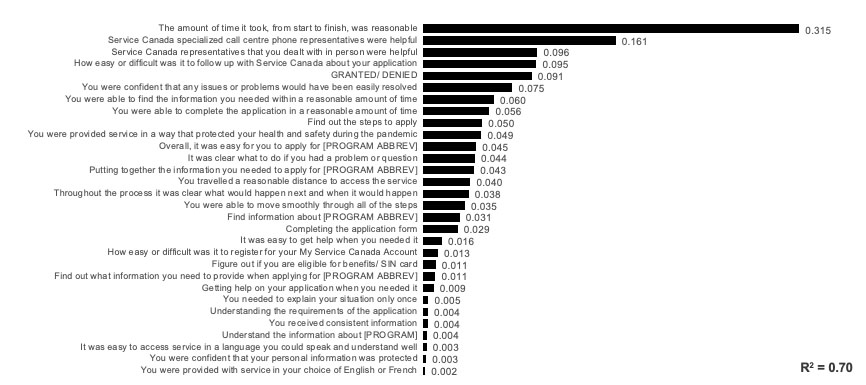
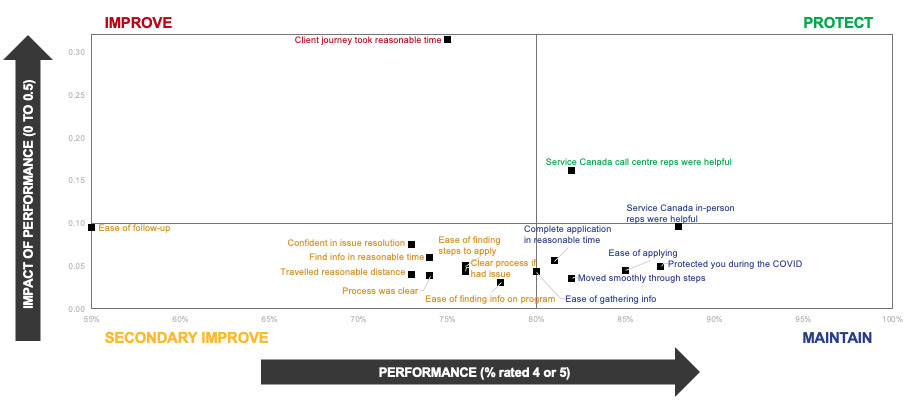
Executive Summary: Overall Drivers of Satisfaction
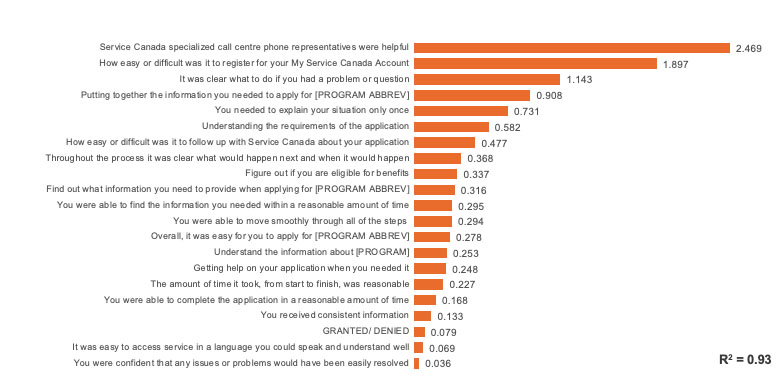
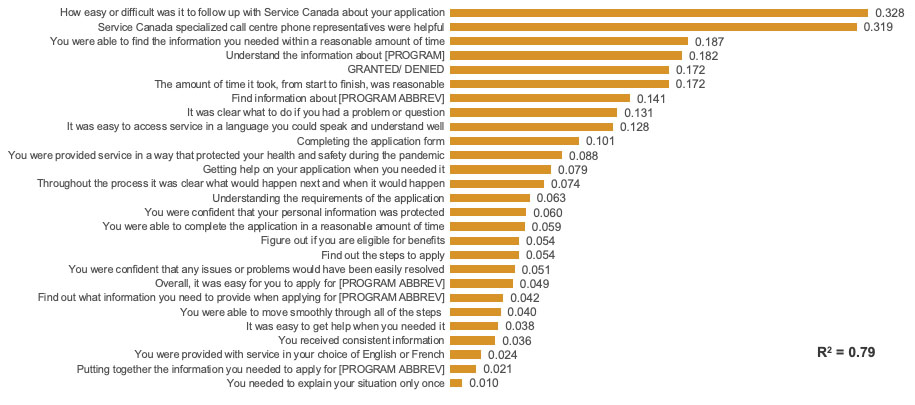
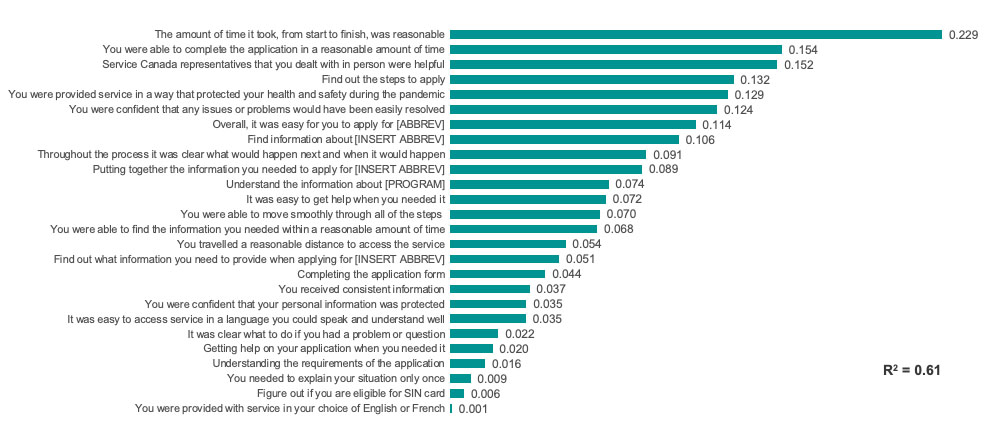
Key drivers of satisfaction represent the aspects of service which have the greatest impact on the clients’ overall impressions of their experience. The most important driver of satisfaction was the amount of time it took from start and to finish was reasonable. Prominent secondary drivers included the helpfulness of Service Canada specialized call centre reps, followed by the helpfulness of in-person reps, the ease of follow-up and whether the application was approved or denied.
Performance on all top drivers has declined since last year, while the proportion of EI and CPP-D clients who had their application approved was also lower than previous year.
To improve the service experience for Service Canada clientele as a whole focus should be placed primarily on improving the timeliness of service. Areas of secondary importance for improvement included the ease of follow-up and to a lesser extent confidence in the issue resolution process.
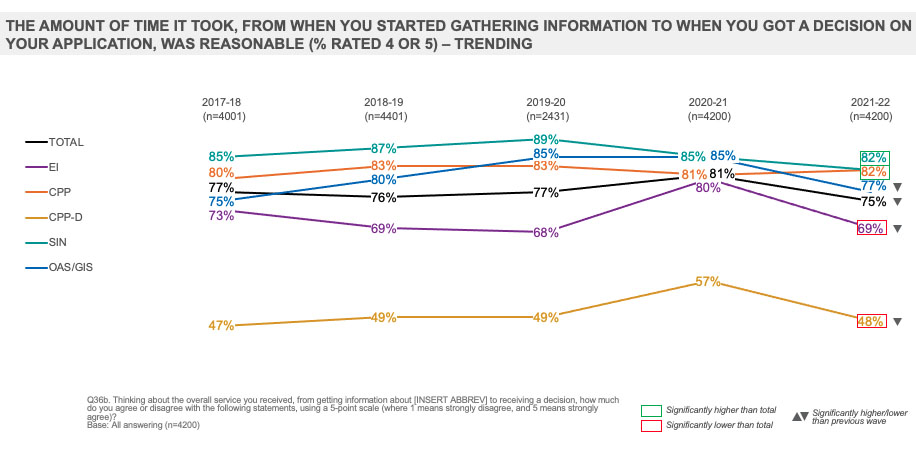
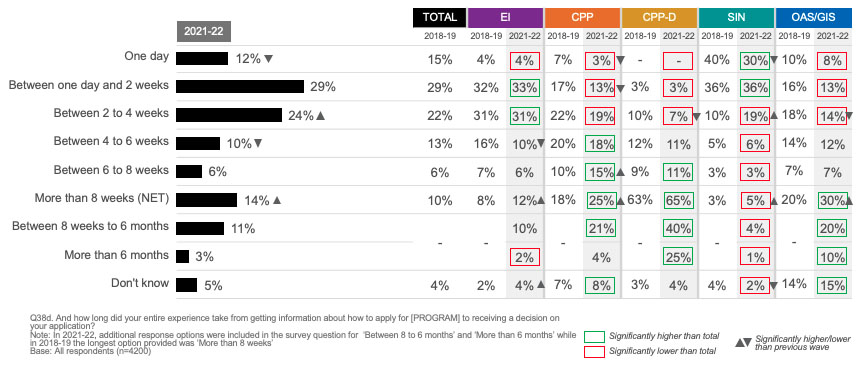
Three-quarters (75%) of clients found the timeliness of service reasonable, lower than in 2020-21 (81%) and consistent with levels observed in 2019-20 and earlier. Most clients (65%) reported that their client journey took 4 weeks or less- of which three in ten (29%) said it took between one day to 2 weeks, one quarter (24%) between 2 to 4 weeks and one in ten (12%) who took one day. Roughly one in ten reported their client journey took between 8 weeks to 6 months (11%), between 4 to 6 weeks (10%) or between 6 to 8 weeks (6%).
The timeliness of service took on increased importance this year and became the clear top driver of satisfaction. The helpfulness of in-person representatives, whether the application was approved or denied and confidence in the issue resolution process also took on increased importance in driving satisfaction. The helpfulness of call centre representatives remained among the most prominent drivers but was less impactful than last year.
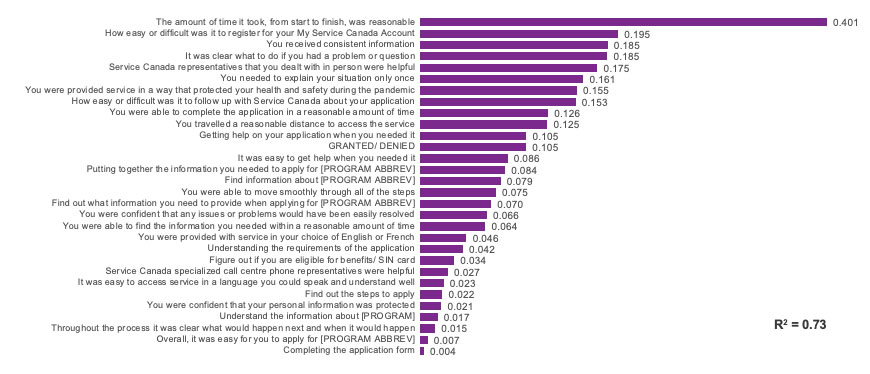
Executive Summary: Drivers of Satisfaction by Program
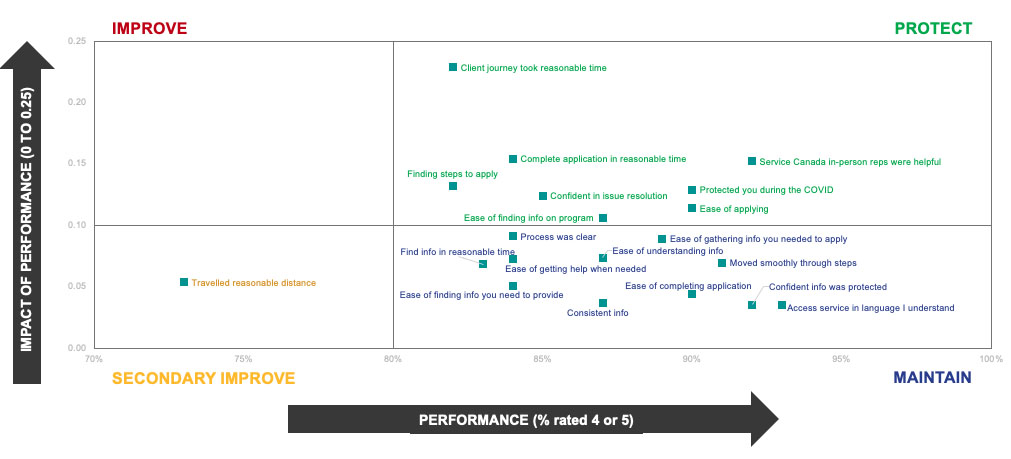
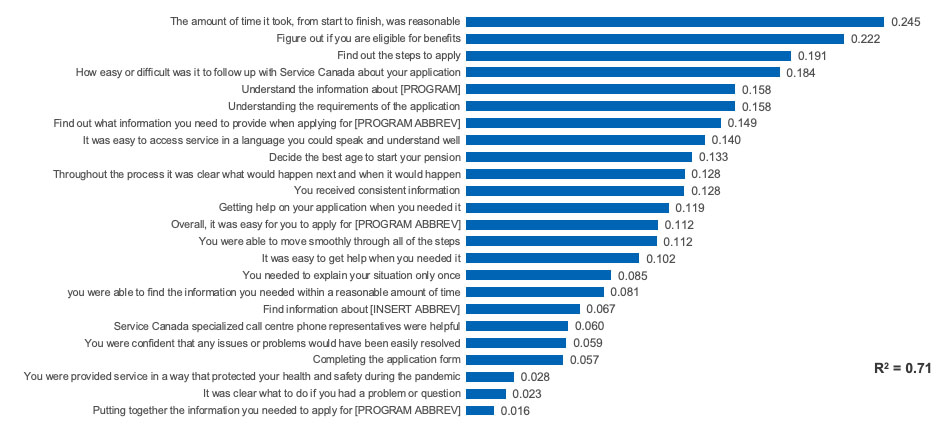
Drivers of satisfaction continue to differ significantly by program. The most common and consistent top driver was timeliness of service for all programs except CPP. The helpfulness of call centre representatives was also among the most prominent drivers for CPP and CPP-D clients and the helpfulness of in-person representatives for SIN and EI clients.
Current areas that were performing strongly and were correlated to satisfaction include the helpfulness of Service Canada call centre phone representatives for CPP and OAS/GIS clients and the helpfulness of in-person representative for SIN and EI clients. Performance in these areas should be maintained in order to maintain/ build satisfaction given the stronger impact they have on impressions of the overall client experience.
The greatest opportunities to improve service across programs which represent areas strongly correlated to satisfaction where performance was lower to other areas differ significantly by program.
For all programs except SIN, it will be important to improve the ease of follow-up.
For EI and OAS/GIS clients, it will also be important to improve the timeliness of service.
For EI clients, it will also be important to improve the ease of registering for MSCA and the ease of getting help on the application.
For OAS/GIS, clients it will also be important to improve the ease of figuring out eligibility and the ease of finding out the steps to apply.
For CPP clients, it will also be important to improve the ease of registering for MSCA, clarity of the issue resolution process and for clients to have to explain their situation to SC staff only once.
For CPP-D clients, it will also be important to improve the helpfulness of call centre representatives.
For SIN clients, it will be important to reduce the distance clients must travel to access service and improve the ease of getting help on their application.
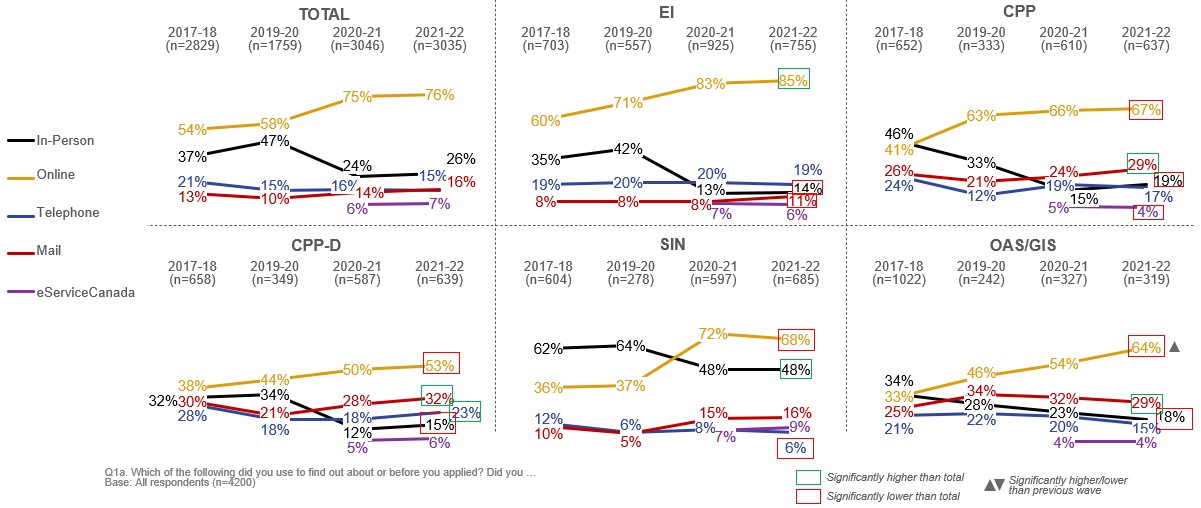
Executive Summary: Change in Channel Use
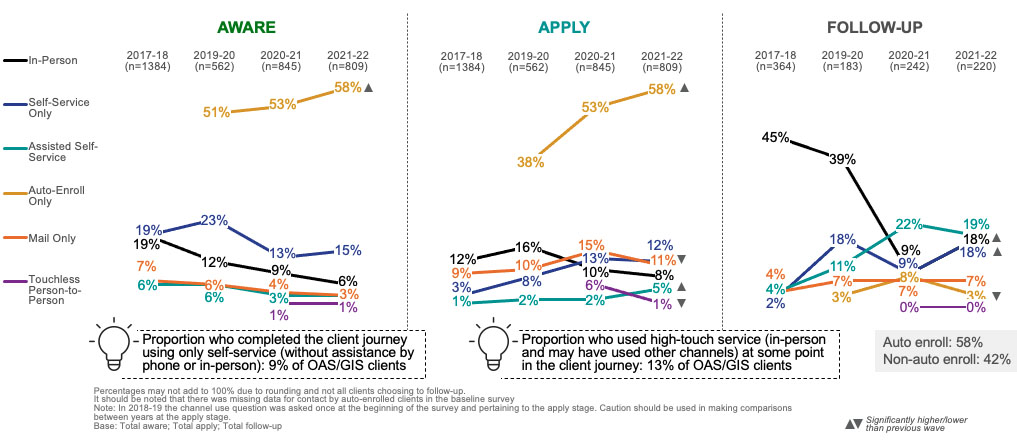
The CX5 Survey is the second iteration of the annual CX Survey to be conducted during the COVID-19 pandemic. Overall, channel use among clients was generally consistent with 2020-21 levels, also within the pandemic period. Clients were more likely to utilize in-person service or assisted self-service during the entire client journey, while fewer used self-service only. Use of in-person service remained considerably lower than in 2019-20 or earlier but was utilized slightly more than self-service only this year.
The largest proportion of clients used in-person service (33%) at some point, followed closely by those who used self-service online only (31%), while around one in ten used assisted self-service (15%). Fewer used touchless person-to-person (6%), were auto-enrolled and did not contact Service Canada (5%) or accessed service by mail only (1%).
Clients were more likely to have used in-person service at the apply and follow-up stages than in 2020-21. Compared to the previous wave, clients were more likely to have used assisted self-service at the apply stage and less likely to have used self-service only. Fewer clients used touchless person-to-person service at the follow-up stage.
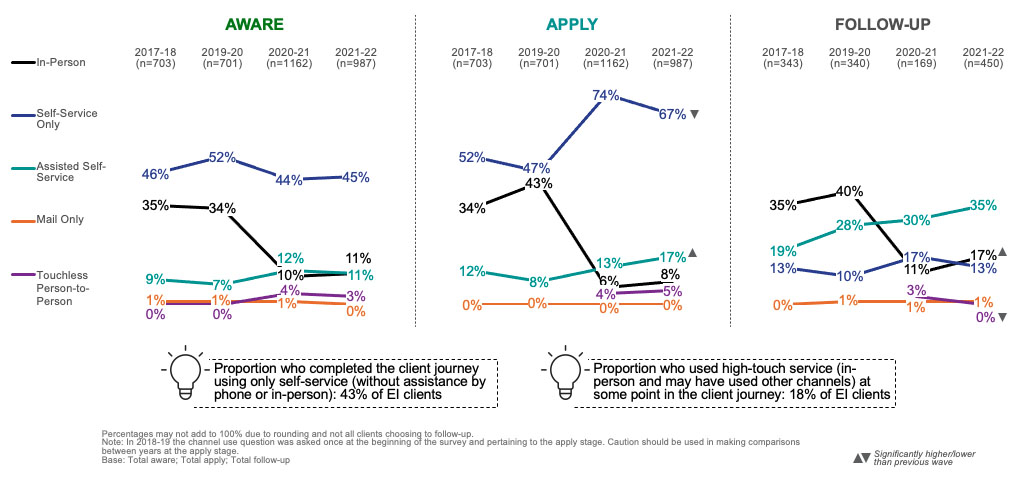
EI clients were more likely to have used assisted self-service at the apply stage and less likely to have used self-service only. EI clients were also more likely to have used in-person service at the follow-up stage and less likely to have used touchless person-to-person service.
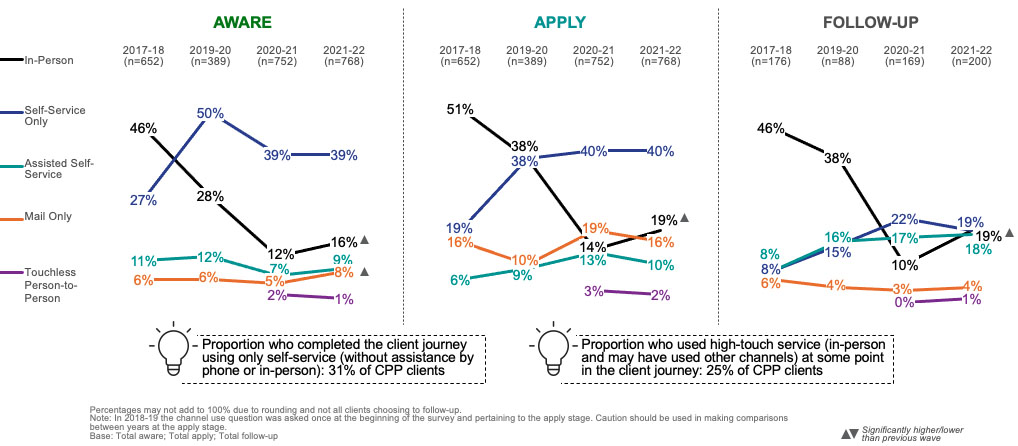
CPP clients were more likely to have used in-person service at all stages of the client journey and were also more likely to have used mail only at the aware stage.
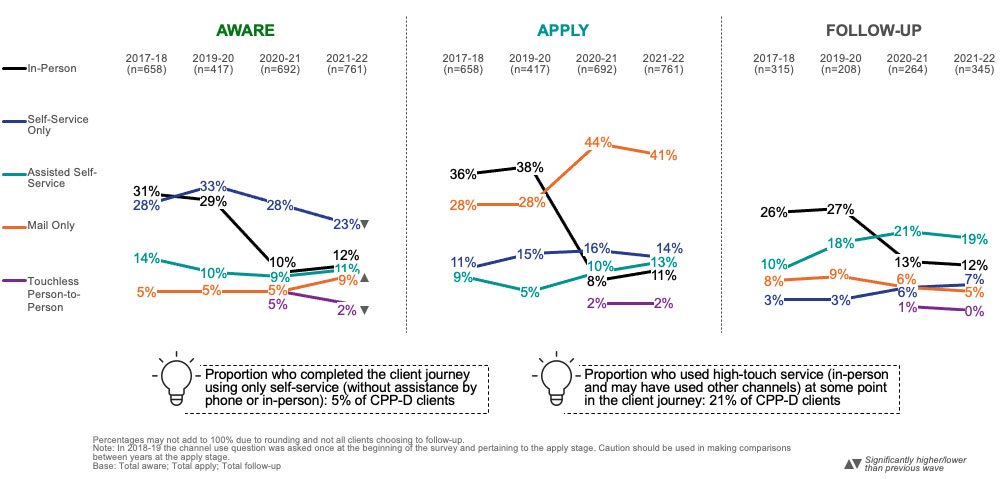
CPP-D clients were more likely to have used mail only at the aware stage and less likely to have used self-service only or touchless person-to-person. Service levels at the apply and follow-up stages remained consistent with 2020-21.
OAS/GIS clients were more likely to be auto-enrolled this year which meant more OAS/GIS clients overall did not engage in the aware or apply stages. OAS/GIS clients were also more likely to have used assisted self-service at the apply stage and less likely to have used mail only or touchless person-to-person, while use of in-person and self-service only increased at the follow-up stage.
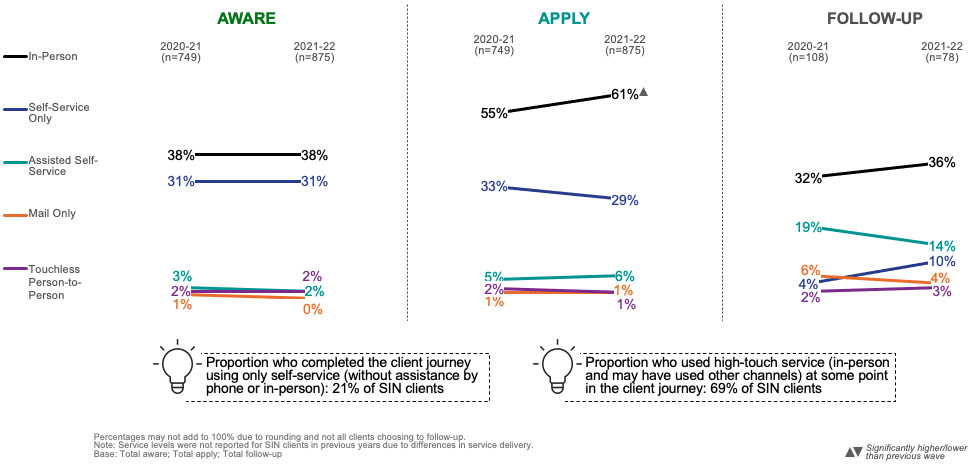
SIN clients were more likely to have utilized in-person at the apply stage.
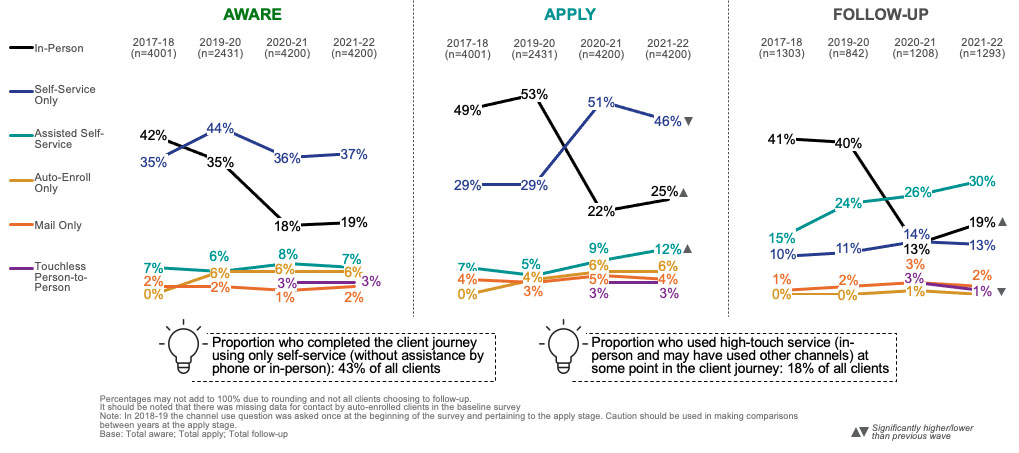
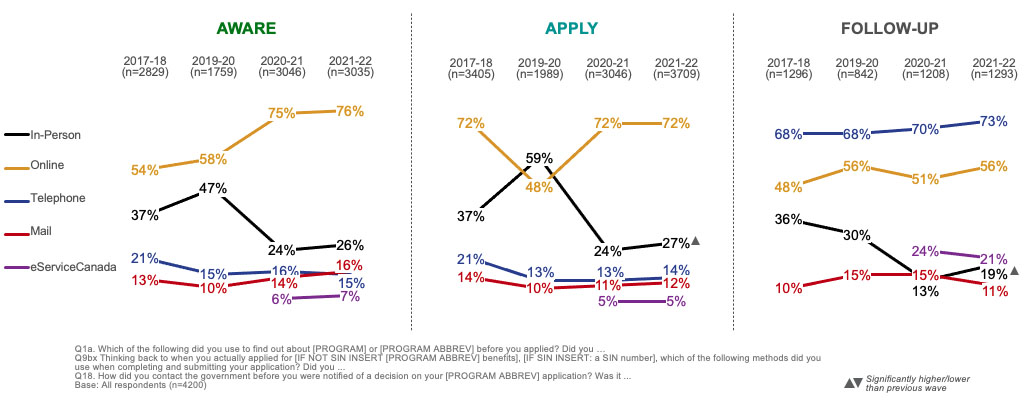
Executive Summary: Channel Use by Stage
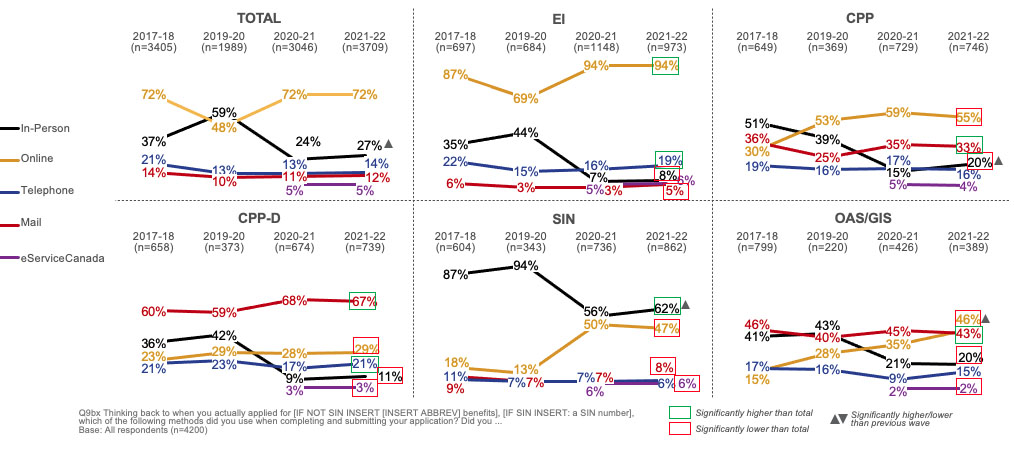
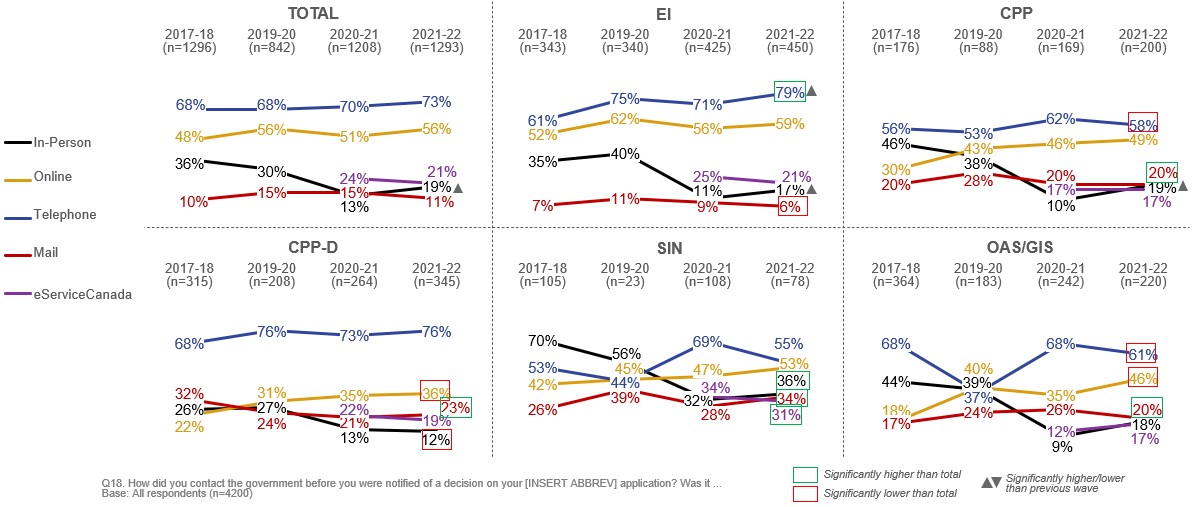
Channel use remained very consistent across all stages of the client journey. Online continued to be the most commonly used channel at the aware and apply stages and telephone at the follow-up stage. Use of the in-person channel increased at the apply and follow-up stages but stayed generally in line with the lower usage observed last year compared to 2019-20 or earlier.
During the aware stage, clients continued to be most likely to use online government sources (76%) followed by in-person service (26%). Fewer than two in ten clients used mail (16%), telephone (15%) or eServiceCanada (7%). Use of all channels remained consistent with last year.
During the apply stage, clients were most likely to use the online channel (72%), followed by in-person service (27%), telephone (14%), mail (12%) and eServiceCanada (5%). Use of in-person service increased compared to last year, while use of all other channels remained consistent.
Among clients who followed-up, telephone (73%) continued to be the most common channel, followed by online (56%). Two in ten (21%) used eServiceCanada or in-person (19%), while one in ten followed-up by mail (11%). Use of in-person service increased compared to last year, while use of all other channels remained consistent.
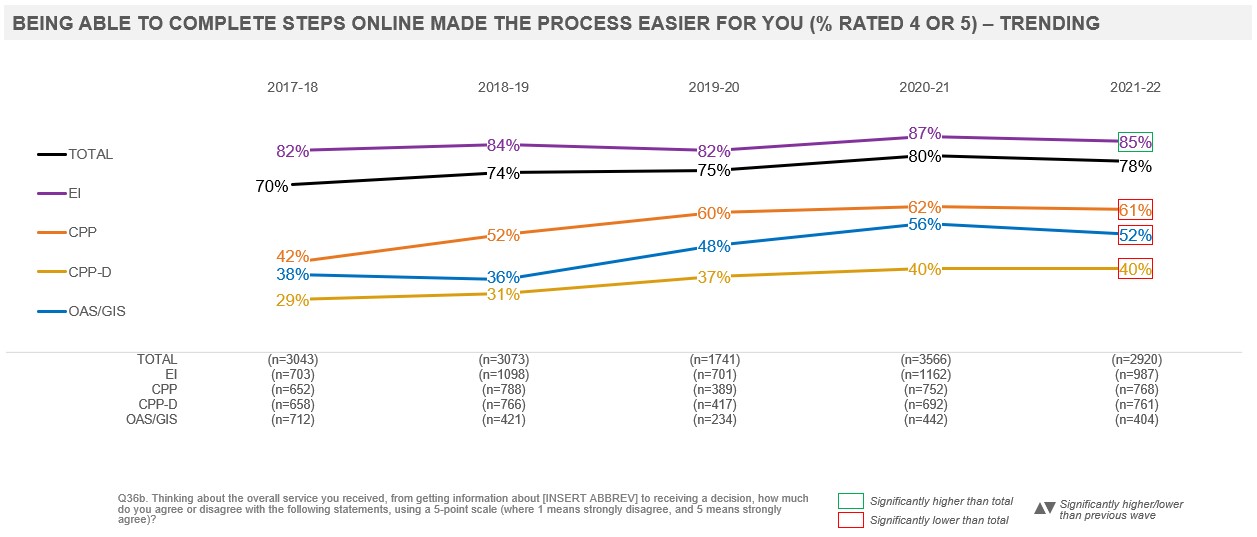
The vast majority of clients continued to feel that being able to complete steps online made the process easier, however CPP-D, CPP and OAS/GIS clients experienced more difficulty than clients in other programs.
Just under eight in ten (78%) clients agreed that being able to complete steps online made the process easier, consistent with last year.
EI clients were more likely to agree than all clients, while CPP, OAS/GIS and CPP-D clients were less likely.
Results were consistent with 2020-21.
Executive Summary: Number of Channels and Multi-Channel Use
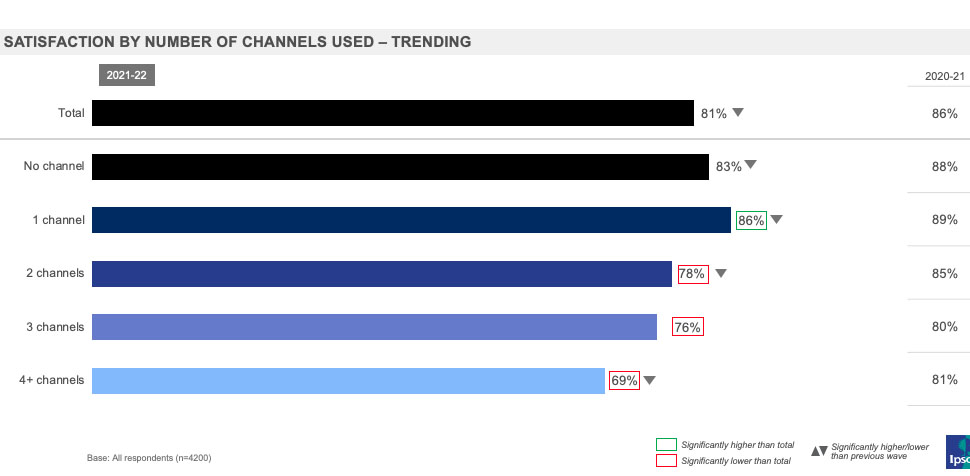
Consistent with previous years, satisfaction with the service experience declines with the number of channels clients contacted during the service experience and was notably higher among those who used one channel and lower among those who used two or more.
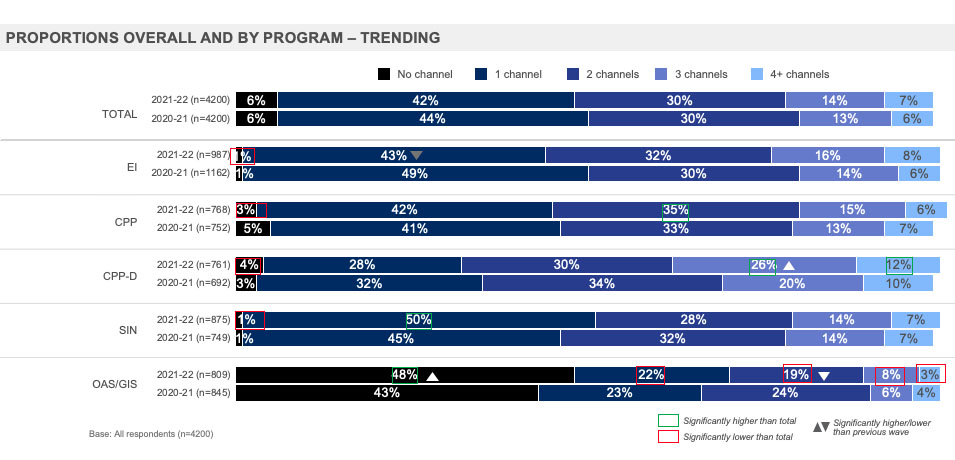
Overall, more than four in ten clients used one channel during their client journey, followed by three in ten who used two, just over one in ten who used three and less than one in ten who used four or more.
SIN clients were more likely to have used only one channel, OAS/GIS clients no channels while CPP-D were more likely to have three or more channels.
Compared to 2020-21, EI clients were less likely to have used one channel, while CPP-D clients were more likely to have used three channels and OAS/GIS clients no channels.
Clients who utilized two or more channels had lower overall satisfaction with their service experience compared to all clients, while those who used one channel had higher satisfaction.
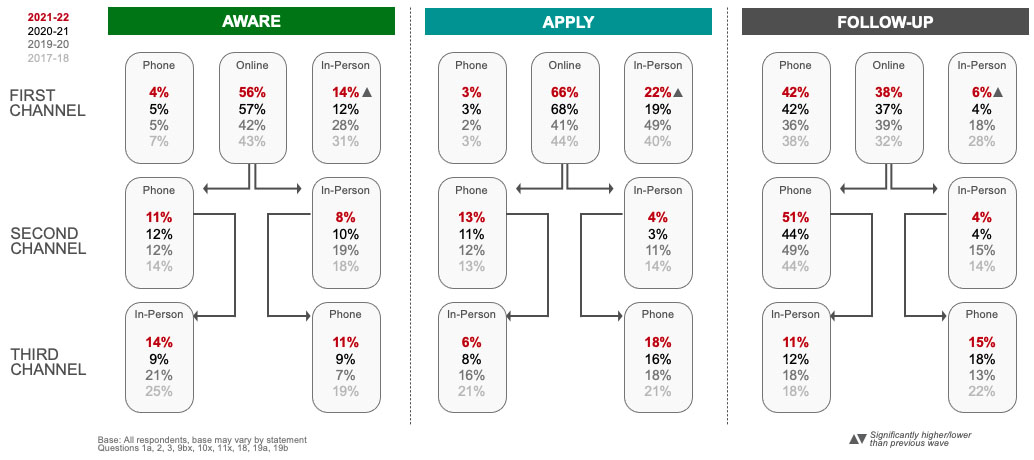
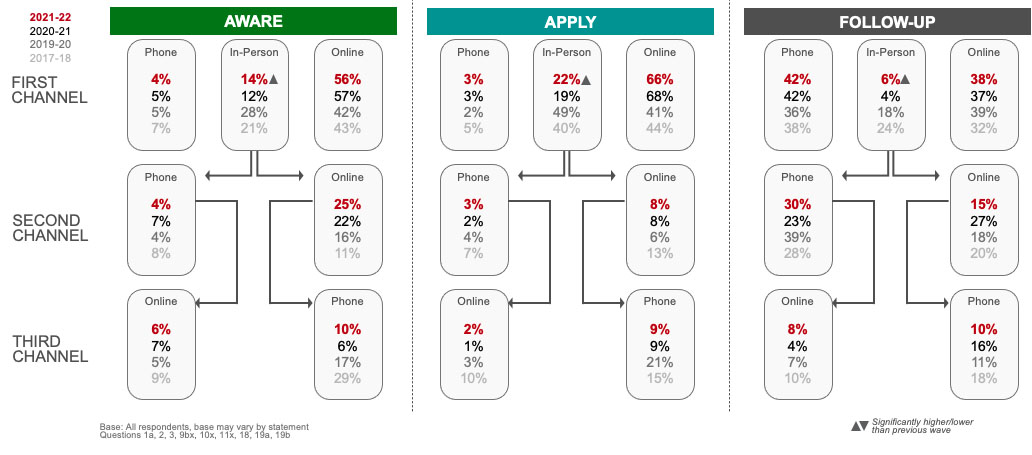
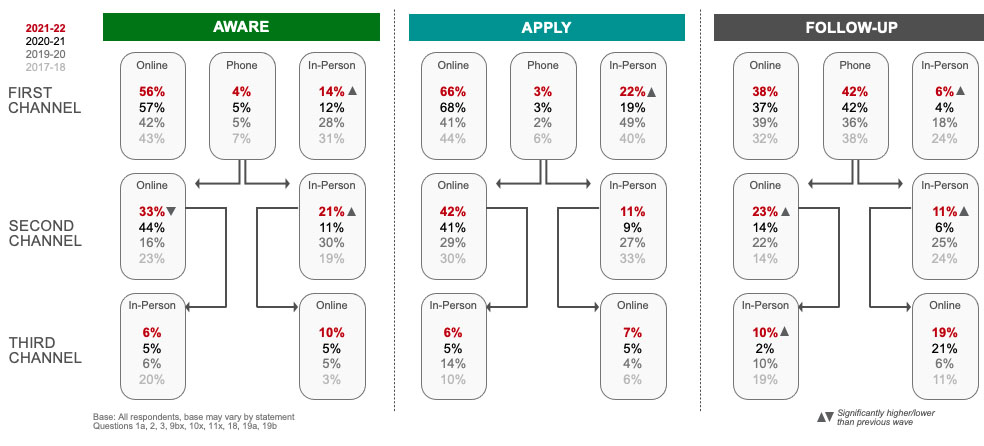
Most clients continued to use only one channel during the aware and apply stages of the client journey, while use of more than one channel is more common among those who followed-up before receiving a decision. Online remained the first point of contact for the majority of clients at the aware and apply phases while the telephone is slightly more used for following up than online. Use of in-person has increased as the first point of contact for all stages but remained lower than historic levels.
Clients who used online or in-person first at the aware and apply stages were less likely to use a second channel than those who used the telephone first. Clients were more likely to go online after beginning on the phone at all stages and more likely to go online after beginning in-person at the aware and apply stages but no more likely at the follow up stage.
Compared to 2020-21, use of in-person as the first point of contact increased across all stages, while use of online and telephone remained consistent. Among those who used telephone first at the aware and follow-up stages, clients were less likely to use online as a second channel and more likely at the follow-up stage while use of in-person increased as a second or third channel at the aware and follow-up stages.
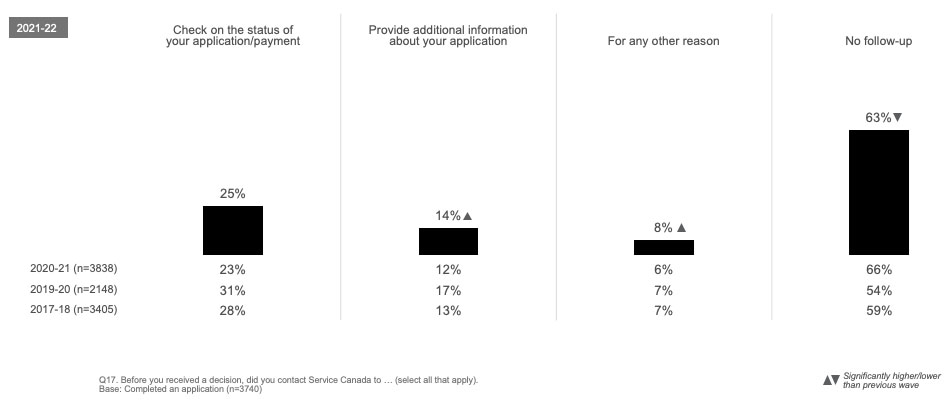
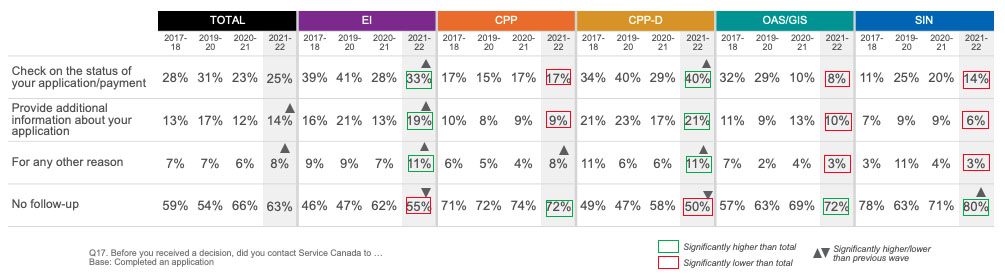
The portion of those who followed up before receiving a decision increased compared to last year. Among those who did, the primary reason was to check on the status of their application/payment, followed by to provide additional information.
EI and CPP-D clients were more likely to have followed-up compared to all clients, while CPP, OAS/GIS and SIN clients were less likely.
Compared to last wave, EI and CPP-D clients were more likely to have followed-up, while SIN clients were less likely.
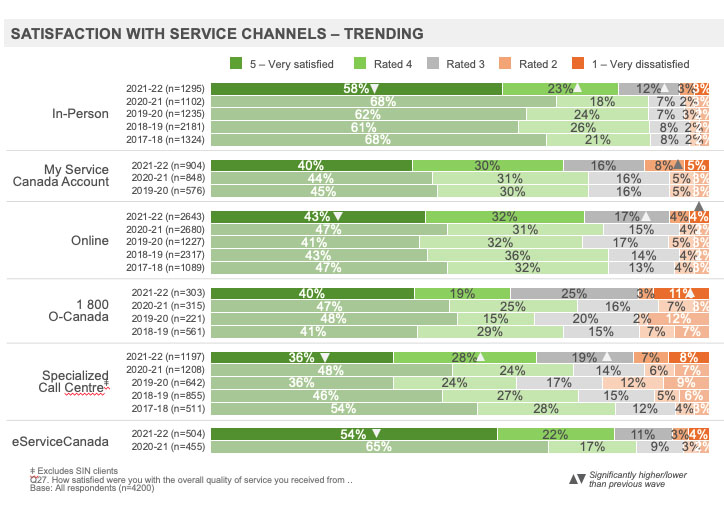
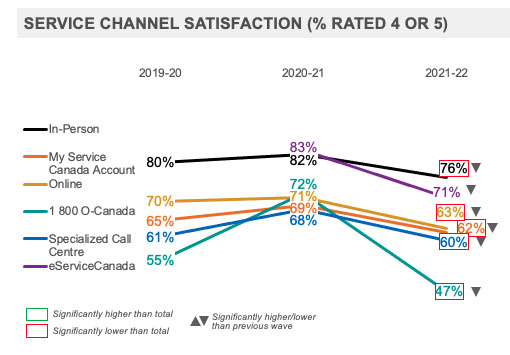
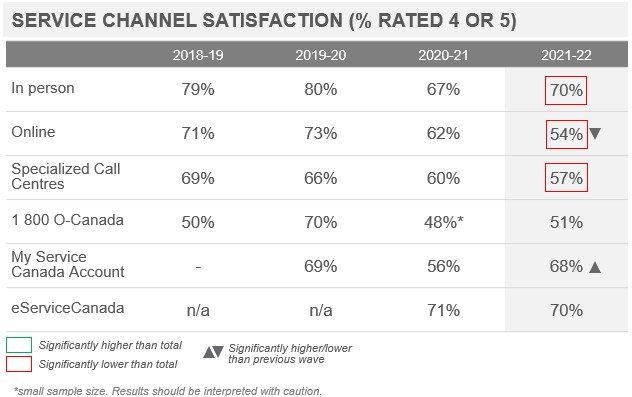
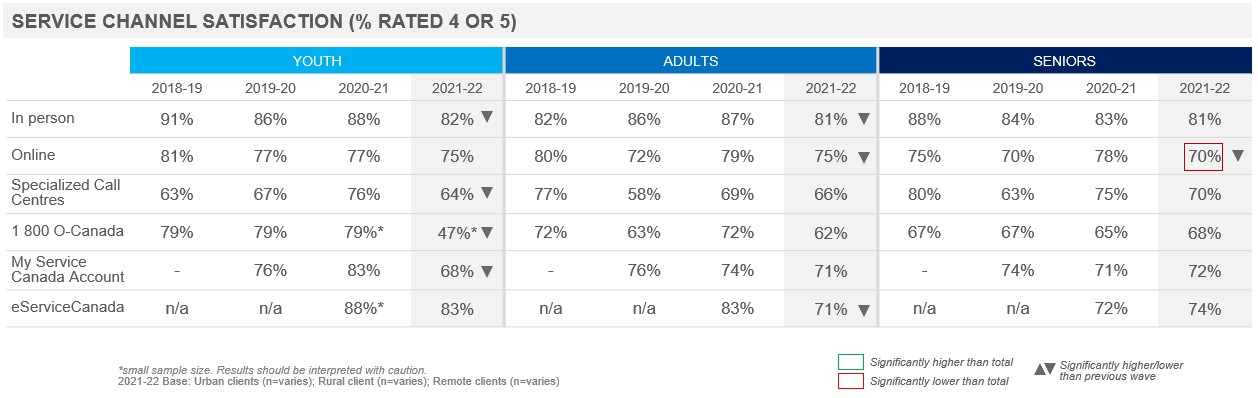
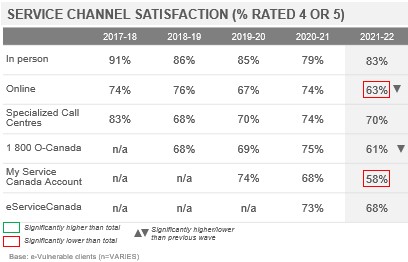
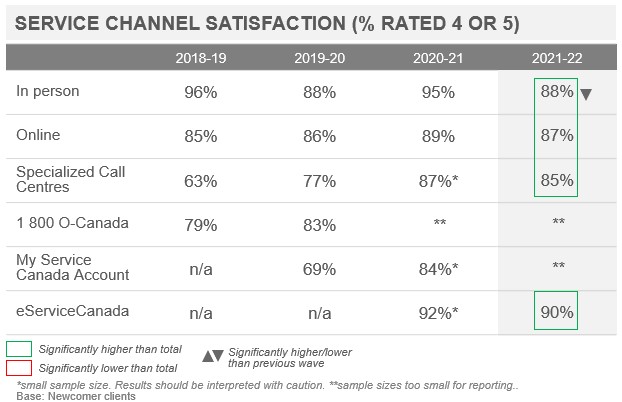
Executive Summary: Service Channel Assessment
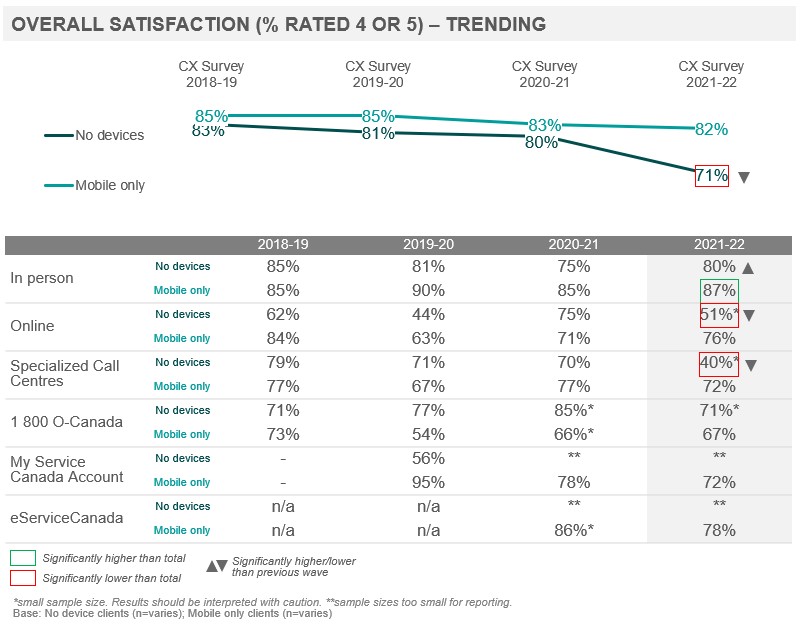
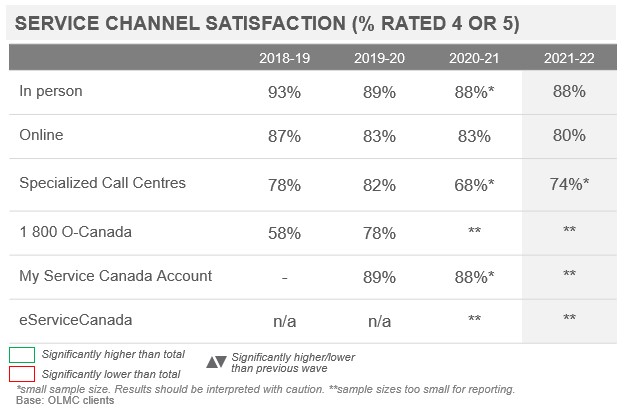
Satisfaction with the quality of service remained highest for the in-person experience and lowest for both telephone channels. Ratings have declined across all service channels, and since tracking began, are at the lowest levels observed for in-person, MSCA and 1 800 O-Canada.
Satisfaction with in-person service remained the highest (81%), followed by eServiceCanada (76%), online (74%), MSCA (70%), specialized call centres (64%) and 1 800 O-Canada (59%). Compared to 2020-21, satisfaction declined across all service channels and stands at historic lows for in-person, MSCA and 1 800 O-Canada. Satisfaction with online and specialized call centres returned to levels observed in 2019-20.
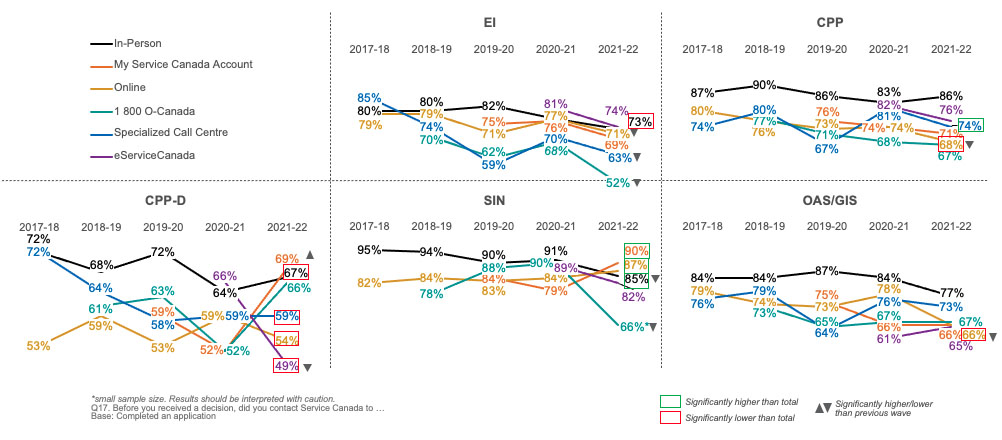
CPP-D clients rated their satisfaction with in-person service, specialized call centres, online, and eServiceCanada lower compared to all clients, while SIN clients provided higher ratings for in-person, online and MSCA. OAS/GIS and CPP clients rated their satisfaction with online service lower, while CPP clients rated their satisfaction with 1 800 O-Canada higher.
Compared to 2020-21, EI clients provided lower ratings for their satisfaction with online, specialized call centres and 1 800 O-Canada, CPP and OAS/GIS clients provided lower ratings for online and SIN clients for in-person and 1 800 O-Canada. CPP-D clients provided lower ratings for eServiceCanada and higher ratings for MSCA.
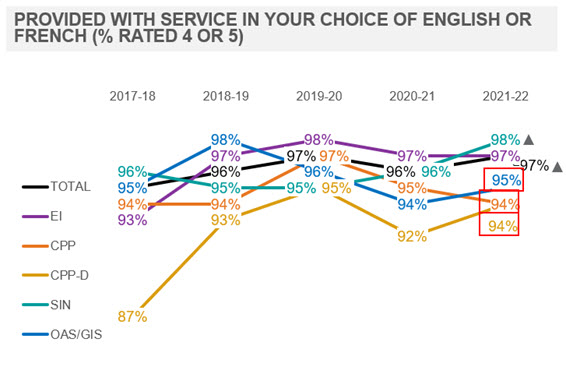
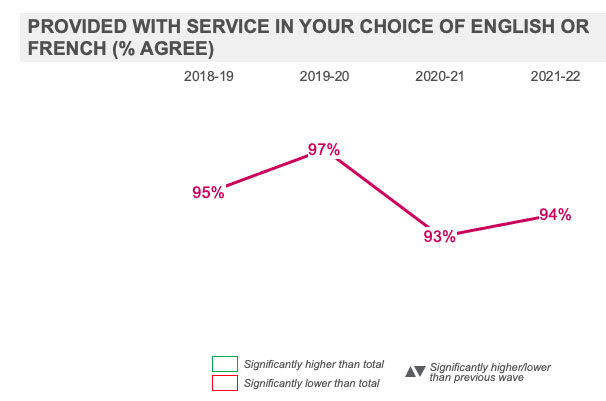
Virtually all clients agreed they were provided service in their choice of English or French (97%), while 93% felt it was easy to access service in a language they could speak and understand well.
Compared to 2020-21, more people agreed that they were provided service in their choice of English or French overall and among SIN clients in particular. Agreement has decreased for it being easy to access service in a language the client could speak and understand well overall and specifically among SIN clients, while CPP-D clients were more likely to agree.
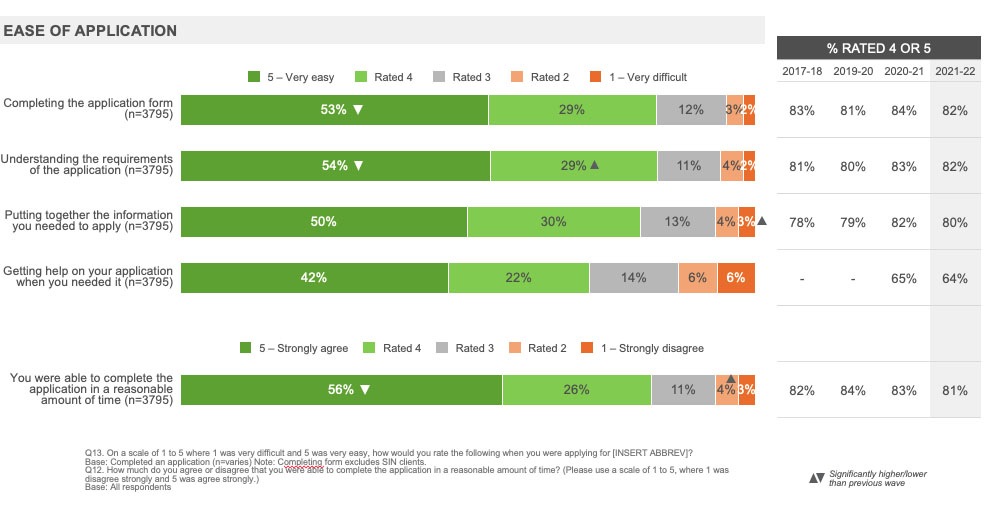
Self-service clients continued to provide high ratings for the ease of the online application process however getting assistance when they needed it continued to be an area where they experienced more difficulty.
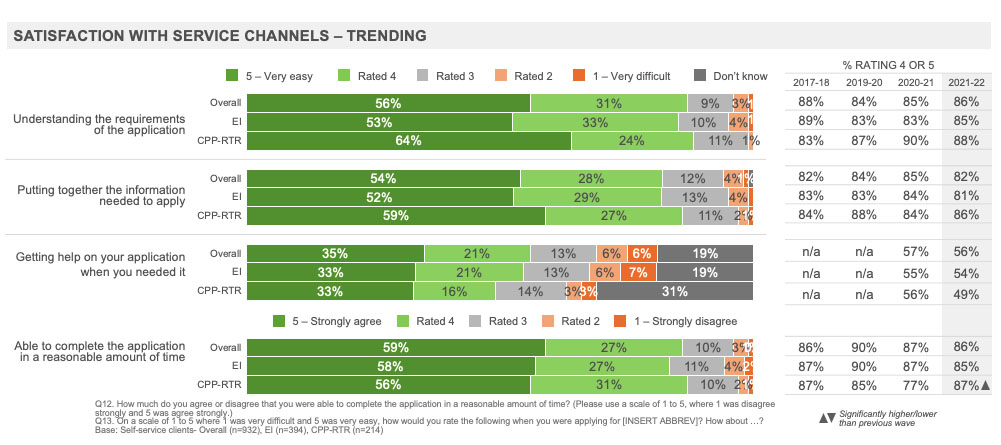
At more than eight in ten, the vast majority of self-serve clients found it easy to understand the requirements of the application, put together the information needed, and to complete the application in a reasonable amount of time. However, only 56% of self-serve clients found it easy to get help on their applications when they needed it.
Compared to 2020-21, CPP-Retirement (CPP-RTR) clients who used self-service were more likely to feel they were able to complete the application in a reasonable amount of time (87% vs. 77%).
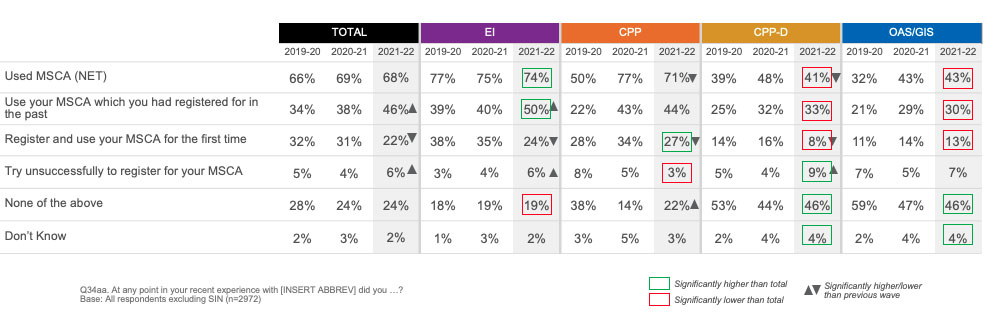
MSCA continued to be used by the vast majority of EI and CPP clients and four in ten CPP-D or OAS/GIS clients. CPP and CPP-D clients were less likely to have used MSCA than in previous years and notably, ease of registering has declined among EI clients. CPP-D clients found it more difficult to register and sign-in compared to all clients, while CPP clients found it more difficult to sign-in.
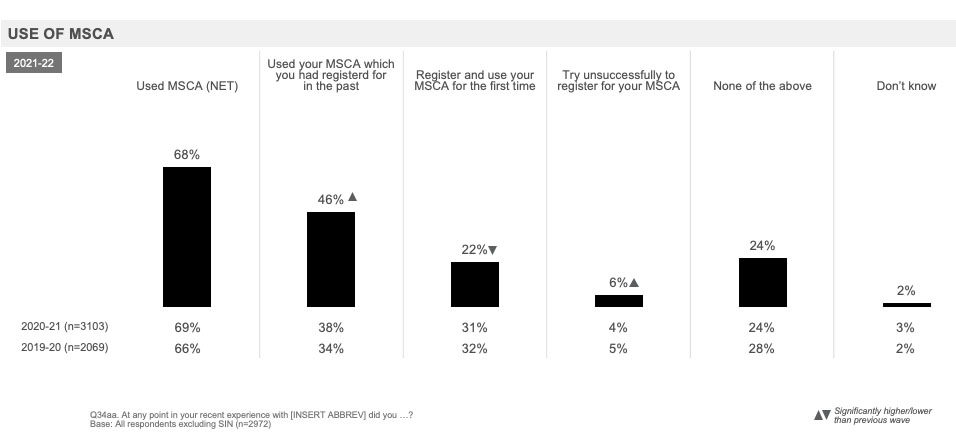
Seventy-four percent of EI clients, 71% of CPP clients, and around four in ten CPP-D and OAS/GIS clients used MSCA during their experience. Compared to 2020-21, fewer CPP (71% vs. 77%) and CPP-D clients (41% vs. 48%) used MSCA. EI clients were more likely to have used their MSCA which they had registered for in the past (50% vs. 40%), while a greater proportion of EI (6% vs. 4%) and CPP-D clients (9% vs. 4%) tried unsuccessfully to register.
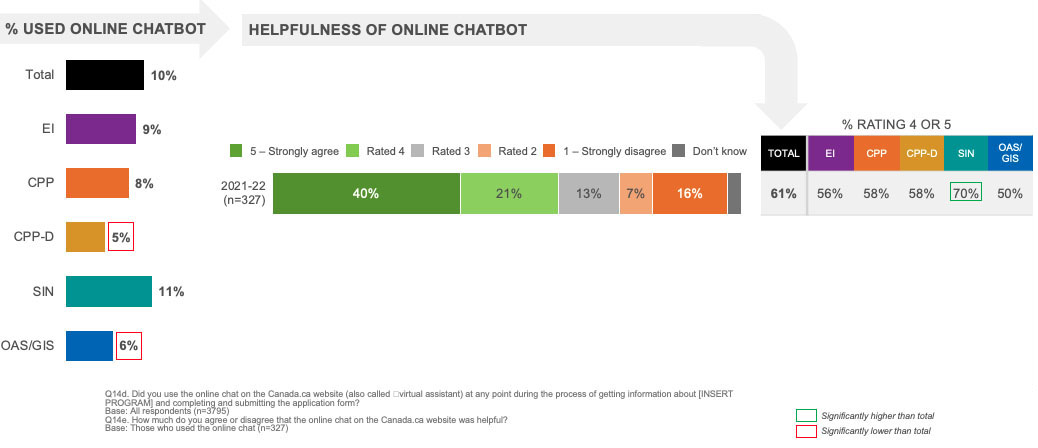
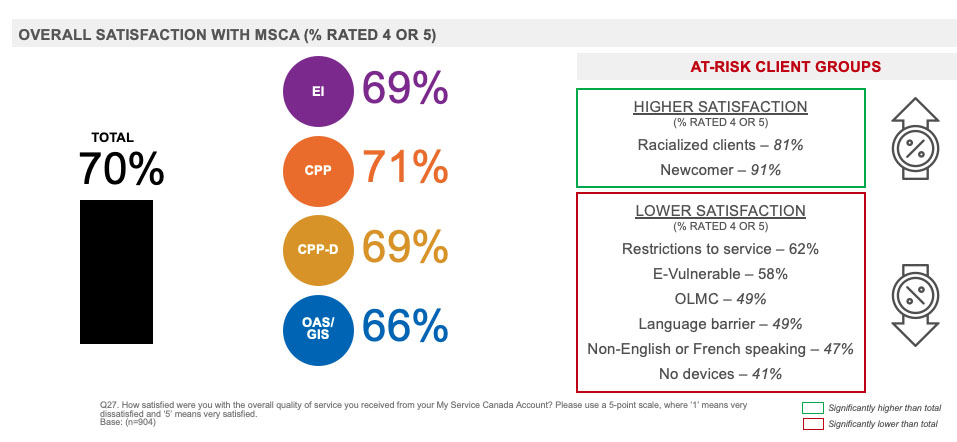
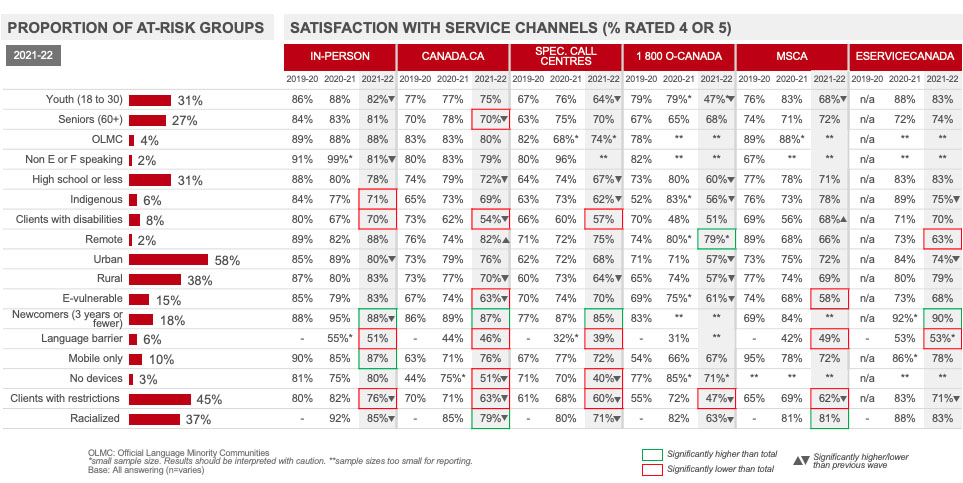
Seventy percent of clients who used MSCA said they were satisfied with the overall quality of service they received. Satisfaction was notably lower among clients who have restrictions (62%), those who are e-vulnerable (58%), OLMC (49%), those with a language barrier (49%), non-English or French speakers (47%), and those with no devices (41%).
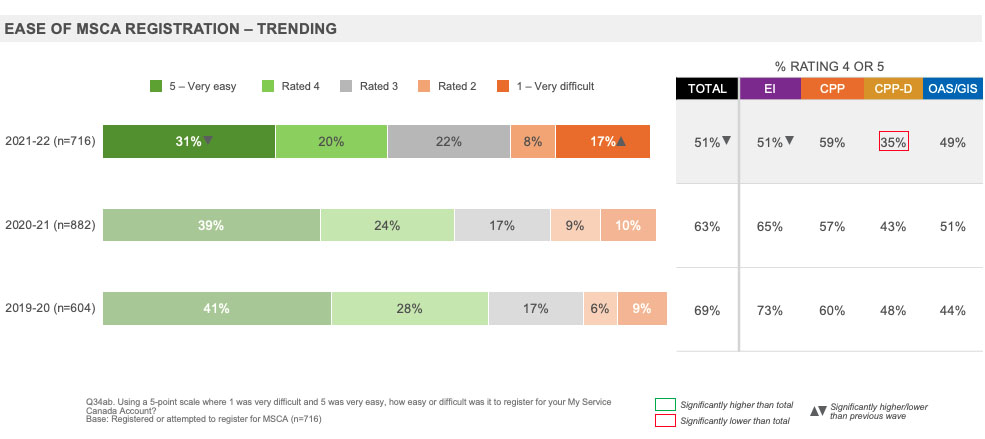
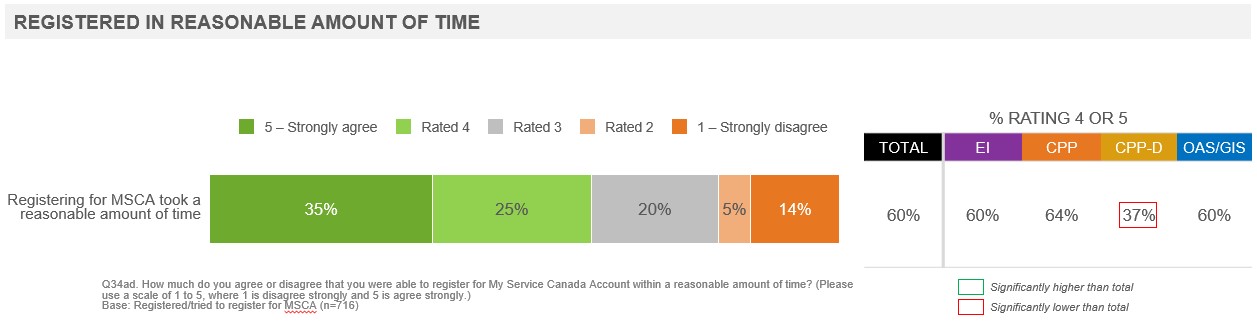
Half of clients (51%) who registered for their MSCA for the first time found it easy to do so, lower than in 2020-21 (63%) due to fewer EI clients who expressed ease with the process. Sixty percent agreed that the registration process took a reasonable amount of time, with CPP-D clients (37%) less likely to feel so compared to all clients.
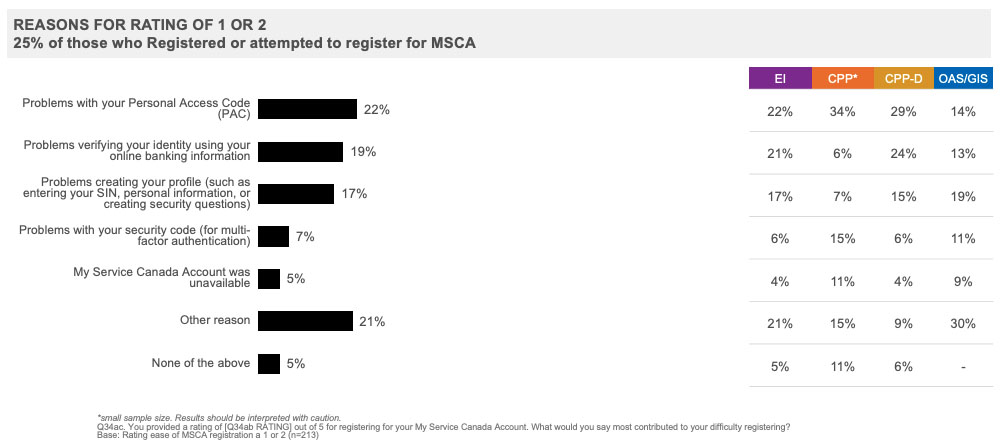
Among those who had difficulty registering, the most common reasons were because they experienced problems with their personal access code (22%), problems verifying their identity using their online banking information (19%) or problems creating their profile (17%).
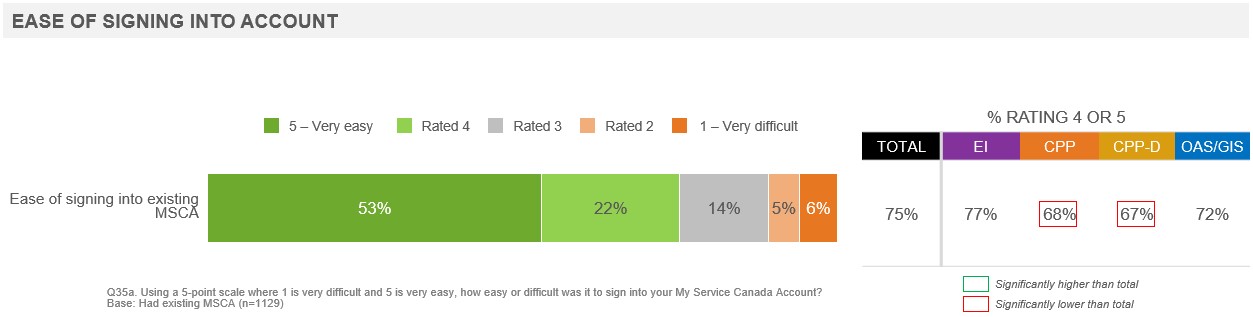
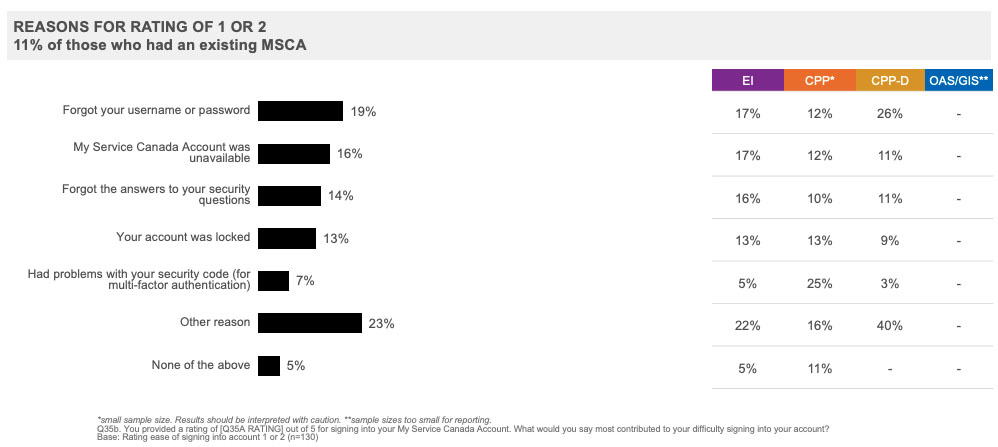
Three-quarters of those with an existing MSCA found it easy to sign into their account. CPP (68%) and CPP-D clients (67%) felt it was more difficult to sign in compared to all clients.
Among those who had difficulty, the most common reasons were because they forgot their username or password (19%), followed by MSCA was unavailable (16%), they forgot the answers to their security questions (14%) or that their account was locked (13%).
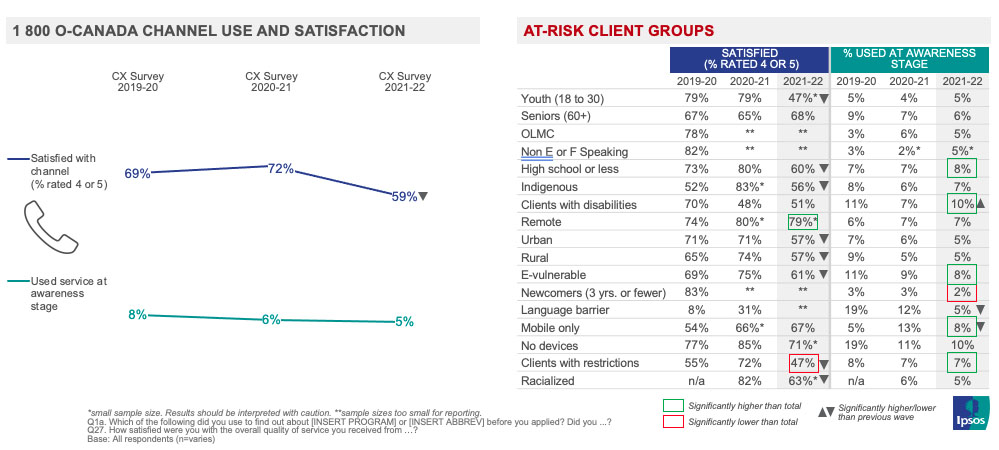
A very limited proportion of clients used 1 800 O-Canada to learn about the program for which they were applying. Usage was generally consistent across most at-risk client groups; however certain at-risk clients did rely slightly more on the service compared to all clients.
Few clients (5%) used 1 800 O-Canada at the aware stage to learn about the program they applied for, consistent with last year. Usage was higher among those with high school education or less, those with disabilities, e-vulnerable clients, those with only a mobile device and clients with restrictions. Six in ten (59%) were satisfied with the quality of service provided through 1 800 O-Canada, lower than last year (72%). Satisfaction was higher among clients living in remote areas and lower among clients with restrictions
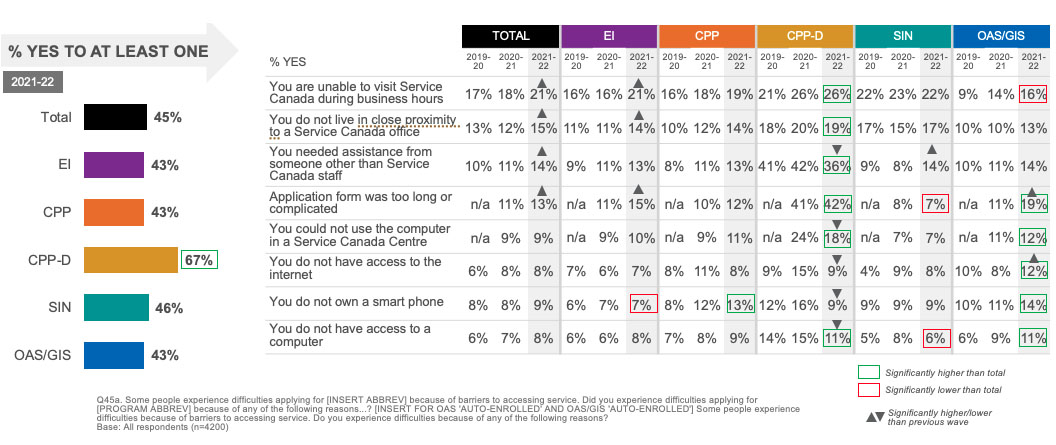
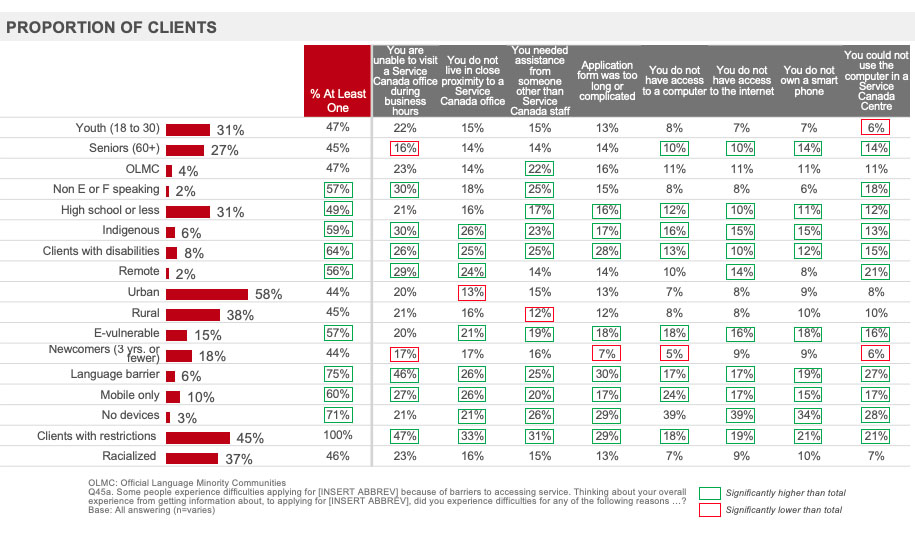
Executive Summary: Barriers to Accessing Service
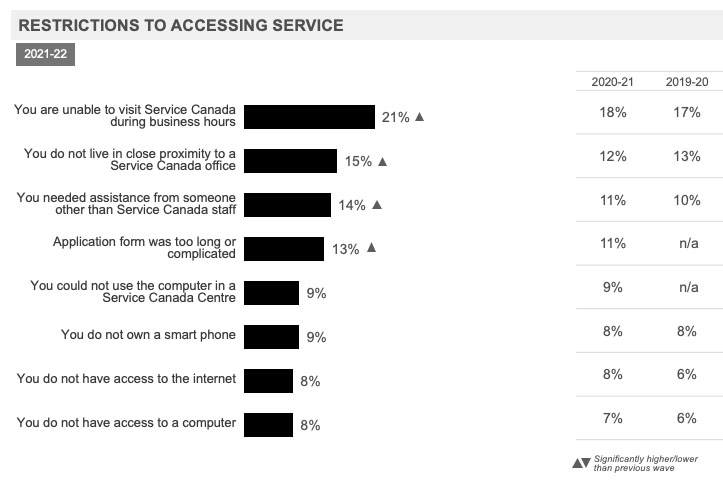
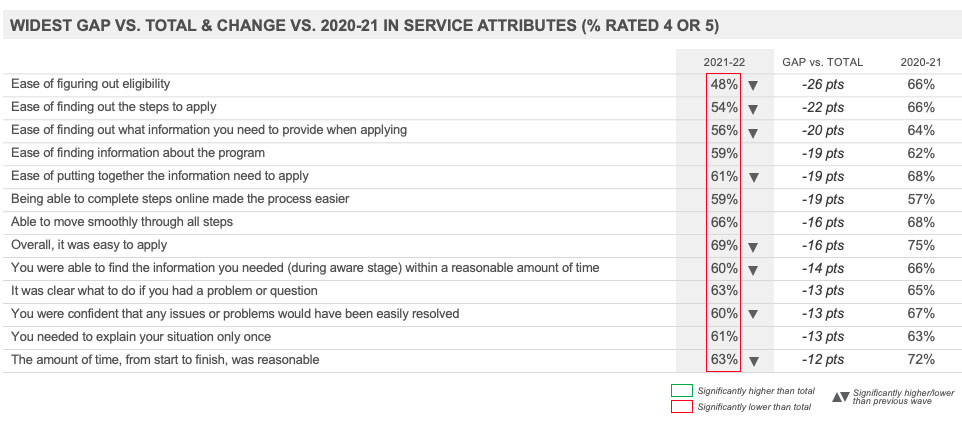
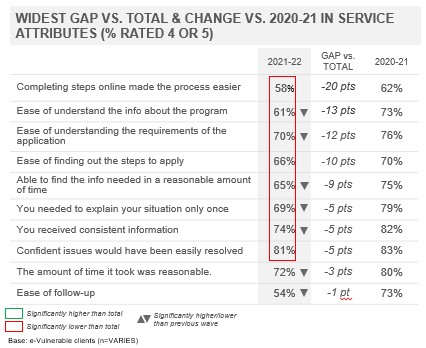
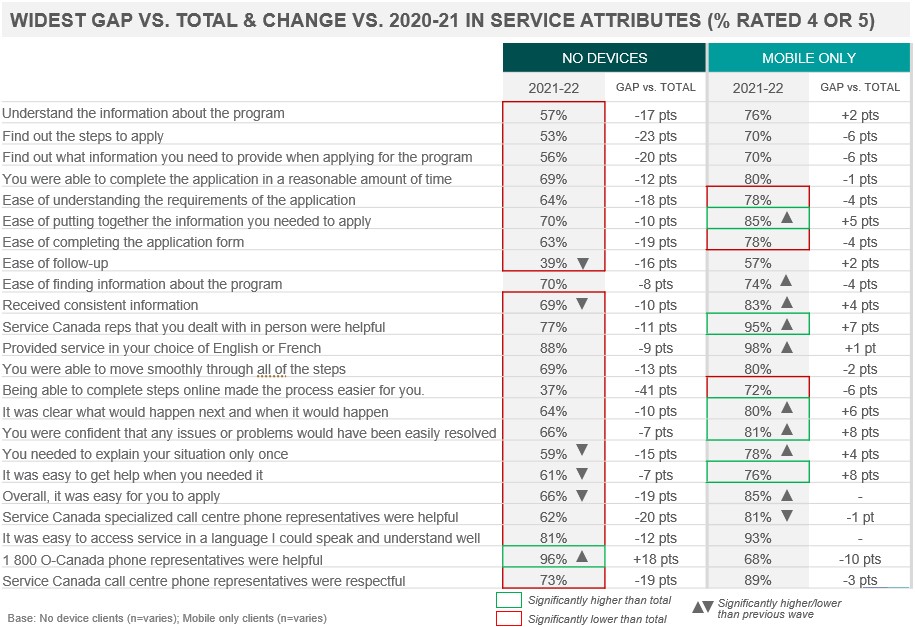
Clients with restrictions that make it more difficult to access service have lower satisfaction than other clients. The most prominent challenges faced by this client group include the ease of understanding information about the program, being able to find the information needed when learning about the program within a reasonable amount of time and the ease of completing steps online.
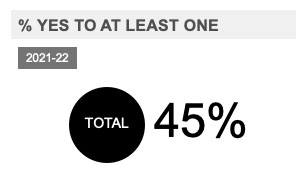
Clients who experienced a restriction to accessing service (45% of the client population) had lower satisfaction with the service provided in-person, online, through MSCA, specialized call centres and 1 800 O-Canada. There were also many significant gaps on service attributes between clients with restrictions and clients overall. The largest gaps were for the ease of understanding information about the program, being able to find the information needed (during the aware stage) within a reasonable amount of time and that being able to complete steps online made the process easier.
Restrictions to accessing service were more prevalent among several at-risk client groups, in particular those with a language barrier, clients with no devices and clients with disabilities. Incidence of restrictions were also higher among e-vulnerable clients, mobile-only clients, clients who live in remote areas, Indigenous clients, non-English for French speaking clients and those with a high school education or less.
Compared to 2020-21, ratings have declined across most measures. The largest declines were observed for the helpfulness of 1 800 O-Canada reps, ease of follow-up, ease of understanding information about the program, being able to find the information needed within a reasonable amount of time and overall timeliness of service.
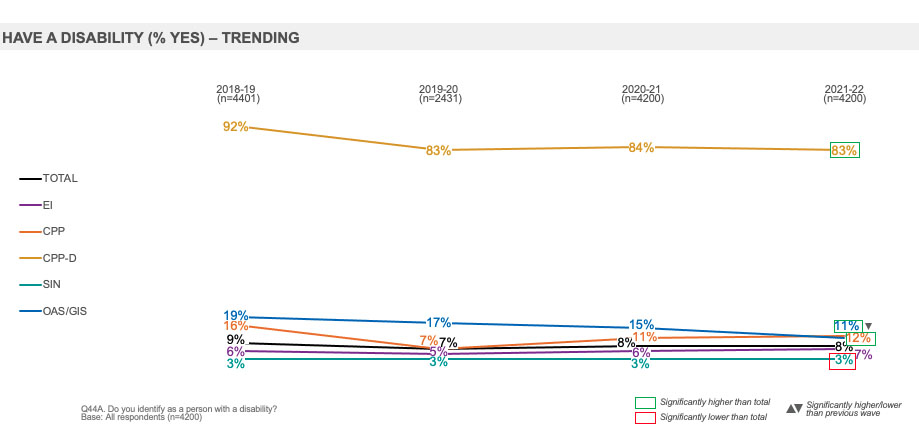
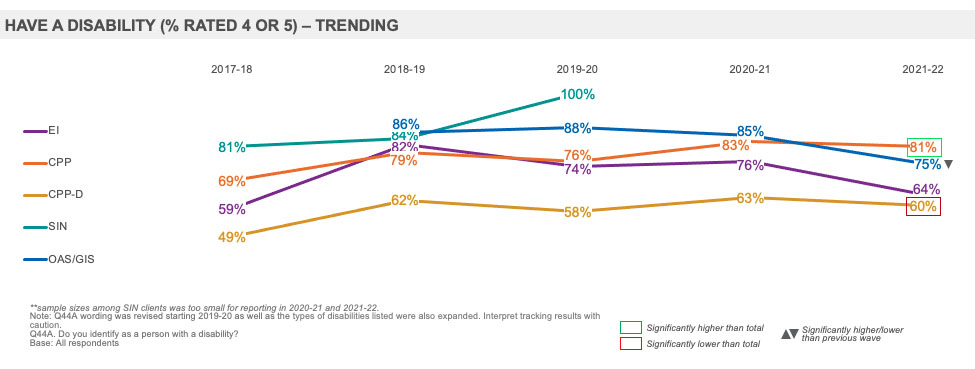
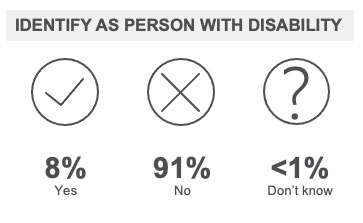
Clients who self-identify as having a disability (8% of the sample population) provided lower ratings for the level of service provided in-person, online and through specialized call centres. There were also many significant gaps on service attributes between clients with disabilities and clients overall. The largest gaps were for the ease of finding information on the program including figuring out eligibility, the steps to apply, what information they needed to provide when applying and information on the program as well as the ease of putting together the information needed to apply.
Compared to 2020-21, ratings have declined across several measures. The largest declines were observed for ease of finding out the steps to apply, the timeliness of service, the ease of figuring out eligibility and the ease of finding out what information they needed to provide when applying.
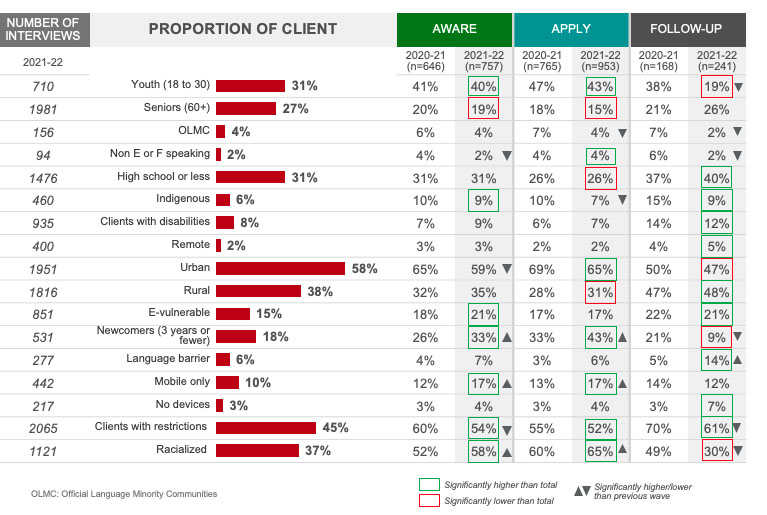
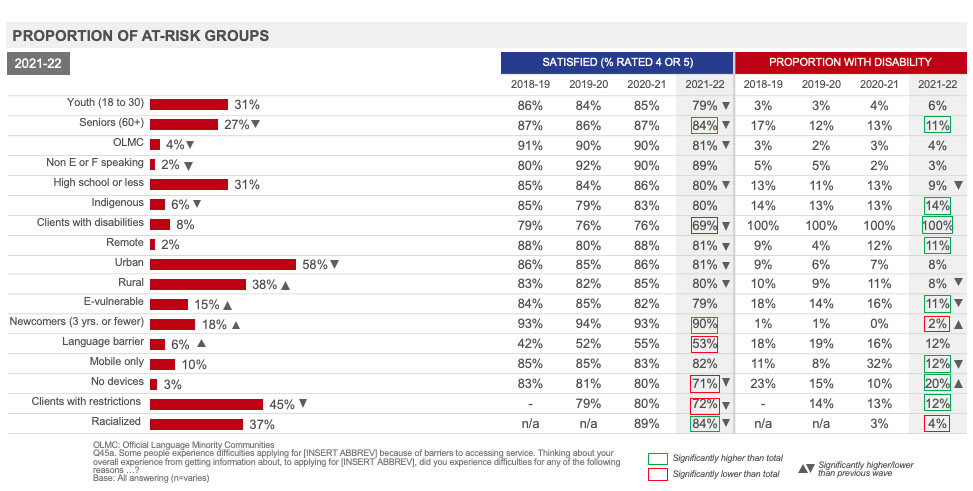
Executive Summary: At-Risk Groups
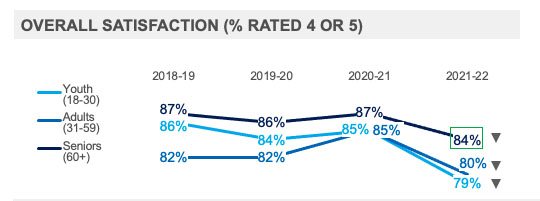
Most at-risk client groups continued to provide high ratings of the service experience however overall satisfaction has declined among most year over year.
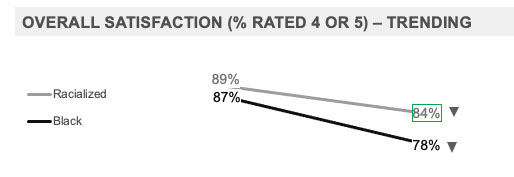
The vast majority of clients in nearly all at-risk groups continued to be highly satisfied with the service experience and notably satisfaction among seniors, newcomers, and racialized clients was higher than compared to all clients. Satisfaction was lower compared to all clients among those with a language barrier, clients with disabilities, clients with restrictions to accessing service and clients with no devices.
Clients with a language barrier continued to experience the most difficulty among all at-risk groups and provided considerably lower ratings across all aspects of their experience. The largest gaps on service attributes compared to all clients were for the helpfulness of 1 800 O-Canada phone representatives, being able to complete steps online made the process easier, clarity of the issue resolution process, receiving consistent information and that it was clear what would happen next and when
Compared to 2020-21, overall satisfaction with the service experience declined among most at-risk groups including:
Clients who experienced restrictions accessing our services (72% vs. 80% in 2020-21)
Clients with no devices (71% vs 80%)
Clients with disabilities (69% vs. 76%)
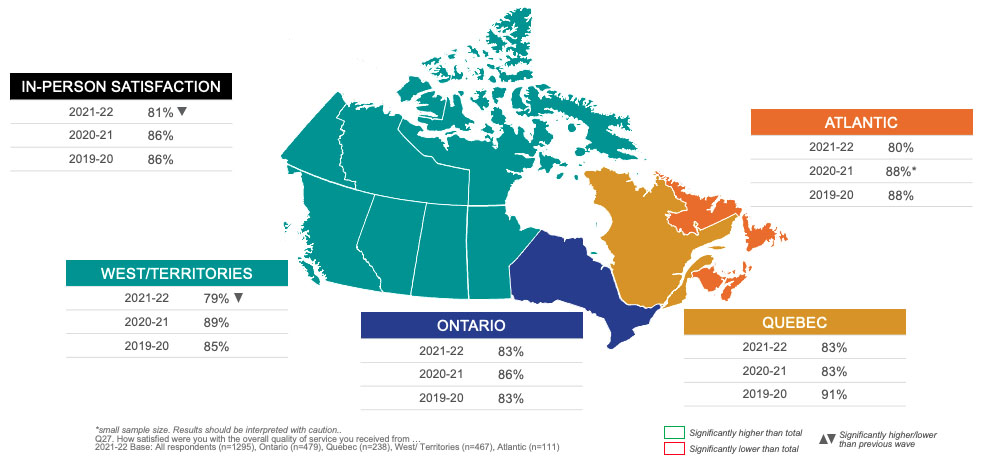
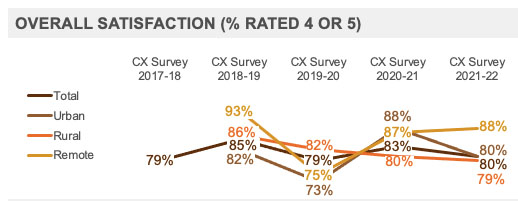
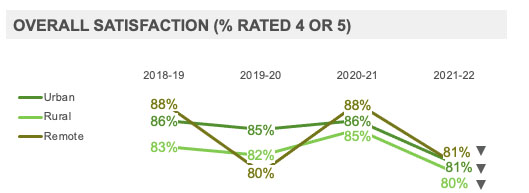
Remote clients (81% vs. 88%)
Rural clients (80% vs. 85%)
Youth (79% vs 85%)
Racialized Canadians (84% vs 89%)
Seniors (84% vs 87%)
Official Language Minority Communities (81% vs. 90%)
All other at-risk groups saw non-statistically significant declines in overall satisfaction.
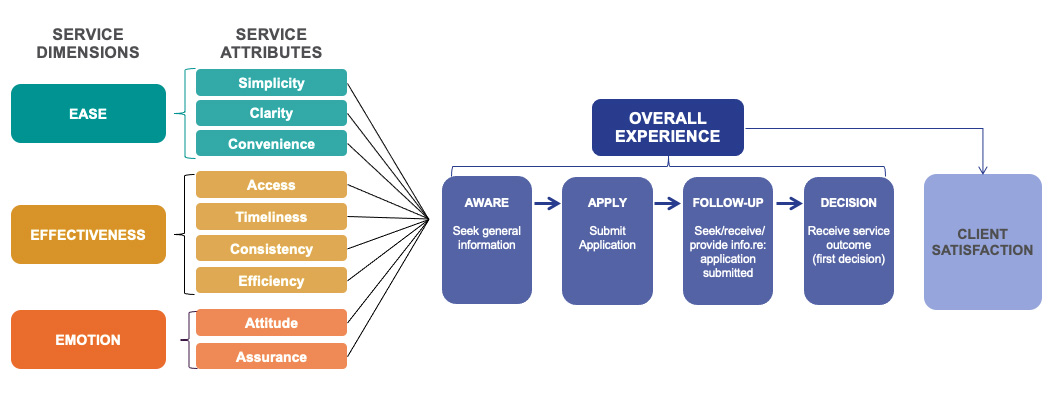
Service Canada Client Experience Survey Measurment Model
Service Canada Client Experience (CX) Survey Measurement Model
Service Canada developed the survey model below as a consistent framework for assessing the service experience of its clients.
The methodology for the Client Experience Survey was initially implemented in 2017-18. In the 2018-19 wave of the survey, the questionnaire was limited to the overall experience to allow for measures to gather data to inform service transformation. In the 2019-20, 2020-21 and 2021-22 waves, the questionnaire took the approach utilized in 2017-18 to allow for assessment of tracking of each stage of the client journey.
Figure long description
Service Dimensions
Ease
Service Attributes
Simplicity
Clarity
Convenience
Effectiveness
Service Attributes
Access
Timeliness
Consistency
Efficiency
Emotion
Service Attributes
Attitude
Assurance
Service attributes to Overall Experience
Aware – Seek general information
Apply –Submit application
Follow-up – Seek/receive/provide info re: application submitted
Decision – Receive service outcome (first decision)
Overall Experience to Client Satisfaction
Note: The Model was drawn from a combination of existing models to suit Service Canada context, and validated through consultation with internal stakeholders. The existing models include: The Common Measurements Tool (CMT), owned and licensed by the Institute for Citizen-Centred Service (ICCS), the client survey model used by the Government of Quebec, and Forrester’s approach to client experience measurement.
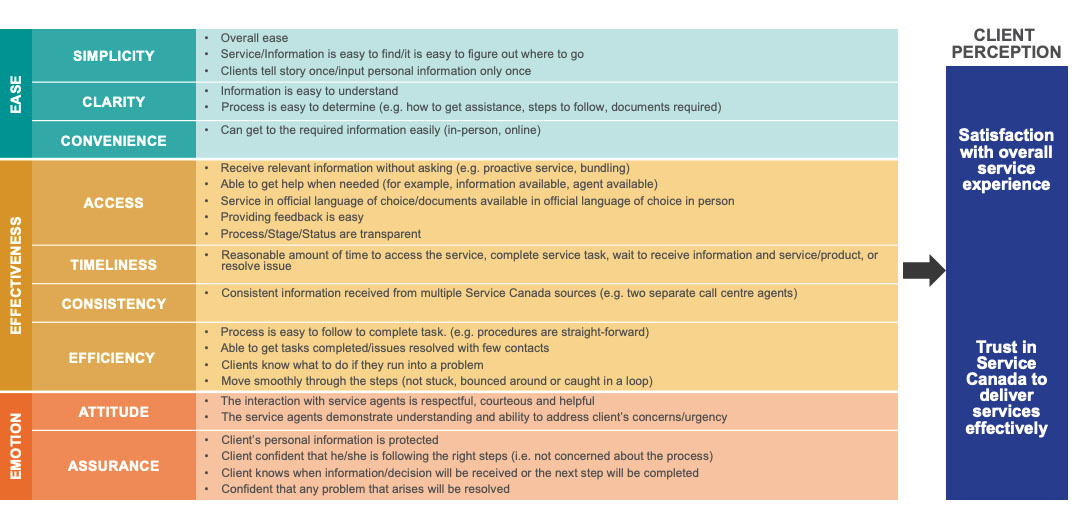
Service Canada CX Survey Measurement Model: Service Attributes
The following was the full set of detailed service attributes in the model that guided the development of the baseline questionnaire.
Figure long description
Ease
Simplicity
Overall ease
Service/Information is easy to find/it is easy to figure out where to go
Clients tell story once/input personal information only once
Clarity
Information is easy to understand
Process is easy to determine (e.g. how to get assistance, steps to follow, documents required)
Convenience
Can get to the required information easily (in-person, online)
Effectiveness
Access
Receive relevant information without asking (e.g. proactive service, bundling)
Able to get help when needed (for example, information available, agent available)
Service in official language of choice/documents available in official language of choice in person
Providing feedback is easy
Process/Stage/Status are transparent
Timeliness
Reasonable amount of time to access the service, complete service task, wait to receive information and service/product, or resolve issue
Consistency
Consistent information received from multiple Service Canada sources (e.g. two separate call centre agents)
Efficiency
Process is easy to follow to complete task. (e.g. procedures are straight-forward)
Able to get tasks completed/issues resolved with few contacts
Clients know what to do if they run into a problem
Move smoothly through the steps (not stuck, bounced around or caught in a loop)
Emotion
Attitude
The interaction with service agents is respectful, courteous and helpful
The service agents demonstrate understanding and ability to address client’s concerns/urgency
Assurance
Client’s personal information is protected
Client confident that he/she is following the right steps (i.e. not concerned about the process)
Client knows when information/decision will be received or the next step will be completed
Confident that any problem that arises will be resolved
Client perception
Satisfaction with overall service experience
Trust in Service Canada to deliver services effectively
Research Approach
Overview: Quantitative Approach
A telephone survey was conducted with a sample of 4,200 Service Canada clients across the five major programs, with between approximately 760 and 990 respondents interviewed about their experience with each program. The interviews were conducted from June 23 to July 26, 2022.
In order to examine the overall service experience, including how clients used the various channels to complete the steps of their client journeys, the clientele was defined as clients who had recently completed a client journey, up to initial decision.
The sample of clients who had received a service outcome during January, February and March 2022 were randomly selected from program administrative databases. Comparisons of findings to the baseline data must take into account that the 2017-18 survey wave largely sampled clients who received a service outcome in April, May, or June 2017.
The sample was stratified by program. Weighting adjustments were made to bring the sample into proportion with the universe by age, gender, and region within each program, and to bring the over-sampled groups back to their proportion among clients.
Data based on the total population have a margin of error of +/-1.5% at the 95% confidence interval, while data based on sub-groups have a larger margin of error. For example, the margin of error for data for each program was between +/-3.1% to +/-3.5%.
The data was weighted in proportion to age, gender, region and program volume.
Small sample sizes of less than n=40 have been identified throughout the report using an asterisk symbol (*) and caution should be used when interpreting these results. Sample sizes less than n=25 are considered very small and results for these measures have not been included in the report and have been identified using a double asterisk (**) where applicable.
Data Collection: Quantitative Approach
The 2021-22 questionnaire was developed based on the Service Canada Client Experience Survey Measurement Model. The 2020-21 CX Survey was used as the basis for developing the questionnaire design. Slight modifications were made to incorporate new statements about the respectfulness of Service Canada staff by channel and a new series of questions to better understand clients’ experience signing into their MSCA account.
The questionnaire was pretested from June 16 to June 22 and fieldwork took place between June 23 and July 26, 2022.
Experienced, trained interviewers were specifically briefed on the requirements of this study. A minimum of 10% of each interviewer’s calls were monitored by a team leader.
Respondents were interviewed in their choice of English or French. For those who could not respond in either language, a proxy respondent (who had assisted them in contacting Service Canada) could respond on their behalf (50 surveys were completed through a proxy respondent this wave). In addition, respondents who could not speak either official language were provided an option of using an on-demand interpretation service (15 respondents utilized the service this wave).
To better reach clients with a hearing deficiency, those clients were actively offered the SVR Canada VRS telephone service to complete the survey. No respondents utilized the SVR Canada VRS service.
Oversamples were conducted with two at-risk client groups: those living in remote areas and Indigenous clients (See Appendix A for the definitions of at-risk client groups). This was done to provide a minimum of 400 completed interviews with each group.
Calibration of the Data: Quantitative Approach
A multi-tiered approach has been used to weight the data from the sample for the Client Experience survey into proportion with the universe of ESDC clients. Steps in the weighting comprised:
Adjust to the universe proportions of age, gender, and region for each program.
Weight over-sampled populations back into proportion to their presence in the universe.
Weight the number of respondents in each program in proportion to the total number of clients.
Weight the number respondents by each region in proportion to the total number of clients.
Adjust to the universe proportions of benefits received for each program.
OAS and GIS have been combined into one client group and weighted according to age, gender, region, and benefit receipt were applied based on combined program figures. The results were then weighted by the proportion of clients in each of OAS and GIS.
The universe proportions used to develop the targets were based on data extracts provided by Service Canada.
Additional details on the methodology are provided in Appendix A. A description of the sampling strategy, weighting and limitations are provided under separate cover, together with the survey questionnaire.
To ensure comparability of results between 2017-18, 2018-19, 2019-20 and 2020-21 the proportions of clients by program were held consistent and is based on the composition of the clientele in May of 2017-18.
Note on Reporting Conventions – Quantitative Data
Throughout the report, subgroup results have been compared to average of all clients (i.e., total) and statistically significant differences at the 95% confidence level noted using green and red boxes.
Where subgroup results are statistically higher than the total a green box has been used and where results are statistically lower than the total a red box has been used.
Additionally, arrows have been used to identify where results in 2021-22 are statistically higher or lower than 2020-21.
Figure long description
Significantly higher/lower than total
Significantly higher/ lower than previous wave
Small sample sizes of less than n=40 have been identified throughout the report using an asterisk symbol (*) and caution should be used when interpreting these results. Sample sizes less than n=25 are considered very small and results for these measures have not been included in the report and have been identified using a double asterisk (**) where applicable.
Qualitative Approach
A mix of in-depth interviews and online focus groups were conducted. Thirty-two (32) in-depth interviews took place in English and French between September 7 and October 7, 2022, broken down by program:
6 in-depth interviews with CPP-D participants
9 x in-depth interviews with GIS participants
8 x in-depth interviews with OAS participants
9 x in-depth interviews with Indigenous respondents who were EI / OAS / CPP
Eight online focus groups took place between September 20 and September 26, 2022, also broken down by program:
2 online English focus groups with 11 EI participants
2 online English focus groups with 14 SIN participants
1 online English focus group with 6 CPP participants
1 online English focus group with 6 OAS / GIS participants
1 online French focus group with 5 EI participants
1 online French focus group with 4 SIN participants
Participants were Service Canada clients receiving an initial decision on their application between January and March, 2022, and who responded to the CX Survey in June 23 to July 26, 2022, meeting one of the following screening criteria: rated their overall satisfaction as low (survey question #38); experienced difficulties applying because of barriers to accessing service (survey question #45)
A total of 76 clients participated in the qualitative research.
The value of qualitative research is that it allows for the in-depth exploration of factors that shape public attitudes and behaviours on certain issues.
Detailed Findings
End-To-End Client Experience By Program
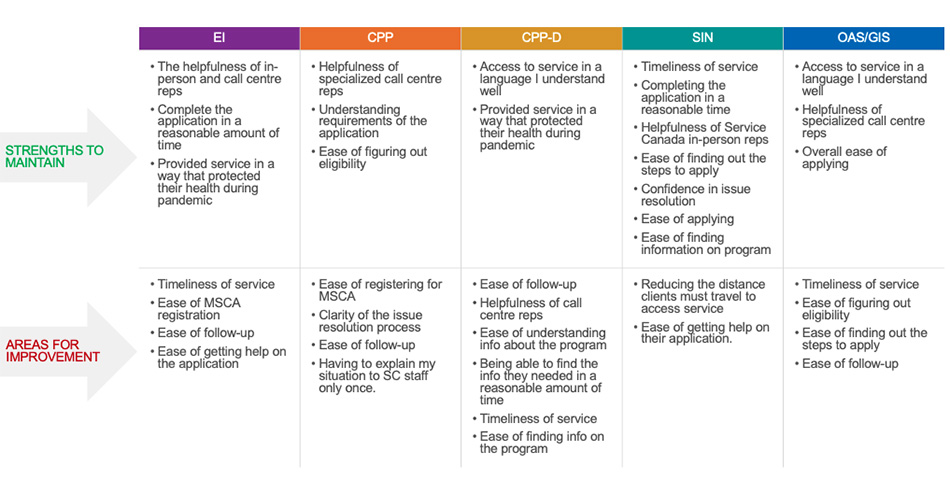
Impact of Service Changes on the Client Experience
Figure long description
EI
Strengths to Maintain
The helpfulness of in-person and call centre reps
Complete the application in a reasonable amount of time
Provided service in a way that protected their health during pandemic
Areas for Improvement
Timeliness of service
Ease of MSCA registration
Ease of follow-up
Ease of getting help on the application
CPP
Strengths to Maintain
Helpfulness of specialized call centre reps
Understanding requirements of the application
Ease of figuring out eligibility
Areas for Improvement
Ease of registering for MSCA
Clarity of the issue resolution process
Ease of follow-up
Having to explain my situation to SC staff only once.
CPP-D
Strengths to Maintain
Access to service in a language I understand well
Provided service in a way that protected their health during pandemic
Areas for Improvement
Ease of follow-up
Helpfulness of call centre reps
Ease of understanding info about the program
Being able to find the info they needed in a reasonable amount of time
Timeliness of service
Ease of finding info on the program
SIN
Strengths to Maintain
Timeliness of service
Completing the application in a reasonable time
Helpfulness of Service Canada in-person reps
Ease of finding out the steps to apply
Confidence in issue resolution
Ease of applying
Ease of finding information on program
Areas for Improvement
Reducing the distance clients must travel to access service
Ease of getting help on their application.
OAS/GIS
Strengths to Maintain
Access to service in a language I understand well
Helpfulness of specialized call centre reps
Overall ease of applying
Areas for Improvement
Timeliness of service
Ease of figuring out eligibility
Ease of finding out the steps to apply
Ease of follow-up
Overall Satisfaction
Qualitative Insights on Ideal Service
Figure long description
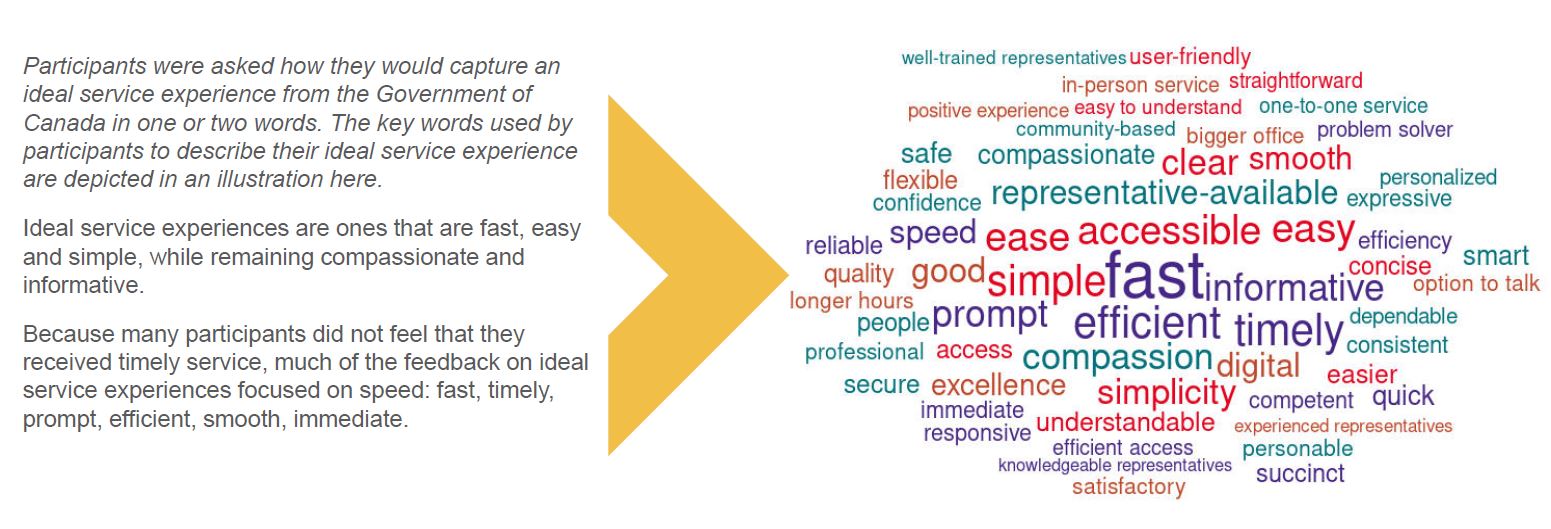
Participants were asked how they would capture an ideal service experience from the Government of Canada in one or two words. The key words used by participants to describe their ideal service experience are depicted in an illustration here.
Ideal service experiences are ones that are fast, easy and simple, while remaining compassionate and informative.
Because many participants did not feel that they received timely service, much of the feedback on ideal service experiences focused on speed: fast, timely, prompt, efficient, smooth, immediate.
Largest
fast
Very large
efficient
easy
timely
representative-available
accessible
timely
simple
informative
compassion
Large
prompt
ease
simplicity
Medium
representatives
Small
excellence
access
compassionate
good
clear
service
digital
Very small
Understandable
speed
smooth
Smallest
immediate
bigger-office
experienced
well-trained
longer-hours
confidence
competent
talk
efficiency
flexible
understand
one-to-personable
option
one-personalized
dependable
consistent
community-based
understandable
positive
concise
responsive
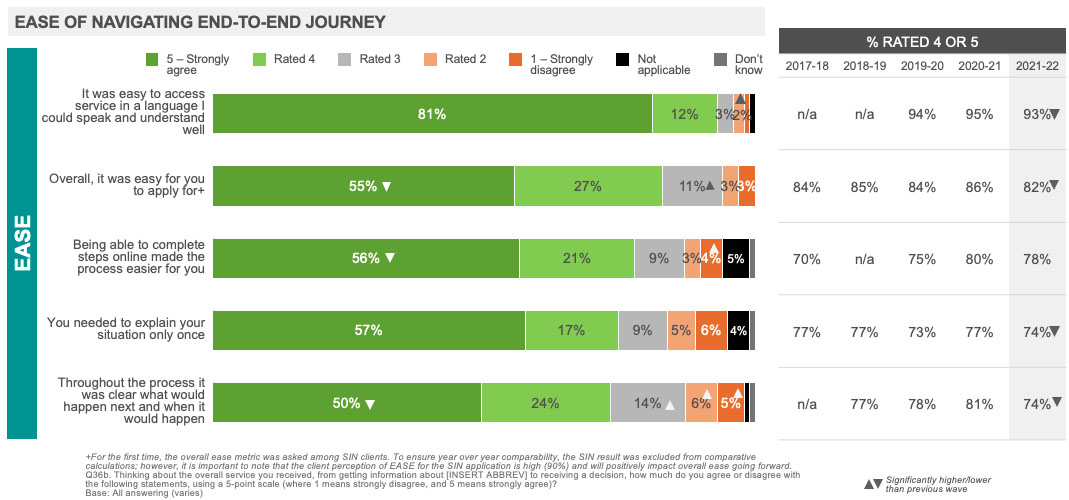
Satisfaction, Ease, Effectiveness and Emotion Over Time
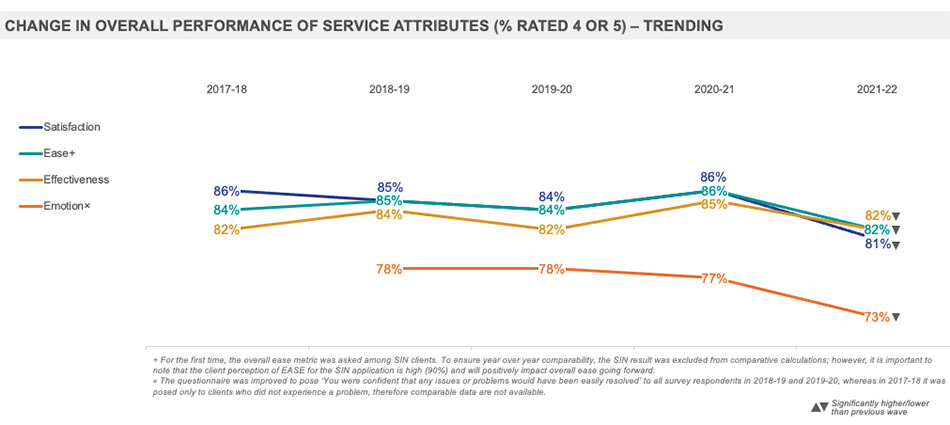
At just over eight in ten, the vast majority of clients were satisfied with their experience and found it easy and effective. Closer to three quarters of clients were confident that any issues or problems would have been easily resolved.
Compared to 2020-21, ratings on overall satisfaction, ease, effectiveness and emotion have decreased. Overall effectiveness has returned to levels observed in 2019-20.
Figure long description
Change in Overall Performance of Service Attributes (% Rated 4 or 5) – Trending
Satisfaction
2017-18, 86%
2018-19, 85%
2019-20. 84%
2020-21, 86%
2021-22, 81%, significantly lower than previous wave
Ease
2017-18, 84%
2018-19, 85%
2019-20. 84%
2020-21, 86%
2021-22, 82%, significantly lower than previous wave
Effectiveness
2017-18, 82%
2018-19, 84%
2019-20. 82%
2020-21, 85%
2021-22, 82%, significantly lower than previous wave
Emotion
2018-19, 78%
2019-20. 78%
2020-21, 77%
2021-22, 73%, significantly lower than previous wave
+ For the first time, the overall ease metric was asked among SIN clients. To ensure year over year comparability, the SIN result was excluded from comparative calculations; however, it is important to note that the client perception of EASE for the SIN application is high (90%) and will positively impact overall ease going forward.
× The questionnaire was improved to pose ‘You were confident that any issues or problems would have been easily resolved’ to all survey respondents in 2018-19 and 2019-20, whereas in 2017-18 it was posed only to clients who did not experience a problem, therefore comparable data are not available.
Satisfaction by Service Experience: Overall
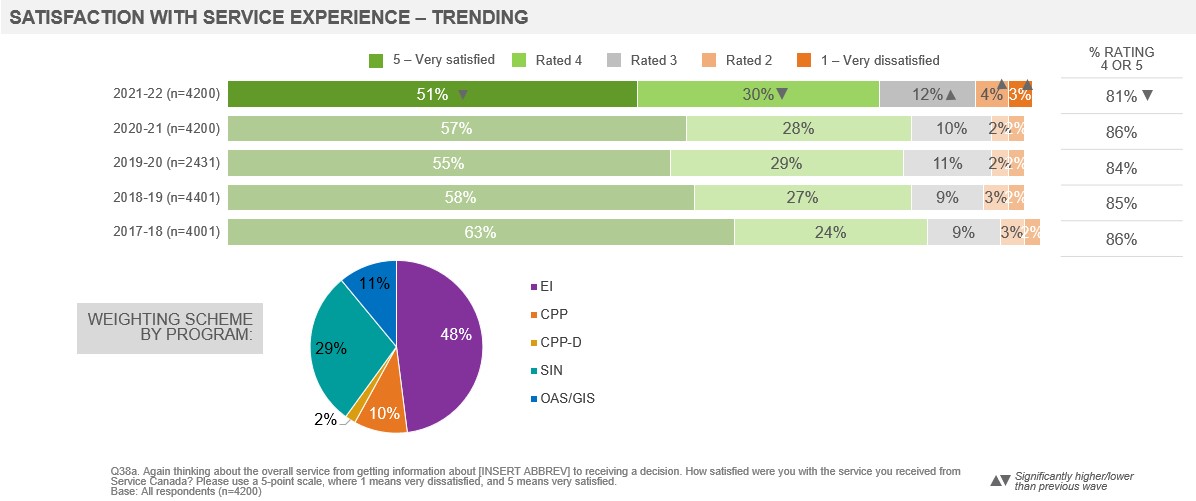
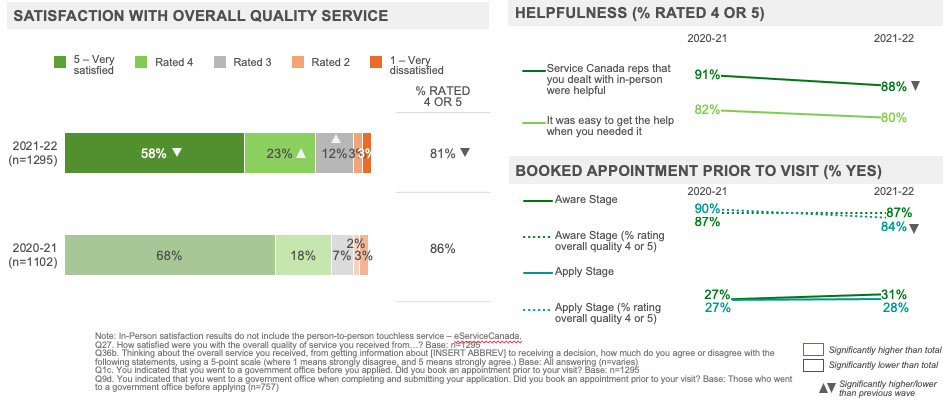
Overall, the majority of clients remained satisfied with the service experience however ratings have decreased compared to 2020-21. Fewer clients provided a rating of either 4 or 5 and the proportion of clients who were very satisfied (5 out of 5) stands at the lowest level observed, while a greater proportion of clients provided a rating of 3, 2 or 1.
This finding reflects the composition of the clientele, half of which nearly were EI clients, and nearly a third of which were SIN clients.
Figure long description
Satisfaction with Service Experience – Trending
2021-22, n=4200
5 - Very satisfied, 51%, significantly lower than previous wave
Rated 4, 30%, significantly lower than previous wave
Rated 3, 12%, significantly higher than previous wave
Rated 2, 4%, significantly higher than previous wave
1 - Very dissatisfied, 3%, significantly higher than previous wave
% Rating 4 or 5, 81%, significantly lower than previous wave
2020-21, (n=4200)
5 - Very satisfied, 57%
Rated 4, 28%
Rated 3, 10%
Rated 2, 2%
1 - Very dissatisfied, 2%
% Rating 4 or 5, 86%
2019-20, (n=2431)
5 - Very satisfied, 55%
Rated 4, 29%
Rated 3, 11%
Rated 2, 2%
1 - Very dissatisfied, 2%
% Rating 4 or 5, 84%
2018-19, (n=4401)
5 - Very satisfied, 58%
Rated 4, 27%
Rated 3, 9%
Rated 2, 3%
1 - Very dissatisfied, 2%
% Rating 4 or 5, 85%
2017-18, (n=4001)
5 - Very satisfied, 63%
Rated 4, 24%
Rated 3, 9%
Rated 2, 3%
1 - Very dissatisfied, 2%
% Rating 4 or 5,
Weighting Scheme by Program
EI, 48%
CPP, 10%
CPP-D, 2%
SIN, 29%
OAS/GIS, 11%
Q38a. Again thinking about the overall service from getting information about [INSERT ABBREV] to receiving a decision. How satisfied were you with the service you received from Service Canada? Please use a 5-point scale, where 1 means very dissatisfied, and 5 means very satisfied.
Base: All respondents (n=4200)
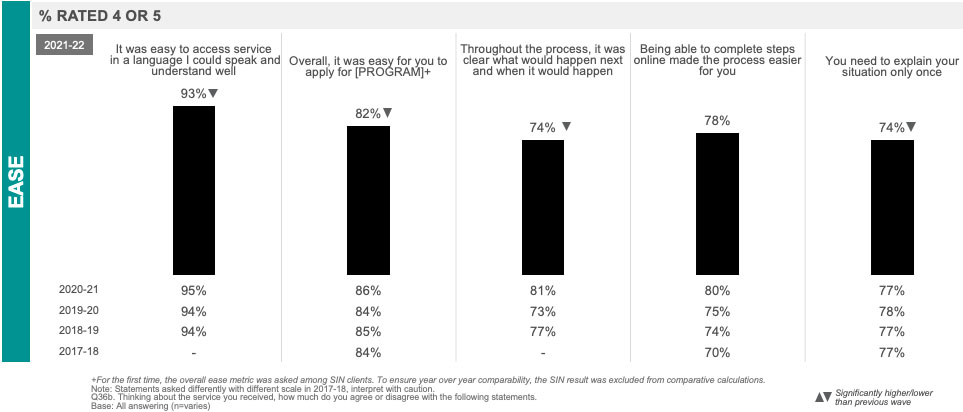
Ease, Effectiveness and Emotion: Overall
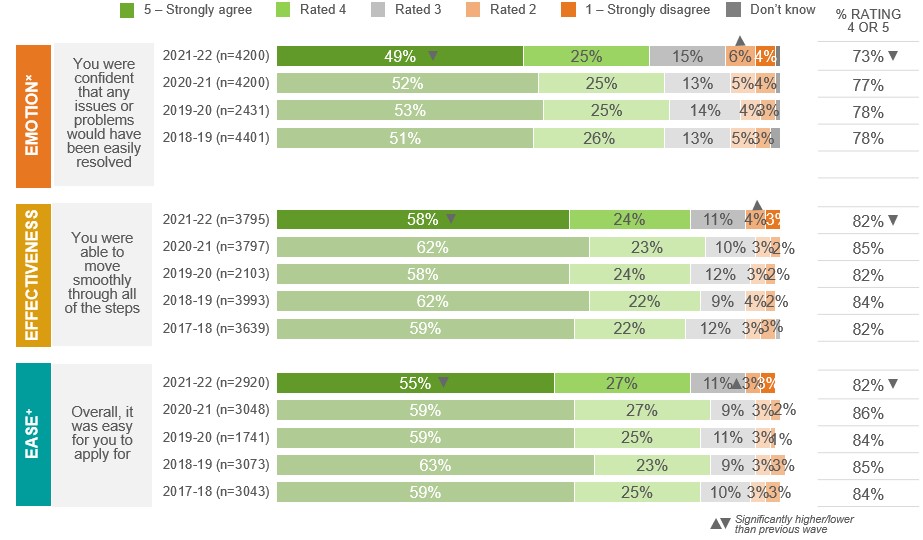
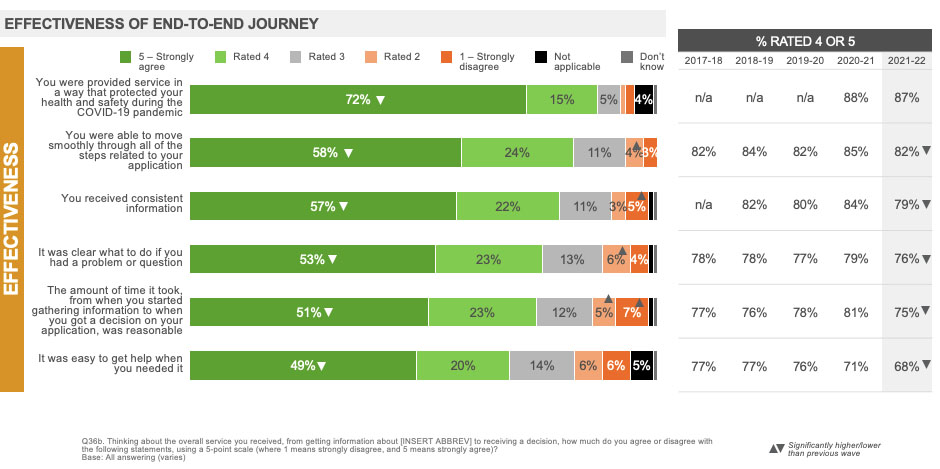
A strong majority of clients found the process easy, effective and had confidence in the issue resolution process, however ratings have declined across all measures compared to 2020-21.
Compared to 2020-21, fewer clients provided a rating of 5 out of 5 for each measure, while a greater proportion of clients provided a rating of 3 for overall ease and a rating of 2 for overall effectiveness and confidence in the issue resolution process.
Figure long description
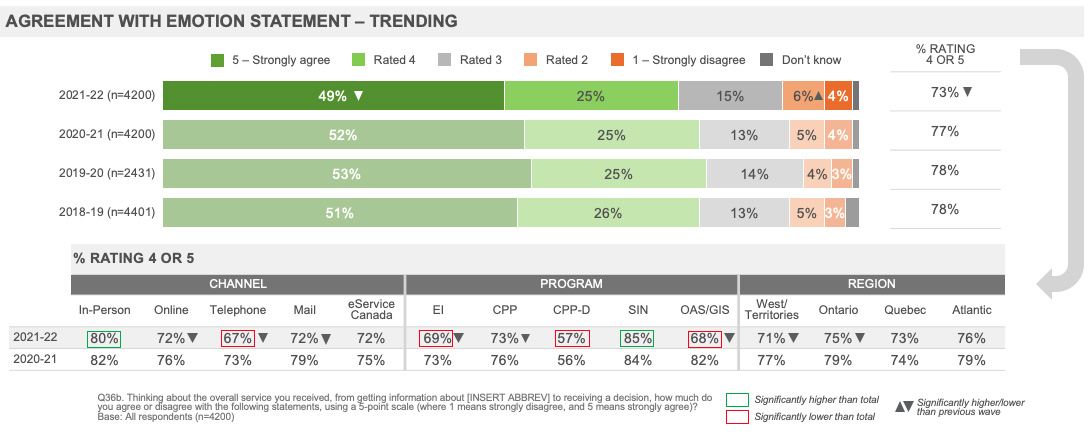
Emotion, You were confident that any issues or problems would have been easily resolved
2021-22, (n=4200)
5 - Strongly agree, 49%, significantly lower than previous wave
Rated 4, 25%
Rated 3, 15%
Rated 2, 6%, significantly higher than previous wave
1 - Strongly disagree, 4%
Don't know, 1%
% Rated 4 or 5, 73%, significantly lower than previous wave
2020-21, (n=4200)
5 - Strongly agree, 52%
Rated 4, 25%
Rated 3, 13%
Rated 2, 5%
1 – Strongly disagree, 4%
Don't know, 1%
% Rated 4 or 5, 77%
2019-20, (n=2431)
5 - Strongly agree, 53%
Rated 4, 25%
Rated 3, 14%
Rated 2, 4%
1 – Strongly disagree, 3%
Don't know, 1%
% Rated 4 or 5, 78%
2018-19, (n=4401)
5 - Strongly agree, 51%
Rated 4, 26%
Rated 3, 13%
Rated 2, 5%
1 - Strongly disagree, 3%
Don't know, 2%
% Rated 4 or 5, 78%
Effectivness, You were able to move smoothly through all of the steps
2021-22, (n=3795)
5 - Strongly agree, 58%, significantly lower than previous wave
Rated 4, 24%
Rated 3, 11%
Rated 2, 4%, significantly higher than previous wave
1 - Strongly disagree, 3%
% Rated 4 or 5, 82%, significantly lower than previous wave
2020-21, (n=3797)
5 - Strongly agree, 62%
Rated 4, 23%
Rated 3, 10%
Rated 2, 3%
1 - Strongly disagree, 2%
% Rated 4 or 5, 85%
2019-20, (n=2103)
5 - Strongly agree, 58%
Rated 4, 24%
Rated 3, 12%
Rated 2, 3%
1 - Strongly disagree, 2%
% Rated 4 or 5, 82%
2018-19, (n=3993)
5 - Strongly agree, 62%
Rated 4, 22%
Rated 3, 9%
Rated 2, 4%
1 - Strongly disagree, 2%
% Rated 4 or 5, 84%
2017-18, (n=3639)
5 - Strongly agree, 59%
Rated 4, 22%
Rated 3, 12%
Rated 2, 3%
1 - Strongly disagree, 3%
Don't know, 1%
% Rated 4 or 5, 82%
Ease, Overall, it was easy for you to apply for
2021-22, (n=2920)
5 - Strongly agree, 55%, significantly lower than previous wave
Rated 4, 27%
Rated 3, 11%, significantly higher than previous wave
Rated 2, 3%
1 - Strongly disagree, 3%
% Rated 4 or 5, 82%, significantly lower than previous wave
2020-21, (n=3048)
5 - Strongly agree, 59%
Rated 4, 27%
Rated 3, 9%
Rated 2, 3%
1 - Strongly disagree, 2%
% Rated 4 or 5, 86%
2019-20, (n=1741)
5 - Strongly agree, 59%
Rated 4, 25%
Rated 3, 11%
Rated 2, 3%
1 - Strongly disagree, 1%
% Rated 4 or 5, 84%
2018-19, (n=3073)
5 - Strongly agree, 63%
Rated 4, 23%
Rated 3, 9%
Rated 2, 3%
1 - Strongly disagree, 3%
Don't know, 0%
% Rated 4 or 5, 85%
2017-18, (n=3043)
5 - Strongly agree, 59%
Rated 4, 25%
Rated 3, 10%
Rated 2, 3%
1 - Strongly disagree, 3%
% Rated 4 or 5, 84%
+ For the first time, the overall ease metric was asked among SIN clients. To ensure year over year comparability, the SIN result was excluded from comparative calculations; however, it is important to note that the client perception of EASE for the SIN application is high (90%) and will positively impact overall ease going forward.
× The questionnaire was improved to pose ‘You were confident that any issues or problems would have been easily resolved’ to all survey respondents in 2018-19 and 2019-20, whereas in 2017-18 it was posed only to clients who did not experience a problem, therefore comparable data are not available.
Q36b. Thinking about the service you received, how much do you agree or disagree with the following statements … Base: All respondents/answering
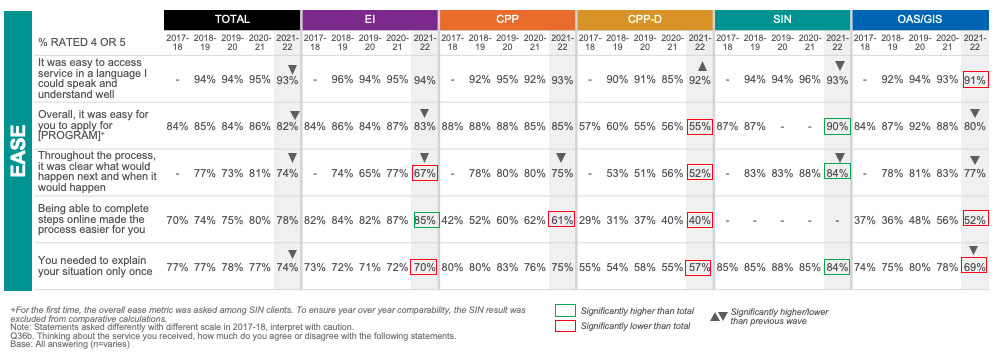
Ease, Effectiveness and Emotion: by Program
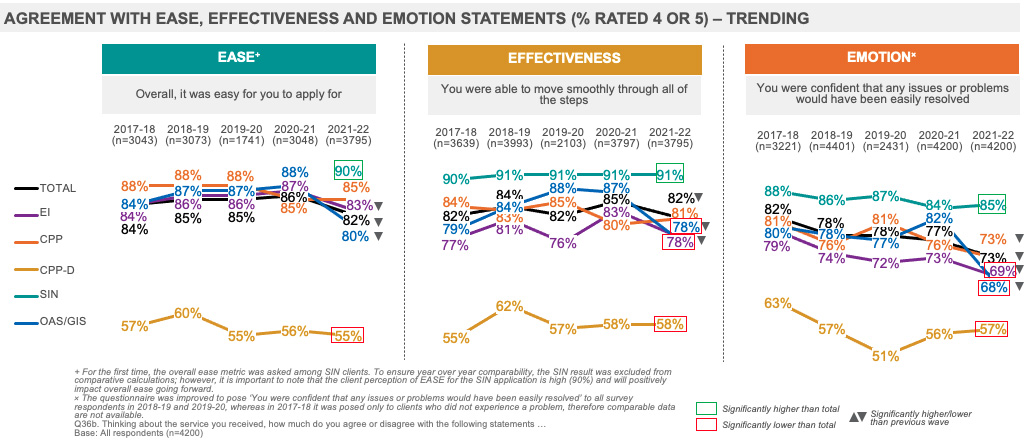
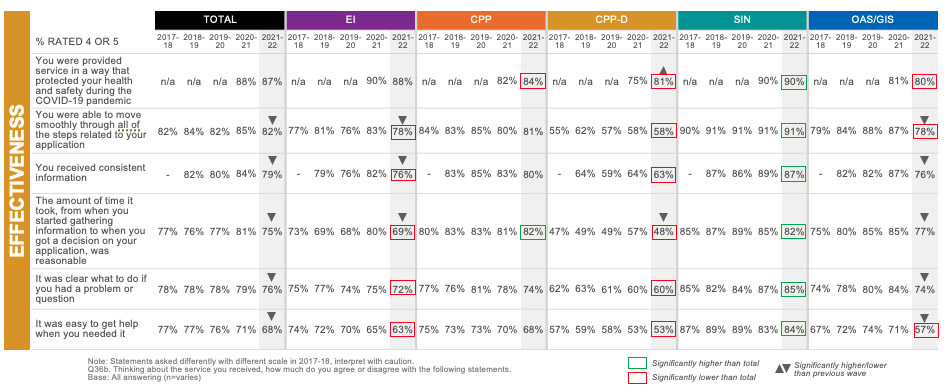
CPP-D clients were less likely to have found the process easy, effective, or to have had confidence in the issue resolution process compared to all clients, while EI and OAS/GIS clients were less likely to have felt the process was effective and to have had confidence in issue resolution. SIN clients were more likely to have found the process easy, effective, and to have had confidence in issue resolution.
Compared to 2020-21, EI and OAS/GIS clients provided lower ratings for ease, effectiveness and confidence in issue resolution, while CPP clients provided lower ratings for confidence in issue resolution.
Figure long description
Agreement with Ease, Effectiveness and Emotion Statements (%Rated 4 or 5) – Trending
Ease, Overall, it was easy for you to apply for
Total
2017-18, (n=3043), 84%
2018-19, (n=3073), 85%
2019-20, (n=1741), 85%
2020-21, (n=3048), 86%
2021-22, (n=3795), 82%, significantly lower than previous wave
EI
2017-18, (n=3043), 84%
2018-19, (n=3073), 86%
2019-20, (n=1741), 86%
2020-21, (n=3048), 87%
2021-22, (n=3795), 83%, significantly lower than previous wave
CPP
2017-18, (n=3043), 88%
2018-19, (n=3073), 88%
2019-20, (n=1741), 88%
2020-21, (n=3048), 85%
2021-22, (n=3795), 85%
CPP-D
2017-18, (n=3043), 57%
2018-19, (n=3073), 60%
2019-20, (n=1741), 55%
2020-21, (n=3048), 56%
2021-22, (n=3795), 55%, significantly lower than total
SIN
2021-22, (n=3795), 90%, significantly higher than total
OAS/GIS
2017-18, (n=3043), 84%
2018-19, (n=3073), 87%
2019-20, (n=1741), 87%
2020-21, (n=3048), 88%
2021-22, (n=3795), 80%, significantly lower than previous wave
Effectivness, You were able to move smoothly through all the steps
TOTAL
2017-18, (n=3639), 82%
2018-19, (n=3993), 84%
2019-20, (n=2103), 82%
2020-21, (n=3797), 85%
2021-22, (n=3795), 82%, significantly lower than previous wave
EI
2017-18, (n=3639), 77%
2018-19, (n=3993), 81%
2019-20, (n=2103), 76%
2020-21, (n=3797), 83%
2021-22, (n=3795), 78%, significantly lower than total, significantly lower than previous wave
CPP
2017-18, (n=3639), 84%
2018-19, (n=3993), 83%
2019-20, (n=2103), 85%
2020-21, (n=3797), 80%
2021-22, (n=3795), 81%
CPP-D
2017-18, (n=3639), 55%
2018-19, (n=3993), 62%
2019-20, (n=2103), 57%
2020-21, (n=3797), 58%
2021-22, (n=3795), 58%, significantly lower than total
SIN
2017-18, (n=3639), 90%
2018-19, (n=3993), 91%
2019-20, (n=2103), 91%
2020-21, (n=3797), 91%
2021-22, (n=3795), 91%, significantly higher than total
OAS/GIS
2017-18, (n=3639), 79%
2018-19, (n=3993), 84%
2019-20, (n=2103), 88%
2020-21, (n=3797), 87%
2021-22, (n=3795), 78%, significantly lower than total, significantly lower than previous wave
Emotion, you were confident that any issues or problems would have been easily resolved
TOTAL
2017-18, (n=3221), 82%
2018-19, (n=4401), 78%
2019-20, (n=2431), 78%
2020-21, (n=4200), 77%
2021-22, (n=4200), 73%, significantly lower than previous wave
EI
2017-18, (n=3221), 79%
2018-19, (n=4401), 74%
2019-20, (n=2431), 72%
2020-21, (n=4200), 73%
2021-22, (n=4200), 69%, significantly lower than total, significantly lower than previous wave
CPP
2017-18, (n=3221), 81%
2018-19, (n=4401), 76%
2019-20, (n=2431), 81%
2020-21, (n=4200), 76%
2021-22, (n=4200), 73%, significantly lower than previous wave
CPP-D
2017-18, (n=3221), 63%
2018-19, (n=4401), 57%
2019-20, (n=2431), 51%
2020-21, (n=4200), 56%
2021-22, (n=4200), 57%, significantly lower than total
SIN
2017-18, (n=3221), 88%
2018-19, (n=4401), 86%
2019-20, (n=2431), 87%
2020-21, (n=4200), 84%
2021-22, (n=4200), 85%, significantly higher than total
OAS/GIS
2017-18, (n=3221), 80%
2018-19, (n=4401), 78%
2019-20, (n=2431), 77%
2020-21, (n=4200), 82%
2021-22, (n=4200), 68%, significantly lower than total, significantly lower than previous wave
+ For the first time, the overall ease metric was asked among SIN clients. To ensure year over year comparability, the SIN result was excluded from comparative calculations; however, it is important to note that the client perception of EASE for the SIN application is high (90%) and will positively impact overall ease going forward.
× The questionnaire was improved to pose ‘You were confident that any issues or problems would have been easily resolved’ to all survey respondents in 2018-19 and 2019-20, whereas in 2017-18 it was posed only to clients who did not experience a problem, therefore comparable data are not available.
Q36b. Thinking about the service you received, how much do you agree or disagree with the following statements …
Base: All respondents (n=4200)
Emotion – Overall and by Channel, Program and Region
Nearly three quarters of clients agreed that they were confident that any issues or problems would have been easily resolved. Agreement has declined compared to 2020-21 and stands at the lowest level observed with fewer clients providing a rating of 5 out of 5 and a greater proportion of clients providing a rating of 2.
EI, CPP-D and OAS/GIS clients were less likely to have had confidence in the issue resolution process compared to all clients. Compared to 2020-21, EI, OAS/GIS and CPP clients provided lower ratings.
Clients who used in-person at some point during their client journey provided higher ratings for confidence in issue resolution, while those who used the telephone channel provided lower ratings. Agreement has declined among clients who used the online channel, telephone or mail during their experience.
Agreement is consistent by region and compared to last year has declined among clients in the West/ Territories and Ontario.
Figure long description
Agreement with Emotion Statement – Trending
2021-22, n=4200
5 - Strongly agree, 49%, significantly lower than previous wave
Rated 4, 25%
Rated 3, 15%
Rated 2, 6%, significantly higher than previous wave
1 – Strongly disagree, 4%
Don't know, 1%
% Rating 4 or 5, 73%, significantly lower than previous wave
2020-21, (n=4200)
5 - Strongly agree, 52%
Rated 4, 25%
Rated 3, 13%
Rated 2, 5%
1 – Strongly disagree, 4%
Don't know, 1%
% Rating 4 or 5, 77%
2019-20, (n=2431)
5 - Strongly agree, 53%
Rated 4, 25%
Rated 3, 14%
Rated 2, 4%
1 – Strongly disagree, 3%
Don't know, 1%
% Rating 4 or 5, 78%
2018-19, (n=4401)
5 - Strongly agree, 51%
Rated 4, 26%
Rated 3, 13%
Rated 2, 5%
1 – Strongly disagree, 3%
Don't know, 2%
% Rating 4 or 5, 78%
% Rating 4 or 5
Channel
In-Person
2021-22, 80%, significantly higher than total
2020-21, 82%
Online
2021-22, 72%, significantly lower than previous wave
2020-21, 76%
Telephone
2021-22, 67%, significantly lower than total, significantly lower than previous wave
2020-21, 73%
Mail
2021-22, 72%, significantly lower than previous wave
2020-21, 79%
eService Canada
2021-22, 72%
2020-21, 75%
Program
EI
2021-22, 69%, significantly lower than total, significantly lower than previous wave
2020-21, 73%
CPP
2021-22, 73%, significantly lower than previous wave
2020-21, 76%
CPP-D
2021-22, 57%, significantly lower than total
2020-21, 56%
SIN
2021-22, 85%, significantly higher than total
2020-21, 84%
OAS/GIS
2021-22, 68%, significantly lower than total, significantly lower than previous wave
2020-21, 82%
Region
West/ Territories
2021-22, 71%, significantly lower than previous wave
2020-21, 77%
Ontario
2021-22, 75%, significantly lower than previous wave
2020-21, 79%
Quebec
2021-22, 73%
2020-21, 74%
Atlantic
2021-22, 76%
2020-21, 79%
Q36b. Thinking about the overall service you received, from getting information about [INSERT ABBREV] to receiving a decision, how much do you agree or disagree with the following statements, using a 5-point scale (where 1 means strongly disagree, and 5 means strongly agree)?
Base: All respondents (n=4200)
Overall Satisfaction by Region (% Rated 4 or 5)
Compared to 2020-21, overall satisfaction decreased among clients in all regions, except for those in Quebec.
Figure long description
Overall Satisfaction by Region (% Rated 4 or 5)
Overall satisfaction
2021-22, 81%, significantly lower than previous wave
2020-21, 86%
2019-20, 84%
2018-19, 85%
2017-18, 85%
West/Territories
2021-22, 80%, significantly lower than previous wave
2020-21, 83%
2019-20, 82%
2018-19, 82%
2017-18, 82%
Ontario
2021-22, 81%, significantly lower than previous wave
2020-21, 89%
2019-20, 85%
2018-19, 85%
2017-18, 87%
Atlantic
2021-22, 82%, significantly lower than previous wave
2020-21, 89%
2019-20, 79%
2018-19, 85%
2017-18, 90%
Quebec
2021-22, 80%
2020-21, 83%
2019-20, 88%
2018-19, 88%
2017-18, 90%
Q38a. How satisfied were you with the service you received from Service Canada related to your application? please use a 5-point scale, where 1 means very dissatisfied, and 5 means very satisfied.
The vast majority of clients continued to express trust in Service Canada to deliver services effectively to Canadians, however ratings have declined compared to 2020-21. EI, CPP, OAS/GIS and CPP-D clients were less likely to express trust compared to all clients, while SIN clients were more likely.
Compared to 2020-21, ratings have declined among clients of all programs except for SIN clients where ratings were consistent.
This measure remained strongly correlated to overall satisfaction
Figure long description
Trust in Service Canada (% Rated 4 or 5) – Trending
TOTAL
2018-19, n=4401, 83%
2019-20, n=2431, 83%
2020-21, n=4200, 84%
2021-22, n=4200, 78%, significantly lower than previous wave
EI
2018-19, n=4401, 80%
2019-20, n=2431, 77%
2020-21, n=4200, 82%
2021-22, n=4200, 75%, significantly lower than total, significantly lower than previous wave
CPP
2018-19, n=4401, 81%
2019-20, n=2431, 86%
2020-21, n=4200, 81%
2021-22, n=4200, 74%, significantly lower than total, significantly lower than previous wave
CPP-D
2018-19, n=4401, 64%
2019-20, n=2431, 64%
2020-21, n=4200, 67%
2021-22, n=4200, 61%, significantly lower than total, significantly lower than previous wave
SIN
2018-19, n=4401, 91%
2019-20, n=2431, 93%
2020-21, n=4200, 90%
2021-22, n=4200, 89%, significantly higher than total
OAS/GIS
2018-19, n=4401, 79%
2019-20, n=2431, 81%
2020-21, n=4200, 82%
2021-22, n=4200, 70%, significantly lower than total, significantly lower than previous wave
There was a strong correlation between trust in Service Canada and overall satisfaction (0.62).
Q38b. How much would you say you trust Service Canada to deliver services effectively to Canadians? Please use a 5-point scale, where 1 means do not trust at all, and 5 means trust a great deal.
Base: All respondents (n=4200)
Trust in Service Canada: Overall
Nearly eight in ten clients expressed trust in Service Canada to deliver services effectively to Canadians. Ratings on trust have declined compared to 2020-21 and stand at the lowest level observed with fewer clients providing a rating of 5 out of 5 and a greater proportion of clients providing a rating of 3, 2 or 1.
This measure remained strongly correlated to overall satisfaction
Figure long description
Trust in Service Canada – Trending
2021-22, (n=4200)
5 - Trust a great deal, 49%, significantly lower than total wave
Rated 4, 29%
Rated 3, 14%, significantly higher than previous wave
Rated 2, 4%, significantly higher than previous wave
1 - Do not trust at all, 3%, significantly higher than previous wave
% Rating 4 or 5, 78%, significantly lower than previous wave
2020-21, (n=4200)
5 - Trust a great deal, 54%
Rated 4, 30%
Rated 3, 12%
Rated 2, 3%
1 - Do not trust at all, 1%
% Rating 4 or 5, 84%
2019-20, (n=2431)
5 - Trust a great deal, 52%
Rated 4, 31%
Rated 3, 13%
Rated 2, 3%
1 - Do not trust at all, 2%
% Rating 4 or 5, 83%
2018-19, (n=4401)
5 - Trust a great deal, 54%
Rated 4, 29%
Rated 3, 11%
Rated 2, 3%
1 - Do not trust at all, 2%
% Rating 4 or 5, 83%
There was a strong correlation between trust in Service Canada and overall satisfaction (0.62).
Q38b. How much would you say you trust Service Canada to deliver services effectively to Canadians? Please use a 5-point scale, where 1 means do not trust at all, and 5 means trust a great deal.
Base: All respondents (n=4200)
Assessment of Duration of End-to-End Journey
At three-quarters, the majority of clients found the timeliness of service reasonable, lower than in 2020-21 and consistent with levels observed in 2019-20 and earlier.
SIN and CPP clients were more likely to have rated the timeliness of service as reasonable, while EI and CPP-D clients were less likely.
Compared to 2020-21, EI, OAS/GIS and CPP-D clients were less likely to agree that the timeliness of service was reasonable.
Figure long description
The Amount Of Time It Took, From When You Started Gathering Information To When You Got A Decision On Your Application, Was Reasonable (% Rated 4 Or 5) – Trending
TOTAL
2017-18, n=4001, 77%
2018-19, n=4401, 76%
2019-20, n=2431, 77%
2020-21, n=4200, 81%
2021-22, n=4200, 75%, significantly lower than previous wave
EI
2017-18, n=4001, 73%
2018-19, n=4401, 69%
2019-20, n=2431, 68%
2020-21, n=4200, 80%
2021-22, n=4200, 69%, significantly lower than total, significantly lower than previous wave
CPP
2017-18, n=4001, 80%
2018-19, n=4401, 83%
2019-20, n=2431, 83%
2020-21, n=4200, 81%
2021-22, n=4200, 82%, significantly higher than total
CPP-D
2017-18, n=4001, 47%
2018-19, n=4401, 49%
2019-20, n=2431, 49%
2020-21, n=4200, 57%
2021-22, n=4200, 48%, significantly lower than total, significantly lower than previous wave
SIN
2017-18, n=4001, 85%
2018-19, n=4401, 87%
2019-20, n=2431, 89%
2020-21, n=4200, 85%
2021-22, n=4200, 82%, significantly higher than total
OAS/GIS
2017-18, n=4001, 75%
2018-19, n=4401, 80%
2019-20, n=2431, 85%
2020-21, n=4200, 85%
2021-22, n=4200, 77%, significantly lower than previous wave
Q36b. Thinking about the overall service you received, from getting information about [INSERT ABBREV] to receiving a decision, how much do you agree or disagree with the following statements, using a 5-point scale (where 1 means strongly disagree, and 5 means strongly agree)?
Base: All answering (n=4200)
Three quarters of clients agreed that the amount of time from when they started gathering information to when they got a decision was reasonable. Ratings on timeliness of service have declined compared to 2020-21 with fewer clients providing a rating of 5 out of 5 and a greater proportion providing a rating of 3, 2 or 1.
SIN and CPP clients were more likely to have rated the timeliness of service as reasonable, while EI and CPP-D clients were less likely.
Compared to 2020-21, EI, OAS/GIS and CPP-D clients were less likely to agree that the timeliness of service was reasonable.
Figure long description
The Amount Of Time It Took, From When You Started Gathering Information To When You Got A Decision On Your Application, Was Reasonable
TOTAL
5 - Strongly agree, 51%, significantly lower than previous wave
Rated 4, 23%
Rated 3, 12%, significantly higher than previous wave
Rated 2, 5%, significantly higher than previous wave
1 - Strongly disagree, 7%, significantly higher than previous wave
Not applicable, 1%
Don't know, 1%
% Rating 4 or 5, 75%, significantly lower than previous wave
EI
5 - Strongly agree, 44%, significantly lower than total, significantly lower than previous wave
Rated 4, 25%
Rated 3, 13%
Rated 2, 7%, significantly higher than total, significantly higher than previous wave
1 - Strongly disagree, 10%, significantly higher than total, significantly higher than previous wave
Don't know, 1%
% Rating 4 or 5, 69%, significantly lower than total, significantly lower than previous wave
CPP
5 - Strongly agree, 58%, significantly higher than total
Rated 4, 25%
Rated 3, 10%
Rated 2, 3%, significantly lower than total
1 - Strongly disagree, 4%, significantly lower than total
% Rating 4 or 5, 82%, significantly higher than total
CPP-D
5 - Strongly agree, 26%, significantly lower than total, significantly lower than previous wave
Rated 4, 22%
Rated 3, 20%, significantly higher than total
Rated 2, 12%, significantly higher than total, significantly higher than previous wave
1 - Strongly disagree, 17%, significantly higher than total
Not applicable, 1%
Don't know, 1%
% Rating 4 or 5, 48%, significantly lower than total, significantly lower than previous wave
SIN
5 - Strongly agree, 61%, significantly higher than total
Rated 4, 21%
Rated 3, 10%
Rated 2, 5%
1 – Strongly disagree, 2%, significantly lower than total
Don't know, 1%
% Rating 4 or 5, 82%, significantly higher than total
OAS/GIS
5 - Strongly agree, 54%, significantly lower than previous wave
Rated 4, 23%
Rated 3,12%, significantly higher than previous wave
Rated 2, 3%, significantly lower than total
1 - Strongly disagree, 3%, significantly lower than total
Not applicable, 4%, significantly higher than total, significantly higher than previous wave
Don't know, 1%
% Rating 4 or 5, 77%, significantly lower than previous wave
Q36b. Thinking about the overall service you received, from getting information about [INSERT ABBREV] to receiving a decision, how much do you agree or disagree with the following statements, using a 5-point scale (where 1 means strongly disagree, and 5 means strongly agree)?
Base: All respondents (n=4200)
Reported Duration of End-to-End Journey
Most clients reported that their client journey took 4 weeks or less- three in ten said it took between one day to 2 weeks, one quarter between 2 to 4 weeks and one in ten who took one day. Roughly one in ten reported their client journey took between 4 to 6 weeks or between 8 weeks to 6 months. Compared to 2018-19 (when this question was last asked), clients were more likely to report it took between 2 to 4 weeks or more than 8 weeks, while fewer said it took one day or between 4 to 6 weeks.
SIN clients were more likely to have reported their client journey took 2 weeks or less (and in particular that it took one day) compared to all clients and EI clients between one day to 4 weeks. CPP-D clients and to a lesser extent OAS/GIS clients were more likely to say their client journey took between 8 weeks to 6 months or more than 6 months, while CPP clients were more likely to report it took between 4 weeks to 6 months.
Compared to 2018-19, clients of all programs except CPP-D were more likely to report their client journey took more than 8 weeks. CPP clients were also more likely to say it took between 6 to 8 weeks and SIN clients between 2 to 4 weeks.
Figure long description
One day
Total
2018-19, 15%
2021-22, 12%, significantly lower than previous wave
EI
2018-19, 4%
2021-22, 4%, significantly lower than total
CPP
2018-19, 7%
2021-22, 3%, significantly lower than total, significantly lower than previous wave
SIN
2018-19, 40%
2021-22, 30%, significantly higher than total, significantly lower than previous wave
OAS/GIS
2018-19, 10%
2021-22, 8%, significantly lower than total
Between one day and 2 weeks,
Total
2018-19, 29%
2021-22, 29%
EI
2018-19, 32%
2021-22, 33%, significantly higher than total
CPP
2018-19, 17%
2021-22, 13%, significantly lower than total, significantly lower than previous wave
CPP-D
2018-19, 3%
2021-22, 3%, significantly lower than total
SIN
2018-19, 36%
2021-22, 36%, significantly higher than total
OAS/GIS
2018-19, 16%
2021-22, 13%, significantly lower than total
Between 2 to 4 weeks
Total
2018-19, 22%
2021-22, 24%, significantly higher than previous wave
EI
2018-19, 31%
2021-22, 31%, significantly higher than total
CPP
2018-19, 22%
2021-22, 19%, significantly lower than total
CPP-D
2018-19, 10%
2021-22, 7%, significantly lower than total, significantly lower than previous wave
SIN
2018-19, 10%
2021-22, 19%, significantly lower than total, significantly higher than previous wave
OAS/GIS
2018-19, 18%
2021-22, 14%, significantly lower than total, significantly lower than previous wave
Between 4 to 6 weeks
Total
2018-19, 13%
2021-22, 10%, significantly lower than previous wave
EI
2018-19, 16%
2021-22, 10%, significantly lower than previous wave
CPP
2018-19, 20%
2021-22, 18%, significantly higher than total
CPP-D
2018-19, 12%
2021-22, 11%
SIN
2018-19, 5%
2021-22, 6%, significantly lower than total
OAS/GIS
2018-19, 14%
2021-22, 12%
Between 6 to 8 weeks
Total
2018-19, 6%
2021-22, 6%
EI
2018-19, 7%
2021-22, 6%
CPP
2018-19, 10%
2021-22, 15%, significantly higher than total, significantly higher than previous wave
CPP-D
2018-19, 9%
2021-22, 11%, significantly higher than total
SIN
2018-19, 3%
2021-22, 3%, significantly lower than total
OAS/GIS
2018-19, 7%
2021-22, 7%
More than 8 weeks (NET)
Total
2018-19, 10%
2021-22, 14%, significantly higher than previous wave
EI
2018-19, 8%
2021-22, 12%, significantly higher than previous wave
CPP
2018-19, 18%
2021-22, 25%, significantly higher than total, significantly higher than previous wave
CPP-D
2018-19, 63%
2021-22, 65%, significantly higher than total
SIN
2018-19, 3%
2021-22, 5%, significantly lower than total, significantly higher than previous wave
OAS/GIS
2018-19, 20%
2021-22, 30%, significantly higher than total, significantly higher than previous wave
Between 8 weeks to 6 months
Total
2021-22, 11%
EI
2021-22, 10%
CPP
2021-22, 21%, significantly higher than total
CPP-D
2021-22, 40%, significantly higher than total
SIN
2021-22, 4%, significantly lower than total
OAS/GIS
2021-22, 20%, significantly higher than total
More than 6 months
Total
2021-22, 3%
EI
2021-22, 2%, significantly lower than total
CPP
2021-22, 4%
CPP-D
2021-22, 25%, significantly higher than total
SIN
2021-22, 1%, significantly lower than total
OAS/GIS
2021-22, 10%, significantly higher than total
Don't know
Total
2018-19, 5%
2021-22, 4%
EI
2018-19, 2%
2021-22, 4%, significantly higher than previous wave
CPP
2018-19, 7%
2021-22, 8%, significantly higher than total
CPP-D
2018-19, 3%
2021-22, 4%
SIN
2018-19, 4%
2021-22, 2%, significantly lower than total, significantly lower than previous wave
OAS/GIS
2018-19, 14%
2021-22, 15%, significantly higher than total
Q38d. And how long did your entire experience take from getting information about how to apply for [PROGRAM] to receiving a decision on your application?
Note: In 2021-22, additional response options were included in the survey question for ‘Between 8 to 6 months’ and ‘More than 6 months’ while in 2018-19 the longest option provided was ‘More than 8 weeks’
Base: All respondents (n=4200)
Highlights by Program
Satisfaction with Service Experience by Program
Compared to 2020-21, satisfaction among EI and OAS/GIS clients decreased. Satisfaction was stable for all other programs.
Satisfaction was higher among SIN clients compared to all clients, lower among EI clients and consistent with previous years remained lower for CPP-D clients.
Figure long description
Satisfaction With Service Experience (% Rated 4 Or 5) – Trending
EI
2017-18, n=4001, 83%
2018-19, n=4401, 80%
2019-20, n=2431, 77%
2020-21, n=4200, 84%
2021-22, n=4200, 76%, significantly lower than total, significantly lower than previous wave
CPP
2017-18, n=4001, 87%
2018-19, n=4401, 87%
2019-20, n=2431, 88%
2020-21, n=4200, 86%
2021-22, n=4200, 86%
CPP-D
2017-18, n=4001, 64%
2018-19, n=4401, 62%
2019-20, n=2431, 60%
2020-21, n=4200, 63%
2021-22, n=4200, 60%, significantly lower than total
SIN
2017-18, n=4001, 94%
2018-19, n=4401, 92%
2019-20, n=2431, 94%
2020-21, n=4200, 89%
2021-22, n=4200, 89%, significantly higher than total
OAS/GIS
2017-18, n=4001, 86%
2018-19, n=4401, 87%
2019-20, n=2431, 87%
2020-21, n=4200, 88%
2021-22, n=4200, 81%, significantly lower than previous wave
Q38a. How satisfied were you with the service you received from Service Canada related to your application? please use a 5-point scale, where 1 means very dissatisfied, and 5 means very satisfied.
Base: All respondents (n=4200)
CX Performance and Service Attributes – EI
Figure long description
CX Performance and Service Attributes – EI
Overall Satisfaction
76% Rated 4 or 5
Decrease in overall satisfaction from 2020-21 (84%).
Satisfaction was higher among Seniors 60+ (85%) and lower among Youth 18-34 (68%).
Satisfaction was lower among first time claimants (70%).
Channel Satisfaction
Decrease for online (71% vs. 77%), specialized call centres (63% vs. 70%) and 1 800 O-Canada (52% vs. 68%) from 2020-21.
Aware
Ease of understanding info about program: -6 pts
2021-22: 69%, significantly lower than total, significantly lower than previous wave
2020-21: 75%
2019-20: 72%
Ease of figuring out eligibility: -4 pts
2021-22: 69%, significantly lower than total
2020-21: 73%
2019-20: 66%
Find the info you needed within reasonable amount of time: -4 pts
2021-22: 69%, significantly lower than total
2020-21: 73%
2019-20: 70%
Ease of finding info about program
2021-22: 74%, significantly lower than total
2020-21: 74%
2019-20: 77%
Apply
Ease of putting together the information needed to apply: -4 pts
2021-22: 77%, significantly lower than total, significantly lower than total, significantly lower than previous wave
2020-21: 81%
2019-20: 75%
Ease of getting help on your application
2021-22: 58%, significantly lower than total
2020-21: 58%
Ease of MSCA registration: -14 pts, top 5 driver of satisfaction
2021-22: 51%, significantly lower than previous wave
2020-21: 65%
2019-20: 73%
Follow-up
Ease of following up on application: -6 pts
2021-22: 53%
2020-21: 59%
2019-20: 57%
Overall
Duration of client journey reasonable: -11 pts, top 5 driver of satisfaction
2021-22: 69%, significantly lower than total, significantly lower than previous wave
2020-21: 80%
2019-20: 68%
Overall ease: -4 pts
2021-22: 83%, significantly lower than previous wave
2020-21: 87%
2019-20: 84%
Process was clear: -10 pts
2021-22: 67%, significantly lower than total, significantly lower than previous wave
2020-21: 77%
2019-20: 65%
Overall effectiveness: -5 pts
2021-22: 78%, significantly lower than total, significantly lower than previous wave
2020-21: 83%
2019-20: 76%
Received consistent information: -6 pts, top 5 driver of satisfaction
2021-22: 76%, significantly lower than total, significantly lower than previous wave
2020-21: 82%
2019-20: 76%
Clear process if had issue: -3 pts, top 5 driver of satisfaction
2021-22: 72%, significantly lower than total
2020-21: 75%
2019-20: 74%
Confidence in issue resolution: -4 pts
2021-22: 69%, significantly lower than total, significantly lower than previous wave
2020-21: 73%
2019-20: 72%
Trust: -7 pts
2021-22: 75%, significantly lower than total, significantly lower than previous wave
2020-21: 82%
2019-20: 77%
33% followed up with Service Canada to check on the status of their application (28% in 2020-21).
19% provided additional information (13% in 2020-21).
28% were contacted by Service Canada about their application status (27% in 2020-21).
Base: EI clients (n=987)
Margin of Error +/- 3.1 percentage points. Within this, sample size varies by statement.
Qualitative Insights on EI
Participants from the EI focus groups discussed the impacts of the pandemic on (un)employment and sudden workplace closures. They described what they felt was a need for the program to change and evolve accordingly, especially since they anticipated continued economic uncertainty stemming from the pandemic.
The program was perceived to be designed for a “normal” work year with a certain number of hours required, and participants said that the pandemic work reality was different.
Further, it was suggested that there could be program adjustments that would better respond to career transitions that resulted from the pandemic.
I think it was designed for normal work year, and it definitely wasn’t a normal work year, just with the amount of change and job loss, and then rehire, but then fired after three weeks, or closed after three weeks. COVID made it all different. I think if the system was a bit more flexible, had a back button, or was able to work with appeals quicker, then it would have been a bit better for the circumstances.
II’m just wondering, because I don’t know how the government works and how they communicate with our employers, are employer’s given a course on ROEs, on sick benefits or laying somebody off? Are they given all of this? Are they told that this is, you know, the exact amount of time you have to submit said ROE? Like do they get that, or do they have to research that themselves? Because there was a point where I felt like I was telling them, ‘No, you don’t have to wait for that, I need that now, I’m done working right now’.
CX Performance and Service Attributes – CPP
Figure long description
CX Performance and Service Attributes – CPP
Overall Satisfaction
86% rated 4 or 5
Stable with previous waves.
There were no significant differences by age, gender, or region.
Channel Satisfaction
Decrease in satisfaction for online (68% vs. 74%) from 2020-21.
Aware
Find the info you needed within reasonable amount of time: -6 pts
2021-22: 72%, significantly lower than previous wave
2020-21: 79%
2019-20: 81%
Ease of figuring out eligibility: -8 pts
2021-22: 81%, significantly higher than total
2020-21: 80%
2019-20: 83%
Apply
Ease of understanding requirements of application: -4 pts
2021-22: 81%, significantly lower than previous wave
2020-21: 85%
2019-20: 80%
Ease of getting help on application: -4 pts
2021-22: 59%
2020-21: 63%
Ease of MSCA registration: +2 pts, top 5 driver of satisfaction
2021-22: 59%
2020-21: 57%
2019-20: 60%
Follow-up
Ease of following up on application: -4 pts
2021-22: 64%, significantly higher than total
2020-21: 68%
2019-20: 68%
Overall
Duration of client journey reasonable: +1 pt
2021-22: 82%, significantly higher than total,
2020-21: 81%
2019-20: 83%
Trust: -5 pts
2021-22: 74%, significantly lower than total, significantly lower than previous wave
2020-21: 81%
2019-20: 83%
Process was clear: -5 pts
2021-22: 75%, significantly lower than previous wave
2020-21: 80%
2019-20: 80%
Completing steps online made it easier: -5 pts
2021-22: 61%, significantly lower than total, significantly lower than previous wave
2020-21: 62%
2019-20: 60%
Protected your safety during COVID : +2 pts
2021-22: 84%, significantly lower than total
2020-21: 82%
Confident personal info protected: -1 pt
2021-22: 81%, significantly lower than total
2020-21: 82%
2019-20: 82%
Specialized call centre staff were helpful: -2 pts, top 5 driver of satisfaction
2021-22: 83%
2020-21: 85%
2019-20: 72%
Clear process if had issue: -4 pts, top 5 driver of satisfaction
2021-22: 74%
2020-21: 78%
2019-20: 81%
Base: CPP clients (n=768)
Margin of Error +/- 3.5 percentage points. Within this, sample size varies by statement.
Qualitative Insights from Senior Clients
Seniors applying to CPP and OAS/GIS called for greater certainty on their application status for planning purposes when applying for these programs. The availability of non-online service channels was of great importance.
Many spoke of their desire to have non-online service channel options available to them, such as phone and in-person, as they do not feel sufficiently technically savvy or have the necessary equipment to get information, apply and follow up online. These non-online options should be quick with reasonable wait times.
Some were unsure of their eligibility or the amount of the benefit, and without a status update or an advanced decision these individuals were unable to confidently plan ahead and budget.
I just find that kind of frustrating because it’s a year-long process and nothing was, I didn’t know anything until two weeks before I was going to get my money. But the Service Canada rep here in town was actually really nice, and she looked up my account, but she just couldn’t tell from the head office or government office, wherever it is, what was going on with the actual deposit, if that makes sense. Yeah, the initial application was fine and easy, it’s just I didn’t know what was going on until literally two weeks before, like for me it would be January 27th or whatever it was that I got my money.
CX Performance and Service Attributes – CPP-D
Figure long description
CX Performance and Service Attributes – CPP-D
Overall Satisfaction
60% rated 4 or 5
Stable with previous waves.
There were no significant differences by age, gender, or region.
Channel Satisfaction
Increased for MSCA (69% vs. 52%) and decreased for eServiceCanada (49% vs. 66%) from 2020-21.
Aware
Ease of finding info about program: -8 pts
2021-22: 55%, significantly lower than total, significantly lower than previous wave
2020-21: 63%
2019-20: 57%
Ease of understanding information about program: -12 pts, top 5 driver of satisfaction
2021-22: 48%, significantly lower than total, significantly lower than previous wave
2020-21: 60%
2019-20: 48%
Ease of finding what info you need to provide: -8 pts
2021-22: 54%, significantly lower than total, significantly lower than previous wave
2020-21: 62%
2019-20: 55%
Find the info you needed within reasonable amount of time: -4 pts, top 5 driver of satisfaction
2021-22: 55%, significantly lower than total
2020-21: 61%
2019-20: 53%
Apply
Ease of putting together the information needed to apply
2021-22: 44%, significantly lower than total
2020-21: 44%
2019-20: 43%
Ease of getting help on your application: +3 pts
2021-22: 48%, significantly lower than total
2020-21: 45%
Ease of MSCA registration: -8 pts
2021-22: 35%, significantly lower than total
2020-21: 43%
2019-20: 48%
Follow-up
Ease of following up on application: -4 pts, top 5 driver of satisfaction
2021-22: 48%, significantly lower than total
2020-21: 52%
2019-20: 48%
Overall
Duration of client journey reasonable: -9 pts
2021-22: 48%, significantly lower than total, significantly lower than previous wave
2020-21: 57%
2019-20: 49%
Trust: -6 pts
2021-22: 61%, significantly lower than total, significantly lower than previous wave
2020-21: 67%
2019-20: 64%
Specialized call centre staff were helpful: +6 pts, top 5 driver of satisfaction
2021-22: 74%, significantly lower than total
2020-21: 68%
2019-20: 68%
1 800 O-Canada staff were helpful: +14 pts
2021-22: 81%, significantly higher than previous wave
2020-21: 67%
Process was clear: -4 pts
2021-22: 52%, significantly lower than total
2020-21: 56%
2019-20: 51%
Confidence in issue resolution: +1 pt
2021-22: 57%, significantly lower than total
2020-21: 56%
2019-20: 51%
Base: CPP-D clients (n=761)
Margin of Error +/- 3.5 percentage points. Within this, sample size varies by statement.
Qualitative Insights on CPP-D
Most CPP-D participants required a lot of support in completing and submitting their applications. Many felt the application form is long and onerous to complete. The necessary documentation also requires a lot of time and energy to assemble.
When it came to applying, the most frequently identified challenges were related to the length of the application form, as well as the type of information required to complete the form.
Those who did not have support, or began their application without support, found the process overwhelming.
A variety of sources provided support, including doctors, social workers, and insurance companies.
I received the package, and at the time it was very overwhelming for me. I had recently lost my son and I'd also lost my daughter previously, and my husband was dying of cancer, so I just was in an emotional and mental bad place. So it was very hard for me to concentrate on trying to figure this all out. I started filling it out and then my anxiety just went through the roof every time I tried to do anything, because it just, it was asking why I was on disability and that sort of thing, and it just kept bringing up emotions. So I had let it go, just let it go and kept trying, let it go and then kept trying and [the insurance company said] we'll get a third party to come and help you fill it out and get the information that you need.
CX Performance and Service Attributes – OAS/GIS
Figure long description
CX Performance and Service Attributes – OAS/GIS
Overall Satisfaction
81% rated 4 or 5
Decrease in overall satisfaction from 2020-21 (88%).
Satisfaction was lower among Seniors 70+ (68%), although this represents only 5% of OAS/GIS clients.
Channel Satisfaction
Decrease in satisfaction for online (78% vs. 66%) from 2020-21.
Aware
Ease of understanding information about program: -17 pts, top five driver of satisfaction
2021-22: 67%, significantly lower than total, significantly lower than previous wave
2020-21: 84%
2019-20: 81%
Ease of finding out what information needed to provide when applying: -8 pts
2021-22: 66%, significantly lower than total
2020-21: 72%
2019-20: 83%
Ease of figuring out eligibility: -9 pts, top five driver of satisfaction
2021-22: 73%
2020-21: 82%
2019-20: 84%
Ease of finding out the steps to apply: -6 pts, top five driver of satisfaction
2021-22: 72%
2020-21: 80%
2019-20: 76%
Apply
Ease of understanding requirements of application: -6 pts
2021-22: 79%, significantly lower than previous wave
2020-21: 85%
2019-20: 83%
Ease of getting help on your application
2021-22: 54%, significantly lower than total, significantly lower than previous wave
2020-21: 61%
Follow-up
Ease of following up on application: -11 pts, top 5 driver of satisfaction
2021-22: 59%, significantly lower than previous wave
2020-21: 70%
2019-20: 77%
Overall
Duration of client journey reasonable: -8 pts, Top five driver of satisfaction
2021-22: 77% significantly lower than previous wave
2020-21: 85%
2019-20: 85%
Overall ease: -8 pts
2021-22: 80%, significantly lower than total, significantly lower than previous wave
2020-21: 88%
2019-20: 92%
Process was clear: -6 pts
2021-22: 77%, significantly lower than previous wave
2020-21: 83%
2019-20: 81%
Need to explain your situation once: -9 pts
2021-22: 69%, significantly lower than total, significantly lower than previous wave
2020-21: 78%
2019-20: 80%
Overall effectiveness: -9 pts
2021-22: 78%, significantly lower than total, significantly lower than previous wave
2020-21: 87%
2019-20: 88%
Received consistent information: -11 pts
2021-22: 76%, significantly lower than previous wave
2020-21: 87%
2019-20: 82%
Clear process if had issue: -10 pts
2021-22: 74%, significantly lower than previous wave
2020-21: 84%
2019-20: 80%
Confidence in issue resolution: -14 pts
2021-22: 68%, significantly lower than total, significantly lower than previous wave
2020-21: 82%
2019-20: 77%
Ease of getting help when needed: -14 pts
2021-22: 57%, significantly lower than total, significantly lower than previous wave
2020-21: 71%
2019-20: 74%
Base: OAS/GIS clients (n=809)
Margin of Error +/- 3.4 percentage points. Within this, sample size varies by statement.
Qualitative Insights on OAS/GIS
Dissatisfaction among OAS/GIS participants was associated with:
Uncertainty about eligibility for OAS/GIS – some were unsure whether they qualified.
Finding out about acceptance very close to when payment was received. The OAS/GIS clients who applied a year or six months in advance did not know if their application was accepted in advance. An advanced notification on their application would ease their anxiety about not having income support that they are relying on when they retire.
Confusion about the application, and difficulties with the application process generally.
Technical issues (unrelated to technical facility of the participant).
Uncertainty and confusion about applying for CPP at the same time.
Receiving a notice of recovery of overpayment.
And then, my other issue is, because I retired, I worked last year, I worked in 2021. In 2022, I have no income, no pension, other than government. And so, what happened was now I’ve got this, so I received the OAS claw back letter, where you made too much money last year, so we’re taking this money from you. And then it was like fill out this form and do this, or whatever, and then another whole episode started again.
So then, I tried calling them, I phoned the 1-800 number, and then they gave me another number and said, ‘No, you’re not supposed to talk to me, you’re supposed to talk to this person’. Sent me over, gave me a phone number and they said, ‘Well, they always say that, but it’s not me you’re supposed to talk to, you’re supposed to talk to this other person’, and blah blah blah blah.
So, I said the heck with it, and I just folded it up and you can have my money, I don’t want it. It’s too much, you know. It’s like because it’s going on for days and days and days, and it’s like really?
CX Performance and Service Attributes – SIN
Figure long description
CX Performance and Service Attributes – SIN
Overall Satisfaction
89% rated 4 or 5
Stable with previous waves.
Satisfaction was highest among clients in Atlantic Canada (97%) and lowest among clients in the West (87%) and Ontario (88%).
Channel Satisfaction
Decreased for in-person (85% vs. 91%) and 1 800 O-Canada (66% vs. 90%) from 2020-21.
Aware
Ease of finding info on program: +1 pt
2021-22: 87%, significantly higher than total
2020-21: 86%
2019-20: 81%
Ease of understanding info on program: +1 pt
2021-22: 87%, significantly higher than total
2020-21: 86%
2019-20: 86%
Ease of finding out the steps to apply: -3 pts, top 5 driver of satisfaction
2021-22: 82%
2020-21: 85%
2019-20: 81%
Apply
Able to complete application in reasonable time: -4 pts, top 5 driver of satisfaction
2021-22: 84%, significantly higher than total, significantly lower than previous wave
2020-21: 88%
2019-20: 87%
Ease of completing application: +1 pt
2021-22: 90%, significantly higher than total
2020-21: 89%
Follow-up
Ease of following up on application: -8 pts
2021-22: 64%
2020-21: 72%
2019-20: 73%
Overall
Duration of client journey reasonable: -3 pts, top 5 driver of satisfaction
2021-22: 82%, significantly higher than total
2020-21: 85%
2019-20: 89%
Clarity of process: -4 pts
2021-22: 84%, significantly higher than total, significantly lower than previous wave
2020-21: 88%
2019-20: 83%
Service Canada in-person representatives were helpful: -3 pts, top 5 driver of satisfaction
2021-22: 92%, significantly higher than total, significantly lower than previous wave
2020-21: 95%
2019-20: 96%
Service Canada phone representatives that called back were helpful: -11 pts
2021-22: 78%, significantly lower than previous wave
2020-21: 89%
Travelled reasonable distance to access service: -10pts
2021-22: 73%, significantly lower than previous wave
2020-21: 83%
2019-20: 79%
Access to service in language I understand: -3 pts
2021-22: 93%, significantly lower than previous wave
2020-21: 96%
2019-20: 94%
Base: SIN clients (n=875)
Margin of Error +/- 3.3 percentage points. Within this, sample size varies by statement.
Qualitative Insights on SIN
Participants from the SIN focus groups described a sense of urgency about applying for a SIN, and so they were looking for the fastest way to obtain one, which based on their research and discussions with others, was in person. As such, most participants applied in person at a Service Canada office. A few described long line ups in cold weather and assumed that line ups were due to COVID protocols or staff shortages.
They tried various strategies to mitigate wait times, such as Google searches for line-ups/wait times for Service Canada locations in their area, or recommended locations through social media and friends. The service they received in person (after moving past the outdoor line-up) was typically fast, friendly, and effective in receiving a SIN on the spot.
I thought that Google Reviews had mostly the truth, and so I got the nearest branch. It was in Mississauga, and I went there, and it was like 10, 15 minutes in the queue, and I got my SIN number that day. I didn’t want to go online, because like everybody is saying, it takes a long time, and I tried to call them before in the office, the Mississauga office, but nobody would pick up. So, that was inconvenient for me, so I just tried to base my opinion on the reviews, and I was hoping they were true that it won’t take long. But hopefully, there was a lot of information there as well, because sometimes you don’t get parking in the lot. You could see all the information in the reviews.
SIN vs. eSIN
Overall satisfaction was higher among SIN and eSIN clients compared to all clients.
SIN and eSIN clients provided higher ratings for the quality of service provided online and through specialized call centres, while SIN clients also provided higher ratings for in-person service and eServiceCanada.
Figure long description
Overall Satisfaction
SIN, n=564
5 - Very satisfied, 64%
Rated 4, 26%, significantly higher than total
Rated 3, 6%, significantly lower than total
Rated 2, 1%
1 - Very dissatisfied, 1%
% Rating 4 or 5, 90%, significantly higher than total
eSIN, n=278
5 - Very satisfied, 58%
Rated 4, 29%, significantly higher than total
Rated 3, 9%
Rated 2, 2%
1 - Very dissatisfied, 1%
% Rating 4 or 5, 87%, significantly higher than total
Figure long description
Service Channel Satisfaction (% Rated 4 or 5)
In person
SIN, 87%, significantly higher than total
eSIN, 77%
Online
SIN, 88%, significantly higher than total
eSIN, 88%, significantly higher than total
Specialized Call Centre
SIN, 87%, significantly higher than total
eSIN, 88%, significantly higher than total
eServiceCanada
SIN, 90%, significantly higher than total
*small sample size. Results should be interpreted with caution. **sample sizes too small for reporting.
Base: SIN/ eSIN clients
SIN and eSIN clients provided higher ratings across several service attributes compared to all clients. Gaps were consistently larger among SIN clients and notably SIN clients also provided higher ratings for the ease of follow-up, timeliness of service and clarity of the issue resolution process.
The largest gaps among SIN clients were for the ease of follow-up, ease of getting help when needed in general and on their application and confidence in issue resolution, while the largest gaps among eSIN clients were for the ease of understanding information about the program, being able to find the information they needed in a reasonable amount of time and being able to move smoothly through all steps.
Figure long description
WIDEST GAP IN SERVICE ATTRIBUTES (% RATED 4 OR 5 VS. TOTAL)
Ease of follow-up
SIN, 83%, significantly higher than total
GAP Vs. Total, +28 points
eSIN, 59%
GAP Vs. Total, +4 points
It was easy to get help when you needed it
SIN, 87%, significantly higher than total
GAP Vs. Total, +19 points
eSIN, 77%, significantly higher than total
GAP Vs. Total, +9 points
Ease of getting help on your application
SIN, 83%, significantly higher than total
GAP Vs. Total, +19 points
eSIN, 70%, significantly higher than total
GAP Vs. Total, +6 points
Confident that any issues or problems would have been easily resolved
SIN, 89%, significantly higher than total
GAP Vs. Total, +16 points
eSIN, 79%, significantly higher than total
GAP Vs. Total, +6 points
It was clear what would happen next and when
SIN, 87%, significantly higher than total
GAP Vs. Total, +13 points
eSIN, 82%, significantly higher than total
GAP Vs. Total, +8 points
Ease of understanding information about the program
SIN, 87%, significantly higher than total
GAP Vs. Total, +13 points
eSIN, 87%, significantly higher than total
GAP Vs. Total, +13 points
The amount of time, from start to finish, was reasonable
SIN, 87%, significantly higher than total
GAP Vs. Total, +12 points
eSIN, 74%
GAP Vs. Total, -1 point
Needed to explain your situation only once
SIN, 86%, significantly higher than total
GAP Vs. Total, +12 points
eSIN, 81%, significantly higher than total
GAP Vs. Total, +7 points
Ease of putting together the information you needed to provide when applying
SIN, 92%, significantly higher than total
GAP Vs. Total, +12 points
eSIN, 85%, significantly higher than total
GAP Vs. Total, +5 points
Ease of finding out what information you needed to provide when applying
SIN, 87%, significantly higher than total
GAP Vs. Total, +11 points
eSIN, 83%, significantly higher than total
GAP Vs. Total, +7 points
It was clear what to do if you had a problem or question
SIN, 87%, significantly higher than total
GAP Vs. Total, 11%
eSIN, 81%
GAP Vs. Total, +5 points
You were able to find the information you needed within a reasonable amount of time
SIN, 83%, significantly higher than total
GAP Vs. Total, +9 points
eSIN, 85%, significantly higher than total
GAP Vs. Total, +11 points
Able to move smoothly through all steps
SIN, 91%, significantly higher than total
GAP Vs. Total, +9 points
eSIN, 93%, significantly higher than total
GAP Vs. Total, +11 points
Base: SIN/ eSIN clients
OAS/GIS- Auto-Enroll and Non Auto-Enroll Clients
Overall satisfaction was consistent among Auto-Enroll and Non Auto-Enroll clients compared to all clients.
Satisfaction decreased among Non Auto-Enroll clients compared to 2020-21 and was consistent among Auto-Enroll clients.
Non Auto-Enroll clients provided lower ratings for online and eServiceCanada and higher ratings for 1 800 O-Canada.
Compared to 2020-21, Non Auto-Enroll clients provided lower ratings for the service provided online.
Figure long description
Overall Satisfaction (% Rated 4 Or 5) – Trending
2018-19
Auto-Enroll, 88%
Non Auto-Enroll, 86%
2019-20
Auto-Enroll, 84%
Non Auto-Enroll, 92%
2020-21
Auto-Enroll, 88%
Non Auto-Enroll, 88%
2021-22
Auto-Enroll, 84%
Non Auto-Enroll, 78%, significantly lower than previous wave
Service Channel Satisfaction (% Rated 4 or 5)
In person
Auto-Enroll
2018-19, 83%
2019-20, 88%
Non Auto-Enroll
2018-19, 85%
2019-20, 86%
2020-21, 84%
2021-22, 81%
Online
Auto-Enroll
2018-19, 73%
2019-20, 77%
Non Auto-Enroll
2018-19, 75%
2019-20, 72%
2020-21, 78%
2021-22, 66, significantly lower than total, significantly lower than previous wave
Specialized Call Centre
Auto-Enroll
2018-19, 785
2019-20, 68%
2020-21, 80%
2021-22, 71%
Non Auto-Enroll
2018-19, 79%
2019-20, 61%
2020-21, 74%
2021-22, 74%
1 800 O-Canada
Auto-Enroll
2018-19, 75%
2019-20, 87%
Non Auto-Enroll
2018-19, 71%
2019-20, 63%
2020-21, 67%
2021-22, 67%, significantly higher than total
My Service Canada Account
Auto-Enroll
2019-20, 77%
2020-21, 64%
2021-22, 70%
Non Auto-Enroll
2019-20, 69%
2020-21, 69%
2021-22, 60%
eServiceCanada
Auto-Enroll
2021-22, 69%
Non Auto-Enroll
2020-21, 56%
2021-22, 61%, significantly lower than total
*small sample size. Results should be interpreted with caution. **sample sizes too small for reporting.
Both Auto-Enroll and Non Auto-enroll clients provided lower ratings for confidence in issue resolution, ease of getting help when needed and confidence that their personal information was protected compared to all clients. Non-Auto Enroll clients also provided lower ratings for needing to explain their situation only once, while Auto-Enroll clients provided higher ratings for clarity of process and lower ratings for the provision of service in their choice of official language.
Compared to 2020-21, both Auto-Enroll and Non-Auto Enroll clients provided lower ratings for clarity of and confidence in the issue resolution process, clarity of process overall, ease of getting help when needed and confidence their personal information was protected. Auto-Enroll clients also provided lower ratings for needing to explain their situation only once, while Non Auto-Enroll clients provided higher ratings for the provision of service in their choice of official language.
Figure long description
Widest Gap Vs. Total & Change Vs. 2020-21 In Service Attributes (% Rated 4 Or 5)
It was clear what to do if you had a problem or question
2018-19
Auto-Enroll, 78%
Non Auto-Enroll, 79%
2019-20
Auto-Enroll, 75%
Non Auto-Enroll, 87%
2020-21
Auto-Enroll, 85%
Non Auto-Enroll, 83%
2021-22
Auto-Enroll, 75%, significantly lower than previous wave
Non Auto-Enroll, 73%, significantly lower than previous wave
Throughout the process it was clear what would happen next and when it would happen
2018-19
Auto-Enroll, 81%
Non Auto-Enroll, 75%
2019-20
Auto-Enroll, 78%
Non Auto-Enroll, 85%
2020-21
Auto-Enroll, 85%
Non Auto-Enroll, 81%
2021-22
Auto-Enroll, 79%, significantly higher than total, significantly lower than previous wave
Non Auto-Enroll, 74%, significantly lower than previous wave
Confident that any issues or problems would have been easily resolved
2018-19
Auto-Enroll, 77%
Non Auto-Enroll, 78%
2019-20
Auto-Enroll, 73%
Non Auto-Enroll, 84%
2020-21
Auto-Enroll, 82%
Non Auto-Enroll, 81%
2021-22
Auto-Enroll, 68%, significantly lower than total, significantly lower than previous wave
Non Auto-Enroll, 67%, significantly lower than total, significantly lower than previous wave
You needed to explain your situation only once
2018-19
Auto-Enroll, 76%
Non Auto-Enroll, 75%
2019-20
Auto-Enroll, 76%
Non Auto-Enroll, 86%
2020-21
Auto-Enroll, 83%
Non Auto-Enroll, 70%
2021-22
Auto-Enroll, 70%, significantly lower than previous wave
Non Auto-Enroll, 68%, significantly lower than total
It was easy to get help when you needed it
2018-19
Auto-Enroll, 69%
Non Auto-Enroll, 74%
2019-20
Auto-Enroll, 70%
Non Auto-Enroll, 80%
2020-21
Auto-Enroll, 70%
Non Auto-Enroll, 72%
2021-22
Auto-Enroll, 55%, significantly lower than total, significantly lower than previous wave
Non Auto-Enroll, 59%, significantly lower than total, significantly lower than previous wave
You were provided with service in your choice of English or French
2018-19
Auto-Enroll, 98%
Non Auto-Enroll, 98%
2019-20
Auto-Enroll, 94%
Non Auto-Enroll, 98%
2020-21
Auto-Enroll, 97%
Non Auto-Enroll, 91%
2021-22
Auto-Enroll, 95%, significantly lower than total
Non Auto-Enroll, 96%, significantly higher than previous wave
Confident that your personal information was protected
2018-19
Auto-Enroll, 82%
Non Auto-Enroll, 84%
2019-20
Auto-Enroll, 75%
Non Auto-Enroll, 86%
2020-21
Auto-Enroll, 86%
Non Auto-Enroll, 85%
2021-22
Auto-Enroll, 79%, significantly lower than total, significantly lower than previous wave
Non Auto-Enroll, 78%, significantly lower than total, significantly lower than previous wave
Both Auto-Enroll and Non Auto-enroll clients provided higher ratings compared to all clients for the helpfulness of specialized call centre staff and lower ratings for being provided service in a way that protected them during the pandemic. Auto-Enroll clients also provided higher ratings for the ease of follow-up and lower ratings for the helpfulness of in person staff. Non-Auto Enroll clients also provided lower ratings for receiving consistent information and access to service in a language they would understand well.
Compared to 2021-20, both Auto-Enroll and Non-Auto Enroll clients provided lower ratings for receiving consistent information and timeliness of service. Non Auto-Enroll clients also provided lower ratings for access to service in a language they could understand well and ease of follow-up and provided higher ratings for the helpfulness of in-person reps.
Figure long description
WIDEST GAP VS. TOTAL & CHANGE VS. 2020-21 IN SERVICE ATTRIBUTES (% RATED 4 OR 5)
Service Canada representatives that you dealt with in person were helpful
2019-20
Auto-Enroll, 91%
Non Auto-Enroll, 93%
2020-21
Auto-Enroll, 62%
Non Auto-Enroll, 73%
2021-22
Auto-Enroll, 58%, significantly lower than total
Non Auto-Enroll, 86%, significantly higher than previous wave
Service Canada specialized call centre phone representatives were helpful
2019-20
Auto-Enroll, 82%
Non Auto-Enroll, 83%
2020-21
Auto-Enroll, 90%
Non Auto-Enroll, 90%
2021-22
Auto-Enroll, 91%, significantly higher than total
Non Auto-Enroll, 88%, significantly higher than total
You received consistent information
2018-19
Auto-Enroll, 83%
Non Auto-Enroll, 81%
2019-20
Auto-Enroll, 77%
Non Auto-Enroll, 90%
2020-21
Auto-Enroll, 89%
Non Auto-Enroll, 85%
2021-22
Auto-Enroll, 78%, significantly lower than previous wave
Non Auto-Enroll, 73%, significantly lower than total, significantly lower than previous wave
It was easy to access service in a I could speak and understand well
2018-19
Auto-Enroll, 93%
Non Auto-Enroll, 91%
2019-20
Auto-Enroll, 92%
Non Auto-Enroll, 97%
2020-21
Auto-Enroll, 93%
Non Auto-Enroll, 95%
2021-22
Auto-Enroll, 92%
Non Auto-Enroll, 90%, significantly lower than total, significantly lower than previous wave
The amount of time it took, from start to finish, was reasonable
2018-19
Auto-Enroll, 79%
Non Auto-Enroll, 80%
2019-20
Auto-Enroll, 84%
Non Auto-Enroll, 88%
2020-21
Auto-Enroll, 87%
Non Auto-Enroll, 82%
2021-22
Auto-Enroll, 79%, significantly lower than previous wave
Non Auto-Enroll, 74%, significantly lower than previous wave
Service Canada representatives that you dealt with in person were respectful
2021-22
Auto-Enroll, 77%, significantly lower than total
Non Auto-Enroll, 91%
You were provided service in a way that protected your health and safety during the COVID-19 pandemic
2020-21
Auto-Enroll, 72%
Non Auto-Enroll, 67%
2021-22
Auto-Enroll, 80%, significantly lower than total
Non Auto-Enroll. 79%, significantly lower than total
Ease of follow-up
2019-20
Auto-Enroll, 75%
Non Auto-Enroll, 85%
2020-21
Auto-Enroll, 72%
Non Auto-Enroll, 67%
2021-22
Auto-Enroll, 64%, significantly higher than toal
Non Auto-Enroll, 54%, significantly lower than previous wave
Ease Service Attributes: Overall
At more than nine in ten, clients were most likely to agree it was easy to access service in a language they could speak and understand well, followed by closer to eight in ten who felt that overall it was easy to apply and that being able to complete steps online made the process easier. Three quarters of clients agreed that it was clear what would happen next and when and that they needed to explain their situation only once.
Compared to 2020-21, ratings have declined across all measures of ease except for being able to complete steps online made the process easier.
Figure long description
% Rated 4 or 5
It was easy to access service in a language I could speak and understand well
2021-22, 93%, significantly lower than previous wave
2020-21, 95%
2019-20, 94%
2018-19, 94%
Overall, it was easy for you to apply for [PROGRAM]+
2021-22, 82%, significantly lower than previous wave
2020-21, 86%
2019-20, 84%
2018-19, 85%
2017-18, 84%
Throughout the process, it was clear what would happen next and when it would happen
2021-22, 74%, significantly lower than previous wave
2020-21, 81%
2019-20, 73%
2018-19, 77%
Being able to complete steps online made the process easier for you
2021-22, 78%
2020-21, 80%
2019-20, 75%
2018-19, 74%
2017-18, 70%
You need to explain your situation only once
2021-22, 74%, significantly lower than previous wave
2020-21, 77%
2019-20, 78%
2018-19, 77%
2017-18, 77%
+For the first time, the overall ease metric was asked among SIN clients. To ensure year over year comparability, the SIN result was excluded from comparative calculations.
Note: Statements asked differently with different scale in 2017-18, interpret with caution.
Q36b. Thinking about the service you received, how much do you agree or disagree with the following statements.
Base: All answering (n=varies)
Ease Service Attributes: by Program
SIN clients were more likely to provide high ratings for all aspects of ease compared to all clients, while CPP-D clients and to a lesser extent OAS/GIS clients were less likely. EI clients were less likely to feel it was clear what would happen next and when and that they needed to explain their situation only once, while they provided higher ratings for being able to complete steps online made the process easier. CPP clients provided lower ratings for being able to complete steps online made the process easier.
Compared to 2020-21, EI, CPP, SIN and OAS/GIS clients were less likely to feel it was clear what would happen next and when, EI and OAS/GIS clients were also less likely to agree that overall it was easy to apply while OAS/GIS clients also provided lower ratings for needing to explain their situation only once. CPP-D clients were more likely to feel it was easy to access service in a language they could speak and understand well, while SIN clients were less likely.
Figure long description
Ease, % Rated 4 or 5
It was easy to access service in a language I could speak and understand well
TOTAL
2018-19, 94%
2019-20, 94%
2020-21, 95%
2021-22, 93%, significantly lower than previous wave
EI
2018-19, 96%
2019-20, 94%
2020-21, 95%
2021-22, 94%
CPP
2018-19, 92%
2019-20, 95%
2020-21, 92%
2021-22, 93%
CPP-D
2018-19, 90%
2019-20, 91%
2020-21, 85%
2021-22, 92%, significantly higher than previous wave
SIN
2018-19, 94%
2019-20, 94%
2020-21, 96%
2021-22, 93%, significantly lower than previous wave
OAS/GIS
2018-19, 92%
2019-20, 94%
2020-21, 93%
2021-22, 91%, significantly lower than total
Overall, it was easy for you to apply for [PROGRAM]+
TOTAL
2017-18, 84%
2018-19, 85%
2019-20, 84%
2020-21, 86%
2021-22, 82%, significantly lower than previous wave
EI
2017-18, 84%
2018-19, 86%
2019-20, 84%
2020-21, 87%
2021-22, 83%, significantly lower than previous wave
CPP
2017-18, 88%
2018-19, 88%
2019-20, 88%
2020-21, 85%
2021-22, 85%
CPP-D
2017-18, 57%
2018-19, 60%
2019-20, 55%
2020-21, 56%
2021-22, 55%, significantly lower than total
SIN
2017-18, 87%
2018-19, 87%
2021-22, 90%, significantly higher than total
OAS/GIS
2017-18, 84%
2018-19, 87%
2019-20, 92%
2020-21, 88%
2021-22, 80%, significantly lower than previous wave
Throughout the process, it was clear what would happen next and when it would happen
TOTAL
2018-19, 77%
2019-20, 73%
2020-21, 81%
2021-22, 74%, significantly lower than previous wave
EI
2018-19, 74%
2019-20, 65%
2020-21, 77%
2021-22, 67%, significantly lower than total, significantly lower than previous wave
CPP
2018-19, 78%
2019-20, 80%
2020-21, 80%
2021-22, 75%, significantly lower than previous wave
CPP-D
2018-19, 53%
2019-20, 51%
2020-21, 56%
2021-22, 52%, significantly lower than total
SIN
2018-19, 83%
2019-20, 83%
2020-21, 88%
2021-22, 84%, significantly higher than total, significantly lower than previous wave
OAS/GIS
2018-19, 78%
2019-20, 81%
2020-21, 83%
2021-22, 77%, significantly lower than previous wave
Being able to complete steps online made the process easier for you
TOTAL
2017-18, 70%
2018-19, 74%
2019-20, 75%
2020-21, 80%
2021-22, 78%
EI
2017-18, 82%
2018-19, 84%
2019-20, 82%
2020-21, 87%
2021-22, 85%, significantly higher than total
CPP
2017-18, 42%
2018-19, 52%
2019-20, 60%
2020-21, 62%
2021-22, 61%, significantly lower than total
CPP-D
2017-18, 29%
2018-19, 31%
2019-20, 37%
2020-21, 40%
2021-22, 40%, significantly lower than total
OAS/GIS
2017-18, 37%
2018-19, 36%
2019-20, 48%
2020-21, 56%
2021-22, 52%, significantly lower than total
You needed to explain your situation only once
TOTAL
2017-18, 77%
2018-19, 77%
2019-20, 78%
2020-21, 77%
2021-22, 74%, significantly lower than previous wave
EI
2017-18, 73%
2018-19, 72%
2019-20, 71%
2020-21, 72%
2021-22, 70%, significantly lower than total
CPP
2017-18, 80%
2018-19, 80%
2019-20, 83%
2020-21, 76%
2021-22, 75%
CPP-D
2017-18, 55%
2018-19, 54%
2019-20, 58%
2020-21, 55%
2021-22, 57%, significantly lower than total
SIN
2017-18, 85%
2018-19, 85%
2019-20, 88%
2020-21, 85%
2021-22, 84%, significantly higher than total
OAS/GIS
2017-18, 74%
2018-19, 75%
2019-20, 80%
2020-21, 78%
2021-22, 69%, significantly lower than total, significantly lower than previous wave
+For the first time, the overall ease metric was asked among SIN clients. To ensure year over year comparability, the SIN result was excluded from comparative calculations.
Note: Statements asked differently with different scale in 2017-18, interpret with caution.
Q36b. Thinking about the service you received, how much do you agree or disagree with the following statements.
Base: All answering (n=varies)
Ease of End-to-End Client Journey
Figure long description
EASE OF NAVIGATING END-TO-END JOURNEY
It was easy to access service in a language I could speak and understand well
5 – Strongly agree, 81%
Rated 4, 12%
Rated 3, 3%
Rated 2, 2%, significantly higher than previous wave
1 – Strongly disagree, 1%
% Rated 4 or 5
2019-20, 94%
2020-21, 95%
2021-22, 93%, significantly lower than previous wave
Overall, it was easy for you to apply for
5 – Strongly agree, 55%, significantly lower than previous wave
Rated 4, 27%
Rated 3, 11%, significantly higher than previous wave
Rated 2, 3%
1 – Strongly disagree, 3%
% Rated 4 or 5
2017-18, 84%
2018-19, 85%
2019-20, 84%
2020-21, 86%
2021-22, 82%, significantly lower than previous wave
Being able to complete steps online made the process easier for you
5 – Strongly agree, 56%, significantly lower than previous wave
Rated 4, 21%
Rated 3, 9%
Rated 2, 3%
1 – Strongly disagree, 4%, significantly higher than previous wave
Not applicable, 5%
Don’t know, 1%
% Rated 4 or 5
2017-18, 70%
2019-20, 75%
2020-21, 80%
2021-22, 78%
You needed to explain your situation only once
5 – Strongly agree, 57%
Rated 4, 17%
Rated 3, 9%
Rated 2, 5%
1 – Strongly disagree, 6%
Not applicable, 4%
Don’t’ know, 1%
% Rated 4 or 5
2017-18, 77%
2018-19, 77%
2019-20, 73%
2020-21, 77%
2021-22, 74%, significantly lower than previous wave
Throughout the process it was clear what would happen next and when it would happen
5 – Strongly agree, 50%, significantly lower than previous wave
Rated 4, 24%
Rated 3, 14%, significantly higher than previous wave
Rated 2, 6%, significantly higher than previous wave
1 – Strongly disagree, 5%, significantly higher than previous wave
Not applicable, 1%
Don’t know, 1%
% Rated 4 or 5
2018-19, 77%
2019-20, 78%
2020-21, 81%
2021-22, 74%, significantly lower than previous wave
+For the first time, the overall ease metric was asked among SIN clients. To ensure year over year comparability, the SIN result was excluded from comparative calculations; however, it is important to note that the client perception of EASE for the SIN application is high (90%) and will positively impact overall ease going forward.
Q36b. Thinking about the overall service you received, from getting information about [INSERT ABBREV] to receiving a decision, how much do you agree or disagree with the following statements, using a 5-point scale (where 1 means strongly disagree, and 5 means strongly agree)?
Base: All answering (varies)
Effectiveness Service Attributes: Overall
At nearly nine in ten, clients were most likely to agree that they were provided service in a way that protected them during the pandemic, followed by closer to eight in ten who agreed they were able to move smoothly through all steps and received consistent information. Three quarters of clients agreed that it was clear what to do if they had a problem or question or that the amount of time from start to finish was reasonable, while roughly seven in ten agreed that it was easy to get help when they needed it.
Compared to 2020-21, ratings have declined across all measures of ease except for being provided service in a way that protected them during the pandemic.
Figure long description
Effectiveness, % Rated 4 or 5
You were provided service in a way that protected your health and safety during the COVID-19 pandemic
2021-22, 87%
2020-21, 88%
You were able to move smoothly through all of the steps related to your application
2021-22, 82%, significantly lower than previous wave
2020-21, 85%
2019-20, 82%
2018-19, 84%
2017-18, 82%
You received consistent information
2021-22, 79%, significantly lower than previous wave
2020-21, 84%
2019-20, 80%
2018-19, 82%
The amount of time it took, from when you started gathering information to when you got a decision on your application, was reasonable
2021-22, 75%, significantly lower than previous wave
2020-21, 81%
2019-20, 77%
2018-19, 76%
2017-18, 77%
It was clear what to do if you had a problem or question
2021-22, 76%, significantly lower than previous wave
2020-21, 79%
2019-20, 78%
2018-19, 78%
2017-18, 78%
It was easy to get help when you needed it
2021-22, 68%, significantly lower than previous wave
2020-21, 71%
2019-20, 76%
2018-19, 77%
2017-18, 77%
Note: Statements asked differently with different scale in 2017-18, interpret with caution.
Q36b. Thinking about the service you received, how much do you agree or disagree with the following statements.
Base: All answering (n=varies)
Effectiveness Service Attributes: by Program
SIN clients were more likely to provide high ratings for all aspects of effectiveness compared to all clients, while CPP-D clients were less likely. EI clients were less likely to provide high ratings on all aspects except for being provided service in a way that protected them during the pandemic. OAS/GIS clients were less likely to agree that they were provided service in a way that protected them during the pandemic (along with CPP clients), were able to move smoothly through all steps and that it was easy to get help when needed.
Compared to 2020-21, OAS/GIS clients provided lower ratings across all aspects except for being provided service in a way that protected them during the pandemic. EI clients provided lower ratings for being able to move smoothly through all steps, receiving consistent information and timeliness of service. CPP-D clients provided higher ratings for being provided service in a way that protected them during the pandemic and lower ratings for timeliness of service.
Figure long description
Effectiveness, % Rated 4 or 5
You were provided service in a way that protected your health and safety during the COVID-19 pandemic
TOTAL
2020-21, 88%
2021-22, 87%
EI
2020-21, 90%
2021-22, 88%
CPP
2020-21, 82%
2021-22, 84%, significantly lower than total
CPP-D
2020-21, 75%
2021-22, 81%, significantly lower than total, significantly higher than previous wave
SIN
2020-21, 90%
2021-22, 90%, significantly higher than total
OAS/GIS
2020-21, 81%
2021-22, 80%, significantly lower than total
You were able to move smoothly through all of the steps related to your application
TOTAL
2017-18, 82%
2018-19, 84%
2019-20, 82%
2020-21, 85%
2021-22, 82%, significantly lower than previous wave
EI
2017-18, 77%
2018-19, 81%
2019-20, 76%
2020-21, 83%
2021-22, 78%, significantly lower than total, significantly lower than previous wave
CPP
2017-18, 84%
2018-19, 83%
2019-20, 85%
2020-21, 80%
2021-22, 81%
CPP-D
2017-18, 55%
2018-19, 62%
2019-20, 57%
2020-21, 58%
2021-22, 58%, significantly lower than total
SIN
2017-18, 90%
2018-19, 91%
2019-20, 91%
2020-21, 91%
2021-22, 91%, significantly higher than total
OAS/GIS
2017-18, 79%
2018-19, 84%
2019-20, 88%
2020-21, 87%
2021-22, 78%, significantly lower than total, significantly lower than previous wave
You received consistent information
TOTAL
2018-19, 82%
2019-20, 80%
2020-21, 84%
2021-22, 79%, significantly lower than previous wave
EI
2018-19, 79%
2019-20, 76%
2020-21, 82%
2021-22, 76%, significantly lower than total, significantly lower than previous wave
CPP
2018-19, 83%
2019-20, 85%
2020-21, 83%
2021-22, 80%
CPP-D
2018-19, 64%
2019-20, 59%
2020-21, 64%
2021-22, 63%, significantly lower than total
SIN
2018-19, 87%
2019-20, 86%
2020-21, 89%
2021-22, 87%, significantly higher than total
OAS/GIS
2018-19, 81%
2019-20, 82%
2020-21, 87%
2021-22, 76%, significantly lower than previous wave
The amount of time it took, from when you started gathering information to when you got a decision on your application, was reasonable
TOTAL
2017-18, 77%
2018-19, 76%
2019-20, 77%
2020-21, 81%
2021-22, 75%, significantly lower than previous wave
EI
2017-18, 73%
2018-19, 69%
2019-20, 68%
2020-21, 80%
2021-22, 69%, significantly lower than total, significantly lower than previous wave
CPP
2017-18, 80%
2018-19, 83%
2019-20, 83%
2020-21, 81%
2021-22, 82%, significantly higher than total
CPP-D
2017-18, 47%
2018-19, 49%
2019-20, 49%
2020-21, 57%
2021-22, 48%, significantly lower than total, significantly lower than previous wave
SIN
2017-18, 85%
2018-19, 87%
2019-20, 89%
2020-21, 85%
2021-22, 82%, significantly higher than total
OAS/GIS
2017-18, 75%
2018-19, 80%
2019-20, 85%
2020-21, 85%
2021-22, 77%, significantly lower than previous wave
It was clear what to do if you had a problem or question
TOTAL
2017-18, 78%
2018-19, 78%
2019-20, 78%
2020-21, 79%
2021-22, 76%, significantly lower than previous wave
EI
2017-18, 75%
2018-19, 77%
2019-20, 74%
2020-21, 75%
2021-22, 72%, significantly lower than total
CPP
2017-18, 77%
2018-19, 76%
2019-20, 81%
2020-21, 78%
2021-22, 74%
CPP-D
2017-18, 62%
2018-19, 63%
2019-20, 61%
2020-21, 60%
2021-22, 60%, significantly lower than total
SIN
2017-18, 85%
2018-19, 82%
2019-20, 84%
2020-21, 87%
2021-22, 85%, significantly higher than total
OAS/GIS
2017-18, 74%
2018-19, 78%
2019-20, 80%
2020-21, 84%
2021-22, 74%, significantly lower than previous wave
It was easy to get help when you needed it
TOTAL
2017-18, 77%
2018-19, 77%
2019-20, 76%
2020-21, 71%
2021-22, 68%, significantly lower than previous wave
EI
2017-18, 74%
2018-19, 72%
2019-20, 70%
2020-21, 65%
2021-22, 63%, significantly lower than total
CPP
2017-18, 75%
2018-19, 73%
2019-20, 73%
2020-21, 70%
2021-22, 68%
CPP-D
2017-18, 57%
2018-19, 59%
2019-20, 58%
2020-21, 53%
2021-22, 53%, significantly lower than total
SIN
2017-18, 87%
2018-19, 89%
2019-20, 89%
2020-21, 83%
2021-22, 84%, significantly higher than total
OAS/GIS
2017-18, 67%
2018-19, 72%
2019-20, 74%
2020-21, 71%
2021-22, 57%, significantly lower than total, significantly lower than previous wave
Note: Statements asked differently with different scale in 2017-18, interpret with caution.
Q36b. Thinking about the service you received, how much do you agree or disagree with the following statements.
Base: All answering (n=varies)
Effectiveness of End-to-End Client Journey
Figure long description
EFFECTIVENESS OF END-TO-END JOURNEY
You were provided service in a way that protected your health and safety during the COVID-19 pandemic
5 – Strongly agree, 72%, significantly lower than previous wave
Rated 4, 15%
Rated 3, 5%
Rated 2, 1%
1 – Strongly disagree, 2%
Not applicable, 4%
Don’t know, 1%
% Rated 4 or 5
2020-21, 88%
2021-22, 87%
You were able to move smoothly through all of the steps related to your application
5 – Strongly agree, 58%, significantly lower than previous wave
Rated 4, 24%
Rated 3, 11%
Rated 2, 4%
1 – Strongly disagree, 3%
% Rated 4 or 5
2017-18, 82%
2018-19, 84%
2019-20, 82%
2020-21, 85%
2021-22, 82%, significantly lower than previous wave
You received consistent information
5 – Strongly agree, 57%, significantly lower than previous wave
Rated 4, 22%
Rated 3, 11%
Rated 2, 3%
1 – Strongly disagree, 5%, significantly higher than previous wave
Not applicable, 1%
Don’t know, 1%
% Rated 4 or 5
2018-19, 82%
2019-20, 80%
2020-21, 84%
2021-22, 79%, significantly lower than previous wave
It was clear what to do if you had a problem or question
5 – Strongly agree, 53%, significantly lower than previous wave
Rated 4, 23%
Rated 3, 13%
Rated 2, 6%, significantly higher than previous wave
1 – Strongly disagree, 4%
Not applicable, 1%
Don’t know, 1%
% Rated 4 or 5
2017-18, 78%
2018-19, 78%
2019-20, 77%
2020-21, 79%
2021-22, 76%, significantly lower than previous wave
The amount of time it took, from when you started gathering information to when you got a decision on your application, was reasonable
5 – Strongly agree, 51%, significantly lower than previous wave
Rated 4, 23%
Rated 3, 12%
Rated 2, 5%, significantly higher than previous wave
1 – Strongly disagree, 7%, significantly higher than previous wave
Not applicable, 1%
Don’t know, 1%
% Rated 4 or 5
2017-18, 77%
2018-19, 76%
2019-20, 78%
2020-21, 81%
2021-22, 75%, significantly lower than previous wave
It was easy to get help when you needed it
5 – Strongly agree, 49%, significantly lower than previous wave
Rated 4, 20%
Rated 3, 14%
Rated 2, 6%
1 – Strongly disagree, 6%
Not applicable, 5%
Don’t know, 1%
% Rated 4 or 5
2017-18, 77%
2018-19, 77%
2019-20, 76%
2020-21, 71%
2021-22, 68%, significantly lower than previous wave
Q36b. Thinking about the overall service you received, from getting information about [INSERT ABBREV] to receiving a decision, how much do you agree or disagree with the following statements, using a 5-point scale (where 1 means strongly disagree, and 5 means strongly agree)?
Base: All answering (varies)
Emotion Service Attributes: Overall (1/3)
Clients were almost unanimous that they were provided service in their choice of English or French. Nearly nine in ten agreed that the Service Canada reps that they dealt with in-person were helpful, followed by that they were confident their personal information was protected while closer to eight in ten agreed that the Service Canada specialized call centre, 1 800 O-Canada and eServiceCanada reps were helpful. Just less than three quarters of clients agreed that they travelled a reasonable distance to access service or that they were confident any issues or problems would have been easily resolved.
Compared to 2020-21, ratings have declined for nearly all measures of emotion except for being provided service in their choice of English or French where ratings have increased and confidence their personal information was protected where ratings were consistent.
Figure long description
Emotion, % Rated 4 or 5
You were provided with service in your choice of English or French
2021-22, 97%, significantly lower than previous wave
2020-21, 96%
2019-20, 97%
2018-19, 96%
2017-18, 94%
Service Canada reps that you dealt with in person were helpful
2021-22, 88%, significantly lower than previous wave
2020-21, 91%
2019-20, 92%
1 800 O-Canada phone reps were helpful
2021-22, 78%, significantly lower than previous wave
2020-21, 88%
You were confident that your personal information was protected
2021-22, 86%
2020-21, 87%
2019-20, 87%
2018-19, 87%
2017-18, 87%
Service Canada specialized call centre phone reps were helpful
2021-22, 82%, significantly lower than previous wave
2020-21, 85%
2019-20, 73%
The Service Canada phone reps that called you back after you completed an online form were helpful
2021-22, 78%, significantly lower than previous wave
2020-21, 85%
You travelled a reasonable distance to access the service
2021-22, 73%, significantly lower than previous wave
2020-21, 79%
2019-20, 75%
You were confident that any issues or problems would have been easily resolved
2021-22, 73%, significantly lower than previous wave
2020-21, 77%
2019-20, 78%
2018-19, 78%
2017-18, 76%
Note: Statements asked differently with different scale in 2017-18, interpret with caution.
Q36b. Thinking about the service you received, how much do you agree or disagree with the following statements.
Base: All answering (n=varies)
Emotion Service Attributes: by Program (2/3)
SIN clients were more likely to provide high ratings for the helpfulness of in-person reps, confidence their personal information was protected and confidence any issues or problems would have been easily resolved compared to all clients, while CPP-D clients provided lower ratings across all measures except for the helpfulness of 1 800 O-Canada reps. OAS/GIS and EI clients provided lower ratings for the helpfulness of in-person reps and confidence any issues or problems would have been easily resolved, while OAS/GIS clients (along with CPP clients) also provided lower ratings for provided service in their choice of English or French and confidence their personal information was protected.
Compared to 2020-21, SIN clients provided lower ratings for the helpfulness of in-person and eServiceCanada reps and for travelling a reasonable distance to access service and provided higher ratings for being provided service in their choice of English or French. OAS/GIS clients provided lower ratings for confidence in issue resolution (along with EI clients) and for confidence their personal information was protected. CPP-D clients provided higher ratings for the helpfulness of 1 800 O-Canada reps.
Figure long description
Emotion, % Rated 4 or 5
You were provided with service in your choice of English or French
TOTAL
2017-18, 94%
2018-19, 96%
2019-20, 97%
2020-21, 96%
2021-22, 97%, significantly higher than previous wave
EI
2017-18, 93%
2018-19, 97%
2019-20, 98%
2020-21, 97%
2021-22, 97%
CPP
2017-18, 94%
2018-19, 94%
2019-20, 97%
2020-21, 95%
2021-22, 94%, significantly lower than total
CPP-D
2017-18, 87%
2018-19, 93%
2019-20, 95%
2020-21, 92%
2021-22, 94%, significantly lower than total
SIN
2017-18, 96%
2018-19, 95%
2019-20, 95%
2020-21, 96%
2021-22, 98%, significantly higher than previous wave
OAS/GIS
2017-18, 95%
2018-19, 98%
2019-20, 96%
2020-21, 94%
2021-22, 95%, significantly lower than total
Service Canada reps that you dealt with in person were helpful
TOTAL
2019-20, 92%
2020-21, 91%
2021-22, 88%, significantly lower than previous wave
EI
2019-20, 89%
2020-21, 85%
2021-22, 83%, significantly lower than total
CPP
2019-20, 93%
2020-21, 86%
2021-22, 87%
CPP-D
2019-20, 85%
2020-21, 76%
2021-22, 79%, significantly lower than total
SIN
2019-20, 96%
2020-21, 95%
2021-22, 92%, significantly higher than total, significantly lower than previous wave
OAS/GIS
2019-20, 92%
2020-21, 72%
2021-22, 82%, significantly lower than total
1 800 O-Canada phone reps were helpful
TOTAL
2020-21, 88%
2021-22, 78%, significantly lower than previous wave
EI
2020-21, 88%
2021-22, 79%
CPP
2020-21, 86%
2021-22, 82%
CPP-D
2020-21, 67%
2021-22, 81%, significantly higher than previous wave
SIN
2020-21, 90%
2021-22, 75%
OAS/GIS
2020-21, 89%
2021-22, 82%
You were confident that your personal information was protected
TOTAL
2017-18, 87%
2018-19, 87%
2019-20, 87%
2020-21, 87%
2021-22, 86%
EI
2017-18, 87%
2018-19, 88%
2019-20, 88%
2020-21, 86%
2021-22, 87%
CPP
2017-18, 86%
2018-19, 79%
2019-20, 82%
2020-21, 82%
2021-22, 81%, significantly lower than total
CPP-D
2017-18, 78%
2018-19, 82%
2019-20, 80%
2020-21, 78%
2021-22, 79%, significantly lower than total
SIN
2017-18, 90%
2018-19, 92%
2019-20, 90%
2020-21, 92%
2021-22, 92%, significantly higher than total
OAS/GIS
2017-18, 82%
2018-19, 83%
2019-20, 79%
2020-21, 85%
2021-22, 78%, significantly lower than total, significantly lower than previous wave
Service Canada specialized call centre phone reps were helpful
TOTAL
2019-20, 73%
2020-21, 85%
2021-22, 82%, lower than previous wave
EI
2019-20, 73%
2020-21, 83%
2021-22, 80%
CPP
2019-20, 72%
2020-21, 85%
2021-22, 83%
CPP-D
2019-20, 68%
2020-21, 68%
2021-22, 74%, significantly lower than total
SIN
2019-20, 74%
2020-21, 92%
2021-22, 89%
OAS/GIS
2019-20, 83%
2020-21, 90%
2021-22, 90%, significantly higher than total
The eServiceCanada phone reps that called you back after you completed an online form were helpful
TOTAL
2020-21, 85%
2021-22, 78%, significantly lower than previous wave
EI
2020-21, 84%
2021-22, 78%
CPP
2020-21, 83%
2021-22, 84%
CPP-D
2020-21, 76%
2021-22, 68%, significantly lower than total
SIN
2020-21, 89%
2021-22, 78%, significantly lower than previous wave
OAS/GIS
2020-21, 85%
2021-22, 70%
You travelled a reasonable distance to access the service
TOTAL
2019-20, 75%
2020-21, 79%
2021-22, 73%, significantly lower than previous wave
EI
2019-20, 71%
2020-21, 71%
2021-22, 72%
CPP
2019-20, 77%
2020-21, 75%
2021-22, 78%
CPP-D
2019-20, 59%
2020-21, 59%
2021-22, 66%
SIN
2019-20, 79%
2020-21, 83%
2021-22, 73%, significantly lower than previous wave
OAS/GIS
2019-20, 83%
2020-21, 74%
2021-22, 72%
You were confident that any issues or problems would have been easily resolved
TOTAL
2017-18, 76%
2018-19, 78%
2019-20, 78%
2020-21, 77%
2021-22, 73%, significantly lower than previous wave
EI
2017-18, 79%
2018-19, 74%
2019-20, 72%
2020-21, 73%
2021-22, 69%, significantly lower than total, significantly lower than previous wave
CPP
2017-18, 81%
2018-19, 76%
2019-20, 81%
2020-21, 76%
2021-22, 73%
CPP-D
2017-18, 63%
2018-19, 57%
2019-20, 51%
2020-21, 56%
2021-22, 57%, significantly lower than total
SIN
2017-18, 88%
2018-19, 86%
2019-20, 87%
2020-21, 84%
2021-22, 85%, significantly higher than total
OAS/GIS
2017-18, 80%
2018-19, 78%
2019-20, 77%
2020-21, 82%
2021-22, 68%, significantly lower than total, significantly lower than previous wave
Note: Statements asked differently with different scale in 2017-18, interpret with caution.
Q36b. Thinking about the service you received, how much do you agree or disagree with the following statements.
Base: All answering (n=varies)
Emotion During End-to-End Client Journey (1/2)
Figure long description
Emotion During End-to-End Journey
You were provided with service in your choice of English or French
5 – Strongly agree, 88%
Rated 4, 9%
Rated 3, 2%
% Rated 4 or 5
2017-18, 94%
2019-20, 97%
2020-21, 96%
2021-22, 97%, significantly higher than previous wave
Service Canada representatives that you dealt with in person were helpful
5 – Strongly agree, 73%
Rated 4, 15%
Rated 3, 5%
Rated 2, 3%
1 – Strongly disagree, 2%
Not applicable, 2%
Don’t know, 1%
% Rated 4 or 5
2019-20, 92%
2020-21, 91%
2021-22, 88%, significantly lower than previous wave
You were confident that your personal information was protected
5 – Strongly agree, 67%
Rated 4, 19%
Rated 3, 9%
Rated 2, 2%
1 – Strongly disagree, 2%
Don’t know, 1%
% Rated 4 or 5
2017-18, 87%
2018-19, 87%
2019-20, 87%
2020-21, 87%
2021-22, 86%
Service Canada specialized call centre phone representatives were helpful
5 – Strongly agree, 62%
Rated 4, 20%
Rated 3, 10%
Rated 2, 4%
1 – Strongly disagree, 3%
Not applicable, 1%
% Rated 4 or 5
2019-20, 73%
2020-21, 85%
2021-22, 82%, significantly lower than previous wave
The eServiceCanada phone representatives that called you back after you completed an online form were helpful
5 – Strongly agree, 63%
Rated 4, 15%
Rated 3, 7%
Rated 2, 3%
1 – Strongly disagree, 4%
Not applicable, 4%
Don’t know, 3%
% Rated 4 or 5
2020-21, 85%
2021-22, 78%, significantly lower than previous wave
1 800 O-Canada phone representatives were helpful
5 – Strongly agree, 57%
Rated 4, 22%
Rated 3, 10%
Rated 2, 1%, significantly higher than previous wave
1 – Strongly disagree, 9%, significantly higher than previous wave
Not applicable, 1%
Don’t know, 1%
% Rated 4 or 5
2020-21, 88%
2021-22, 78%, significantly lower than previous wave
You were confident that any issues or problems would have been easily resolved
5 – Strongly agree, 49%, significantly lower than previous wave
Rated 4, 25%
Rated 3, 15%
Rated 2, 6%
1 – Strongly disagree, 4%
Not applicable, 1%
Don’t know, 1%
% Rated 4 or 5
2017-18, 76%
2018-19, 78%
2019-20, 78%
2020-21, 77%
2021-22, 73%, significantly lower than previous wave
You travelled a reasonable distance to access the service
5 – Strongly agree, 53%, significantly lower than previous wave
Rated 4, 20%
Rated 3, 15%
Rated 2, 4%
1 – Strongly disagree, 5%
Not applicable, 2%, significantly lower than previous wave
Don’t know, 1%
% Rated 4 or 5
2019-20, 75%
2020-21, 79%
2021-22, 73%, significantly lower than previous wave
Q36b. Thinking about the overall service you received, from getting information about [INSERT ABBREV] to receiving a decision, how much do you agree or disagree with the following statements, using a 5-point scale (where 1 means strongly disagree, and 5 means strongly agree)? Note The questionnaire was improved to pose ‘You were confident that any issues or problems would have been easily resolved’ to all survey respondents in 2018-19 and 2019-20, whereas in 2017-18 it was posed only to clients who did not experience a problem, therefore comparable data are not available.
Base: All answering (varies)
Emotion Service Attributes: Overall and by Program (3/3)
More than nine in ten agreed that the Service Canada call centre and in-person reps were respectful, followed by 1 800 O-Canada reps while closer to eight in ten felt that eServiceCanada reps were respectful.
CPP-D clients were less likely to agree that Service Canada call centre and in-person reps were respectful and more likely to agree that 1 800 O-Canada reps were respectful.
Figure long description
Emotion
Emotion, % Rated 4 or 5, 2021-22
Service Canada call centre phone representatives were respectful, 92%
Service Canada representatives that you dealt with in person were respectful, 92%
1 800 O-Canada phone representatives were respectful, 86%
eServiceCanada representatives that called you back after you completed an online form were respectful, 83%
% Rated 4 or 5 by Program, 2021-22
Service Canada call centre phone representatives were respectful
Total, 92%
EI, 92%
CPP, 91%
CPP-D, 88%, significantly lower than total
SIN, 95%
OAS/GIS, 92%
Service Canada representatives that you dealt with in person were respectful
Total, 92%
EI, 91%
CPP, 93%
CPP-D, 86%, significantly lower than total
SIN, 92%
OAS/GIS, 89%
1-800 O-Canada phone representatives were respectful
Total, 86%
EI, 84%
CPP, 90%
CPP-D, 95%, significantly higher than total
SIN, 89%
OAS/GIS, 84%
eServiceCanada representatives that called you back after you completed an online form were respectful
Total, 83%
EI, 81%
CPP, 89%
CPP-D, 80%
SIN, 84%
OAS/GIS, 81%
Q36b. Thinking about the service you received, how much do you agree or disagree with the following statements.
Base: All answering (n=varies)
Emotion During End-to-End Client Journey (2/2)
Figure long description
Emotion During End-to-end Journey
Service Canada representatives that you dealt with in person were respectful
5 – Strongly agree, 81%
Rated 4, 11%
Rated 3, 4%
Rated 2, 1%
1 – Strongly disagree, 2%
Not applicable, 1%
% Rated 4 or 5
2021-22, 92%
Service Canada call centre phone representatives were respectful
5 – Strongly agree, 77%
Rated 4, 15%
Rated 3, 5%
Rated 2, 1%
Not applicable, 1%
% Rated 4 or 5
2021-22, 92%
1-800 O-Canada phone representatives were respectful
5 – Strongly agree, 74%
Rated 4, 12%
Rated 3, 5%
Rated 2, 1%
1 – Strongly disagree, 4%
Not applicable, 2%
Don’t know, 1%
% Rated 4 or 5
2021-22, 86%
eServiceCanada representatives that called you back after you completed an online form were respectful
5 – Strongly agree, 69%
Rated 4, 14%
Rated 3, 7%
Rated 2, 1%
1 – Strongly disagree, 1%
Not applicable, 5%
Don’t know, 4%
% Rated 4 or 5
2021-22, 83%
Q36b. Thinking about the overall service you received, from getting information about [INSERT ABBREV] to receiving a decision, how much do you agree or disagree with the following statements, using a 5-point scale (where 1 means strongly disagree, and 5 means strongly agree)?
Base: All answering (varies)
Ease of Follow-Up with Service Canada
Just over half of clients found it easy to follow-up with Service Canada about their application. CPP-D clients were less likely to have felt it was easy to follow-up compared to all clients, while CPP clients were more likely.
Compared to 2020-21, ratings have declined overall and among OAS/GIS clients
Figure long description
Ease Of Follow-up With Service Canada Regarding Your Application (% Rated 4 Or 5) – Trending
2021-22, n=1293, 64%, significantly higher than total
CPP-D
2017-18, n=1296, 50%
2019-20, n=842, 48%
2020-21, n=1209, 52%
2021-22, n=1293, 48%, significantly lower than total
SIN
2017-18, n=1296, 62%
2019-20, n=842, 73%
2020-21, n=1209, 72%
2021-22, n=1293, 64%, small sample size
OAS/GIS
2017-18, n=1296, 66%
2019-20, n=842, 77%
2020-21, n=1209, 70%
2021-22, n=1293, 59%, significantly lower than previous wave
Q20a. Using a 5-point scale where 1 is very difficult and 5 is very easy, how easy or difficult was it to follow up with Service Canada about your application?
Base: Clients who followed-up before receiving a decision (n=1293)
Ease of Follow-up
Figure long description
Ease Of Follow-up With Service Canada
Ease of follow up with Service Canada about your application
5 – Strongly agree, 31%, significantly lower than previous wave
Rated 4, 24%
Rated 3, 20%
Rated 2, 10%
1 – Strongly disagree, 13%, significantly higher than previous wave
% Rated 4 or 5
2017-18, 66%
2019-20, 61%
2020-21, 63%
2021-22, 55%, significantly lower than previous wave
Q20a. Using a 5-point scale where 1 was very difficult and 5 was very easy, how easy or difficult was it to follow up with Service Canada about your application?
Base: Clients who followed up (n=1293)
Changes That Would Have Improved Follow-up Experience: Overall
Among the 37% of clients who followed-up with Service Canada before receiving a decision, quicker assistance by phone would have improved the experience the most, followed by clearer information on the status of their application and real-time support through an online chat with a Service Canada representative.
CPP-D clients were more likely to identify quicker assistance by phone as the change that would have improved their experience the most, while SIN clients were more likely to want clearer information on the status of their application.
Figure long description
Changes to Improve Follow-up Experience, 2021-22
Quicker to get assistance by phone
Total, 53%
EI, 56%
CPP, 48%
CPP-D, 60%, significantly higher than total
SIN, 35%, significantly lower than total
OAS/GIS, 48%
Clearer information on the status of your application
Total, 23%
EI, 23%
CPP, 19%
CPP-D, 26%
SIN, 36%, significantly higher than total
OAS/GIS, 19%
Real-time support through online chat with a Service Canada representative
Total, 15%
EI, 14%
CPP, 18%
CPP-D, 4%, significantly lower than total
SIN, 23%
OAS/GIS, 17%
None of the above
Total, 8%
EI, 7%
CPP, 12%, significantly higher than total
CPP-D, 8%
SIN, 4%
OAS/GIS, 15%, significantly higher than total
Q20c. Before you were notified of a decision on your [INSERT ABBREV] application, which of the following changes would have improved your experience in following up the most?
Base: Clients who followed-up before receiving a decision (n=1293)
Satisfaction Drivers Analysis
Drivers of Satisfaction – Background on Analysis
The key drivers analysis was conducted by regression overall among all clients and by each of the five programs. All key service attributes were included in the analysis in addition to benefit approval/denial. All specific statements included were outlined below. Not all variables were included in regression by program due to an insignificant relationship to overall satisfaction or strong inter-collinearity with another variable (in the latter instance, the variable more strongly related to overall satisfaction –or- the variable asked among a larger sample size was kept).
Compared to 2020-21, the strength of the drivers’ analysis has remained consistent (R2 of 0.70 compared to 0.69).
Figure long description
Drivers of Satisfaction – Background on Analysis
AWARE
Understand the information about [PROGRAM]
Find out what information you need to provide when applying for [PROGRAM]
Figure out if you were eligible for benefits/ SIN card
Find information about [PROGRAM]
Find out the steps to apply
Find the information you needed within a reasonable amount of time
APPLY
You were able to complete the application in a reasonable amount of time
Understanding the requirements of the application
Completing the form
Putting together the information you needed to apply for [PROGRAM]
Ease of registering for/ signing into your My Service Canada Account
FOLLOW-UP
Ease of follow-up
OTHER VARIABLES
Received/ Denied Benefit
EASE
It was easy to access service in a language I could speak and understand well
Overall, it was easy for you to apply for [PROGRAM]?
You needed to explain your situation only once
Throughout the process it was clear what would happen next and when it would happen
EFFECTIVENESS
The amount of time it took was reasonable
It was easy to get help when you needed it
You received consistent information
It was clear what to do if you had a problem or question
You were able to move smoothly through all of the steps related to your [PROGRAM] application
You were provided service in a way that protected your health and safety during the COVID-19 pandemic
EMOTION
Service Canada specialized call centre phone representatives were helpful
Service Canada representatives that you dealt with in person were helpful
1 800 O-Canada phone representatives were helpful
The Service Canada phone representatives that called you back after you completed an online form were helpful
You were confident that any issues or problems would have been easily resolved
You were confident that your personal information was protected
You travelled a reasonable distance to access the service
You were provided with service in your choice of English or French
Summary: Drivers of Satisfaction – Overall
The top driver of satisfaction in the service experience was the timeliness of service and took on increased importance this year. The helpfulness of call centre representatives remains among the most prominent drivers but was less impactful than last year, while the helpfulness of in-person representatives, whether the application was approved or denied and confidence in the issue resolution process have taken on increased importance in driving satisfaction.
The primary driver of satisfaction in the service experience was by far whether the timeliness of the client journey was considered reasonable. The helpfulness of Service Canada specialized call centre reps was a prominent secondary driver, followed by the helpfulness of in-person reps, the ease of follow-up and whether the application was approved or denied.
The greatest opportunity for potential improvement for Service Canada clientele as a whole was in improving the timeliness of service.
In order to summarize what potential changes could result in an increase in overall satisfaction, the service attributes that most strongly drove satisfaction for Service Canada clients were determined and compared to Service Canada’s performance against these attributes.
The resulting analysis found that most common area for potential improvement was improving the timeliness of service. Areas of secondary importance for improvement included the ease of follow-up and to a lesser extent confidence in the issue resolution process.
The helpfulness of Service Canada call centre reps and in-person reps are currently prominent strengths and areas that should be protected.
Summary: Drivers of Satisfaction – EI Program
EI Clients
Whether EI clients considered the timeliness of the client journey reasonable was by far the top driver of satisfaction. Prominent secondary drivers included the ease of registering for MSCA, receiving consistent information, clarity of the issue resolution process and helpfulness of Service Canada in-person reps.
The greatest opportunity to improve the service experience for EI clients were in improving the timeliness of service. Areas of secondary importance for improvement included the ease of registering for MSCA, the ease follow-up and the ease of getting help on the application.
The helpfulness of Service Canada in-person reps, being able to complete the application in a reasonable amount of time and being provided service in a way that protected them during the pandemic were prominent strengths this year and areas that should be protected.
The timeliness of service increased in importance and became the top driver of satisfaction this year. The ease of registering for MSCA, receiving consistent information, clarity of the issue resolution process and the helpfulness of Service Canada in-person reps also took on increased importance.
Summary: Drivers of Satisfaction – CPP Program
CPP Clients
Top drivers included: the helpfulness of Service Canada call centre phone representatives and the ease of registering for MSCA. Prominent secondary drivers of satisfaction included the clarity of the issue resolution process, the ease of gathering the information needed to apply and needing to explain your situation only once.
The greatest opportunities to improve the service experience for CPP clients are improving the ease of registering for MSCA, clarity of the issue resolution process, the ease of follow-up and for clients to have to explain their situation to SC staff only once.
The helpfulness of Service Canada call centre reps and to a lesser extent the ease of understanding requirements of the application and the ease of figuring out eligibility represented prominent strengths and areas that should be protected.
The top driver has remained consistent this year while the ease of registering for MSCA, the clarity of the issue resolution process and the ease of gathering the information needed to apply also took on increased importance in driving satisfaction.
Summary: Drivers of Satisfaction – CPP-D Program
CPP-D Clients
Top drivers included: the ease of follow-up and the helpfulness of Service Canada call centre phone reps. Prominent secondary drivers of satisfaction included being able to find the information they needed (when learning about the program) in a reasonable amount of time, the ease of understanding information about the program, and whether the application was approved or denied.
The greatest opportunities to improve the service experience for CPP-D clients were in improving the ease of follow-up and the helpfulness of call centre representatives.
Areas of secondary importance for improvement included the ease of understanding information about the program, timeliness of service, being able to find the information they needed (when learning about the program) in a reasonable time, ease of finding info on the program and the clarity of the issue resolution process.
Access to service in a language they would understand and to a lesser extent being provided service in a way that protected them during the pandemic were relative strengths this year and areas that should be protected.
The ease of follow-up has increased in importance this year and become the top driver of satisfaction. Being able to find the information they needed when learning about the program in a reasonable amount of time and the ease of understanding information about the program also took on increased importance in driving satisfaction.
Summary: Drivers of Satisfaction – SIN Program
SIN Clients
Top driver was the amount of time it took from start to finish was reasonable. Prominent secondary drivers of satisfaction included being able to complete the application in a reasonable time and the helpfulness of Service Canada in-person reps.
The greatest opportunities to improve the service experience for SIN clients were in reducing the distance clients travelled to access service and improving the ease of getting help on their application.
The timeliness of service in particular represented a key strength this year and an area that should be protected. Being able to complete the application in a reasonable time, the helpfulness of Service Canada in-person reps, ease of finding out the steps to apply, confidence in issue resolution, being provided service in a way that protected them during the pandemic, ease of applying and ease of finding information on the program were also areas of relatively stronger performance and should also be protected.
The timeliness of service has increased in importance this year and become the top driver of satisfaction. Being able to complete the application in a reasonable amount of time, the ease of finding out the steps to apply and being provided service in a way that protected their health during the pandemic also took on increased importance in driving satisfaction.
Summary: Drivers of Satisfaction – OAS/GIS Program
OAS/GIS Clients
Top drivers included: the amount of time it took from start to finish was reasonable and the ease of figuring out eligibility for benefits. Prominent secondary drivers of satisfaction included the ease of finding out the steps to apply and the ease of follow-up.
The greatest opportunities to improve the service experience for OAS/GIS clients were in improving the timeliness of service, the ease of figuring out eligibility, the ease of finding out the steps to apply and the ease of follow-up. Secondary areas for improvement included the ease of understanding information about the program, the ease of finding what information is needed when applying and the ease of deciding the best age to start their pension.
Being able to access service in a language clients understand, the ease of applying and the helpfulness of Service Canada call centre reps represent relative strengths and areas that should be protected.
The top driver remained consistent this year while the ease of figuring out eligibility, finding out the steps to apply, follow-up and understanding information about the program took on increased importance in driving satisfaction.
Drivers of Satisfaction: Overall
The primary driver of satisfaction in the service experience was the amount of time it took from start to finish was reasonable. The helpfulness of Service Canada specialized call centre reps was a prominent secondary driver, followed by the helpfulness of in-person reps, the ease of follow-up and whether the application was approved or denied.
Compared to 2020-21, the top two most important drivers remained consistent, however timeliness of service took on increased importance. The helpfulness of Service Canada in-person reps, whether the application was approved or denied and confidence in the issue resolution process have also taken on increased importance in driving satisfaction.
The strength of the drivers’ analysis has remained consistent compared to 2020-21 (R2 of 0.70 compared to 0.69).
Figure long description
Drivers of Satisfaction: Overall
The amount of time it took, from start to finish, was reasonable 0.315
Service Canada specialized call centre phone representatives were helpful 0.161
Service Canada representatives that you dealt with in person were helpful 0.096
How easy or difficult was it to follow up with Service Canada about your application 0.095
GRANTED/ DENIED 0.091
You were confident that any issues or problems would have been easily resolved 0.075
You were able to find the information you needed within a reasonable amount of time 0.060
You were able to complete the application in a reasonable amount of time 0.056
Find out the steps to apply 0.050
You were provided service in a way that protected your health and safety during the pandemic 0.049
Overall, it was easy for you to apply for [PROGRAM ABBREV] 0.045
It was clear what to do if you had a problem or question 0.044
Putting together the information you needed to apply for [PROGRAM ABBREV] 0.043
You travelled a reasonable distance to access the service 0.040
Throughout the process it was clear what would happen next and when it would happen 0.038
You were able to move smoothly through all of the steps 0.035
Find information about [PROGRAM ABBREV] 0.031
Completing the application form 0.029
It was easy to get help when you needed it 0.016
How easy or difficult was it to register for your My Service Canada Account 0.013
Figure out if you are eligible for benefits/ SIN card 0.011
Find out what information you need to provide when applying for [PROGRAM ABBREV] 0.011
Getting help on your application when you needed it 0.009
You needed to explain your situation only once 0.005
Understanding the requirements of the application 0.004
You received consistent information 0.004
Understand the information about [PROGRAM] 0.004
It was easy to access service in a language you could speak and understand well 0.003
You were confident that your personal information was protected 0.003
You were provided with service in your choice of English or French 0.002
Priority Matrix: Overview
READER’S NOTE: This slide was intended to assist the reader in interpreting data shown in a priority matrix. A priority matrix has been used to identify priority improvement areas with respect to service interactions with clients.
A priority matrix allows for decision makers to identify priorities for improvement by comparing how well clients feel you have performed in an area with how much impact that area has on clients’ overall satisfaction. It helps to answer the question, ‘what can we do to improve satisfaction?’. Each driver or component will fall into one of the quadrants explained below, depending on its impact on overall satisfaction and its performance score (provided by survey respondents).
Figure long description
Priority Matrix: Overview
IMPROVE / FOCUS, 1st quadrant
Driver/component has more impact on satisfaction, and its performance score was lower relative to other drivers/ components. Focus on improving your performance in this area.
PROTECT / REINFORCE, 2nd quadrant
Driver/component has more impact on satisfaction, and its performance score was higher relative to other drivers/ components. This was a strength which needs to be protected.
IMPROVE SECONDARY/ BE AWARE, 3rd quadrant
Driver/component was not as impactful and it has a lower performance score relative to other drivers/ components
MAINTAIN, 4th quadrant
Driver/component was not as impactful as other drivers/ components and performance scores were high.
Overall Priority Matrix: Impact vs. Performance
The greatest opportunities to improve the service experience for Service Canada clientele as a whole are improving the timeliness of service. Areas of secondary importance for improvement include the ease of follow-up and to a lesser extent confidence in the issue resolution process.
The helpfulness of Service Canada call centre reps and in-person reps are prominent strengths and areas that should be protected.
Note: aspects of service that had an impact of 0.03 or lower were not included in the analysis below given their limited impact on satisfaction.
Figure long description
Overall Priority Matrix: Impact vs. Performance
Improve
Client journey took reasonable time
Protect
Service Canada call centre reps were helpful
Secondary Improve
Ease of follow-up
Confident in issue resolution
Find info in reasonable time
Travelled reasonable distance
Clear process was clear if had issues
Ease of finding info on program
Ease of finding steps to apply
Overall process was clear
Maintain
Complete application in reasonable time
Ease of gathering info
Moved smoothly through steps
Ease of applying
Service Canada in-person reps were helpful
Protected you during the COVID
Drivers of Satisfaction: EI Clients
The primary driver of satisfaction in the service experience for EI clients was the amount of time it took from start to finish was reasonable. Secondary drivers of satisfaction included the ease of registering for MSCA, receiving consistent information, clarity of the issue resolution process and helpfulness of Service Canada in-person reps.
Compared to 2020-21, the timeliness of service has increased in importance and became the top driver of satisfaction. The ease of registering for MSCA, receiving consistent information, clarity of the issue resolution process and the helpfulness of Service Canada in-person reps have also taken on increased importance.
The strength of the drivers’ analysis has remained consistent compared to 2020-21 (R2 of 0.73 compared to 0.72).
Figure long description
Drivers of Satisfaction: EI Clients
The amount of time it took, from start to finish, was reasonable 0.401
How easy or difficult was it to register for your My Service Canada Account 0.195
You received consistent information 0.185
It was clear what to do if you had a problem or question 0.185
Service Canada representatives that you dealt with in person were helpful 0.175
You needed to explain your situation only once 0.161
You were provided service in a way that protected your health and safety during the pandemic 0.155
How easy or difficult was it to follow up with Service Canada about your application 0.153
You were able to complete the application in a reasonable amount of time 0.126
You travelled a reasonable distance to access the service 0.125
Getting help on your application when you needed it 0.105
GRANTED/ DENIED 0.105
It was easy to get help when you needed it 0.086
Putting together the information you needed to apply for [PROGRAM ABBREV] 0.084
Find information about [PROGRAM ABBREV] 0.079
You were able to move smoothly through all of the steps 0.075
Find out what information you need to provide when applying for [PROGRAM ABBREV] 0.070
You were confident that any issues or problems would have been easily resolved 0.066
You were able to find the information you needed within a reasonable amount of time 0.064
You were provided with service in your choice of English or French 0.046
Understanding the requirements of the application 0.042
Figure out if you are eligible for benefits/ SIN card 0.034
Service Canada specialized call centre phone representatives were helpful 0.027
It was easy to access service in a language you could speak and understand well 0.023
Find out the steps to apply 0.022
You were confident that your personal information was protected 0.021
Understand the information about [PROGRAM] 0.017
Throughout the process it was clear what would happen next and when it would happen 0.015
Overall, it was easy for you to apply for [PROGRAM ABBREV] 0.007
Completing the application form 0.004
Overall Priority Matrix: Impact vs. Performance – EI Clients
The greatest opportunity to improve the service experience for EI clients is in improving the timeliness of service. Areas of secondary importance for improvement include the ease of registering for MSCA, the ease follow-up and the ease of getting help on the application.
The helpfulness of Service Canada in-person reps, being able to complete the application in a reasonable amount of time and being provided service in a way that protected them during the pandemic are prominent strengths this year and areas that should be protected.
Note: aspects of service that had an impact of 0.03 or lower were not included in the analysis below given their limited impact on satisfaction.
Figure long description
Overall Priority Matrix: Impact vs. Performance – EI Clients
Improve
Client journey took reasonable time
Ease of MSCA registration
Consistent info
Clear process if had issue
Explain once
Ease of follow-up
Travelled reasonable distance
Ease of getting help on application
Protect
Service Canada in-person reps were helpful
Protected you during the COVID
Complete application in reasonable time
Secondary Improve
Ease of getting help when needed
Ease of gathering info
Ease of finding info on program
Moved smoothly through steps
Ease of finding info you need to provide
Confident in issue resolution
Find info in reasonable time
Ease of figuring out eligibility
Maintain
Understanding requirements
Drivers of Satisfaction: CPP Clients
The primary drivers of satisfaction in the service experience for CPP clients were: the helpfulness of Service Canada call centre phone representatives and the ease of registering for MSCA. Secondary drivers of satisfaction included the clarity of the issue resolution process, ease of gathering the information needed to apply and needing to explain your situation only once.
Compared to 2020-21, the top driver has remained consistent while ease of registering for MSCA, clarity of the issue resolution process and ease of gathering the information needed to apply have taken on increased importance in driving satisfaction.
The strength of the drivers’ analysis has increased compared to 2020-21 (R2 of 0.93 compared to 0.62).
Figure long description
Drivers of Satisfaction: CPP Clients
Service Canada specialized call centre phone representatives were helpful 2.469
How easy or difficult was it to register for your My Service Canada Account 1.897
It was clear what to do if you had a problem or question 1.143
Putting together the information you needed to apply for [PROGRAM ABBREV] 0.908
You needed to explain your situation only once 0.731
Understanding the requirements of the application 0.582
How easy or difficult was it to follow up with Service Canada about your application 0.477
Throughout the process it was clear what would happen next and when it would happen 0.368
Figure out if you are eligible for benefits 0.337
Find out what information you need to provide when applying for [PROGRAM ABBREV] 0.316
You were able to find the information you needed within a reasonable amount of time 0.295
You were able to move smoothly through all of the steps 0.294
Overall, it was easy for you to apply for [PROGRAM ABBREV] 0.278
Understand the information about [PROGRAM] 0.253
Getting help on your application when you needed it 0.248
The amount of time it took, from start to finish, was reasonable 0.227
You were able to complete the application in a reasonable amount of time 0.168
You received consistent information 0.133
GRANTED/ DENIED 0.079
It was easy to access service in a language you could speak and understand well 0.069
You were confident that any issues or problems would have been easily resolved 0.036
Overall Priority Matrix: Impact vs. Performance – CPP Clients
The greatest opportunities to improve the service experience for CPP clients are improving the ease of registering for MSCA, clarity of the issue resolution process, the ease of follow-up and for clients to have to explain their situation to SC staff only once.
The helpfulness of Service Canada call centre reps and to a lesser extent the ease of understanding requirements of the application and the ease of figuring out eligibility represent prominent strengths and areas that should be protected.
Figure long description
Overall Priority Matrix: Impact vs. Performance – CPP Clients
Improve
Ease of MSCA registration
Clear process if had issue
Ease of gathering info
Explain once
Ease of follow-up
Process was clear
Protect
Service Canada call centre reps were helpful
Understanding requirements
Ease of figuring out eligibility
Secondary Improve
Ease of finding info you need to provide
Find info in reasonable time
Ease of understanding info
Ease of getting help on application
Complete application in reasonable time
Confident in issue resolution
Maintain
Moved smoothly through steps
Ease of applying
Client journey took reasonable time
Consistent info
Access service in language I understand
Drivers of Satisfaction: CPP-D Clients
The primary drivers of satisfaction in the service experience for CPP-D clients were: the ease of follow-up and the helpfulness of Service Canada call centre phone reps. Secondary drivers of satisfaction included being able to find the information they needed (when learning about the program) in a reasonable amount of time, ease of understanding information about the program, and whether the application was approved or denied.
Compared to 2020-21, the ease of follow-up has increased in importance and became the top driver of satisfaction. Being able to find the information they needed when learning about the program in a reasonable amount of time and the ease of understanding information about the program have also taken on increased importance in driving satisfaction.
The strength of the drivers’ analysis has increased compared to 2020-21 (R2 of 0.79 compared to 0.72).
Figure long description
Drivers of Satisfaction: CPP-D Clients
How easy or difficult was it to follow up with Service Canada about your application 0.328
Service Canada specialized call centre phone representatives were helpful 0.319
You were able to find the information you needed within a reasonable amount of time 0.187
Understand the information about [PROGRAM] 0.182
GRANTED/ DENIED 0.172
The amount of time it took, from start to finish, was reasonable 0.172
Find information about [PROGRAM ABBREV] 0.141
It was clear what to do if you had a problem or question 0.131
It was easy to access service in a language you could speak and understand well 0.128
Completing the application form 0.101
You were provided service in a way that protected your health and safety during the pandemic 0.088
Getting help on your application when you needed it 0.079
Throughout the process it was clear what would happen next and when it would happen 0.074
Understanding the requirements of the application 0.063
You were confident that your personal information was protected 0.060
You were able to complete the application in a reasonable amount of time 0.059
Figure out if you are eligible for benefits 0.054
Find out the steps to apply 0.054
You were confident that any issues or problems would have been easily resolved 0.051
Overall, it was easy for you to apply for [PROGRAM ABBREV] 0.049
Find out what information you need to provide when applying for [PROGRAM ABBREV] 0.042
You were able to move smoothly through all of the steps 0.040
It was easy to get help when you needed it 0.038
You received consistent information 0.036
You were provided with service in your choice of English or French 0.024
Putting together the information you needed to apply for [PROGRAM ABBREV] 0.021
You needed to explain your situation only once 0.010
Overall Priority Matrix: Impact vs. Performance – CPP-D Clients
The greatest opportunities to improve the service experience for CPP-D clients are improving the ease of follow-up and the helpfulness of call centre representatives.
Areas of secondary importance for improvement include ease of understanding information about the program, timeliness of service, being able to find the information they needed (when learning about the program) in a reasonable time, ease of finding info on the program and the clarity of the issue resolution process.
Access to service in a language they would understand and to a lesser extent being provided service in a way that protected them during the pandemic are relative strengths this year and areas that should be protected.
Note: aspects of service that had an impact of 0.03 or lower were not included in the analysis below given their limited impact on satisfaction.
Figure long description
Overall Priority Matrix: Impact vs. Performance – CPP-D Clients
Improve
Ease of follow-up
Service Canada call centre reps were helpful
Find info in reasonable time
Ease of understanding info
Client journey took reasonable time
Ease of finding info on program
Clear process if had issue
Protect
Access service in language I understand
Secondary Improve
Ease of completing application
Ease of getting help on application
Process was clear
Understanding requirements
Confident info was protected
Complete application in reasonable time
Ease of figuring out eligibility
Ease of finding steps to apply
Confident in issue resolution
Ease of applying
Ease of finding info you need to provide
Moved smoothly through steps
Ease of getting help when needed
Consistent info
Maintain
Protected you during the COVID
Drivers of Satisfaction: SIN Clients
The primary driver of satisfaction in the service experience for SIN clients was the amount of time it took from start to finish was reasonable. Secondary drivers of satisfaction included being able to complete the application in a reasonable time and the helpfulness of Service Canada in-person reps, followed by the ease of finding out the steps to apply, being provided service in a way that protected their health during COVID-19 and confidence in the issue resolution process.
Compared to 2020-21, the timeliness of service has increased in importance and became the top driver of satisfaction. Being able to complete the application in a reasonable amount of time, the ease of finding out the steps to apply and being provided service in a way that protected their health during the pandemic have also taken on increased importance in driving satisfaction.
The strength of the drivers’ analysis has decreased compared to 2020-21 but remains strong (R2 of 0.61 compared to 0.72).
Figure long description
Drivers of Satisfaction: SIN Clients
The amount of time it took, from start to finish, was reasonable 0.229
You were able to complete the application in a reasonable amount of time 0.154
Service Canada representatives that you dealt with in person were helpful 0.152
Find out the steps to apply 0.132
You were provided service in a way that protected your health and safety during the pandemic 0.129
You were confident that any issues or problems would have been easily resolved 0.124
Overall, it was easy for you to apply for [ABBREV] 0.114
Find information about [INSERT ABBREV] 0.106
Throughout the process it was clear what would happen next and when it would happen 0.091
Putting together the information you needed to apply for [INSERT ABBREV] 0.089
Understand the information about [PROGRAM] 0.074
It was easy to get help when you needed it 0.072
You were able to move smoothly through all of the steps 0.070
You were able to find the information you needed within a reasonable amount of time 0.068
You travelled a reasonable distance to access the service 0.054
Find out what information you need to provide when applying for [INSERT ABBREV] 0.051
Completing the application form 0.044 You received consistent information 0.037
You were confident that your personal information was protected 0.035
It was easy to access service in a language you could speak and understand well 0.035
It was clear what to do if you had a problem or question 0.022
Getting help on your application when you needed it 0.020
Understanding the requirements of the application 0.016
You needed to explain your situation only once 0.009
Figure out if you are eligible for SIN card 0.006
You were provided with service in your choice of English or French 0.001
Overall Priority Matrix: Impact vs. Performance – SIN Clients
The greatest opportunities to improve the service experience for SIN clients are reducing the distance clients must travel to access service and improving the ease of getting help on their application.
The timeliness of service in particular represents a prominent strength this year and an area that should be protected. Being able to complete the application in a reasonable time, the helpfulness of Service Canada in-person reps, ease of finding out the steps to apply, confidence in issue resolution, being provided service in a way that protected them during the pandemic, ease of applying and ease of finding information on the program are also areas of relatively stronger performance and should also be protected. Note: aspects of service that had an impact of 0.03 or lower were not included in the analysis below given their limited impact on satisfaction.
Figure long description
Protect
Client journey took reasonable time
Complete application in reasonable time
Service Canada in-person reps were helpful
Finding steps to apply
Protected you during the COVID
Confident in issue resolution
Ease of applying
Ease of finding info on program
Secondary Improve
Travelled reasonable distance
Maintain
Process was clear
Ease of gathering info you needed to apply
Ease of understanding info
Ease of getting help when needed
Moved smoothly through steps
Find info in reasonable time
Ease of finding info you need to provide
Ease of completing application
Consistent info
Confident info was protected
Access service in language I understand
Drivers of Satisfaction: OAS/GIS Clients
The primary drivers of satisfaction in the service experience for OAS/GIS clients were: the amount of time it took from start to finish was reasonable and the ease of figuring out eligibility for benefits. Secondary drivers of satisfaction included the ease of finding out the steps to apply and the ease of follow-up.
Compared to 2020-21, the top driver has remained consistent while the ease of figuring out eligibility, finding out the steps to apply, follow-up and understanding information about the program have taken on increased importance in driving satisfaction.
The strength of the drivers’ analysis has declined compared to 2020-21 but remains strong (R2 of 0.71 compared to 0.80).
Figure long description
Drivers of Satisfaction: OAS/GIS Clients
The amount of time it took, from start to finish, was reasonable 0.245
Figure out if you are eligible for benefits 0.222
Find out the steps to apply 0.191
How easy or difficult was it to follow up with Service Canada about your application 0.184
Understand the information about [PROGRAM] 0.158
Understanding the requirements of the application 0.158
Find out what information you need to provide when applying for [PROGRAM ABBREV] 0.149
It was easy to access service in a language you could speak and understand well 0.140
Decide the best age to start your pension 0.133
Throughout the process it was clear what would happen next and when it would happen 0.128
You received consistent information 0.128
Getting help on your application when you needed it 0.119
Overall, it was easy for you to apply for [PROGRAM ABBREV] 0.112
You were able to move smoothly through all of the steps 0.112
It was easy to get help when you needed it 0.102
You needed to explain your situation only once 0.085
you were able to find the information you needed within a reasonable amount of time 0.081
Find information about [INSERT ABBREV] 0.067
Service Canada specialized call centre phone representatives were helpful 0.060
You were confident that any issues or problems would have been easily resolved 0.059
Completing the application form 0.057
You were provided service in a way that protected your health and safety during the pandemic 0.028
It was clear what to do if you had a problem or question 0.023
Putting together the information you needed to apply for [PROGRAM ABBREV] 0.016
Overall Priority Matrix: Impact vs. Performance – OAS/GIS Clients
The greatest opportunities to improve the service experience for OAS/GIS clients are improving the timeliness of service, the ease of figuring out eligibility, the ease of finding out the steps to apply and the ease of follow-up. Secondary areas for improvement include the ease of understanding information about the program, the ease of finding what information is needed when applying and the ease of deciding the best age to start their pension.
Being able to access service in a language clients understand, the ease of applying and the helpfulness of Service Canada specialized call centre reps represent relative strengths and areas that should be protected.
Note: aspects of service that had an impact of 0.03 or lower were not included in the analysis below given their limited impact on satisfaction.
Figure long description
Improve
Client journey took reasonable time
Ease of figuring out eligibility
Ease of finding steps to apply
Ease of follow-up
Ease of understanding info
Understanding requirements
Ease of finding info you need to provide
Ease of deciding best age to start pension
Process was clear
Consistent info
Moved smoothly through steps
Protect
Ease of applying
Access service in language I understand
Secondary Improve
Ease of getting help when needed
Explain once
Find info in reasonable time
Ease of finding info on program
Confident in issue resolution
Ease of completing application
Maintain
Service Canada call centre reps were helpful
Impact of Outcome on Satisfaction
The proportion of EI and CPP-D who were granted benefits decreased compared to 2020-21.
Satisfaction among EI clients who were either approved or denied a benefit decreased year over year. The vast majority of CPP clients, half of EI clients and four in ten CPP-D clients who were denied benefits were satisfied with their experience.
Figure long description
% Rating Satisfaction as 4 or 5
EI
2017-19, n=703
Approved, 85%
Denied, 73%
2018-19, n=1098
Approved, 84%
Denied, 55%
2019-20, n=701
Approved, 81%
Denied, 39%
2020-21, n=1162
Approved, 85%
Denied, 61%
2021-22, n=987
Approved, 78%, significantly lower than previous wave
Denied, 51%, significantly lower than previous wave
CPP
2017-19, n=652
Approved, 88%
Denied, 67%
2018-19, n=788
Approved, 87%
Denied, 72%
2019-20, n=389
Approved, 89%
Denied, 59%
2020-21, n=752
Approved, 86%
Denied, 81%
2021-22, n=768
Approved, 86%
Denied, 80%
CPPD
2017-19, n=658
Approved, 79%
Denied, 43%
2018-19, n=766
Approved, 76%
Denied, 40%
2019-20, n=417
Approved, 77%
Denied, 40%
2020-21, n=692
Approved, 80%
Denied, 43%
2021-22, n=761
Approved, 82%
Denied, 39%
% approved/denied in the survey sample
EI
2017-19, n=703
Approved, 81%
Denied, 19%
2018-19, n=1098
Approved, 88%
Denied, 12%
2019-20, n=701
Approved, 88%
Denied, 12%
2020-21, n=1162
Approved, 95%
Denied, 5%
2021-22, n=987
Approved, 90%, significantly lower than previous wave
Denied, 10%, significantly higher than previous wave
CPP
2017-19, n=652
Approved, 98%
Denied, 2%
2018-19, n=788
Approved, 98%
Denied, 2%
2019-20, n=389
Approved, 97%
Denied, 3%
2020-21, n=752
Approved, 96%
Denied, 4%
2021-22, n=768
Approved, 96%
Denied, 4%
CPPD
2017-19, n=658
Approved, 60%
Denied, 40%
2018-19, n=766
Approved, 61%
Denied, 39%
2019-20, n=417
Approved, 53%
Denied, 47%
2020-21, n=692
Approved, 54%
Denied, 46%
2021-22, n=761
Approved, 48%, significantly lower than previous wave
Denied, 52%, significantly higher than previous wave
Note: Clients who were denied benefit were present in the administrative databases of EI, CPP and CPP-D, but not other programs.
Note: Clients are asked specifically to assess the service delivery, not whether the application was approved or denied. While granted/denied is a driver of satisfaction, it must be remembered that approval is based on legislation.
Q38a. Again thinking about the overall service from getting information about [INSERT ABBREV] to receiving a decision. How satisfied were you with the service you received from Service Canada related to your [insert abbrev] application? Please use a 5-point scale, where 1 means very dissatisfied, and 5 means very satisfied.
Service Levels and Channel Use
Self-service and Assistance
Change in Multiple Channel Use Over Time
Overall, multiple channel use among clients was generally consistent with 2020-21 levels. Clients were statistically more likely to utilize in-person service or assisted self-service during the entire client journey compared to 2020-21, while fewer used self-service only.
Use of in-person service remained considerably lower than in 2019-20 or earlier but was utilized slightly more than self-service only. Assisted self-service has continued to see gradual increases in usage year-over-year.
Six percent utilized the touchless person-to-person service, while five percent were auto-enrolled only and one percent used mail only. The balance of clients (8%), indicated either using no channels throughout their experience or did not fit a defined level of service. This figure is stable with the previous year.
Multiple Channel Use definitions were mutually exclusive paths that track the client journey. The Multiple Channel Use variables were used to assess whether there has been an increase or decrease in a particular method of contact with Service Canada. Please note that the definitions used are based on those set in CX3.
In-Person: If a respondent goes into a Service Canada centre at any stage of their journey, they were considered to have used the “in person” service level.
Self-Service Only: These respondents use online offerings including the Government of Canada website and their My Service Canada Account. They engage online at all stages.
Assisted Self-Service: These respondents use an online or mail, but also contact Service Canada by phone, or a combination of phone and online or mail throughout their journey.
Auto-Enroll Only: These respondents were auto-enrolled in their program/benefit and made no additional contact with Service Canada.
Mail Only: These respondents only contact Service Canada by mail at every stage, making no use of the online, in person, or telephone services.
Touchless Person-to-Person: These respondents used an online application and had a service interaction with eServiceCanada at any point (no in-person at any point).
Figure long description
Multiple Channel use Changes – Trending
In-person at any
2017-18, 60%
2018-20, 62%
2020-21, 30%
2021-22, 33%, significantly higher than previous wave
Self-service only
2017-18, 19%
2019-20, 17%
2020-21, 34%
2021-22, 31%, significantly lower than previous wave
Assisted Self-Service
2017-18, 6%
2019-20, 10%
2020-21, 13%
2021-22, 15%, significantly higher than previous wave
Auto-Enroll Only
2017-18, 5%
2019-20, 4%
2020-21, 4%
2021-22, 5%
Mail Only
2017-18, 0%
2019-20, 1%
2020-21, 1%
2021-22, 1%
Touchless Person-to-Person
2020-21, 7%
2021-22, 6%
Note On Multiple Channel Use:
There was a select number of clients who either did not indicate a channel at all stages or do not fit into any of the defined service levels. The proportion of these respondents as a part of the total sample was:
2021-22 – 8%
2020-21 – 6%
2019-20 – 6%
2017-18 – 10%
Service Levels by Stage in the Client Journey: Overall
Clients were most likely to have used self-service only at the aware and apply stages and assisted self-service at the follow-up stage.
Compared to 2020-21, the in-person service level remained generally consistent, though more have used in-person service at the apply and follow-up stages. Clients were also more likely to have used assisted-self-service at the apply stage and less likely to have used self-service only compared to the previous wave. Fewer used touchless person-to-person at the follow-up stage.
Figure long description
Aware
In-person
2017-18, 42%
2019-20, 35%
2020-21, 18%
2021-22, 19%
Self-Service Only
2017-18, 35%
2019-20, 44%
2020-21, 36%
2021-22, 37%
Assisted Self-Service
2017-18, 7%
2019-20, 6%
2020-21, 8%
2021-22, 7%
Auto-Enroll Only
2017-18, 0%
2019-20, 6%
2020-21, 6%
2021-22, 6%
Mail Only
2017-18, 2%
2019-20, 2%
2020-21, 1%
2021-22, 2%
Touchless Person-to-Person
2020-21, 3%
2021-22, 3%
Apply
In-person
2017-18, 49%
2019-20, 53%
2020-21, 22%
2021-22, 25%, significantly higher than previous wave
Self-Service Only
2017-18, 29%
2019-20, 29%
2020-21, 51%
2021-22, 46%, significantly lower than previous wave
Assisted Self-Service
2017-18, 7%
2019-20, 5%
2020-21, 9%
2021-22, 12%, significantly higher than previous wave
Auto-Enroll Only
2017-18, 0%
2019-20, 4%
2020-21, 6%
2021-22, 6%
Mail Only
2017-18, 4%
2019-20, 3%
2020-21, 5%
2021-22, 4%
Touchless Person-to-Person
2020-21, 3%
2021-22, 3%
Follow-up
In-person
2017-18, 41%
2019-20, 40%
2020-21, 13%
2021-22, 19%, significantly higher than previous wave
Self-Service Only
2017-18, 10%
2019-20, 11%
2020-21, 14%
2021-22, 13%
Assisted Self-Service
2017-18, 15%
2019-20, 24%
2020-21, 26%
2021-22, 30%
Auto-Enroll Only
2017-18, 0%
2019-20, 0%
2020-21, 1%
2021-22, 1%
Mail Only
2017-18, 1%
2019-20, 2%
2020-21, 3%
2021-22, 2%
Touchless Person-to-Person
2020-21, 3%
2021-22, 1%, significantly lower than previous wave
Proportion who completed the client journey using only self-service (without assistance by phone or in-person): 43% of all clients
Proportion who used high-touch service (in-person and may have used other channels) at some point in the client journey: 18% of al clients
Percentages may not add to 100% due to rounding and not all clients choosing to follow-up.
It should be noted that there was missing data for contact by auto-enrolled clients in the baseline survey
Note: In 2018-19 the channel use question was asked once at the beginning of the survey and pertaining to the apply stage. Caution should be used in making comparisons between years at the apply stage.
Base: Total aware; Total apply; Total follow-up
Service Levels by Stage in the Client Journey: EI
EI clients were most likely to have used self-service only at the aware and apply stages and assisted self-service at the follow-up stage.
Compared to 2020-21, EI clients were more likely to have used assisted self-service at the apply stage and less likely to have used self-service only. EI clients were also more likely to have used in-person service at the follow-up stage compared to last year and less likely to have used touchless person-to-person.
Figure long description
Aware
In-person
2017-18, 35%
2019-20, 34%
2020-21, 10%
2021-22, 11%
Self-service Only
2017-18, 46%
2019-20, 52%
2020-21, 44%
2021-22, 45%
Assisted Self-service
2017-18, 9%
2019-20, 7%
2020-21, 12%
2021-22, 11%
Mail Only
2017-18, 1%
2019-20, 1%
2020-21, 1%
2021-22, 0%
Touchless Person-to-person
2017-18, 0%
2019-20, 0%
2020-21, 4%
2021-22, 3%
Apply
In-person
2017-18, 34%
2019-20, 43%
2020-21, 6%
2021-22, 8%
Self-service Only
2017-18, 52%
2019-20, 47%
2020-21, 74%
2021-22, 67%, significantly lower than previous wave
Assisted Self-service
2017-18, 12%
2019-20, 8%
2020-21, 13%
2021-22, 17%, significantly higher than previous wave
Mail Only
2017-18, 0%
2019-20, 0%
2020-21, 0%
2021-22, 0%
Touchless Person-to-person
2020-21, 4%
2021-22, 5%
Follow-up
In-person
2017-18, 35%
2019-20, 40%
2020-21, 11%
2021-22, 17%, significantly higher than previous wave
Self-service Only
2017-18, 13%
2019-20, 10%
2020-21, 17%
2021-22, 13%
Assisted Self-service
2017-18, 19%
2019-20, 28%
2020-21, 30%
2021-22, 35%
Mail Only
2017-18, 0%
2019-20, 1%
2020-21, 1%
2021-22, 1%
Touchless Person-to-person
2020-21, 3%
2021-22, 0%, significantly lower than previous wave
Proportion who completed the client journey using only self-service (without assistance by phone or in-person): 43% of EI clients
Proportion who used high-touch service (in-person and may have used other channels) at some point in the client journey: 18% of EI clients
Percentages may not add to 100% due to rounding and not all clients choosing to follow-up.
Note: In 2018-19 the channel use question was asked once at the beginning of the survey and pertaining to the apply stage. Caution should be used in making comparisons between years at the apply stage.
Base: Total aware; Total apply; Total follow-up
Service Levels by Stage in the Client Journey: CPP
CPP clients were most likely to have used self-service only at the aware and apply stages, while an equal proportion used self-service only, assisted self-service or in-person service at the follow-up stage.
Compared to 2020-21, CPP clients were more likely to have used in-person service at all stages of the client journey and were also more likely to have used mail only at the aware stage.
Figure long description
Aware
In-person
2017-18, 46%
2019-20, 28%
2020-21, 12%
2021-22, 16%, significantly higher than previous wave
Self-service Only
2017-18, 27%
2019-20, 50%
2020-21, 39%
2021-22, 39%
Assisted Self-service
2017-18, 11%
2019-20, 12%
2020-21, 7%
2021-22, 9%
Mail Only
2017-18, 6%
2019-20, 6%
2020-21, 5%
2021-22, 8%, significantly higher than previous wave
Touchless Person-to-person
2020-21, 2%
2021-22, 1%
Apply
In-person
2017-18, 51%
2019-20, 38%
2020-21, 14%
2021-22, 19%. Significantly higher than previous wave
Self-service Only
2017-18, 19%
2019-20, 38%
2020-21, 40%
2021-22, 40%
Assisted Self-service
2017-18, 6%
2019-20, 9%
2020-21, 13%
2021-22, 10%
Mail Only
2017-18, 16%
2019-20, 10%
2020-21, 19%
2021-22, 16%
Touchless Person-to-person
2020-21, 3%
2021-22, 2%
Follow-up
In-person
2017-18, 46%
2019-20, 38%
2020-21, 10%
2021-22, 19%, significantly higher than previous wave
Self-service Only
2017-18, 8%
2019-20, 15%
2020-21, 22%
2021-22, 19%
Assisted Self-service
2017-18, 8%
2019-20, 16%
2020-21, 17%
2021-22, 18%
Mail Only
2017-18, 6%
2019-20, 4%
2020-21, 3%
2021-22, 4%
Touchless Person-to-person
2020-21, 0%
2021-22, 1%
Proportion who completed the client journey using only self-service (without assistance by phone or in-person): 31% of CPP clients
Proportion who used high-touch service (in-person and may have used other channels) at some point in the client journey: 25% of CPP clients
Percentages may not add to 100% due to rounding and not all clients choosing to follow-up.
Note: In 2018-19 the channel use question was asked once at the beginning of the survey and pertaining to the apply stage. Caution should be used in making comparisons between years at the apply stage.
Base: Total aware; Total apply; Total follow-up
Service Levels by Stage in the Client Journey: CPP-D
CPP-D clients were most likely to have used self-service only at the aware stage, mail only at the apply stage and assisted self-service at the follow-up stage.
Compared to 2020-21, CPP-D clients were more likely to have used mail only at the aware stage and less likely to have used self-service only or touchless person-to-person. Service levels at the apply and follow-up stages remained consistent with last year.
Figure long description
Aware
In-person
2017-18, 31%
2019-20, 29%
2020-21, 10%
2021-22, 12%
Self-service Only
2017-18, 28%
2019-20, 33%
2020-21, 28%
2021-22, 23%, significantly lower than previous wave
Assisted Self-service
2017-18, 14%
2019-20, 10%
2020-21, 9%
2021-22, 11%
Mail Only
2017-18, 5%
2019-20, 5%
2020-21, 5%
2021-22, 9%, significantly higher than previous wave
Touchless Person-to-person
2020-21, 5%
2021-22, 2%, significantly lower than previous wave
Apply
In-person
2017-18, 36%
2019-20, 38%
2020-21, 8%
2021-22, 11%
Self-service Only
2017-18, 11%
2019-20, 15%
2020-21, 16%
2021-22, 14%
Assisted Self-service
2017-18, 9%
2019-20, 5%
2020-21, 10%
2021-22, 13%
Mail Only
2017-18, 28%
2019-20, 28%
2020-21, 44%
2021-22, 41%
Touchless Person-to-person
2020-21, 2%
2021-22, 2%
Follow-up
In-person
2017-18, 26%
2019-20, 27%
2020-21, 13%
2021-22, 12%
Self-service Only
2017-18, 3%
2019-20, 3%
2020-21, 6%
2021-22, 7%
Assisted Self-service
2017-18, 10%
2019-20, 18%
2020-21, 21%
2021-22, 19%
Mail Only
2017-18, 8%
2019-20, 9%
2020-21, 6%
2021-22, 5%
Touchless Person-to-person
2020-21, 1%
2021-22, 0%
Proportion who completed the client journey using only self-service (without assistance by phone or in-person): 5% of CPP-D clients
Proportion who used high-touch service (in-person and may have used other channels) at some point in the client journey: 21% of CPP-D clients
Percentages may not add to 100% due to rounding and not all clients choosing to follow-up.
Note: In 2018-19 the channel use question was asked once at the beginning of the survey and pertaining to the apply stage. Caution should be used in making comparisons between years at the apply stage.
Base: Total aware; Total apply; Total follow-up
Service Levels by Stage in the Client Journey: SIN
SIN clients were most likely to have used in-person at all stages of the client journey and in-particular at the apply stage.
Compared to 2020-21, SIN clients were more likely to have utilized in-person at the apply stage, while use of all other service levels remained consistent across all stages of the client journey.
Figure long description
Aware
In-person
2020-21, 38%
2021-22, 38%
Self-service Only
2020-21, 31%
2021-22, 31%
Assisted Self-service
2020-21, 3%
2021-22, 2%
Mail Only
2020-21, 1%
2021-22, 0%
Touchless Person-to-person
2020-21, 2%
2021-22, 2%
Apply
In-person
2020-21, 55%
2021-22, 61%, significantly higher than previous wave
Self-service Only
2020-21, 33%
2021-22, 29%
Assisted Self-service
2020-21, 5%
2021-22, 6%
Mail Only
2020-21, 1%
2021-22, 1%
Touchless Person-to-person
2020-21, 2%
2021-22, 1%
Follow-up
In-person
2020-21, 32%
2021-22, 36%
Self-service Only
2020-21, 4%
2021-22, 10%
Assisted Self-service
2020-21, 19%
2021-22, 14%
Mail Only
2020-21, 6%
2021-22, 4%
Touchless Person-to-person
2020-21, 2%
2021-22, 3%
Proportion who completed the client journey using only self-service (without assistance by phone or in-person): 21% of SIN clients
Proportion who used high-touch service (in-person and may have used other channels) at some point in the client journey: 69% of SIN clients
Percentages may not add to 100% due to rounding and not all clients choosing to follow-up.
Note: Service levels were not reported for SIN clients in previous years due to differences in service delivery.
Base: Total aware; Total apply; Total follow-up
Service Levels by Stage in the Client Journey: OAS/GIS
The largest proportion of OAS/GIS clients were auto-enrolled and did not engage in the aware or apply stage. Non auto-enrolled clients were most likely to use self-service only at the aware stage, while use of self-service only and mail only were most common at the apply stage. Among those who followed up, an equal proportion used self-service only, assisted self-service or in-person service most often.
Compared to 2020-21, the proportion of clients auto-enrolled increased which meant more OAS/GIS clients overall did not engage in the aware or apply stages. OAS/GIS clients were more likely to have used assisted self-service at the apply stage and less likely to have used mail only or touchless person-to-person, while use of in-person and self-service only increased at the follow-up stage.
Figure long description
Aware
In-person
2017-18, 19%
2019-20, 12%
2020-21, 9%
2021-22, 6%
Self-service Only
2017-18, 19%
2019-20, 23%
2020-21, 13%
2021-22, 15%
Assisted Self-service
2017-18, 6%
2019-20, 6%
2020-21, 3%
2021-22, 3%
Auto-enroll Only
2019-20, 51%
2020-21, 53%
2021-22, 58%, significantly higher than previous wave
Mail Only
2017-18, 7%
2019-20, 6%
2020-21, 4%
2021-22, 3%
Touchless Person-to-person
2020-21, 1%
2021-22, 1%
Apply
In-person
2017-18, 12%
2019-20, 16%
2020-21, 10%
2021-22, 8%
Self-service Only
2017-18, 3%
2019-20, 8%
2020-21, 13%
2021-22, 12%
Assisted Self-service
2017-18, 1%
2019-20, 2%
2020-21, 2%
2021-22, 5%, significantly higher than previous wave
Auto-enroll Only
2019-20, 38%
2020-21, 53%
2021-22, 58%, significantly higher than previous wave
Mail Only
2017-18, 9%
2019-20, 10%
2020-21, 15%
2021-22, 11%, significantly lower than previous wave
Touchless Person-to-person
2020-21, 6%
2021-22, 1%, significantly lower than previous wave
Follow-up
In-person
2017-18, 45%
2019-20, 39%
2020-21, 9%
2021-22, 18%, significantly higher than previous wave
Self-service Only
2017-18, 2%
2019-20, 18%
2020-21, 9%
2021-22, 18%, significantly higher than previous wave
Assisted Self-service
2017-18, 4%
2019-20, 11%
2020-21, 22%
2021-22, 19%
Auto-enroll Only
2019-20, 3%
2020-21, 8%
2021-22, 3%, significantly lower than previous wave
Mail Only
2017-18, 4%
2019-20, 7%
2020-21, 7%
2021-22, 7%
Touchless Person-to-person
2020-21, 0%
2021-22, 0%
Proportion who completed the client journey using only self-service (without assistance by phone or in-person): 9% of OAS/GIS clients
Proportion who used high-touch service (in-person and may have used other channels) at some point in the client journey: 13% of OAS/GIS clients
Percentages may not add to 100% due to rounding and not all clients choosing to follow-up.
It should be noted that there was missing data for contact by auto-enrolled clients in the baseline survey
Note: In 2018-19 the channel use question was asked once at the beginning of the survey and pertaining to the apply stage. Caution should be used in making comparisons between years at the apply stage.
Base: Total aware; Total apply; Total follow-up
Proactive Communication with CPP-D Clients (Reported)
Just over half (53%) of CPP-D clients reported receiving a call from Service Canada to discuss their application status and next steps prior to receiving a decision, higher than the previous year.
Satisfaction continued to be considerably higher among CPP-D clients who report being contacted by Service Canada before receiving a decision, compared to those who were not.
Figure long description
Contact with Service Canada Prior to Decision, A service Canada representative called to discuss your application status and the next steps (CPP-D clients n=761)
2021-22
Yes, 53%, significantly higher than previous wave
No, 43%
Don’t know, 4%
% Yes
2020-21, n=692, 47%
2019-20, n=417, 54%
Figure long description
Satisfaction among clients who were contacted by Service Canada, A service Canada representative called to discuss your application status and the next steps (CPP-D clients=761)
Contacted
2021-22, 70%
2020-21, 72%
2019-20, 60%
Not contacted
2021-22, 49%
2020-21, 54%
2019-20, 46%
Q20bx. Before you received a decision about your application to [PROGRAM ABBREV], did …
Base: CPP-D or EI Clients (n=varies)
Proactive Communication with EI Clients (Reported)
Three in ten (28%) EI clients reported receiving a letter, email, or telephone call from Service Canada about their application status prior to receiving a decision, consistent with 2020-21.
For EI clients, contact by Service Canada did not make a significant difference in their satisfaction and overall satisfaction ratings have decreased among both groups compared to 2020-21.
Figure long description
Contact with Service Canada prior to decision, A Service Canada representative contact you about you application status by email, letter or telephone call (EI clients n=987)
2021-22
Yes, 28%
No, 68%
Don’t know, 4%
% Yes
2020-21, 27%
Figure long description
Satisfaction among clients who were contacted by Service Canada, A Service Canada representative contact you about your application status by email, letter or telephon call (EI clients n=987)
Contacted
2021-22, 73%, significantly lower than previous wave
2020-21, 84%
Not Contacted
2021-22, 77%, significantly lower than previous wave
2020-21, 83%
Q20bx. Before you received a decision about your application to [PROGRAM ABBREV], did …
Base: CPP-D or EI Clients (n=varies)
Channel Use by Stage and Program
Channel Use: Overall
Across all stages of the client journey, nearly eight in ten (77%) clients used the online channel at some point, while one-third used in-person (33%) and slightly fewer telephone (31%). Two in ten (21%) used mail and around one in ten (13%) eServiceCanada at some point during their client journey.
Channel use was generally consistent with 2020-21, however there has been a statistically significant increase in the proportion who used the in-person or mail channels.
Figure long description
Overall Channel Use – Trending
In-person
2017-18, 59%
2019-20, 62%
2020-21, 30%
2021-22, 33%, significantly higher than last year
Online
2017-18, 66%
2019-20, 60%
2020-21, 78%
2021-22, 77%
Telephone
2017-18, 29%
2019-20, 32%
2020-21, 30%
2021-22, 31%
Mail
2017-18, 18%
2019-20, 17%
2020-21, 19%
2021-22, 21%, significantly higher than previous wave
eServiceCanada
2020-21, 13%
2021-22, 13%
Q1a. Which of the following did you use to find out about [PROGRAM] or [PROGRAM ABBREV] before you applied? Did you …
Q9bx Thinking back to when you actually applied for [IF NOT SIN INSERT [PROGRAM ABBREV] benefits], [IF SIN INSERT: a SIN number], which of the following methods did you use when completing and submitting your application? Did you ...
Q18. How did you contact the government before you were notified of a decision on your [PROGRAM ABBREV] application? Was it ...
Base: All respondents (n=4200)
Channel Use by Stage: Overall
Online was the most used channel at the aware and apply stages and telephone at the follow-up stage.
Compared to 2020-21, channel use remained very consistent across all stages of the client journey. Use of the in-person channel increased at the apply and follow-up stages but stayed generally in line with the lower usage observed last year compared to 2019-20 or earlier.
Figure long description
Aware
In-person
2017-18, 37%
2019-20, 47%
2020-21, 24%
2021-22, 26%
Online
2017-18, 54%
2019-20, 58%
2020-21, 75%
2021-22, 76%
Telephone
2017-18, 21%
2019-20, 15%
2020-21, 16%
2021-22, 15%
Mail
2017-18, 13%
2019-20, 10%
2020-21, 14%
2021-22, 16%
eServiceCanada
2020-21, 6%
2021-22, 7%
Apply
In-person
2017-18, 37%
2019-20, 59%
2020-21, 24%
2021-22, 27%, significantly higher than previous wave
Online
2017-18, 72%
2019-20, 48%
2020-21, 72%
2021-22, 72%
Telephone
2017-18, 21%
2019-20, 13%
2020-21, 13%
2021-22, 14%
Mail
2017-18, 14%
2019-20, 10%
2020-21, 11%
2021-22, 12%
eServiceCanada
2020-21, 5%
2021-22, 5%
Follow-up
In-person
2017-18, 36%
2019-20, 30%
2020-21, 13%
2021-22, 19%, significantly higher than previous wave
Online
2017-18, 48%
2019-20, 56%
2020-21, 51%
2021-22, 56%
Telephone
2017-18, 68%
2019-20, 68%
2020-21, 70%
2021-22, 73%
Mail
2017-18, 10%
2019-20, 15%
2020-21, 15%
2021-22, 11%
eServiceCanada
2020-21, 24%
2021-22, 21%
Q1a. Which of the following did you use to find out about [PROGRAM] or [PROGRAM ABBREV] before you applied? Did you …
Q9bx Thinking back to when you actually applied for [IF NOT SIN INSERT [PROGRAM ABBREV] benefits], [IF SIN INSERT: a SIN number], which of the following methods did you use when completing and submitting your application? Did you ...
Q18. How did you contact the government before you were notified of a decision on your [PROGRAM ABBREV] application? Was it ...
Base: All respondents (n=4200)
Channel Use at Aware Stage: by Program
Clients of all programs were most likely to have used online government sources to find out about the program they were applying for. EI clients continued to be more likely to use the online channel compared to all clients, whereas clients of all other programs were less likely. Telephone use was higher among CPP, CPP-D and OAS/GIS clients, while SIN clients were significantly more likely to use in-person service.
Compared to 2020-21, channel use at the aware stage remained very consistent across each program. OAS/GIS clients were more likely to have gone online during the aware stage.
Figure long description
Total
In-person
2017-18, 37%
2019-20, 47%
2020-21, 24%
2021-22, 26%
Online
2017-18, 54%
2019-20, 58%
2020-21, 75%
2021-22, 76%
Telephone
2017-18, 21%
2019-20, 15%
2020-21, 16%
2021-22, 15%
Mail
2017-18, 13%
2019-20, 10%
2020-21, 14%
2021-22, 16%
eServiceCanada
2020-21, 6%
2021-22, 7%
EI
In-person
2017-18, 35%
2019-20, 42%
2020-21, 14%
2021-22, 14%, significantly lower than total
Online
2017-18, 60%
2019-20, 71%
2020-21, 83%
2021-22, 85%, significantly higher than total
Telephone
2017-18, 19%
2019-20, 20%
2020-21, 20%
2021-22, 19%
Mail
2017-18, 8%
2019-20, 8%
2020-21, 8%
2021-22, 11%, significantly lower than total
eServiceCanada
2020-21, 7%
2021-22, 6%
CPP
In-person
2017-18, 46%
2019-20, 33%
2020-21, 15%
2021-22, 19%, significantly lower than total
Online
2017-18, 41%
2019-20, 63%
2020-21, 66%
2021-22, 67%, significantly lower than total
Telephone
2017-18, 24%
2019-20, 12%
2020-21, 19%
2021-22, 17%
Mail
2017-18, 26%
2019-20, 21%
2020-21, 24%
2021-22, 29%, significantly higher than total
eServiceCanada
2020-21, 5%
2021-22, 4%, significantly lower than total
CPP-D
In-person
2017-18, 32%
2019-20, 34%
2020-21, 12%
2021-22, 15%, significantly lower than total
Online
2017-18, 38%
2019-20, 44%
2020-21, 50%
2021-22, 53%, significantly lower than total
Telephone
2017-18, 28%
2019-20, 18%
2020-21, 18%
2021-22, 23%, significantly higher than total
Mail
2017-18, 30%
2019-20, 21%
2020-21, 28%
2021-22, 32%, significantly higher than total
eServiceCanada
2020-21, 5%
2021-22, 6%
SIN
In-person
2017-18, 62%
2019-20, 64%
2020-21, 48%
2021-22, 48%, significantly higher than total
Online
2017-18, 36%
2019-20, 37%
2020-21, 72%
2021-22, 68%, significantly lower than total
Telephone
2017-18, 12%
2019-20, 6%
2020-21, 8%
2021-22, 6%, significantly lower than total
Mail
2017-18, 10%
2019-20, 5%
2020-21, 15%
2021-22, 16%
eServiceCanada
2020-21, 7%
2021-22, 9%
OAS/GIS
In-person
2017-18, 34%
2019-20, 28%
2020-21, 23%
2021-22, 18%, significantly lower than total
Online
2017-18, 33%
2019-20, 46%
2020-21, 54%
2021-22, 64%, significantly lower than total, significantly higher than previous wave
Telephone
2017-18, 21%
2019-20, 22%
2020-21, 20%
2021-22, 15%
Mail
2017-18, 25%
2019-20, 34%
2020-21, 32%
2021-22, 29%, significantly higher than total
eServiceCanada
2020-21, 4%
2021-22, 4%
Q1a. Which of the following did you use to find out about or before you applied? Did you …
Base: All respondents (n=4200)
Channel Use at Apply Stage: by Program
EI, CPP and OAS/GIS clients were most likely to have used the online channel at the apply stage, while CPP-D were most likely to have used mail and SIN clients in-person. EI clients were more likely to have used the online channel compared to all clients, EI and CPP-D clients the telephone channel, and CPP, CPP-D and OAS/GIS clients the mail channel. SIN clients were significantly more likely to use in-person service compared to all clients.
Compared to 2020-21, channel use at the apply stage remained very consistent across each program. Compared to 2020-21, SIN and CPP clients were more likely to have used the in-person channel, while OAS/GIS clients were more likely to have used the online channel.
Figure long description
Total
In-person
2017-18, 37%
2019-20, 59%
2020-21, 24%
2021-22, 27%, significantly higher than previous wave
Online
2017-18, 72%
2019-20, 48%
2020-21, 72%
2021-22, 72%
Telephone
2017-18, 21%
2019-20, 13%
2020-21, 13%
2021-22, 14%
Mail
2017-18, 14%
2019-20, 10%
2020-21, 11%
2021-22, 12%
eServiceCanada
2020-21, 5%
2021-22, 5%
EI
In-person
2017-18, 35%
2019-20, 44%
2020-21, 7%
2021-22, 8%, significantly lower than total
Online
2017-18, 87%
2019-20, 69%
2020-21, 94%
2021-22, 94%, significantly higher than total
Telephone
2017-18, 22%
2019-20, 15%
2020-21, 16%
2021-22, 19%, significantly higher than total
Mail
2017-18, 6%
2019-20, 3%
2020-21, 3%
2021-22, 5%, significantly lower than total
eServiceCanada
2020-21, 5%
2021-22, 6%
CPP
In-person
2017-18, 51%
2019-20, 39%
2020-21, 15%
2021-22, 20%, significantly lower than total, significantly higher than previous wave
Online
2017-18, 30%
2019-20, 53%
2020-21, 59%
2021-22, 55%, significantly lower than total
Telephone
2017-18, 19%
2019-20, 16%
2020-21, 17%
2021-22, 16%
Mail
2017-18, 36%
2019-20, 25%
2020-21, 35%
2021-22, 33%, significantly higher than total
eServiceCanada
2020-21, 5%
2021-22, 4%
CPP-D
In-person
2017-18, 36%
2019-20, 42%
2020-21, 9%
2021-22, 11%, significantly lower than total
Online
2017-18, 23%
2019-20, 29%
2020-21, 28%
2021-22, 29%, significantly lower than total
Telephone
2017-18, 21%
2019-20, 23%
2020-21, 17%
2021-22, 21%, significantly higher than total
Mail
2017-18, 60%
2019-20, 59%
2020-21, 68%
2021-22, 67%, significantly higher than total
eServiceCanada
2020-21, 3%
2021-22, 3%, significantly lower than total
SIN
In-person
2017-18, 87%
2019-20, 94%
2020-21, 56%
2021-22, 62%, significantly higher than total, significantly higher than previous wave
Online
2017-18, 18%
2019-20, 13%
2020-21, 50%
2021-22, 47%, significantly lower than total
Telephone
2017-18, 11%
2019-20, 7%
2020-21, 7%
2021-22, 6%
Mail
2017-18, 9%
2019-20, 7%
2020-21, 7%
2021-22, 8%, significantly lower than total
eServiceCanada
2020-21, 6%
2021-22, 6%, significantly lower than total
OAS/GIS
In-person
2017-18, 41%
2019-20, 43%
2020-21, 21%
2021-22, 20%, significantly lower than total
Online
2017-18, 15%
2019-20, 28%
2020-21, 35%
2021-22, 46%, significantly lower than total, significantly higher than previous wave
Telephone
2017-18, 17%
2019-20, 16%
2020-21, 9%
2021-22, 15%
Mail
2017-18, 46%
2019-20, 40%
2020-21, 45%
2021-22, 43%, significantly higher than total
eServiceCanada
2020-21, 2%
2021-22, 2%, significantly lower than total
Q9bx Thinking back to when you actually applied for [IF NOT SIN INSERT [INSERT ABBREV] benefits], [IF SIN INSERT: a SIN number], which of the following methods did you use when completing and submitting your application? Did you ...
Base: All respondents (n=4200)
Channel Use at Follow-Up Stage: by Program
Clients of all programs were most likely to have used the telephone channel at the follow-up stage. EI clients were more likely to have used the telephone channel compared to all clients and CPP, CPP-D, SIN and OAS/GIS clients the mail channel. SIN clients were also more likely to have used the in-person channel or eServiceCanada.
Compared to 2020-21, channel use at the follow-up stage remained very consistent across each program. Compared to 2020-21, EI and CPP clients were more likely to have used the in-person channel, while EI clients were also more likely to have used the telephone channel.
Figure long description
Total
In-person
2017-18, 36%
2019-20, 30%
2020-21, 13%
2021-22, 19%, significantly higher than previous wave
Online
2017-18, 48%
2019-20, 56%
2020-21, 51%
2021-22, 56%
Telephone
2017-18, 68%
2019-20, 68%
2020-21, 70%
2021-22, 73%
Mail
2017-18, 10%
2019-20, 15%
2020-21, 15%
2021-22, 11%
eServiceCanada
2020-21, 24%
2021-22, 21%
EI
In-person
2017-18, 35%
2019-20, 40%
2020-21, 11%
2021-22, 17%, significantly higher than previous wave
Online
2017-18, 52%
2019-20, 62%
2020-21, 56%
2021-22, 59%
Telephone
2017-18, 61%
2019-20, 75%
2020-21, 71%
2021-22, 79%, significantly higher than total, significantly higher than previous wave
Mail
2017-18, 7%
2019-20, 11%
2020-21, 9%
2021-22, 6%, significantly lower than total
eServiceCanada
2020-21, 25%
2021-22, 21%
CPP
In-person
2017-18, 46%
2019-20, 38%
2020-21, 10%
2021-22, 19%, significantly higher than previous wave
Online
2017-18, 30%
2019-20, 43%
2020-21, 46%
2021-22, 49%
Telephone
2017-18, 56%
2019-20, 53%
2020-21, 62%
2021-22, 58%, significantly lower than total
Mail
2017-18, 20%
2019-20, 28%
2020-21, 20%
2021-22, 20%, significantly higher than total
eServiceCanada
2020-21, 17%
2021-22, 17%
CPP-D
In-person
2017-18, 26%
2019-20, 27%
2020-21, 13%
2021-22, 12%, significantly lower than total
Online
2017-18, 22%
2019-20, 31%
2020-21, 35%
2021-22, 36%, significantly lower than total
Telephone
2017-18, 68%
2019-20, 76%
2020-21, 73%
2021-22, 76%
Mail
2017-18, 32%
2019-20, 24%
2020-21, 21%
2021-22, 23%, significantly higher than total
eServiceCanada
2020-21, 22%
2021-22, 19%
SIN
In-person
2017-18, 70%
2019-20, 56%
2020-21, 32%
2021-22, 36%, significantly higher than total
Online
2017-18, 42%
2019-20, 45%
2020-21, 47%
2021-22, 53%
Telephone
2017-18, 53%
2019-20, 44%
2020-21, 69%
2021-22, 55%
Mail
2017-18, 26%
2019-20, 39%
2020-21, 28%
2021-22, 34%, significantly higher than total
eServiceCanada
2020-21, 34%
2021-22, 31%, significantly higher than total
OAS/GIS
In-person
2017-18, 44%
2019-20, 39%
2020-21, 9%
2021-22, 18%
Online
2017-18, 18%
2019-20, 40%
2020-21, 35%
2021-22, 46%, significantly lower than total
Telephone
2017-18, 68%
2019-20, 37%
2020-21, 68%
2021-22, 61%, significantly lower than total
Mail
2017-18, 17%
2019-20, 24%
2020-21, 26%
2021-22, 20%, significantly higher than total
eServiceCanada
2020-21, 12%
2021-22, 17%
Q18. How did you contact the government before you were notified of a decision on your [INSERT ABBREV] application? Was it ...
Base: All respondents (n=4200)
Sequence of Channel Use
Qualitative Insights on Channel Preferences
Participants’ choice of service channel is dependent on the nature of the intended service interaction.
Service channel preference varied and was highly dependent on the context of the service need and the program. Some participants said they had no service channel preference, saying that their choice of channel depended on the nature of the service interaction.
In other words, these clients select the service channel that, in their view, is best suited to the service interaction. This suggests a potential need to reconsider future service channel design and/or improvements from the perspective of function. For example, if clients prefer to use Service Canada’s website for quick access to things like application forms, these forms should be made more clearly accessible from the landing page of the website. If clients are asking for resolutions to specific questions over the phone, agents should be able to access client files or previous call logs to maximize the likelihood the question can be addressed in one transaction.
I would prefer real-time support, because if you get the information as soon as possible, I can make a decision quicker, because I don’t want to stay in lines or wait for my thing online for a few times. I’d rather I get on a personal level with a person giving me information, and he can just give me information based on my needs.
It’s in person, and that’s much better to have a reaction on things. Because sometimes, doing things without the face-to-face, you don’t feel comfortable not seeing the person, especially filling out your information.
Send an e-mail, like just send an e-mail and say like, ‘Hey, we’re missing this, we were wondering if you could reach out to your employer’, or vice versa.
Multi-Channel Use: Online Channel Usage In-Depth
Clients most often used the online channel first at the aware and apply stages. Online contact is the second most used option at follow-up. Among those who used online first, clients were more likely to have used phone as a second channel at the follow-up stage and to a lesser extent the apply and awareness stage.
Compared to 2020-21, use of the online channel remained consistent across all points of contact.
In-person was the second most used channel as a first point of contact at the aware or apply stage and the least used as a first point of contact at the follow-up stage. Among those who used in-person first, clients were more likely to have used online as a second channel at the aware stage and to a lesser extent the apply stage, while phone was the most common second channel used for follow-up.
Compared to 2020-21, clients were more likely to have used the in-person channel as a first point of contact at all stages.
Figure long description
Aware
First Channel
In-person
2021-22, 14%, significantly higher than previous wave
2020-21, 12%
2019-20, 28%
2017-18, 21%
Second Channel
In-person to Phone
2021-22, 4%
2020-21, 7%
2019-20, 4%
2017-18, 8%
In-person to Online
2021-22, 25%
2020-21, 22%
2019-20, 16%
2017-18, 11%
Third Channel
Phone to Online
2021-22, 6%
2020-21, 7%
2019-20, 5%
2017-18, 9%
Online to Phone
2021-22, 10%
2020-21, 6%
2019-20, 17%
2017-18, 29%
Apply
First Channel
In-person
2021-22, 22%, significantly higher than previous wave
2020-21, 19%
2019-20, 49%
2017-18, 40%
Second Channel
In-person to phone
2021-22, 3%
2020-21, 2%
2019-20, 4%
2017-18, 7%
In-person to online
2021-22, 8%
2020-21, 8%
2019-20, 6%
2017-18, 13%
Third Channel
Phone to Online
2021-22, 2%
2020-21, 1%
2019-20, 3%
2017-18, 10%
Online to Phone
2021-22, 9%
2020-21, 9%
2019-20, 21%
2017-18, 15%
Follow-up
First channel
In-person
2021-22, 6%, significantly higher than previous wave
Telephone continues to be the least used channel for the first point of contact at the aware and apply stages and the most common used first channel at the follow-up stage. Among those who used telephone first, clients were more likely to use the online channel as a second channel at all stages.
Compared to 2020-21, use of telephone as the first point of contact remained consistent across all stages. Among those who used telephone first at the aware and follow-up stages, clients were less likely to use online as a second channel and more likely at the follow-up stage. Use of in-person increased as a second or third channel at the aware and follow-up stages.
Figure long description
Aware
First Channel
Phone
2021-22, 4%
2020-21, 5%
2019-20, 5%
2017-18, 7%
Second channel
Phone to online
2021-22, 33%, significantly lower than previous wave
2020-21, 44%
2019-20, 16%
2017-18, 23%
Phone to in-person
2021-22, 21%, significantly higher than previous wave
2020-21, 11%
2019-20, 30%
2017-18, 19%
Third Channel
Online to In-person
2021-22, 6%
2020-21, 5%
2019-20, 6%
2017-18, 20%
In-person to online
2021-22, 10%
2020-21, 5%
2019-20, 5%
2017-18, 3%
Apply
First Channel
Phone
2021-22, 3%
2020-21, 3%
2019-20, 2%
2017-18, 6%
Second channel
Phone to online
2021-22, 42%
2020-21, 41%
2019-20, 29%
2017-18, 30%
Phone to in-person
2021-22, 11%
2020-21, 9%
2019-20, 27%
2017-18, 33%
Third Channel
Online to In-person
2021-22, 6%
2020-21, 5%
2019-20, 14%
2017-18, 10%
In-person to online
2021-22, 7%
2020-21, 5%
2019-20, 4%
2017-18, 6%
Follow-up
First Channel
Phone
2021-22, 42%
2020-21, 42%
2019-20, 36%
2017-18, 38%
Second channel
Phone to online
2021-22, 23%, significantly higher than previous wave
2020-21, 14%
2019-20, 22%
2017-18, 14%
Phone to in-person
2021-22, 11%, significantly higher than previous wave
2020-21, 6%
2019-20, 25%
2017-18, 24%
Third Channel
Online to In-person
2021-22, 10%, significantly higher than previous wave
2020-21, 2%
2019-20, 10%
2017-18, 19%
In-person to online
2021-22, 19%
2020-21, 21%
2019-20, 6%
2017-18, 11%
Base: All respondents, base may vary by statement
Questions 1a, 2, 3, 9bx, 10x, 11x, 18, 19a, 19b
Multiple Channel Use Proportions
Overall, more than four in ten clients used one channel during their client journey, followed by three in ten who used two, just over one in ten who used three and 7% who used 4 or more. SIN clients were more likely to have used only one channel, OAS/GIS clients no channels (due to auto-enrolled clients who did not use any service channel) while CPP-D were more likely to have used three or more channels.
Compared to 2020-21, EI clients were less likely to have used one channel, while CPP-D clients were more likely to have used three channels and OAS/GIS clients no channels.
Figure long description
Proportions Overall and By Program – Trending
Total
2021-22
No channel, 6%
1 channel, 42%
2 channels, 30%
3 channels, 14%
+4 channels, 7%
2020-21,
No channel, 6%
1 channel, 44%
2 channels, 30%
3 channels, 13%
+4 channels, 6%
EI
2021-22
No channel, 1%, significantly lower than total
1 channel, 43%, significantly lower than previous wave
2 channels, 32%
3 channels, 16%
+4 channels, 8%
2020-21,
No channel, 1%
1 channel, 49%
2 channels, 30%
3 channels, 14%
+4 channels, 6%
CPP
2021-22
No channel, 3%, significantly lower than total
1 channel, 42%
2 channels, 35%, significantly higher than total
3 channels, 15%
+4 channels, 6%
2020-21,
No channel, 5%
1 channel, 41%
2 channels, 33%
3 channels, 13%
+4 channels, 7%
CPP-D
2021-22
No channel, 4%, significantly lower than total
1 channel, 28%
2 channels, 30%
3 channels, 26%, significantly higher than total, significantly higher than previous wave
+4 channels, 12%, significantly higher than total
2020-21,
No channel, 3%
1 channel, 32%
2 channels, 34%
3 channels, 20%
+4 channels, 10%
SIN
2021-22
No channel, 1%, significantly lower than total
1 channel, 50%, significantly higher than total
2 channels, 28%
3 channels, 14%
+4 channels, 7%
2020-21,
No channel, 1%
1 channel, 45%
2 channels, 32%
3 channels, 14%
+4 channels, 7%
OAS/GIS
2021-22
No channel, 48%, significantly higher than total, significantly higher than previous wave
1 channel, 22%, significantly lower than total
2 channels, 19%, significantly lower than total, significantly lower than previous wave
3 channels, 8%, significantly lower than total
+4 channels, 3%, significantly lower than total
2020-21,
No channel, 43%
1 channel, 23%
2 channels, 24%
3 channels, 6%
+4 channels, 4%
Base: All respondents (n=4200)
Impact of Multiple Channel Use
Clients who utilized two or more channels had lower overall satisfaction with their service experience compared to all clients, while those who used one channel had higher satisfaction.
Compared to 2020-21, satisfaction has declined by a statistically significant margin among all groups except for those who used 3 channels.
Figure long description
Satisfaction by Number of Channels Used – Trending
Total
2021-22, 81%, significantly lower than previous wave
2020-21, 86%
No channel
2021-22, 83%, significantly lower than previous wave
2020-21, 88%
1 Channel
2021-22, 86%, significantly higher than total, significantly lower than previous wave
2020-21, 89%
2 Channels
2021-22, 78%, significantly lower than total, significantly lower than previous wave
2020-21, 85%
3 Channels
2021-22, 76%, significantly lower than total
2020-21, 80%
+4 Channels
2021-22, 69%, significantly lower than total, significantly lower than previous wave
2020-21, 81%
Base: All respondents (n=4200)
Reason for Follow-Up: Overall
Relatively more clients followed-up before receiving a decision, compared to last wave (37% vs. 34%). Among those who did, the primary reason was to check on the status of their application/payment, followed by to provide additional information.
Compared to 2020-21, clients were more likely to have followed-up to provide additional information or for other reasons.
Figure long description
Reason for Follow-Up: Overall
Check on the status of your application
2021-22, 25%
2020-21 (n=3838), 23%
2019-20 (n=2148), 21%
2017-18 (n=3405), 28%
Provide additional information about your application
2021-22, 14%, significantly higher than previous wave
2020-21 (n=3838), 12%
2019-20 (n=2148), 17%
2017-18 (n=3405), 13%
For any other reason
2021-22, 8%, significantly higher than previous wave
2020-21 (n=3838), 6%
2019-20 (n=2148), 7%
2017-18 (n=3405), 7%
No follow-up
2021-22, 63%, significantly lower than previous wave
2020-21 (n=3838), 66%
2019-20 (n=2148), 54%
2017-18 (n=3405), 59%
Q17. Before you received a decision, did you contact Service Canada to … (select all that apply).
Base: Completed an application (n=3740)
Reason for Follow-up: by Program
EI and CPP-D clients were more likely to have followed-up compared to all clients, while CPP, OAS/GIS and SIN clients were less likely to have done so.
Compared to last wave, EI and CPP-D clients were more likely to have followed-up, while SIN clients were less likely to have done so.
Figure long description
Reason for Follow-up: by Program
Check on the status of your application/payment
TOTAL
2017-18, 28%
2019-20, 31%
2020-21, 23%
2021-22, 25%
EI
2017-18, 39%
2019-20, 41%
2020-21, 28%
2021-22, 33%, significantly higher than total, significantly higher than previous wave
CPP
2017-18, 17%
2019-20, 15%
2020-21, 17%
2021-22, 17%, significantly lower than total
CPP-D
2017-18, 34%
2019-20, 40%
2020-21, 29%
2021-22, 40%, significantly higher than total, significantly higher than previous wave
OAS/GIS
2017-18, 32%
2019-20, 29%
2020-21, 10%
2021-22, 8%, significantly lower than total
SIN
2017-18, 11%
2019-20, 25%
2020-21, 20%
2021-22, 14%, significantly lower than total
Provide additional information about your application
TOTAL
2017-18, 13%
2019-20, 17%
2020-21, 12%
2021-22, 14%, significantly higher than previous wave
EI
2017-18, 16%
2019-20, 21%
2020-21, 13%
2021-22, 19%, significantly higher than total, significantly higher than previous wave
CPP
2017-18, 10%
2019-20, 8%
2020-21, 9%
2021-22, 9%, significantly lower than total
CPP-D
2017-18, 21%
2019-20, 23%
2020-21, 17%
2021-22, 21%, significantly higher than total
OAS/GIS
2017-18, 11%
2019-20, 9%
2020-21, 13%
2021-22, 10%, significantly lower than total
SIN
2017-18, 7%
2019-20, 9%
2020-21, 9%
2021-22, 6%, significantly lower than total
For any other reason
TOTAL
2017-18, 7%
2019-20, 7%
2020-21, 6%
2021-22, 8%, significantly higher than previous wave
EI
2017-18, 9%
2019-20, 9%
2020-21, 7%
2021-22, 11%, significantly higher than total, significantly higher than previous wave
CPP
2017-18, 6%
2019-20, 5%
2020-21, 4%
2021-22, 8%, significantly higher than previous wave
CPP-D
2017-18, 11%
2019-20, 6%
2020-21, 6%
2021-22, 11%, significantly higher than total, significantly higher than previous wave
OAS/GIS
2017-18, 7%
2019-20, 2%
2020-21, 4%
2021-22, 3%, significantly lower than total
SIN
2017-18, 3%
2019-20, 11%
2020-21, 4%
2021-22, 3%, significantly lower than total
No follow-up
TOTAL
2017-18, 59%
2019-20, 54%
2020-21, 66%
2021-22, 63%
EI
2017-18, 46%
2019-20, 47%
2020-21, 62%
2021-22, 55%, significantly lower than total, significantly lower than previous wave
CPP
2017-18, 71%
2019-20, 72%
2020-21, 74%
2021-22, 72%, significantly higher than total
CPP-D
2017-18, 49%
2019-20, 47%
2020-21, 58%
2021-22, 50%, significantly lower than total, significantly lower than previous wave
OAS/GIS
2017-18, 57%
2019-20, 63%
2020-21, 69%
2021-22, 72%, significantly higher than total
SIN
2017-18, 78%
2019-20, 63%
2020-21, 71%
2021-22, 80%, significantly higher than total, significantly higher than previous wave
Q17. Before you received a decision, did you contact Service Canada to …
Base: Completed an application
Client Experience with Service Channels
Satisfaction by Service Channel: Overall (% Rated 4 or 5)
Satisfaction with in-person service remained the highest, followed by eServiceCanada, online, MSCA, specialized call centres, and 1 800 O-Canada.
Compared to 2020-21, satisfaction declined across all service channels and stands at historic lows for in-person, MSCA and 1 800 O-Canada. Satisfaction with online and specialized call centres returned to levels observed in 2019-20.
Figure long description
Satisfaction with Service Channels (% Rated 4 or 5) – Trending
In-person
2017-18, (n=1324), 89%
2018-19, (n=2181), 87%
2019-20, (n=1245), 86%
2020-21, (n=1102), 86%
2021-22, (n=1226), 81%, significantly lower than previous wave
My Service Canada Account
2019-20, (n=576), 75%
2020-21, (n=848), 75%
2021-22, (n=603), 70%, significantly lower than previous wave
1 800 O-Canada
2018-19, (n=561), 72%
2019-20, (n=221), 69%
2020-21, (n=315), 72%
2021-22, (n=147), 59%, significantly lower than previous wave
Specialized Call Centre
2017-18, (n=511), 82%
2018-19, (n=855), 76%
2019-20, (n=642), 60%
2020-21, (n=1208), 72%
2021-22, (m=789), 64%, significantly lower than previous wave
eServiceCanada
2020-21, (n=455), 82%
2021-22, (n=399), 76%, significantly lower than previous wave
ǂ Excludes SIN clients
Q27. How satisfied were you with the overall quality of service you received from …
Base: All respondents (n=4200)
Satisfaction by Service Channel: Overall
Satisfaction with in-person service remained the highest, followed by eServiceCanada, online, MSCA, 1 800 O-Canada and specialized call centres.
Compared to 2020-21, satisfaction declined across all service channels. Notably, fewer rated their satisfaction a 5 out of 5 for in-person, online, a specialized call centre, and eServiceCanada this year and a greater proportion rated their satisfaction 1 out of 5 (“very dissatisfied”) for online and 1 800 O-Canada.
Figure long description
Satisfaction with Service Cannels – Trending
In-Person
2021-22 (n=1295)
5 - Very satisfied, 58%, significantly lower than previous wave
Rated 4, 23%, significantly higher than previous wave
Rated 3, 12%, significantly higher than previous wave
Rated 2, 3%
1 - Very dissatisfied, 3%
2020-21 (n=1102)
5 - Very satisfied, 68%
Rated 4, 18%
Rated 3, 7%
Rated 2, 2%
1 - Very dissatisfied, 3%
2019-20 (n=1235)
5 - Very satisfied, 62%
Rated 4, 24%
Rated 3, 7%
Rated 2, 3%
1 - Very dissatisfied, 2%
2018-19 (n=2181)
5 - Very satisfied, 61%
Rated 4, 26%
Rated 3, 8%
Rated 2, 2%
1 - Very dissatisfied, 2%
2017-18 (n=1324)
5 - Very satisfied, 68%
Rated 4, 21%
Rated 3, 8%
Rated 2, 2%
1 - Very dissatisfied, 2%
My Service Canada Account
2021-22 (n=904),
5 - Very satisfied, 40%
Rated 4, 30%
Rated 3, 16%
Rated 2, 8%, significantly higher than previous wave
1 - Very dissatisfied, 5%
2020-21 (n=848),
5 - Very satisfied, 44%
Rated 4, 31%
Rated 3, 16%
Rated 2, 5%
1 - Very dissatisfied, 3%
2019-20 (n=576),
5 - Very satisfied, 45%
Rated 4, 30%
Rated 3, 16%
Rated 2, 5%
1 - Very dissatisfied, 3%
Online
2021-22 (n=2643),
5 - Very satisfied, 43%, significantly lower than previous wave
Rated 4, 32%
Rated 3, 17%, significantly higher than previous wave
Rated 2, 4%
1 - Very dissatisfied, 4%, significantly higher than previous wave
2020-21 (n=2680),
5 - Very satisfied, 47%
Rated 4, 31%
Rated 3, 15%
Rated 2, 4%
1 - Very dissatisfied, 2%
2019-20 (n=1227),
5 - Very satisfied, 41%
Rated 4, 32%
Rated 3, 17%
Rated 2, 5%
1 - Very dissatisfied, 3%
2018-19 (n=2317),
5 - Very satisfied, 43%
Rated 4, 36%
Rated 3, 14%
Rated 2, 4%
1 - Very dissatisfied, 2%
2017-18 (n=1089),
5 - Very satisfied, 47%
Rated 4, 32%
Rated 3, 13%
Rated 2, 4%
1 - Very dissatisfied, 3%
1 800 O-Canada
2021-22 (n=303),
5 - Very satisfied, 40%
Rated 4, 19%
Rated 3, 25%
Rated 2, 3%
1 - Very dissatisfied, 11%, significantly higher than previous wave
2020-21 (n=315),
5 - Very satisfied, 47%
Rated 4, 25%
Rated 3, 16%
Rated 2, 7%
1 - Very dissatisfied, 3%
2019-20 (n=221),
5 - Very satisfied, 48%
Rated 4, 15%
Rated 3, 20%
Rated 2, 2%
1 - Very dissatisfied, 12%
2018-19 (n=561),
5 - Very satisfied, 41%
Rated 4, 29%
Rated 3, 15%
Rated 2, 7%
1 - Very dissatisfied, 7%
Specialized Call Centreǂ
2021-22 (n=1197),
5 - Very satisfied, 36%, significantly lower than previous wave
Rated 4, 28%, significantly higher than previous wave
Rated 3, 19%, significantly higher than previous wave
Rated 2, 7%
1 - Very dissatisfied, 8%
2020-21 (n=1208),
5 - Very satisfied, 48%
Rated 4, 24%
Rated 3, 14%
Rated 2, 6%
1 - Very dissatisfied, 7%
2019-20 (n=642),
5 - Very satisfied, 36%
Rated 4, 24%
Rated 3, 17%
Rated 2, 12%
1 - Very dissatisfied, 9%
2018-19 (n=855),
5 - Very satisfied, 46%
Rated 4, 27%
Rated 3, 15%
Rated 2, 5%
1 - Very dissatisfied, 6%
2017-18 (n=511),
5 - Very satisfied, 54%
Rated 4, 28%
Rated 3, 12%
Rated 2, 4%
1 - Very dissatisfied, 3%
eServiceCanada
2021-22 (n=504),
5 - Very satisfied, 54%, significantly lower than previous wave
Rated 4, 22%
Rated 3, 11%
Rated 2, 3%
1 - Very dissatisfied, 4%
2020-21 (n=455),
5 - Very satisfied, 65%
Rated 4, 17%
Rated 3, 9%
Rated 2, 3%
1 - Very dissatisfied, 2%
ǂ Excludes SIN clients
Q27. How satisfied were you with the overall quality of service you received from …
Base: All respondents (n=4200)
Satisfaction with Service Channels: by Program
Satisfaction with service channels differed by program: CPP-D clients rated their satisfaction with in-person service, specialized call centres, online, and eServiceCanada lower compared to all clients, while SIN clients provided higher ratings for in-person, online and MSCA. OAS/GIS and CPP clients rated their satisfaction with online service lower, while CPP clients rated their satisfaction with 1 800 O-Canada higher.
Compared to 2020-21, EI clients provided lower ratings for their satisfaction with online, specialized call centres and 1 800 O-Canada, CPP and OAS/GIS clients provided lower ratings for online and SIN clients for in person and 1 800 O-Canada. CPP-D clients provided lower ratings for eServiceCanada and higher ratings for MSCA.
Figure long description
EI
In-person
2017-18, 80%
2018-19, 80%
2019-20, 82%
2020-21, 77%
2021-22, 73%, significantly lower than total
My Service Canada Account
2019-20, 75%
2020-21, 76%
2021-22, 69%
Online
2017-18, 79%
2018-19, 79%
2019-20, 71%
2020-21, 77%
2021-22, 71%, significantly lower than previous wave
1 800 O-Canada
2018-19, 70%
2019-20, 62%
2020-21, 68%
2021-22, 52%, significantly lower than previous wave
Specialized Call Centre
2017-18, 85%
2018-19, 74%
2019-20, 59%
2020-21, 70%
2021-22, 63%, significantly lower than previous wave
eServiceCanada
2020-21, 81%
2021-22, 74%
CPP
In-person
2017-18, 87%
2018-19, 90%
2019-20, 86%
2020-21, 83%
2021-22, 86%
My Service Canada Account
2019-20, 76%
2020-21, 74%
2021-22, 71%
Online
2017-18, 80%
2018-19, 76%
2019-20, 73%
2020-21, 74%
2021-22, 68%, significantly lower total, significantly lower than previous wave
1 800 O-Canada
2018-19, 77%
2019-20, 71%
2020-21, 68%
2021-22, 67%
Specialized Call Centre
2017-18, 74%
2018-19, 80%
2019-20, 67%
2020-21, 81%
2021-22, 74%, significantly higher than total
eServiceCanada
2020-21, 82%
2021-22, 76%
CPP-D
In-person
2017-18, 72%
2018-19, 68%
2019-20, 72%
2020-21, 64%
2021-22, 67%, significantly lower than total
My Service Canada Account
2019-20, 59%
2020-21, 52%
2021-22, 69%, significantly higher than previous wave
Online
2017-18, 53%
2018-19, 59%
2019-20, 53%
2020-21, 59%
2021-22, 54%, significantly lower than total
1 800 O-Canada
2018-19, 61%
2019-20, 63%
2020-21, 52%
2021-22, 66%
Specialized Call Centre
2017-18, 72%
2018-19, 64%
2019-20, 58%
2020-21, 59%
2021-22, 59%, significantly lower than total
eServiceCanada
2020-21, 66%
2021-22, 49%, significantly lower than total, significantly lower than previous wave
SIN
In-person
2017-18, 95%
2018-19, 94%
2019-20, 90%
2020-21, 91%
2021-22, 85%, significantly higher than total, significantly lower than previous wave
My Service Canada Account
2019-20, 84%
2020-21, 79%
2021-22, 90%, significantly higher than total
Online
2017-18, 82%
2018-19, 84%
2019-20, 83%
2020-21, 84%
2021-22, 87%, significantly higher than total
1 800 O-Canada
2018-19, 78%
2019-20, 88%
2020-21, 90%
2021-22, 66%, significantly lower than total
eServiceCanada
2020-21, 89%
2021-22, 82%
OAS/GIS
In-person
2017-18, 84%
2018-19, 84%
2019-20, 87%
2020-21, 84%
2021-22, 77%
My Service Canada Account
2019-20, 75%
2020-21, 66%
2021-22, 66%,
Online
2017-18, 79%
2018-19, 74%
2019-20, 73%
2020-21, 78%
2021-22, 66%, significantly lower than total, significantly lower than previous wave
1 800 O-Canada
2018-19, 73%
2019-20, 65%
2020-21, 67%
2021-22, 67%
Specialized Call Centre
2017-18, 76%
2018-19, 79%
2019-20, 64%
2020-21, 76%
2021-22, 73%
eServiceCanada
2020-21, 61%
2021-22, 65%
*small sample size. Results should be interpreted with caution.
Q17. Before you received a decision, did you contact Service Canada to …
Base: Completed an application
Ease of Navigating Government of Canada Website: Overall
Clients were most likely to find it easy to find information about the program, find out the steps to apply and find out what information they need to provide when applying.
Compared to 2020-21, ratings decreased for the ease of understanding information about the program and being able to find information in a reasonable amount of time.
Figure long description
% Rated 4 or 5
Find information about [ABBREV]
2021-22, 78%
2020-21, 78%
2019-20, 78%
2017-18, 79%
Find out the steps to apply
2021-22, 76%
2020-21, 77%
2019-20, 81%
2017-18, 80%
Find out what information you need to provide when applying for program
2021-22, 76%
2020-21, 77%
2019-20, 80%
2017-18, 78%
Understand the information about program
2021-22, 74%, significantly lower than previous wave
2020-21, 78%
2019-20, 76%
2017-18, 76%
Figure out if you are eligible for benefits/ SIN card
2021-22, 74%
2020-21, 76%
2019-20, 71%
2017-18, 76%
Decide the best age to start your pension
2021-22, 64%
2020-21, 66%
2019-20, 72%
Agree able to find the information you needed (online, in person or by phone) within a reasonable amount of time
2021-22, 74%, significantly lower than previous wave
2020-21, 78%
2019-20, 75%
2017-18, 78%
Q6. When you were looking for information about [INSERT ABBREV] on the Government of Canada website, how easy or difficult was it to …? Please use a scale of 1 to 5, where 1 was very difficult and 5 was very easy, how would you rate…?
Base: All answering (n=1833)
Q7. How much do you agree or disagree that you were able to find the information you needed (online, in person or by phone) within a reasonable amount of time? Please use a scale of 1 to 5, where 1 was disagree strongly and 5 was agree strongly.
Base= All respondents (n= 2729)
Ease of Navigating Government of Canada Website: by Program
SIN clients were more likely to provide high ratings for all aspects of their experience on the Government of Canada website compared to all clients, while CPP-D clients were less likely. EI clients were less likely to feel it was easy to find and understand information about the program and to figure out eligibility. OAS/GIS clients were less likely to understand information about the program and to feel it was easy to find out what information they need to apply.
Compared to 2020-21, EI, CPP-D and OAS/GIS clients were less likely to provide high ratings for the ease of understanding information about the program, CPP-D clients also provided lower ratings for the ease of finding information about the program and finding out what information they need to apply. CPP clients were less likely to be able to find the information they needed (online, in person or by phone) in a reasonable amount of time.
Figure long description
Ease of Navigating Government of Canada Website: by Program
Find information about [PROGRAM ABBREV]
TOTAL
2017-18, 78%
2019-20, 78%
2020-21, 78%
2021-22, 78%
EI
2017-18, 78%
2019-20, 77%
2020-21, 74%
2021-22, 74%, significantly lower than total
CPP
2017-18, 76%
2019-20, 82%
2020-21, 76%
2021-22, 76%
CPP-D
2017-18, 58%
2019-20, 57%
2020-21, 63%,
2021-22, 55%, significantly lower than total, significantly lower than previous wave
SIN
2017-18, 85%
2019-20, 81%
2020-21, 86%
2021-22, 87%, significantly higher than total
OAS/GIS
2017-18, 72%
2019-20, 76%
2020-21, 75%
2021-22, 72%
Understand the information about program
TOTAL
2017-18, 76%
2019-20, 76%
2020-21, 78%
2021-22, 74%, significantly lower than previous wave
EI
2017-18, 75%
2019-20, 72%
2020-21, 75%
2021-22, 69%, significantly lower than total, significantly lower than previous wave
CPP
2017-18, 73%
2019-20, 84%
2020-21, 76%
2021-22, 73%
CPP-D
2017-18, 52%
2019-20, 48%
2020-21, 60%
2021-22, 48%, significantly lower than total, significantly lower than previous wave
SIN
2017-18, 84%
2019-20, 86%
2020-21, 86%
2021-22, 87%m significantly higher than total
OAS/GIS
2017-18, 69%
2019-20, 82%
2020-21, 84%
2021-22, 67%, significantly lower than total, significantly lower than previous wave
Find out the steps to apply
TOTAL
2017-18, 80%
2019-20, 81%
2020-21, 77%
2021-22, 76%
EI
2017-18, 80%
2019-20, 82%
2020-21, 74%
2021-22, 74%
CPP
2017-18, 78%
2019-20, 81%
2020-21, 77%
2021-22, 73%
CPP-D
2017-18, 62%
2019-20, 58%
2020-21, 60%
2021-22, 57%, significantly lower than total
SIN
2017-18, 83%
2019-20, 81%
2020-21, 85%
2021-22, 82%, significantly higher than total
OAS/GIS
2017-18, 76%
2019-20, 76%
2020-21, 80%
2021-22, 72%
Find out what information need to provide when applying for program
TOTAL
2017-18, 78%
2019-20, 80%
2020-21, 77%
2021-22, 76%
EI
2017-18, 76%
2019-20, 80%
2020-21, 75%
2021-22, 74%
CPP
2017-18, 78%
2019-20, 81%
2020-21, 78%
2021-22, 74%
CPP-D
2017-18, 57%
2019-20, 55%
2020-21, 62%
2021-22, 54%, significantly lower than total, significantly lower than previous wave
SIN
2017-18, 84%
2019-20, 81%
2020-21, 83%
2021-22, 84%, significantly higher than total
OAS/GIS
2017-18, 75%
2019-20, 83%
2020-21, 72%
2021-22, 66%, significantly lower than total
Figure out if you are eligible for benefits/SIN card
TOTAL
2017-18, 75%
2019-20, 71%
2020-21, 76%
2021-22, 74%
EI
2017-18, 72%
2019-20, 66%
2020-21, 72%
2021-22, 69%, significantly lower than total
CPP
2017-18, 79%
2019-20, 83%
2020-21, 80%
2021-22, 81%, significantly higher than total
CPP-D
2017-18, 43%
2019-20, 39%
2020-21, 46%
2021-22, 44%, significantly lower than total
SIN
2017-18, 80%
2019-20, 81%
2020-21, 82%
2021-22, 84%, significantly higher than total
OAS/GIS
2017-18, 72%
2019-20, 84%
2020-21, 82%
2021-22, 73%
Decide the best age to start your pension
TOTAL
2019-20, 72%
2020-21, 66%
2021-22, 64%
CPP
2019-20, 72%
2020-21, 64%
2021-22, 63%
OAS/GIS
2019-20, 74%
2020-21, 71%
2021-22, 67%
Agree able to find the information you needed (online, in person or by phone) within a reasonable amount of time
TOTAL
2017-18, 78%
2019-20, 75%
2020-21, 78%
2021-22, 74%, significantly lower than previous wave
EI
2017-18, 77%
2019-20, 70%
2020-21, 73%
2021-22, 69%, significantly lower than total
CPP
2017-18, 76%
2019-20, 81%
2020-21, 79%
2021-22, 72%, significantly lower than previous wave
CPP-D
2017-18, 58%
2019-20, 53%
2020-21, 61%
2021-22, 55%, significantly lower than total
SIN
2017-18, 83%
2019-20, 80%
2020-21, 87%
2021-22, 83%, significantly higher than total
OAS/GIS
2017-18, 72%
2019-20, 80%
2020-21, 76%
2021-22, 71%
Q6. When you were looking for information about [INSERT ABBREV] on the Government of Canada website, how easy or difficult was it to …? Please use a scale of 1 to 5, where 1 was very difficult and 5 was very easy, how would you rate…?
Base: All answering (n=varies)
Q7. How much do you agree or disagree that you were able to find the information you needed (online, in person or by phone) within a reasonable amount of time? Please use a scale of 1 to 5, where 1 was disagree strongly and 5 was agree strongly.
Base= All respondents (n=4200)
Ease of Using Government of Canada Website
Figure long description
Ease Of Navigating Government Of Canada Website
Find information about program
5 – very easy, 41%
Rated 4, 36%
Rated 3, 15%
Rated 2, 5%
1 – very difficult, 2%
% Rated 4 or 5
2017-18, 79%
2019-20, 78%
2020-21, 78%
2021-22, 78%
Find out the steps to apply
5 – very easy, 45%
Rated 4, 31%
Rated 3, 16%
Rated 2, 5%
1 – very difficult, 2%
% Rated 4 or 5
2017-18, 80%
2019-20, 81%
2020-21, 77%
2021-22, 76%
Find out what information you need to provide when applying for program
5 – very easy, 46%
Rated 4, 31%
Rated 3, 15%
Rated 2, 5%
1 – very difficult, 3%
% Rated 4 or 5
2017-18, 78%
2019-20, 80%
2020-21, 77%
2021-22, 76%
Understand the information about program
5 – very easy, 40%, significantly lower than previous wave
Rated 4, 34%
Rated 3, 18%, significantly higher than previous wave
Rated 2, 4%
1 – very difficult, 3%, significantly higher than previous wave
% Rated 4 or 5
2017-18, 76%
2019-20, 76%
2020-21, 78%
2021-22, 74%, significantly lower than previous wave
Figure out if you were eligible for benefits
5 – very easy, 45%, significantly lower than previous wave
Rated 4, 29%, significantly higher than previous wave
Rated 3, 15%
Rated 2, 5%
1 – very difficult, 4%, significantly higher than previous wave
% Rated 4 or 5
2017-18, 75%
2019-20, 71%
2020-21, 76%
2021-22, 74%
Decide the best age to start your pension
5 – very easy, 42%
Rated 4, 23%
Rated 3, 19%
Rated 2, 6%
1 – very difficult, 5%
% Rated 4 or 5
2019-20, 72%
2020-21, 66%
2021-22, 64%
Q6. When you were looking for information about on the Government of Canada website, how easy or difficult was it to…? Please use a scale of 1 to 5, where 1 was very difficult and 5 was very easy, how would you rate…?
Base: All answering (n=varies)
Reported Increased Ease Provided by Digital Services
Just under eight in ten clients agreed that being able to complete steps online made the process easier, consistent with last year. EI clients were more likely to agree compared to all clients, while CPP, OAS/GIS and CPP-D clients were less likely.
Results were consistent with 2020-21.
Figure long description
Being Able to Complete Steps Online Made The Process Easier For You *% Rated 4 or 5) – Trending
Total
2017-18, n=3043, 70%
2018-19, n=3073, 74%
2019-20, n=1741, 75%
2020-21, n=3566, 80%
2021-22, n=2920, 78%
EI
2017-18, n=703, 82%
2018-19, n=1098, 84%
2019-20, n=701, 82%
2020-21, n=1162, 87%
2021-22, n=987, 85%, significantly higher than total
CPP
2017-18, n=652, 42%
2018-19, n=788, 52%
2019-20, n=389, 60%
2020-21, n=752, 62%
2021-22, n=768, 61%, significantly lower than total
CPP-D
2017-18, n=658, 29%
2018-19, n=766, 31%
2019-20, n=417, 37%
2020-21, n=692, 40%
2021-22, n=761, 40%, significantly lower than total
OAS/GIS
2017-18, n=712, 38%
2018-19, n=421, 36%
2019-20, n=234, 48%
2020-21, n=442, 56%
2021-22, n=404, 52%, significantly lower than total
Q36b. Thinking about the overall service you received, from getting information about [INSERT ABBREV] to receiving a decision, how much do you agree or disagree with the following statements, using a 5-point scale (where 1 means strongly disagree, and 5 means strongly agree)?
Online Channel
Among those who went online at the aware stage, the vast majority were able to find the information they were looking for on the Government of Canada website. Six in ten were able to completely find the information they sought, one-third somewhat.
Results were consistent with 2020-21.
Figure long description
Able to Find Information on government of Canada Website (% Yes) – Trending
Note: In waves prior to 2020-21, response options included Yes or No only.
Q4. Did you get what you wanted from the Government of Canada website when you were looking for information on [INSERT ABBREV] before you applied?
Base: All respondents (n=4200)
Ease When Applying: Overall
A majority (81%) of clients agreed they were able to complete the application in a reasonable amount of time.
Clients were most likely to find it easy to complete the application form (82%) and understand the requirement of the application (82%).
Figure long description
% RATED 4 OR 5
Agree able to complete application in a reasonable amount of time
2021-22, 81%
2020-21, n=3797, 83%
2019-20, n=2431, 84%
2017-18, n=3405, 82%
Completing the application form
2021-22, 82%
2020-21, n=3797, 84%
2019-20, n=2431, 81%
2017-18, n=3405, 83%
Understanding the requirements of the application
2021-22, 82%
2020-21, n=3797, 83%
2019-20, n=2431, 80%
2017-18, n=3405, 81%
Putting together the information you needed to apply for [ABBREV]
2021-22, 80%
2020-21, n=3797, 82%
2019-20, n=2431, 79%
2017-18, n=3405, 78%
Getting help on your application when you needed it
2021-22, 64%
2020-21, n=3797, 65%
Q12. How much do you agree or disagree that you were able to complete the application in a reasonable amount of time? (Please use a scale of 1 to 5, where 1 was disagree strongly and 5 was agree strongly.)
Base: All respondents (n=3795)
Q13. On a scale of 1 to 5 where 1 was very difficult and 5 was very easy, how would you rate the following when you were applying for [INSERT ABBREV]? How about …?
Base: All answering (n=varies)
Ease When Applying: by Program
SIN clients were more likely to provide high ratings for all aspects compared to all clients, while CPP-D clients were less likely. EI clients were less likely to find it easy to put together the information they needed to apply or to find it easy to get help when needed, CPP clients were less likely to feel it was easy to get help when needed, while OAS/GIS clients were less likely to feel it was easy to gather the information required, complete the application form and get help when needed.
Compared to 2020-21, EI clients were less likely to find it easy to gather the information required. CPP clients were less likely to find it easy to understand the requirements, while OAS/GIS clients provided lower ratings for the ease of understanding the requirements of the application and getting help when needed. SIN clients provided lower ratings for being able to complete the application in a reasonable amount of time.
Figure long description
Ease When Applying: by Program
Agree able to complete application in a reasonable amount of time
TOTAL
2017-18, 82%
2019-20, 84%
2020-21, 83%
2021-22, 81%
EI
2017-18, 82%
2019-20, 83%
2020-21, 82%
2021-22, 81%
CPP
2017-18, 82%
2019-20, 83%
2020-21, 80%
2021-22, 81%
CPP-D
2017-18, 56%
2019-20, 55%
2020-21, 59%
2021-22, 57%, significantly lower than total
SIN
2017-18, 85%
2019-20, 87%
2020-21, 88%
2021-22, 84%, significantly higher than total, significantly lower than previous wave
OAS/GIS
2017-18, 81%
2019-20, 89%
2020-21, 83%
2021-22, 79%
Completing the application form
TOTAL
2017-18, 83%
2019-20, 81%
2020-21, 84%
2021-22, 82%
EI
2017-18, 81%
2019-20, 82%
2020-21, 84%
2021-22, 81%
CPP
2017-18, 81%
2019-20, 82%
2020-21, 81%
2021-22, 80%
CPP-D
2017-18, 53%
2019-20, 50%
2020-21, 50%
2021-22, 53%, significantly lower than total
SIN
2017-18, 88%
2020-21, 89%
2021-22, 90%, significantly higher than total
OAS/GIS
2017-18, 78%
2019-20, 85%
2020-21, 76%
2021-22, 73%, significantly lower than total
Understanding the requirements of the application
TOTAL
2017-18, 81%
2019-20, 80%
2020-21, 83%
2021-22, 82%
EI
2017-18, 79%
2019-20, 78%
2020-21, 79%
2021-22, 80%
CPP
2017-18, 79%
2019-20, 80%
2020-21, 85%
2021-22, 81%, significantly lower than previous wave
CPP-D
2017-18, 52%
2019-20, 53%
2020-21, 54%
2021-22, 54%, significantly lower than total
SIN
2017-18, 89%
2019-20, 85%
2020-21, 90%
2021-22, 89%, significantly higher than total
OAS/GIS
2017-18,75%
2019-20, 83%
2020-21, 85%
2021-22, 79%, significantly lower than previous wave
Putting together the information you needed to apply for [PROGRAM ABBREV]
TOTAL
2017-18, 78%
2019-20, 79%
2020-21, 82%
2021-22, 80%
EI
2017-18, 75%
2019-20, 75%
2020-21, 81%
2021-22, 77%, significantly lower than total, significantly lower than previous wave
CPP
2017-18, 77%
2019-20, 82%
2020-21, 81%
2021-22, 78%
CPP-D
2017-18, 46%
2019-20, 43%
2020-21, 44%
2021-22, 44%, significantly lower than total
SIN
2017-18, 87%
2019-20, 86%
2020-21, 88%
2021-22, 89%, significantly higher than total
OAS/GIS
2017-18, 75%
2019-20, 79%
2020-21, 77%
2021-22, 74%, significantly lower than total
Getting help on your application when you needed it
TOTAL
2020-21, 65%
2021-22, 64%
EI
2020-21, 58%
2021-22, 58%, significantly lower than total
CPP
2020-21, 63%
2021-22, 59%, significantly lower than total
CPP-D
2020-21, 45%
2021-22, 48%, significantly lower than total
SIN
2020-21, 78%
2021-22, 78%, significantly higher than total
OAS/GIS
2020-21, 61%
2021-22, 54%, significantly lower than previous wave
Q12. How much do you agree or disagree that you were able to complete the application in a reasonable amount of time? (Please use a scale of 1 to 5, where 1 was disagree strongly and 5 was agree strongly.) Q13. On a scale of 1 to 5 where 1 was very difficult and 5 was very easy, how would you rate the following when you were applying for [INSERT ABBREV]? How about …?
Base: All respondents (n=3795)
Online Application Completion
Figure long description
Ease of Application
Completing the application form (n=3795)
5 – very easy, 53%, significantly lower than previous wave
Rated 4, 29%
Rated 3, 12%
Rated 2, 3%
1 – very difficult, 2%
% Rated 4 or 5
2017-18, 83%
2019-20, 81%
2020-21, 84%
2021-22, 82%
Understanding the requirements of the application (n=3795)
5 – very easy, 54%, significantly lower than previous wave
Rated 4, 29%, significantly higher than previous wave
Rated 3, 11%
Rated 2, 4%
1 – very difficult, 2%
% Rated 4 or 5
2017-18, 81%
2019-20, 80%
2020-21, 83%
2021-22, 82%
Putting together the information you needed to apply (n=3795)
5 – very easy, 50%
Rated 4, 30%
Rated 3, 13%
Rated 2, 4%
1 – very difficult, 3%, significantly higher than previous wave
% Rated 4 or 5
2017-18, 78%
2019-20, 79%
2020-21, 82%
2021-22, 80%
Getting help on your application when you needed it (n=3795)
5 – very easy, 42%
Rated 4, 22%
Rated 3, 14%
Rated 2, 6%
1 – very difficult, 6%
% Rated 4 or 5
2020-21, 65%
2021-22, 64%
You were able to complete the application in a reasonable amount of time (n=3795)
5 – Strongly agree, 56%, significantly lower than previous wave
Rated 4, 26%
Rated 3, 11%
Rated 2, 4%, significantly higher than previous wave
1 – Strongly disagree, 3%
% Rated 4 or 5
2017-18, 82%
2019-20, 84%
2020-21, 83%
2021-22, 81%
Q13. On a scale of 1 to 5 where 1 was very difficult and 5 was very easy, how would you rate the following when you were applying for [INSERT ABBREV]?
Base: Completed an application (n=varies) Note: Completing form excludes SIN clients.
Q12. How much do you agree or disagree that you were able to complete the application in a reasonable amount of time? (Please use a scale of 1 to 5, where 1 was disagree strongly and 5 was agree strongly.)
Base: All respondents
Use of Online Chatbot on Canada.ca
One in ten (10%) clients used the online chat on the Canada.ca website. CPP-D and OAS/GIS clients were less likely to have used the chat compared to all clients.
Of those who used the chat, six in ten agreed it was helpful. SIN clients were more likely to feel the online chat was helpful.
Figure long description
Use of Online Chatbot on Canada.ca
% Used Online Chatbot
Total, 10%
EI, 9%
CPP, 8%
CPP-D, 5%, significantly lower than the total
SIN, 11%
OAS/GIS, 6%, significantly lower than the total
Helpfulness of Online Chatbot
2021-22 (n=327)
5 – strongly agree, 40%
Rated 4, 21%
Rated 3,13%
Rated 2, 7%
1 – Strongly disagree, 16%
Don’t know, 3%
% Rating 4 or 5
Total, 61%
EI, 56%
CPP, 58%
CPP-D, 58%
SIN, 70%, significantly higher than total
OAS/GIS, 50%
Q14d. Did you use the online chat on the Canada.ca website (also called virtual assistant) at any point during the process of getting information about [INSERT PROGRAM] and completing and submitting the application form?
Base: All respondents (n=3795)
Q14e. How much do you agree or disagree that the online chat on the Canada.ca website was helpful?
Base: Those who used the online chat (n=327)
Ease of Application Process: Self-Service Clients
The majority of self-serve clients found it easy to understand the requirements of the application, put together the information needed, and to complete the application in a reasonable amount of time. At just over half, fewer found it was easy for them to get help on their application when they needed it.
Year over year, CPP-Retirement (CPP-RTR) clients were more likely to feel they were able to complete the application in a reasonable amount of time.
Figure long description
Satisfaction with Service Channels - Trending
Understanding the requirements of the application
Overall
5 - Very easy, 56%
Rated 4, 31%
Rated 3, 9%
Rated 2, 3%
1 - Very difficult, 1%
EI
5 - Very easy, 53%
Rated 4, 33%
Rated 3, 10%
Rated 2, 4%
1 - Very difficult, 1%
CPP-RTR
5 - Very easy, 64%
Rated 4, 24%
Rated 3, 11%
Rated 2, 1%
1 - Very difficult, 1%
Putting together the information needed to apply
Overall
5 - Very easy, 54%
Rated 4, 28%
Rated 3, 12%
Rated 2, 4%
1 - Very difficult, 1%
Don’t Know, 1%
EI
5 - Very easy, 52%
Rated 4, 29%
Rated 3, 13%
Rated 2, 4%
1 - Very difficult, 1%
CPP-RTR
5 - Very easy, 59%
Rated 4, 27%
Rated 3, 11%
Rated 2, 2%
1 - Very difficult, 1%
Getting help on your application when you needed it
Overall
5 - Very easy, 35%
Rated 4, 21%
Rated 3, 13%
Rated 2, 6%
1 - Very difficult, 7%
Don’t Know, 19%
EI
5 - Very easy, 33%
Rated 4, 21%
Rated 3, 13%
Rated 2, 6%
1 - Very difficult, 6%
Don’t Know, 19%
CPP-RTR
5 - Very easy, 33%
Rated 4, 16%
Rated 3, 14%
Rated 2, 3%
1 - Very difficult, 3%
Don’t Know, 31%
Able to complete the application in a reasonable amount of time
Overall
5 - Strongly agree, 59%
Rated 4, 27%
Rated 3, 10%
Rated 2, 3%
1 - Strongly disagree, 1%
EI
5 - Strongly agree, 58%
Rated 4, 27%
Rated 3, 11%
Rated 2, 4%
1 - Strongly disagree, 2%
CPP-RTR
5 - Strongly agree, 56%
Rated 4, 31%
Rated 3, 10%
Rated 2, 2%
1 - Strongly disagree, 1%
% Rating 4 or 5
Understanding the requirements of the application
Overall
2017-18, 88%
2019-20, 84%
2020-21, 85%
2021-22, 86%
EI
2017-18, 89%
2019-20, 83%
2020-21, 83%
2021-22, 85%
CPP-RTR
2017-18, 83%
2019-20, 87%
2020-21, 90%
2021-22, 88%
Putting together the information needed to apply
Overall
2017-18, 82%
2019-20, 84%
2020-21, 85%
2021-22, 82%
EI
2017-18, 83%
2019-20, 83%
2020-21, 84%
2021-22, 81%
CPP-RTR
2017-18, 84%
2019-20, 88%
2020-21, 84%
2021-22, 86%
Getting help on your application when you needed it
Overall
2020-21, 57%
2021-22, 56%
EI
2020-21, 55%
2021-22, 54%
CPP-RTR
2020-21, 56%
2021-22, 49%
Able to complete the application in a reasonable amount of time
Overall
2017-18, 86%
2019-20, 90%
2020-21, 87%
2021-22, 86%
EI
2017-18, 87%
2019-20, 90%
2020-21, 87%
2021-22, 85%
CPP-RTR
2017-18, 87%
2019-20, 85%
2020-21, 77%
2021-22, 87%, significantly higher than previous wave
Q12. How much do you agree or disagree that you were able to complete the application in a reasonable amount of time? (Please use a scale of 1 to 5, where 1 was disagree strongly and 5 was agree strongly.)
Q13. On a scale of 1 to 5 where 1 was very difficult and 5 was very easy, how would you rate the following when you were applying for [INSERT ABBREV]? How about …?
Base: Self-service clients- Overall (n=932), EI (n=394), CPP-RTR (n=214)
Qualitative Insights on My Service Canada Account (MSCA)
Most participants who signed up for MSCA were satisfied with the experience, describing it as easy, following step by step instructions provided during the process. Having to receive a PAC via mail was viewed as simple, though a few didn’t like having to wait. Some did not recall the registration process itself but assumed it must have been straightforward because they don’t remember having experienced any issues.
Several participants had registered their MSCA account years ago when they were submitting an application for another benefit. Among them, a few encountered challenges when attempting to sign in after some time. Their issues included not recalling the password and/or security question answers required to sign in; having to keep track of many different passwords and security questions across websites and services can be cumbersome to manage; or trying to sign in after several years but finding themselves locked out and deeming it too much hassle to register again.
It was fairly simple. I understand they have to do the access code thing, but I wish it was a little bit quicker, easier way than having to wait for it to come in the mail.
When I registered, I got it in the mail… it was a little daunting. Just the idea of having to wait for an access code after getting through. Also, originally, I tried one of their methods which used a bank account, and that didn’t work.
Use of My Service Canada Account (MSCA): Overall
Overall, nearly seven in ten clients (68%) used MSCA. Just under half (46%) used their MSCA which they had registered for in the past, two in ten (22%) registered and used their MSCA for the first time, and 6% tried unsuccessfully to register for their MSCA.
Compared to 2020-21, more clients reported using their MSCA which they had registered for in the past or that they tried unsuccessfully to register for their MSCA, fewer registered and used their MSCA for the first time.
Figure long description
Use of MSCA
Used MSCA (NET)
2021-22, 68%
2020-21, n=3103, 69%
2019-20, n=2069, 66%
Used your MSCA which you had registered for in the past
2021-22, 46%, significantly higher than previous wave
2020-21, n=3103, 38%
2019-20, n=2069, 34%
Register and use your MSCA for the first time
2021-22, 22%, significantly lower than previous wave
2020-21, n=3103, 31%
2019-20, n=2069, 32%
Try unsuccessfully to register for your MSCA
2021-22, 6%, significantly higher than previous wave
2020-21, n=3103, 4%
2019-20, n=2069, 5%
None of the above
2021-22, 24%
2020-21, n=3103, 24%
2019-20, n=2069, 28%
Don’t know
2021-22, 2%
2020-21, n=3103, 3%
2019-20, n=2069, 2%
Q34aa. At any point in your recent experience with [INSERT ABBREV] did you …?
Base: All respondents excluding SIN (n=2972)
Use of My Service Canada Account (MSCA): by Program
Three-quarters of EI clients, seven in ten CPP clients and four in ten CPP-D and OAS/GIS clients used MSCA during their experience. Compared to 2020-21, fewer CPP or CPP-D clients used MSCA. EI clients were more likely to have used their MSCA which they had registered for in the past, while a greater proportion of EI and CPP-D clients tried unsuccessfully to register.
EI clients were more likely to have used their MSCA which they had registered for in the past, CPP were more likely to have used their MSCA for the first time, while CPP-D clients were more likely to have tried unsuccessfully to register.
Figure long description
% Rating 4 or 5
Used MSCA (NET)
TOTAL
2019-20, 66%
2020-21, 69%
2021-22, 68%
EI
2019-20, 77%
2020-21, 75%
2021-22, 74%, significantly higher than total
CPP
2019-20, 50%
2020-21, 77%
2021-22, 71%, significantly lower than previous wave
CPP-D
2019-20, 39%
2020-21, 48%
2021-22, 41%, significantly lower than total, significantly lower than previous wave
OAS/GIS
2019-20, 32%
2020-21, 43%
2021-22, 43%, significantly lower than total
Use your MSCA which you had registered for in the past
TOTAL
2019-20, 34%
2020-21, 38%
2021-22, 46%, significantly higher than previous wave
EI
2019-20, 39%
2020-21, 40%
2021-22, 50%, significantly higher than total, significantly higher than previous wave
CPP
2019-20, 22%
2020-21, 43%
2021-22, 44%
CPP-D
2019-20, 25%
2020-21, 32%
2021-22, 33%, significantly lower than total
OAS/GIS
2019-20, 21%
2020-21, 29%
2021-22, 30%, Significantly lower than total
Register and use your MSCA for the first time
TOTAL
2019-20, 32%
2020-21, 31%
2021-22, 22%, significantly lower than previous wave
EI
2019-20, 38%
2020-21, 35%
2021-22, 24%, significantly lower than previous wave
CPP
2019-20, 28%
2020-21, 34%
2021-22, 27%, significantly higher than total, significantly lower than previous wave
CPP-D
2019-20, 14%
2020-21, 16%
2021-22, 8%, significantly lower than total, significantly lower than previous wave
OAS/GIS
2019-20, 11%
2020-21, 14%
2021-22, 13%, significantly lower than total
Try unsuccessfully to register for your MSCA
TOTAL
2019-20, 5%
2020-21, 4%
2021-22, 6%, significantly higher than previous wave
EI
2019-20, 3%
2020-21, 4%
2021-22, 6%, significantly higher than previous wave
CPP
2019-20, 8%
2020-21, 5%
2021-22, 3%, significantly lower than total
CPP-D
2019-20, 5%
2020-21, 4%
2021-22, 9%, significantly higher than total, significantly higher than previous wave
OAS/GIS
2019-20, 7%
2020-21, 5%
2021-22, 7%
None of the above
TOTAL
2019-20, 28%
2020-21, 24%
2021-22, 24%
EI
2019-20, 18%
2020-21, 19%
2021-22, 19%, significantly lower than total
CPP
2019-20, 38%
2020-21, 14%
2021-22, 22%, significantly higher than previous wave
CPP-D
2019-20, 53%
2020-21, 44%
2021-22, 46%, significantly higher than total
OAS/GIS
2019-20, 59%
2020-21, 47%
2021-22, 46%, significantly higher than total
Don’t Know
TOTAL
2019-20, 2%
2020-21, 3%
2021-22, 2%
EI
2019-20, 1%
2020-21, 3%
2021-22, 2%
CPP
2019-20, 3%
2020-21, 5%
2021-22, 3%
CPP-D
2019-20, 2%
2020-21, 4%
2021-22, 4%, significantly higher than total
OAS/GIS
2019-20, 2%
2020-21, 4%
2021-22, 4%, significantly higher than total
Q34aa. At any point in your recent experience with [INSERT ABBREV] did you …?
Base: All respondents excluding SIN (n=2972)
Ease of My Service Canada Account (MSCA) Registration: by Program
Half of clients found it easy to register for their MSCA, lower than in 2020-21. CPP-D clients felt it was more difficult to register compared to all clients.
Compared to 2020-21, EI clients were less likely to feel it was easy to register.
Figure long description
Ease of MSCA Registration – Trending
2021-22, n=716
5 – very easy, 31%, significantly lower than previous wave
Rated 4, 20%
Rated 3, 22%
Rated 2, 8%
1 – Very difficult, 17%, significantly higher than previous wave
2020-21, n=882
5 – very easy, 39%
Rated 4, 24%
Rated 3, 17%
Rated 2, 9%
1 – Very difficult, 10%
2019-20, n=604
5 – very easy, 41%
Rated 4, 28%
Rated 3, 17%
Rated 2, 6%
1 – Very difficult, 9%
% Rating 4 or 5
2021-22, n=716
Total, 51%, significantly lower than previous wave
EI, 51%, significantly lower than previous wave
CPP, 59%
CPP-D, 35%, significantly lower than total
OAS/GIS, 49%
2020-21, n=882
Total, 63%
EI, 65%
CPP, 57%
CPP-D, 43%
OAS/GIS, 51%
2019-20, n=604
Total, 69%
EI, 73%
CPP, 60%
CPP-D, 48%
OAS/GIS, 44%
Q34ab. Using a 5-point scale where 1 was very difficult and 5 was very easy, how easy or difficult was it to register for your My Service Canada Account?
Base: Registered or attempted to register for MSCA (n=716)
Reasons for Low Satisfaction with MSCA Registration
Among those who rated registering their MSCA as a 1 or 2 out of 5, the most common reasons were that they experienced problems with their personal access code, problems verifying their identity using their online banking information or problems creating their profile.
Results were consistent by program.
Figure long description
Reasons for Rating of 1 or 2: 25% of those who Registered or attempted to register for MSCA
Problems with your Personal Access Code (PAC), 22%
EI, 22%
CPP, 34%
CPP-D, 29%
OAS/GIS, 14%
Problems verifying your identity using your online banking information, 19%
EI, 21%
CPP, 6%
CPP-D, 24%
OAS/GIS, 13%
Problems creating your profile (such as entering your SIN, personal information, or creating security questions), 17%
EI, 17%
CPP, 7%
CPP-D, 15%
OAS/GIS, 19%
Problems with your security code (for multi-factor authentication), 7%
EI, 6%
CPP, 15%
CPP-D, 6%
OAS/GIS, 11%
My Service Canada Account was unavailable, 5%
EI, 4%
CPP, 11%
CPP-D, 4%
OAS/GIS, 9%
Other reason, 21%
EI, 21%
CPP, 15%
CPP-D, 9%
OAS/GIS, 30%
None of the above, 5%
EI, 5%
CPP, 11%
CPP-D, 6%
*small sample size. Results should be interpreted with caution.
Q34ac. You provided a rating of [Q34ab RATING] out of 5 for registering for your My Service Canada Account. What would you say most contributed to your difficulty registering?
Base: Rating ease of MSCA registration a 1 or 2 (n=213)
Registered for MSCA in a Reasonable Amount of Time
Six in ten clients who registered or attempted to register for their MSCA agreed that they could do so in a reasonable amount of time.
CPP-D clients were less likely to feel they could register for their MSCA in a reasonable amount of time.
Figure long description
Registered in Reasonable Amount of Time
5 – Strongly agree, 35%
Rated 4, 25%
Rated 3, 20%
Rated 2, 5%
1 – Strongly1 disagree, 14%
% Rating 4 or 5
Total, 60%
EI, 60%
CPP, 64%
CPP-D, 37%, significantly lower than total
OAS/GIS, 60%
Q34ad. How much do you agree or disagree that you were able to register for My Service Canada Account within a reasonable amount of time? (Please use a scale of 1 to 5, where 1 is disagree strongly and 5 is agree strongly.)
Base: Registered/tried to register for MSCA (n=716)
Ease of Signing into Existing MSCA
Three-quarters of those with an existing MSCA rated signing into their account as easy, with a majority (53%) saying it was very easy.
CPP and CPP-D clients felt it was more difficult to sign in compared to all clients.
Figure long description
Ease of Signing into Account
5 – Very easy, 53%
Rated 4, 22%
Rated 3, 14%
Rated 2, 5%
1 – Very difficult, 6%
% Rating 4 or 5
Total, 75%
EI, 77%
CPP, 68%, significantly lower than total
CPP-D, 67%, significantly lower than total
OAS/GIS, 72%
Q35a. Using a 5-point scale where 1 is very difficult and 5 is very easy, how easy or difficult was it to sign into your My Service Canada Account?
Base: Had existing MSCA (n=1129)
Reason for Difficulty Signing into MSCA: Overall
Among those who rated the ease of signing into their MSCA as a 1 or 2 out of 5, the most common reasons were that they forgot their username or password, followed by MSCA was unavailable, they forgot the answers to their security questions or that their account was locked. One quarter cited other reasons.
Results were consistent by program.
Figure long description
Reasons for Rating of 1 or 2
Forgot your username or password, 19%
EI, 17%
CPP, 12%
CPP-D, 26%
My Service Canada Account was unavailable, 16%
EI, 17%
CPP, 12%
CPP-D, 11%
Forgot the answers to your security questions, 14%
EI, 16%
CPP, 10%
CPP-D, 11%
Your account was locked, 13%
EI, 13%
CPP, 13%
CPP-D, 9%
Had problems with your security code (for multi-factor authentication), 7%
EI, 5%
CPP, 25%
CPP-D, 3%
Other reason, 23%
EI, 22%
CPP, 16%
CPP-D, 40%
None of the above, 5%
EI, 5%
CPP, 11%
*small sample size. Results should be interpreted with caution. **sample sizes too small for reporting.
Q35b. You provided a rating of [Q35A RATING] out of 5 for signing into your My Service Canada Account. What would you say most contributed to your difficulty signing into your account?
Base: Rating ease of signing into account 1 or 2 (n=130)
Satisfaction with My Service Canada Account (MSCA)
Seven in ten clients who used their MSCA said they were satisfied with the overall quality of service they received. Results are consistent by program.
When looking at results by at-risk group, racialized clients and newcomers were more likely to be highly satisfied, while clients who have restrictions, those who are e-vulnerable, OLMC, those with a language barrier, non-English or French speakers and those with no devices were less likely.
Figure long description
Overall Satisfaction with MSCA (% Rated 4 or 5)
Total, 70%
EI, 69%
CPP, 71%
CPP-D, 69%
OAS/GIS, 66%
At-risk Client Groups
Higher Satisfaction, (% Rated 4 Or 5)
Racialized Clients, 81%
Newcomer, 91%
Lower Satisfaction, (% Rated 4 Or 5)
Restrictions To Service, 62%
E-vulnerable, 58%
OLMC, 49%
Language Barrier, 49%
Non-English Or French Speaking, 47%
No Devices, 41%
Q27. How satisfied were you with the overall quality of service you received from your My Service Canada Account? Please use a 5-point scale, where ‘1’ means very dissatisfied and ‘5’ means very satisfied.
Base: (n=904)
Use of 1 800 O-Canada at Aware Stage and Channel Satisfaction: Overall and by At-Risk Group
Overall, fewer than one in ten of all clients used 1 800 O-Canada at the aware stage to learn about the program they applied for, consistent with last year. Usage at the aware stage was higher among those with high school education or less, those with disabilities, e-vulnerable clients, those with only a mobile device and clients with restrictions.
Six in ten were satisfied with the quality of service provided through 1 800 O-Canada, lower than last year. Satisfaction was higher among clients living in remote areas and lower among clients with restrictions compared to all clients who used 1 800 O-Canada.
Figure long description
1 800 O-Canada Channel Use and Satisfaction
Satisfied with channel (% rated 4 or 5)
2019-20, 69%
2020-21, 72%
2021-22, 59%, significantly lower than previous wave
Used service at awareness stage
2019-20, 8%
2020-21, 6%
2021-22, 5%
At-risk Client Groups
Satisfied (% Rated 4 or 5)
Youth (18 to 30)
2019-20, 79%
2020-21, 79%
2021-22, 47%, significantly lower than previous wave, small sample size
Seniors (60+)
2019-20, 67%
2020-21, 65%
2021-22, 68%
OLMC
2019-20, 78%
Non E or F Speaking
2019-20, 82%
High school or less
2019-20, 73%
2020-21, 80%
2021-22, 60%, significantly lower than previous wave
Indigenous
2019-20, 52%
2020-21, 83%, small sample size
2021-22, 56%, significantly lower than previous wave
Clients with disabilities
2019-20, 70%
2020-21, 48%
2021-22, 51%
Remote
2019-20, 74%
2020-21, 80%, small sample size
2021-22, 79%, significantly higher than total, small sample size
Urban
2019-20, 71%
2020-21, 71%
2021-22, 57%, significantly lower than previous wave
Rural
2019-20, 65%
2020-21, 74%
2021-22, 57%, significantly lower than previous wave
E-vulnerable
2019-20, 69%
2020-21, 75%
2021-22, 61%, significantly lower than previous wave
Newcomers (3 yrs. or fewer)
2019-20, 83%
Language barrier
2019-20, 8%
2020-21, 31%
Mobile only
2019-20, 54%
2020-21, 66%, small sample size
2021-22, 67%
No devices
2019-20, 77%
2020-21, 85%
2021-22, 71%, small sample size
Clients with restrictions
2019-20, 55%
2020-21, 72%
2021-22, 47%, significantly lower than total, significantly lower than previous wave
Racialized
2020-21, 82%
2021-22, 63%, significantly lower than previous wave, small sample size
% Used At Awareness Stage
Youth (18 to 30)
2019-20, 5%
2020-21, 4%
2021-22, 5%
Seniors (60+)
2019-20, 9%
2020-21, 7%
2021-22, 6%
OLMC
2019-20, 3%
2020-21, 6%
2021-22, 5%
Non E or F Speaking
2019-20, 3%
2020-21, 2%, small sample size
2021-22, 5%, small sample size
High school or less
2019-20, 7%
2020-21, 7%
2021-22, 8%, significantly higher than total
Indigenous
2019-20, 8%
2020-21, 6%
2021-22, 7%
Clients with disabilities
2019-20, 11%
2020-21, 7%
2021-22, 10%, significantly higher than total, significantly higher than previous wave
Remote
2019-20, 6%
2020-21, 7%
2021-22, 7%
Urban
2019-20, 7%
2020-21, 6%
2021-22, 5%
Rural
2019-20, 9%
2020-21, 5%
2021-22, 5%
E-vulnerable
2019-20, 11%
2020-21, 9%
2021-22, 8%, significantly higher than total
Newcomers (3 yrs. Or fewer)
2019-20, 3%
2020-21, 3%
2021-22, 2%, significantly lower than total
Language barrier
2019-20, 19%
2020-21, 12%
2021-22, 5%, significantly lower than previous wave
Mobile only
2019-20, 5%
2020-21, 13%
2021-22, 8%, significantly higher than total, significantly lower than previous wave
No devices
2019-20, 19%
2020-21, 11%
2021-22, 10%
Clients with restrictions
2019-20, 8%
2020-21, 7%
2021-22, 7%, significantly higher than total
Racialized
2020-21, 6%
2021-22, 5%
*small sample size. Results should be interpreted with caution. **sample sizes too small for reporting.
Q1a. Which of the following did you use to find out about [INSERT PROGRAM] or [INSERT ABBREV] before you applied? Did you ...?
Q27. How satisfied were you with the overall quality of service you received from …?
Base: All respondents (n=varies)
eServiceCanada
At three-quarters, the majority of clients who used eServiceCanada were satisfied with the overall quality of service received, however ratings declined compared to last year.
Among those who used eServiceCanada, more than eight in ten found the process to be easy, while three-quarters found it effective and easy to find information about the program they were applying for on the Government of Canada website. Just over half felt it was easy to follow up. Compared to 2020-21, ratings for the ease of follow-up have declined while a greater proportion of eServiceCanada users found it easy to find information on the program.
Figure long description
Satisfaction with Overall Quality of Service
1 – Very Dissatisfied, 4%
Rated 2, 3%
Rated 3, 11%
Rated 4, 22%
5 – Very Satisfied, 54%, significantly lower than previous wave
% Rated 4 or 5
2020-21, 82%
2021-22, 76%, significantly lower than previous wave
Measures Of Ease And Effectiveness
Ease, Overall it was easy for you to apply for [Program Abbrev]
2021-22, 82%
2020-21, 80%
Effective, You were able to move smoothly through all of the steps related to you [Program Abbrev] application
2021-22, 75%
2020-21, 78%
Ease of Follow-up, Ease of follow-up with Service Canada about application
2021-22, 54%, significantly lower than previous wave
2020-21, 62%
Ease of Finding Information, Ease of finding information about the program on the Government of Canada website
2021-22, 77%, significantly higher than previous wave
2020-21, 69%
Q27. How satisfied were you with the overall quality of service you received from …?
Q36b. Thinking about the overall service you received, from getting information about [INSERT ABBREV] to receiving a decision, how much do you agree or disagree with the following statements, using a 5-point scale where 1 means strongly disagree, and 5 means strongly agree?
Q20a. Using a 5-point scale where 1 is very difficult and 5 is very easy, how easy or difficult was it to follow up with Service Canada about your application?
Q6. When you were looking for information about [INSERT ABBREV] on the Government of Canada website, how easy or difficult was it to …? Please use a scale of 1 to 5, where 1 is very difficult and 5 is very easy, how would you rate …?
Qualitative Insights on eServiceCanada
Those who had used the online appointment booking tool eServiceCanada found the service helpful. They received a call back in two days or less and were able to receive immediate support or book appointments for in-person service if their needs were not resolved over the phone.
Many of the participants were not aware of eServiceCanada and, after learning about the booking tool, their likelihood to use it was mixed. Some felt that eServiceCanada would be preferable to having to wait on the phone to reach a program call centre representative, while others were concerned that they would miss the call because it was unscheduled, or do not see the advantage of using a booking tool option when they could reach a representative sooner using the call centre or the office.
I would like to add one more thing. Most of the time, they called during the day between 9:00 and 10:00 in the morning. Sometimes, you might be at work, and you won’t be able to answer the call, and there is no way you could call them back, too. That’s one of the things that I felt that you have to keep your phone on yourself if you have booked for a callback. We didn’t get a timeframe either, so it’s really hard if your office doesn't allow you to use your phone with you, then it’s a problem.
I was very fragile. And when she phoned I totally broke down and cried. And she was so patient and it was just amazing. Everything was taken care of very quickly. … during that time it was extremely important and that woman was worth her weight in gold.
At eight in ten, the vast majority of clients who used the in-person channel were satisfied with the quality of service received, however ratings have declined compared to last year. Nearly nine in ten felt that Service Canada representatives were helpful, lower than last year, and eight in ten found it easy to get help when they needed it.
Roughly three in ten clients who utilized in person services at the aware or apply stage booked an appointment prior to their visit. Clients who booked an appointment at either the aware or apply stage have consistent levels of satisfaction with their experience compared to those who did not, however compared to 2020-21 ratings have decreased for those who booked an appointment at the apply stage.
5 – Very Satisfied, 58%, significantly lower than previous wave
Rated 4, 23%, significantly higher than previous wave
Rated 3, 12%, significantly higher than previous wave
Rated 2, 3%
1 –Very Dissatisfied, 3%
2020-21, n=1102
5 – Very Satisfied, 68%
Rated 4, 18%
Rated 3, 7%
Rated 2, 2%
1 – Very Dissatisfied, 3%
% Rated 4 or 5
2021-22, 81%, significantly lower than previous wave
2020-21. 86%
Helpfulness (% Rated 4 or 5)
Service Canada reps that you dealt with in-person were helpful
2020-21, 91%
2021-22, 88%, significantly lower than previous wave
It was easy to get the help when you needed it
2020-21, 82%
2021-22, 80%
Booked Appointment Prior to Visit (% Yes)
Aware Stage
2020-21, 27%
2021-22, 31%
Aware Stage (% rating overall quality 4 or 5)
2020-21, 87%
2021-22, 87%
Apply Stage
2020-21, 27%
2021-22, 28%
Apply Stage (% rating overall quality 4 or 5)
2020-21, 90%
2021-22, 84%, significantly lower than previous wave
Note: In-Person satisfaction results do not include the person-to-person touchless service – eServiceCanada.
Q27. How satisfied were you with the overall quality of service you received from…? Base: n=1295
Q36b. Thinking about the overall service you received, from getting information about [INSERT ABBREV] to receiving a decision, how much do you agree or disagree with the following statements, using a 5-point scale (where 1 means strongly disagree, and 5 means strongly agree.) Base: All answering (n=varies)
Q1c. You indicated that you went to a government office before you applied. Did you book an appointment prior to your visit? Base: n=1295
Q9d. You indicated that you went to a government office when completing and submitting your application. Did you book an appointment prior to your visit? Base: Those who went to a government office before applying (n=757)
Profile of In-Person Clientele- Proportion of At-Risk Client Groups
The proportion of vulnerable groups among in-person clientele varied; with certain groups having relied more on in-person service.
Clients with restrictions to accessing service were more prevalent among those who used in-person at any stage of the client journey. The proportion of racialized clients, newcomers, youth and mobile-only was higher among those who used in-person at the aware or apply stages.
E-vulnerable and Indigenous clients were more prevalent among those who used in-person at the aware and follow-up stages, while the proportion of several other at-risk groups were higher among those who followed-up in-person.
Figure long description
Proportion of At-risk Client Groups
Youth (18 to 30), n=710, 31%
Aware
2020-21, (n=646), 41%
2021-22, (n=757), 40%, significantly higher than total
Apply
2020-21, (n=765), 47%
2021-22, (n=953), 43%, significantly higher than total
Follow-up
2020-21, (n=168), 38%
2021-22, (n=241), 19%, significantly lower than total, significantly lower than previous wave
Seniors (60+), 27%, n=1981
Aware
2020-21, (n=646), 20%
2021-22, (n=757), 19%, significantly lower than total
Apply
2020-21, (n=765), 18%
2021-22, (n=953), 15%, significantly lower than total
Follow-up
2020-21, (n=168), 21%
2021-22, (n=241), 26%
OLMC, 4%, n=156
Aware
2020-21, (n=646), 6%
2021-22, (n=757), 4%
Apply
2020-21, (n=765), 7%
2021-22, (n=953), 4%, significantly lower than previous wave
Follow-up
2020-21, (n=168), 7%
2021-22, (n=241), 2%, significantly lower than previous wave
Non E or F speaking, 2%, n=94
Aware
2020-21, (n=646), 4%
2021-22, (n=757), 2%, significantly lower than previous wave
Apply
2020-21, (n=765), 4%
2021-22, (n=953), 4%. Significantly higher than total
Follow-up
2020-21, (n=168), 6%
2021-22, (n=241), 2%, significantly lower than previous wave
High school or less, 31%, n=1476
Aware
2020-21, (n=646), 31%
2021-22, (n=757), 31%
Apply
2020-21, (n=765), 26%
2021-22, (n=953), 26%, significantly lower than total
Follow-up
2020-21, (n=168), 37%
2021-22, (n=241), 40%, significantly higher than total
Indigenous, 6%, 460
Aware
2020-21, (n=646), 10%
2021-22, (n=757), 9%, significantly higher than total
Apply
2020-21, (n=765), 10%
2021-22, (n=953), 7%, significantly lower than previous wave
Follow-up
2020-21, (n=168), 15%
2021-22, (n=241), 9%, significantly higher than total
Clients with disabilities, 8%, n=935
Aware
2020-21, (n=646), 7%
2021-22, (n=757), 9%
Apply
2020-21, (n=765), 6%
2021-22, (n=953), 7%
Follow-up
2020-21, (n=168), 14%
2021-22, (n=241), 12%, significantly higher than total
Remote, 2%, n=400
Aware
2020-21, (n=646), 3%
2021-22, (n=757), 3%
Apply
2020-21, (n=765), 2%
2021-22, (n=953), 2%
Follow-up
2020-21, (n=168), 4%
2021-22, (n=241), 5%, significantly higher than total
Urban, 58%, n=1951
Aware
2020-21, (n=646), 65%
2021-22, (n=757), 59%, significantly lower than previous wave
Apply
2020-21, (n=765), 69%
2021-22, (n=953), 65%, significantly higher than total
Follow-up
2020-21, (n=168), 50%
2021-22, (n=241), 47%, significantly lower than total
Rural, 38%, n=1816
Aware
2020-21, (n=646), 32%
2021-22, (n=757), 35%
Apply
2020-21, (n=765), 28%
2021-22, (n=953), 31%, significantly lower than total
Follow-up
2020-21, (n=168), 47%
2021-22, (n=241), 48%, significantly higher than total
E-vulnerable, 15%, n=851
Aware
2020-21, (n=646), 18%
2021-22, (n=757), 21%, significantly higher than total
Apply
2020-21, (n=765), 17%
2021-22, (n=953), 17%
Follow-up
2020-21, (n=168), 22%
2021-22, (n=241), 21%, significantly higher than total
Newcomers (3 years or fewer), 18%, n=531
Aware
2020-21, (n=646), 26%
2021-22, (n=757), 33%, significantly higher than total, significantly higher than previous wave
Apply
2020-21, (n=765), 33%
2021-22, (n=953), 43%, significantly higher than total, significantly higher than previous wave
Follow-up
2020-21, (n=168), 21%
2021-22, (n=241), 9%, significantly lower than total, significantly lower than previous wave
Language barrier, 6%, n=277
Aware
2020-21, (n=646), 4%
2021-22, (n=757), 7%
Apply
2020-21, (n=765), 3%
2021-22, (n=953), 6%
Follow-up
2020-21, (n=168), 5%
2021-22, (n=241), 14%, significantly higher than total, significantly higher than previous wave
Mobile only, 10%, n=442
Aware
2020-21, (n=646), 12%
2021-22, (n=757), 17%, significantly higher than total, significantly higher than previous wave
Apply
2020-21, (n=765), 13%
2021-22, (n=953), 17%, significantly higher than total, significantly higher than previous wave
Follow-up
2020-21, (n=168), 14%
2021-22, (n=241), 12%
No devices, 3%, n=217
Aware
2020-21, (n=646), 3%
2021-22, (n=757), 4%
Apply
2020-21, (n=765), 3%
2021-22, (n=953), 4%
Follow-up
2020-21, (n=168), 3%
2021-22, (n=241), 7%, significantly higher than total
Clients with restrictions, 45%, n=2065
Aware
2020-21, (n=646), 60%
2021-22, (n=757), 54%, significantly higher than total, significantly lower than previous wave
Apply
2020-21, (n=765), 55%
2021-22, (n=953), 52%, significantly higher than total
Follow-up
2020-21, (n=168), 70%
2021-22, (n=241), 61%, significantly higher than total, significantly lower than previous wave
Racialized, 37%, n=1121
Aware
2020-21, (n=646), 52%
2021-22, (n=757), 58%, significantly higher than total, significantly higher than previous wave
Apply
2020-21, (n=765), 60%
2021-22, (n=953), 65%, significantly higher than total, significantly higher than previous wave
Follow-up
2020-21, (n=168), 49%
2021-22, (n=241), 30%, significantly lower than total, significantly lower than previous wave
OLMC
Official Language Minority Communities
In-Person Satisfaction by Region (% Rated 4 or 5)
Overall, 81% of clients who utilized in-person services were satisfied with the service provided, lower than last year.
Satisfaction ratings were consistent by region; however, satisfaction has declined among clients in the West/Territories compared to last year.
Figure long description
In-Person Satisfaction by Region (% Rated 4 or 5)
In-Person Satisfaction
2021-22, 81%, significantly lower than previous wave
2020-21, 86%
2019-20, 86%
West/Territories
2021-22, 79%, significantly lower than previous wave
2020-21, 89%
2019-20, 85%
Ontario
2021-22, 83%
2020-21, 86%
2019-20, 83%
Quebec
2021-22, 83%
2020-21, 83%
2019-20, 91%
Atlantic
2021-22, 80%
2020-21, 88%
2019-20, 88%
*small sample size. Results should be interpreted with caution..
Q27. How satisfied were you with the overall quality of service you received from …
Nearly nine in ten clients who used in-person services felt that Service Canada representatives were helpful, while roughly three quarters agreed that they travelled a reasonable distance to access the service. More than eight in ten clients who used telephone services agreed that Service Canada specialized call centre telephone representatives were helpful. Ratings on all measures have declined compared to last year.
Notably, clients who were satisfied with their overall experience applying provided higher ratings for the helpfulness of Service Canada in-person and specialized call centre representatives compared to all clients who used those services, while those who were dissatisfied provided considerably lower ratings.
Figure long description
In-person
Service Canada representatives that you dealt with in person were helpful
5 - Strongly agree, 73%
Rated 4, 15%
Rated 3, 5%
Rated 2, 3%
1 - Strongly disagree, 2%
Not Applicable, 2%
Don’t know, 1%
% Rated 4 or 5
2019-20, 92%
2020-21, 91%
2021-22, 88%, significantly lower than previous wave
By Overall Satisfaction
Rated 4 or 5, 94%, significantly higher than total
Rated 1 or 2, 47%, significantly lower than total
You travelled a reasonable distance to access the service
5 - Strongly agree, 53%, significantly lower than previous wave
Rated 4, 20%
Rated 3, 15%, significantly higher than previous wave
Rated 2, 4%
1 - Strongly disagree, 5%
Not Applicable, 2%, significantly higher than previous wave
Don’t know, 1%
% Rated 4 or 5
2019-20, 75%
2020-21, 79%
2021-22, 73%, significantly lower than previous wave
By Overall Satisfaction
Rated 4 or 5, 78%, significantly higher than total
Rated 1 or 2, 48%, significantly lower than total
Telephone
Service Canada specialized call centre phone representatives were helpful
5 - Strongly agree, 62%, significantly lower than previous wave
Rated 4, 20%
Rated 3, 10%
Rated 2, 4%
1 - Strongly disagree, 3%
Not Applicable, 1%
% Rated 4 or 5
2019-20, 73%
2020-21, 85%
2021-22, 82%, significantly lower than previous wave
By Overall Satisfaction
Rated 4 or 5, 94%, significantly higher than total
Rated 1 or 2, 32%, significantly lower than total
Q36b. Thinking about the overall service you received, from getting information about [INSERT ABBREV] to receiving a decision, how much do you agree or disagree with the following statements, using a 5-point scale (where 1 means strongly disagree, and 5 means strongly agree)?
Base: All respondents (n=varies)
Qualitative Insights on Service Canada Representatives
When asked whether they felt the Service Canada representative(s) respected them and their time, most participants said yes, particularly on the phone. They felt Service Canada representatives were friendly, made them feel comfortable, took their time to address all questions without rushing them, and were very helpful and informative.
Absolutely. The first gentleman I talked to there, it seemed like he went above and beyond to get me some money, because I’ve been out of work, and I wasn’t getting any money at all. I had no income for over a year… He was very good, that gentleman. Very helpful. At the office, they’re all great. Very professional. I had no problem talking to anybody once I waited in line for a while, but other than that, yeah.
Absolutely. The person I spoke with was very helpful. I had to wait a little bit to talk to somebody, but actually, I was quite satisfied with the services he provided.
Reasons for Low Satisfaction with Specialized Call Centre Service: Overall
Among those who reported low satisfaction scores (ratings of 1 to 3 out of 5) for the service provided by specialized call centres, the most common reason was long wait times, with nearly half feeling it was too long. Other reasons included inconsistent or unclear information or that their questions were not answered.
Compared to 2020-21, fewer felt the telephone wait times were too long while more clients said they did not like the outcome of the call.
Figure long description
Reason for Rating of 1 to 3, 34% of those who used a Specialized Call Centre
The telephone wait times were too long
2021-22, 46%, significantly lower than previous wave
2020-21, n=315, 54%
Inconsistent or unclear information
2021-22, 18%
2020-21, n=315, 23%
Your questions were not answered
2021-22, 7%
2020-21, n=315, 5%
Did not like the outcome of the call(s)
2021-22, 4%, significantly higher than previous wave
2020-21, n=315, 1%
Service Canada representatives were disrespectful
2021-22, 1%
2020-21, n=315, 0%
Other
2021-22, 21%
2020-21, n=315, 23%
(DK/NS)
2021-22, 2%
2020-21, n=315, 3%
Q27a. You provided a rating of [INSERT RATING FOR 'AN [INSERT ABBREV] CALL CENTRE' AT Q27] out of 5 for the service provided by the [INSERT ABBREV] Call Centre. What would you say most contributed to your lower satisfaction with the overall quality of the service you received from the [PROGRAM ABBREV] call centre?)
Base: Those who provided a rating of 1 to 3/10 on Q27 (n=344
Qualitative Insights on Wait Times
There was concern about wait times and many experiences of being unable to get in touch with Service Canada representative(s) when needed – sometimes across multiple attempts.
Many participants described long wait times to reach a representative on the phone or long lines to access service in person as causes of dissatisfaction, and yet continue to use these channels to access service.
Some felt that they were treated with respect; however, their time was not respected as they had to wait in line or on hold for a long time to get through to a representative.
Oh yes, they were. Well, not my time because I was on hold for probably two hours, sometimes two-and-a-half hours, so you just sat there with the thing on speaker and try to go in your business. But I guess, you know, there’s only so many people up there. I mean, like I said, I’ve never had to do that in my life, so I didn’t know what to expect. So, I guess I accepted that that was the norm.
The wait time was really long. I struggled on my lunch break to get a hold of Service Canada, and then after work as well, just because the hours of calling are really within the work, a usual workday. I kind of struggled to find time to call, and then when I did call, I struggled to actually get a hold of someone, because the wait was so long. It was an appeal I made in September, and then I didn’t actually see progress until February. And then, I didn’t actually get payment until March.
Reasons for Low Satisfaction with Specialized Call Centre Service: by Program and Region
OAS/GIS clients were more likely to cite their questions not being sufficiently answered compared to all clients and were considerably more likely to say this is the reason for their lower rating compared to 2020-21. EI clients were less likely to mention the telephone wait times being too long compared to last year.
By region, clients from Quebec were more likely to say their questions were not answered. Compared to 2020-21, clients in the West/Territories were more likely to say did they not like the outcome of the call while clients in Ontario were more likely to cite inconsistent or unclear information.
Figure long description
Reason for Rating of 1 to 4
The telephone wait times were too long
Total
2020-21, (n=315), 54%
2021-22, (n=344), 46%, significantly lower than previous wave
By Program
EI
2020-21, (n=122), 59%
2021-22, (n=147), 45%, significantly lower than previous wave
CPP
2020-21, (n=38*), 52%
2021-22, (n=44), 53%
CPP-D
2020-21, (n=90), 27%
2021-22, (n=106), 27%, significantly lower than total
SIN
2020-21, (n=29*), 42%
OAS/GIS
2020-21, (n=36*), 50%
2021-22, (n=38*), 49%
By Region
West/ Territories
2020-21, (n=132), 45%
2021-22, (n=138), 41%
Ontario
2020-21, (n=79), 57%
2021-22, (n=118), 47%
Quebec
2020-21, (n=78), 57%
2021-22, (n=65), 53%
Atlantic
2020-21, (n=29*), 75%
Inconsistent or unclear information
Total
2020-21, (n=315), 12%
2021-22, (n=344), 18%
By Program
EI
2020-21, (n=122), 12%
2021-22, (n=147), 20%
CPP
2020-21, (n=38*), 12%
2021-22, (n=44), 16%
CPP-D
2020-21, (n=90), 16%
2021-22, (n=106), 22%
SIN
2020-21, (n=29*), 0%
OAS/GIS
2020-21, (n=36*), 11%
2021-22, (n=38*), 10%
By Region
West/ Territories
2020-21, (n=132), 20%
2021-22, (n=138), 25%
Ontario
2020-21, (n=79), 10%
2021-22, (n=118), 21%, significantly higher than previous wave
Quebec
2020-21, (n=78), 8%
2021-22, (n=65), 8%, significantly lower than total
Atlantic
2020-21, (n=29*), 12%
Your questions were not answered
Total
2020-21, (n=315), 5%
2021-22, (n=344), 7%
By Program
EI
2020-21, (n=122), 4%
2021-22, (n=147), 7%
CPP
2020-21, (n=38*), 4%
2021-22, (n=44), 4%
CPP-D
2020-21, (n=90), 13%
2021-22, (n=106), 10%
SIN
2020-21, (n=29*), 0%
OAS/GIS
2020-21, (n=36*), 2%
2021-22, (n=38*), 23%, significantly higher than total, significantly higher than previous wave
By Region
West/ Territories
2020-21, (n=132), 6%
2021-22, (n=138), 7%
Ontario
2020-21, (n=79), 2%
2021-22, (n=118), 3%
Quebec
2020-21, (n=78), 8%
2021-22, (n=65), 16%, significantly higher than total
Atlantic
2020-21, (n=29*), 3%
Did not like the outcome of the calls
Total
2020-21, (n=315), 1%
2021-22, (n=344), 4%, significantly higher than previous wave
By Program
EI
2020-21, (n=122), 2%
2021-22, (n=147), 4%
CPP
2020-21, (n=38*), 4%
2021-22, (n=44), 2%
CPP-D
2020-21, (n=90), 8%
2021-22, (n=106), 7%
SIN
2020-21, (n=29*), 12%
OAS/GIS
2021-22, (n=38*), 1%
By Region
West/ Territories
2020-21, (n=132), 2%
2021-22, (n=138), 7%, significantly higher than previous wave
Ontario
2021-22, (n=118), 0%
Quebec
2021-22, (n=65), 4%
Service Canada representatives were disrespectful
Total
2020-21, (n=315), 0%
2021-22, (n=344), 1%
By Program
EI
2021-22, (n=147), 1%
CPP-D
2020-21, (n=90), 4%
2021-22, (n=106), 1%
OAS/GIS
2020-21, (n=36*), 2%
2021-22, (n=38*), 2%
By Region
West/ Territories
2021-22, (n=138), 0%
Ontario
2021-22, (n=118), 0%
Quebec
2021-22, (n=65), 3%
Atlantic
2020-21, (n=29*), 1%
Other
Total
2020-21, (n=315), 23%
2021-22, (n=344), 21%
By Program
EI
2020-21, (n=122), 23%
2021-22, (n=147), 22%
CPP
2020-21, (n=38*), 28%
2021-22, (n=44), 24%
CPP-D
2020-21, (n=90), 28%
2021-22, (n=106), 26%
SIN
2020-21, (n=29*), 17%
OAS/GIS
2020-21, (n=36*), 34%
2021-22, (n=38*), 16%, significantly lower than previous wave
By Region
West/ Territories
2020-21, (n=132), 23%
2021-22, (n=138), 18%
Ontario
2020-21, (n=79), 27%
2021-22, (n=118), 27%
Quebec
2020-21, (n=78), 23%
2021-22, (n=65), 13%, significantly lower than total
Atlantic
2020-21, (n=29*), 6%
Don’t know/not stated
Total
2020-21, (n=315), 3%
2021-22, (n=344), 2%
By Program
EI
2020-21, (n=122), 1%
2021-22, (n=147), 1%
CPP-D
2020-21, (n=90), 4%
2021-22, (n=106), 7%, significantly higher than total
OAS/GIS
2020-21, (n=36*), 2%
By Region
West/ Territories
2020-21, (n=132), 4%
2021-22, (n=138), 2%
Ontario
2020-21, (n=79), 4%
2021-22, (n=118), 2%
Quebec
2020-21, (n=78), 3%
2021-22, (n=65), 2%
Atlantic
2020-21, (n=29*), 3%
*small sample size. Results should be interpreted with caution. **sample sizes too small for reporting.
Q27a. You provided a rating of [INSERT RATING FOR 'AN [INSERT ABBREV] CALL CENTRE' AT Q27] out of 5 for the service provided by the [INSERT ABBREV] Call Centre.
What would you say most contributed to your lower satisfaction with the overall quality of the service you received from the [PROGRAM ABBREV] call centre?
Base: Those who provided a rating of 1 to 3/10 on Q27
At-risk client groups
Barriers/Restrictions to Accessing Service
Clients with Restrictions that Affect Accessing Service: Overall
Nearly half of all clients felt they had restrictions that made it more difficult to access services.
The most common type of restriction experienced pertained to accessing a Service Canada centre, including being unable to visit SC offices during business hours and not living in close proximity to a SC Office.
Compared to 2020-21, clients were more likely to report being unable to visit SC offices during business hours, not living in close proximity to a SC Office, needing assistance from someone other than SC staff and feeling that the application form was too long or complicated.
Figure long description
Yes To At Least One
% Yes To At Least One, 2021-22, Total, 45%
Figure long description
Restrictions to Accessing Service
You are unable to visit Service Canada during business hours
2021-22, 21%, significantly higher than previous wave
2020-21, 18%
2019-20, 17%
You do not live in close proximity to a Service Canada office
2021-22, 15%, significantly higher than previous wave
2020-21, 12%
2019-20, 13%
You needed assistance from someone other than Service Canada staff
2021-22, 14%, significantly higher than previous wave
2020-21, 11%
2019-20, 10%
Application form was too long or complicated
2021-22, 13%, significantly higher than previous wave
2020-21, 11%
You could not use the computer in a Service Canada Centre
2021-22, 9%
2020-21, 9%
You do not own a smart phone
2021-22, 9%
2020-21, 8%
2019-20, 8%
You do not have access to the internet
2021-22, 8%
2020-21, 8%
2019-20, 6%
You do not have access to a computer
2021-22, 8%
2020-21, 7%
2019-20, 6%
Q45a. Some people experience difficulties applying for [INSERT ABBREV] because of barriers to accessing service. Did you experience difficulties applying for [PROGRAM ABBREV] because of any of the following reasons...? [INSERT FOR OAS 'AUTO-ENROLLED' AND OAS/GIS 'AUTO-ENROLLED'] Some people experience difficulties because of barriers to accessing service. Do you experience difficulties because of any of the following reasons?
Base: All respondents (n=4200)
Qualitative Insights on Accessibility
Many participants said they did not experience any service barriers or accessibility concerns with Service Canada. Most appreciated having options so they could choose whichever channel was most convenient or appropriate for them.
The various accessibility concerns that emerged were related to:
Long wait times and line ups
Concerns by clients with disabilities having to wait several hours in line.
Indigenous participants who had limited access to the internet and/or a physical Service Canada office.
Among those who are not technologically savvy or might not have computer equipment, particularly seniors – there was a concern that in-person options are becoming more difficult to access or would be phased out.
But for somebody who has no, or is on limited income, do they have a computer? Do they have access to the internet? So, which makes it very difficult.
And then to have to go to Service Canada and wait in line, you’ve got to go through all the protocols to get in there. I am a senior citizen, I have physical health limitations, and you’re causing me a great deal of suffering. Because I am standing in a lineup that is very, very slow moving, and then I have to, again, stand to talk to this employee who then hands me paperwork and dismisses me. So, I basically went back to my vehicle in a great deal of pain, frustrated.
The website was brutal. It took hours, it literally took hours, and I don’t know why. It was very hard to find what I needed. I didn’t have a service account yet, so I had to make one. And I found that really confusing and the instructions were confusing, and there were all these buttons. But when I would try and enter something, I got that round circle going round and round and round and round and round, and then I would refresh. But if you refreshed, you lost all your data, you lost everything you had entered till that point and you had to start all over again. And then you’re trying to submit and that thing went round and round and round. It got so bad, like I went and made a cup of tea, I went and did a few things, came back, it was still going round and round.
Clients with Restrictions that Affect Accessing Service: by Program
CPP-D clients were more likely to have nearly all restrictions, while OAS/GIS clients were more likely to say they were restricted by the application form being too long or complicated, not being able to use the computer in a Service Canada Centre, not having access to the internet, not owning a smartphone or not having access to a computer. CPP clients were more likely to say they were restricted by not owning a smartphone.
Compared to 2020-21, EI clients were more likely to say they were unable to visit Service Canada during business hours, that they do not live in close proximity to a Service Canada office or that the application form was too long or complicated. SIN clients were more likely to report they needed assistance from someone other than Service Canada staff, while OAS/GIS clients were more likely to say the application form was too long or complicated and that they do not have access to the internet. CPP-D clients were less likely to report having most restrictions.
Figure long description
% Yes to At Least One, 2021-22
Total, 45%
EI, 43%
CPP, 43%
CPPD, 67%, significantly higher than total
SIN, 46%
OAS/GIS, 43%
% Yes
You are unable to visit Service Canada during business hours
Total,
2019-20, 17%
2020-21, 18%
2021-22, 21%, significantly higher than previous wave
EI
2019-20, 16%
2020-21, 16%
2021-22, 21%, significantly higher than previous wave
CPP
2019-20, 16%
2020-21, 18%
2021-22, 19%
CPPD
2019-20, 21%
2020-21, 26%
2021-22, 26%, significantly higher than total
SIN
2019-20, 22%
2020-21, 23%
2021-22, 22%
OAS/GIS
2019-20, 9%
2020-21, 14%
2021-22, 16%, significantly lower than total
You do not live in close proximity to a Service Canada office
Total,
2019-20, 13%
2020-21, 12%
2021-22, 15%, significantly higher than previous wave
EI
2019-20, 11%
2020-21, 11%
2021-22, 14%, significantly higher than previous wave
CPP
2019-20, 10%
2020-21, 12%
2021-22, 14%
CPPD
2019-20, 18%
2020-21, 20%
2021-22, 19%, significantly higher than total
SIN
2019-20, 17%
2020-21, 15%
2021-22, 17%
OAS/GIS
2019-20, 10%
2020-21, 10%
2021-22, 13%
You needed assistance from someone other than Service Canada staff
Total,
2019-20, 10%
2020-21, 11%
2021-22, 14%, significantly higher than previous wave
EI
2019-20, 9%
2020-21, 11%
2021-22, 13%
CPP
2019-20, 8%
2020-21, 11%
2021-22, 13%
CPPD
2019-20, 41%
2020-21, 42%
2021-22, 36%, significantly higher than total, significantly lower than previous wave
SIN
2019-20, 9%
2020-21, 8%
2021-22, 14%, significantly higher than previous wave
OAS/GIS
2019-20, 10%
2020-21, 11%
2021-22, 14%
Application form was too long or complicated
Total,
2020-21, 11%
2021-22, 13%, significantly higher than previous wave
EI
2020-21, 11%
2021-22, 15%, significantly higher than previous wave
CPP
2020-21, 10%
2021-22, 12%
CPPD
2020-21, 41%
2021-22, 42%, significantly higher than total
SIN
2020-21, 8%
2021-22, 7%, significantly lower than total
OAS/GIS
2020-21, 11%
2021-22, 19%, significantly higher than total, significantly higher than previous wave
You could not use the computer in a Service Canada Centre
Total,
2020-21, 9%
2021-22, 9%
EI
2020-21, 9%
2021-22, 10%
CPP
2020-21, 9%
2021-22, 11%
CPPD
2020-21, 24%
2021-22, 18%, significantly higher than total, significantly lower than previous wave
SIN
2020-21, 7%
2021-22, 7%
OAS/GIS
2020-21, 11%
2021-22, 12%, significantly higher than total
You do not have access to the internet
Total,
2019-20, 6%
2020-21, 8%
2021-22, 8%
EI
2019-20, 7%
2020-21, 6%
2021-22, 7%
CPP
2019-20, 8%
2020-21, 11%
2021-22, 8%
CPPD
2019-20, 9%
2020-21, 15%
2021-22, 9%, significantly lower than previous wave
SIN
2019-20, 4%
2020-21, 9%
2021-22, 8%
OAS/GIS
2019-20, 10%
2020-21, 8%
2021-22, 12%, significantly higher than total, significantly higher than previous wave
You do not own a smart phone
Total,
2019-20, 8%
2020-21, 8%
2021-22, 9%
EI
2019-20, 6%
2020-21, 7%
2021-22, 7%, significantly lower than total
CPP
2019-20, 8%
2020-21, 12%
2021-22, 13%, significantly higher than total
CPPD
2019-20, 12%
2020-21, 16%
2021-22, 9%, significantly lower than previous wave
SIN
2019-20, 9%
2020-21, 9%
2021-22, 9%
OAS/GIS
2019-20, 10%
2020-21, 11%
2021-22, 14%, significantly higher than total
You do not have access to a computer
Total,
2019-20, 6%
2020-21, 7%
2021-22, 8%
EI
2019-20, 6%
2020-21, 6%
2021-22, 8%
CPP
2019-20, 7%
2020-21, 8%
2021-22, 9%
CPPD
2019-20, 14%
2020-21, 15%
2021-22, 11%, significantly higher than total, significantly lower than previous wave
SIN
2019-20, 5%
2020-21, 8%
2021-22, 6%, significantly lower than total
OAS/GIS
2019-20, 6%
2020-21, 9%
2021-22, 11%, significantly higher than total
Q45a. Some people experience difficulties applying for [INSERT ABBREV] because of barriers to accessing service. Did you experience difficulties applying for [PROGRAM ABBREV] because of any of the following reasons...? [INSERT FOR OAS 'AUTO-ENROLLED' AND OAS/GIS 'AUTO-ENROLLED'] Some people experience difficulties because of barriers to accessing service. Do you experience difficulties because of any of the following reasons?
Base: All respondents (n=4200)
Clients with Restrictions that Affect Accessing Service
Clients with restrictions had lower overall satisfaction compared to all clients and were less satisfied compared to 2020-21, consistent with overall clientele.
Clients with restrictions had lower satisfaction with the service provided in-person, online, through MSCA, specialized call centres and 1 800 O-Canada.
Compared to 2020-21, satisfaction has decreased for the service provided through all channels.
Figure long description
Overall Satisfaction (% Rated 4 or 5)
2018-20, 79%
2020-21, 80%
2021-22, 72%, significantly lower than total, significantly lower than previous wave
Figure long description
Service Channel Satisfaction (% Rated 4 or 5)
In-Person
2019-20, 80%
2020-21, 82%
2021-22, 76%, significantly lower than total, significantly lower than previous wave
My Service Canada Account
2019-20, 65%
2020-21, 69%
2021-22, 62%, significantly lower than total, significantly lower than previous wave
Online
2019-20, 70%
2020-21, 71%
2021-22, 63%, significantly lower than total, significantly lower than previous wave
1 800 O-Canada
2019-20, 55%
2020-21, 72%
2021-22, 47%, significantly lower than total, significantly lower than previous wave
Specialized Call Centre
2019-20, 61%
2020-21, 68%
2021-22, 60%, significantly lower than total, significantly lower than previous wave
eServiceCanada
2020-21, 83%
2021-22, 71%, significantly lower than previous wave
Base: Clients with restrictions that affect accessing service (n=2065)
There were also many significant gaps in service attributes between clients with restrictions and clients overall. The largest gaps were for the ease of understanding information about the program, being able to find the information needed (when learning about the program) within a reasonable amount of time and that being able to complete steps online made the process easier.
Compared to 2020-21, ratings have declined across most measures. The largest declines were observed for the helpfulness of 1 800 O-Canada reps, ease of follow-up, ease of understanding information about the program, being able to find the information needed within a reasonable amount of time and overall timeliness of service.
Figure long description
WIDEST GAP VS. TOTAL & CHANGE VS. 2020-21 IN SERVICE ATTRIBUTES (% RATED 4 OR 5)
Ease of understanding information about the program
2021-22, 63%, significantly lower than total, significantly lower than previous wave
GAP vs Total, -11 pts
2020-21, 74%
You were able to find the information you needed (online, in person or by phone) within a reasonable amount of time
2021-22, 63%, significantly lower than total, significantly lower than previous wave
GAP vs Total, -11 pts
2020-21, 73%
Being able to complete steps online made the process easier for you
2021-22, 67%, significantly lower than total, significantly lower than previous wave
GAP vs Total, -11 pts
2020-21, 74%
Ease of finding out the steps to apply
2021-22, 66%, significantly lower than total
GAP vs Total, -10 pts
2020-21, 70%
Ease of finding out what information you need to provide when applying
2021-22, 66%, significantly lower than total
Gap vs Total, -10 pts
2020-21, 70%
Ease of completing the application form
2021-22, 72%, significantly lower than total, significantly lower than previous wave
Gap vs total, -10 pts
2020-21, 79%
Able to move smoothly through all steps
2021-22, 72%, significantly lower than total, significantly lower than previous wave
Gap vs total, -10 pts
2020-21, 79%
Overall, it was easy to apply
2021-22, 75%, significantly lower than total, significantly lower than previous wave
Gap vs total, -10 pts
2020-21, 79%
1 800 O-Canada phone representatives were helpful
2021-22, 68%, significantly lower than total, significantly lower than previous wave
Gap vs total, -10 pts
2020-21, 83%
The amount of time it took, from start to finish, was reasonable.
2021-22, 66%, significantly lower than total, significantly lower than previous wave
Gap vs total, -9 pts
2020-21, 75%
It was clear what to do if you had a problem or question
2021-22, 67%, significantly lower than total
Gap vs total, -9 pts
2020-21, 74%
Ease of follow-up
2021-22, 46%, significantly lower than total, significantly lower than previous wave
Gap vs total, -9 pts
2020-21, 59%
Ease of understanding requirements of the application
2021-22, 73%, significantly lower than total, significantly lower than previous wave
Gap vs total, -9 pts
2020-21, 77%
Ease of understanding information about the program
2021-22, 69%, significantly lower than total
Gap vs total, -9 pts
2020-21, 73%
Ease of figuring out eligibility
2021-22, 65%, significantly lower than total, significantly lower than previous wave
Gap vs total, -9 pts
2020-21, 71%
Proportion of At-Risk Client Groups with Restrictions
Figure long description
Proportion of Clients
Youth (18 to 30), 31%
% At Least One, 47%
You are unable to visit a Service Canada office during business hours, 22%
You do not live in close proximity to a Service Canada office, 15%
You needed assistance from someone other than Service Canada staff, 15%
Application form was too long or complicated, 13%
You do not have access to a computer, 8%
You do not have access to the internet, 7%
You do not own a smart phone, 7%
You could not use the computer in a Service Canada Centre, 6%, significantly lower than total
Seniors (60+), 27%
% At Least One, 45%
You are unable to visit a Service Canada office during business hours, 16%, significantly lower than total
You do not live in close proximity to a Service Canada office, 14%
You needed assistance from someone other than Service Canada staff, 14%
Application form was too long or complicated, 14%
You do not have access to a computer, 10%, significantly higher than total
You do not have access to the internet, 10%, significantly higher than total
You do not own a smart phone, 14%, significantly higher than total
You could not use the computer in a Service Canada Centre, 14%, significantly higher than total
OLMC, 4%
% At Least One, 47%
You are unable to visit a Service Canada office during business hours, 23%
You do not live in close proximity to a Service Canada office, 14%
You needed assistance from someone other than Service Canada staff, 22%, significantly higher than total
Application form was too long or complicated, 16%
You do not have access to a computer, 11%
You do not have access to the internet, 11%
You do not own a smart phone, 11%
You could not use the computer in a Service Canada Centre, 11%
Non E or F speaking, 2%
% At Least One, 57%, significantly higher than total
You are unable to visit a Service Canada office during business hours, 30%, significantly higher than total
You do not live in close proximity to a Service Canada office, 18%
You needed assistance from someone other than Service Canada staff, 25%, significantly higher than total
Application form was too long or complicated, 15%
You do not have access to a computer, 8%
You do not have access to the internet, 8%
You do not own a smart phone, 6%
You could not use the computer in a Service Canada Centre, 18%, significantly higher than total
High school or less, 31%
% At Least One, 49%, significantly higher than total
You are unable to visit a Service Canada office during business hours, 21%
You do not live in close proximity to a Service Canada office, 16%
You needed assistance from someone other than Service Canada staff, 17%, significantly higher than total
Application form was too long or complicated, 16%, significantly higher than total
You do not have access to a computer, 12%, significantly higher than total
You do not have access to the internet, 10% significantly higher than total
You do not own a smart phone, 11%, significantly higher than total
You could not use the computer in a Service Canada Centre, 12%, significantly higher than total
Indigenous, 6%
% At Least One, 59%, significantly higher than total
You are unable to visit a Service Canada office during business hours, 30%, significantly higher than total
You do not live in close proximity to a Service Canada office, 26%, significantly higher than total
You needed assistance from someone other than Service Canada staff, 23%, significantly higher than total
Application form was too long or complicated, 17%, significantly higher than total
You do not have access to a computer, 16%, significantly higher than total
You do not have access to the internet, 15%, significantly higher than total
You do not own a smart phone, 15%, significantly higher than total
You could not use the computer in a Service Canada Centre, 13%, significantly higher than total
Clients with disabilities, 8%
% At Least One, 64%, significantly higher than total
You are unable to visit a Service Canada office during business hours, 26%, significantly higher than total
You do not live in close proximity to a Service Canada office, 25%, significantly higher than total
You needed assistance from someone other than Service Canada staff, 25%, significantly higher than total
Application form was too long or complicated, 28%, significantly higher than total
You do not have access to a computer, 13%, significantly higher than total
You do not have access to the internet, 10%, significantly higher than total
You do not own a smart phone, 12%, significantly higher than total
You could not use the computer in a Service Canada Centre, 15%, significantly higher than total
Remote, 2%
% At Least One, 56%, significantly higher than total
You are unable to visit a Service Canada office during business hours, 29%, significantly higher than total
You do not live in close proximity to a Service Canada office, 24%, significantly higher than total
You needed assistance from someone other than Service Canada staff, 14%
Application form was too long or complicated, 14%
You do not have access to a computer, 10%
You do not have access to the internet, 14%, significantly higher than total
You do not own a smart phone, 8%
You could not use the computer in a Service Canada Centre, 21%, significantly higher than total
Urban, 58%
% At Least One, 44%
You are unable to visit a Service Canada office during business hours, 20%
You do not live in close proximity to a Service Canada office, 13%, significantly lower than total
You needed assistance from someone other than Service Canada staff, 15%
Application form was too long or complicated, 13%
You do not have access to a computer, 7%
You do not have access to the internet, 8%
You do not own a smart phone, 9%
You could not use the computer in a Service Canada Centre, 8%
Rural, 38%
% At Least One, 45%
You are unable to visit a Service Canada office during business hours, 21%
You do not live in close proximity to a Service Canada office, 16%
You needed assistance from someone other than Service Canada staff, 12%, significantly lower than total
Application form was too long or complicated, 12%
You do not have access to a computer, 8%
You do not have access to the internet, 8%
You do not own a smart phone, 10%
You could not use the computer in a Service Canada Centre, 10%
E-vulnerable, 15%
% At Least One, 57%, significantly higher than total
You are unable to visit a Service Canada office during business hours, 20%
You do not live in close proximity to a Service Canada office, 21%, significantly higher than total
You needed assistance from someone other than Service Canada staff, 19%, significantly higher than total
Application form was too long or complicated, 18%, significantly higher than total
You do not have access to a computer, 18%, significantly higher than total
You do not have access to the internet, 16%, significantly higher than total
You do not own a smart phone, 18%, significantly higher than total
You could not use the computer in a Service Canada Centre, 16%, significantly higher than total
Newcomers (3 yrs. or fewer), 18%
% At Least One, 44%
You are unable to visit a Service Canada office during business hours, 17%, significantly lower than total
You do not live in close proximity to a Service Canada office, 17%
You needed assistance from someone other than Service Canada staff, 16%
Application form was too long or complicated, 7%, significantly lower than total
You do not have access to a computer, 5%, significantly lower than total
You do not have access to the internet, 9%
You do not own a smart phone, 9%
You could not use the computer in a Service Canada Centre, 6%, significantly lower than total
Language barrier, 6%
% At Least One, 75%, significantly higher than total
You are unable to visit a Service Canada office during business hours, 46%, significantly higher than total
You do not live in close proximity to a Service Canada office, 26% significantly higher than total,
You needed assistance from someone other than Service Canada staff, 25%, significantly higher than total
Application form was too long or complicated, 30%, significantly higher than total
You do not have access to a computer, 17%, significantly higher than total
You do not have access to the internet, 17%, significantly higher than total
You do not own a smart phone, 19%, significantly higher than total
You could not use the computer in a Service Canada Centre, 27%, significantly higher than total
Mobile only, 10%
% At Least One, 60%, significantly higher than total
You are unable to visit a Service Canada office during business hours, 27%, significantly higher than total
You do not live in close proximity to a Service Canada office, 26%, significantly higher than total
You needed assistance from someone other than Service Canada staff, 20%, significantly higher than total
Application form was too long or complicated, 17%, significantly higher than total
You do not have access to a computer, 24%, significantly higher than total
You do not have access to the internet, 17%, significantly higher than total
You do not own a smart phone, 15%, significantly higher than total
You could not use the computer in a Service Canada Centre, 17%, significantly higher than total
No devices, 3%
% At Least One, 71%, significantly higher than total
You are unable to visit a Service Canada office during business hours, 21%
You do not live in close proximity to a Service Canada office, 21%, significantly higher than total
You needed assistance from someone other than Service Canada staff, 26%, significantly higher than total
Application form was too long or complicated, 29%, significantly higher than total
You do not have access to a computer, 39%
You do not have access to the internet, 39%, significantly higher than total
You do not own a smart phone, 34%, significantly higher than total
You could not use the computer in a Service Canada Centre, 28%, significantly higher than total
Clients with restrictions, 45%
% At Least One, 100%
You are unable to visit a Service Canada office during business hours, 47%, significantly higher than total
You do not live in close proximity to a Service Canada office, 33%. significantly higher than total
You needed assistance from someone other than Service Canada staff, 31%, significantly higher than total
Application form was too long or complicated, 29%, significantly higher than total
You do not have access to a computer, 18%, significantly higher than total
You do not have access to the internet, 19%. significantly higher than total
You do not own a smart phone, 21%, significantly higher than total
You could not use the computer in a Service Canada Centre, 21%, significantly higher than total
Racialized, 37%
% At Least One, 46%
You are unable to visit a Service Canada office during business hours, 23%
You do not live in close proximity to a Service Canada office, 16%
You needed assistance from someone other than Service Canada staff, 15%
Application form was too long or complicated, 13%
You do not have access to a computer, 7%
You do not have access to the internet, 9%
You do not own a smart phone, 10%
You could not use the computer in a Service Canada Centre, 7%
OLMC
Official Language Minority Communities
Q45a. Some people experience difficulties applying for [INSERT ABBREV] because of barriers to accessing service. Thinking about your overall experience from getting information about, to applying for [INSERT ABBREV], did you experience difficulties for any of the following reasons …?
Base: All answering (n=varies)
At-risk client groups
At-Risk Client Groups: Introduction
At-risk clientsǂ make up 95% of the total sample universe.
Service Canada aims to assess whether it has improved service to client groups with low satisfaction and who encounter barriers to service. Clients may encounter barriers to accessing service for a number of reasons, and Service Canada is committed to identifying and eliminating barriers to service.
Newcomers
Not born in Canada and arrived within the previous 3 years
Non English or French speakers
Identify “other” as preferred language of service
Lower Education
High school or less
Youth
Aged 18 to 30
Seniors
Aged 60 and over
Clients with disabilities
Self-identified
Clients with restrictions
Self-identified
Indigenous people
Self-identified as First Nations, Inuit, or Métis
E-vulnerable
Clients who rarely or never use online services
Mobile only
Self-reported as clients with only a smartphone, no computer or tablet
No devices
Self-reported as clients with no devices (mobile, tablet, computer)
Remote clients
Sample variable
Rural clients
Sample variable
Urban clients
Sample variable
Official language minorities (OLMC)
Clients in Quebec who prefer service in English, and clients outside Quebec who prefer service in French (sample variable and (Q41b)
Language barrier
It was easy to access service in a language I could speak and understand well (Rated 1 or 2)
Racialized
Clients who identify as a racial or cultural group other than White (Can be in addition to also identifying as white)
ǂ This calculation considers all clients who were a part of at least one At-Risk group, excluding residents of urban areas. If we were to consider residents of urban areas, 100% of the sample falls into at least one At-Risk category. Q45a. Some people experience difficulties applying for [INSERT ABBREV] because of barriers to accessing service. Thinking about your overall experience from getting information about, to applying for [INSERT ABBREV], did you experience difficulties for any of the following reasons …?
Base: All answering (n=varies)
Proportion of At-Risk Client Groups: by Program
Presence of at-risk client groups differed significantly by program due in large part to program design.
Figure long description
2021-22 Proportion of Clients
Youth (18 to 30) 31%
EI
2020-21, 29%
2021-22, 28%
CPP
2020-21, 0%
2021-22, 0%, significantly lower than total
CPPD
2020-21, 3%
2021-22, 5%, significantly lower than total,
SIN
2020-21, 57%
2021-22, 58%, significantly higher than total
OAS/GIS
2021-22, 0%, significantly lower than total
Seniors (60+) 27%, significantly lower than previous wave
EI
2020-21, 15%
2021-22, 13%, significantly lower than total
CPP
2020-21, 96%
2021-22, 96%significantly higher than total
CPPD
2020-21, 25%
2021-22, 20%, significantly lower than total, significantly lower than previous wave
SIN
2020-21, 4%
2021-22, 2%, significantly lower than total, significantly lower than previous wave
OAS/GIS
2020-21, 100%
2021-22, 100%, significantly higher than total
OLMC 4%, significantly higher than previous wave
EI
2020-21, 4%
2021-22, 4%
CPP
2020-21, 2%
CPPD
2020-21, 2%
2021-22, 1%, significantly lower than total
SIN
2020-21, 9%
2021-22, 5%, significantly lower than previous wave
OAS/GIS
2020-21, 5%
2021-22, 4%
Non E or F speaking 2%, significantly lower than previous wave
EI
2020-21, 2%
2021-22, 1%, significantly lower than total
CPP
2020-21, 1%
2021-22, 2%
CPPD
2020-21, 3%
2021-22, 1%, significantly lower than previous wave
SIN
2020-21, 6%
2021-22, 5%, significantly higher than total
OAS/GIS
2020-21, 1%
2021-22, 1%
High school or less 31%
EI
2020-21, 33%
2021-22, 35%, significantly higher than total
CPP
2020-21, 41%
2021-22, 34%, significantly lower than previous wave
CPPD
2020-21, 41%
2021-22, 36%, significantly higher than total
SIN
2020-21, 19%
2021-22, 20%, significantly lower than total
OAS/GIS
2020-21, 43%
2021-22, 35%, significantly higher than total, significantly lower than previous wave
Indigenous 6%, significantly lower than previous wave
EI
2020-21, 12%
2021-22, 7%, significantly lower than previous wave
CPP
2020-21, 5%
2021-22, 5%
CPPD
2020-21, 8%
2021-22, 9%, significantly higher than total
SIN
2020-21, 7%
2021-22, 7%
OAS/GIS
2020-21, 3%
2021-22, 4%, significantly lower than total
Clients with disabilities 8%
EI
2020-21, 6%
2021-22, 7%
CPP
2020-21, 11%
2021-22, 12%, significantly higher than total
CPPD
2020-21, 84%
2021-22, 83%, significantly higher than total
SIN
2020-21, 3%
2021-22, 3%, significantly lower than total
OAS/GIS
2020-21, 15%
2021-22, 11%, significantly higher than total, significantly lower than previous wave
Remote 2%
EI
2020-21, 3%
2021-22, 3%
CPP
2020-21, 2%
2021-22, 2%
CPPD
2020-21, 3%
2021-22, 2%
SIN
2020-21, 1%
2021-22, 1%, significantly lower than total
OAS/GIS
2020-21, 2%
2021-22, 2%
Urban 58%, significantly lower than previous wave
EI
2020-21, 56%
2021-22, 51%, significantly lower than total, significantly lower than previous wave
CPP
2020-21, 54%
2021-22, 54%, significantly lower than total
CPPD
2020-21, 53%
2021-22, 53%, significantly lower than total
SIN
2020-21, 79%
2021-22, 75%, significantly higher than total
OAS/GIS
2020-21, 52%
2021-22, 51%, significantly lower than total
Rural 38%, significantly higher than previous wave
EI
2020-21, 41%
2021-22, 45%, significantly higher than total
CPP
2020-21, 44%
2021-22, 43%, significantly higher than total
CPPD
2020-21, 44%
2021-22, 44%, significantly higher than total
SIN
2020-21, 18%
2021-22, 22%, significantly lower than total, significantly higher than previous wave
OAS/GIS
2020-21, 46%
2021-22, 47%, significantly higher than total
E-vulnerable 15%, significantly higher than previous wave
EI
2020-21, 11%
2021-22, 14%, significantly higher than previous wave
CPP
2020-21, 26%
2021-22, 27%, significantly higher than total
CPPD
2020-21, 26%
2021-22, 19%, significantly higher than total, significantly lower than previous wave
SIN
2020-21, 9%
2021-22, 11%, significantly lower than total
OAS/GIS
2020-21, 22%
2021-22, 24%, significantly higher than total
Newcomers (3 yrs. or fewer) 18%, significantly higher than previous wave
EI
2020-21, 2%
2021-22, 2%, significantly lower than total
SIN
2020-21, 44%
2021-22, 58%, significantly higher than total, significantly higher than previous wave
Language barrier 6%, significantly higher than previous wave
EI
2020-21, 4%
2021-22, 5%
CPP
2020-21, 7%
2021-22, 5%
CPPD
2020-21, 13%
2021-22, 7%, significantly lower than previous wave
SIN
2020-21, 4%
2021-22, 6%
OAS/GIS
2020-21, 5%
2021-22, 7%
Mobile only 10%
EI
2020-21, 9%
2021-22, 9%
CPP
2020-21, 5%
2021-22, 6%, significantly lower than total
CPPD
2020-21, 11%
2021-22, 13%, significantly higher than total
SIN
2020-21, 9%
2021-22, 15%, significantly higher than total, significantly higher than previous wave
OAS/GIS
2020-21, 9%
2021-22, 6%, significantly lower than total
No devices 3%
EI
2020-21, 2%
2021-22, 1%, significantly lower than total
CPP
2020-21, 8%
2021-22, 5%, significantly higher than total, significantly lower than previous wave
CPPD
2020-21, 7%
2021-22, 4%, significantly lower than previous wave
SIN
2020-21, 1%
2021-22, 2%
OAS/GIS
2020-21, 9%
2021-22, 10%, significantly higher than total
Clients with restrictions 45%, significantly lower than previous wave
EI
2020-21, 46%
2021-22, 43%
CPP
2020-21, 47%
2021-22, 43%
CPPD
2020-21, 80%
2021-22, 67%, significantly higher than total, significantly lower than previous wave
SIN
2020-21, 52%
2021-22, 46%, significantly lower than previous wave
OAS/GIS
2020-21, 43%
2021-22, 38%, significantly lower than total, significantly lower than previous wave
Racialized 37%
EI
2020-21, 24%
2021-22, 24%, significantly lower than total
CPP
2020-21, 11%
2021-22, 11%, significantly lower than total
CPPD
2020-21, 16%
2021-22, 18%, significantly lower than total
SIN
2020-21, 72%
2021-22, 79%, significantly higher than total, significantly higher than previous wave
OAS/GIS
2020-21, 9%
2021-22, 8%, significantly lower than total
OLMC
Official Language Minority Communities
Proportion of At-Risk Client Groups: by Region
Among clients in the West and the Territories, there was a higher portion of Indigenous clients, clients with disabilities, remote clients and those with a language barrier compared to all clients.
Among clients in Ontario, there was a higher portion of youth, clients with disabilities, urban clients, racialized clients and newcomers.
Among clients in Quebec, there was a higher proportion of OLMC and clients with a high school education or less formal education.
Among clients in Atlantic Canada, there was also a higher proportion of seniors and rural clients.
Figure long description
2021-22 Proportion of clients
Youth (18 to 30) 31%
West/ Territories
2020-21, n=1626, 30%
2021-22, n=1533, 30%
Ontario
2020-21, n=1148, 34%
2021-22, n=1501, 37%, significantly higher than total,
Quebec
2020-21, n=1006, 28%
2021-22, n=750, 24%, significantly lower than total
Atlantic
2020-21, n=420, 26%
2021-22, n=416, 26%, significantly lower than previous wave
Seniors (60+) 27%, significantly lower than previous wave
West/ Territories
2020-21, n=1626, 29%
2021-22, n=1533, 29%
Ontario
2020-21, n=1148, 29%
2021-22, n=1501, 26%
Quebec
2020-21, n=1006, 28%
2021-22, n=750, 26%
Atlantic
2020-21, n=420, 33%
2021-22, n=416, 33%, significantly higher than total
OLMC 4%, significantly lower than previous wave
West/ Territories
2020-21, n=1626, 1%
Ontario
2020-21, n=1148, 2%
Quebec
2020-21, n=1006, 17%
2021-22, n=750, 17%, significantly higher than total
Atlantic
2020-21, n=420, 8%
2021-22, n=1416, 1%, significantly lower than total, significantly lower than previous wave
Non E or F speaking 2%, significantly lower than previous wave
West/ Territories
2020-21, n=1626, 3%
2021-22, n=1533, 3%
Ontario
2020-21, n=1148, 3%
2021-22, n=1501, 3%
Quebec
2020-21, n=1006, 2%
2021-22, n=750, 2%
Atlantic
2020-21, n=420, 2%
High school or less 31%
West/ Territories
2020-21, n=1626, 35%
2021-22, n=1533, 31%, significantly lower than previous wave
Ontario
2020-21, n=1148, 27%
2021-22, n=1501, 27%, significantly lower than total
Quebec
2020-21, n=1006, 30%
2021-22, n=750, 35%, significantly higher than total, significantly higher than previous wave
Atlantic
2020-21, n=420, 35%
2021-22, n=1416, 35%
Indigenous 6%, significantly lower than previous wave
West/ Territories
2020-21, n=1626, 10%
2021-22, n=1533, 11%, significantly higher than total
Ontario
2020-21, n=1148, 7%
2021-22, n=1501, 4%, significantly lower than total, significantly lower than previous wave
Quebec
2020-21, n=1006, 8%
2021-22, n=750, 4%, significantly lower than total, significantly lower than previous wave
Atlantic
2020-21, n=420, 10%
2021-22, n=416, 6%, significantly lower than previous wave
Clients with disabilities 8%
West/ Territories
2020-21, n=1626, 10%
2021-22, n=1533, 10%, significantly higher than total
Ontario
2020-21, n=1148, 7%
2021-22, n=1501, 10%, significantly higher than total, significantly higher than previous wave
Quebec
2020-21, n=1006, 8%
2021-22, n=750, 2%, significantly lower than total, significantly lower than previous wave
Atlantic
2020-21, n=420, 10%
2021-22, n=1416, 10
Remote 2%
West/ Territories
2020-21, n=1626, 4%
2021-22, n=1533, 6%, significantly higher than total, significantly higher than previous wave
Ontario
2020-21, n=1148, 1%
Quebec
2020-21, n=1006, 1%
2021-22, n=750, 2%
Atlantic
2020-21, n=420, 4%
2021-22, n=1416, 1%, significantly lower than previous wave
Urban 58%, significantly lower than previous wave
West/ Territories
2020-21, n=1626, 62%
2021-22, n=1533, 55%, significantly lower than total, significantly lower than previous wave
Ontario
2020-21, n=1148, 69%
2021-22, n=1501, 70%, significantly higher than total
Quebec
2020-21, n=1006, 65%
2021-22, n=750, 56%, significantly lower than previous wave
Atlantic
2020-21, n=420, 30%
2021-22, n=1416, 25%, significantly lower than total
Rural 38%, significantly higher than previous wave
West/ Territories
2020-21, n=1626, 33%
2021-22, n=1533, 38%, significantly higher than previous wave
Ontario
2020-21, n=1148, 30%
2021-22, n=1501, 29%, significantly lower than total
Quebec
2020-21, n=1006, 33%
2021-22, n=750, 41%, significantly higher than previous wave
Atlantic
2020-21, n=420, 67%
2021-22, n=1416, 72%, significantly higher than total
E-vulnerable 15%, significantly higher than previous wave
West/ Territories
2020-21, n=1626, 14%
2021-22, n=1533, 14%
Ontario
2020-21, n=1148, 13%
2021-22, n=1501, 15%
Quebec
2020-21, n=1006, 13%
2021-22, n=750, 16%
Atlantic
2020-21, n=420, 16%
2021-22, n=1416, 17%
Newcomers (3 yrs. or fewer) 18%, significantly higher than previous wave
West/ Territories
2020-21, n=1626, 14%
2021-22, n=1533, 17%, significantly higher than previous wave
Ontario
2020-21, n=1148, 18%
2021-22, n=1501, 21%, significantly higher than total
Quebec
2020-21, n=1006, 11%
2021-22, n=750, 16%, significantly higher than previous wave
Atlantic
2020-21, n=420, 9%
2021-22, n=1416, 11%, significantly lower than total
Language barrier 6%, significantly higher than previous wave
West/ Territories
2020-21, n=1626, 5%
2021-22, n=1533, 8%, significantly higher than total, significantly higher than previous wave
Ontario
2020-21, n=1148, 3%
2021-22, n=1501, 5%, significantly higher than previous wave
Quebec
2020-21, n=1006, 6%
2021-22, n=750, 5%
Atlantic
2020-21, n=420, 5%
2021-22, n=416, 4%
Mobile only 10%
West/ Territories
2020-21, n=1626, 11%
2021-22, n=1533, 9%
Ontario
2020-21, n=1148, 8%
2021-22, n=1501, 9%
Quebec
2020-21, n=1006, 9%
2021-22, n=750, 12%, significantly higher than previous wave
Atlantic
2020-21, n=420, 5%
2021-22, n=416, 12%, significantly higher than previous wave
No devices 3%
West/ Territories
2020-21, n=1626, 3%
2021-22, n=1533, 3%
Ontario
2020-21, n=1148, 3%
2021-22, n=1501, 3%
Quebec
2020-21, n=1006, 3%
2021-22, n=750, 3%
Atlantic
2020-21, n=420, 4%
2021-22, n=1416, 2%
Clients with restrictions 45%, significantly lower than previous wave
West/ Territories
2020-21, n=1626, 51%
2021-22, n=1533, 44%, significantly lower than previous wave
Ontario
2020-21, n=1148, 49%
2021-22, n=1501, 46%
Quebec
2020-21, n=1006, 46%
2021-22, n=750, 42%
Atlantic
2020-21, n=420, 38%
2021-22, n=1416, 38%, significantly lower than total
Racialized 37%
West/ Territories
2020-21, n=1626, 35%
2021-22, n=1533, 33%, significantly lower than total
Ontario
2020-21, n=1148, 44%
2021-22, n=1501, 47%, significantly higher than total
Quebec
2020-21, n=1006, 26%
2021-22, n=750, 30%, significantly lower than total
Atlantic
2020-21, n=420, 18%
2021-22, n=1416, 19%, significantly lower than total
OLMC
Official Language Minority Communities
At-Risk Client Groups: Summary
Figure long description
Proportion of At-Risk Groups
Youth (18 to 30) 31%
Satisfied (% Rated 4 or 5)
2018-19, 86%
2019-20, 84%
2020-21, 85%
2021-22, 79%, significantly lower than previous wave
Proportion with Disability
2018-19, 3%
2019-20, 3%
2020-21, 4%
2021-22, 6%
Seniors (60+) 27%, Significantly lower than previous wave
Satisfied (% Rated 4 or 5)
2018-19, 87%
2019-20, 86%
2020-21, 87%
2021-22, 84%, significantly higher than total, significantly lower than previous wave
Proportion with Disability
2018-19, 17%
2019-20, 12%
2020-21, 13%
2021-22, 11%, significantly higher than total
OLMC 4%, significantly lower than previous wave
Satisfied (% Rated 4 or 5)
2018-19, 91%
2019-20, 90%
2020-21, 90%
2021-22, 81%, significantly lower than previous wave
Proportion with Disability
2018-19, 3%
2019-20, 2%
2020-21, 3%
2021-22, 4%
Non E or F speaking 2%, significantly lower than previous wave
Satisfied (% Rated 4 or 5)
2018-19, 80%
2019-20, 92%
2020-21, 90%
2021-22, 89%
Proportion with Disability
2018-19, 5%
2019-20, 5%
2020-21, 2%
2021-22, 3%
High school or less 31%
Satisfied (% Rated 4 or 5)
2018-19, 85%
2019-20, 84%
2020-21, 86%
2021-22, 80%, significantly lower than previous wave
Proportion with Disability
2018-19, 13%
2019-20, 11%
2020-21, 13%
2021-22, 9%, significantly lower than previous wave
Indigenous 6%, significantly lower than previous wave
Satisfied (% Rated 4 or 5)
2018-19, 85%
2019-20, 79%
2020-21, 83%
2021-22, 80%
Proportion with Disability
2018-19, 14%
2019-20, 13%
2020-21, 13%
2021-22, 14%, significantly higher than total,
Clients with disabilities 8%
Satisfied (% Rated 4 or 5)
2018-19, 79%
2019-20, 76%
2020-21, 76%
2021-22, 69%, significantly lower than total, significantly lower than previous wave
Proportion with Disability
2018-19, 100%
2019-20, 100%
2020-21, 100%
2021-22, 100%, significantly higher than total
Remote 2%
Satisfied (% Rated 4 or 5)
2018-19, 88%
2019-20, 80%
2020-21, 88%
2021-22, 81%, significantly lower than previous wave
Proportion with Disability
2018-19, 9%
2019-20, 4%
2020-21, 12%
2021-22, 11%, significantly higher than total
Urban 58%, significantly lower than previous wave
Satisfied (% Rated 4 or 5)
2018-19, 86%
2019-20, 85%
2020-21, 86%
2021-22, 81%, significantly lower than previous wave
Proportion with Disability
2018-19, 9%
2019-20, 6%
2020-21, 7%
2021-22, 8%
Rural 38%, significantly higher than previous wave
Satisfied (% Rated 4 or 5)
2018-19, 83%
2019-20, 82%
2020-21, 85%
2021-22, 80%, significantly lower than previous wave
Proportion with Disability
2018-19, 10%
2019-20, 9%
2020-21, 11%
2021-22, 8%, significantly lower than previous wave
E-vulnerable 15%, significantly higher than previous wave
Satisfied (% Rated 4 or 5)
2018-19, 84%
2019-20, 85%
2020-21, 82%
2021-22, 79%
Proportion with Disability
2018-19, 18%
2019-20, 14%
2020-21, 16%
2021-22, 11%, significantly higher than total, significantly lower than previous wave
Newcomers (3 yrs. or fewer) 18%, significantly higher than previous wave
Satisfied (% Rated 4 or 5)
2018-19, 93%
2019-20, 94%
2020-21, 93%
2021-22, 90%, significantly higher than total
Proportion with Disability
2018-19, 1%
2019-20, 1%
2020-21, 0%
2021-22, 2%, significantly lower than total, significantly higher than previous wave
Language barrier 6%, significantly higher than previous wave
Satisfied (% Rated 4 or 5)
2018-19, 42%
2019-20, 52%
2020-21, 55%
2021-22, 53%, significantly lower than total
Proportion with Disability
2018-19, 18%
2019-20, 19%
2020-21, 16%
2021-22, 12%
Mobile only 10%
Satisfied (% Rated 4 or 5)
2018-19, 85%
2019-20, 85%
2020-21, 83%
2021-22, 82%
Proportion with Disability
2018-19, 11%
2019-20, 8%
2020-21, 32%
2021-22, 12%, significantly higher than total, significantly higher than previous wave
No devices 3%
Satisfied (% Rated 4 or 5)
2018-19, 83%
2019-20, 81%
2020-21, 80%
2021-22, 71%, significantly lower than total, significantly lower than previous wave
Proportion with Disability
2018-19, 23%
2019-20, 15%
2020-21, 10%
2021-22, 20%, significantly higher than total, significantly higher than previous wave
Clients with restrictions 45%, significantly lower than previous wave
Satisfied (% Rated 4 or 5)
2019-20, 79%
2020-21, 80%
2021-22, 72%, significantly lower than total, significantly lower than previous wave
Proportion with Disability
2019-20, 14%
2020-21, 13%
2021-22, 12%, significantly higher than total
Racialized 37%
Satisfied (% Rated 4 or 5)
2020-21, 89%
2021-22, 84%, significantly higher than total, significantly lower than previous wave
Proportion with Disability
2020-21, 3%
2021-22, 4%, significantly lower than total
OLMC
Official Language Minority Communities
Q45a. Some people experience difficulties applying for [INSERT ABBREV] because of barriers to accessing service. Thinking about your overall experience from getting information about, to applying for [INSERT ABBREV], did you experience difficulties for any of the following reasons …?
Base: All answering (n=varies)
At-Risk Client Groups: by Channel
Figure long description
Proportion of At-Risk Groups and Satisfaction with Service Channels (% Rated 4 or 5)
Youth (18 to 30) 31%
In-person
2019-20, 86%
2020-21, 88%
2021-22, 82%, significantly lower than previous wave
Canada.ca
2019-20, 77%
2020-21, 77%
2021-22, 75%
Spec. Call Centres
2019-20, 67%
2020-21, 76%
2021-22, 64%, significantly lower than previous wave
1 800 O-Canada
2019-20, 79%
2020-21, 79%, small sample size
2021-22, 47%, significantly lower than previous wave
MSCA
2019-20, 76%
2020-21, 83%
2021-22, 68%, significantly lower than previous wave
eServiceCanada
2020-21, 88%
2021-22, 83%
Seniors (60+) 27%
In-person
2019-20, 84%
2020-21, 83%
2021-22, 81%
Canada.ca
2019-20, 70%
2020-21, 78%
2021-22, 70%, significantly lower than total, significantly lower than previous wave
Spec. Call Centres
2019-20, 63%
2020-21, 75%
2021-22, 70%
1 800 O-Canada
2019-20, 67%
2020-21, 65%
2021-22, 68%
MSCA
2019-20, 74%
2020-21, 71%
2021-22, 72%
eServiceCanada
2020-21, 72%
2021-22, 74%
OLMC 4%
In-person
2019-20, 89%
2020-21, 88%
2021-22, 88%
Canada.ca
2019-20, 83%
2020-21, 83%
2021-22, 80%
Spec. Call Centres
2019-20, 82%
2020-21, 68%, small sample size
2021-22, 74%, small sample size
1 800 O-Canada
2019-20, 78%
MSCA
2019-20, 89%
2020-21, 88%, small sample size
Non E or F speaking 2%
In-person
2019-20, 91%
2020-21, 99%, small sample size
2021-22, 81%, significantly lower than previous wave
Canada.ca
2019-20, 80%
2020-21, 83%
2021-22, 79%
Spec. Call Centres
2019-20, 80%
2020-21, 96%
1 800 O-Canada
2019-20, 82%
MSCA
2019-20, 67%
High school or less 31%
In-person
2019-20, 88%
2020-21, 80%
2021-22, 78%
Canada.ca
2019-20, 74%
2020-21, 79%
2021-22, 72%, significantly lower than previous wave
Spec. Call Centres
2019-20, 64%
2020-21, 74%
2021-22, 67%, significantly lower than previous wave
1 800 O-Canada
2019-20, 73%
2020-21, 80%
2021-22, 60%, significantly lower than previous wave
MSCA
2019-20, 77%
2020-21, 78%
2021-22, 71%
eServiceCanada
2020-21, 83%
2021-22, 83%
Indigenous 6%
In-person
2019-20, 84%
2020-21, 77%
2021-22, 71%, significantly lower than total
Canada.ca
2019-20, 65%
2020-21, 73%
2021-22, 69%
Spec. Call Centres
2019-20, 63%
2020-21, 73%
2021-22, 62%, significantly lower than previous wave
1 800 O-Canada
2019-20, 52%
2020-21, 83%
2021-22, 56%, significantly lower than previous wave
MSCA
2019-20, 76%
2020-21, 73%
2021-22, 78%
eServiceCanada
2020-21, 89%
2021-22, 75%, significantly lower than previous wave
Clients with disabilities 8%
In-person
2019-20, 80%
2020-21, 67%
2021-22, 70%, significantly lower than total
Canada.ca
2019-20, 73%
2020-21, 62%
2021-22, 54%, significantly lower than total, significantly lower than previous wave
Spec. Call Centres
2019-20, 66%
2020-21, 60%
2021-22, 57%, significantly lower than total
1 800 O-Canada
2019-20, 70%
2020-21, 48%
2021-22, 51%
MSCA
2019-20, 69%
2020-21, 56%
2021-22, 68%, significantly higher than previous wave
eServiceCanada
2020-21, 71%
2021-22, 70%
Remote 2%
In-person
2019-20, 89%
2020-21, 82%
2021-22, 88%
Canada.ca
2019-20, 76%
2020-21, 74%
2021-22, 82%, significantly higher than previous wave
Spec. Call Centres
2019-20, 71%
2020-21, 72%
2021-22, 75%
1 800 O-Canada
2019-20, 74%
2020-21, 80%, small sample size
2021-22, 79%, significantly higher than total, small sample size
MSCA
2019-20, 89%
2020-21, 68%
2021-22, 66%
eServiceCanada
2020-21, 73%
2021-22, 63%, significantly lower than total
Urban 58%
In-person
2019-20, 85%
2020-21, 89%
2021-22, 80%, significantly lower than previous wave
Canada.ca
2019-20, 73%
2020-21, 79%
2021-22, 76%
Spec. Call Centres
2019-20, 62%
2020-21, 72%
2021-22, 68%
1 800 O-Canada
2019-20, 71%
2020-21, 71%
2021-22, 57%, significantly lower than previous wave
MSCA
2019-20, 73%
2020-21, 75%
2021-22, 72%
eServiceCanada
2020-21, 84%
2021-22, 74%, significantly lower than previous wave
Rural 38%
In-person
2019-20, 87%
2020-21, 80%
2021-22, 83%
Canada.ca
2019-20, 73%
2020-21, 77%
2021-22, 70%, significantly lower than previous wave
Spec. Call Centres
2019-20, 60%
2020-21, 73%
2021-22, 64%, significantly lower than previous wave
1 800 O-Canada
2019-20,65%
2020-21, 74%
2021-22, 57%, significantly lower than previous wave
MSCA
2019-20, 77%
2020-21, 74%
2021-22, 69%
eServiceCanada
2020-21, 80%
2021-22, 79%
E-vulnerable 15%
In-person
2019-20, 85%
2020-21, 79%
2021-22, 83%
Canada.ca
2019-20, 67%
2020-21, 74%
2021-22, 63%, significantly lower than total, significantly lower than previous wave
Spec. Call Centres
2019-20, 70%
2020-21, 74%
2021-22, 70%
1 800 O-Canada
2019-20, 69%
2020-21, 75%, small sample size
2021-22, 61%, significantly lower than previous wave
MSCA
2019-20, 74%
2020-21, 68%
2021-22, 58%, significantly lower than total
eServiceCanada
2020-21, 73%
2021-22, 68%
Newcomers (3 years or fewer) 18%
In-person
2019-20, 88%
2020-21, 95%
2021-22, 88%, significantly higher than total, significantly lower than previous wave
Canada.ca
2019-20, 86%
2020-21, 89%
2021-22, 87%, significantly higher than total
Spec. Call Centres
2019-20, 77%
2020-21, 87%
2021-22, 85%, significantly higher than total
1 800 O-Canada
2019-20, 83%
MSCA
2019-20, 69%
2020-21, 84%
eServiceCanada
2020-21, 92%, small sample size
2021-22, 90%, significantly higher than total
Language barrier 6%
In-person
2020-21, 55%, small sample size
2021-22, 51%, significantly lower than total
Canada.ca
2020-21, 44%
2021-22, 46%, significantly lower than total
Spec. Call Centres
2020-21, 32%, small sample size
2021-22, 39%, significantly lower than total
1 800 O-Canada
2020-21, 31%
MSCA
2020-21, 42%
2021-22, 49%, significantly lower than total
eServiceCanada
2020-21, 53%
2021-22, 53%, significantly lower than total, small sample size
Mobile only 10%
In-person
2019-20, 90%
2020-21, 85%
2021-22, 87%, significantly higher than total
Canada.ca
2019-20, 63%
2020-21, 71%
2021-22, 76%
Spec. Call Centres
2019-20, 67%
2020-21, 77%
2021-22, 72%
1 800 O-Canada
2019-20, 54%
2020-21, 66%
2021-22, 67%
MSCA
2019-20, 95%
2020-21, 78%
2021-22, 72%
eServiceCanada
2020-21, 86%, small sample size
2021-22, 78%
No devices 3%
In-person
2019-20, 81%
2020-21, 75%
2021-22, 80%
Canada.ca
2019-20, 44%
2020-21, 75%, small sample size
2021-22, 51%, significantly lower than total, significantly lower than previous wave
Spec. Call Centres
2019-20, 71%
2020-21, 70%
2021-22, 40%, significantly lower than total, significantly lower than previous wave
1 800 O-Canada
2019-20, 77%
2020-21, 85%, small sample size
2021-22, 71%, small sample size
Clients with restrictions 45%
In-person
2019-20, 80%
2020-21, 82%
2021-22, 76%, significantly lower than total, significantly lower than previous wave
Canada.ca
2019-20, 70%
2020-21, 71%
2021-22, 63%, significantly lower than total, significantly lower than previous wave
Spec. Call Centres
2019-20, 61%
2020-21, 68%
2021-22, 60%, significantly lower than total, significantly lower than previous wave
1 800 O-Canada
2019-20, 55%
2020-21, 72%
2021-22, 47%, significantly lower than total, significantly lower than previous wave
MSCA
2019-20, 65%
2020-21, 69%
2021-22, 62%, significantly lower than total, significantly lower than previous wave
eServiceCanada
2020-21, 83%
2021-22, 71%, significantly lower than previous wave
Racialized 37%
In-person
2020-21, 92%
2021-22, 85%, significantly lower than previous wave
Canada.ca
2020-21, 85%
2021-22, 79%, significantly higher than total, significantly lower than previous wave
Spec. Call Centres
2020-21, 80%
2021-22, 71%, significantly lower than previous wave
1 800 O-Canada
2020-21, 82%
2021-22, 63%, significantly lower than previous wave
MSCA
2020-21, 81%
2021-22, 81%, significantly higher than total
eServiceCanada
2020-21, 88%
2021-22, 83%
OLMC
Official Language Minority Communities
*small sample size. Results should be interpreted with caution. **sample sizes too small for reporting.
Base: All answering (n=varies)
Proportion of Clients with Disabilities: Overall and by Program
Fewer than one in ten identified as a person with a disability, consistent with previous years. CPP-D clients remain most likely, OAS/GIS and CPP clients also have a higher presence of disability compared to the proportion among all clients, while SIN clients have a lower proportion.
Compared to 2020-21, the proportion of OAS/GIS clients who identified as a person with a disability decreased.
Figure long description
Have a Disability (% Yes) – Trending
Total
2018-19, n=4401, 9%
2019-20, n=2431, 7%
2020-21, n=4200, 8%
2021-22, n=4200, 8%
EI
2018-19, n=4401, 6%
2019-20, n=2431, 5%
2020-21, n=4200, 6%
2021-22, n=4200, 7%
CPP
2018-19, n=4401, 16%
2019-20, n=2431, 7%
2020-21, n=4200, 11%
2021-22, n=4200, 12%, significantly higher than total
CPPD
2018-19, n=4401, 92%
2019-20, n=2431, 83%
2020-21, n=4200, 84%
2021-22, n=4200, 83%, significantly higher than total
SIN
2018-19, n=4401, 3%
2019-20, n=2431, 3%
2020-21, n=4200, 3%
2021-22, n=4200, 3%, significantly lower than total
OAS/GIS
2018-19, n=4401, 19%
2019-20, n=2431, 17%
2020-21, n=4200, 15%
2021-22, n=4200, 11%, significantly higher than total, significantly lower than previous wave
Q44A. Do you identify as a person with a disability?
Base: All respondents (n=4200)
Type of Disability: Overall and by Program
The most common disability was a mobility restriction, followed by mental health-related and cognitive disabilities. The proportion of clients who reported having a mobility restriction decreased compared to 2020-21, while the proportion who have a mental health-related or cognitive disability increased.
CPP, CPP-D and OAS/GIS clients were more likely to have a mobility disability, while CPP-D clients were also more likely to have a mental health-related disability and OAS/GIS clients were also more likely to have a hearing or seeing disability. Compared to 2020-21, OAS/GIS clients were more likely to have reported having a mental health-related or cognitive disability and less likely to have reported a seeing disability.
Figure long description
Type of Disability
Mobility (such as flexibility, dexterity, or pain)
Total
2020-21, n=916, 50%
2021-22, 45%, significantly lower than previous wave
EI
2020-21, n=83, 38%
2021-22, n=66, 35%
CPP
2020-21, n=95, 65%
2021-22, n=92, 64%, significantly higher than total
CPPD
2020-21, n=592, 55%
2021-22, n=628, 56%, significantly higher than total
OAS/GIS
2020-21, n=123, 72%
2021-22, n=126, 61%, significantly higher than total
Mental health-related
Total
2020-21, n=916, 21%
2021-22, 27%, significantly higher than previous wave
EI
2020-21, n=83, 22%
2021-22, n=66, 31%
CPP
2020-21, n=95, 13%
2021-22, n=92, 16%, significantly lower than total
CPPD
2020-21, n=592, 30%
2021-22, n=628, 35%, significantly higher than total
OAS/GIS
2020-21, n=123, 2%
2021-22, n=126, 18%, significantly lower than total, significantly higher than previous wave
Cognitive (such as learning, developmental, or memory)
Total
2020-21, n=916, 13%
2021-22, 18%, significantly higher than previous wave
EI
2020-21, n=83, 19%
2021-22, n=66, 25%
CPP
2020-21, n=95, 14%
2021-22, n=92, 11%
CPPD
2020-21, n=592, 16%
2021-22, n=628, 15%
OAS/GIS
2020-21, n=123, 2%
2021-22, n=126, 8%, significantly lower than total, significantly higher than previous wave
Hearing
Total
2020-21, n=916, 9%
2021-22, 8%
EI
2020-21, n=83, 10%
2021-22, n=66, 7%
CPP
2020-21, n=95, 11%
2021-22, n=92, 9%
CPPD
2020-21, n=592, 5%
2021-22, n=628, 3%, significantly lower than total
OAS/GIS
2020-21, n=123, 10%
2021-22, n=126, 14%, significantly higher than total
Communicating
Total
2020-21, n=916, 2%
2021-22, 5%, significantly lower than previous wave
EI
2020-21, n=83, 1%
2021-22, n=66, 2%
CPP
2020-21, n=95, 1%
2021-22, n=92, 5%
CPPD
2020-21, n=592, 3%
2021-22, n=628, 4%
OAS/GIS
2020-21, n=123, 1%
2021-22, n=126, 1%, significantly lower than total
Seeing
Total
2020-21, n=916, 8%
2021-22, 4%, significantly lower than previous wave
EI
2020-21, n=83, 5%
CPP
2020-21, n=95, 6%
2021-22, n=92, 7%
CPPD
2020-21, n=592, 6%
2021-22, n=628, 4%
OAS/GIS
2020-21, n=123, 19%
2021-22, n=126, 8%, significantly higher than total, significantly lower than previous wave
Q46A. What type of disability do you have?
Base: Have a disability (n=935)
**sample sizes too small for reporting.
Clients with Disabilities
Clients who identified as a person with a disability had lower overall satisfaction compared to all clients and were less satisfied compared to 2020-21.
Clients with disabilities were less satisfied with the service provided in-person, online and through specialized call centres.
Compared to 2020-21, clients with disabilities provided lower ratings for the quality of service provided online and higher ratings for the service provided through MSCA.
Figure long description
Overall Satisfaction (% Rated 4 or 5)
2018-19, 79%
2019-20, 76%
2020-21, 76%
2021-22, 69%, significantly lower than total, significantly lower than previous wave
Figure long description
Service Channel Satisfaction (% Rated 4 or 5)
In person
2018-19, 79%
2019-20, 80%
2020-21, 67%
2021-22, 70%, significantly lower than total
Online
2018-19, 71%
2019-20, 73%
2020-21, 62%
2021-22, 54%, significantly lower than total, significantly lower than previous wave
Specialized Call Centre
2018-19, 69%
2019-20, 66%
2020-21, 60%
2021-22, 57%, significantly lower than total
1 800 O-Canada
2018-19, 50%
2019-20, 70%
2020-21, 48%, small sample size
2021-22, 51%
My Service Canada Account
2019-20, 69%
2020-21, 56%
2021-22, 68%, significantly higher than previous wave
eServiceCanada
2020-21, 71%
2021-22, 70%
*small sample size. Results should be interpreted with caution.
There were also many significant gaps in service attributes between clients with disabilities and clients overall. The largest gaps were for the ease of finding information on the program including figuring out eligibility, the steps to apply, what information they needed to provide when applying and information on the program as well as the ease of putting together the information needed to apply.
Compared to 2021-22, ratings have declined across several measures. The largest declines were observed for ease of finding out the steps to apply, the timeliness of service, the ease of figuring out eligibility and the ease of finding out what information they needed to provide when applying.
Figure long description
WIDEST GAP VS. TOTAL & CHANGE VS. 2020-21 IN SERVICE ATTRIBUTES (% RATED 4 OR 5)
Ease of figuring out eligibility
2021-22, 48%, significantly lower than total, significantly lower than previous wave
GAP vs Total,-26 pts
2020-21, 66%
Ease of finding out the steps to apply
2021-22, 54%, significantly lower than total, significantly lower than previous wave
GAP vs Total, -22 pts
2020-21, 66%
Ease of finding out what information you need to provide when applying
2021-22, 56%, significantly lower than total, significantly lower than previous wave
Gap vs Total-20 pts
2020-21, 64%
Ease of finding information about the program
2021-22, 59%, significantly lower than total
Gap vs Total-19 pts
2020-21, 62%
Ease of putting together the information need to apply
2021-22, 61%, significantly lower than total, significantly lower than previous wave
Gap vs Total-19 pts
2020-21, 68%
Being able to complete steps online made the process easier
2021-22, 59%, significantly lower than total
Gap vs Total, -19 pts
2020-21, 57%
Able to move smoothly through all steps
2021-22, 66%, significantly lower than total
Gap vs Total-16 pts
2020-21, 68%
Overall, it was easy to apply
2021-22, 69%, significantly lower than total, significantly lower than previous wave
Gap vs Total, -16 pts
2020-21, 75%
You were able to find the information you needed (during aware stage) within a reasonable amount of time
2021-22, 60%, significantly lower than total, significantly lower than previous wave
Gap vs Total, -14 pts
2020-21, 66%
It was clear what to do if you had a problem or question
2021-22, 63%, significantly lower than total
Gap vs Total, -13 pts
2020-21, 65%
You were confident that any issues or problems would have been easily resolved
2021-22, 60%, significantly lower than total, significantly lower than previous wave
Gap vs Total, -13 pts
2020-21, 67%
You needed to explain your situation only once
2021-22, 61%, significantly lower than total
Gap vs Total, -13 pts
2020-21, 63%
The amount of time, from start to finish, was reasonable
2021-22, 63%, significantly lower than total, significantly lower than previous wave
Gap vs Total, -12 pts
2020-21, 72%
Clients with Disabilities: Overall Satisfaction by Program
Among clients with disabilities, CPP clients were more likely to be satisfied while CPP-D clients were less likely to be satisfied compared to all clients with disabilities.
Compared to 2020-21, satisfaction decreased among OAS/GIS clients with disabilities.
Figure long description
Have a disability (% Rated 4 or 5) – Trending
EI
2017-18, 59%
2018-19, 82%
2018-20, 74%
2020-21, 76%
2021-22, 64%
CPP
2017-18, 69%
2018-19, 79%
2018-20, 76%
2020-21, 83%
2021-22, 81%, significantly higher than total
CPPD
2017-18, 49%
2018-19, 62%
2018-20, 58%
2020-21, 63%
2021-22, 60%, significantly lower than total
SIN
2017-18, 81%
2018-19, 84%
2018-20, 100%
OAS/GIS
2018-19, 86%
2018-20, 88%
2020-21, 85%
2021-22, 75%, significantly lower than previous wave
**sample sizes among SIN clients was too small for reporting in 2020-21 and 2021-22.
Note: Q44A wording was revised starting 2019-20 as well as the types of disabilities listed were also expanded. Interpret tracking results with caution.
Q44A. Do you identify as a person with a disability?
Base: All respondents
Indigenous Clients
Overall satisfaction among Indigenous clients was consistent compared to all clients and compared to 2020-21.
Indigenous clients were less satisfied with the service provided in person compared to all clients.
Compared to 2020-21, Indigenous clients provided lower ratings for the quality of service provided through specialized call centres, 1 800 O-Canada and eServiceCanada.
Figure long description
Overall Satisfaction (R% Rated 4 or 5)
Total
2017-18, 79%
2018-19, 85%
2019-20, 79%
2020-21, 83%
2021-22, 80%
Urban
2018-19, 82%
2019-20, 73%
2020-21, 88%
2021-22, 80%
Rural
2018-19, 86%
2019-20, 82%
2020-21, 80%
2021-22, 79%
Remote
2018-19, 93%
2019-20, 75%
2020-21, 87%
2021-22, 88%
Figure long description
Service Channel Satisfaction (% Rated 4 or 5)
In person
2017-18, 77%
2018-19, 87%
2019-20, 84%
2020-21, 77%
2021-22, 71%, significantly lower than total
Online
2017-18, 75%
2018-19, 82%
2019-20, 65%
2020-21, 73%
2021-22, 69%
Specialized Call Centres
2017-18, 77%
2018-19, 78%
2019-20, 63%
2020-21, 73%
2021-22, 62%, significantly lower than previous wave
1 800 O-Canada
2017-18, 68%
2018-19, 71%
2019-20, 52%
2020-21, 83%, small sample size
2021-22, 56%, significantly lower than previous wave
My Service Canada Account
2019-20, 76%
2020-21, 73%
2021-22, 78%
eServiceCanada
2020-21, 87%, small sample size
2021-22, 75%, significantly lower than previous wave
Figure long description
Profile of Indigenous clients
First nations
2018-19, 58%
2019-20, 78%
2020-21, 62%
2021-22, 61%
Metis
2018-19, 34%
2019-20, 16%
2020-21, 32%
2021-22, 33%
Inuit
2018-19, 10%
2019-20, 6%
2020-21, 6%
2021-22, 5%
*small sample size. Results should be interpreted with caution.
Base: Indigenous clients (n=460)
Indigenous clients provided lower ratings on several service attributes compared to all clients. The largest gaps were for the helpfulness of 1 800 O-Canada reps, the respectfulness of 1 800 O-Canada and in-person reps and the ease of finding out what information they needed to provide when applying.
Compared to 2020-21, Indigenous clients provided lower ratings across a number of service attributes. The largest declines were observed for the helpfulness of 1 800 O-Canada reps, the ease of follow-up and the timeliness of service.
Figure long description
Widest Gap Vs. Total & Change Vs. 2020-21 In Service Attributes (% Rated 4 Or 5)
1 800 O-Canada phone representatives were helpful
2021-22, 50%, significantly lower than total, significantly lower than previous wave
Gap vs Total, -28 pts
2020-21, 84%
1 800 O-Canada phone representatives were respectful
2021-22, 75%, significantly lower than total
Gap vs Total, -11 pts
2020-21, N/A
Service Canada representatives that you dealt with in person were respectful
2021-22, 82%, significantly lower than total
Gap vs Total, -10 pts
2020-21, N/A
Ease of finding out what information you need to provide when applying
2021-22, 67%, significantly lower than total
Gap vs Total, -9 pts
2020-21, 72%
Ease of understanding the requirements of the application
2021-22, 74%, significantly lower than total
Gap vs Total, -8 pts
2020-21, 79%
Ease of putting together the information you needed to provide when applying
2021-22, 73%, significantly lower than total
Gap vs Total, -7 pts
2020-21, 77%
Able to move smoothly through all steps
2021-22, 75%, significantly lower than total, significantly lower than previous wave
Gap vs Total, -7 pts
2020-21, 82%
You needed to explain your situation only once
2021-22, 67%, significantly lower than total, significantly lower than previous wave
Gap vs Total, -7 pts
2020-21, 77%
Service Canada specialized call centre phone representatives were helpful
2021-22, 75%, significantly lower than total
Gap vs Total, -7 pts
2020-21, 83%
You received consistent information
2021-22, 72%, significantly lower than total, significantly lower than previous wave
Gap vs Total, -7 pts
2020-21, 77%
The amount of time, from start to finish, was reasonable
2021-22, 68%, significantly lower than total, significantly lower than previous wave
Gap vs Total, -7 pts
2020-21, 79%
Ease of follow-up
2021-22, 52%, lower than previous wave
Gap vs Total, -3 pts
2020-21, 68%
It was clear what would happen next and when it would happen
2021-22, 70%, significantly lower than previous wave
Gap vs Total, -4 pts
2020-21, 80%
Base: Indigenous clients (n=460)
Qualitative Insights from Indigenous Clients
Indigenous participants’ service experiences tended to be similar to those of other clients in the same program. However, awareness of programs was low and interest in receiving additional resources and supports specifically for clients who are Indigenous was high.
Many were satisfied with their service experiences and provided feedback consistent with non-Indigenous participants who had applied to the same programs.
A specific question was posed about use of resources and supports, such as friendship centres and Indigenous Skills and Employment Training Program. Awareness of these resources was low, while interest in learning more about them, and using them to support them in the application process was high.
I’m aware of the Friendship Centre in Regina. However, I was not aware that they would provide support to do this work, or to do the submission. The first one you mentioned, Indigenous Employment, yes, that would definitely be an interest in me. More promotion of the program through whatever means, including through our employers at the First Nations. That definitely had I known about it, would definitely have made me feel a bit better.
No, I didn’t consider it. I wasn’t aware they did that. But I think it would be good if somebody would let people know that they have, there is access to those places to fill out their forms and getting your first-time pension. There’s a little newspaper that goes to the communities that’s run from Whitehorse, if they put those in there, because everybody looks forward to their little newspaper because there’s nothing much to do. And through the First Nations offices, like just a little letter from whoever sent to the Band offices, like the First Nations offices.
Urban, Rural and Remote Clients
Overall satisfaction was consistent among urban, rural or remote clients compared to all clients and has decreased compared to 2020-21 among all groups.
Urban and remote clients were more satisfied with online service, while rural clients were less satisfied. Remote clients were also more satisfied with in-person service and through 1 800 O-Canada.
Compared to 2020-21, urban clients provided lower ratings for the quality of service provided in-person, through 1 800 O-Canada and eServiceCanada. Rural clients provided lower ratings for the service provided online, through specialized call centres and 1 800 O-Canada, while remote clients provided higher ratings for the service provided in-person or online.
Figure long description
Overall Satisfaction (% Rated 4 or 5)
Urban
2018-19, 86%
2019-20, 85%
2020-21, 86%
2021-22, 81%, significantly lower than previous wave
Rural
2018-19, 83%
2019-20, 82%
2020-21, 85%
2021-22, 80%, significantly lower than previous wave
Remote
2018-19, 88%
2019-20, 80%
2020-21, 88%
2021-22, 81%, significantly lower than previous wave
Figure long description
Service Channel Satisfaction (% rated 4 or 5)
In person
Urban
2018-19, 88%
2019-20, 85%
2020-21, 89%
2021-22, 80%, significantly lower than previous wave
Rural
2018-19, 85%
2019-20, 87%
2020-21, 80%
2021-22, 83%
Remote
2018-19, 87%
2019-20, 89%
2020-21, 82%
2021-22, 88%, significantly higher than total, significantly higher than previous wave
Online
Urban
2018-19, 78%
2019-20, 73%
2020-21, 79%
2021-22, 76%, significantly higher than total
Rural
2018-19, 81%
2019-20, 73%
2020-21, 77%
2021-22, 70%, significantly lower than total, significantly lower than previous wave
Remote
2018-19, 80%
2019-20, 76%
2020-21, 74%
2021-22, 82%, significantly higher than total, significantly higher than previous wave
Specialized Call Centres
Urban
2018-19, 73%
2019-20, 62%
2020-21, 72%
2021-22, 68%
Rural
2018-19, 76%
2019-20, 60%
2020-21, 73%
2021-22, 64%, significantly lower than previous wave
Remote
2018-19, 79%
2019-20, 71%
2020-21, 72%
2021-22, 75%
1 800 O-Canada
Urban
2018-19, 70%
2019-20, 71%
2020-21, 71%
2021-22, 57%, significantly lower than previous wave
Rural
2018-19, 76%
2019-20, 65%
2020-21, 74%
2021-22, 57%, significantly lower than previous wave
Remote
2018-19, 69%
2019-20, 74%
2020-21, 80%, small sample size
2021-22, 79%, significantly lower than total, small sample size
My Service Canada Account
Urban
2019-20, 73%
2020-21, 75%
2021-22, 72%
Rural
2019-20, 77%
2020-21, 74%
2021-22, 69%
Remote
2019-20, 89%
2020-21, 68%
2021-22, 66%
eServiceCanada
Urban
2020-21, 84%
2021-22, 74%, significantly lower than previous wave
Rural
2020-21, 80%
2021-22, 79%
Remote
2020-21, 73%, small sample size
2021-22, 63%
*small sample size. Results should be interpreted with caution.
Urban clients provided higher ratings for receiving consistent information and being able to move smoothly through all steps compared to all clients. Rural clients provided lower ratings for receiving consistent information, being able to move smoothly through all steps, that it was clear what to do if they had a problem or question and having confidence in the issue resolution process compared to all clients. Remote clients provided lower ratings for clarity of process compared to all clients.
Compared to 2020-21, urban, rural and remote clients all provided lower ratings for the clarity of process and timeliness of service. Urban and rural clients also provided lower ratings for receiving consistent information and confidence in issue resolution. Urban clients also provided lower ratings for the ease of understanding information about the program, while rural clients also provided lower ratings for being able to move smoothly through all steps and clarity of the issue resolution process. Remote clients provided higher ratings for the ease of finding information on the program and the steps to apply, the ease of putting together the information they needed to apply and the clarity of and confidence in the issue resolution process.
Figure long description
WIDEST GAP VS. TOTAL & CHANGE VS. 2020-21 IN SERVICE ATTRIBUTES (% RATED 4 OR 5)
Throughout the process it was clear what would happen next and when
Urban
2018-19, 75%
2019-20, 73%
2020-21, 80%
2021-22, 74%, significantly lower than previous wave
Rural
2018-19, 79%
2019-20, 74%
2020-21, 81%
2021-22, 73%, significantly lower than previous wave
Remote
2018-19, 79%
2019-20, 68%
2020-21, 77%
2021-22, 68%, significantly lower than total, significantly lower than previous wave
The amount of time it took was reasonable
Urban
2018-19, 76%
2019-20, 78%
2020-21, 81%
2021-22, 75%, significantly lower than previous wave
Rural
2018-19, 77%
2019-20, 80%
2020-21, 82%
2021-22, 74%, significantly lower than previous wave
Remote
2018-19, 75%
2019-20, 77%
2020-21, 84%
2021-22, 73%, significantly lower than previous wave
You received consistent information
Urban
2018-19, 81%
2019-20, 81%
2020-21, 85%
2021-22, 81%, significantly higher than total, significantly lower than previous wave
Rural
2018-19, 82%
2019-20, 80%
2020-21, 84%
2021-22, 77%, significantly lower than total, significantly lower than previous wave
Remote
2018-19, 84%
2019-20, 77%
2020-21, 81%
2021-22, 80%
Ease of finding information about the program
Urban
2019-20, 77%
2020-21, 81%
2021-22, 79%
Rural
2019-20, 79%
2020-21, 71%
2021-22, 75%
Remote
2019-20, 84%
2020-21, 72%
2021-22, 80%, significantly higher than previous wave
Ease of understanding information about the program
Urban
2019-20, 75%
2020-21, 80%
2021-22, 75%, significantly lower than previous wave
Rural
2019-20, 78%
2020-21, 74%
2021-22, 72%
Remote
2019-20, 78%
2020-21, 72%
2021-22, 76%
Ease of finding out the steps to apply
Urban
2019-20, 82%
2020-21, 80%
2021-22, 77%
Rural
2019-20, 79%
2020-21, 72%
2021-22, 74%
Remote
2019-20, 77%
2020-21, 73%
2021-22, 79%, significantly higher than previous wave
Putting together the information you needed to apply
Urban
2019-20, 80%
2020-21, 83%
2021-22, 81%
Rural
2019-20, 77%
2020-21, 81%
2021-22, 79%
Remote
2019-20, 78%
2020-21, 76%
2021-22, 83%, significantly higher than previous wave
You were able to move smoothly through all of the steps
Urban
2018-19, 83%
2019-20, 83%
2020-21, 85%
2021-22, 84%, significantly higher than total
Rural
2018-19, 85%
2019-20, 81%
2020-21, 84%
2021-22, 78%, significantly lower than total, significantly lower than previous wave
Remote
2018-19, 88%
2019-20, 81%
2020-21, 88%
2021-22, 84%
It was clear what to do if you had a problem or question
Urban
2018-19, 77%
2019-20, 76%
2020-21, 79%
2021-22, 77%
Rural
2018-19, 78%
2019-20, 80%
2020-21, 79%
2021-22, 73%, significantly lower than total, significantly lower than previous wave
Remote
2018-19, 84%
2019-20, 83%
2020-21, 73%
2021-22, 80%, significantly higher than previous wave
Confident that any issues or problems would have been easily resolved
Urban
2018-19, 79%
2019-20, 79%
2020-21, 78%
2021-22, 75%, significantly lower than previous wave
Rural
2018-19, 76%
2019-20, 76%
2020-21, 75%
2021-22, 71%, significantly lower than total, significantly lower than previous wave
Remote
2018-19, 81%
2019-20, 76%
2020-21, 68%
2021-22, 74%, significantly higher than previous wave
Urban and remote clients provided higher ratings for the ease of getting help on their application compared to all clients, while rural clients provided lower ratings. Rural clients also provided lower ratings for the overall ease of applying and higher ratings for the helpfulness of eServiceCanada reps. Remote clients also provided higher ratings for the helpfulness of 1 800 O-Canada reps.
Compared to 2020-21, urban and rural clients provided lower ratings for the ease of follow-up and helpfulness of 1 800 O-Canada reps. Urban clients also provided lower ratings for traveling a reasonable distance to access service and the helpfulness of eServiceCanada reps, while rural clients also provided lower ratings for the overall ease of applying and the helpfulness of call centre reps (along with remote clients). Remote clients provided higher ratings for traveling a reasonable distance to access service and being provided service in a way that protected them during the pandemic.
Figure long description
Widest Gap Vs. Total & Change Vs. 2020-21 In Service Attributes (% Rated 4 Or 5)
Ease of follow-up
Urban
2019-20, 58%
2020-21, 62%
2021-22, 55%, significantly lower than previous wave
Rural
2019-20, 64%
2020-21, 64%
2021-22, 55%, significantly lower than previous wave
Remote
2019-20, 59%
2020-21, 65%
2021-22, 66%
Overall, it was easy for you to apply
Urban
2018-19, 83%
2019-20, 82%
2020-21, 85%
2021-22, 86%
Rural
2018-19, 87%
2019-20, 86%
2020-21, 86%
2021-22, 82%, significantly lower than total, significantly lower than previous wave
Remote
2018-19, 90%
2019-20, 85%
2020-21, 93%
2021-22, 88%, significantly lower than previous wave
Service Canada specialized call centre phone representatives were helpful
Urban
2019-20, 74%
2020-21, 84%
2021-22, 85%
Rural
2019-20, 71%
2020-21, 85%
2021-22, 80%
Remote
2019-20, 89%
2020-21, 79%
2021-22, 76%
Getting help on your application when you needed it
Urban
2020-21, 66%
2021-22, 67%, significantly higher than total
Rural
2020-21, 61%
2021-22, 59%, significantly lower than total
Remote
2020-21, 68%
2021-22, 71%, significantly higher than total
You travelled a reasonable distance to access the service
Urban
2019-20, 76%
2020-21, 81%
2021-22, 73%, significantly lower than previous wave
Rural
2019-20, 75%
2020-21, 75%
2021-22, 71%
Remote
2019-20, 72%
2020-21, 67%
2021-22, 77%, significantly higher than previous wave
Service Canada phone representatives that called you back after you completed an online form were helpful
Urban
2020-21, 85%
2021-22, 74%, significantly lower than previous wave
Rural
2020-21, 87%
2021-22, 85%, significantly higher than total
Remote
2020-21, 66%
2021-22, 84%
You were provided service in a way that protected your health and safety during the COVID-19 pandemic
Urban
2020-21, 89%
2021-22, 88%
Rural
2020-21, 87%
2021-22, 86%
Remote
2020-21, 76%
2021-22, 86%, significantly higher than previous wave
1 800 O-Canada phone representatives were helpful
Urban
2020-21, 87%
2021-22, 77%, significantly lower than previous wave
Rural
2020-21, 90%
2021-22, 79%, significantly lower than previous wave
Overall satisfaction was higher among seniors compared to all clients and consistent among youth and adults.
Satisfaction has declined among all age groups compared to 2020-21.
Compared to 2020-21, youth and adults were less satisfied with the quality of service provided in person. Youth also provided lower ratings for specialized call centres, 1 800 O-Canada and MSCA, while adults also provided lower ratings for online and eServiceCanada. Seniors provided lower ratings for online.
Figure long description
Overall Satisfaction (% Rated 4 or 5)
Youth (18-30)
2018-19, 86%
2019-20, 84%
2020-21, 85%
2021-22, 79%, significantly lower than previous wave
Adults (31-59)
2018-19, 82%
2019-20, 82%
2020-21, 85%
2021-22, 80%, significantly lower than previous wave
Seniors (60+)
2018-19, 87%
2019-20, 86%
2020-21, 87%
2021-22, 84%, significantly higher than total, significantly lower than previous wave
Figure long description
Service Channel Satisfaction (% Rated 4 or 5)
In person
Youth (18-30)
2018-19, 91%
2019-20, 86%
2020-21, 88%
2021-22, 82%, significantly lower than previous wave
Adults (31-59)
2018-19, 82%
2019-20, 86%
2020-21, 87%
2021-22, 81%, significantly lower than previous wave
Seniors (60+)
2018-19, 88%
2019-20, 84%
2020-21, 83%
2021-22, 81%
Online
Youth (18-30)
2018-19, 81%
2019-20, 77%
2020-21, 77%
2021-22, 75%
Adults (31-59)
2018-19, 80%
2019-20, 72%
2020-21, 79%
2021-22, 75%, significantly lower than previous wave
Seniors (60+)
2018-19, 75%
2019-20, 70%
2020-21, 78%
2021-22, 70%, significantly lower than total, significantly lower than previous wave
Specialized Call Centres
Youth (18-30)
2018-19, 63%
2019-20, 67%
2020-21, 76%
2021-22, 64%, significantly lower than previous wave
Adults (31-59)
2018-19, 77%
2019-20, 58%
2020-21, 69%
2021-22, 66%
Seniors (60+)
2018-19, 80%
2019-20, 63%
2020-21, 75%
2021-22, 70%
1 800 O-Canada
Youth (18-30)
2018-19, 79%
2019-20, 79%
2020-21, 79%, small sample size
2021-22, 47%, significantly lower than previous wave, small sample size
Adults (31-59)
2018-19, 72%
2019-20, 63%
2020-21, 72%
2021-22, 62%
Seniors (60+)
2018-19, 67%
2019-20, 67%
2020-21, 65%
2021-22, 68%
My Service Canada Account
Youth (18-30)
2019-20, 76%
2020-21, 83%
2021-22, 68%, significantly lower than previous wave
Adults (31-59)
2019-20, 76%
2020-21, 74%
2021-22, 71%
Seniors (60+)
2019-20, 74%
2020-21, 71%
2021-22, 72%
eServiceCanada
Youth (18-30)
2020-21, 88%, small sample size
2021-22, 83%
Adults (31-59)
2020-21, 83%
2021-22, 71%, Significantly lower than previous wave
Seniors (60+)
2020-21, 72%
2021-22, 74%
*small sample size. Results should be interpreted with caution.
Compared to all clients, youth and adults provided higher ratings for completing steps online made the process easier. Youth also provided higher ratings for the ease of getting help and lower ratings for the helpfulness of call centre and 1 800 O-Canada reps, while adults provided higher ratings for the helpfulness of 1 800 O-Canada reps. Seniors provided lower ratings for completing steps online made it easier, the ease of getting help and being provided service in a way that protected them during the pandemic and provided higher ratings for traveling a reasonable distance to access service, timeliness of service and ease of follow-up.
Compared to 2020-21, all groups provided lower ratings for clarity of process. Youth and adults also provided lower ratings for the helpfulness of eServiceCanada reps and the timeliness of service, while youth also provided lower ratings for the helpfulness of specialized call centre and 1 800 O-Canada reps and the ease of follow-up. Seniors provided lower ratings for receiving consistent information (along with adults), ease of getting help, confidence in issue resolution and ease of follow-up.
Figure long description
WIDEST GAP VS. TOTAL & CHANGE VS. 2020-21 IN SERVICE ATTRIBUTES (% RATED 4 OR 5)
Completing steps online made the process easier
Youth
2018-19, 89%
2019-20, 86%
2020-21, 85%
2021-22, 85%, significantly higher than total
Adults
2018-19, 80%
2019-20, 79%
2020-21, 83%
2021-22, 82%, significantly higher than total
Seniors
2018-19, 56%
2019-20, 62%
2020-21, 70%
2021-22, 66%, Significantly lower than total
You were able to move smoothly through all of the steps
Youth
2018-19, 86%
2019-20, 82%
2020-21, 85%
2021-22, 84%
Adults
2018-19, 82%
2019-20, 80%
2020-21, 86%
2021-22, 80%, Significantly lower than previous wave
Seniors
2018-19, 84%
2019-20, 85%
2020-21, 83%
2021-22, 82%
You received consistent information
Youth
2018-19, 81%
2019-20, 81%
2020-21, 82%
2021-22, 78%
Adults
2018-19, 81%
2019-20, 78%
2020-21, 86%
2021-22, 80%, significantly lower than previous wave
Seniors
2018-19, 83%
2019-20, 83%
2020-21, 84%
2021-22, 79%, significantly lower than previous wave
It was clear what would happen next and when
Youth
2018-19, 76%
2019-20, 71%
2020-21, 80%
2021-22, 74%, significantly lower than previous wave
Adults
2018-19, 76%
2019-20, 71%
2020-21, 81%
2021-22, 72%, significantly lower than previous wave
Seniors
2018-19, 78%
2019-20, 79%
2020-21, 81%
2021-22, 76%, significantly lower than previous wave
It was easy to get help when you needed it
Youth
2018-19, 84%
2019-20, 80%
2020-21, 76%
2021-22, 73%, significantly higher than totla
Adults
2018-19, 74%
2019-20, 74%
2020-21, 69%
2021-22, 68%
Seniors
2018-19, 73%
2019-20, 73%
2020-21, 70%
2021-22, 64%, significantly lower than total, significantly lower than previous wave
Service Canada specialized call centre reps were helpful
Youth
2019-20, 73%
2020-21, 88%
2021-22, 77%, significantly lower than total, significantly lower than previous wave
Adults
2019-20, 73%
2020-21, 81%
2021-22, 82%
Seniors
2019-20, 75%
2020-21, 88%
2021-22, 86%
The Service Canada phone representatives that called you back after you completed an online form were helpful
Youth
2020-21, 95%
2021-22, 82%, significantly lower than previous wave
Adults
2020-21, 80%
2021-22, 74%, significantly lower than previous wave
Seniors
2020-21, 81%
2021-22, 82%
You were provided service in a way that protected your health and safety during the COVID-19 pandemic
Youth
2020-21, 91%
2021-22, 88%
Adults
2020-21, 89%
2021-22, 89%
Seniors
2020-21, 83%
2021-22, 83%, significantly lower than total
You travelled a reasonable distance to access the service
Youth
2019-20, 70%
2020-21, 83%
2021-22, 70%, significantly lower than previous wave
Adults
2019-20, 79%
2020-21, 77%
2021-22, 73%
Seniors
2019-20, 78%
2020-21, 75%
2021-22, 79%, significantly higher than total
The amount of time it took was reasonable
Youth
2018-19, 77%
2019-20, 76%
2020-21, 80%
2021-22, 73%, significantly lower than previous wave
Adults
2018-19, 72%
2019-20, 74%
2020-21, 82%
2021-22, 73%, significantly lower than previous wave
Seniors
2018-19, 81%
2019-20, 83%
2020-21, 82%
2021-22, 79%, significantly higher than total
Confident any issues would have been easily resolved
Youth
2019-20, 79%
2020-21, 78%
2021-22, 76%
Adults
2019-20, 76%
2020-21, 77%
2021-22, 73%, significantly lower than previous wave
Seniors
2019-20, 78%
2020-21, 76%
2021-22, 71%, significantly lower than previous wave
1 800 O-Canada phone representatives were helpful
Youth
2020-21, 91%
2021-22, 68%, significantly lower than total, significantly lower than previous wave
Adults
2020-21, 88%
2021-22, 86%, significantly higher than total
Seniors
2020-21, 84%
2021-22, 80%
Ease of follow-up
Youth
2019-20, 54%
2020-21, 62%
2021-22, 51%, significantly lower than previous wave
Adults
2019-20, 60%
2020-21, 58%
2021-22, 54%
Seniors
2019-20, 70%
2020-21, 71%
2021-22, 61%, significantly higher than total, significantly lower than previous wave
Satisfaction among e-vulnerable clients was consistent compared to all clients and compared to 2020-21.
E-vulnerable clients were less satisfied with the quality of service provided online and through MSCA compared to all clients and compared to 2020-21 were less satisfied with the service provided online or through 1 800 O-Canada.
Figure long description
Overall Satisfaction (% Rated 4 or 5)
2017-18, 87%
2018-19, 84%
2019-20, 85%
2020-21, 82%
2021-22, 79%
Figure long description
Service Channel Satisfaction (% Rated 4 or 5)
In person
2017-18, 91%
2018-19, 86%
2019-20, 85%
2020-21, 79%
2021-22, 83%
Online
2017-18, 74%
2018-19, 76%
2019-20, 67%
2020-21, 74%
2021-22, 63%, significantly lower than total, significantly lower than previous wave
Specialized Call Centres
2017-18, 83%
2018-19, 68%
2019-20, 70%
2020-21, 74%
2021-22, 70%
1 800 O-Canada
2018-19, 68%
2019-20, 69%
2020-21, 75%
2021-22, 61%, significantly lower than previous wave
My Service Canada Account
2019-20, 74%
2020-21, 68%
2021-22, 58%, significantly lower than total
eServiceCanada
2020-21, 73%
2021-22, 68%
Base: e-Vulnerable clients (n=VARIES)
E-vulnerable clients provided lower ratings across a number of service attributes compared to all clients. The largest gaps were for completing steps online made the process easier, the ease of understanding information about the program, the ease of understanding the requirements of the application and the ease of finding the steps to apply.
Compared to 2020-21, E-vulnerable clients provided lower ratings for the ease of understanding information about the program, the ease of understanding the requirements of the application, being able to find the information they needed in a reasonable time, needing to explain their situation only once, receiving consistent information, timeliness of service and ease of follow-up
Figure long description
Widest Gap Vs. Total & Change Vs. 2020-21 In Service Attributes (% Rated 4 Or 5)
Completing steps online made the process easier
2021-22, 58%, significantly lower than total
Gap vs Total, -20 pts
2020-21, 62%
Ease of understand the info about the program
2021-22, 61%, significantly lower than total, significantly lower than previous wave
Gap vs Total, -13 pts
2020-21, 73%
Ease of understanding the requirements of the application
2021-22, 70%, significantly lower than total, significantly lower than previous wave
Gap vs Total, -12 pts
2020-21, 76%
Ease of finding out the steps to apply
2021-22, 66%, significantly lower than total
Gap vs Total, -10 pts
2020-21, 70%
Able to find the info needed in a reasonable amount of time
2021-22, 65%, significantly lower than total, significantly lower than previous wave
Gap vs Total, -9 pts
2020-21, 75%
You needed to explain your situation only once
2021-22, 69%, significantly lower than total, significantly lower than previous wave
Gap vs Total, -5 pts
2020-21, 79%
You received consistent information
2021-22, 74%, significantly lower than total, significantly lower than previous wave
Gap vs Total, -5 pts
2020-21, 82%
Confident issues would have been easily resolved
2021-22, 81%, significantly lower than total
Gap vs Total, -5 pts
2020-21, 83%
The amount of time it took was reasonable.
2021-22, 72%, significantly lower than previous wave
Gap vs Total, -3 pts
2020-21, 80%
Ease of follow-up
2021-22, 54%, significantly lower than previous wave
Gap vs Total, -1 pt
2020-21, 73%
Base: e-Vulnerable clients (n=VARIES)
Clients with No Devices or Mobile Only
Overall satisfaction was lower among clients with no devices and consistent among those with mobile only compared to all clients. Satisfaction has decreased among clients with no devices compared to 2020-21.
Clients with no devices were less satisfied with the quality of service provided through specialized call centres, while clients with mobile only were more satisfied with the quality of service provided in person.
Figure long description
Overall Satisfaction (% Rated 4 or 5) – Trending
No Devices
2019-19, 83%
2019-20, 81%
2020-21, 80%
2021-22, 71%, significantly lower than total, significantly lower than previous wave
Mobile only
2018-19, 85%
2019-20, 85%
2020-21, 83%
2021-22, 82%
Overall Satisfaction by Channel (% Rated 4 or 5)
In person
No devices
2018-19, 85%
2019-20, 81%
2020-21, 75%
2021-22, 80%, significantly higher than previous wave
Mobile only
2018-19, 85%
2019-20, 90%
2020-21, 85%
2021-22, 87%, significantly higher than total
Online
No devices
2018-19, 62%
2019-20, 44%
2020-21, 75%
2021-22, 51%, significantly lower than total, significantly lower than previous wave, small sample size
Mobile only
2018-19, 84%
2019-20, 63%
2020-21, 71%
2021-22, 76%
Specialized Call Centres
No devices
2018-19, 79%
2019-20, 71%
2020-21, 70%
2021-22, 40%, significantly lower than total, significantly lower than previous wave, small sample size
Mobile only
2018-19, 77%
2019-20, 67%
2020-21, 77%
2021-22, 72%
1 800 O-Canada
No devices
2018-19, 71%
2019-20, 77%
2020-21, 85%, small sample size
2021-22, 71%, small sample size
Mobile only
2018-19, 73%
2019-20, 54%
2020-21, 66%, small sample size
2021-22, 67%
My Service Canada Account
No devices
2019-20, 56%
Mobile only
2019-20, 95%
2020-21, 78%
2021-22, 72%
eServiceCanada
Mobile only
2020-21, 86%, small sample size
2021-22, 78%
*small sample size. Results should be interpreted with caution. **sample sizes too small for reporting.
Base: No device clients (n=varies); Mobile only clients (n=varies)
Clients with no devices provided lower ratings across most service attributes compared to all clients. The largest gaps were that completing steps online made it easier, the ease of finding out the steps to apply, what information you need to provide when applying and the helpfulness of call centre reps. Mobile only clients provider higher ratings for the ease of putting together the information needed to apply, the helpfulness of in-person reps, clarity of process, confidence in issue resolution and ease of getting help. They provided lower ratings for the ease of understanding requirements of the application, ease of completing the application form and that completing steps online made it easier.
Compared to 2020-21, clients with no devices provided lower ratings for the ease of follow-up, receiving consistent information, needing to explain yourself once, ease of getting help and overall ease of applying and provided higher ratings for the helpfulness of 1 800 O-Canada reps. Mobile only clients provided higher ratings across a number of areas of which the largest increases were for the ease of finding information about the program, helpfulness of in-person reps and ease of putting together the information they needed to apply.
Figure long description
WIDEST GAP VS. TOTAL & CHANGE VS. 2020-21 IN SERVICE ATTRIBUTES (% RATED 4 OR 5)
Understand the information about the program
No Devices
2021-22, 57%, significantly lower than total
GAP Vs. Total, -17%
Mobile Only
2021-22, 76%
GAP Vs. Total, +2
Find out the steps to apply
No Devices
2021-22, 53%, significantly lower than ttotal
GAP Vs. Total, -23
Mobile Only
2021-22, 70%
GAP Vs. Total, -6 pts
Find out what information you need to provide when applying for the program
No Devices
2021-22, 56%, significantly lower than total
GAP Vs. Total, -20 pts
Mobile Only
2021-22, 70%
GAP Vs. Total, -6 pts
You were able to complete the application in a reasonable amount of time
No Devices
2021-22, 69%, significantly lower than total
GAP Vs. Total, -12 pts
Mobile Only
2021-22, 80%
GAP Vs. Total, -1 pts
Ease of understanding the requirements of the application
No Devices
2021-22, 64%, significantly lower than total
GAP Vs. Total, -18 pts
Mobile Only
2021-22, 78%, significantly lower than total
GAP Vs. Total, -4 pts
Ease of putting together the information you needed to apply
No Devices
2021-22, 70%, significantly lower than total
GAP Vs. Total, -10 pts
Mobile Only
2021-22, 85%, significantly higher than total, significantly higher than previous wave
GAP Vs. Total, +5 pts
Ease of completing the application form
No Devices
2021-22, 63%, significantly lower than total
GAP Vs. Total, -19 pts
Mobile Only
2021-22, 78%, significantly lwoer than total
GAP Vs. Total, -4 pts
Ease of follow-up
No Devices
2021-22, 39%, significantly lower than total, significantly lower than previous wave
GAP Vs. Total, -16 pts
Mobile Only
2021-22, 57%
GAP Vs. Total, +2 pts
Ease of finding information about the program
No Devices
2021-22, 70%
GAP Vs. Total, -8 pts
Mobile Only
2021-22, 74%, significantly lower than total, significantly higher than previous wave
GAP Vs. Total, -4 pts
Received consistent information
No Devices
2021-22, 69%, significantly lower than total, significantly higher than previous wave
GAP Vs. Total, -10
Mobile Only
2021-22, 83%, significantly higher than previous wave
GAP Vs. Total, +4 pts
Service Canada reps that you dealt with in person were helpful
No Devices
2021-22, 77%, significantly lower than total
GAP Vs. Total, -11 pts
Mobile Only
2021-22, 95%, significantly higher than total, significantly higher than previous wave
GAP Vs. Total, +7 pts
Provided service in your choice of English or French
No Devices
2021-22, 88%, significantly lower than total
GAP Vs. Total, -9 pts
Mobile Only
2021-22, 98%, significantly higher than previous wave
GAP Vs. Total, +1 pts
You were able to move smoothly through all of the steps
No Devices
2021-22, 69%, significantly lower than total
GAP Vs. Total, -13 pts
Mobile Only
2021-22, 80%
GAP Vs. Total, -2 pts
Being able to complete steps online made the process easier for you.
No Devices
2021-22, 37%, significantly lower than total
GAP Vs. Total, -41 pts
Mobile Only
2021-22, 72%, significantly lower than total
GAP Vs. Total, -6 pts
It was clear what would happen next and when it would happen
No Devices
2021-22, 64%, significantly lower than total
GAP Vs. Total, -10
Mobile Only
2021-22, 80%, significantly higher than total, significantly higher than previous wave
GAP Vs. Total, +6 pts
You were confident that any issues or problems would have been easily resolved
No Devices
2021-22, 66%, significantly lower than total
GAP Vs. Total, -7 pts
Mobile Only
2021-22, 81%, significantly higher than total, significantly higher than previous wave
GAP Vs. Total, +8 pts
You needed to explain your situation only once
No Devices
2021-22, 59%, significantly lower than total, significantly lower than previous wave
GAP Vs. Total, -15 pts
Mobile Only
2021-22, 78%, significantly higher than previous wave
GAP Vs. Total, +4 pts
It was easy to get help when you needed it
No Devices
2021-22, 61%, significantly lower than total, significantly lower than previous wave
GAP Vs. Total, -7 pts
Mobile Only
2021-22, 76%, significantly higher than total
GAP Vs. Total, +8 pts
Overall, it was easy for you to apply
No Devices
2021-22, 66%, significantly lower than total, significantly lower than previous wave
GAP Vs. Total, -19 pts
Mobile Only
2021-22, 85%, significantly higher than previous wave
GAP Vs. Total, 0 pts
Service Canada specialized call centre phone representatives were helpful
No Devices
2021-22, 62%, significantly lwoer than total
GAP Vs. Total, -20 pts
Mobile Only
2021-22, 81%, significantly lower than previous wave
GAP Vs. Total, -1 pts
It was easy to access service in a language I could speak and understand well
No Devices
2021-22, 81%, significantly lower than total
GAP Vs. Total, -12 pts
Mobile Only
2021-22, 93%
GAP Vs. Total, 0 pts
1 800 O-Canada phone representatives were helpful
No Devices
2021-22, 96%, significantly higher than total, significantly higher than previous wave
GAP Vs. Total, +18 pts
Mobile Only
2021-22, 68%
GAP Vs. Total, -10 pts
Service Canada call centre phone representatives were respectful
No Devices
2021-22, 73%, significantly lower than total
GAP Vs. Total, -19 pts
Mobile Only
2021-22, 89%
GAP Vs. Total, -3 pts
Base: No device clients (n=varies); Mobile only clients (n=varies)
Access to Service via a Device: Overall
Eight in ten clients (83%) reported owning or having access to a personal computer, 82% reported owning or having access to a smartphone and roughly four in ten (44%) clients reported owning or having access to a tablet. Only 3% of clients neither own nor have access to any devices.
Compared to 2020-21, the proportion of clients who reported owning or having a smartphone has increased.
Figure long description
Own or Have Access to
Personal computer
2021-22, 83%
2020-21, n=4200, 83%
Smartphone
2021-22, 82%, significantly higher than previous wave
2020-21, n=4200, 80%
Tablet
2021-22, 44%
2020-21, n=4200, 45%
No device
2021-22, 3%
2020-21, n=4200, 3%
Q39d. Which of the following do you own or have access to?
Base: All respondents (n=4200)
Clients with a Language Barrier
Overall satisfaction was lower among those with a language barrier compared to all clients and consistent compared to 2020-21.
Clients with a language barrier provided lower ratings for the quality of service provided through all channels and lower ratings on all service attributes compared to all clients.
The largest gaps in service attributes were for the helpfulness of 1 800 O-Canada phone representatives, being able to complete steps online made the process easier, clarity of the issue resolution process, receiving consistent information and that it was clear what would happen next and when.
Compared to 2020-21, there have been no statistically significant shifts in ratings across all service attributes.
Figure long description
Overall Satisfaction (% Rated 4 or 5)
2020-21, n=285, 55%
2021-22, n=277, 53%, significantly lower than total
Figure long description
Service Channel Satisfaction (% Rated 4 or 5)
In person
2020-21, 55%
2021-22, 51%, significantly lower than total
Online
2020-21, 44%
2021-22, 46%, significantly lower than total
Specialized Call Centres
2020-21, 32%
2021-22, 39%, significantly lower than total
1 800 O-Canada
2020-21, 31%
My Service Canada Account
2020-21, 42%
2021-22, 49%, significantly lower than total
eServiceCanada
2020-21, 53%
2021-22, 53%, significantly lower than total, small sample size
*small sample size. Results should be interpreted with caution. **sample sizes too small for reporting.
Base: Language barrier clients
Figure long description
Widest Gap in Service Attributes (% Rated 4 or 5 Vs. Total)
1 800 O-Canada phone representatives were helpful
2021-22, 38%, significantly lower than total
Gap vs Total, -40 pts
2020-21, 42%
Completing steps online made the process easier
2021-22, 41%, significantly lower than total
Gap vs Total, -37 pts
2020-21, 43%
It was clear what to do if you had a problem or question
2021-22, 42%, significantly lower than total
Gap vs Total, -34 pts
2020-21, 39%
You received consistent information
2021-22, 46%, significantly lower than total
Gap vs Total, -33 pts
2020-21, 51%
It was clear what would happen next and when
2021-22, 43%, significantly lower than total
Gap vs Total, -31 pts
2020-21, 40%
Confident any issues would have been easily resolved.
2021-22, 43%, significantly lower than total
Gap vs Total, -30 pts
2020-21, 35%
Able to find the info you needed within reasonable amount of time
2021-22, 44%, significantly lower than total
Gap vs Total, -30 pts
2020-21, 50%
Able to move smoothly through all steps
2021-22, 53%, significantly lower than total
Gap vs Total, -29 pts
2020-21, 48%
It was easy to get help when you needed it
2021-22, 39%, significantly lower than total
Gap vs Total, -29 pts
2020-21, 32%
Overall, it was easy to apply
2021-22, 56%, significantly lower than total
Gap vs Total, -29 pts
2020-21, 52%
Provision of Services in Official Languages
Nearly all clients agreed they were provided service in their choice of English or French, and that it was easy to access service in a language they could speak and understand well.
Compared to 2020-21, agreement has increased for being provided service in their choice of English or French overall and among SIN clients and has decreased for being easy to access service in a language they could speak and understand well overall and among SIN clients, while CPP-D clients were more likely to agree.
Figure long description
Provided with Service in Your Choice of English or French (% Rated 4 or 5)
Total
2017-18, 95%
2018-19, 96%
2019-20, 97%
2020-21, 96%
2021-22, 97%, significantly higher than previous wave
EI
2017-18, 93%
2018-19, 97%
2019-20, 98%
2020-21, 97%
2021-22, 97%
CPP
2017-18, 94%
2018-19, 94%
2019-20, 97%
2020-21, 95%
2021-22, 94%, significantly lower than total
CPPD
2017-18, 87%
2018-19, 93%
2019-20, 95%
2020-21, 92%
2021-22, 94%, significantly lower than total
SIN
2017-18, 96%
2018-19, 95%
2019-20, 95%
2020-21, 96%
2021-22, 98%, significantly higher than previous wave
OAS/GIS
2017-18, 95%
2018-19, 98%
2019-20, 96%
2020-21, 94%
2021-22, 95%, significantly lower than total
Figure long description
Easy to Access Service in a Language I could Speak and Understand Well (% Rated 4 or 5)
Total
2018-19, 94%
2019-20, 94%
2020-21, 95%
2021-22, 93%, significantly lower than previous wave
EI
2018-19, 96%
2019-20, 94%
2020-21, 95%
2021-22, 94%
CPP
2018-19, 92%
2019-20, 95%
2020-21, 92%
2021-22, 93%
CPPD
2018-19, 90%
2019-20, 91%
2020-21, 85%
2021-22, 92%, significantly higher than previous wave
SIN
2018-19, 94%
2019-20, 94%
2020-21, 96%
2021-22, 93%, significantly lower than previous wave
OAS/GIS
2018-19, 92%
2019-20, 94%
2020-21, 93%
2021-22, 91%, significantly lower than total
Q36b. Thinking about the service you received, from getting information about [INSERT ABBREV] to receiving a decision, how much do you agree or disagree with the following statements
Base: All respondents (n=4200)
Official Language Minority Communities
Overall satisfaction among OLMC clients was consistent with all clients and has decreased compared to 2020-21.
More than nine in ten OLMC clients were provided service in their choice of English or French which was consistent compared to all clients
Figure long description
Overall Satisfaction (% Rated 4 or 5)
2017-18, 89%
2018-19, 91%
2019-20, 90%
2020-21, 90%
2021-22, 81%, significantly lower than previous wave
Figure long description
Service Channel Satisfaction (% Rated 4 or 5)
In person
2018-19, 93%
2019-20, 89%
2020-21, 88%, small sample size
2021-22, 88%
Online
2018-19, 87%
2019-20, 83%
2020-21, 83%
2021-22, 80%
Specialized Call Centres
2018-19, 78%
2019-20, 82%
2020-21, 68%, small sample size
2021-22, 74%, small sample size
1 800 O-Canada
2018-19, 58%
2019-20, 78%
My Service Canada Account
2019-20, 89%
2020-21, 88%, small sample size
Figure long description
Provided with Service in Your Choice of English or French (% Agree)
2018-19, 95%
2019-20, 97%
2020-21, 93%
2021-22, 94%
*small sample size. Results should be interpreted with caution. **sample sizes too small for reporting.
Base: OLMC clients
OLMC clients provided lower ratings for the respectfulness of 1 800 O-Canada reps compared to all clients and higher ratings for the ease of deciding the best age to start their pension, the ease of understanding information about the program, the ease of determining eligibility, needing to explain their situation only once and clarity of process.
Compared to 2020-21, OLMC clients provided lower ratings for the timeliness of service, being able to move smoothly through all steps and completing steps online made the process easier.
Figure long description
Widest Gap Vs. Total & Change Vs. 2020-21 In Service Attributes (% Rated 4 Or 5)
1 800 O-Canada phone representatives were respectful
2021-22, 51%, significantly lower than total
Gap vs Total, -35 pts
2020-21, N/A
Ease of deciding the best age to start your pension
2021-22, 96%, significantly higher than total
Gap vs Total, +32 pts
2020-21, 80%
Understand the information about [INSERT PROGRAM]
2021-22, 90%, significantly higher than total
Gap vs Total, +16 pts
2020-21, 79%
Figure out if you are eligible for benefits/ SIN card
2021-22, 86%, significantly higher than total
Gap vs Total, +12 pts
2020-21, 77%
You needed to explain your situation only once
2021-22, 84%, significantly higher than total
Gap vs Total, +10 pts
2020-21, 86%
It was clear what would happen next and when
2021-22, 83%, significantly higher than total
Gap vs Total, +9 pts
2020-21, 88%
Able to move smoothly through all steps
2021-22, 85%, significantly lower than previous wave
Gap vs Total, +3 pts
2020-21, 93%
Completing steps online made the process easier
2021-22, 80%, significantly lower than previous wave
Gap vs Total, +2 pts
2020-21, 88%
The amount of time, from start to finish, was reasonable
2021-22, 75%, significantly lower than previous wave
Gap vs Total, 0 pts
2020-21, 91%
Newcomers (Arrived in Past 3 Years)
Overall satisfaction among newcomers continued to be higher than all clients and results were consistent compared to 2020-21.
Newcomers were more satisfied with the service they received in-person, online, through specialized call centres and eServiceCanada compared to all clients.
Compared to 2020-21, satisfaction decreased for service provided in-person.
Figure long description
Overall Satisfaction (% Rated 4 or 5)
2018-19, 93%
2019-20, 94%
2020-21, 93%
2021-22, 90%, significantly higher than total
Figure long description
Service Channel Satisfaction (% Rated 4 or 5)
In person
2018-19, 96%
2019-20, 88%
2020-21, 95%
2021-22, 88%, significantly higher than total, significantly lower than previous wave
Online
2018-19, 85%
2019-20, 86%
2020-21, 89%
2021-22, 87%, significantly higher than total
Specialized Call Centres
2018-19, 63%
2019-20, 77%
2020-21, 87%, small sample size
2021-22, 85%, significantly higher than total
1 800 O-Canada
2018-19, 79%
2019-20, 83%
My Service Canada Account
2019-20, 69%
2020-21, 84%, small sample size
eServiceCanada
2020-21, 92%, small sample size
2021-22, 90%, significantly higher than total
*small sample size. Results should be interpreted with caution. **sample sizes too small for reporting..
Base: Newcomer clients
Newcomers were also more likely to provide high ratings on several service attributes. The largest gaps were for ease of getting help when needed, ease of follow-up, confidence any issues or problems would have been easily resolved and ease of getting help on their application.
Compared to 2020-21, there have been no statistically significant shifts in ratings across service attributes.
Figure long description
WIDEST GAP VS. TOTAL & CHANGE VS. 2020-21 IN SERVICE ATTRIBUTES (% RATED 4 OR 5)
It was easy to get help when you needed it
2021-22, 86%, significantly higher than total
GAP vs. TOTAL, +18 pts
2020-21, 86%
Ease of follow-up
2021-22, 73%, significantly higher than total
GAP vs. TOTAL, +18 pts
2020-21, 76%
Confident any issues or problems would have been easily resolved
2021-22, 88%, significantly higher than total
GAP vs. TOTAL, +15 pts
2020-21, 86%
Getting help on your application when you needed it
2021-22, 77%, significantly higher than total
GAP vs. TOTAL, +13 pts
2020-21, 82%
It was clear what would happen next and when
2021-22, 86%, significantly higher than total
GAP vs. TOTAL, +12 pts
2020-21, 89%
Ease of figuring out if you are eligible for benefits/ SIN card
2021-22, 86%, significantly higher than total
GAP vs. TOTAL, +12 pts
2020-21, 86%
Ease of putting together the information you needed to apply
2021-22, 90%, significantly higher than total
GAP vs. TOTAL, +10 pts
2020-21, 91%
Able to find the info you needed within a reasonable amount of time
2021-22, 84%, significantly higher than total
GAP vs. TOTAL, +10 pts
2020-21, 89%
Ease of finding out what info you needed to provide when applying
2021-22, 86%, significantly higher than total
GAP vs. TOTAL, +10 pts
2020-21, 87%
Racialized and Black Clients
Overall satisfaction and trust in Service Canada were higher among Racialized clients compared to all clients and consistent among those who identify as ‘Black’ specifically. Satisfaction has decreased among Racialized and Black clients compared to 2020-21.
Racialized clients provided higher ratings for the quality of service provided online and through MSCA, while Black clients provided higher ratings for in-person service and lower ratings for online.
Compared to 2020-21, Racialized and Black clients provided lower ratings for the quality of service provided online and through specialized call centres, while Racialized clients also provided lower ratings for in-person and 1 800 O-Canada.
Figure long description
Overall Satisfaction (% Rated 4 or 5) – Trending
Racialized
2020-21, 89%
2021-22, 84%, significantly higher than total, significantly lower than previous wave
Black
2020-21, 87%
2021-22, 78%, significantly lower than previous wave
Figure long description
Service Channel Satisfaction (% Rated 4 or 5)
In person
Racialized
2020-21, 92%
2021-22, 85%, significantly lower than previous wave
Black
2020-21, 89%, small sample size
2021-22, 89%, significantly higher than toal
Online
Racialized
2020-21, 85%
2021-22, 79%, significantly higher than total, significantly lower than previous wave
Black
2020-21, 81%
2021-22, 63%, significantly lower than total, significantly lower than previous wave
Specialized Call Centres
Racialized
2020-21, 80%
2021-22, 71%, significantly lower than previous wave
Black
2020-21, 75%, small sample size
2021-22, 58%, significantly lower than previous wave, small sample size
1 800 O-Canada
Racialized
2020-21, 82%
2021-22, 63%, significantly lower than previous wave
My Service Canada Account
Racialized
2020-21, 81%
2021-22, 81%, significantly higher than total
Black
2021-22, 62%, small sample size
eServiceCanada
Racialized
2020-21, 88%
2021-22, 83%
Black
2020-21, 85%
2021-22, 82%, small sample size
*small sample size. Results should be interpreted with caution. **sample sizes too small for reporting.
Base: Racialized clients
Racialized clients provided higher ratings across several service attributes. The largest gaps were for the ease of getting help when needed and on the application specifically, confidence in the issue resolution process and ease of finding information about the program.
Compared to 2020-21, Racialized clients provided lower ratings for the timeliness of service and for completing steps online made the process easier.
Figure long description
Widest Gap Vs. Total & Change Vs. 2020-21 In Service Attributes (% Rated 4 Or 5)
It was easy to get help when you needed it
2021-22, 78%, significantly higher than total
GAP Vs. Total, +10 pts
2020-21, 81%
Ease of getting help on your application when you needed it
2021-22, 74%, significantly higher than total
GAP Vs. Total, +10 pts
2020-21, 75%
Confident that any issues or problems would have been easily resolved
2021-22, 82%, significantly higher than total
GAP Vs. Total, +9 pts
2020-21, 83%
Ease of finding information about the program
2021-22, 85%, significantly higher than total
GAP Vs. Total, +7 pts
2020-21, 85%
Able to move smoothly through all of the steps related to your application
2021-22, 88%, significantly higher than total
GAP Vs. Total, +6 pts
2020-21, 90%
It was clear what would happen next and when
2021-22, 80%, significantly higher than total
GAP Vs. Total, +6 pts
2020-21, 83%
Finding out the steps to apply
2021-22, 82%, significantly higher than total
GAP Vs. Total, +6 pts
2020-21, 83%
The amount of time, from start to finish, was reasonable
2021-22, 76%, significantly higher than total, significantly lower than previous wave
GAP Vs. Total, +1 pts
2020-21, 84%
Completing steps online made the process easier
2021-22, 80%, significantly higher than total, significantly lower than previous wave
GAP Vs. Total, +2 pts
2020-21, 87%
Conclusions
The vast majority of Service Canada clientele remain highly satisfied with their overall service experience, however ratings across nearly all aspects of service have declined year over year. Results have largely returned to levels observed prior to the pandemic.
Ratings on overall ease (82% vs. 86%), effectiveness (82% vs. 85%), emotion (73% vs. 77%), timeliness of service (75% vs. 81%) and trust (78% vs. 84%) have decreased compared to last year contributing to the overall decline in satisfaction (81% vs. 86%).
In order to improve satisfaction, the primary focus should be placed on reducing the time the client journey takes. Secondary areas of importance for improvement included the ease of follow-up and confidence in the issue resolution process. These areas represent aspects of service that have the greatest impact on clients’ impressions of their experience, where ratings are weaker relative to other areas.
Reduced satisfaction with the service experience was driven primarily by lower ratings among EI and OAS/GIS clients and lower ratings of the quality of service provided through all Service Canada channels. Timeliness of service and trust have also experienced broad declines and have received lower ratings among clients of most programs.
Overall satisfaction has decreased among EI (76% vs. 84%) and OAS/GIS clients (81% vs. 88%) who provided lower ratings for several aspects of the ease and effectiveness of the process including timeliness of service which is the strongest driver of satisfaction for both programs. Notably, the decline among OAS/GIS clients was driven mostly by lower satisfaction among Non Auto-Enroll clients however ratings have dropped in several areas for both Auto-Enroll and Non Auto-Enroll clients.
While ratings are more consistent among clients of other programs compared to last year, there have also been notable declines in trust for CPP and CPP-D clients, timeliness of service for CPP clients and clarity of process for SIN and CPP clients. Overall, impressions of the service experience remained strongest among SIN clients and weakest among CPP-D clients.
Satisfaction with the quality of service has decreased across all service channels. The in-person experience continued to receive the highest ratings while both telephone channels received the lowest.
This year’s declines were broad in nature, impacting several service measures, all service channels, clients of most programs and nearly all at-risk groups. Clients were also more likely to report having experienced restrictions, most notably accessing service at a Service Canada Centre, while there has also been an increase in the number of clients who have identified as having a mental-health related disability. This evidence suggests that there may be other environmental factors contributing to overall declines (i.e. pandemic fatigue, impact of rising cost of living and labour market disruption).
Service Canada clients provide the highest ratings for the respectfulness of in-person and specialized call centre staff representing a new aspect of service measured this year and a prominent strength. The helpfulness of in-person and specialized call centre staff, confidence in information security and the process’ overall ease and effectiveness were also among the highest rated areas.
The aspects of service that receive the lowest ratings include the ease of follow-up, ease of getting help on the application when needed and ease of getting help in general and ease of deciding the best age to start your pension.
Following the dramatic shifts observed last year, channel use was generally consistent year over year. Clients were more likely to utilize in-person service or assisted self-service across the entire client journey, while fewer used self-service only. Use of in-person service rose but remained considerably lower than in 2019-20 and was utilized slightly more than self-service only this year which saw a decline. Assisted self-service has continued to see gradual increases in usage year-over-year.
When looking at service level by stage of the client journey, clients were more likely to have used in-person service at the apply and follow-up stages compared to last year. Clients were also more likely to have used assisted-self-service at the apply stage and less likely to have used self-service only, while fewer used touchless person-to-person at the follow-up stage.
Online remained the preferred first point of contact for the majority of clients at the aware and apply phases while the telephone is slightly more preferred than online for following up. Use of in-person increased this year as the first point of contact for all stages.
CPP clients were more likely to have used in-person service at all stages of the client journey. SIN clients at the apply stage and EI clients and OAS/GIS clients at the follow-up stage. Use of self-service only also increased among OAS/GIS clients at the follow-up stage, while EI clients were less likely to have used touchless person-to-person at the follow-up stage.
EI and OAS/GIS clients were more likely to have used assisted self-service at the apply stage, while EI clients were less likely to have used self-service only. CPP and CPP-D clients were more likely to have used mail only at the aware stage, while CPP-D were less likely to have used self-service only or touchless person-to-person.
Notably, OAS/GIS clients who were non auto-enrolled relied more heavily on the Government of Canada website when learning about and applying this year but were less satisfied with their experience with the channel. OAS/GIS clients had more difficulty understanding information about the program and figuring out what they need to provide when applying on the GoC website and were less likely to feel completing steps online made the process easier compared to all clients. The increased usage of online observed this year combined with decreased satisfaction likely contributed to the lower overall satisfaction among OAS/GIS clients.
The proportion of clients who self-serve is largely consistent with the historic high observed last year and they continue to provide high ratings for the ease of the online application process. However, satisfaction with MSCA has decreased and use of MSCA has declined among CPP and CPP-D clients who experience more difficulty signing-in while CPP-D clients also have more trouble registering.
Reported ease of completing steps online continues to be strong and consistent after steadily improving for several years, however CPP-D, CPP and OAS/GIS clients experience more difficulty.
MSCA continues to be used by the vast majority of EI and CPP clients, while four in ten CPP-D or OAS/GIS clients report doing so. CPP and CPP-D clients were less likely to have used MSCA than in previous years and notably, ease of registering has declined among EI clients. CPP-D clients found it more difficult to register and sign-in compared to all clients, while CPP clients found it more difficult to sign-in.
The vast majority of those with an existing MSCA found it easy to sign into their account, however only half of clients who registered for their MSCA for the first time found it easy, lower than last year. Among those who had difficulty registering, the most common reasons are because they experienced problems with their personal access code, problems verifying their identity or problems creating their profile.
At-risk client groups continue to be largely satisfied with the service experience however ratings have declined among most year over year. Satisfaction is notably higher among seniors, newcomers, and racialized clients than compared to all clients
Satisfaction was lower compared to all clients among those with a language barrier, clients with disabilities, clients who experienced restrictions to accessing service and clients with no devices.
Overall satisfaction with the service experience declined among most at-risk groups including clients who experienced restrictions accessing our services, clients with no devices, clients with disabilities, remote clients, rural clients, youth, racialized Canadians, seniors and Official Language Minority Communities. All other at-risk groups saw non-statistically significant declines in overall satisfaction.
Clients with a language barrier represent only 6% of clients but continue to be the at-risk group that experience the most difficulty. They provide considerably lower ratings across all aspects of their experience and the largest gaps are for the helpfulness of 1 800 O-Canada phone representatives, being able to complete steps online made the process easier, clarity of the issue resolution process, receiving consistent information and that it was clear what would happen next and when.
University certificate/ diploma below bachelor's level 5%
Bachelor's degree 21%
Post graduate degree 12%
Figure long description
Province/ Region
Province
British Columbia, 15%
Alberta, 9%
Saskatchewan, 3%
Manitoba, 3%
Ontario, 40%
Quebec, 20%
New Brunswick, 3%
Nova Scotia, 3%
Prince Edward Island, 1%
Newfoundland, 3%
Region
Ontario, 40%
West/ Territories 30%
Quebec, 20%
Atlantic, 9%
Figure long description
Service Language Preference
English, 80%
French, 16%
Both, 2%
Other, 0%
Figure long description
Identify as Person with Disabilities
Yes, 8%
No, 91%
Don’t know, <1%
Figure long description
Use of Online Service
Routinely/all the time, 64%
Sometimes, 20%
Rarely, 8%
Never, 8%
Figure long description
Identify as Indigenous
Yes, 6%
No, 94%
Figure long description
Indigenous Groups
First Nations, 4%
Metis, 2%
Inuk, 0%
None of the above, 87%
Don’t know, 6%
Figure long description
Racial/Cultural Group
White, 54%
South Asian, 10%
Black, 8%
Chinese, 5%
Latin American, 4%
Filipino, 3%
Southeast Asian, 2%
Arab, 2%
Indigenous/First Nations, 2%
Other, 1%
Don’t know, 4%
Appendix A – Details on Call Disposition, Background on Drivers’ Analysis and Definition of At-Risk Groups
Call Disposition
Up to seven calls were placed in an effort to reach a selected respondent. The overall response rate achieved was 12% which is consistent compared to the industry average. The response rate was lower than in 2020-21 (16%) and consistent with the response rate achieved in 2019-20 (12%).
Of the 4,200 completed interviews, 3,568 were conducted in English and 617 conducted in French.
The final call outcomes are as follows:
Figure long description
Call Outcome
Call backs, 2652
Completed Interviews, 4200
Disqualified, 1346
Language Barriers, 907
No Answers, 16596
Not In Service (Out of Scope), 4171
Over quota, 34
Refusals, 13882
Terminations, 1455
TOTAL IN SCOPE, 45243
TOTAL RESPONDING, 5546
OVERALL RESPONSE RATE, 12%
Definition of At-Risk Client Groups
Newcomers
Not born in Canada and arrived within the previous 3 years
Non English or French speakers
Identify “other” as preferred language of service
Lower Education
High school or less
Youth
Aged 18 to 30
Seniors
Aged 60 and over
Clients with disabilities
Self-identified
Clients with restrictions
Self-identified
Indigenous people
Self-identified as First Nations, Inuit, or Métis
E-vulnerable
Clients who rarely or never use online services
Mobile only
Self-reported as clients with only a smartphone, no computer or tablet
No devices
Self-reported as clients with no devices (mobile, tablet, computer)
Remote clients
Sample variable
Rural clients
Sample variable
Urban clients
Sample variable
Official language minorities (OLMC)
Clients in Quebec who prefer service in English, and clients outside Quebec who prefer service in French (sample variable and (Q41b)
Language barrier
It was easy to access service in a language I could speak and understand well (Rated 1 or 2)
Racialized
Clients who identify as a racial or cultural group other than White (Can be in addition to also identifying as white)