This public opinion research report presents the results of a telephone survey conducted on behalf of Service Canada with a sample of 4,200 Service Canada clients across the five major programs. The study was conducted between June 9 and July 26, 2023.
It is available upon request in multiple formats (large print, MP3, braille, e-text, DAISY), by contacting 1 800 O-Canada (1-800-622-6232). By teletypewriter (TTY), call 1-800-926-9105.
Service Canada sondage sur l'expérience client 2022-2023
Ce rapport de recherche sur l’opinion publique présente les résultats d’un sondage téléphonique mené pour le compte de Service Canada auprès d’un échantillon de 4 200 clients de Service Canada dans les cinq principaux programmes. L’étude a été menée entre le 9 juin et le 26 juillet 2023.
Ce document offert sur demande en médias substituts (gros caractères, MP3, braille, fichiers de texte, DAISY) auprès du 1 800 O-Canada (1-800-622-6232). Si vous utilisez un téléscripteur (ATS), composez le 1-800-926-9105.
I hereby certify as Senior Officer of Ipsos that the deliverables fully comply with the Government of Canada political neutrality requirements outlined in the Policy on Communications and Federal Identity and the Directive on the Management of Communications. Specifically, the deliverables do not include information on electoral voting intentions, political party preferences, standings with the electorate or ratings of the performance of a political party or its leaders.
Mike Colledge
President
Ipsos Public Affairs
Additional information
Supplier Name: Ipsos Limited Partnership
PSPC Contract Number: CW2303967 (G9292-23-3716)
Contract Award Date: 2023-05-05
Executive Summary
Service Canada CX Survey 2022-23 – Results at a Glance
4,200 interviews conducted (between 750 and 1035 per program)
Methodology: Telephone survey
Fieldwork: June 9 and July 26, 2023
Client experiences that reached initial decision: Jan to Mar 2023
Figure long description
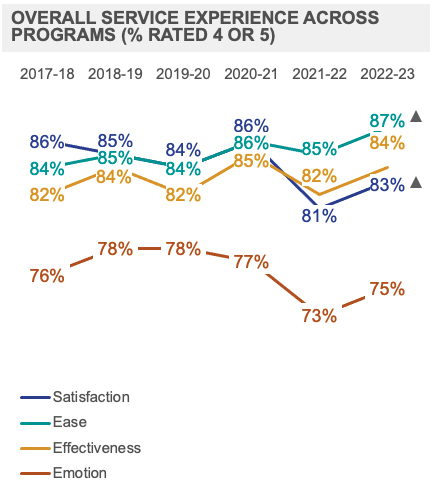
Overall Service Experience Across Programs (% Rated 4 or 5)
Satisfaction
2017-18, 86%
2018-19, 85%
2019-20, 84%
2020-21, 86%
2021-22, 81%
2022-23, 83%, significantly higher than previous wave
Ease
2017-18, 84%
2018-19, 85%
2019-20, 84%
2020-21, 86%
2021-22, 82%
2022-23, 87%, significantly higher than previous wave
Effectiveness
2017-18, 82%
2018-19, 84%
2019-20, 82%
2020-21, 85%
2021-22, 82%
2022-23, 84%
Emotion
2017-18, 76%
2018-19, 78%
2019-20, 78%
2020-21, 77%
2021-22, 73%
2022-23, 75%
Figure long description
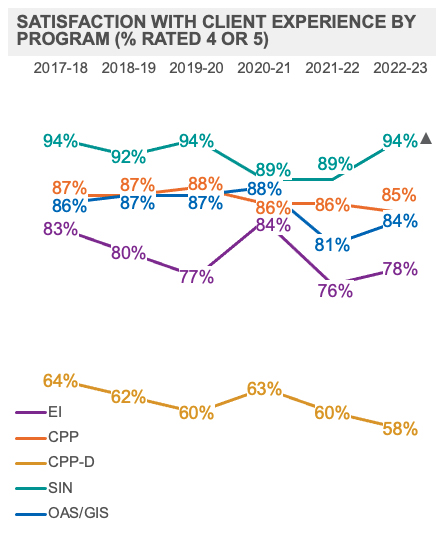
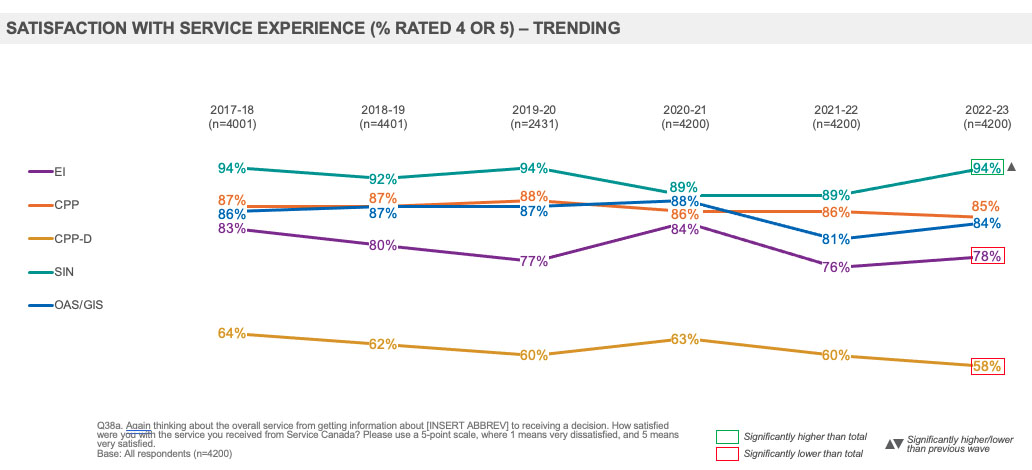
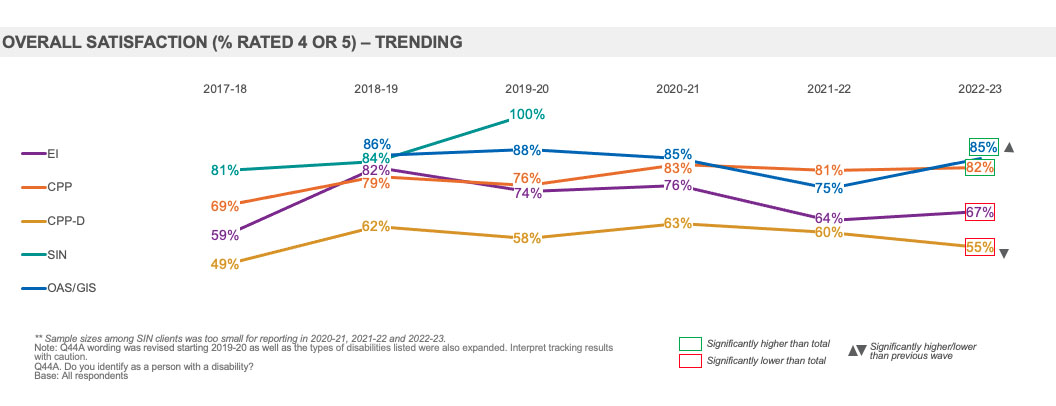
Satisfaction with clients Experience by Program (% rated 4 or 5)
EI
2017-18, 83%
2018-19, 80%
2019-20, 77%
2020-21, 84%
2021-22, 76%
2022-23, 78%
CPP
2017-18, 87%
2018-19, 87%
2019-20, 88%
2020-21, 86%
2021-22, 86%
2022-23, 85%
CPP-D
2017-18, 64%
2018-19, 62%
2019-20, 60%
2020-21, 63%
2021-22, 60%
2022-23, 58%
SIN
2017-18, 94%
2018-19, 92%
2019-20, 94%
2020-21, 89%
2021-22, 89%
2022-23, 94%, significantly higher than previous wave
OAS/GIS
2017-18, 86%
2018-19, 87%
2019-20, 87%
2020-21, 88%
2021-22, 81%
2022-23, 94%
Figure long description
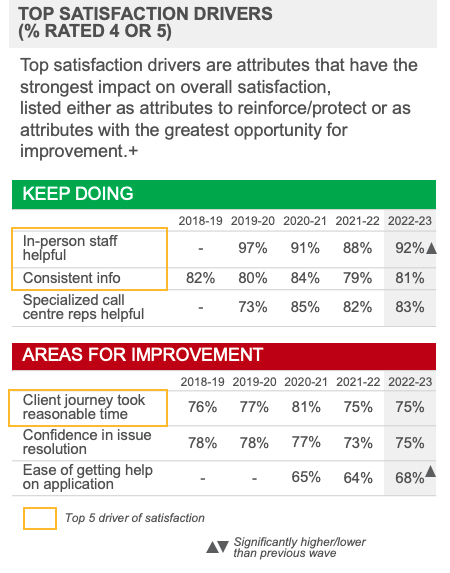
Top Satisfaction Drivers (% Rated 4 or 5)
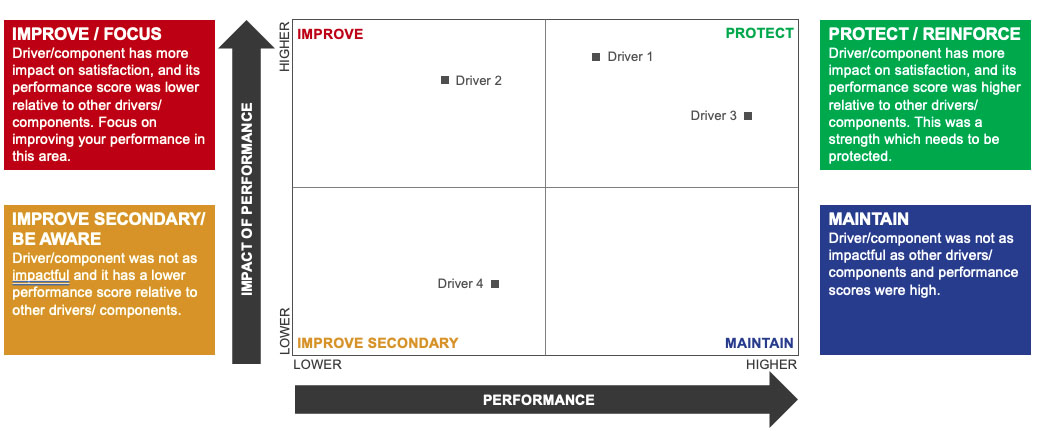
Top satisfaction drivers are attributes that have the strongest impact on overall satisfaction, listed either as attributes to reinforce/protect or as attributes with the greatest opportunity for improvement.+
KEEP DOING
2018-19
2019-20
2020-21
2021-22
2022-23
In-person staff helpful
-
97%
91%
88%
92%
Consistent info
82%
80%
84%
79%
81%
Specialized call centre reps helpful
-
73%
85%
82%
83%
AREAS FOR IMPROVEMENT
2018-19
2019-20
2020-21
2021-22
2022-23
Client journey took reasonable time
76%
77%
81%
75%
75%
Confidence in issue resolution
78%
78%
77%
73%
75%
Ease of getting help on application
-
-
65%
64%
68%
+Ref. Service Canada CX Survey report 2022-23 / Overall Priority Matrix: Impact vs. Performance
Figure long description
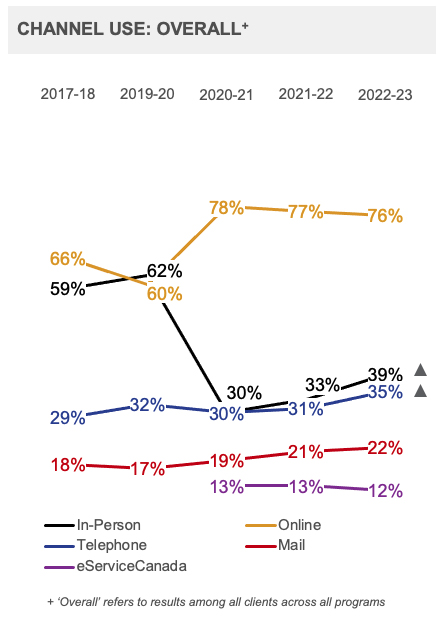
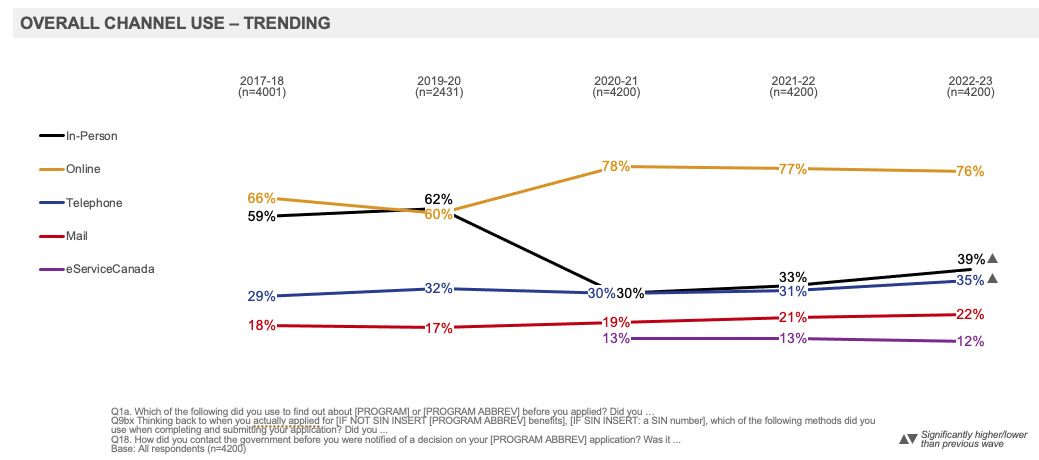
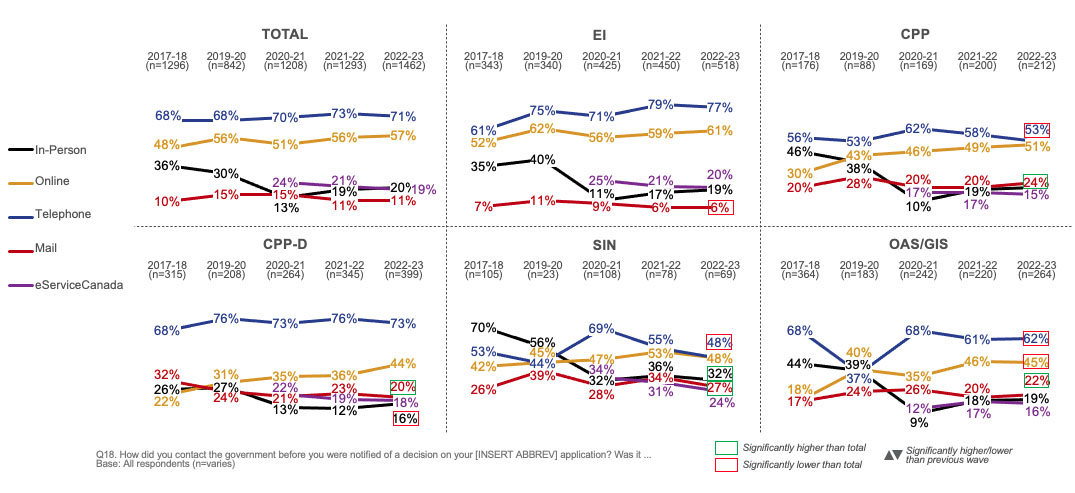
Channel Use: Overall+
In-person
2017-18, 59%
2019-20, 62%
2020-21, 30%
2021-22, 33%
2022-23, 39%, significantly higher than previous waves
Telephone
2017-18, 29%
2019-20, 32%
2020-21, 30%
2021-22, 31%
2022-23, 35%, significantly higher than previous waves
eServiceCanada
2020-21, 13%
2021-22, 13%
2022-23, 12%
Online
2017-18, 66%
2019-20, 60%
2020-21, 78%
2021-22, 77%
2022-23, 76%
Mail
2017-18, 18%
2019-20, 17%
2020-21, 19%
2021-22, 21%
2022-23, 22%
+ ‘Overall’ refers to results among all clients across all programs
Figure long description
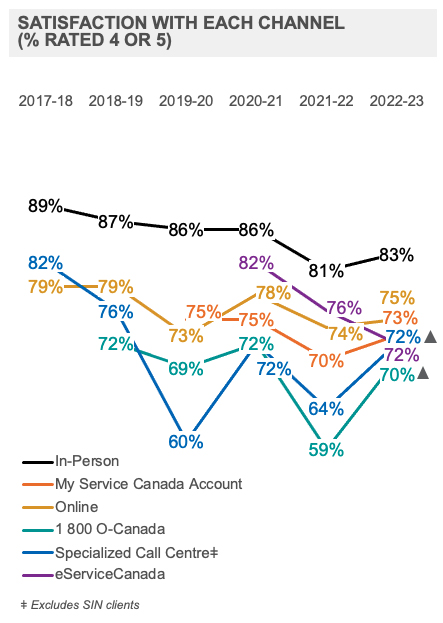
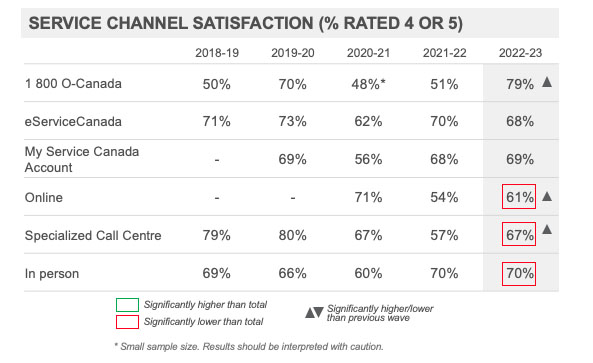
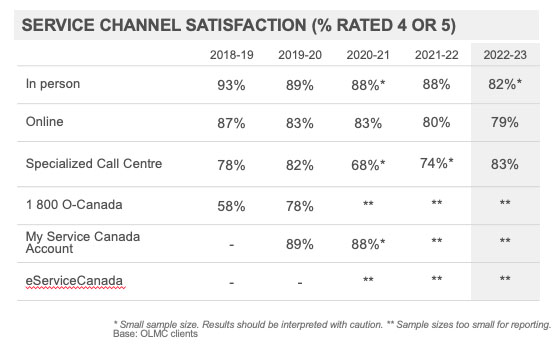
Satisfaction with each channel (% Rated 4 or 5)
In-person
2017-18, 89%
2018-19, 87%
2019-20, 86%
2020-21, 86%
2021-22, 81%
2022-23, 83%
My Service Canada Account
2019-20, 75%
2020-21, 75%
2021-22, 70%
2022-23, 73%
Online
2017-18, 79%
2018-19, 79%
2019-20, 73%
2020-21, 78%
2021-22, 74%
2022-23, 75%
1 800 O-Canada
2018-19, 72%
2019-20, 69%
2020-21, 72%
2021-22, 59%
2022-23, 70%
Specialized Call Centre
2017-18, 82%
2018-19, 76%
2019-20, 60%
2020-21, 72%
2021-22, 64%
2022-23, 72%, significantly higher than previous wave
eServiceCanada
2020-21, 82%
2021-22, 76%
2022-23, 72%,
ǂ Excludes SIN clients
Figure long description
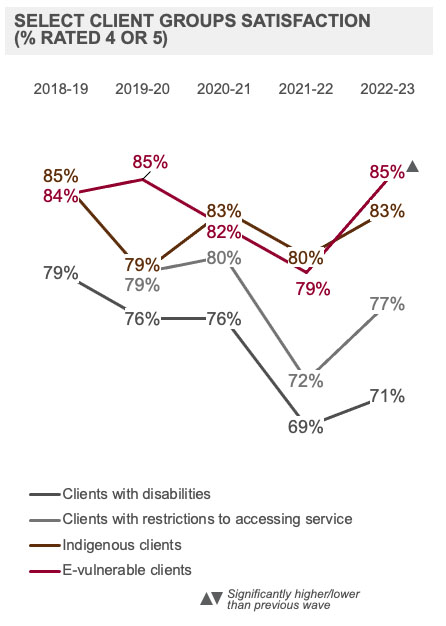
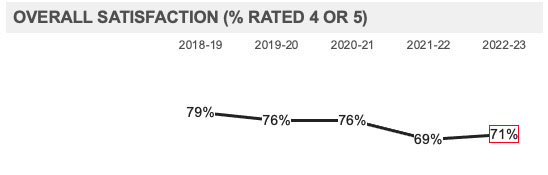
Client Groups Satisfaction
Clients with disabilities
2018-19, 79%
2019-20, 76%
2020-21, 76%
2021-22, 69%
2022-23, 71%
Client with restrictions to accessing service
2019-20, 79%
2020-21, 80%
2021-22, 72%
2022-23, 77%
Indigenous clients
2018-19, 85%
2019-20, 79%
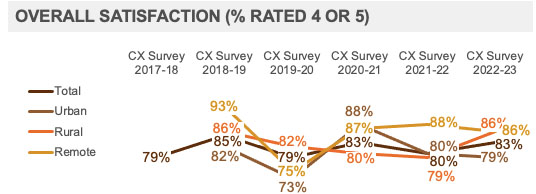
2020-21, 83%
2021-22, 80%
2022-23, 83%
E-vulnerable clients
2018-19, 84%
2019-20, 85%
2020-21, 82%
2021-22, 79%
2022-23, 85%, significantly higher than previous wave
Background and Objectives
The annual Service Canada Client Experience (CX) Survey measures the end-to-end service experience delivered by Service Canada and tracks the impact of service delivery change on clients’ ability to access federal programs and satisfaction with the federal programs.
The 2022-23 Client Experience (CX) Survey is the sixth annual wave. This provides trend data to contribute to monitoring the service delivery performance of Service Canada.
The CX Survey provides tracking of satisfaction with the client journey among Service Canada clients, measures changes in use and satisfaction of service channels and assesses the ease, effectiveness and emotion of Service Canada clients by service channel and program. It also tracks up-take and use of self-service and assisted self-service among Service Canada clients.
The Client Experience Survey project is conducted in two phases: an initial quantitative survey followed by a qualitative phase of research.
The qualitative phase was used to explore service channel preference, barriers, and opportunities for improvement to service delivery and channel use.
The contract value ($299,851.15 [including HST]) for this research includes both the qualitative and quantitative phases.
To comply with the Treasury Board Secretariat’s Policy on Service and Digital, the Chief Client Experience Officer (CCXO) conducts the Client Experience (CX) Survey to collect client feedback to assist in effectively managing service delivery across the service channels and to help ensure client-centric service design and delivery that is accessible and inclusive.
The CCXO launched the annual Client Experience (CX) Survey in 2017 as part of a structured approach to collecting feedback from clients to track how well Service Canada was delivering federal programs through its service channels. The CX Survey was conducted again in 2018-19, 2019-20, 2020-21 and 2021-22.
The CX Survey in 2022-23 collected trend data to contribute to monitoring the service delivery performance of Service Canada, and to report annual satisfaction to meet service standards on the client experience.
Results from the 2022-23 CX Survey project will be used to:
Improve service delivery and access to programs;
Respond to clients’ evolving service needs;
Measure performance and impacts of service changes over time (e.g., pre-pandemic vs. pandemic vs. post-pandemic);
Contribute to evaluating the overall success of the client experience management function and service delivery; and,
Inform service management decisions as reported to Treasury Board Secretariat under the Management Accountability Framework.
The research objectives for the quantitative phase were to:
Track overall satisfaction with end-to-end service experience of Service Canada clients, including clients of Employment Insurance (EI), Canada Pension Plan (CPP), Canada Pension Plan – Disability (CPP-D), Old Age Security/Guaranteed Income Supplement (OAS/GIS), and Social Insurance Number (SIN);
Track changes over time on the use of and satisfaction with the service channels; and,
Use the Client Experience Measurement Model and assess ease, effectiveness, emotion and trust in Service Canada of clients accessing the five major programs.
Methodology
A telephone survey was conducted with a sample of 4,200 Service Canada clients across the five major programs.
EI: (n=1035) +/- 3.0 percentage points
CPP: (n=768) +/- 3.5 percentage points
CPP-D: (n=752) +/- 3.6 percentage points
OAS/GIS: (n=862) +/- 3.3 percentage points
SIN: (n=783) +/- 3.5 percentage points
Oversamples were collected with two client groups: those living in remote areas and Indigenous clients. A minimum of 400 completed questionnaires was achieved for each of these smaller groups.
The interviews were conducted between June 9 and July 26, 2023.
Clients who were sampled had completed a client journey and received an initial decision, benefit or Social Insurance Number in January, February or March 2023.
The survey sample size has a margin of error of +/-1.5%.
Results were weighted by age, gender, region, program and benefit receipt (approved/denied) using administrative data on clients who completed a client journey from April 2022 to March 2023. Program weights were held constant with 2017-18 to allow the results to highlight any change due to the service experience.
The 2022-23 Client Experience Survey Detailed Methodology document, which includes the research instruments, is available under separate cover.
The qualitative research, which comprised a mix of in-depth interviews (37) and online focus groups (7), was conducted between September 21st and November 6th, 2023. Participants who were screened into the focus groups or in-depth interviews were those who had lower satisfaction and/or experienced a barrier to accessing service. A total of 85 clients participated in the qualitative research. The findings presented are qualitative in nature, meaning that they provide an in-depth exploration of the research issues and at no point is the intention to produce results that are statistically representative of the population at large. The results of the qualitative research are also available under separate cover.
Glossary
Throughout the report, subgroup results have been compared to the average of all clients (i.e., total) and statistically significant differences at the 95% confidence level noted using green and red boxes.
Where subgroup results are statistically higher than the total a green box has been used and where results are statistically lower than the total a red box has been used. Where applicable, yellow boxes are used to indicate drivers of satisfaction which are in the top five most impactful.
Additionally, arrows have been used to identify where results in 2022-23 are statistically higher or lower than 2021-22.
Small sample sizes of less than n=40 have been identified throughout the report using an asterisk symbol (*) and caution should be used when interpreting these results. Sample sizes less than n=25 are considered very small and results for these measures have not been included in the report and have been identified using a double asterisk (**) where applicable.
Where applicable, “-” is used in tabulations to indicate that an attribute or statement was not asked/did not exist during the given year.
Throughout this report, the term “overall” is used to describe the specific attribute related to satisfaction with service received from Service Canada as a whole (“overall satisfaction”), or to refer to results for the total sample/all client groups (“Trust in Service Canada: Overall”), where indicated.
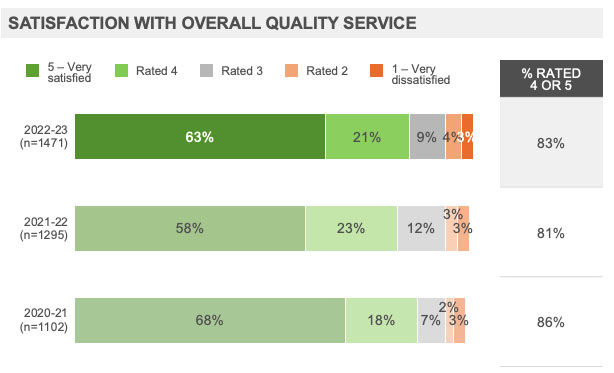
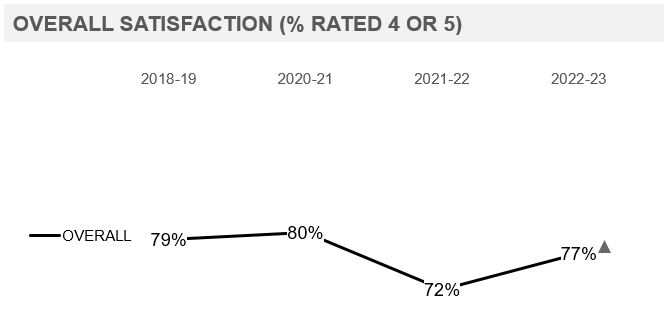
Executive Summary: Overall Satisfaction
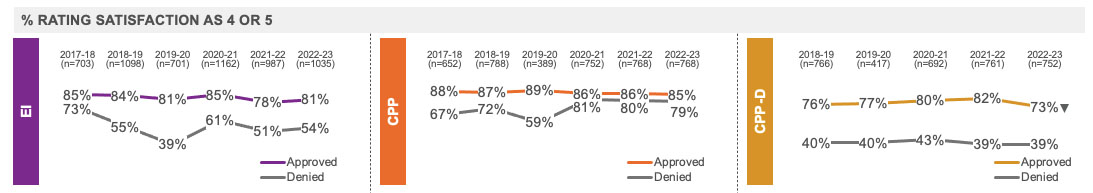
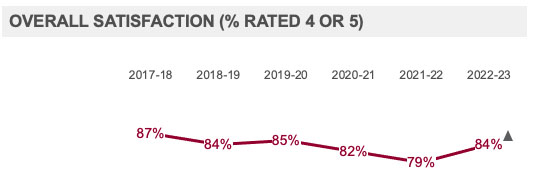
Satisfaction with the overall service experience has increased compared to 2021-22. Satisfaction among EI clients increased compared to last year and remained consistent among clients of all other programs, however ratings among CPP-D clients have declined directionally for the second consecutive year and were lower compared to 2021-22. Satisfaction was higher among SIN clients compared to all clients, lower among EI clients and, consistent with historic trends, remained the lowest for CPP-D clients.
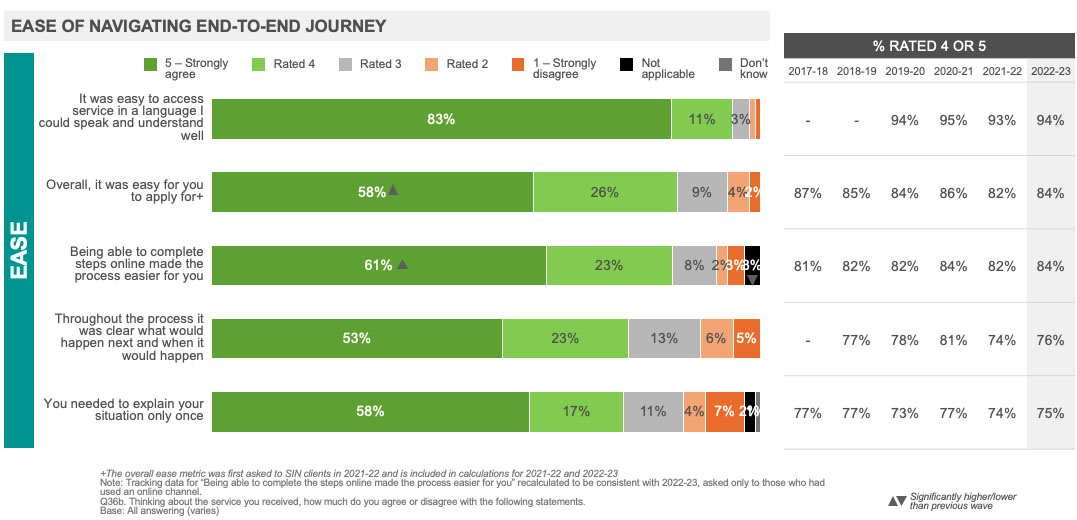
At more than eight in ten, the vast majority of clients were satisfied with their experience overall (83%) and found it easy (87%) and effective (84%). Three-quarters of clients (75%) were confident that any issues or problems would be easily resolved. Compared to 2021-22, ratings on satisfaction (83% vs. 81%), and ease (87% vs.85%) have increased. Effectiveness (84% vs.82%) and emotion (75% vs. 73%) and were on the cusp of statistical significance.
At more than nine in ten (94%), SIN clients were most satisfied with the service experience overall. Over eight in ten CPP (85%) and OAS/GIS clients (84%) were satisfied, followed by just under eight in ten EI clients (78%), while nearly six in ten CPP-D clients (58%) were satisfied, lower than other programs. Satisfaction has increased among SIN clients from last year (94% vs. 89%). Satisfaction was stable for all other programs, however ratings have declined directionally among CPP-D clients for the second consecutive year and were lower compared to ratings in 2020-21 (58% vs. 60% in 2021-22 and 63% in 2020-21).
More broadly, there has been a return to pre-pandemic satisfaction ratings across most programs, channels and client groups. However, some longer-term trends are reversing. For example, overall satisfaction among E-vulnerable clients had been in a trend of decline over the past five years (87% satisfaction in 2017-18 compared to 79% in 2021-22), though this has rebounded this year (84% satisfaction).
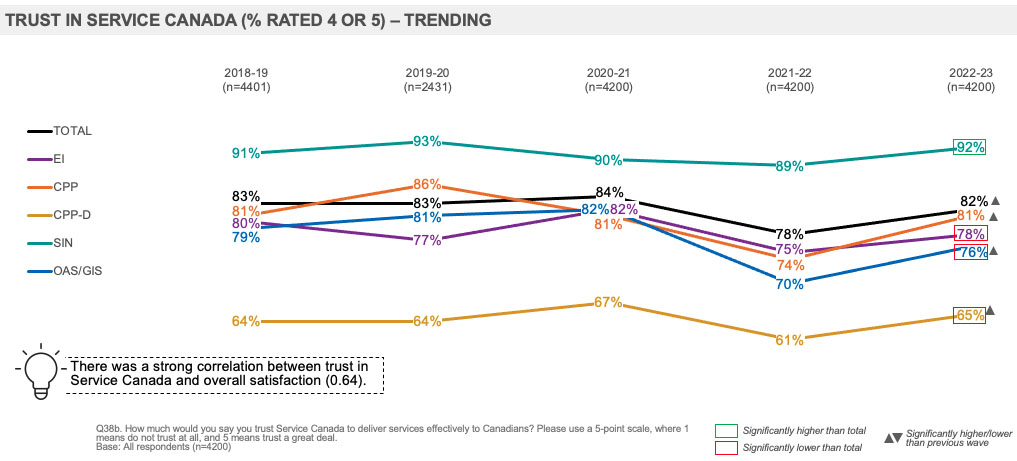
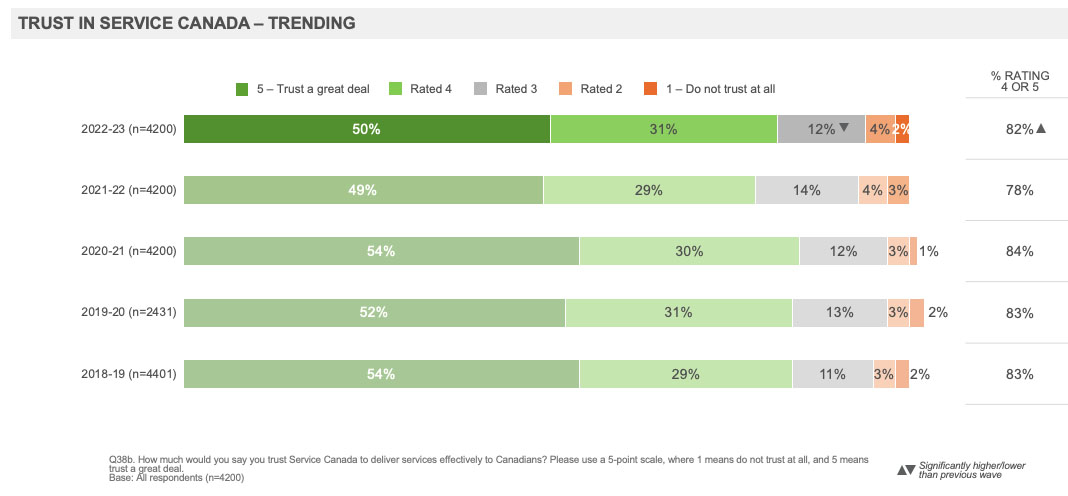
Executive Summary: Trust
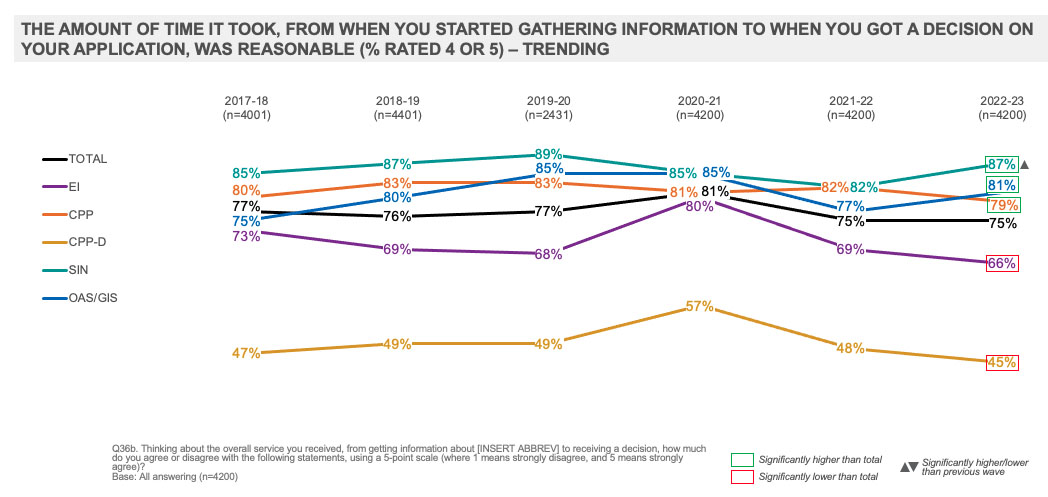
Trust in Service Canada to deliver services effectively has increased overall and among CPP and OAS/GIS clients compared to 2021-22. EI and OAS/GIS clients provided higher ratings for overall ease this year, while EI clients also provided lower ratings for timeliness of service.
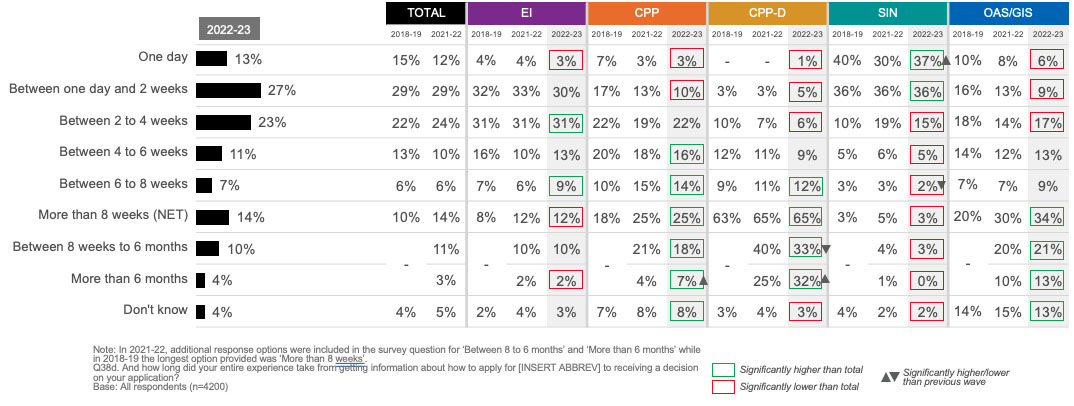
SIN clients were more likely to express trust (92%), to have found the process easy (93%), effective (93%) and to have had confidence in issue resolution (86%) compared to all clients. They were also more likely to have felt the timeliness of service was reasonable (87%) and to have reported their client journey took two weeks or less (73%); notably a higher proportion said it took only one day compared to 2021-22 (37% vs. 30%).
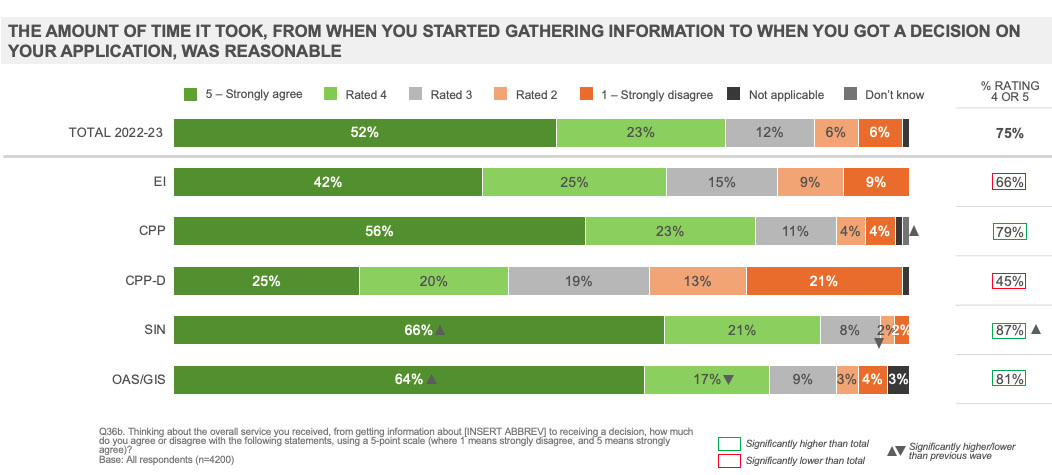
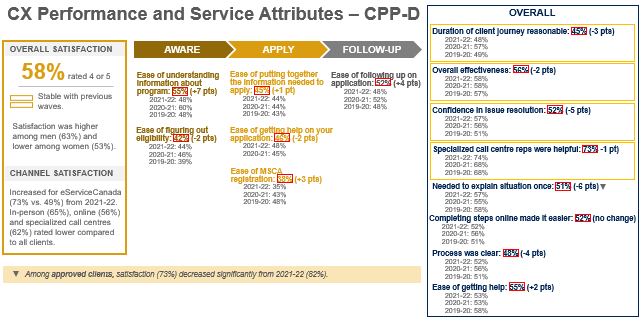
CPP-D clients were less likely to express trust (65%), to have found the process easy (54%) and effective (56%) and to have confidence in issue resolution (52%) compared to all clients. They were also much less likely to have rated the timeliness of service as reasonable (45%) and continued to report the longest client journey of any program with CPP-D clients much more likely to say it took more than eight weeks (65%). Compared to 2021-22, a higher proportion reported their client journey took more than six months (32% vs. 25%) and ratings on timeliness experienced a directional decline and are at the lowest level observed.
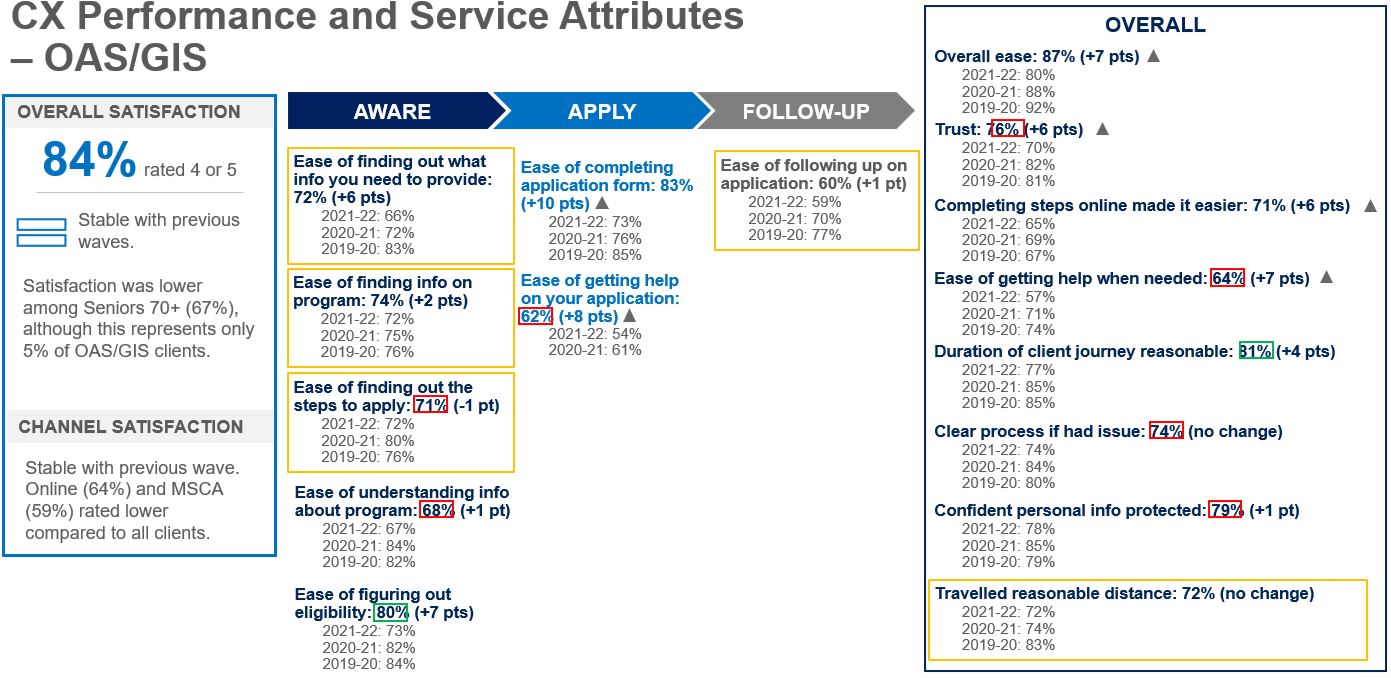
OAS/GIS clients were less likely to express trust (76%) compared to all clients, while ratings on the ease (87%) and effectiveness (84%) of the process and confidence in issue resolution (73%) were consistent with overall levels. They were more likely to have felt the timeliness of service was reasonable (81%) and to report their client journey took more than eight weeks (34%) compared to all clients, however most said it took less than eight weeks (54%).
EI clients were less likely to express trust (78%), to have found the process effective (79%) and to have confidence in issue resolution (70%) compared to all clients. They were also less likely to have rated the timeliness of service as reasonable (66%) and to have reported their client journey took between two to four weeks (31%) or between six to eight weeks (9%).
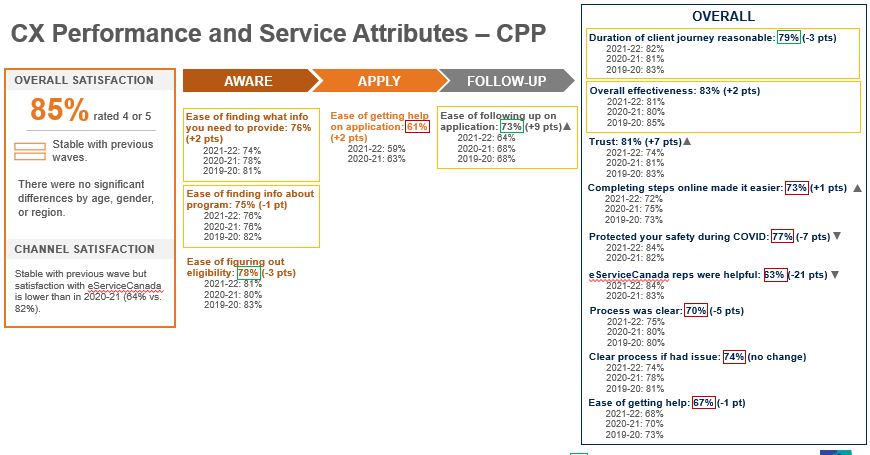
CPP clients’ ratings on trust (81%), ease (85%), effectiveness (83%) and confidence in issue resolution (75%) were consistent with overall levels. They were more likely to have rated the timeliness of service as reasonable (79%) and to have reported their client journey took four weeks or longer (55%).
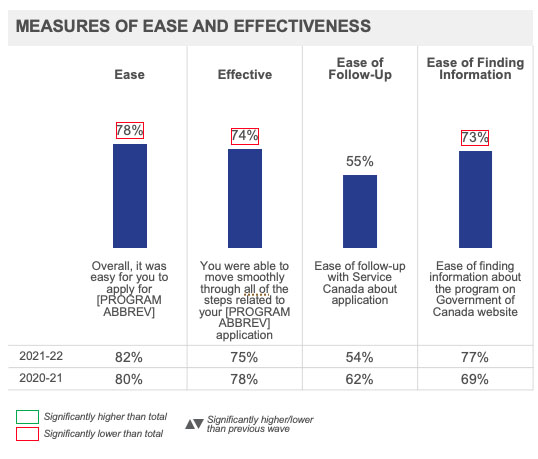
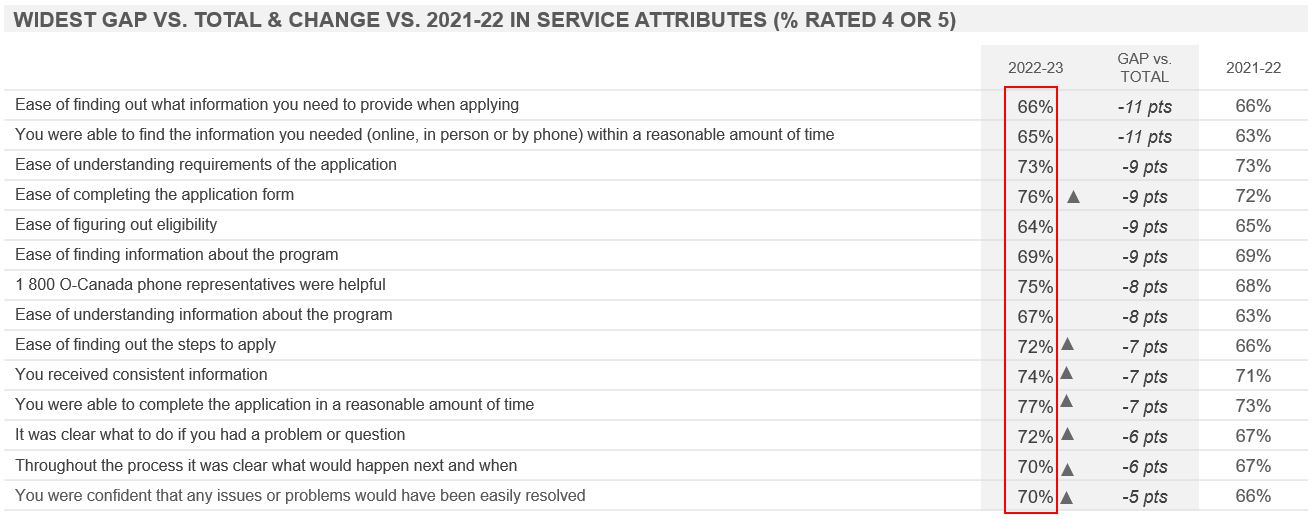
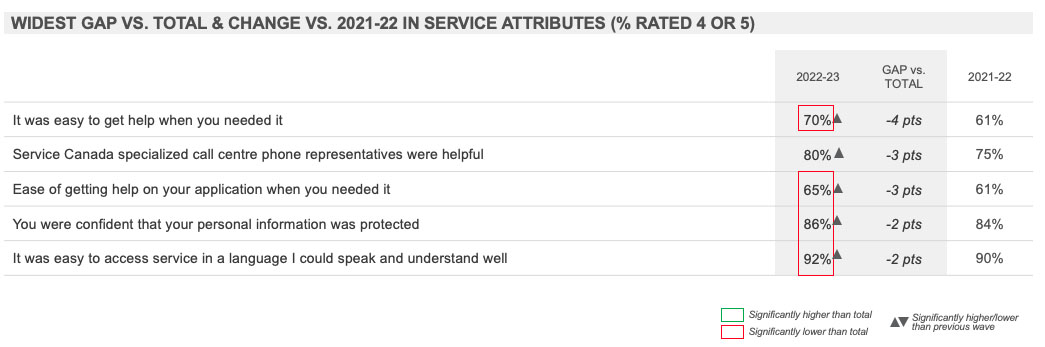
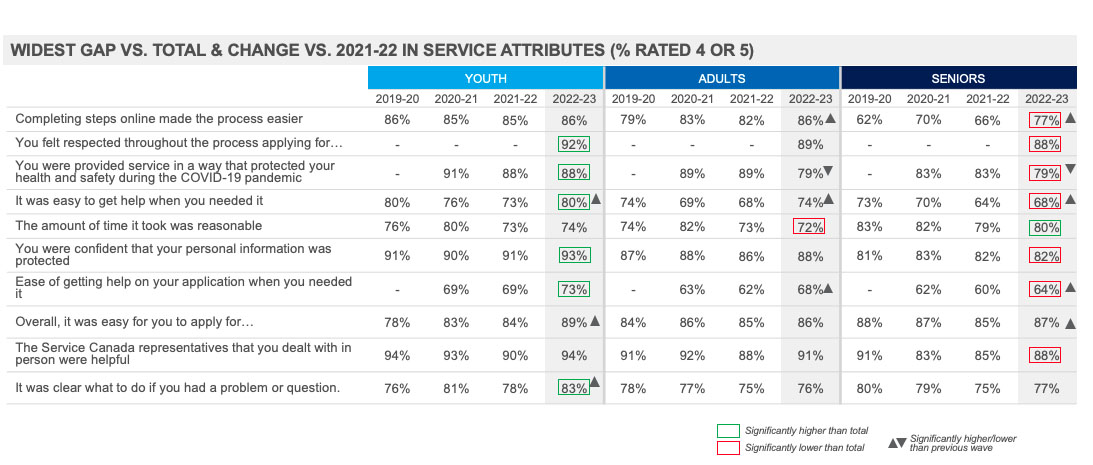
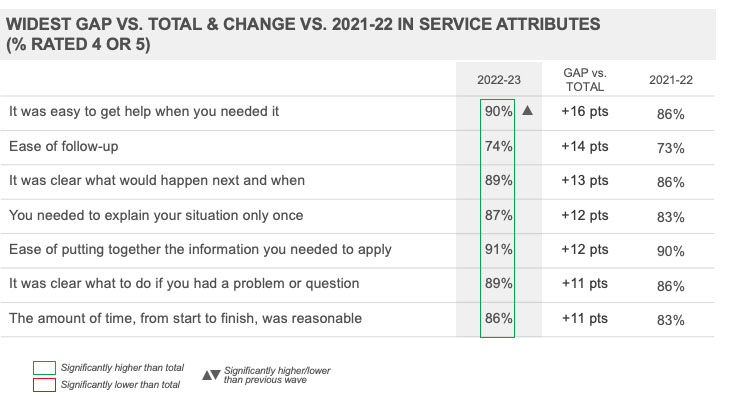
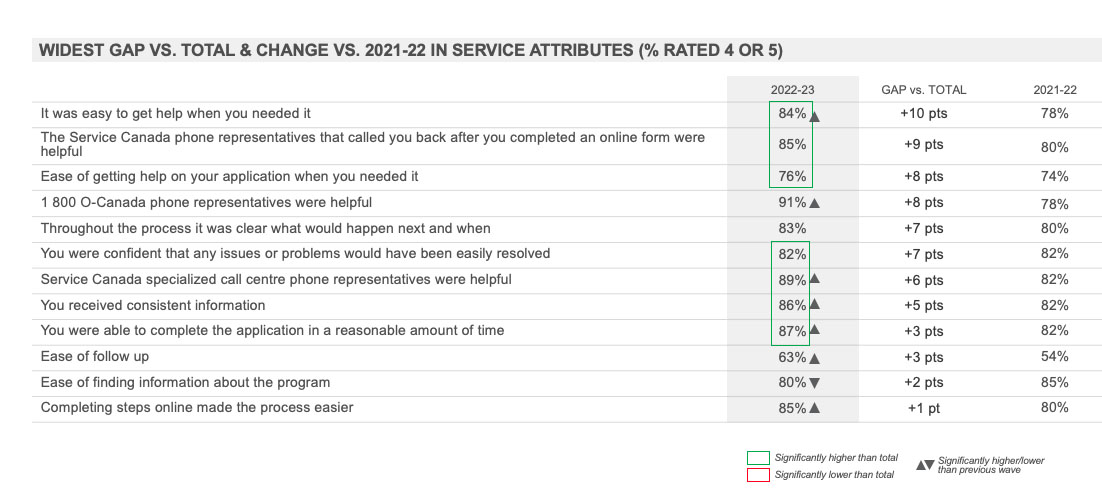
Executive Summary: Service Attribute Performance
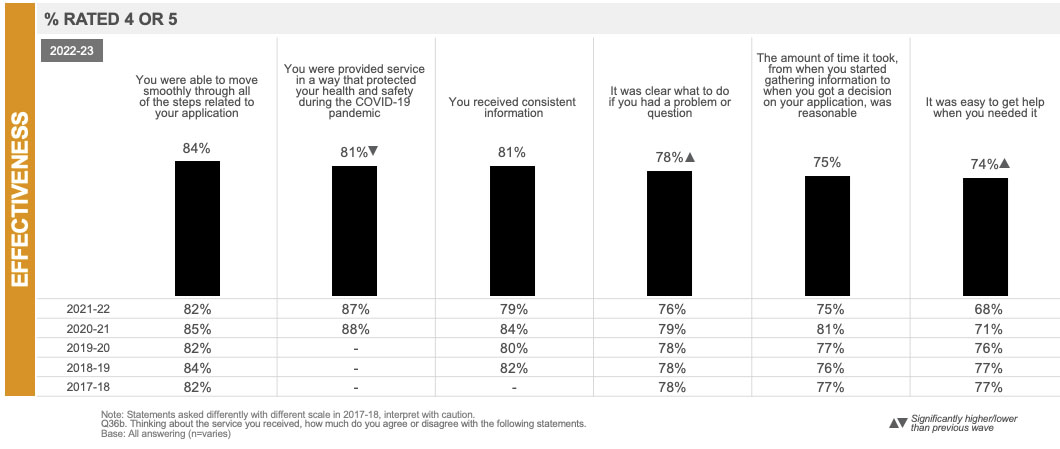
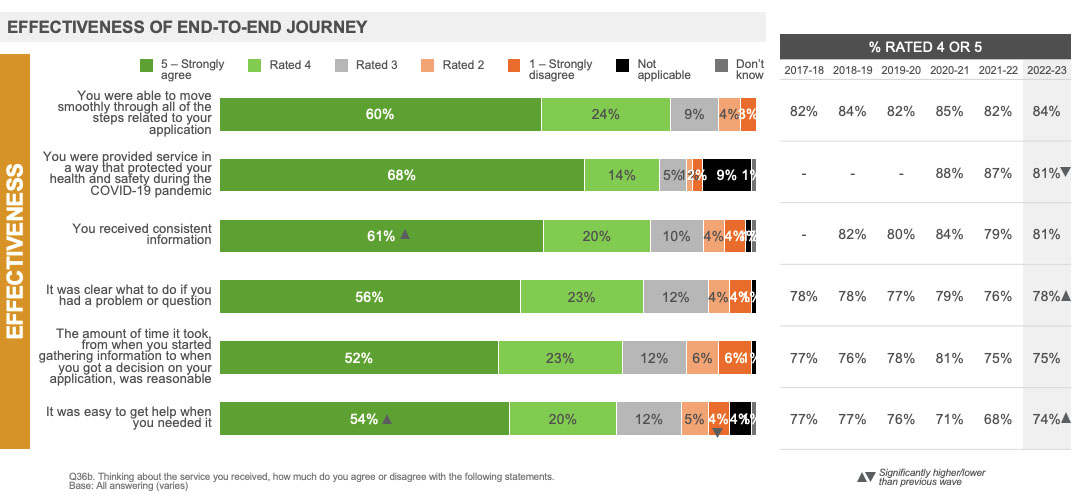
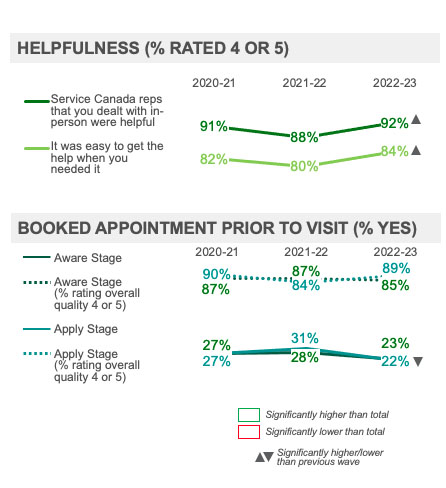
There have been a number of positive shifts for service attributes related to effectiveness and emotion year over year, while a higher proportion reported that they were able to complete the application in a reasonable time.
Clients were more likely to agree that it was clear what to do if they had a problem or question, that it was easy to get help when they needed it, that Service Canada in-person representatives were helpful and that they travelled a reasonable distance to access service.
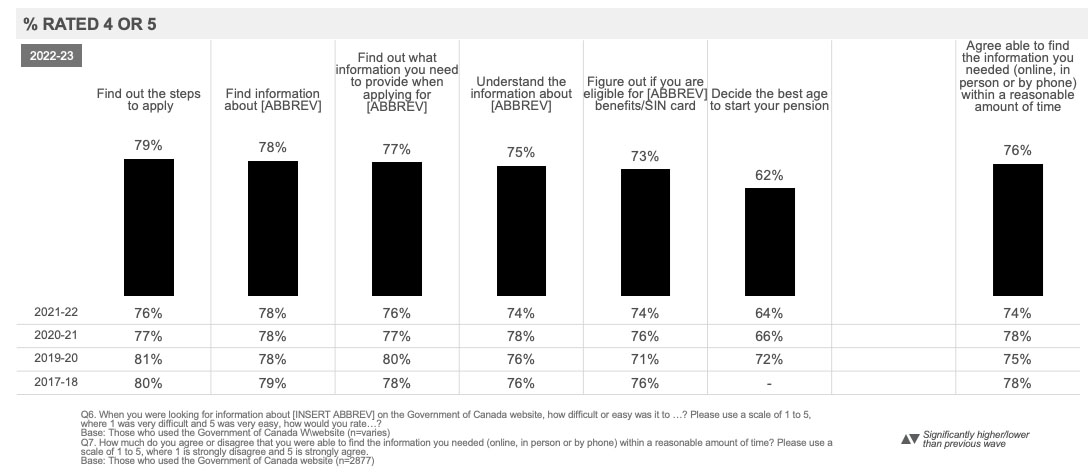
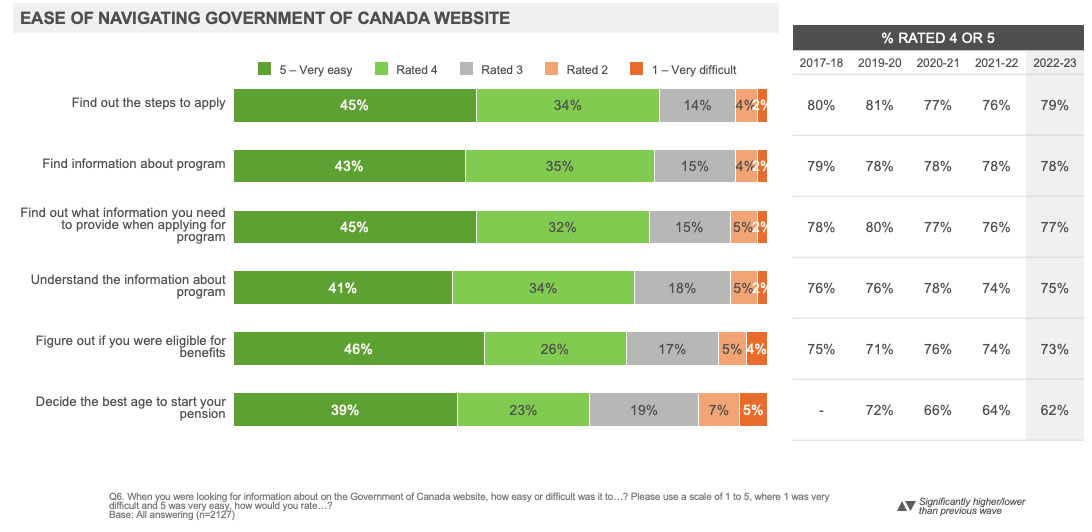
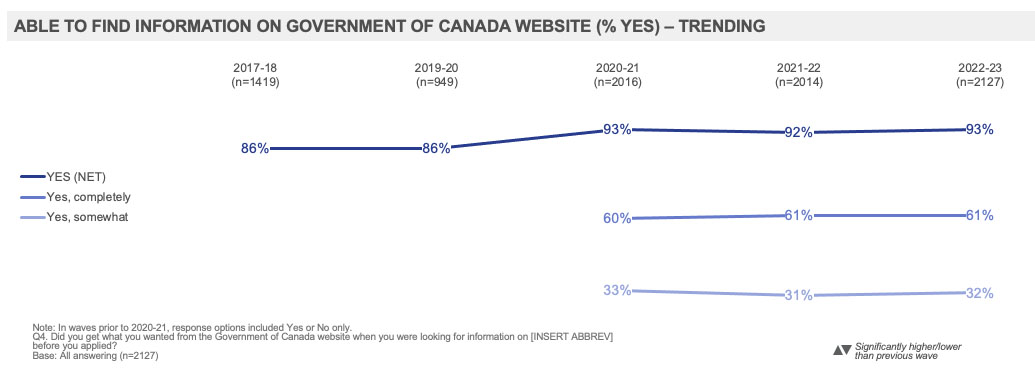
A higher proportion agreed that they were able to complete the application in a reasonable amount of time and that it was easy to get help on their application when needed, compared to 2021-22. Ratings for the ease of finding information about the program on the Government of Canada website were consistent year over year.
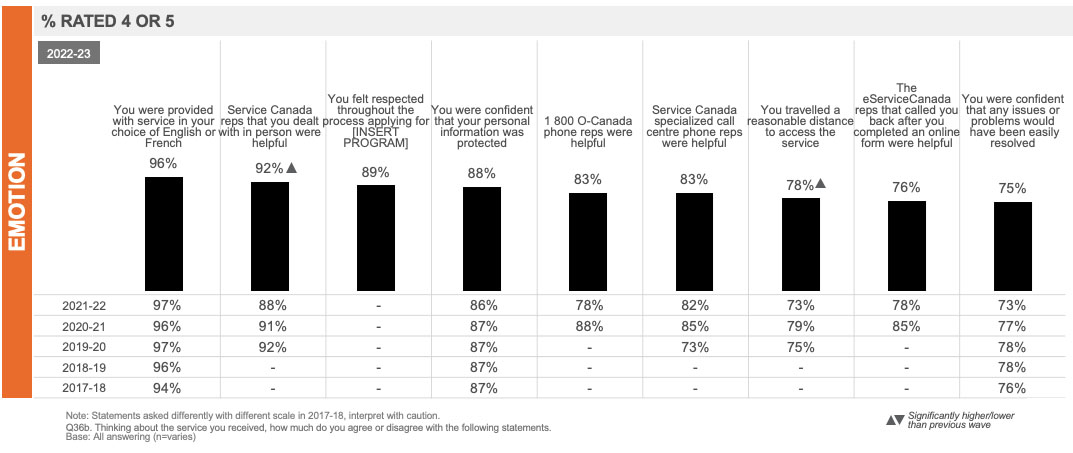
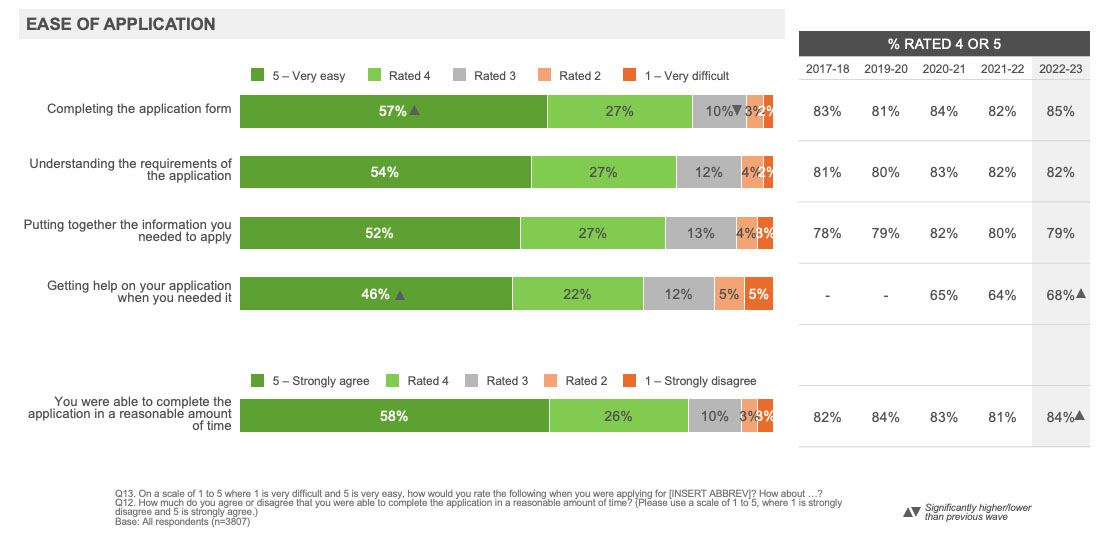
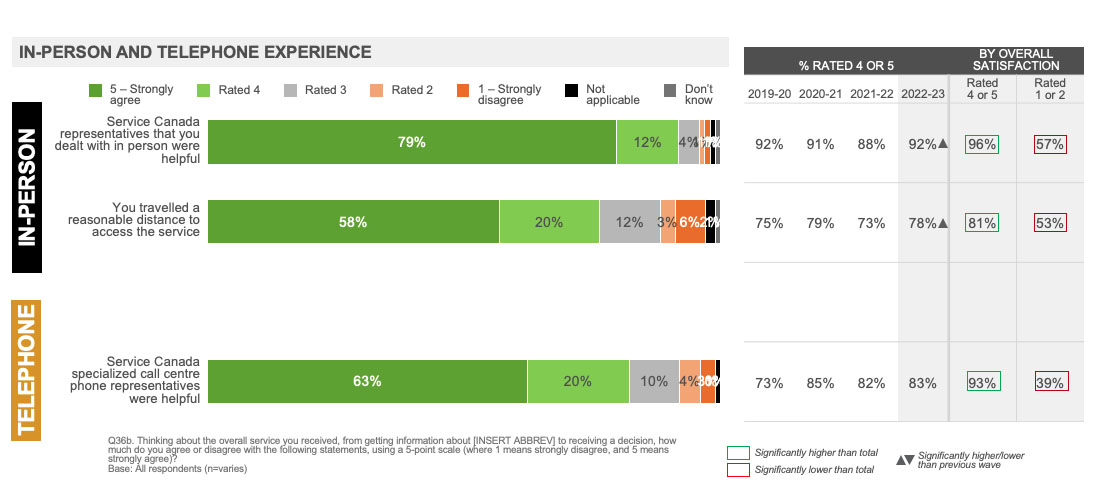
Overall, clients provided the highest ratings for helpfulness of in-person representatives, feeling respected throughout the process, confidence in information security, and overall effectiveness of the process, including ease of completing the application form.
At over nine in ten, the vast majority of clients provided high ratings for the helpfulness of Service Canada in-person representatives (92%). Well over eight in ten:
Felt respected throughout the process (89%);
Were confident their personal information was protected (88%);
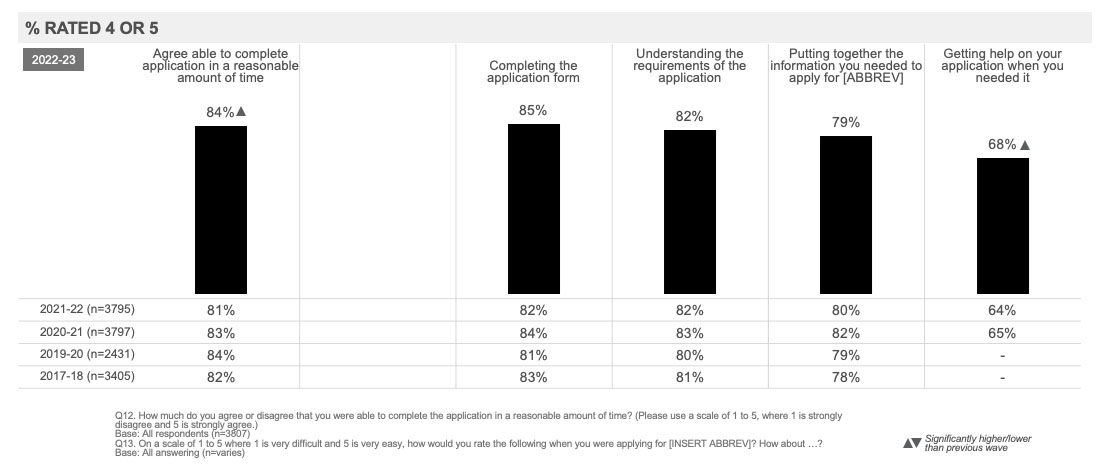
Found it easy to apply (84%), including that it was easy to complete the application form (85%) and to complete the application in a reasonable time (84%); and
Were able to move smoothly through all steps (84%).
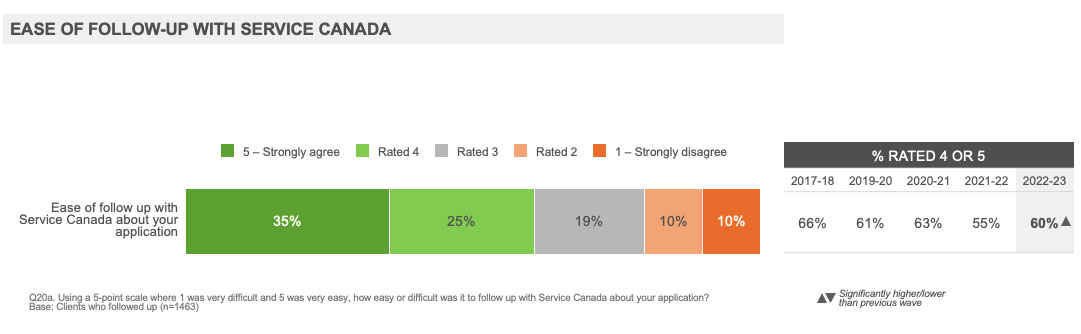
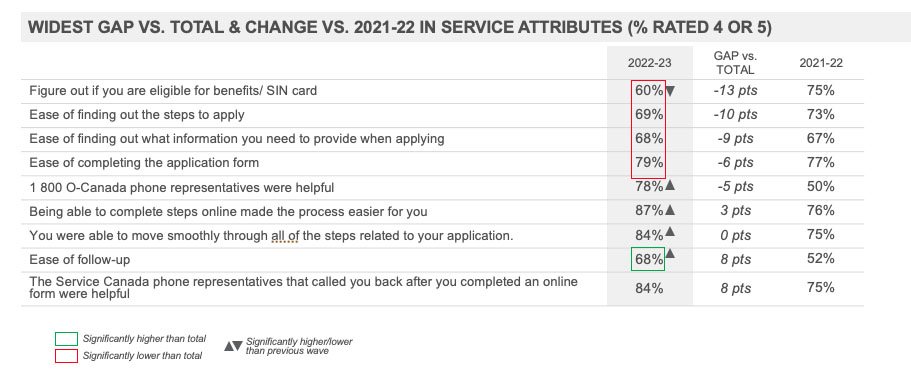
Service attributes with lower ratings were ease of follow-up, ease of deciding the best age to start their pension, ease of getting help on the application when needed and ease of figuring out program eligibility.
Six in ten provided high ratings for the ease of following-up on their application (60%) and ease of deciding the best age to start their pension (62%). Closer to seven in ten provided high ratings for ease of getting help on the application when needed (68%) and just over seven in ten for ease of figuring out program eligibility (73%).
The helpfulness of Service Canada in-person representatives, being respected throughout the process and protection of personal information were rated consistently high across all programs. While ease of follow-up and ease of getting help on the application when needed were consistently rated low.
Executive Summary: Service Attribute Performance by Program
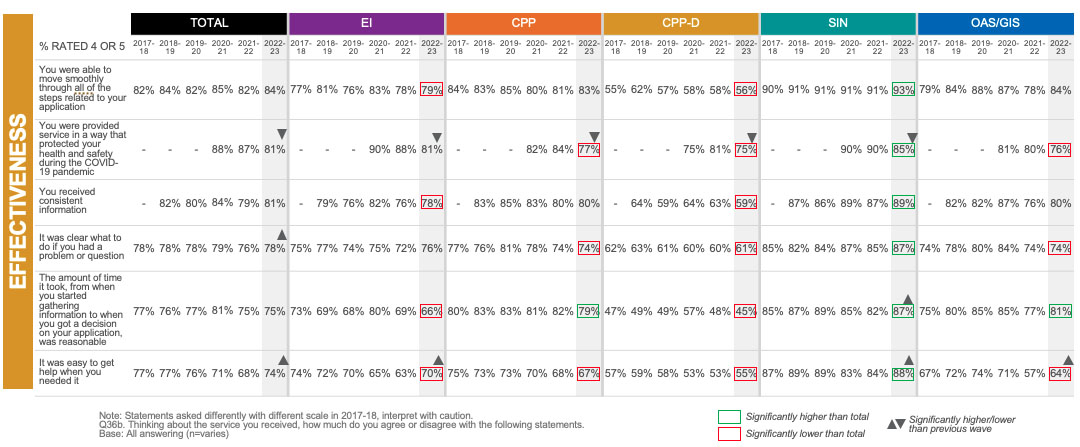
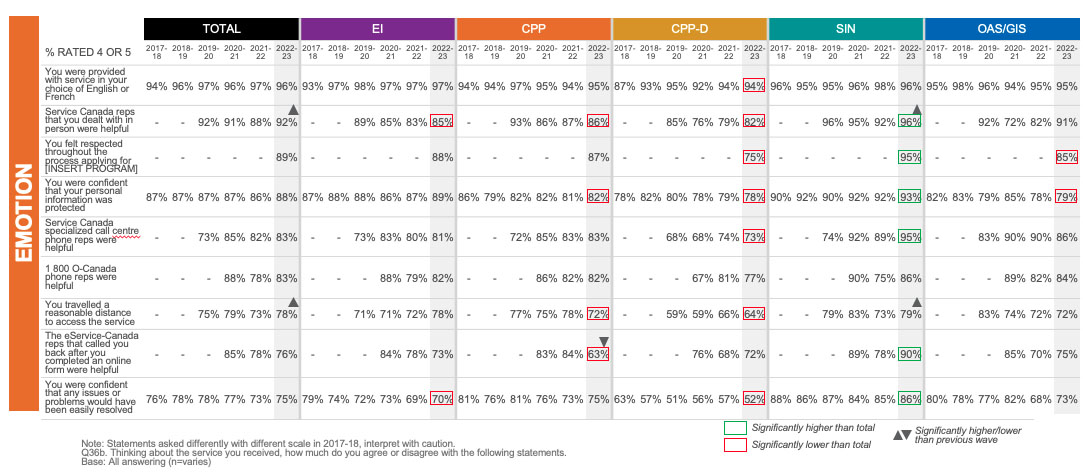
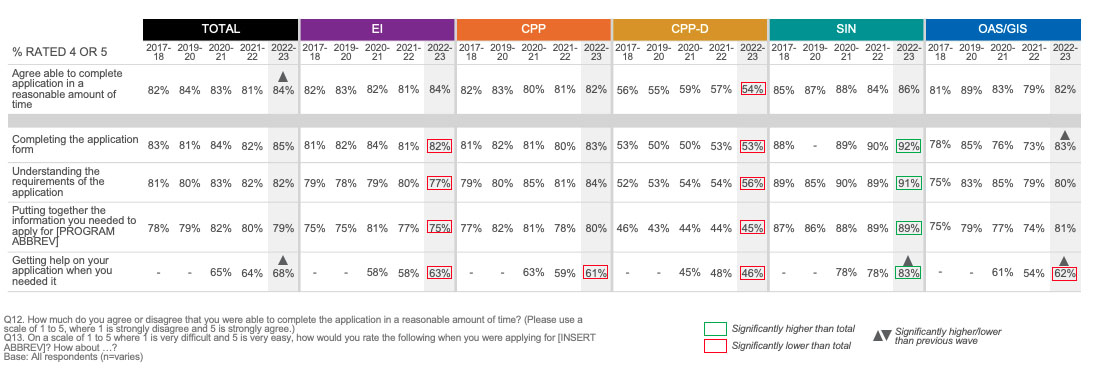
SIN clients continued to provide the highest ratings across nearly all service attributes except for being able to complete the application in a reasonable amount of time, the helpfulness of 1 800 O-Canada representatives and travelling a reasonable distance to access service, where ratings were consistent with all clients.
At well over eight in ten, the vast majority of SIN clients provided high ratings for all service attributes and, in particular, ease of applying; aspects of the effectiveness and emotion of the process; helpfulness of Service Canada in-person and specialized call centre representatives; and being respected throughout the process.
EI, CPP and OAS/GIS clients provided generally high ratings across most service attributes. However, ratings were lower for several aspects of the effectiveness of the process compared to all clients and, to a lesser extent, ease and emotion. EI clients also provided lower ratings for the ease of nearly all components of the application process specifically.
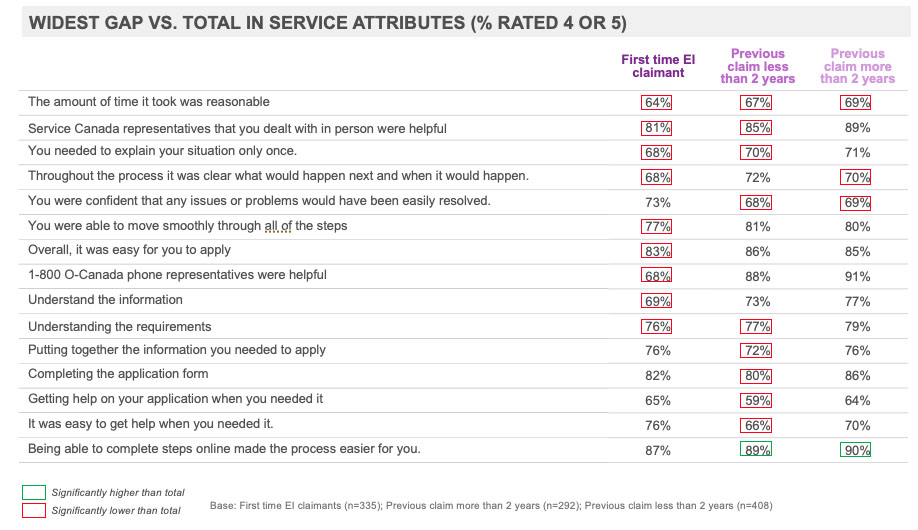
EI clients were less likely to provide high ratings on all aspects of the ease of the application process and most service attributes related to effectiveness. They were also less likely to feel it was easy to figure out eligibility; it was clear what would happen next and when; that they needed to explain their situation only once; that the in-person representatives were helpful; and they were confident any issues or problems would be easily resolved. EI clients provided higher ratings for being able to complete steps online that made the process easier.
OAS/GIS clients were less likely to feel it was easy to understand information about the program, find out the steps to apply and to get help on their application when needed. They were also less likely to provide high ratings on the ease of getting help in general; being able to complete steps online made the process easier; clarity of the issue resolution process; that they were provided service in a way that protected them during the pandemic; ease of accessing service in a language they understand well; confidence their personal information was protected; and that they felt respected throughout the process.
CPP clients were less likely feel it was easy to get help on their application when needed; being able to complete steps online made the process easier; it was clear what would happen next and when; they were provided service in a way that protected them during the pandemic; it was clear what to do if they had a problem or question; it was easy to get help in general; that Service Canada in-person or eServiceCanada representatives were helpful; they travelled a reasonable distance to access service; and to have confidence their personal information was protected. CPP clients were more likely to feel it was easy to figure out eligibility and follow-up on their application and that the timeliness of service was reasonable.
Consistent with historic trends, CPP-D clients continued to experience the most challenges during the application process and provided lower ratings across nearly all service attributes.
The lowest rated service attributes included the ease of figuring out eligibility, gathering the information needed to apply, and getting help on the application when needed, timeliness of service and that it was clear what would happen next and when.
The CPP-D service experience was rated highest for the helpfulness of Service Canada in-person and specialized call centre representatives and for confidence in protection of personal information.
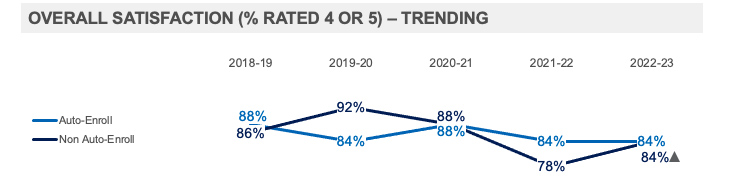
Satisfaction among OAS/GIS clients who were Auto-Enroll and Non Auto-Enroll was consistent. Non Auto-Enroll clients were directionally more satisfied, reversing much of the declines observed last year, and provided higher ratings for the ease of aspects of applying and overall timeliness of service.
Overall satisfaction was consistent among Auto-Enroll and Non Auto-Enroll clients compared to all clients. Compared to 2021-22, satisfaction has increased directionally among Non Auto-Enroll clients and returned to levels observed in 2019-20.
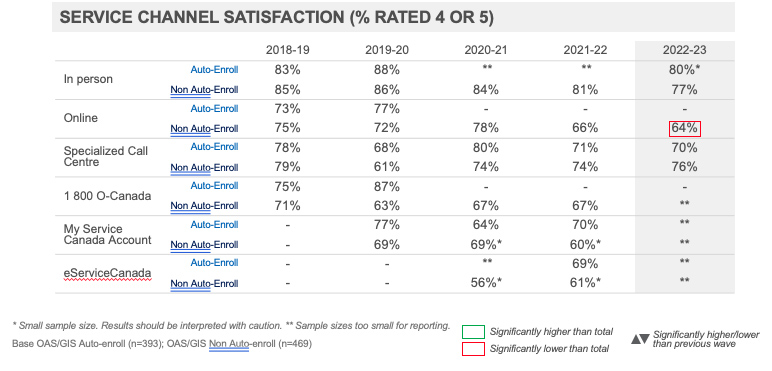
Non Auto-Enroll clients provided lower ratings for online compared to all clients.
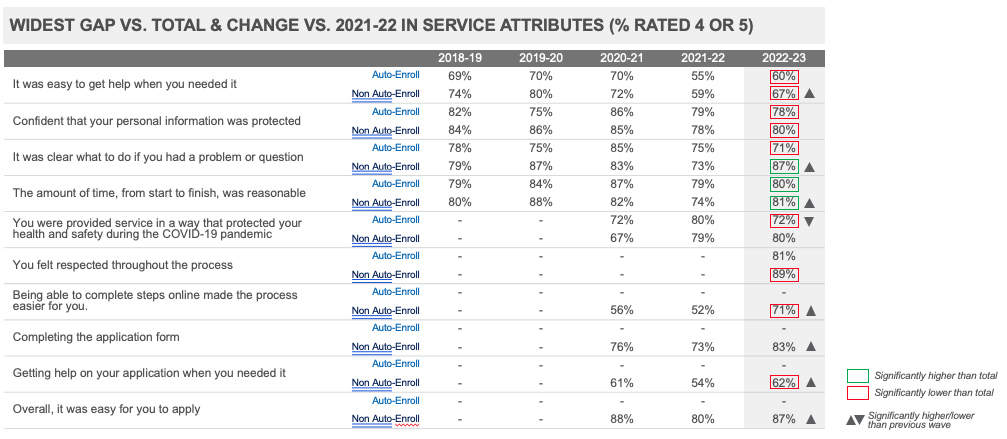
Compared to all clients, both Auto-Enroll and Non Auto-enroll clients provided lower ratings for the ease of getting help when needed and confidence that personal information is protected, and higher ratings for the timeliness of service.
Non-Auto Enroll clients also provided lower ratings for feeling respected throughout the process, being able to complete steps online made the process easier and getting help on the application. Non Auto-Enroll clients also provided higher ratings for the clarity of the issue resolution process.
Auto-Enroll clients also provided lower ratings for clarity of the issue resolution process and being protected during the COVID-19 pandemic.
Compared to 2021-22, Non Auto-enroll clients provided higher ratings on ease of getting help, clarity of the issue resolution process, timeliness of service, being able to complete steps online made the process easier, the ease of completing the form, getting assistance on the application and overall ease of applying.
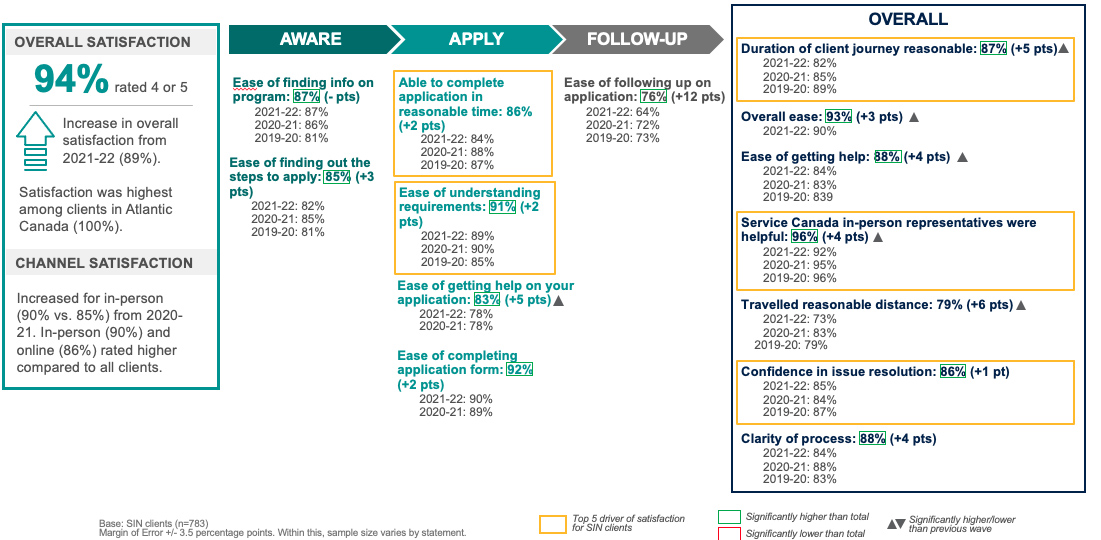
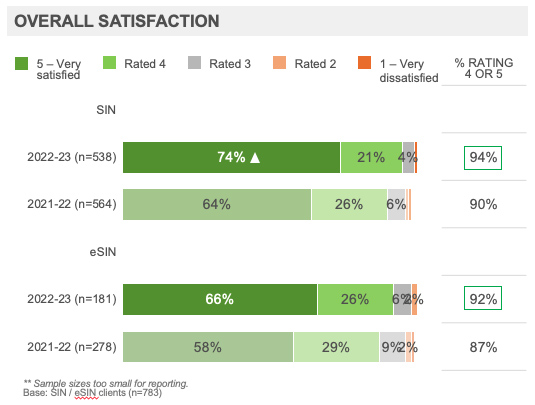
Results were largely consistent among SIN and eSIN clients, although SIN clients were more likely to be very satisfied compared to eSIN clients and compared to results among this group in 2021-22. As observed with results for the program, both client groups were more satisfied overall with their experience compared to all clients.
Overall satisfaction was consistent among SIN and eSIN clients, although a higher proportion of SIN clients provided a rating of 5 out of 5. Consistent with overall results for the program, satisfaction was higher among SIN and eSIN clients compared to all clients.
Results were directionally higher among both groups compared to 2021-22, and notably a higher proportion of SIN clients provided a rating of 5 out of 5 compared to last year.
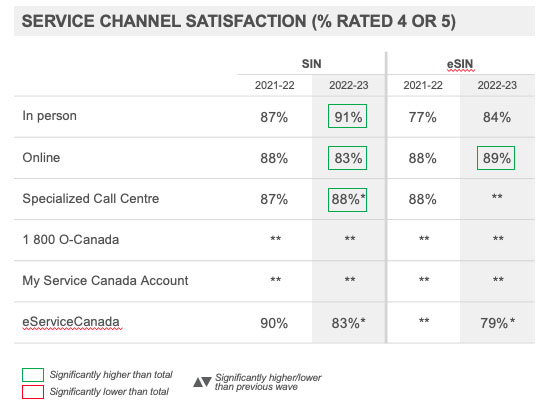
SIN clients provided higher ratings for the quality of service provided in person, online and through specialized call centres, while eSIN clients provided higher ratings for online. Results were consistent compared to 2021-22.
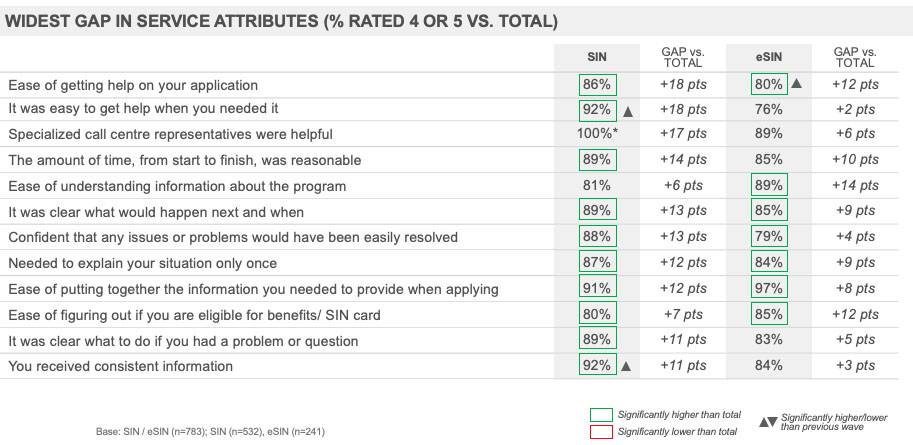
SIN and eSIN clients provided higher ratings across several service attributes compared to all clients.
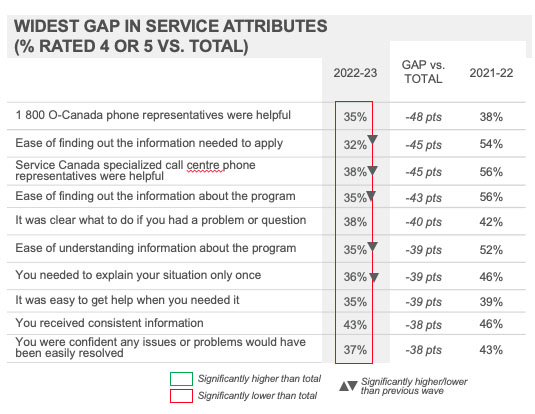
Gaps were consistently larger among SIN clients, with the widest gaps for ease of getting help in general and on the application, the helpfulness of specialized call centre representatives and timeliness of service.
The largest gaps among eSIN clients were for ease of understanding information about the program, ease of getting help on the application, ease of figuring out eligibility and timeliness of service.
Compared to 2021-22, ratings have increased among SIN clients for ease of getting help and receiving consistent information, while eSIN clients provided higher ratings for ease of getting help on the application.
Executive Summary: Change in Client Experience by Program
SIN clients were more satisfied with certain aspects of service including the timeliness of service, overall ease of applying, helpfulness of Service Canada in-person representatives and the reasonableness of the distance travelled to access service compared to 2021-22.
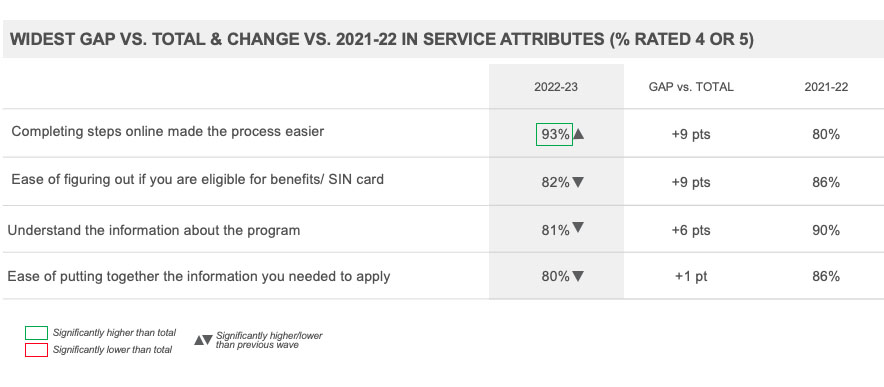
Compared to 2021-22, SIN clients provided higher ratings for the overall ease of applying (93% vs. 90%), the timeliness of service (87% vs. 82%), the ease of getting help in general (88% vs. 84%) and on the application specifically (83% vs. 78%), the helpfulness of Service Canada in-person representatives (96% vs. 92%) and that they travelled a reasonable distance to access service (79% vs. 73%). SIN clients provided lower ratings for being provided service in a way that protected them during the pandemic (85% vs. 90%).
OAS/GIS clients were more satisfied with the overall ease of applying and with the ease of getting help and completing the form.
Compared to 2021-22, OAS/GIS clients provided higher ratings for the overall ease of applying (87% vs. 80%), the ease of getting help in general (64% vs. 57%) and on the application specifically (62% vs. 54%) and the ease of completing the application form (83% vs. 73%).
CPP clients provided generally consistent ratings across most aspects of service and were more satisfied with the ease of follow-up.
Compared to 2021-22, CPP clients provided higher ratings for ease of following up on the application (73% vs. 64%). CPP clients provided lower ratings for being provided service in a way that protected them during the pandemic (77% vs. 84%) and the helpfulness of eServiceCanada representatives (63% vs. 84%).
Ratings among EI clients were largely consistent year over year.
Compared to 2021-22, EI clients provided higher ratings for being able to complete steps online made the process easier (89% vs. 86%) and that it was easy to get help when needed (70% vs. 63%) and lower ratings for being provided service in a way that protected them during the pandemic (81% vs. 88%).
CPP-D clients provided consistent ratings across nearly all aspects of service.
Compared to 2021-22, CPP-D clients provided lower ratings for being provided service in a way that protected them during the pandemic (75% vs. 81%).
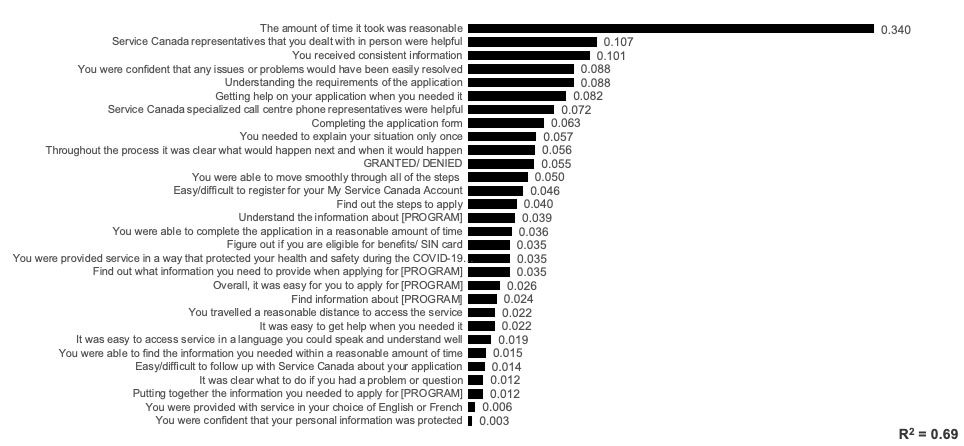
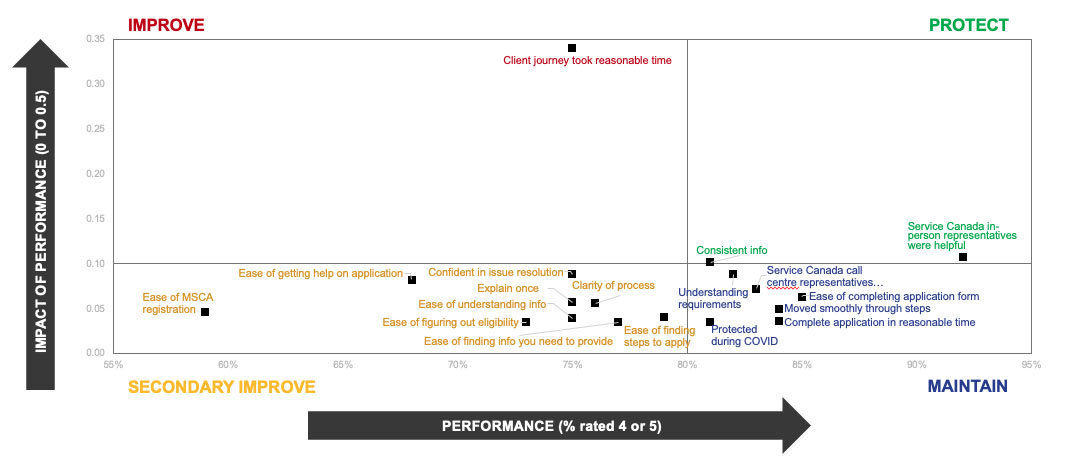
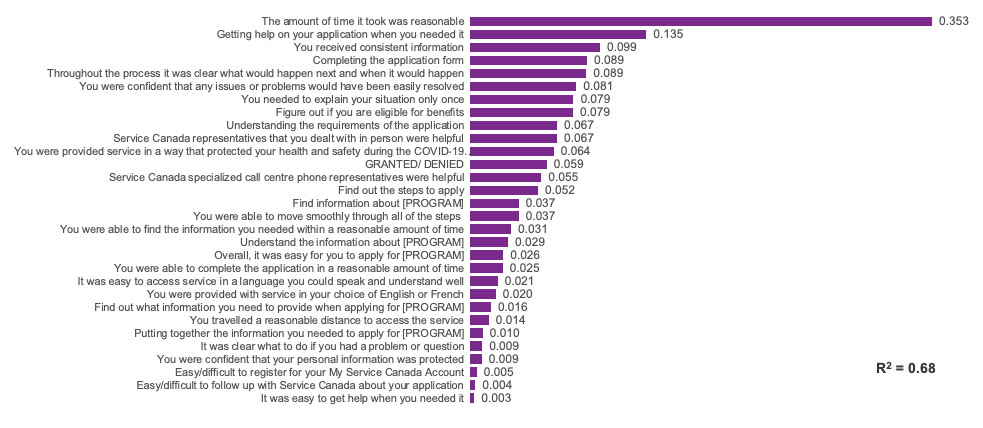
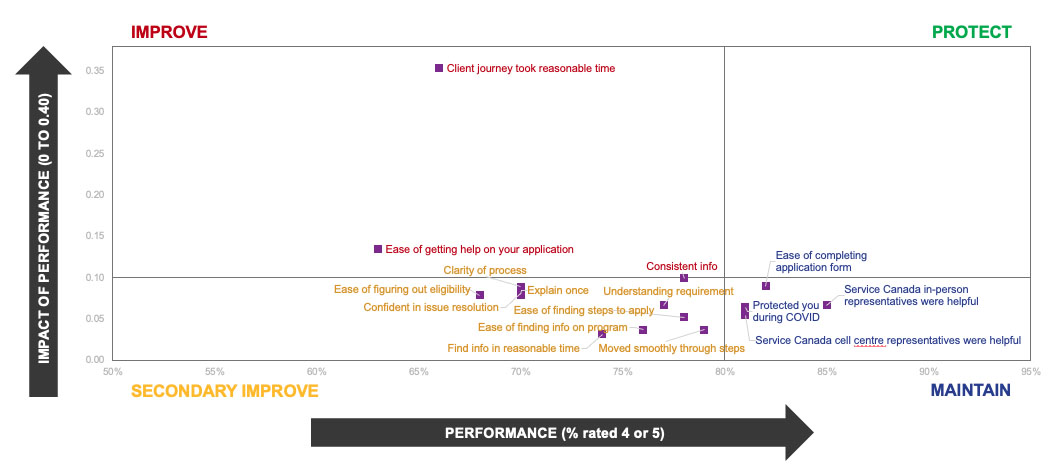
Executive Summary: Key Drivers of Satisfaction
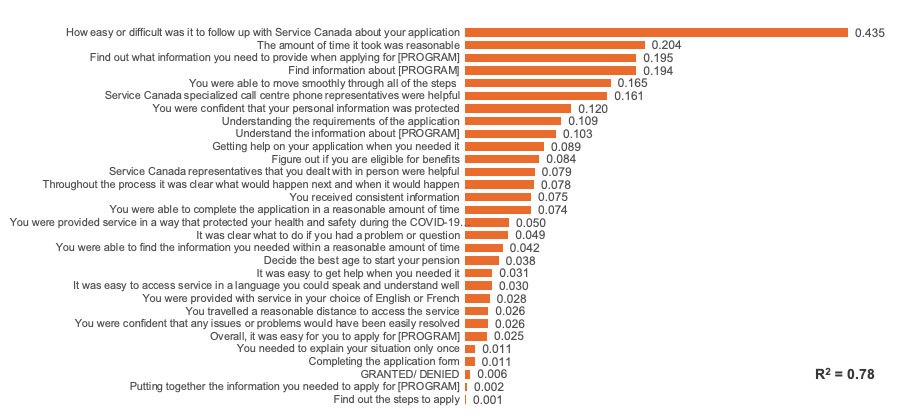
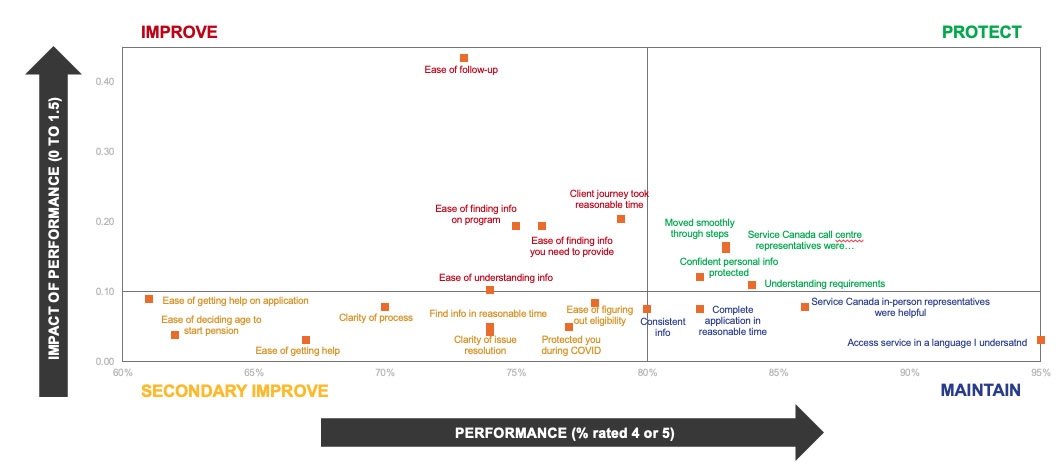
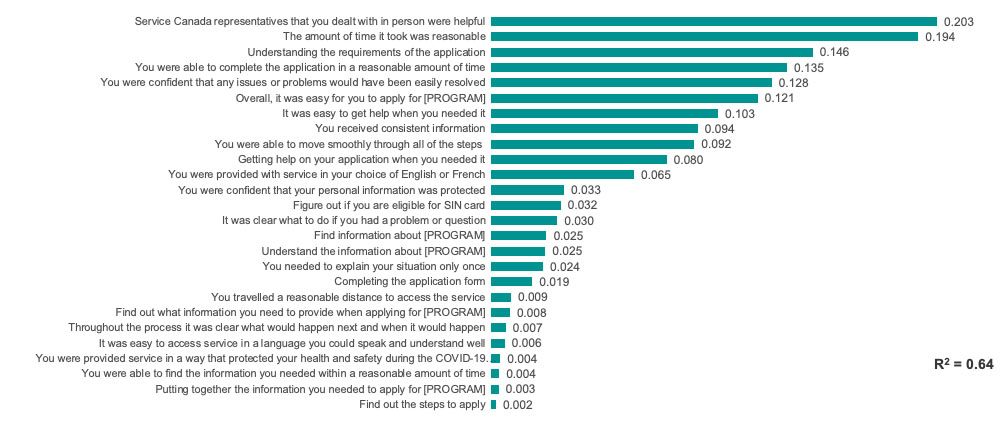
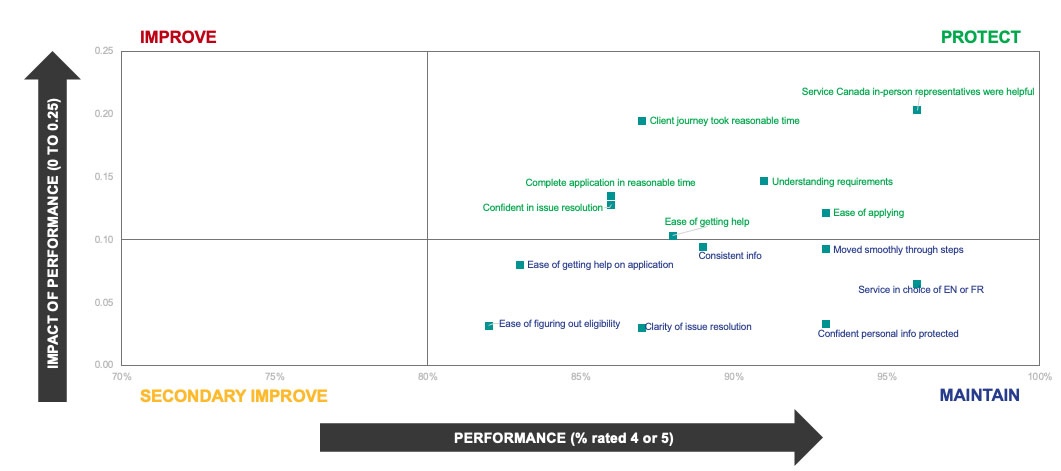
Key drivers of satisfaction represent the aspects of service which have the greatest impact on the clients’ overall impressions of their experience. The top most important driver of satisfaction continued to be the amount of time it took from start to finish was reasonable. Prominent secondary drivers included the helpfulness of Service Canada in-person representatives, receiving consistent information, confidence in issue resolution, understanding the requirements and getting help on the application.
Year over year, performance has improved on the helpfulness of Service Canada in-person representatives and getting help on the application when needed.
To improve the service experience for Service Canada clientele as a whole, focus should continue to be placed primarily on improving the timeliness of service. Areas of secondary importance for improvement include the ease of getting help on your application and to a lesser extent confidence in the issue resolution process.
The top-most important driver remained consistent this year, while receiving consistent information, understanding the requirements of the application, getting help on your application when needed and ease of completing the application form have taken on increased importance in driving satisfaction. The helpfulness of call centre representatives was less impactful than last year.
Ratings for timeliness of service and reported duration of the client journey were consistent with last year; three-quarters (75%) of clients found the amount of time it took reasonable and nearly two-thirds (63%) reported that their client journey took four weeks or less.
Executive Summary: Drivers of Satisfaction by Program
The aspects of service that had the greatest impact of satisfaction continued to differ significantly by program. Timeliness of service remained the most common key driver for all programs except OAS/GIS, while ease of follow-up was the top driver for CPP and OAS/GIS. The helpfulness of call centre representatives was also among the most prominent drivers of satisfaction for CPP and CPP-D clients. The helpfulness of in-person representatives was a prominent driver for SIN clients.
Current areas that were performing strongly and were correlated to satisfaction include the helpfulness of in-person representatives for SIN and EI clients, timeliness of service for SIN and OAS/GIS clients and the helpfulness of Service Canada call centre phone representatives for CPP and EI clients. Performance in these areas should be protected in order to maintain satisfaction given the strong impact they have on impressions of the overall client experience.
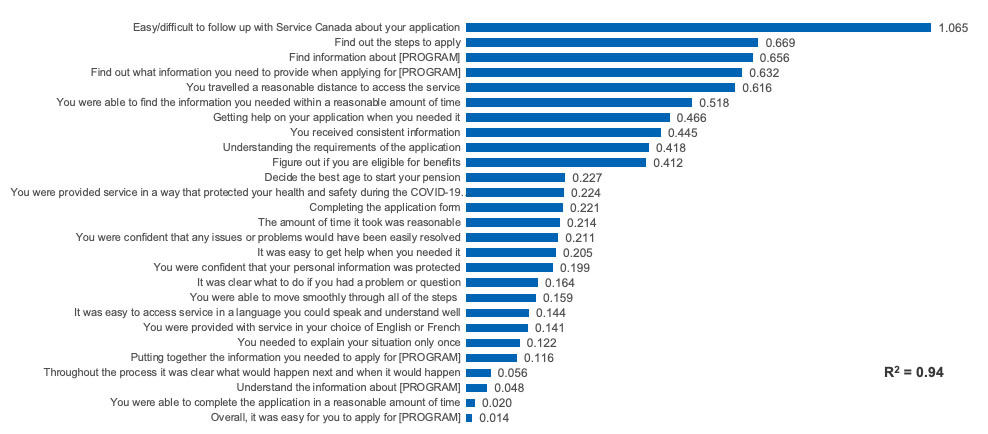
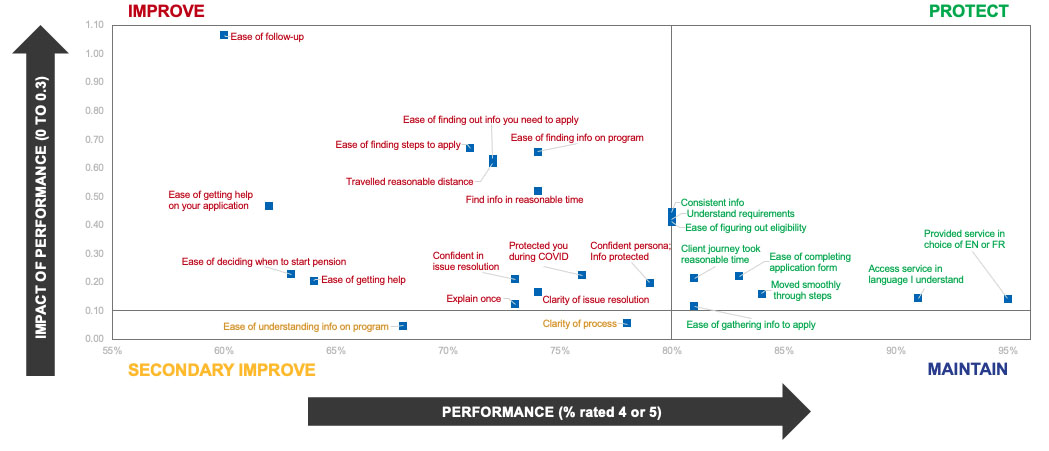
The greatest opportunities to improve service across programs which represent areas strongly correlated to satisfaction where performance was lower to other areas differed significantly by program.
For all programs except SIN and OAS/GIS, it will be important to improve the timeliness of service.
For CPP and OAS/GIS clients, it will be important to improve the ease of follow-up and the ease of finding what information you need to provide when applying.
For CPP clients, it will also be important to improve the ease of finding information on the program.
For OAS/GIS clients, it will also be important to improve ease of finding the steps to apply and information on the program and travelling a reasonable distance to access service.
For EI, OAS/GIS and CPP-D clients, it will be important to improve the ease of getting help on the application.
For EI clients, it will also be important to improve receiving consistent information.
For CPP-D clients, it will also be important to improve moving smoothly through all steps, the ease of gathering the information needed to apply and ease of follow-up.
Executive Summary: Change in Channel Use
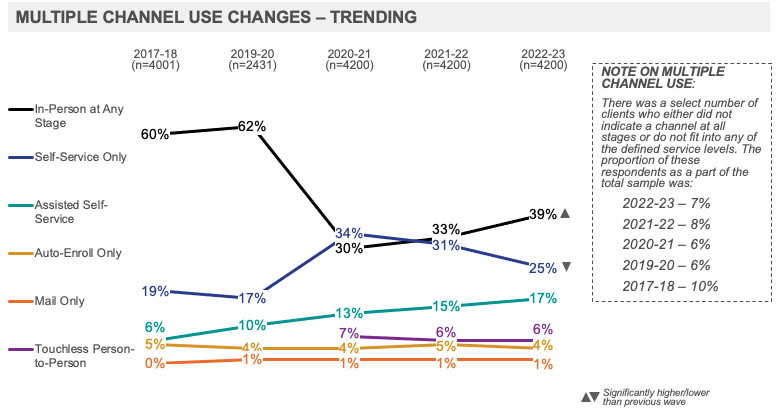
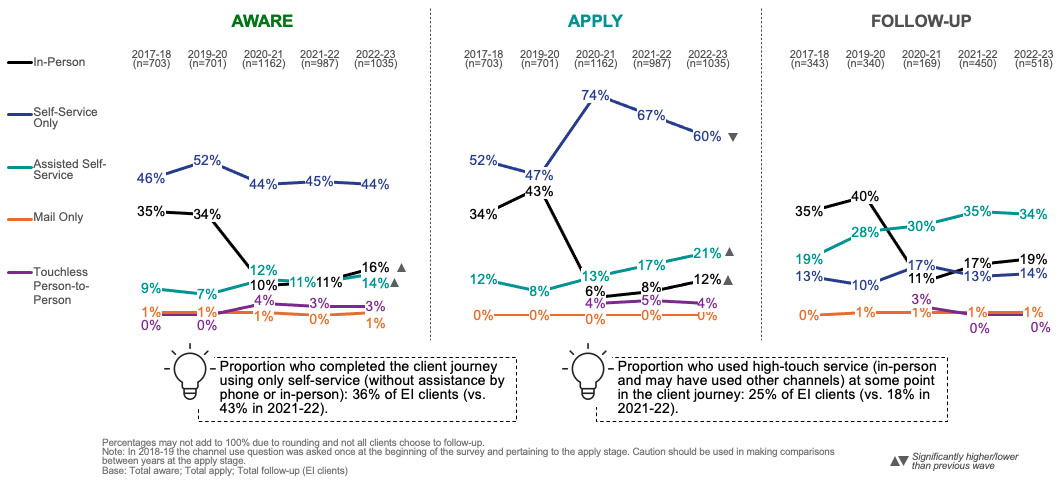
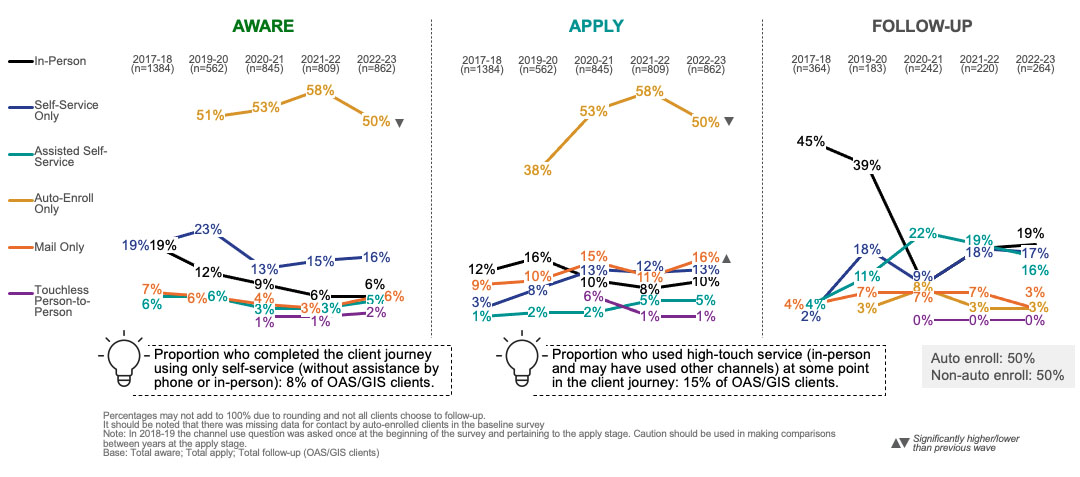
Channels used, in particular in-person and online, has not returned to pre-pandemic levels, possibly indicating the longer-term impacts of service transformation changes and evolving service channel preferences. Overall, in 2022-23, channel use among clients sees more use of in-person but is still far off levels observed prior to the pandemic. Clients were more likely to utilize in-person service during the entire client journey and less likely to have used self-service only for the second consecutive year. Use of in-person service, while still considerably lower than in 2019-20 or earlier, was utilized more than self-service only this year.
At nearly four in ten, the largest proportion of clients used in-person service (39%) at some point, followed by those who used self-service online only (25%), while just under two in ten used assisted self-service (17%). Six percent utilized the touchless person-to-person service, while 4% were auto-enrolled only and 1% used mail only.
Clients were more likely to have used in-person service at the aware and apply stages compared to 2021-22. Clients were also more likely to have used assisted-self-service at the aware stage and less likely to have used self-service only at the apply stage.
EI clients were more likely to have used in-person service or assisted self-service at the aware and apply stages and less likely to have used self-service only at the apply stage.
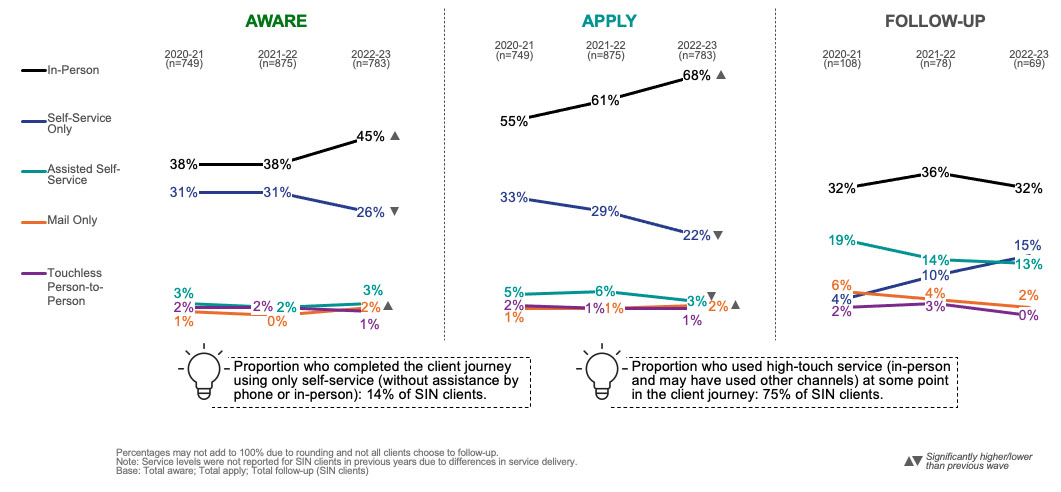
SIN clients were more likely to have used in-person or mail only at the aware and apply stages and less likely to have used self-service only or assisted self-service. Service levels remained consistent at the follow-up stage compared to last year.
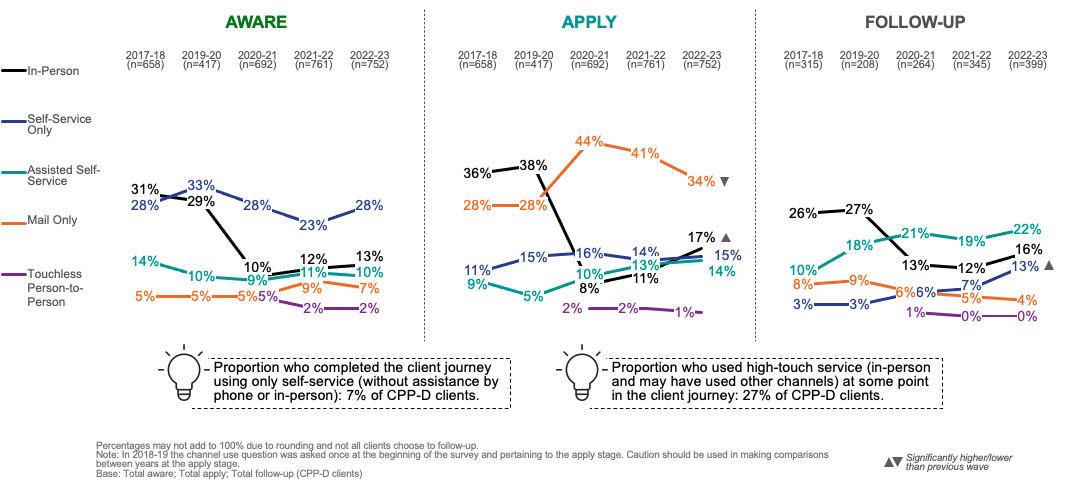
CPP-D clients were more likely to have used in-person service at the apply stage and less likely to have used mail-only. They were also more likely to have used self-service only at the follow-up stage.
OAS/GIS clients were less likely to be auto-enrolled this year which meant more OAS/GIS clients overall engaged in the aware or apply stages. OAS/GIS clients were more likely to have used mail only at the apply stage, while service levels remained consistent at the aware and follow-up stages.
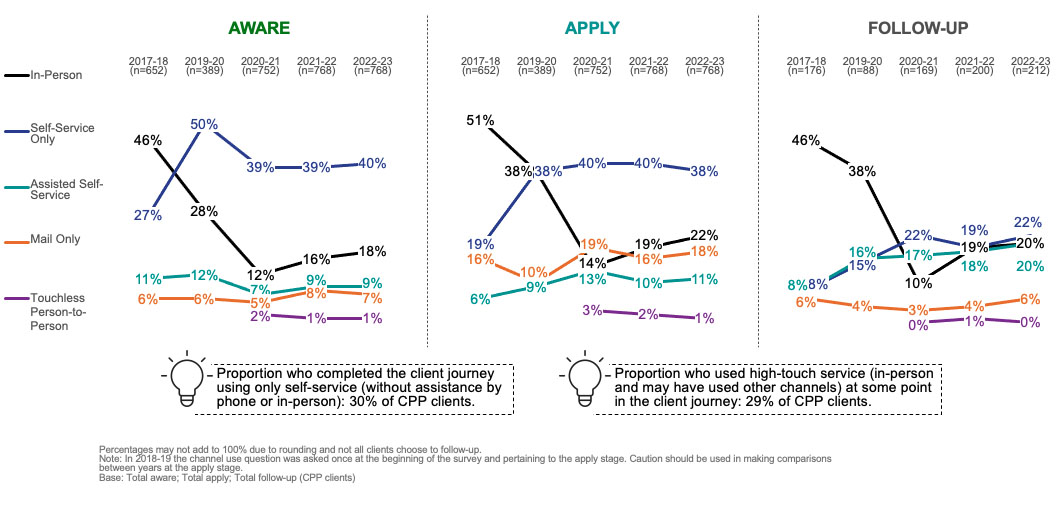
Service levels among CPP clients remained consistent across all stages of the client journey.
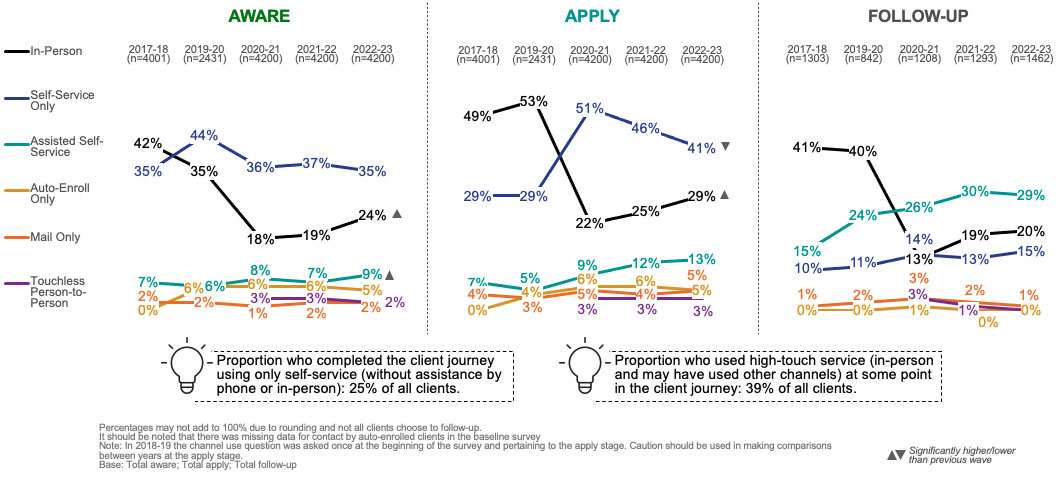
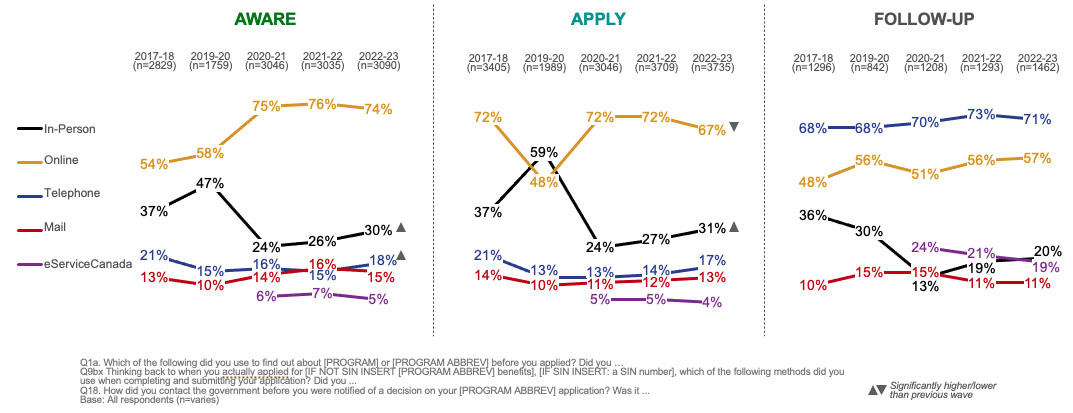
Executive Summary: Channel Use by Stage
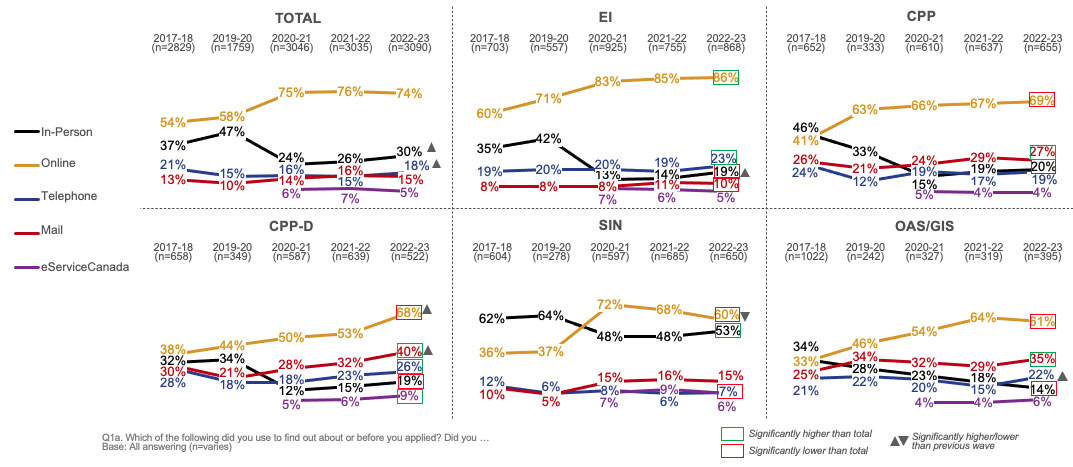
Channel use was largely consistent across all stages of the client journey and online continued to be the most commonly used channel at the aware and apply stages and telephone at the follow-up stage. Use of the in-person channel increased at the aware and apply stages, but continued to be much lower than in 2019-20 or earlier, while a higher proportion used the telephone channel at the apply stage and fewer the online channel at the apply stage.
During the aware stage, clients continued to be most likely to use online government sources (74%) followed by in-person service (30%), the telephone channel (18%), mail (15%) or eServiceCanada (5%). Use of in-person and telephone service increased compared to last year.
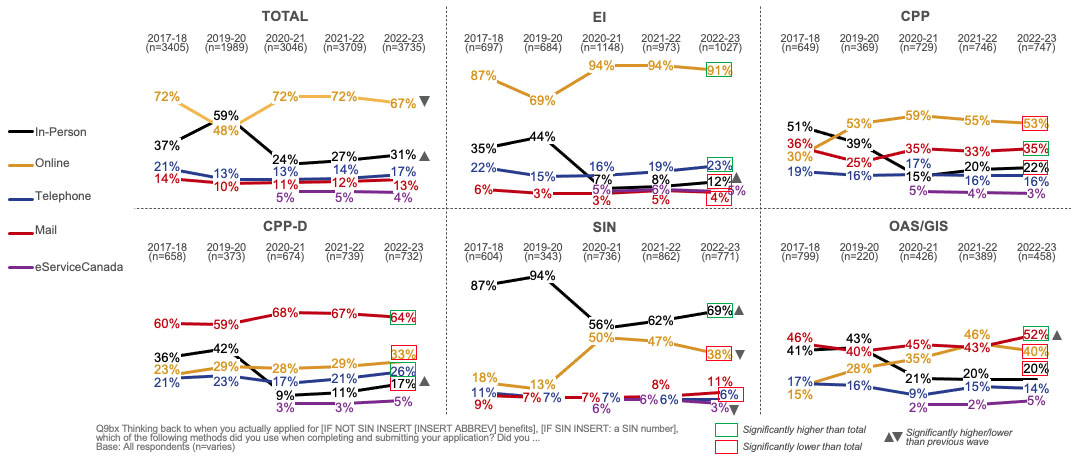
During the apply stage, clients were most likely to use the online channel (67%), followed by in-person service (31%), telephone (17%), mail (13%) and eServiceCanada (4%). Use of in-person service increased compared to last year, while use of the online channel declined.
Among clients who followed-up, telephone (71%) continued to be the most common channel, followed by online (57%). Two in ten used in-person service (20%) or eServiceCanada (19%), while one in ten followed-up by mail (11%). Channel use remained consistent with last year.
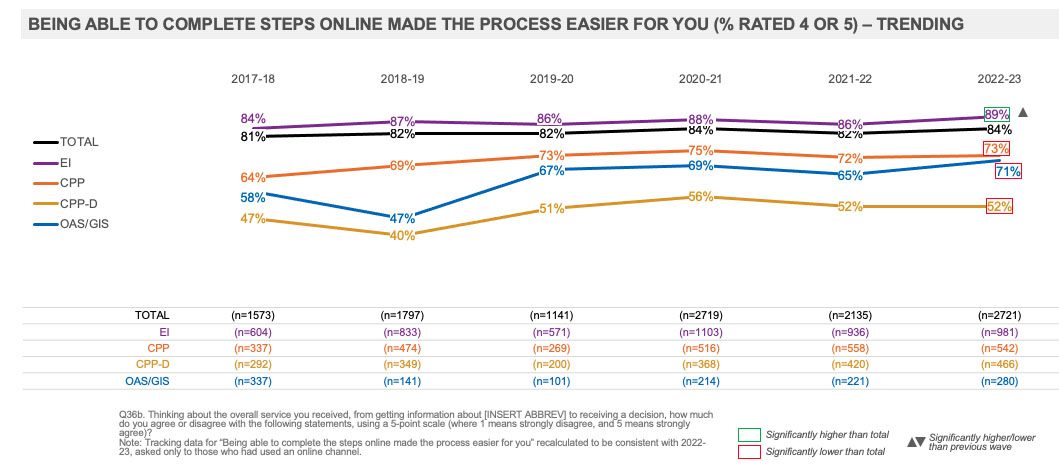
Clients were more likely to feel that being able to complete steps online made the process easier than last year. Progress has been made among clients of all programs, however CPP-D clients in particular and to a lesser extent CPP and OAS/GIS clients continued to experience more challenges with the ease of digital services.
More than eight in ten clients (84%) agreed that being able to complete steps online made the process easier, higher than in 2021-22 (82%).
EI clients were more likely to agree that being able to complete steps online made the process easier compared to all clients, while CPP, OAS/GIS and CPP-D clients were less likely.
Compared to 2021-22, ratings have increased overall and among clients of all programs.
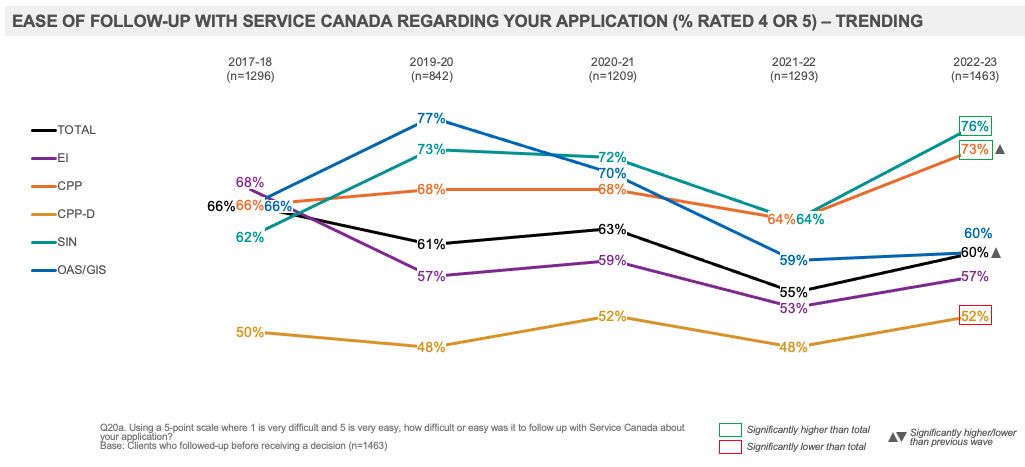
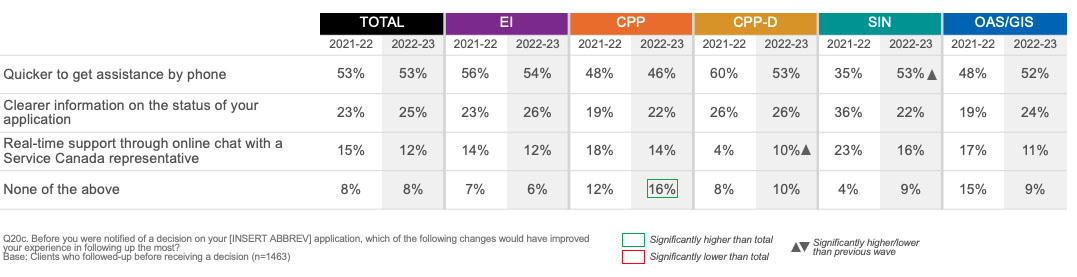
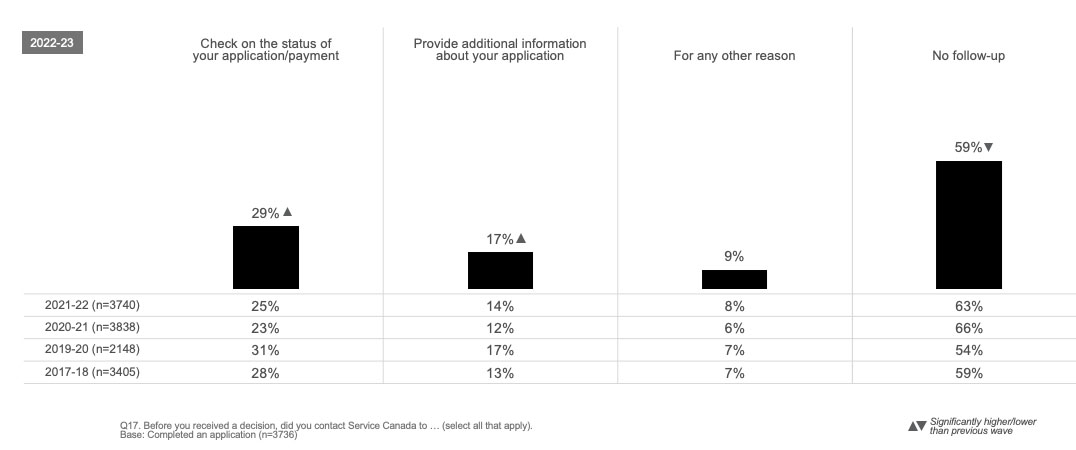
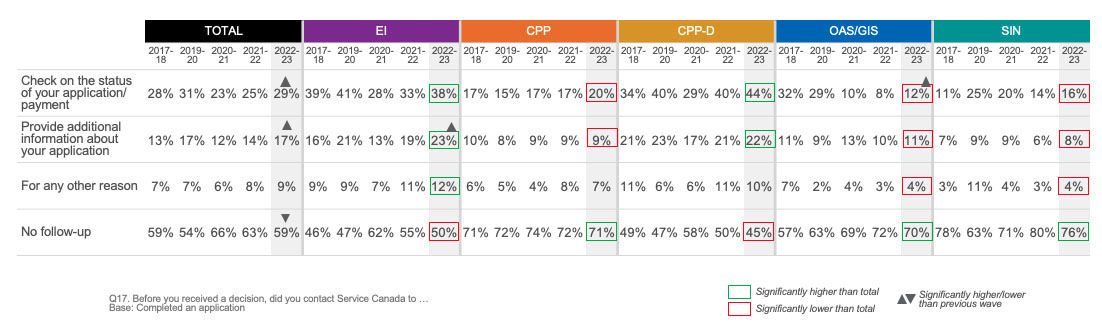
A higher proportion of clients followed up before receiving a decision this year and felt it was easy to do so. The most common reasons for follow-up remained to check on the status of their application/payment, followed by to provide additional information.
EI and CPP-D clients were more likely to have followed-up compared to all clients, while CPP, OAS/GIS and SIN clients were less likely. Compared to 2021-22, EI clients were more likely to have followed-up to provide additional information, while OAS/GIS clients were more likely to have followed-up to check on the status of their application/payment.
Among those who followed-up, six in ten (60%) found it easy to do so, higher overall and among CPP clients than last year. CPP-D clients were less likely to have felt it was easy to follow-up compared to all clients, while SIN and CPP clients were more likely.
Executive Summary: Number of Channels and Multi-Channel Use
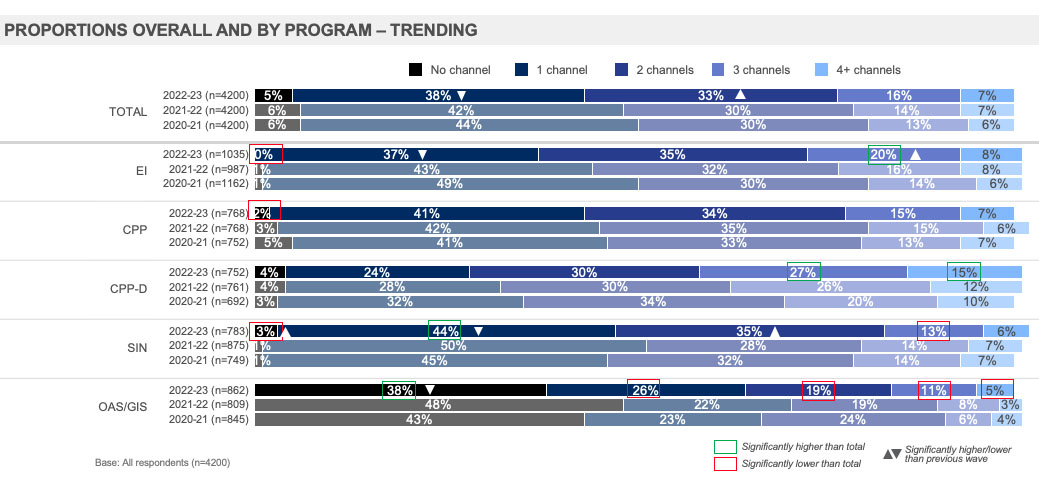
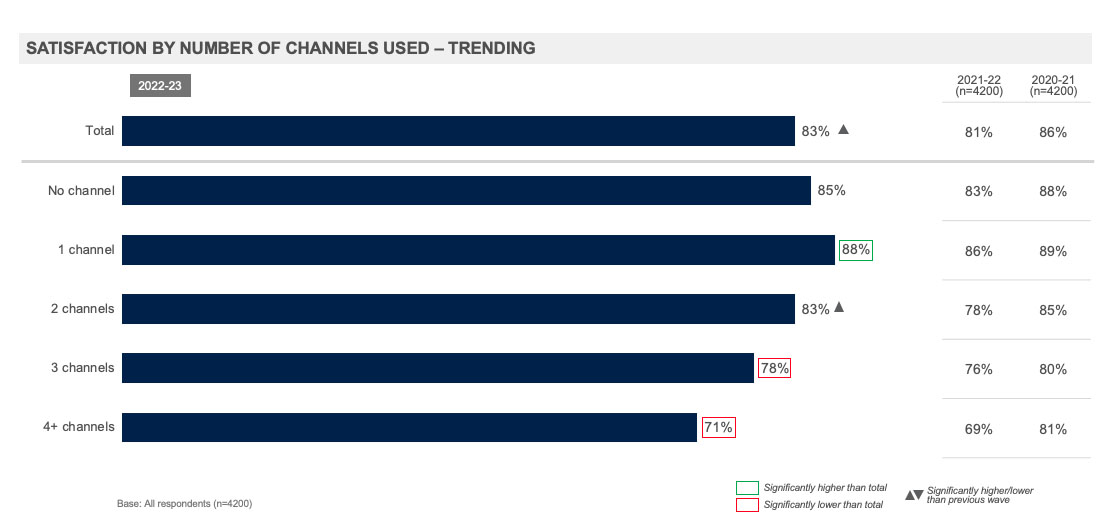
The greater the number of channels a client used during the service experience, the lower their satisfaction was with the overall experience. Those who used three or more channels were less satisfied, while those who used one channel were more satisfied.
Overall, just under four in ten clients used one channel during their client journey (38%), followed by one-third (33%) who used two, just under two in ten (16%) who used three and 7% who used four or more. SIN clients were more likely to have used only one channel, and OAS/GIS clients no channels, while EI clients were more likely to have used three channels and CPP-D clients three or more channels.
Compared to 2021-22, EI and SIN clients were less likely to have used one channel, with EI clients more likely to have used three channels and SIN clients two channels. OAS/GIS clients were less likely to have used no channels (due to a higher proportion who were non-Auto enrolled this year).
Clients who utilized three or more channels had lower overall satisfaction with their service experience compared to all clients, while those who used one channel had higher satisfaction. Compared to 2021-22, satisfaction has increased among those who used two channels.
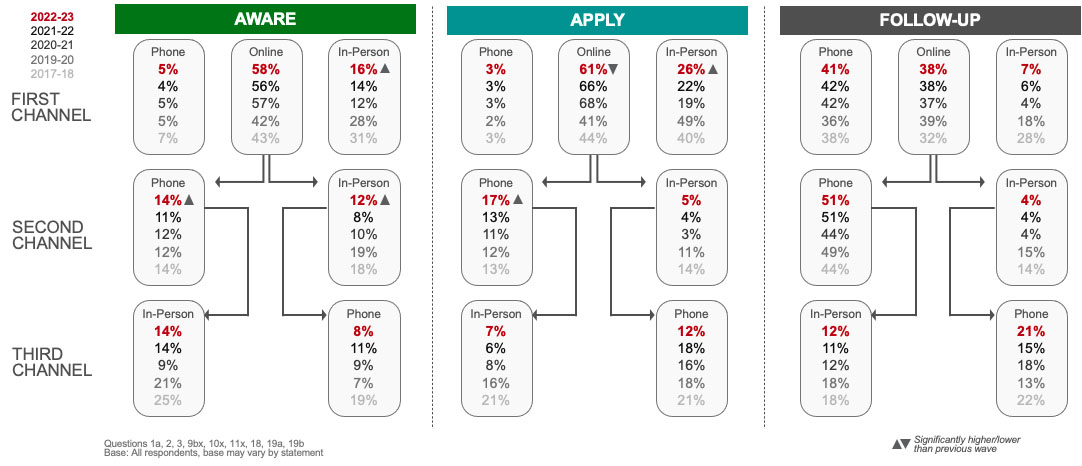
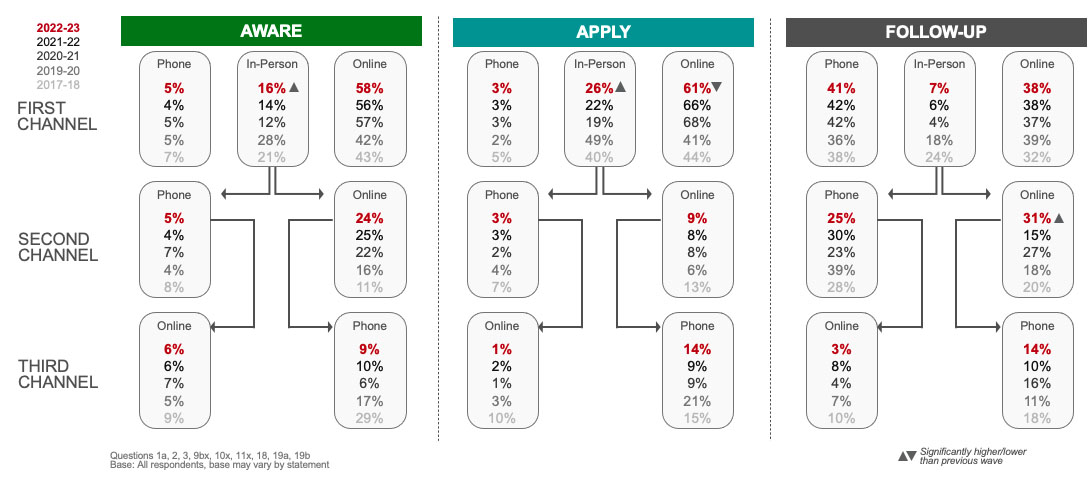
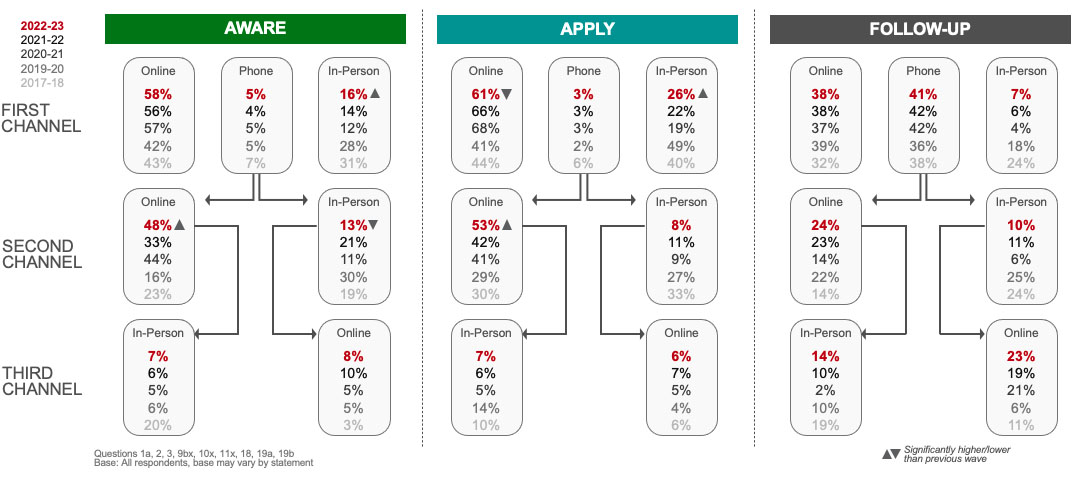
The majority of clients used only one channel during the aware and apply stages, while most of those who follow-up before receiving a decision continued to use more than one channel. The online channel remained the first point of contact for most clients at the aware and apply stages while telephone was used slightly more for following up. Use of in-person has increased as the first point of contact for the aware and apply stages, while fewer used online at the apply stage.
Clients who used telephone first at the aware or apply stages continued to be more likely to use a second channel than those who started online or in-person. Online was the most common second channel among those who began on the phone at all stages and those who used in-person at the aware stage. Among those who used online first, clients were more likely to have used phone as a second channel at the follow-up and apply stage.
Compared to 2021-22, use of in-person as the first point of contact increased at the aware and apply stages, while use of online decreased at the apply stage.
Among those who used the online channel first at the aware stage, clients were more likely to use phone or in-person as a second channel, while those who used online first at the apply stage were more likely to use phone as a second channel.
Among those who used in-person first at the follow-up stage, clients were more likely to use online as a second channel.
Among those who used telephone first at the aware stage, clients were more likely to use online as a second channel and less likely to use in-person. Use of online also increased as a second channel at the apply stage.
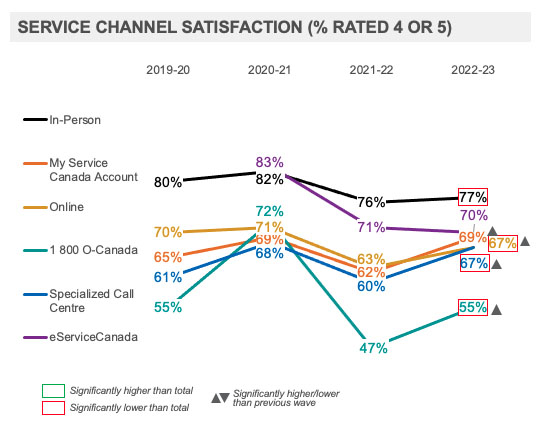
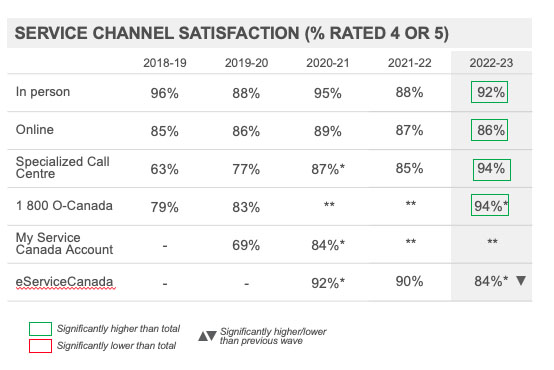
Executive Summary: Service Channel Assessment
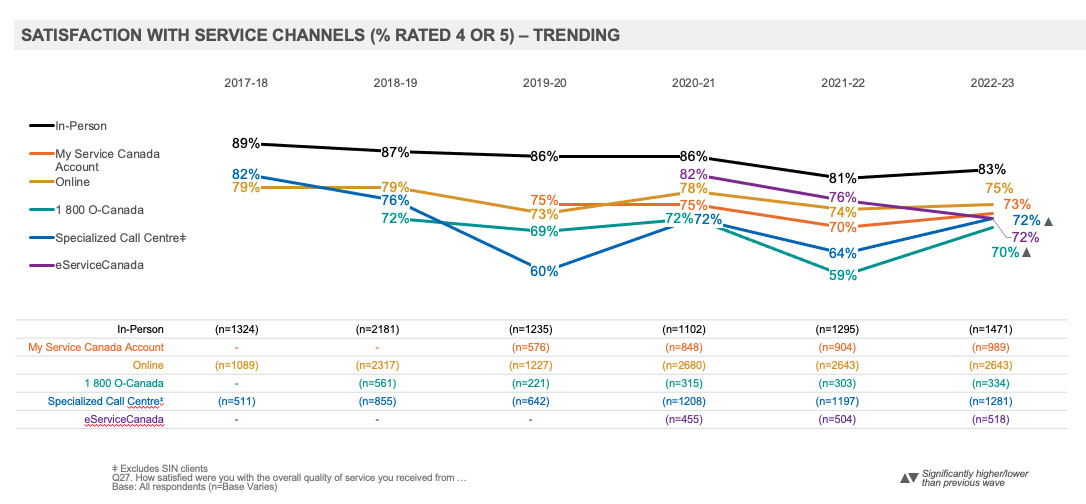
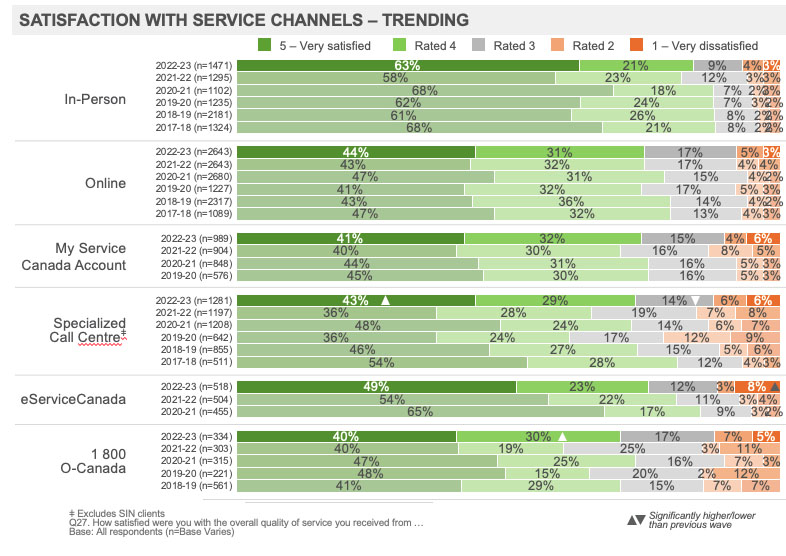
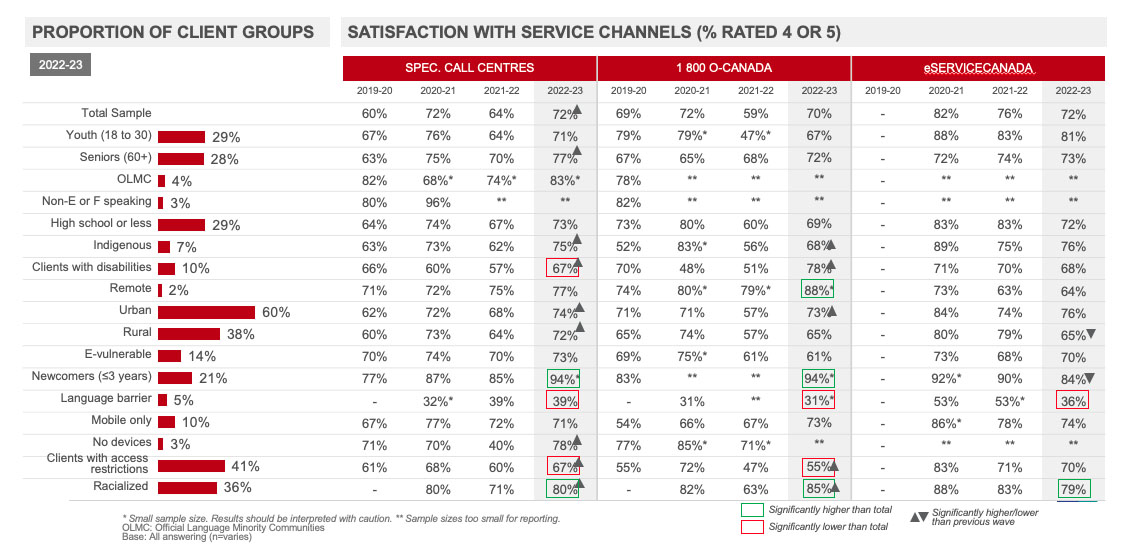
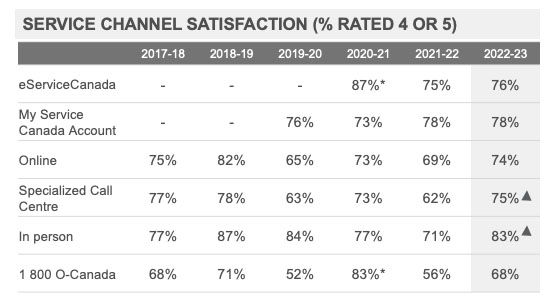
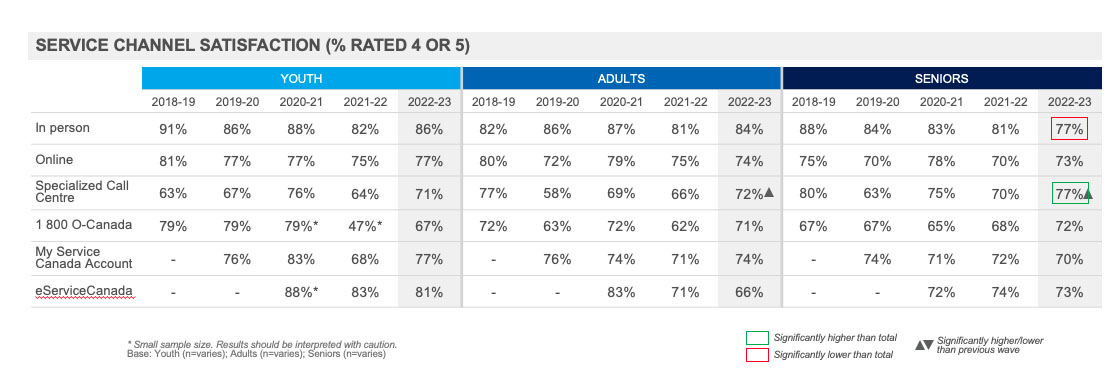
Satisfaction with the quality of service by channel remained largely consistent this year and was highest for the in-person service experience and lowest for both telephone channels and eServiceCanada. Ratings have increased for specialized call centres, while satisfaction with eServiceCanada has declined directionally continuing the downward trend observed last year.
Satisfaction with in-person service remained the highest (83%), followed by online (75%), MSCA (73%), specialized call centres (72%), eServiceCanada (72%) and 1 800 O-Canada (70%). Compared to 2021-22, satisfaction increased for specialized call centres and 1 800 O-Canada. Satisfaction with all other service channels remained consistent, however ratings for eServiceCanada declined directionally for the second consecutive year and were statistically lower than in 2020-21.
Among those who used in-person service, the vast majority felt that Service Canada representatives were helpful (92%) and that it was easy to get help when they needed it (84%) and ratings have increased across both measures compared to 2021-22.
Among those who used eServiceCanada, a higher proportion rated their satisfaction 1 out of 5 this year and ratings for the ease and effectiveness of the process and ease of finding information about the program, while relatively strong, were lower compared to all clients.
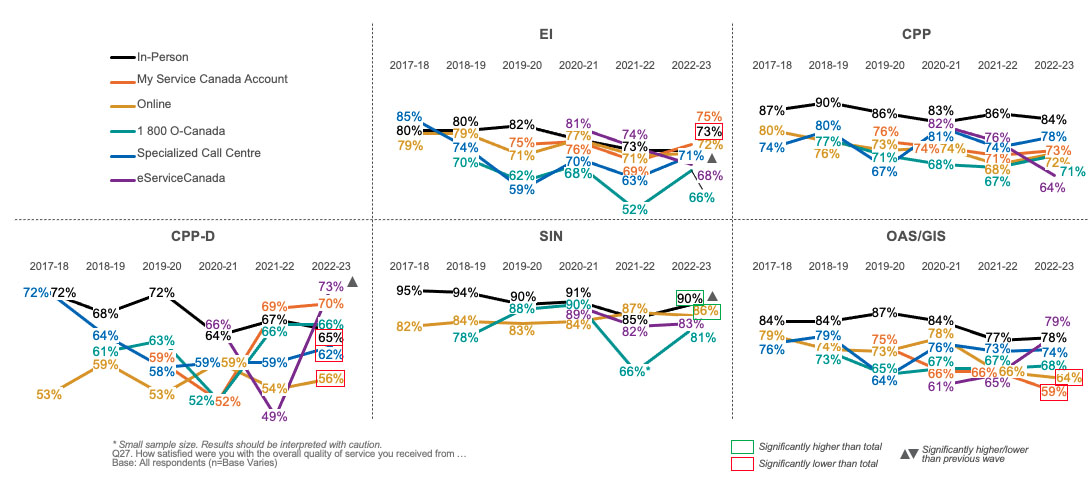
CPP-D clients rated their satisfaction with in-person service, specialized call centres and online lower compared to all clients, EI clients for in-person service and OAS/GIS clients for online and MSCA. SIN clients provided higher ratings for in-person and online.
Compared to 2021-22, EI clients provided higher ratings for their satisfaction with specialized call centres, CPP-D clients provided higher ratings for eServiceCanada and SIN clients for in-person service.
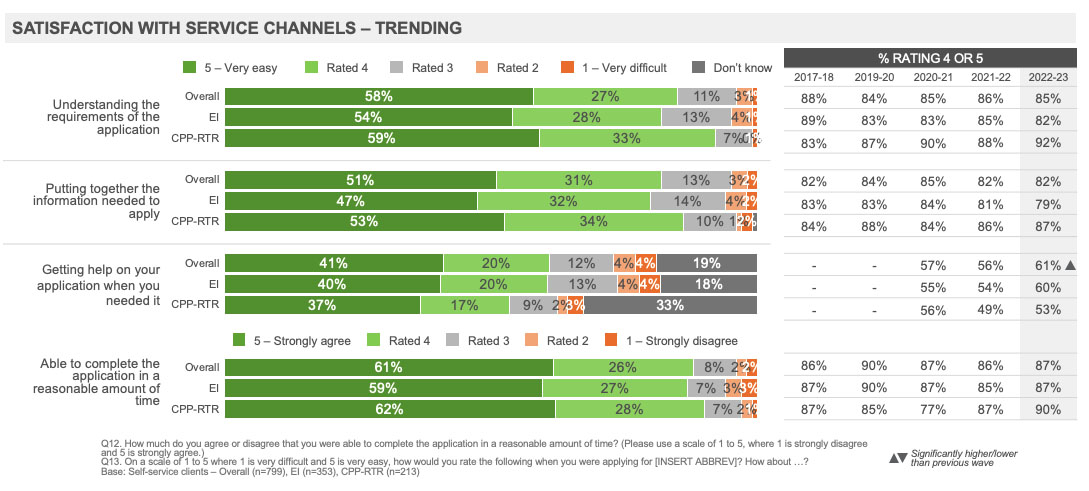
The vast majority of self-serve clients continued to find the online application process easy and improvement has been made on getting assistance when needed.
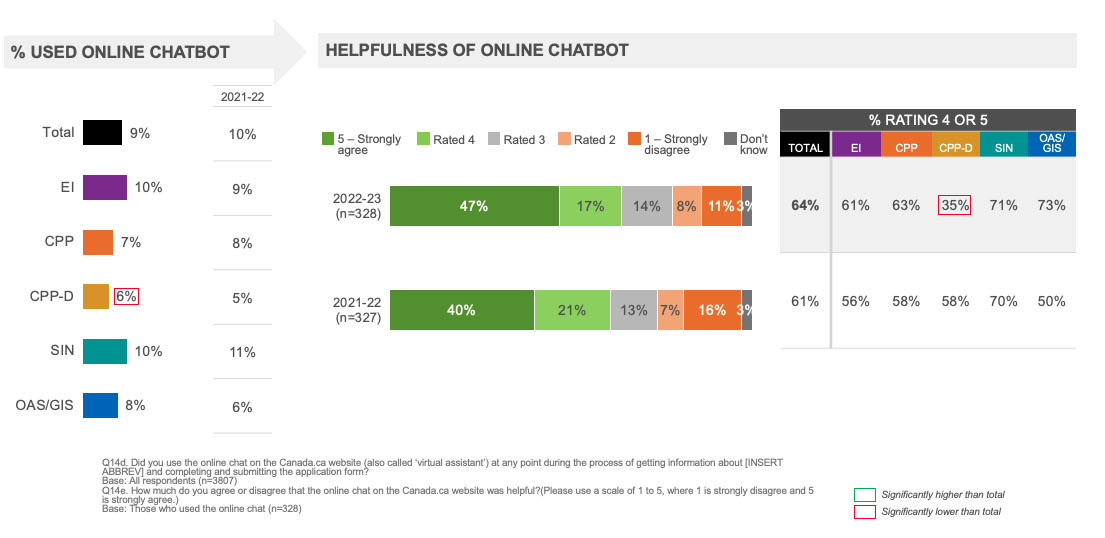
Between eight to nine in ten self-serve clients found it easy to understand the requirements of the application (85%), put together the information needed (82%) and to complete the application in a reasonable amount of time (87%). Closer to six in ten clients found it was easy to get help on their application when they needed it (61%) and ratings have improved among self-serve clients overall compared to last year (56%). Results were consistent among EI and CPP-Retirement (RTR) clients.
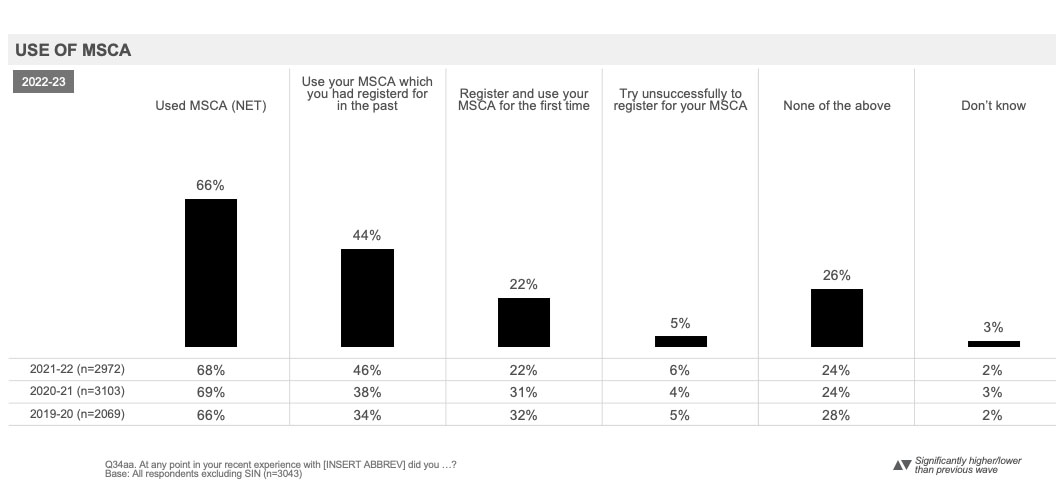
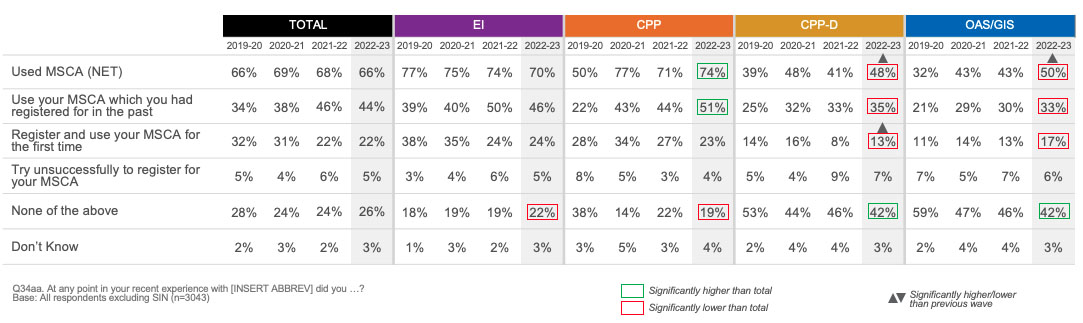
The vast majority of EI and CPP clients and half of CPP-D and OAS/GIS clients used MSCA at some point during their service experience. Use of MSCA has increased among CPP-D and OAS/GIS clients but registration continued to pose more difficulties for clients of both programs. Ease of registering has rebounded among EI clients after declining last year, while CPP clients found it easier to sign-in.
Three-quarters of CPP clients (74%), seven in ten EI clients (70%) and half of CPP-D (48%) and OAS/GIS clients (50%) used MSCA during their experience. Compared to 2021-22, a higher proportion of CPP-D (48% vs. 41%) and OAS/GIS clients (50% vs. 43%) used MSCA.
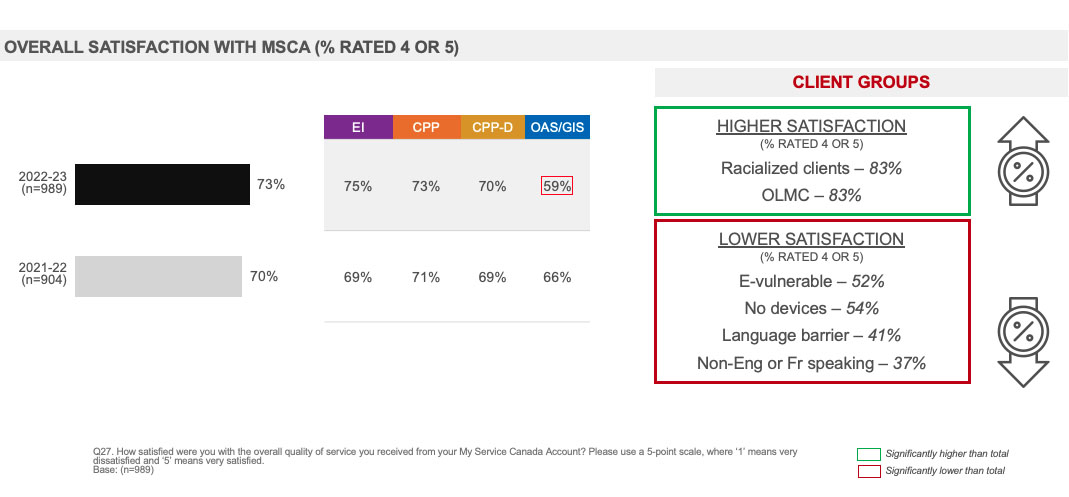
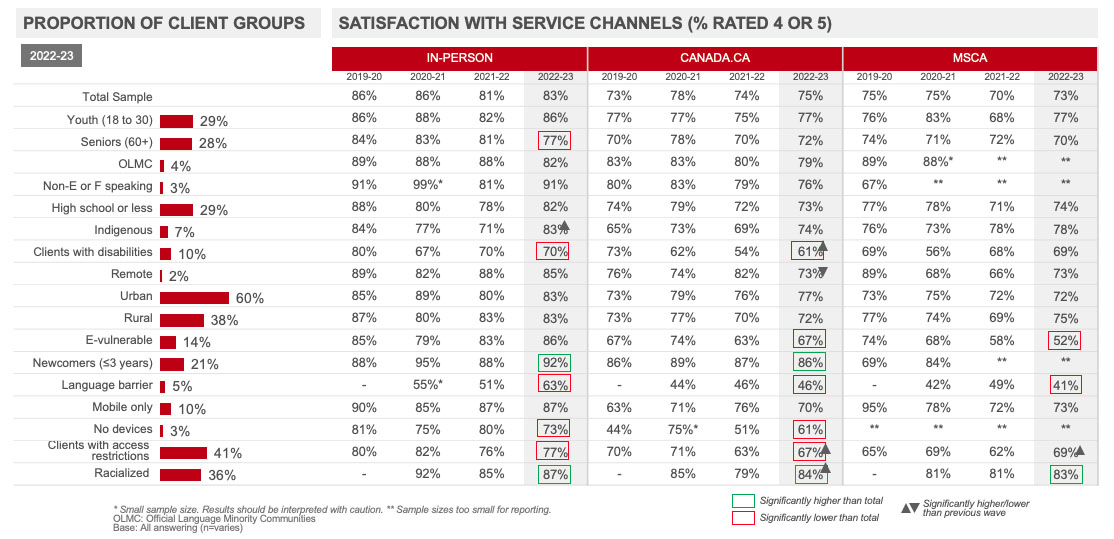
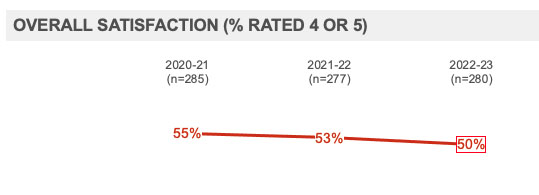
Nearly three-quarters (73%) of clients who used their MSCA were satisfied with the overall quality of service they received. OAS/GIS clients were less likely to be satisfied with the service received through MSCA (59%) and satisfaction was also lower among clients with no devices (53%), those who are E-vulnerable (52%), those with a language barrier (41%) and non-English or French speakers (37%).
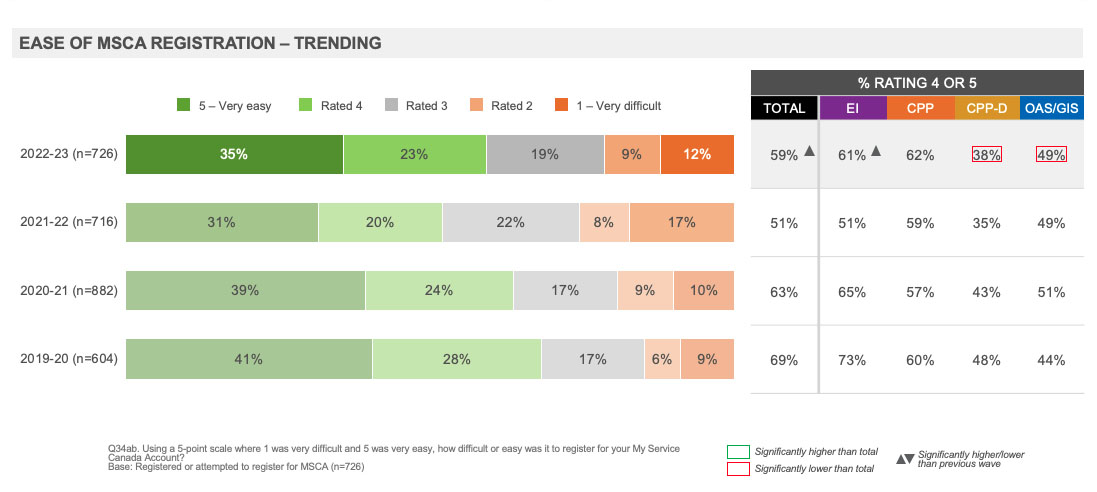
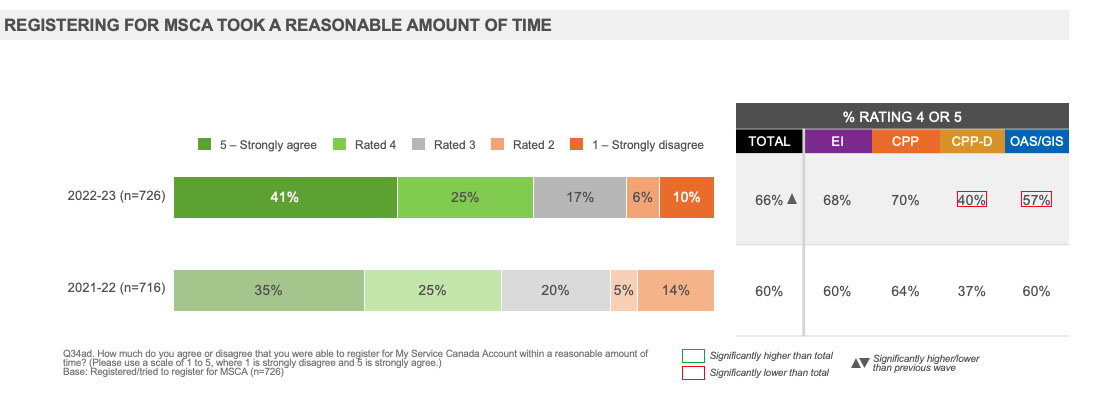
Six in ten clients (59%) who registered for their MSCA for the first time found it easy to do so, higher than in 2020-21 (51%) due to an increase in ratings among EI clients. Two-thirds (66%) agreed that the registration process took a reasonable amount of time, consistent with 2021-22. CPP-D and OAS/GIS clients were less likely to feel it was easy to register for their MSCA in a reasonable amount of time.
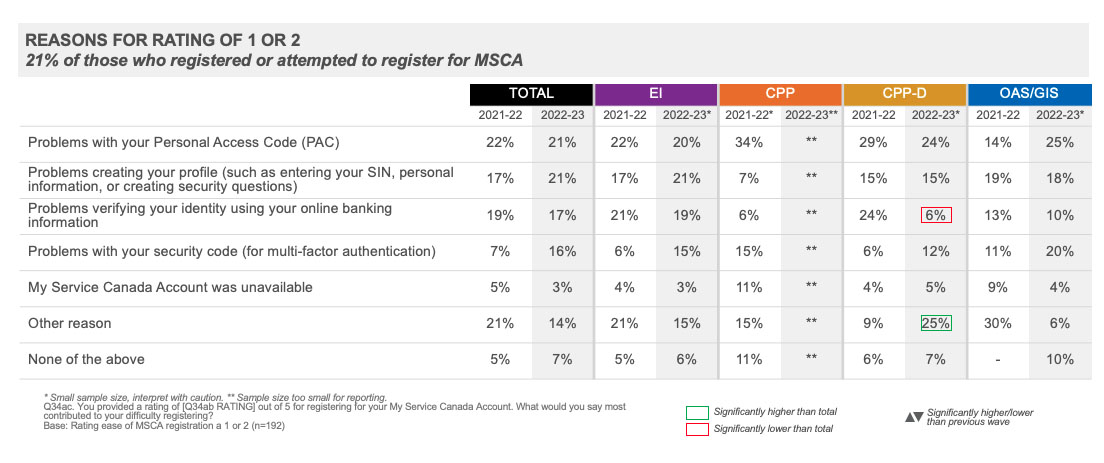
Among those who had difficulty registering, the most common reasons were that they experienced problems with their personal access code or creating their profile, followed by problems verifying their identity using their online banking information.
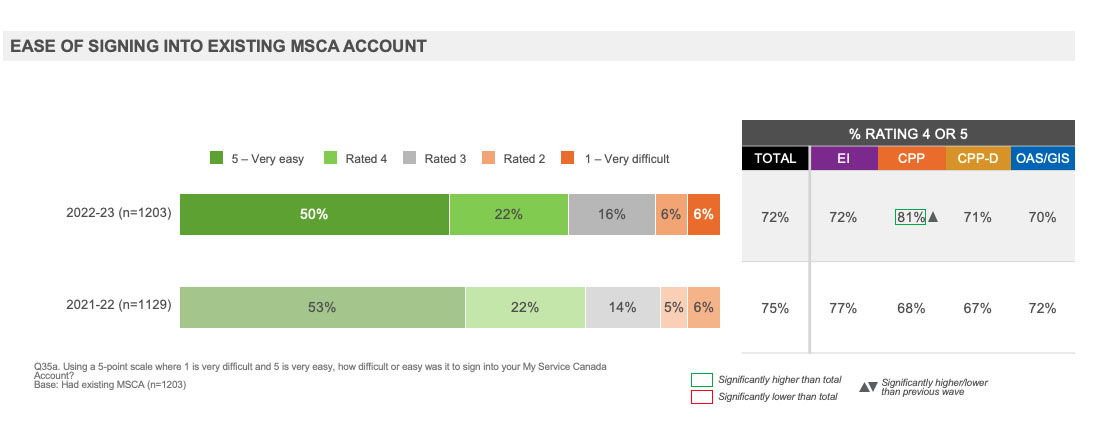
Just over seven in ten (72%) of those with an existing MSCA found it easy to sign into their account. CPP clients were more likely to find it easy to sign in compared to all clients and ratings have increased compared to 2021-22.
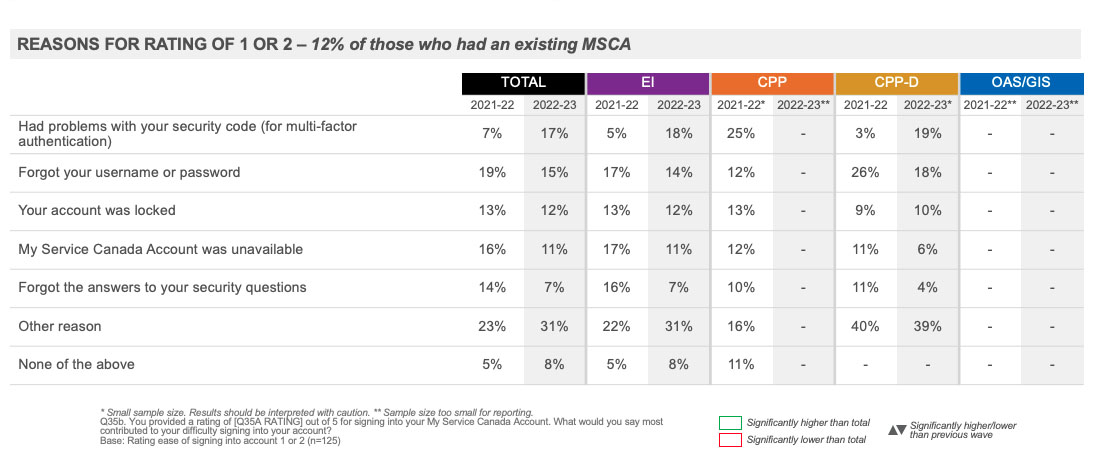
Among those who had difficulty, the most common reasons were problems with their security code, followed by they forgot their username or password, their account was locked or MSCA was unavailable.
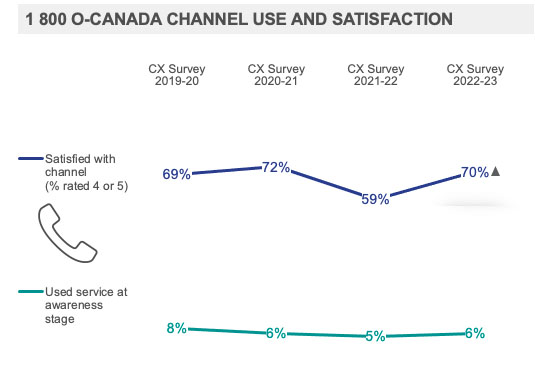
Use of 1 800 O-Canada at the aware stage continued to be limited and, on par with past years, was generally consistent among most client groups. Satisfaction with the quality of service has improved directionally this year and ratings were notably higher among certain client groups.
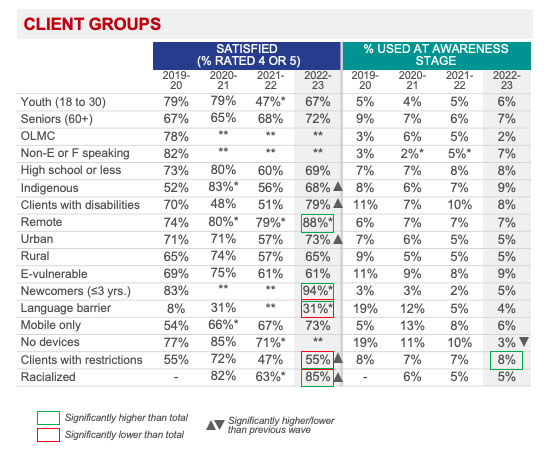
Overall, 6% of all clients used 1 800 O-Canada at the aware stage to learn about the program they were applying for, consistent with 2021-22. Usage at the aware stage was higher among clients with a high school education or less, Indigenous clients, E-vulnerable and clients with restrictions.
Seven in ten (70%) were satisfied with the quality of service provided through 1 800 O-Canada, directionally higher than 2021-22 (59%). Satisfaction was higher among remote clients, newcomers and Racialized clients compared to all clients who used 1 800 O-Canada and lower among those with a language barrier or clients with restrictions. Compared to 2021-22, satisfaction has increased among Indigenous clients, those who live in an urban area, clients with restrictions and Racialized clients.
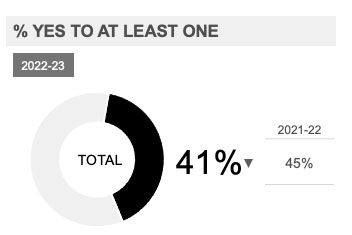
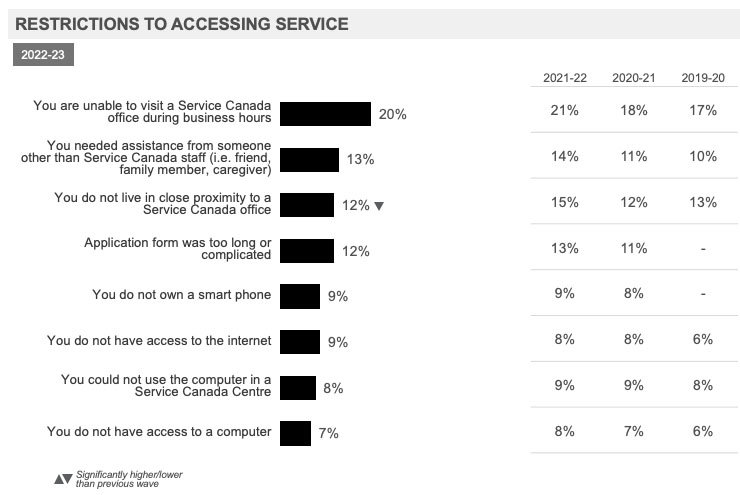
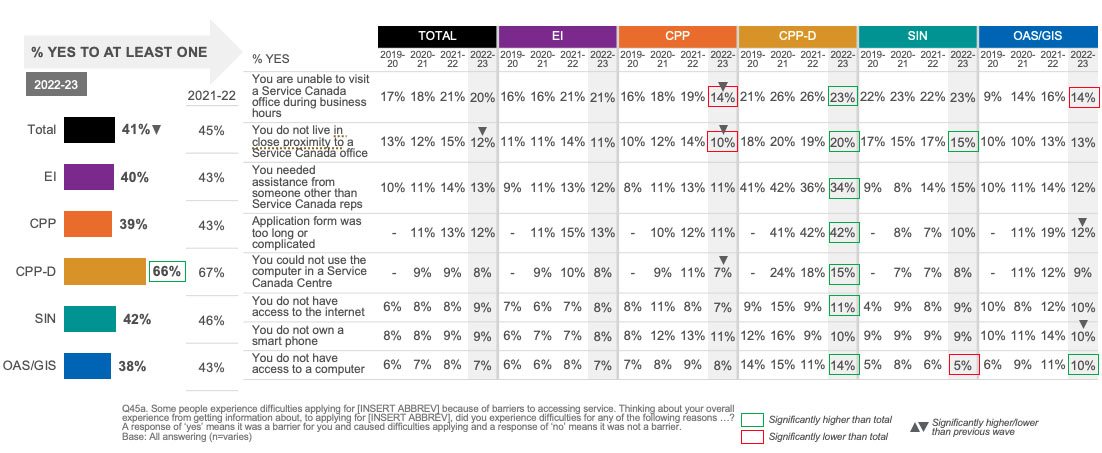
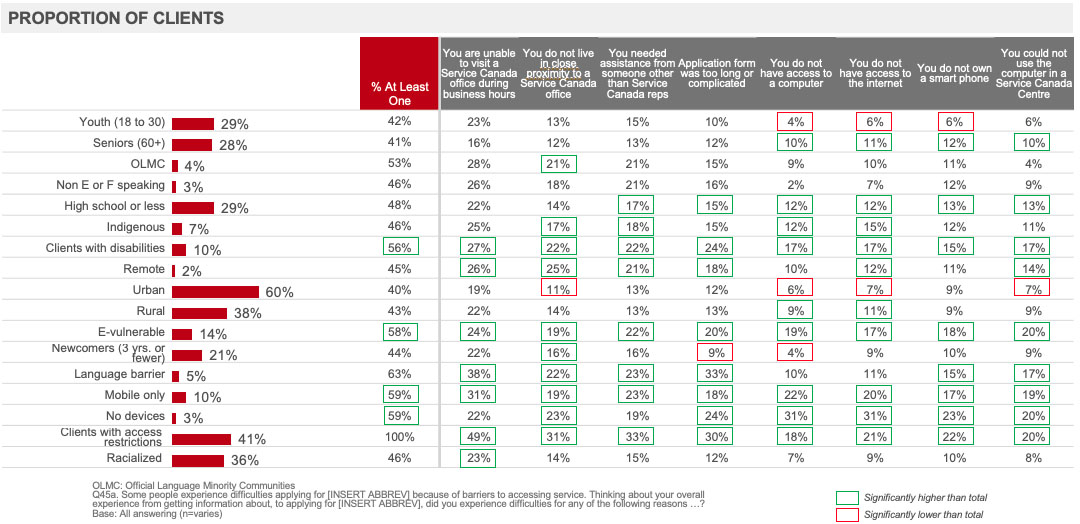
Executive Summary: Barriers to Accessing Service
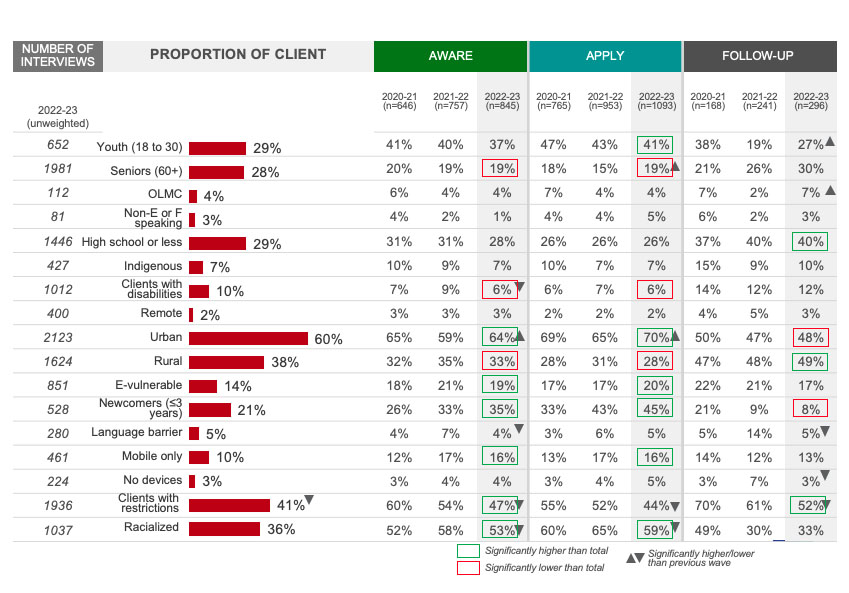
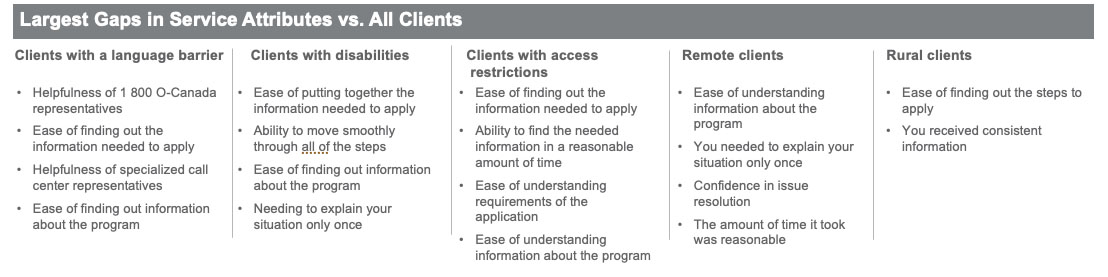
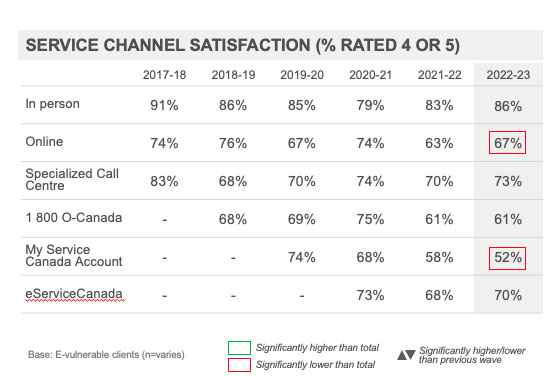
Clients with restrictions have lower satisfaction compared to clients without restrictions. The most prominent challenges faced by this client group include the ease of being able to find the information needed when learning about the program within a reasonable amount of time and the ease of finding out the steps to apply.
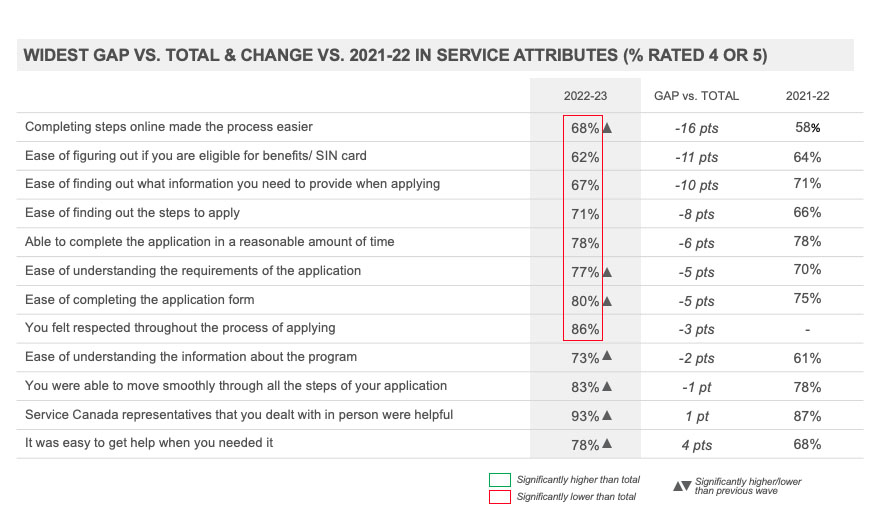
Clients who experienced a restriction to accessing service (41% of the client population) had lower satisfaction with the service provided in-person, online, through specialized call centres and 1 800 O-Canada. There were also many significant gaps in service attributes between clients with restrictions and clients overall. The largest gaps were for finding needed information in a reasonable amount of time, finding out what information was needed to apply, ease of completing the application form, ease of understanding the requirements of the application, ease of understanding information about the program and ease of figuring out eligibility.
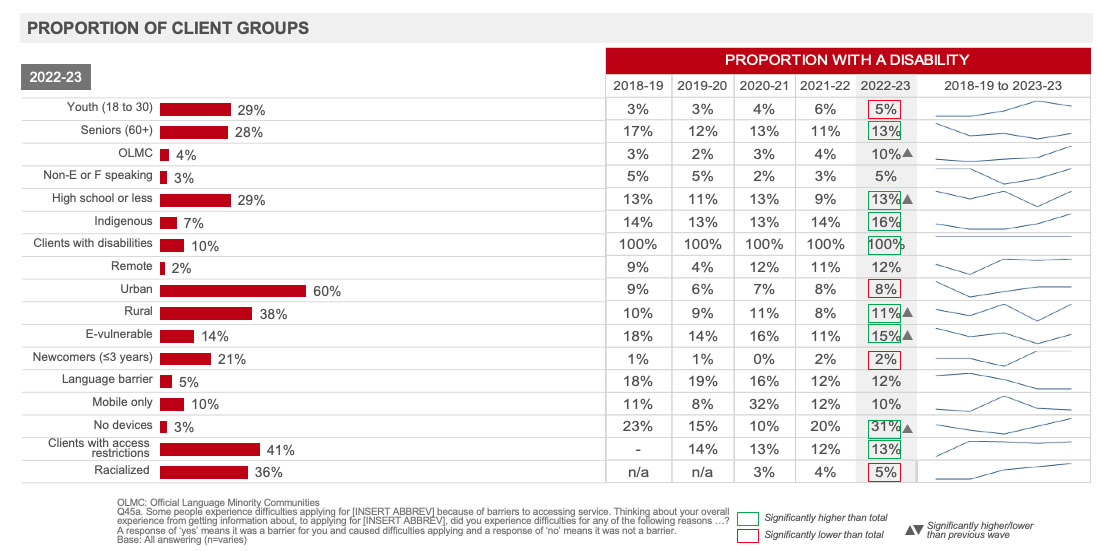
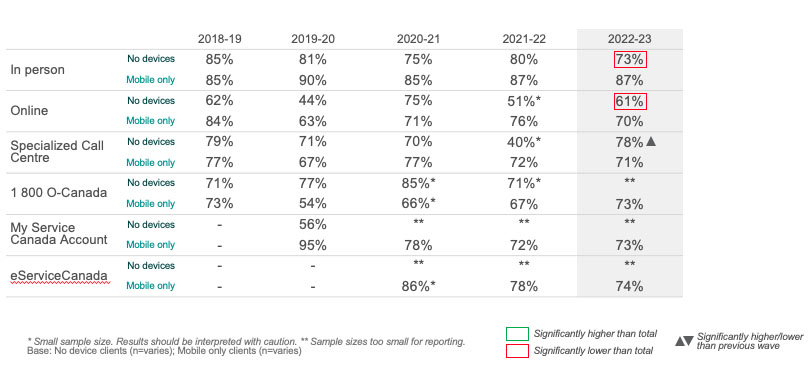
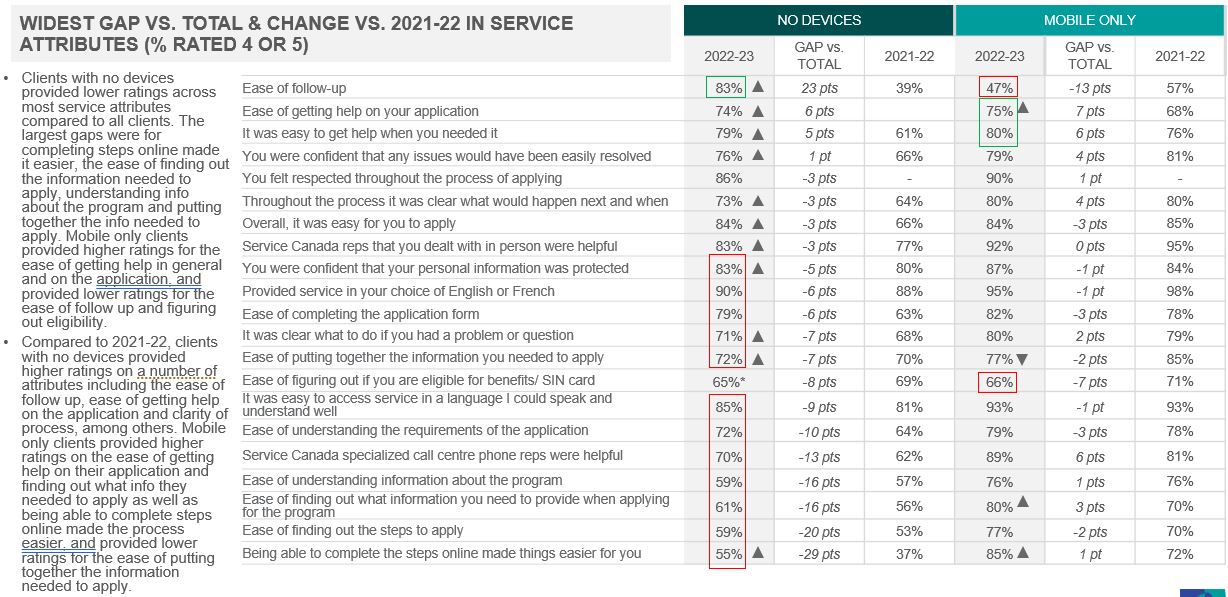
Restrictions to accessing service were more prevalent among several client groups, in particular clients with no devices, E-vulnerable clients, mobile only clients and clients with disabilities.
Compared to 2021-22, ratings increased for a number of measures including ease of completing the application form, ease of finding out the steps to apply, receiving consistent information, being able to complete the application in a reasonable amount of time, it being clear what to do if there was a problem, clarity of process, confidence that problems could be resolved, it being easy to get help when needed, getting help on the application specifically, being confident that one’s personal information was protected and ease of accessing service in a language clients could speak and understand well.
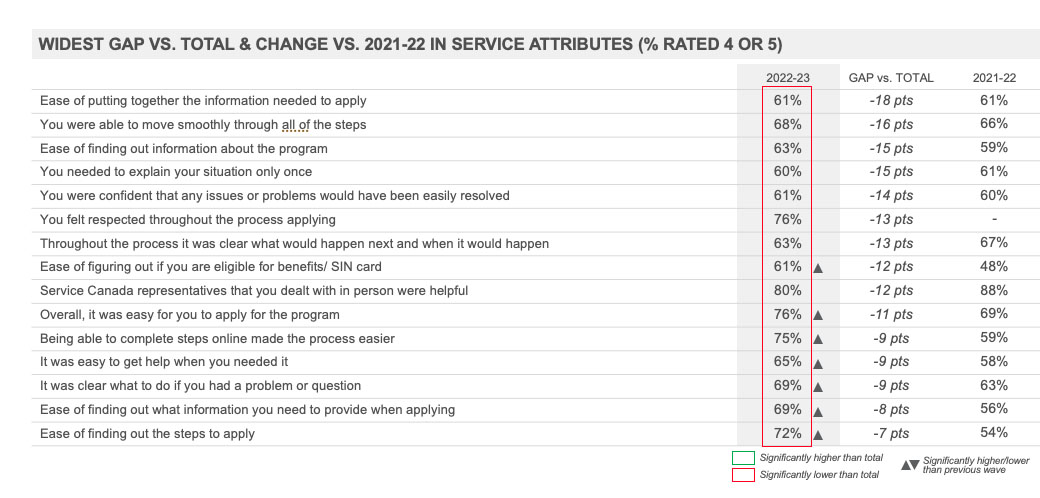
Clients who self-identify as having a disability (10% of the sample population) provided lower ratings for service provided in-person, online and through specialized call centres. There were also many significant gaps on service attributes between clients with disabilities and clients overall. The largest gaps were for ease of putting together the information to apply, being able to move smoothly through all steps, ease of finding information about the program, needing to explain one’s situation only once and being confident any issues or problems would be easily resolved.
Compared to 2021-22, ratings have increased across several measures, including ease of figuring out eligibility, ease of application overall, agreement that completing the steps online made things easier, ease of getting help when needed, it being clear what to do if there was a problem, ease of finding out the information needed to apply and ease of finding out the steps to apply.
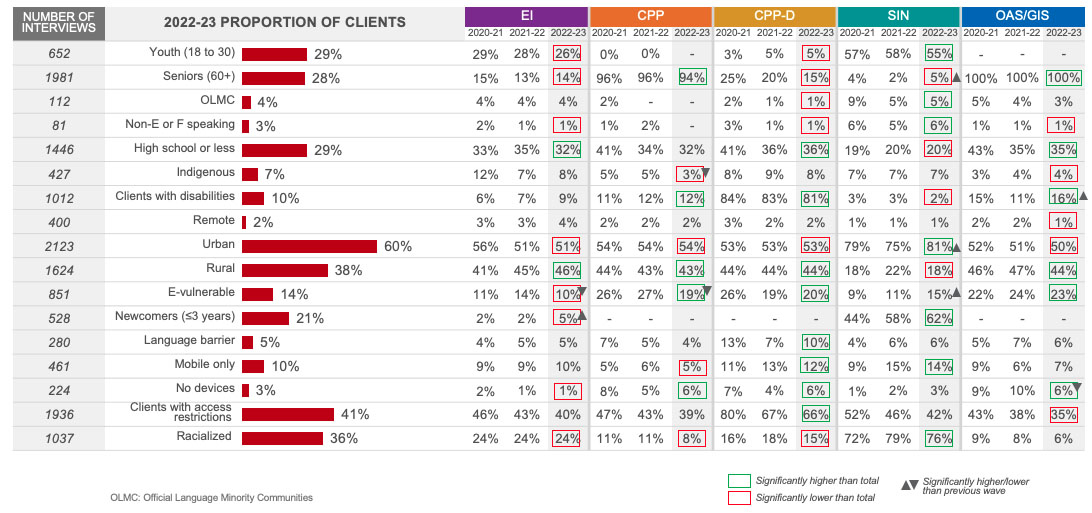
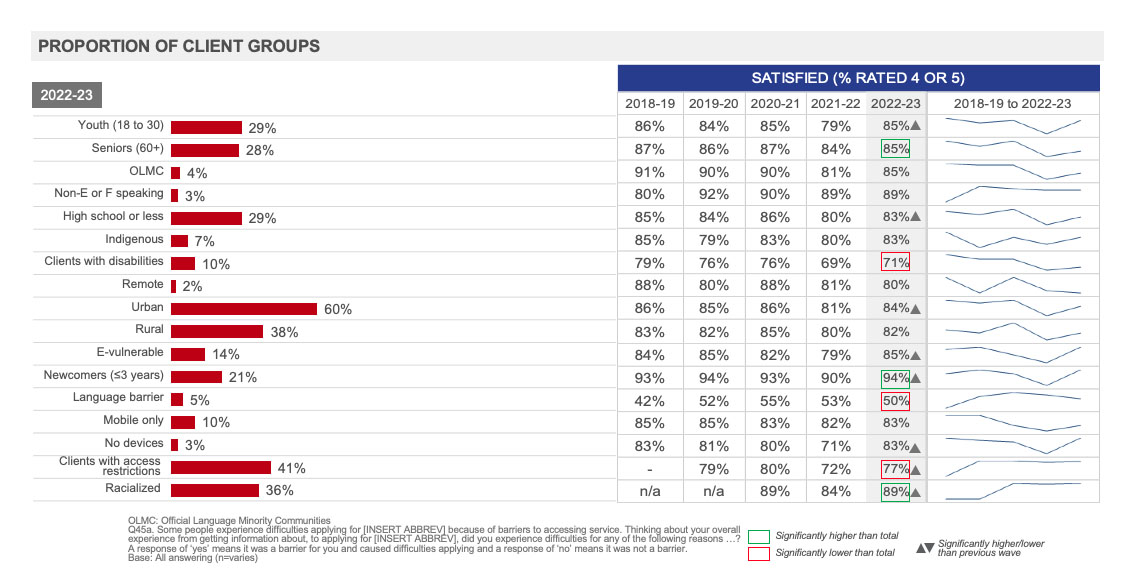
Executive Summary: Client Groups
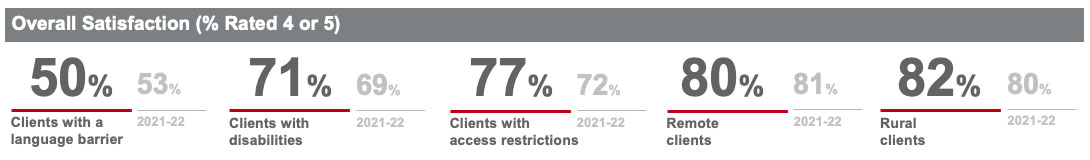
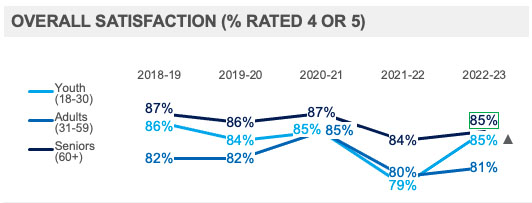
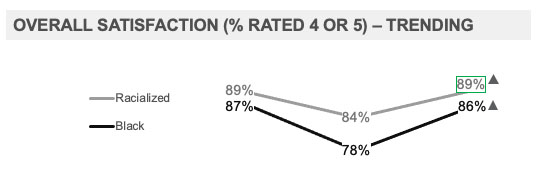
Satisfaction continued to be high among most client groups, and ratings of overall satisfaction have increased among many year over year.
The vast majority of clients in nearly all client groups continued to be highly satisfied with the service experience and notably satisfaction among youth, seniors, newcomers, and Racialized clients was higher compared to all clients. Satisfaction was lower compared to all clients among those with a language barrier, clients with disabilities and clients with restrictions to accessing service.
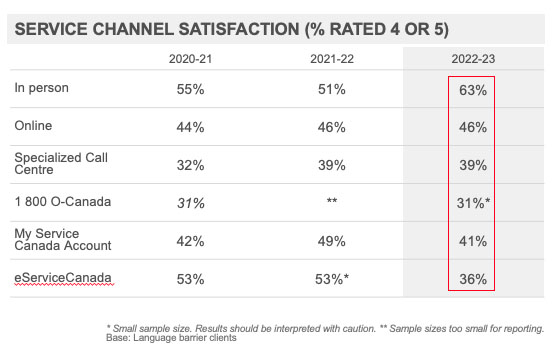
Clients with a language barrier continued to provide considerably lower ratings across all aspects of their experience. The largest gaps on service attributes compared to all clients were for the helpfulness of 1 800 O-Canada and specialized call centre representatives, ease of finding out the information needed to apply and ease of finding and understanding information about the program.
In 2022-23, overall satisfaction with the service experience increased among several client groups compared to 2021-22, including:
Youth (85% vs. 79%)
Those with a high school education or less (83% vs. 80%)
Urban clients (84% vs. 81%)
E-vulnerable clients (84% vs. 79%)
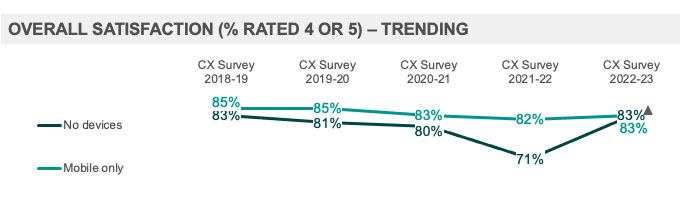
Clients with no devices (83% vs. 71%)
Clients with restrictions (77% vs. 72%)
Newcomers (94% vs. 90%)
Racialized clients (89% vs. 84%)
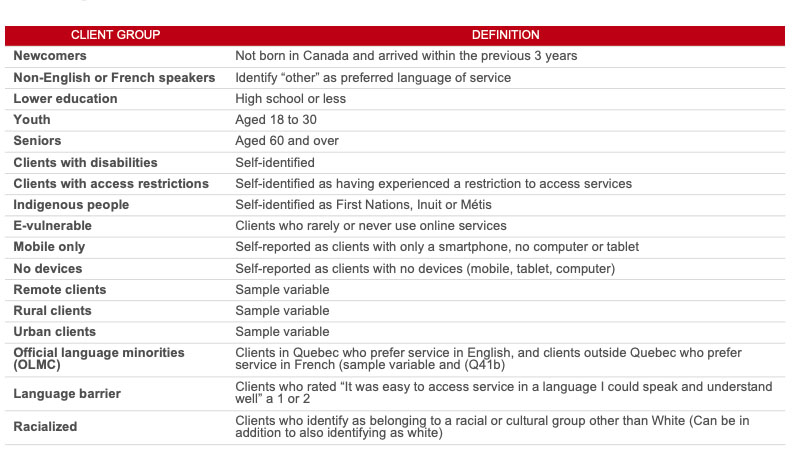
The definitions of the noted client groups can be found in Annex A of this report.
Service Canada Client Experience Survey Model
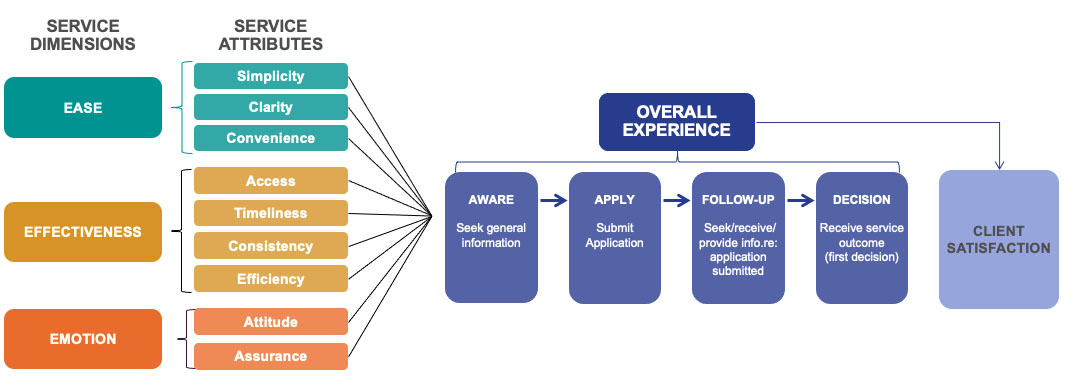
Service Canada Client Experience (CX) Survey Measurement Model
Service Canada developed the survey model below as a consistent framework for assessing the service experience of its clients.
The methodology for the Client Experience Survey was initially implemented in 2017-18. In the 2018-19 wave of the survey, the questionnaire was limited to the overall experience to allow for measures to gather data to inform service transformation. In the 2019-20, 2020-21, 2021-22 and 2022-23 waves the questionnaire took the approach utilized in 2017-18 to allow for assessment of tracking of each stage of the client journey.
Figure long description
Service Canada Client Experience (CX) Survey Measurement Model
Service Dimensions
Ease
Service Attributes
Simplicity
Clarity
Convenience
Effectiveness
Service Attributes
Access
Timeliness
Consistency
Efficiency
Emotion
Service Attributes
Attitude
Assurance
Service attributes to Overall Experience
Aware – Seek general information
Apply –Submit application
Follow-up – Seek/receive/provide info re: application submitted
Decision – Receive service outcome (first decision)
Overall Experience to Client Satisfaction
Note: The Model was drawn from a combination of existing models to suit Service Canada context and validated through consultation with internal stakeholders. The existing models include: The Common Measurements Tool (CMT), owned and licensed by the Institute for Citizen-Centred Service (ICCS), the client survey model used by the Government of Quebec, and Forrester’s approach to client experience measurement.
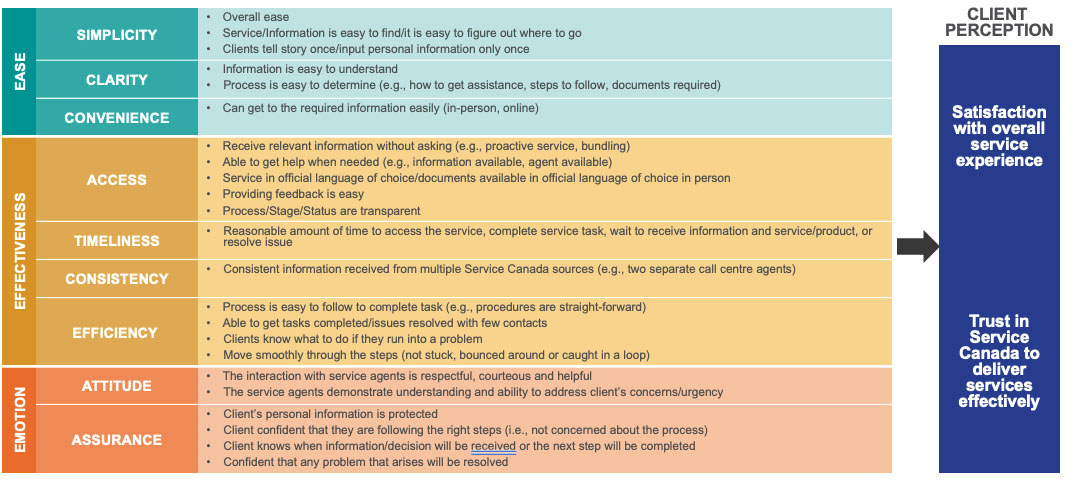
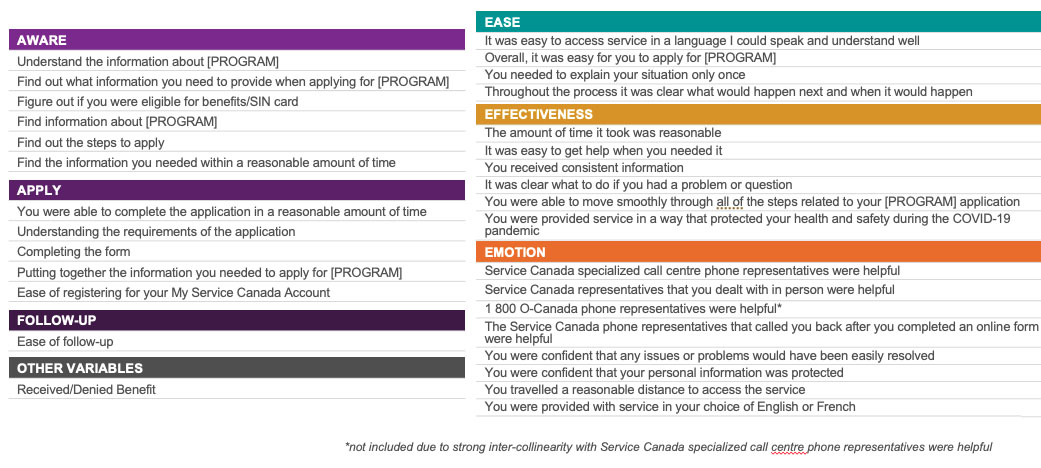
Service Canada CX Survey Measurement Model: Service Attributes
The following was the full set of detailed service attributes in the model that guided the development of the baseline questionnaire.
Figure long description
Ease
Simplicity
Overall ease
Service/Information is easy to find/it is easy to figure out where to go
Clients tell story once/input personal information only once
Clarity
Information is easy to understand
Process is easy to determine (e.g. how to get assistance, steps to follow, documents required)
Convenience
Can get to the required information easily (in-person, online)
Effectiveness
Access
Receive relevant information without asking (e.g. proactive service, bundling)
Able to get help when needed (for example, information available, agent available)
Service in official language of choice/documents available in official language of choice in person
Providing feedback is easy
Process/Stage/Status are transparent
Timeliness
Reasonable amount of time to access the service, complete service task, wait to receive information and service/product, or resolve issue
Consistency
Consistent information received from multiple Service Canada sources (e.g. two separate call centre agents)
Efficiency
Process is easy to follow to complete task. (e.g. procedures are straight-forward)
Able to get tasks completed/issues resolved with few contacts
Clients know what to do if they run into a problem
Move smoothly through the steps (not stuck, bounced around or caught in a loop)
Emotion
Attitude
The interaction with service agents is respectful, courteous and helpful
The service agents demonstrate understanding and ability to address client’s concerns/urgency
Assurance
Client’s personal information is protected
Client confident that he/she is following the right steps (i.e. not concerned about the process)
Client knows when information/decision will be received or the next step will be completed
Confident that any problem that arises will be resolved
Client perception
Satisfaction with overall service experience
Trust in Service Canada to deliver services effectively
Research Approach
Overview: Quantitative Approach
A telephone survey was conducted with a sample of 4,200 Service Canada clients across the five major programs, with between approximately 750 and 1035 respondents interviewed about their experience with each program. The interviews were conducted from June 9 to July 26, 2023.
In order to examine the overall service experience, including how clients used the various channels to complete the steps of their client journeys, the clientele was defined as clients who had recently completed a client journey, up to initial decision.
The sample of clients who had received a service outcome during January, February and March 2023 were randomly selected from program administrative databases. Comparisons of findings to the baseline data must take into account that the 2017-18 survey wave largely sampled clients who received a service outcome in April, May or June 2017.
The sample was stratified by program. Weighting adjustments were made to bring the sample into proportion with the universe by age, gender and region within each program and to bring the over-sampled groups back to their proportion among clients.
Data based on the total population have a margin of error of +/-1.5% at the 95% confidence interval, while data based on sub-groups have a larger margin of error. For example, the margin of error for data for each program was between +/-3.0% to +/-3.6%.
The data were weighted in proportion to age, gender, region and program volume.
Data Collection: Quantitative Approach
The 2022-23 questionnaire was developed based on the Service Canada Client Experience Survey Measurement Model. The 2021-22 CX Survey was used as the basis for developing the questionnaire design. Slight modifications were made to incorporate a new statement about the overall feeling of being respected throughout the application process.
The questionnaire was pretested from June 2 to June 8, 2023, and fieldwork took place between June 9 and July 26, 2023.
Experienced, trained interviewers were specifically briefed on the requirements of this study. A minimum of 10% of each interviewer’s calls were monitored by a team leader.
Respondents were interviewed in their choice of English or French. For those who could not respond in either language, a proxy respondent (who had assisted them in contacting Service Canada) could respond on their behalf (65 surveys were completed through a proxy respondent this wave). In addition, respondents who could not speak either official language were provided an option of using an on-demand translation service (23 respondents utilized the service this wave).
To better reach Deaf or Hard of Hearing clients, those clients were actively offered the SVR Canada VRS telephone service to complete the survey. No respondents utilized the SVR Canada VRS service.
Oversamples were conducted with two client groups: those living in remote areas and Indigenous clients (see Appendix A for the definitions of client groups). This was done to provide a minimum of 400 completed interviews with each group.
Calibration of the Data: Quantitative Approach
A multi-tiered approach has been used to weight the data from the sample for the Client Experience Survey into proportion with the universe of ESDC clients. Steps in the weighting comprised:
Adjust to the universe proportions of age, gender, and region for each program;
Weight over-sampled populations back into proportion to their presence in the universe;
Weight the number of respondents in each program in proportion to the total number of clients;
Weight the number respondents by each region in proportion to the total number of clients;
Adjust to the universe proportions of benefits received for each program.
OAS and GIS have been combined into one client group and weights according to age, gender, region and benefit receipt were applied based on combined program figures. The results were then weighted by the proportion of clients in each of OAS and GIS.
The universe proportions used to develop the targets were based on data extracts provided by Service Canada.
Detailed methodology, including a description of the sampling strategy, weighting and limitations, are provided under separate cover, together with the survey questionnaire.
To ensure comparability of results between 2017-18, 2018-19, 2019-20, 2020-21 and 2021-22, the proportions of clients by program were held consistent and are based on the composition of the clientele in May 2017.
Qualitative Approach
A mix of 37 in-depth interviews and seven (7) online focus groups were conducted between September 21 and November 6, 2023.
Participants were Service Canada clients receiving an initial decision on their application between January and March 2023, and who responded to the CX Survey from June 6 to July 26, 2023, meeting one of the following screening criteria: rated their overall satisfaction as low (survey question #38); experienced difficulties applying because of barriers to accessing service (survey question #45).
A total of 85 clients participated in the qualitative research (hereafter referred to as participants), of which 34 participants indicated they had a disability during the recruitment screening process.
The value of qualitative research is that it allows for the in-depth exploration of factors that shape public attitudes and behaviours on issues of interest.
The 2022-23 Client Experience Qualitative Research Detailed Findings Report, which includes the research instruments, is available under separate cover.
Method
Program
Language
Number of participants
Focus Groups
3 x EI groups
English
20
1 x EI group
French
5
2 x SIN groups
English
12
1 x CPP-D group
English
11
In-depth Interviews
3 x EI interviews
English
3
4 x SIN interviews
English
4
1 x SIN interview
French
1
13 x CPP-D interviews
English
13
6 x CPP interviews
English
6
8 x OAS or OAS/GIS interviews
English
8
2 x OAS or OAS/GIS interviews
French
2
Detailed Findings
End-to-End Client Experience By Program
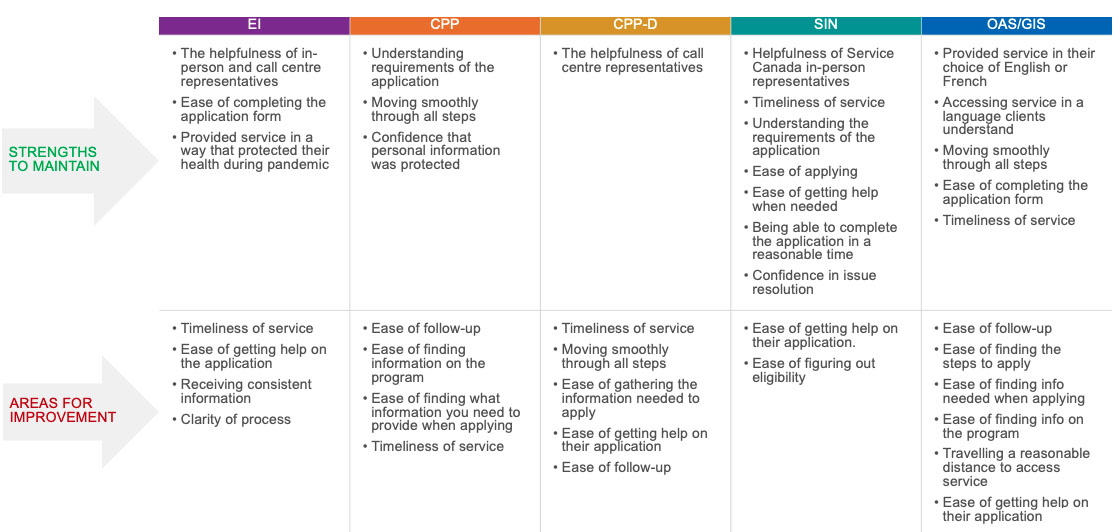
Impact of Service Changes on the Client Experience by Program
Figure long description
EI
Strengths to maintain
The helpfulness of in-person and call centre representatives
Ease of completing the application form
Provided service in a way that protected their health during pandemic
Areas for improvement
Timeliness of service
Ease of getting help on the application
Receiving consistent information
Clarity of process
CPP
Strengths to maintain
Understanding requirements of the application
Moving smoothly through all steps
Confidence that personal information was protected
Areas for improvement
Ease of follow-up
Ease of finding information on the program
Ease of finding what information you need to provide when applying
Timeliness of service
CPP-D
Strengths to maintain
The helpfulness of call centre representatives
Areas for improvement
Timeliness of service
Moving smoothly through all steps
Ease of gathering the information needed to apply
Ease of getting help on their application
Ease of follow-up
SIN
Strengths to maintain
Helpfulness of Service Canada in-person representatives
Timeliness of service
Understanding the requirements of the application
Ease of applying
Ease of getting help when needed
Being able to complete the application in a reasonable time
Confidence in issue resolution
Areas for improvement
Ease of getting help on their application.
Ease of figuring out eligibility
OAS/GIS
Strengths to maintain
Provided service in their choice of English or French
Accessing service in a language clients understand
Moving smoothly through all steps
Ease of completing the application form
Timeliness of service
Areas for improvement
Ease of follow-up
Ease of finding the steps to apply
Ease of finding info needed when applying
Ease of finding info on the program
Travelling a reasonable distance to access service
Ease of getting help on their application
Overall Satisfaction
Satisfaction, Ease, Effectiveness and Emotion Over Time
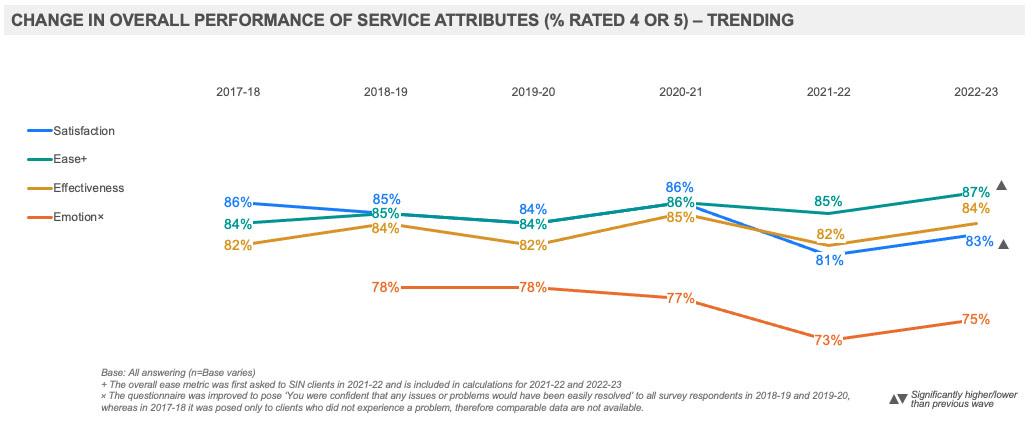
At more than eight in ten, the vast majority of clients were satisfied with their experience overall and found it easy and effective. Three-quarters of clients were confident that any issues or problems would have been easily resolved.
Compared to 2021-22, ratings on satisfaction and ease have increased. Directional increases have been observed on effectiveness and emotion (i.e., on the cusp of statistical significance).
Figure long description
Change in Overall Performance of Service Attributes (% Rated 4 or 5) – Trending
Satisfaction
2017-18, 86%
2018-19, 85%
2019-20. 84%
2020-21, 86%
2021-22, 81%
2022-23, 83%, significantly higher than previous wave
Ease (For the first time in 2021-22, the overall ease metric was asked among SIN clients. SIN data has therefore been included in calculations from 2021-22 onward)
2017-18, 84%
2018-19, 85%
2019-20. 84%
2020-21, 86%
2021-22, 82%
2022-23, 87%, significantly higher than previous wave
Effectiveness
2017-18, 82%
2018-19, 84%
2019-20. 82%
2020-21, 85%
2021-22, 82%
2022-23, 84%
Emotion (The questionnaire was improved to pose ‘You were confident that any issues or problems would have been easily resolved’ to all survey respondents in 2018-19 and 2019-20, whereas in 2017-18 it was posed only to clients who did not experience a problem, therefore comparable data are not available.)
2018-19, 78%
2019-20. 78%
2020-21, 77%
2021-22, 73%
2022-23, 75%
Base: All answering (n=Base varies)
+ The overall ease metric was first asked to SIN clients in 2021-22 and is included in calculations for 2021-22 and 2022-23
× The questionnaire was improved to pose ‘You were confident that any issues or problems would have been easily resolved’ to all survey respondents in 2018-19 and 2019-20, whereas in 2017-18 it was posed only to clients who did not experience a problem, therefore comparable data are not available.
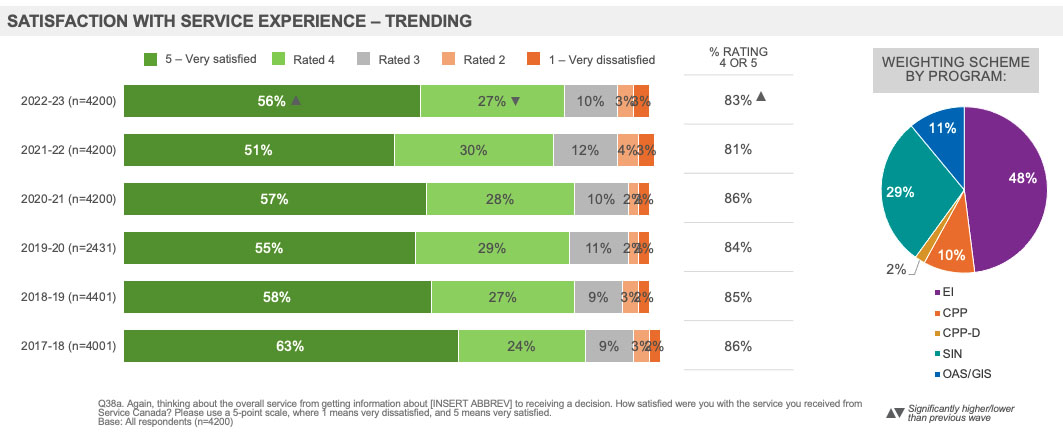
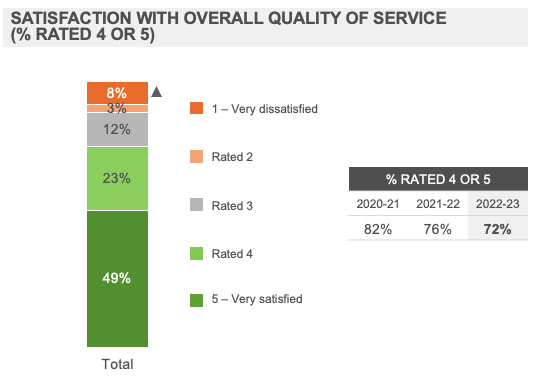
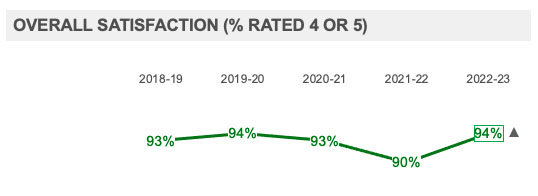
Overall Satisfaction with Service Experience
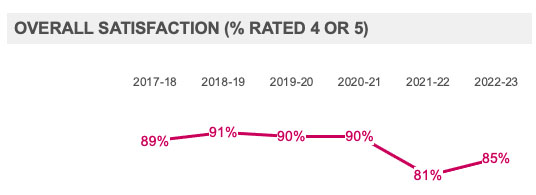
Overall, the majority of clients remained satisfied with the service experience and ratings have increased compared to 2021-22, returning to levels observed in 2019-20. A higher proportion of clients provided a rating of 5 out of 5, while fewer provided a rating of 4.
According to the weighting scheme used by program, nearly half of respondents in the sample were EI clients, and nearly a third were SIN clients.
Figure long description
Satisfaction with service experience – trending
2022-23 (n=4200)
5 – very satisfied, 56%, significantly higher than previous wave
Rated 4, 27%, significantly lower than previous wave
Rated 3, 10%
Rated 2, 3%
1 – very dissatisfied, 3%
% Rated 4 or 5, 83%, significantly higher than previous wave
2021-22 (n=4200)
5 – very satisfied, 51%
Rated 4, 30%
Rated 3, 12%
Rated 2, 4%
1 – very dissatisfied, 3%
% Rated 4 or 5, 81%
2020-21 (n=4200)
5 – very satisfied, 57%
Rated 4, 28%
Rated 3, 10%
Rated 2, 2%
1 – very dissatisfied, 2%
% Rated 4 or 5, 86%
2019-20 (n=2431)
5 – very satisfied, 55%
Rated 4, 29%
Rated 3, 11%
Rated 2, 2%
1 – very dissatisfied, 2%
% Rated 4 or 5, 84%
2018-19 (n=4401)
5 – very satisfied, 58%
Rated 4, 27%
Rated 3, 9%
Rated 2, 3%
1 – very dissatisfied, 2%
% Rated 4 or 5, 85%
2017-18 (n=4001)
5 – very satisfied, 63%
Rated 4, 24%
Rated 3, 9%
Rated 2, 3%
1 – very dissatisfied, 2%
% Rated 4 or 5, 86%
Weighting Scheme by Program
EI, 48%
CPP, 10%
CPP-D, 2%
SIN, 29%
OAS/GIS, 11%
Q38a. Again, thinking about the overall service from getting information about [INSERT ABBREV] to receiving a decision. How satisfied were you with the service you received from Service Canada? Please use a 5-point scale, where 1 means very dissatisfied, and 5 means very satisfied.
Base: All respondents (n=4200)
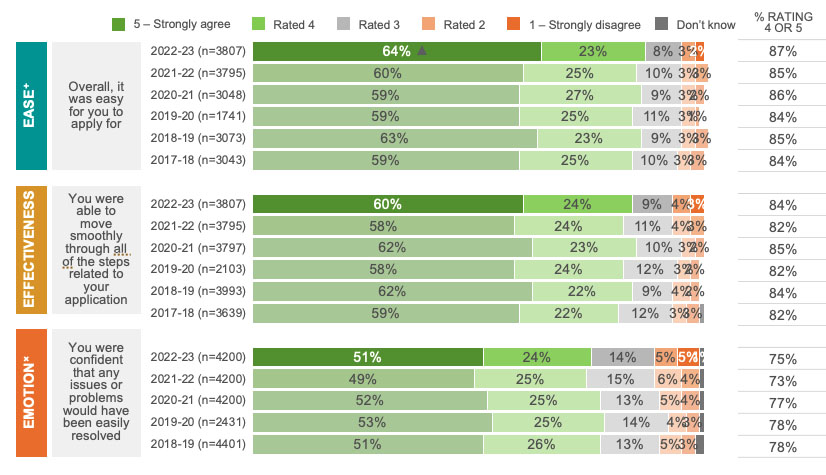
Ease, Effectiveness and Emotion: Overall
A strong majority of clients found the process easy, effective and had confidence in the issue resolution process.
Compared to 2021-22, ratings have increased for ease, and increased directionally across effectiveness and emotion (i.e., on the cusp of statistical significance).
Across each measure, a directionally higher proportion provided a rating of 5 out of 5, while directionally fewer provided a rating of 2 or 3.
Figure long description
Ease, Overall, it was easy for you to apply for
2022-23 (n=3807)
5 - Strongly agree, 64%, significantly higher than previous wave
Rated 4, 23%
Rated 3, 8%
Rated 2, 3%
1 - Strongly disagree, 2%
% Rated 4 or 5, 87%
2021-22, (n=3795)
5 - Strongly agree, 60%
Rated 4, 25%
Rated 3, 10%
Rated 2, 3%
1 - Strongly disagree, 3%
% Rated 4 or 5, 85%
2020-21, (n=3048)
5 - Strongly agree, 59%
Rated 4, 27%
Rated 3, 9%
Rated 2, 3%
1 - Strongly disagree, 2%
% Rated 4 or 5, 86%
2019-20, (n=1741)
5 - Strongly agree, 59%
Rated 4, 25%
Rated 3, 11%
Rated 2, 3%
1 - Strongly disagree, 1%
% Rated 4 or 5, 84%
2018-19, (n=3073)
5 - Strongly agree, 63%
Rated 4, 23%
Rated 3, 9%
Rated 2, 3%
1 - Strongly disagree, 3%
Don't know, 0%
% Rated 4 or 5, 85%
2017-18, (n=3043)
5 - Strongly agree, 59%
Rated 4, 25%
Rated 3, 10%
Rated 2, 3%
1 - Strongly disagree, 3%
% Rated 4 or 5, 84%
Effectivness, You were able to move smoothly through all of the steps
2022-23 (n=3807)
5 - Strongly agree, 60%
Rated 4, 24%
Rated 3, 9%
Rated 2, 4%
1 - Strongly disagree, 3%
% Rated 4 or 5, 84%
2021-22, (n=3795)
5 - Strongly agree, 58%
Rated 4, 24%
Rated 3, 11%
Rated 2, 4%
1 - Strongly disagree, 3%
% Rated 4 or 5, 82%
2020-21, (n=3797)
5 - Strongly agree, 62%
Rated 4, 23%
Rated 3, 10%
Rated 2, 3%
1 - Strongly disagree, 2%
% Rated 4 or 5, 85%
2019-20, (n=2103)
5 - Strongly agree, 58%
Rated 4, 24%
Rated 3, 12%
Rated 2, 3%
1 - Strongly disagree, 2%
% Rated 4 or 5, 82%
2018-19, (n=3993)
5 - Strongly agree, 62%
Rated 4, 22%
Rated 3, 9%
Rated 2, 4%
1 - Strongly disagree, 2%
% Rated 4 or 5, 84%
2017-18, (n=3639)
5 - Strongly agree, 59%
Rated 4, 22%
Rated 3, 12%
Rated 2, 3%
1 - Strongly disagree, 3%
Don't know, 1%
% Rated 4 or 5, 82%
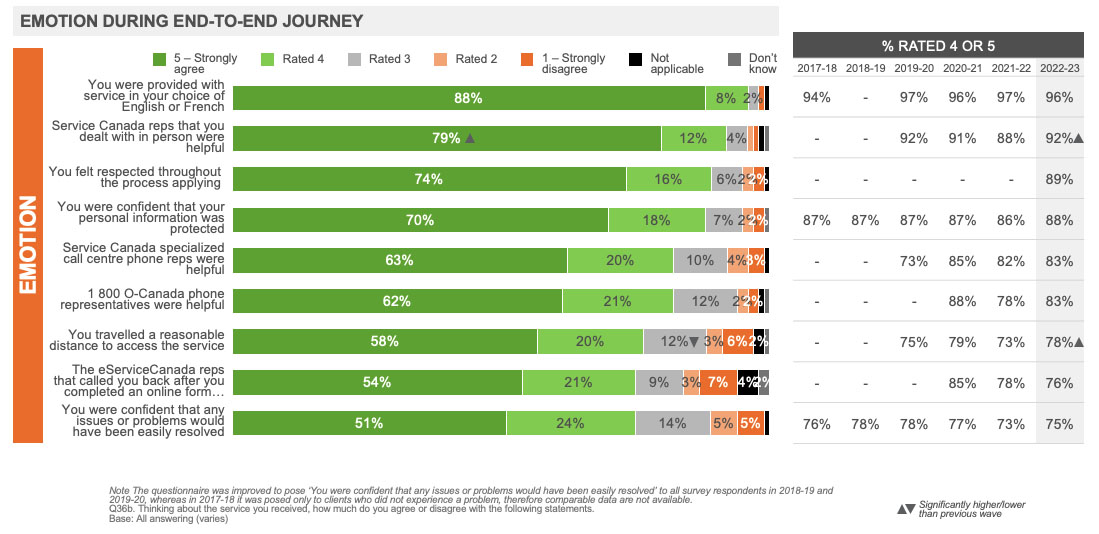
Emotion, You were confident that any issues or problems would have been easily resolved
2022-23 (n=4200)
5 - Strongly agree, 51%
Rated 4, 24%
Rated 3, 14%
Rated 2, 5%
1 - Strongly disagree, 5%
Don't know, 1%
% Rated 4 or 5, 75%
2021-22, (n=4200)
5 - Strongly agree, 49%
Rated 4, 25%
Rated 3, 15%
Rated 2, 6%
1 - Strongly disagree, 4%
Don't know, 1%
% Rated 4 or 5, 73%
2020-21, (n=4200)
5 - Strongly agree, 52%
Rated 4, 25%
Rated 3, 13%
Rated 2, 5%
1 – Strongly disagree, 4%
Don't know, 1%
% Rated 4 or 5, 77%
2019-20, (n=2431)
5 - Strongly agree, 53%
Rated 4, 25%
Rated 3, 14%
Rated 2, 4%
1 – Strongly disagree, 3%
Don't know, 1%
% Rated 4 or 5, 78%
2018-19, (n=4401)
5 - Strongly agree, 51%
Rated 4, 26%
Rated 3, 13%
Rated 2, 5%
1 - Strongly disagree, 3%
Don't know, 2%
% Rated 4 or 5, 78%
+ The overall ease metric was first asked to SIN clients in 2021-22 and is included in calculations for 2021-22 and 2022-23
× The questionnaire was improved to pose ‘You were confident that any issues or problems would have been easily resolved’ to all survey respondents in 2018-19 and 2019-20, whereas in 2017-18 it was posed only to clients who did not experience a problem, therefore comparable data are not available.
Q36b. Thinking about the overall service you received, from getting information about [INSERT ABBREV] to receiving a decision, how much do you agree or disagree with the following statements, using a 5-point scale (where 1 means strongly disagree, and 5 means strongly agree)?
Base: All respondents/answering (n= Base varies)
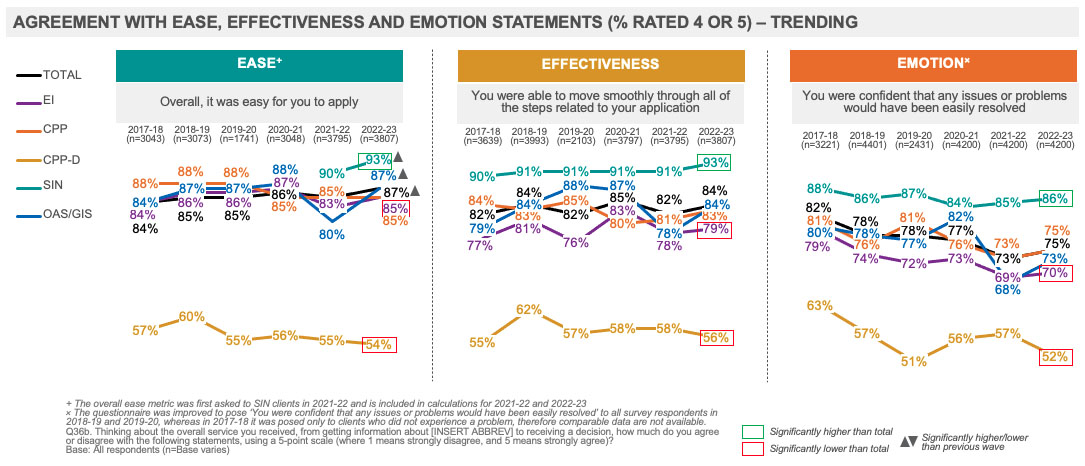
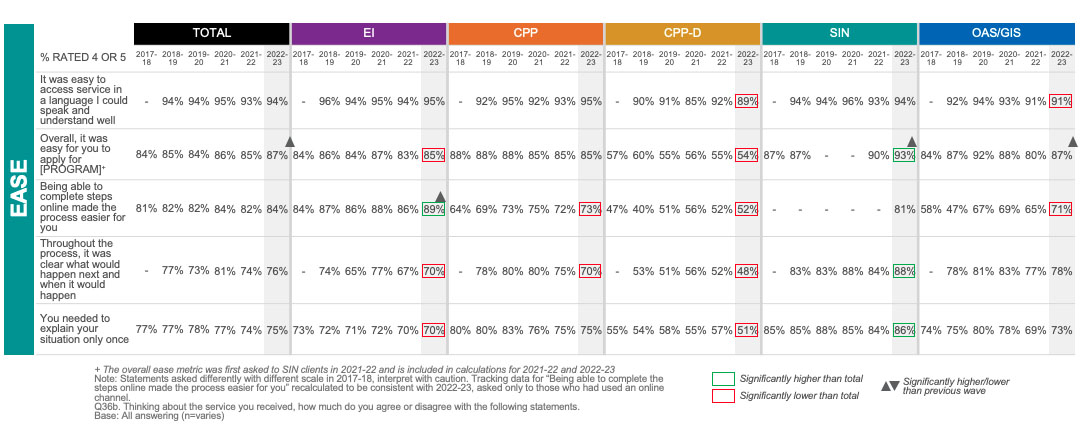
Ease, Effectiveness and Emotion: by Program
CPP-D clients were less likely to have found the process easy, effective or to have had confidence in the issue resolution process compared to all clients, while EI were less likely to have felt the process was easy and effective and to have had confidence in issue resolution. SIN clients were more likely to have found the process easy, effective and to have had confidence in issue resolution.
Compared to 2021-22, EI and OAS/GIS clients provided higher ratings for ease.
Figure long description
Agreement with Ease, Effectiveness and Emotion Statements (%Rated 4 or 5) – Trending
Ease, Overall, it was easy for you to apply for
Total
2017-18, (n=3043), 84%
2018-19, (n=3073), 85%
2019-20, (n=1741), 85%
2020-21, (n=3048), 86%
2021-22, (n=3795), 82%
2022-23, (n=3807), 87%, significantly higher than previous wave
EI
2017-18, (n=3043), 84%
2018-19, (n=3073), 86%
2019-20, (n=1741), 86%
2020-21, (n=3048), 87%
2021-22, (n=3795), 83%
2022-23, (n=3807), 85%, significantly lower than total
CPP
2017-18, (n=3043), 88%
2018-19, (n=3073), 88%
2019-20, (n=1741), 88%
2020-21, (n=3048), 85%
2021-22, (n=3795), 85%
2022-23, (n=3807), 85%
CPP-D
2017-18, (n=3043), 57%
2018-19, (n=3073), 60%
2019-20, (n=1741), 55%
2020-21, (n=3048), 56%
2021-22, (n=3795), 55%
2022-23, (n=3807), 54%, significantly lower than total
SIN
2021-22, (n=3795), 90%
2022-23, (n=3807), 93%, significantly lower than total, significantly higher than previous wave
OAS/GIS
2017-18, (n=3043), 84%
2018-19, (n=3073), 87%
2019-20, (n=1741), 87%
2020-21, (n=3048), 88%
2021-22, (n=3795), 80%
2022-23, (n=3807), 87%, significantly higher than previous wave
Effectiveness, You were able to move smoothly through all the steps
TOTAL
2017-18, (n=3639), 82%
2018-19, (n=3993), 84%
2019-20, (n=2103), 82%
2020-21, (n=3797), 85%
2021-22, (n=3795), 82%
2022-23, (n=3807), 84%
EI
2017-18, (n=3639), 77%
2018-19, (n=3993), 81%
2019-20, (n=2103), 76%
2020-21, (n=3797), 83%
2021-22, (n=3795), 78%
2022-23, (n=3807), 79%, significantly lower than previous wave
CPP
2017-18, (n=3639), 84%
2018-19, (n=3993), 83%
2019-20, (n=2103), 85%
2020-21, (n=3797), 80%
2021-22, (n=3795), 81%
2022-23, (n=3807), 83%
CPP-D
2017-18, (n=3639), 55%
2018-19, (n=3993), 62%
2019-20, (n=2103), 57%
2020-21, (n=3797), 58%
2021-22, (n=3795), 58%
2022-23, (n=3807), 56%, significantly lower than previous wave
SIN
2017-18, (n=3639), 90%
2018-19, (n=3993), 91%
2019-20, (n=2103), 91%
2020-21, (n=3797), 91%
2021-22, (n=3795), 91%
2022-23, (n=3807), 93%, significantly higher than previous wave
OAS/GIS
2017-18, (n=3639), 79%
2018-19, (n=3993), 84%
2019-20, (n=2103), 88%
2020-21, (n=3797), 87%
2021-22, (n=3795), 78%
2022-23, (n=3807), 84%
Emotion, you were confident that any issues or problems would have been easily resolved
TOTAL
2017-18, (n=3221), 82%
2018-19, (n=4401), 78%
2019-20, (n=2431), 78%
2020-21, (n=4200), 77%
2021-22, (n=4200), 73%
2022-23, (n=4200), 75%
EI
2017-18, (n=3221), 79%
2018-19, (n=4401), 74%
2019-20, (n=2431), 72%
2020-21, (n=4200), 73%
2021-22, (n=4200), 69%
2022-23, (n=4200), 70%, significantly lower than total
CPP
2017-18, (n=3221), 81%
2018-19, (n=4401), 76%
2019-20, (n=2431), 81%
2020-21, (n=4200), 76%
2021-22, (n=4200), 73%
2022-23, (n=4200), 75%
CPP-D
2017-18, (n=3221), 63%
2018-19, (n=4401), 57%
2019-20, (n=2431), 51%
2020-21, (n=4200), 56%
2021-22, (n=4200), 57%
2022-23, (n=4200), 52%, significantly lower than total
SIN
2017-18, (n=3221), 88%
2018-19, (n=4401), 86%
2019-20, (n=2431), 87%
2020-21, (n=4200), 84%
2021-22, (n=4200), 85%
2022-23, (n=4200), 86%, significantly higher than total
OAS/GIS
2017-18, (n=3221), 80%
2018-19, (n=4401), 78%
2019-20, (n=2431), 77%
2020-21, (n=4200), 82%
2021-22, (n=4200), 68%
2022-23, (n=4200), 73%
+ The overall ease metric was first asked to SIN clients in 2021-22 and is included in calculations for 2021-22 and 2022-23
× The questionnaire was improved to pose ‘You were confident that any issues or problems would have been easily resolved’ to all survey respondents in 2018-19 and 2019-20, whereas in 2017-18 it was posed only to clients who did not experience a problem, therefore comparable data are not available.
Q36b. Thinking about the overall service you received, from getting information about [INSERT ABBREV] to receiving a decision, how much do you agree or disagree with the following statements, using a 5-point scale (where 1 means strongly disagree, and 5 means strongly agree)?
Base: All respondents (n=Base varies)
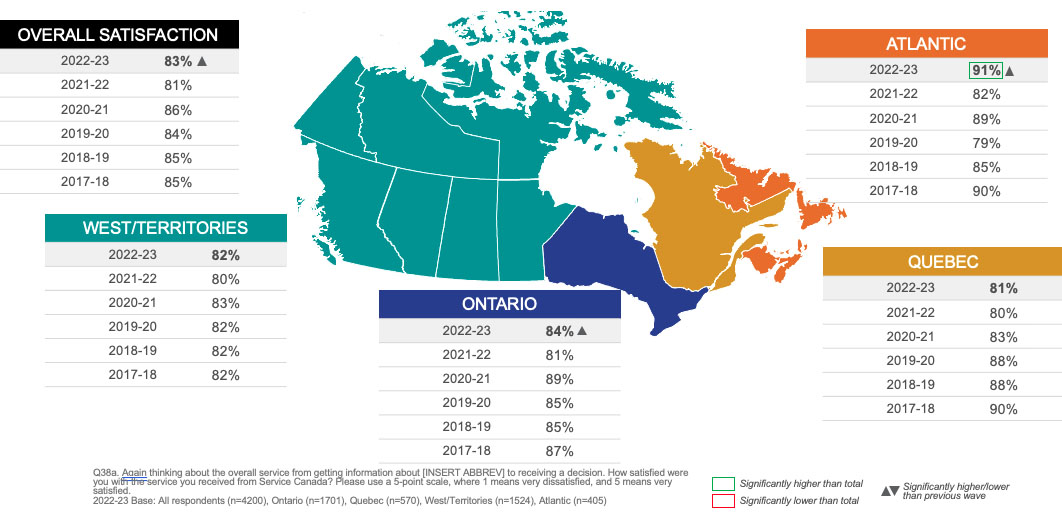
Overall Satisfaction by Region (% Rated 4 or 5)
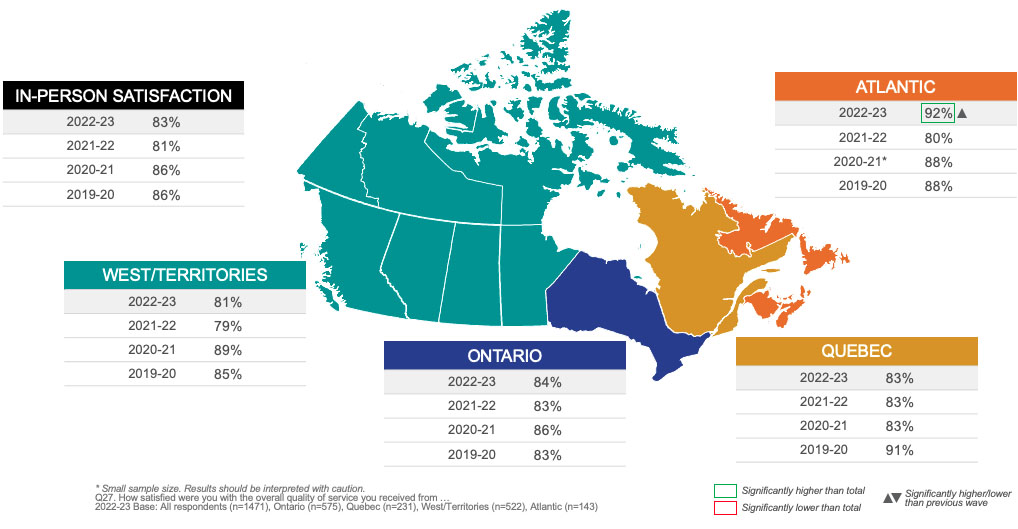
Overall satisfaction was higher among clients in Atlantic Canada compared to all clients.
Compared to 2021-22, satisfaction increased among clients in Ontario and Atlantic Canada.
Figure long description
Overall Satisfaction by Region (% Rated 4 or 5)
Overall satisfaction
2022-23, 83%
2021-22, 81%
2020-21, 86%
2019-20, 84%
2018-19, 85%
2017-18, 85%, significantly higher than previous wave
West/Territories
2022-23, 82%
2021-22, 80%
2020-21, 83%
2019-20, 82%
2018-19, 82%
2017-18, 82%
Ontario
2022-21, 84%
2021-22, 81%
2020-21, 89%
2019-20, 85%
2018-19, 85%
2017-18, 87%, significantly higher than previous wave
Atlantic
2022-21, 91%
2021-22, 82%
2020-21, 89%
2019-20, 79%
2018-19, 85%
2017-18, 90%, significantly higher than total, significantly higher than previous wave
Quebec
2022-21, 81%
2021-22, 80%
2020-21, 83%
2019-20, 88%
2018-19, 88%
2017-18, 90%
Q38a. Again thinking about the overall service from getting information about [INSERT ABBREV] to receiving a decision. How satisfied were you with the service you received from Service Canada? Please use a 5-point scale, where 1 means very dissatisfied, and 5 means very satisfied.
Emotion – Overall and by Channel, Program and Region
Three-quarters of clients agreed that they were confident that any issues or problems would have been easily resolved. Client agreement that they were confident that any issues or problems would have been easily resolved has remained statistically consistent but increased directionally compared to 2021-22 with a slightly higher proportion of clients providing a rating of 5 out of 5.
Compared to all clients, EI and CPP-D clients were less likely to have had confidence in the issue resolution process, while SIN clients were more likely. Ratings remained consistent across programs compared to 2021-22.
Clients who used in-person service at some point during their client journey provided higher ratings for confidence in issue resolution, while those who used the telephone channel or eServiceCanada provided lower ratings.
Clients in Atlantic Canada provided higher ratings for confidence in issue resolution and agreement has increased compared to 2021-22.
Figure long description
Agreement with emotion statement – trending
2022-23 (n=4200)
5 – strongly agree, 51%
Rated 4, 24%
Rated 3, 14%
Rated 2, 5%
1 – strongly disagree,5%
Don’t know, 1%
% Rated 4 or 5, 75%
2021-22 (n=4200)
5 – strongly agree, 49%
Rated 4, 25%
Rated 3, 15%
Rated 2, 6%
1 – strongly disagree, 4%
Don’t know, 1%
% Rated 4 or 5, 73%
2020-21 (n=4200)
5 – strongly agree, 52%
Rated 4, 25%
Rated 3, 13%
Rated 2, 5%
1 – strongly disagree, 4%
Don’t know, 1%
% Rated 4 or 5, 77%
2019-20 (n=2431)
5 – strongly agree, 53%
Rated 4, 25%
Rated 3, 14%
Rated 2, 4%
1 – strongly disagree, 3%
Don’t know, 1%
% Rated 4 or 5, 78%
2018-19 (n=4401)
5 – strongly agree, 51%
Rated 4, 26%
Rated 3, 13%
Rated 2, 5%
1 – strongly disagree, 3%
Don’t know, 2%
% Rated 4 or 5, 78%
% Rated 4 or 5
Channel
In-person
2022-23, 80%, significantly higher than total
2021-22, 80%
2020-21, 82%
Online
2022-23, 74%
2021-22, 72%
2020-21, 76%
Telephone
2022-23, 70%, significantly lower than total
2021-22, 67%
2020-21, 73%
Mail
2022-23, 76%
2021-22, 72%
2020-21, 79%
eServiceCanada
2022-23, 71%, significantly lower than total
2021-22, 72%
2020-21, 75%
Program
EI
2022-23, 70%, significantly higher than total
2021-22, 69%
2020-21, 73%
CPP
2022-23, 75%
2021-22, 73%
2020-21, 76%
CPP-D
2022-23, 52%, significantly lower than total
2021-22, 57%
2020-21, 56%
SIN
2022-23, 86%, significantly higher than total
2021-22, 85%
2020-21, 84%
OAS/GIS
2022-23, 73%
2021-22, 68%
2020-21, 82%
Region
West/Territories
2022-23, 74%
2021-22, 71%
2020-21, 77%
Ontario
2022-23, 75%
2021-22, 75%
2020-21, 79%
Quebec
2022-23, 74%
2021-22, 73%
2020-21, 74%
Atlantic
2022-23, 82%, significantly higher than total, significantly higher than previous wave
2021-22, 76%
2020-21, 79%
Q36b. Thinking about the overall service you received, from getting information about [INSERT ABBREV] to receiving a decision, how much do you agree or disagree with the following statements, using a 5-point scale (where 1 means strongly disagree, and 5 means strongly agree)? You were confident that any issues or problems would have been easily resolved.
Base: All respondents (n=4200)
Trust in Service Canada
At just over eight in ten, the vast majority of clients express trust in Service Canada to deliver services effectively to Canadians. EI, OAS/GIS and CPP-D clients were less likely to express trust compared to all clients, while SIN clients were more likely.
Compared to 2021-22, trust ratings have increased overall and among CPP, CPP-D and OAS/GIS clients.
This measure remained strongly correlated to overall satisfaction.
Figure long description
Trust in Service Canada (% Rated 4 or 5) – Trending
TOTAL
2018-19, n=4401, 83%
2019-20, n=2431, 83%
2020-21, n=4200, 84%
2021-22, n=4200, 78%
2022-23 ,n=4200, 82%, significantly higher than previous wave
EI
2018-19, n=4401, 80%
2019-20, n=2431, 77%
2020-21, n=4200, 82%
2021-22, n=4200, 75%
2022-23 ,n=4200, 78%, significantly lower than total
CPP
2018-19, n=4401, 81%
2019-20, n=2431, 86%
2020-21, n=4200, 81%
2021-22, n=4200, 74%
2022-23 ,n=4200, 81%, significantly higher than previous wave
2022-23 ,n=4200, 65%, significantly lower than total, significantly higher than previous wave
SIN
2018-19, n=4401, 91%
2019-20, n=2431, 93%
2020-21, n=4200, 90%
2021-22, n=4200, 89%
2022-23 ,n=4200, 92%, significantly higher than total
OAS/GIS
2018-19, n=4401, 79%
2019-20, n=2431, 81%
2020-21, n=4200, 82%
2021-22, n=4200, 70%
2022-23 ,n=4200, 76%, significantly lower than total, significantly higher than previous wave
There was a strong correlation between trust in Service Canada and overall satisfaction (0.64).
Q38b. How much would you say you trust Service Canada to deliver services effectively to Canadians? Please use a 5-point scale, where 1 means do not trust at all, and 5 means trust a great deal.
Base: All respondents (n=4200)
Trust in Service Canada: Overall
Just over eight in ten clients expressed trust in Service Canada to deliver services effectively to Canadians. Ratings on trust have increased compared to 2021-22 and returned to levels observed in 2019-20. A directionally higher proportion of clients provided a rating of 4 out of 5 and fewer provided a rating of 3.
Figure long description
Trust in Service Canada – Trending
2022-23, (n=4200)
5 - Trust a great deal, 50%
Rated 4, 31%
Rated 3, 12%, significantly lower than previous wave
Rated 2, 4%
1 - Do not trust at all, 2%
% Rating 4 or 5, 82%, significantly higher than previous wave
2021-22, (n=4200)
5 - Trust a great deal, 49%
Rated 4, 29%
Rated 3, 14%
Rated 2, 4%
1 - Do not trust at all, 3%
% Rating 4 or 5, 78%
2020-21, (n=4200)
5 - Trust a great deal, 54%
Rated 4, 30%
Rated 3, 12%
Rated 2, 3%
1 - Do not trust at all, 1%
% Rating 4 or 5, 84%
2019-20, (n=2431)
5 - Trust a great deal, 52%
Rated 4, 31%
Rated 3, 13%
Rated 2, 3%
1 - Do not trust at all, 2%
% Rating 4 or 5, 83%
2018-19, (n=4401)
5 - Trust a great deal, 54%
Rated 4, 29%
Rated 3, 11%
Rated 2, 3%
1 - Do not trust at all, 2%
% Rating 4 or 5, 83%
Q38b. How much would you say you trust Service Canada to deliver services effectively to Canadians? Please use a 5-point scale, where 1 means do not trust at all, and 5 means trust a great deal.
Base: All respondents (n=4200)
Assessment of Duration of End-to-End Journey
At three-quarters, the majority of clients found the timeliness of service reasonable, unchanged from 2021-22.
SIN, OAS/GIS and CPP clients were more likely to have rated the timeliness of service as reasonable, while EI and CPP-D clients were less likely.
Compared to 2021-22, SIN clients were more likely to agree that the timeliness of service was reasonable.
Figure long description
The Amount Of Time It Took, From When You Started Gathering Information To When You Got A Decision On Your Application, Was Reasonable (% Rated 4 Or 5) – Trending
TOTAL
2017-18, n=4001, 77%
2018-19, n=4401, 76%
2019-20, n=2431, 77%
2020-21, n=4200, 81%
2021-22, n=4200, 75%
2022-23, n=4200, 75%
EI
2017-18, n=4001, 73%
2018-19, n=4401, 69%
2019-20, n=2431, 68%
2020-21, n=4200, 80%
2021-22, n=4200, 69%
2022-23, n=4200, 66%, significantly lower than total
CPP
2017-18, n=4001, 80%
2018-19, n=4401, 83%
2019-20, n=2431, 83%
2020-21, n=4200, 81%
2021-22, n=4200, 82%
2022-23, n=4200, 79%, significantly higher than total
CPP-D
2017-18, n=4001, 47%
2018-19, n=4401, 49%
2019-20, n=2431, 49%
2020-21, n=4200, 57%
2021-22, n=4200, 48%
2022-23, n=4200, 45%, significantly lower than total
SIN
2017-18, n=4001, 85%
2018-19, n=4401, 87%
2019-20, n=2431, 89%
2020-21, n=4200, 85%
2021-22, n=4200, 82%
2022-23, n=4200, 87%, significantly higher than total, significantly higher than previous wave
OAS/GIS
2017-18, n=4001, 75%
2018-19, n=4401, 80%
2019-20, n=2431, 85%
2020-21, n=4200, 85%
2021-22, n=4200, 77%
2022-23, n=4200, 81%, significantly higher than total
Q36b. Thinking about the overall service you received, from getting information about [INSERT ABBREV] to receiving a decision, how much do you agree or disagree with the following statements, using a 5-point scale (where 1 means strongly disagree, and 5 means strongly agree)?
Base: All answering (n=4200)
Three-quarters of clients agreed that the amount of time from when they started gathering information to when they got a decision was reasonable. Ratings on timeliness of service were unchanged compared to 2021-22.
Compared to 2021-22, a higher proportion of clients provided a rating of 5 out of 5. A higher proportion of OAS/GIS clients also provided a rating of 5 out of 5, while fewer provided a rating of 4.
Figure long description
The Amount Of Time It Took, From When You Started Gathering Information To When You Got A Decision On Your Application, Was Reasonable
TOTAL
5 - Strongly agree, 52%
Rated 4, 23%
Rated 3, 12%
Rated 2, 6%
1 - Strongly disagree, 6%
Not applicable,
% Rating 4 or 5, 75%
EI
5 - Strongly agree, 42%
Rated 4, 25%
Rated 3, 15%
Rated 2, 9%
1 - Strongly disagree, 9%
% Rating 4 or 5, 66%, significantly lower than total
CPP
5 - Strongly agree, 56%
Rated 4, 23%
Rated 3, 11%
Rated 2, 4%
1 - Strongly disagree, 4%
Not applicable, 1%
Don't know, 1%, significantly higher than previous wave
% Rating 4 or 5, 79%, significantly higher than total
CPP-D
5 - Strongly agree, 25%
Rated 4, 20%
Rated 3, 19%
Rated 2, 13%
1 - Strongly disagree, 21%
Not applicable, 1%
% Rating 4 or 5, 45%, significantly lower than total
SIN
5 - Strongly agree, 66%, singificantly higher than previous wave
Rated 4, 21%
Rated 3, 8%
Rated 2, 2%, significantly lower than previous wave
1 - Strongly disagree, 2%
% Rating 4 or 5, 87%, significantly higher than total, significantly higher than previous wave
OAS/GIS
5 - Strongly agree, 64%, significantly higher than previous wave
Rated 4, 17%, significnatly lower than previous wave
Rated 3, 9%
Rated 2, 3%
1 - Strongly disagree, 4%
Not applicable, 3%
% Rating 4 or 5, 81%, significantly higher than total
Q36b. Thinking about the overall service you received, from getting information about [INSERT ABBREV] to receiving a decision, how much do you agree or disagree with the following statements, using a 5-point scale (where 1 means strongly disagree, and 5 means strongly agree)?
Base: All respondents (n=4200)
Reported Duration of End-to-End Journey
Roughly two-thirds of clients reported that their client journey took four weeks or less, approximately one-quarter said it took between one day to two weeks or between two to four weeks and just over one in ten took one day. Roughly one in ten reported their client journey took between four to six weeks or between eight weeks to six months, while slightly fewer took between six to eight weeks. Reported duration of the client journey was consistent with 2021-22.
SIN clients were more likely to have reported their client journey took two weeks or less (and most notably that it took one day) compared to all clients. For EI clients, more were likely to have reported their client journey took between two to four weeks or between six to eight weeks, and for CPP clients that number was four to six weeks or longer. OAS/GIS and CPP-D clients (in particular) were more likely to report it took more than eight weeks.
Compared to 2021-22, SIN clients were more likely to report it took one day, while CPP-D clients were more likely to report it took more than six months.
Figure long description
Reported Duration of End-to-End Journey
One day
Total
2018-19, 15%
2021-22, 12%
2022-23, 13%
EI
2018-19, 4%
2021-22, 4%
2022-23, 3%, significantly lower than total
CPP
2018-19, 7%
2021-22, 3%
2022-23, 3%, significantly lower than total
CPP-D
2022-23, 1%, significantly lower than total
SIN
2018-19, 40%
2021-22, 30%
2022-23, 37%, significantly higher than total, significantly higher than previous wave
OAS/GIS
2018-19, 10%
2021-22, 8%
2022-23, 6%, significantly lower than total
Between one day and 2 weeks,
Total
2018-19, 29%
2021-22, 29%
2022-23, 27%
EI
2018-19, 32%
2021-22, 33%
2022-23, 30%
CPP
2018-19, 17%
2021-22, 13%
2022-23, 10%, significantly lower than total
CPP-D
2018-19, 3%
2021-22, 3%
2022-23, 5%, significantly lower than total
SIN
2018-19, 36%
2021-22, 36%
2022-23, 36%, significantly higher than total
OAS/GIS
2018-19, 16%
2021-22, 13%
2022-23, 9%, significantly lower than total
Between 2 to 4 weeks
Total
2018-19, 22%
2021-22, 24%
2022-23, 23%
EI
2018-19, 31%
2021-22, 31%
2022-23, 31%, significantly higher than total
CPP
2018-19, 22%
2021-22, 19%
2022-23, 22%
CPP-D
2018-19, 10%
2021-22, 7%
2022-23, 6%, significantly lower than total
SIN
2018-19, 10%
2021-22, 19%
2022-23, 15%, significantly lower than total
OAS/GIS
2018-19, 18%
2021-22, 14%
2022-23, 17%, significantly lower than total
Between 4 to 6 weeks
Total
2018-19, 13%
2021-22, 10%
2022-23, 11%
EI
2018-19, 16%
2021-22, 10%
2022-23, 13%
CPP
2018-19, 20%
2021-22, 18%
2022-23, 16%, significantly higher than total
CPP-D
2018-19, 12%
2021-22, 11%
2022-23, 9%
SIN
2018-19, 5%
2021-22, 6%
2022-23, 5%, significantly lower than total
OAS/GIS
2018-19, 14%
2021-22, 12%
2022-23, 13%
Between 6 to 8 weeks
Total
2018-19, 6%
2021-22, 6%
2022-23, 7%
EI
2018-19, 7%
2021-22, 6%
2022-23, 9%, significantly higher than total
CPP
2018-19, 10%
2021-22, 15%
2022-23, 14%, significantly higher than total
CPP-D
2018-19, 9%
2021-22, 11%
2022-23, 12%, significantly higher than total
SIN
2018-19, 3%
2021-22, 3%
2022-23, 2%, significantly lower than total, significantly lower than previous wave
OAS/GIS
2018-19, 7%
2021-22, 7%
2022-23, 9%
More than 8 weeks (NET)
Total
2018-19, 10%
2021-22, 14%
2022-23, 14%
EI
2018-19, 8%
2021-22, 12%
2022-23, 12%, significantly lower than total
CPP
2018-19, 18%
2021-22, 25%
2022-23, 25%, significantly higher than total
CPP-D
2018-19, 63%
2021-22, 65%
2022-23, 65%, significantly higher than total
SIN
2018-19, 3%
2021-22, 5%
2022-23, 3%, significantly lower than total
OAS/GIS
2018-19, 20%
2021-22, 30%
2022-23, 34%, significantly higher than total
Between 8 weeks to 6 months
Total
2021-22, 11%
2022-23, 10%
EI
2021-22, 10%
2022-23, 10%
CPP
2021-22, 21%
2022-23, 18%, significantly higher than total
CPP-D
2021-22, 40%
2022-23, 33%, significantly higher than total, significantly lower than previous wave
SIN
2021-22, 4%
2022-23, 3%, significantly lower than total
OAS/GIS
2021-22, 20%
2022-23, 21%, significantly higher than total
More than 6 months
Total
2021-22, 3%
2022-23, 4%
EI
2021-22, 2%
2022-23, 2%, significantly lower than the total
CPP
2021-22, 4%
2022-23, 7%, significantly higher than total, significantly higher than previous wave
CPP-D
2021-22, 25%
2022-23, 32%, significantly higher than total, significantly higher than previous wave
SIN
2021-22, 1%
2022-23, 0%, significantly lower than total
OAS/GIS
2021-22, 10%
2022-23, 13%, significantly higher than total
Don't know
Total
2018-19, 4%
2021-22, 4%
2022-23, 5%
EI
2018-19, 2%
2021-22, 4%
2022-23, 3%
CPP
2018-19, 7%
2021-22, 8%
2022-23, 8%, significantly higher than total
CPP-D
2018-19, 3%
2021-22, 4%
2022-23, 3%, significantly lower than total
SIN
2018-19, 4%
2021-22, 2%
2022-23, 2%, significantly lower than total
OAS/GIS
2018-19, 14%
2021-22, 15%
2022-23, 13%, significantly higher than total
Note: In 2021-22, additional response options were included in the survey question for ‘Between 8 to 6 months’ and ‘More than 6 months’ while in 2018-19 the longest option provided was ‘More than 8 weeks’.
Q38d. And how long did your entire experience take from getting information about how to apply for [INSERT ABBREV] to receiving a decision on your application?
Base: All respondents (n=4200)
Highlights By Program
Satisfaction with Service Experience by Program
Compared to 2021-22, satisfaction among SIN clients increased. Satisfaction was stable for all other programs, however ratings have declined directionally among CPP-D clients for the second consecutive year.
Satisfaction was higher among SIN clients compared to all clients, lower among EI clients and, consistent with previous years, remained lower for CPP-D clients.
Figure long description
Satisfaction With Service Experience (% Rated 4 Or 5) – Trending
EI
2017-18, n=4001, 83%
2018-19, n=4401, 80%
2019-20, n=2431, 77%
2020-21, n=4200, 84%
2021-22, n=4200, 76%
2022-23, n=4200, 78%, significantly lower than total
CPP
2017-18, n=4001, 87%
2018-19, n=4401, 87%
2019-20, n=2431, 88%
2020-21, n=4200, 86%
2021-22, n=4200, 86%
2022-23, n=4200, 85%
CPP-D
2017-18, n=4001, 64%
2018-19, n=4401, 62%
2019-20, n=2431, 60%
2020-21, n=4200, 63%
2021-22, n=4200, 60%
2022-23, n=4200, 58%, significantly lower than total
SIN
2017-18, n=4001, 94%
2018-19, n=4401, 92%
2019-20, n=2431, 94%
2020-21, n=4200, 89%
2021-22, n=4200, 89%
2022-23, n=4200, 94%, significantly higher than total, significantly higher than previous wave
OAS/GIS
2017-18, n=4001, 86%
2018-19, n=4401, 87%
2019-20, n=2431, 87%
2020-21, n=4200, 88%
2021-22, n=4200, 81%
2022-23, n=4200, 84%
Q38a. Again thinking about the overall service from getting information about [INSERT ABBREV] to receiving a decision. How satisfied were you with the service you received from Service Canada? Please use a 5-point scale, where 1 means very dissatisfied, and 5 means very satisfied.
Base: All respondents (n=4200)
CX Performance and Service Attributes – EI
Figure long description
CX Performance and Service Attributes – EI
Overall Satisfaction
78% rated 4 or 5
Stable with previous wave (76%) but lower than in 2020-21 (84%)
Satisfaction was higher among Seniors 60+ (87%) and clients in Atlantic Canada (90%).
Channel Satisfaction
Increase for specialized call centres (71% vs. 63%) from 2021-22. In-person service rated lower compared to all clients (73% vs. 83%)
Aware
Ease of understanding info about program: 73% (+4 pts)
2021-22: 69%
2020-21: 75%
2019-20: 72%
Ease of figuring out eligibility: 68% (-1 pt) , significantly lower than total
2021-22: 69%
2020-21: 73%
2019-20: 66%
Find the info you needed within reasonable amount of time: 74% (+5 pts)
2021-22: 69%
2020-21: 73%
2019-20: 70%
Apply
Ease of putting together the information needed to apply: 75% (-2 pts) , significantly lower than total
2021-22: 77%
2020-21: 81%
2019-20: 75%
Ease of MSCA registration: 61% (+10 pts), significantly higher than previous wave
2021-22: 51%
2020-21: 65%
2019-20: 73%
Ease of getting help on your application: 63% (+5 pts) , significantly lower than total, top five driver of satisfaction
2021-22: 58%
2020-21: 58%
Ease of completing the form: 82% (+1 pt) , significantly lower than total, top five driver of satisfaction
2021-22: 81%
2020-21: 84%
2019-20: 82%
Follow-up
Ease of following up on application: 57% (+4 pts)
2021-22: 53%
2020-21: 59%
2019-20: 57%
Overall
Duration of client journey reasonable: 66% (-3 pts), significantly lower than total, top five driver of satisfaction
2021-22: 69%
2020-21: 80%
2019-20: 68%
Process was clear: 70% (-3 pts), significantly lower than total, top five driver of satisfaction
2021-22: 67%
2020-21: 77%
2019-20: 65%
Overall effectiveness: 79% (+1 pts), significantly lower than total
2021-22: 78%
2020-21: 83%
2019-20: 76%
Received consistent information: 78% (+2 pts), significantly lower than total, top five driver of satisfaction
2021-22: 76%
2020-21: 82%
2019-20: 76%
Ease of getting help when needed: 70% (+7 pts), significantly higher than previous wave
2021-22: 63%
2020-21: 65%
2019-20: 70%
Completing steps online made it easier: 89% (+3 pts) , significantly higher than total, significantly higher than previous wave
2021-22: 86%
2020-21: 86%
2019-20: 86%
Confidence in issue resolution: 70% (+1 pt), significantly lower than total
2021-22: 69%
2020-21: 73%
2019-20: 72%
Needed to explain situation once: 70% (no change), significantly lower than total
2021-22: 70%
2020-21: 72%
2019-20: 71%
Base: EI clients (n=1035)
Margin of Error +/- 3.0 percentage points. Within this, sample size varies by statement.
Qualitative Highlights on the EI Client Journey
There were several negative emotions expressed by participants who had lower satisfaction and/or experienced a barrier during the application process for EI. Specifically, these participants felt confused, angry, disappointed, helpless and painful.
These emotions were a result of difficulties encountered including: receipt of conflicting information from different Service Canada representatives; needed to repeat their story; delayed payments and/or being “ignored”, i.e., having to wait several weeks for answers.
Some participants expressed gratitude for having access to the EI program in a time of need; relief for the ease of applying and connecting with a helpful Service Canada representative.
A few participants had accessed EI on several occasions and therefore were very familiar with the process and felt that it was easy owing to their repeated experiences.
I was just thankful that we were able to apply for EI. Just for the fact that, you know, there’s no income coming in, but you have that option. You put into it and you’re able to collect something, right. Something’s better than nothing while you’re unemployed.
But for me when I left from sick benefits, and I still had weeks left and I said to myself, I'm ready to go back to work now. My doctor didn't want me to, but I said that's it. I was done. So, when I called and I transferred from sick benefits to the regular benefits, that was when my nightmare started. Every time I called…I know I had to give them a couple of weeks to get everything set up. And then it was like nothing, nothing. I escalated my claims 17 times.
EI Claimant Frequency
Satisfaction was consistent by claimant frequency among EI clients. Consistent with overall program results, satisfaction was lower among all groups compared to all clients.
First time EI claimants and those who have applied less than two years ago provided lower ratings for the quality of service provided in-person.
Those who made a previous claim less than two years ago provided lower ratings for the specialized call centre.
Figure long description
Overall satisfaction (% rated 4 or 5)
2022-23
First time EI claimant, 78%, significantly lower than total
More than 2 years, 78%, significantly lower than total
Less than 2 years, 77%, significantly lower than total
Figure long description
Service Channel Satisfaction (% Rated 4 or 5)
In person
First time EI claimant, 70%, significantly lower than total
More than 2 years, 80%
Less than 2 years, 71%, significantly lower than total
Online
First time EI claimant, 72%
More than 2 years, 73%
Less than 2 years, 72%
Specialized Call Centre
First time EI claimant, 79%
More than 2 years, 71%
Less than 2 years, 64%, significantly lower than total
1 800 O-Canada
First time EI claimant, 64%
More than 2 years, 72%
Less than 2 years, 63%
My Service Canada Account
First time EI claimant, 72%
More than 2 years, 75%
Less than 2 years, 78%
eServiceCanada
First time EI claimant, 69%
More than 2 years, 63%
Less than 2 years, 71%
Base: First time EI claimants (n=335); Previous claim more than 2 years (n=292); Previous claim less than 2 years (n=408)
Consistent with overall program results, ratings on timeliness of service were lower among all claimant frequency groups compared to all clients.
First time EI claimants also provided lower ratings for the helpfulness of in-person and 1 800 O-Canada representatives, needing to explain your situation once, clarity of process, overall ease and effectiveness, understanding information about the program and the requirements of the application.
Those who have made a claim less than two years ago also provided lower ratings for the helpfulness of in-person representatives, needing to explain your situation once, confidence in issue resolution, understanding the requirements, ease of putting together the information needed, completing the form and getting help in general and on the application.
Those who have made a claim more than two years ago also provided lower ratings for the clarity of process and confidence in issue resolution.
EI clients who have applied before (either less than two year or more than two years ago) provided higher ratings for being able to complete steps online made the process easier.
Figure long description
Widest gap vs. Total in service attributes (% rated 4 or 5)
The amount of time it took was reasonable
First time EI claimant, 64%, significantly lower than total
Previous claim less than 2 years, 67%, significantly lower than total
Previous claim more than 2 years, 69%, significantly lower than total
Service Canada representatives that you dealt with in person were helpful
First time EI claimant, 81%, significantly lower than total
Previous claim less than 2 years, 85%, significantly lower than total
Previous claim more than 2 years, 89%
You needed to explain your situation only once.
First time EI claimant, 68%, significantly lower than total
Previous claim less than 2 years, 70%, significantly lower than total
Previous claim more than 2 years, 71%
Throughout the process it was clear what would happen next and when it would happen.
First time EI claimant, 68%, significantly lower than total
Previous claim less than 2 years, 72%
Previous claim more than 2 years, 70%, significantly lower than total
You were confident that any issues or problems would have been easily resolved.
First time EI claimant, 73%
Previous claim less than 2 years, 68%, significantly lower than total
Previous claim more than 2 years, 69%, significantly lower than total
You were able to move smoothly through all of the steps
First time EI claimant, 77%, significantly lower than total
Previous claim less than 2 years, 81%
Previous claim more than 2 years, 80%
Overall, it was easy for you to apply
First time EI claimant, 83%, significantly lower than total
Previous claim less than 2 years, 86%
Previous claim more than 2 years, 85%
1-800 O-Canada phone representatives were helpful
First time EI claimant, 68%, significantly lower than total
Previous claim less than 2 years, 88%
Previous claim more than 2 years, 91%
Understand the information
First time EI claimant, 69%, significantly lower than total
Previous claim less than 2 years, 73%
Previous claim more than 2 years, 77%
Understanding the requirements
First time EI claimant, 76%, significantly lower than total
Previous claim less than 2 years, 77%, significantly lower than total
Previous claim more than 2 years, 79%
Putting together the information you needed to apply
First time EI claimant, 76%
Previous claim less than 2 years, 72%, significantly lower than total
Previous claim more than 2 years, 76%
Completing the application form
First time EI claimant, 82%
Previous claim less than 2 years, 80%, significantly lower than total
Previous claim more than 2 years, 86%
Getting help on your application when you needed it
First time EI claimant, 65%
Previous claim less than 2 years, 59%, significantly lower than total
Previous claim more than 2 years, 64%
It was easy to get help when you needed it.
First time EI claimant, 76%
Previous claim less than 2 years, 66%, significantly lower than total
Previous claim more than 2 years, 70%
Being able to complete steps online made the process easier for you.
First time EI claimant, 87%
Previous claim less than 2 years, 89%, significantly higher than total
Previous claim more than 2 years, 90%, significantly higher than total
Base: First time EI claimants (n=335); Previous claim more than 2 years (n=292); Previous claim less than 2 years (n=408)
CX Performance and Service Attributes – CPP
Figure long description
Overall Satisfaction
85% rated 4 or 5
Stable with previous waves
There were no significant differences by age, gender, or region.
Channel Satisfaction
Stable with previous wave but satisfaction with eServiceCanada is lower than in 2020-21 (64% vs. 82%).
Aware
Ease of finding what info you need to provide: 76% (+2 pts), top five driver of satisfaction
2021-22: 74%
2020-21: 78%
2019-20: 81%
Ease of finding info about program: 75% (-1 pt), top five driver of satisfaction
2021-22: 76%
2020-21: 76%
2019-20: 82%
Ease of figuring out eligibility: 78% (-3 pts), significantly higher than total
2021-22: 81%
2020-21: 80%
2019-20: 83%
Apply
Ease of getting help on application: 61% (+2 pts), significantly lower than total
2021-22: 59%
2020-21: 63%
Follow-up
Ease of following up on application: 73% (+9 pts), significantly higher than total, significantly higher than previous wave, top five driver of satisfaction
2021-22: 64%
2020-21: 68%
2019-20: 68%
Overall
Duration of client journey reasonable: 79% (-3 pts), significantly higher than total, top five driver of satisfaction
2021-22: 82%
2020-21: 81%
2019-20: 83%
Overall effectiveness: 83% (+2 pts) , top five driver of satisfaction
2021-22: 81%
2020-21: 80%
2019-20: 85%
Trust: 81% (+7 pts), significantly higher than previous wave
2021-22: 74%
2020-21: 81%
2019-20: 83%
Completing steps online made it easier: 73% (+12 pts), significantly lower than total, significantly higher than previous wave
2021-22: 61%
2020-21: 62%
2019-20: 60%
Protected your safety during COVID: 77% (-7 pts), significantly lower than total, significantly lower than previous wave
2021-22: 84%
2020-21: 82%
eService Canada reps were helpful: 63% (-21 pts), significantly lower than total, significantly lower than previous wave
2021-22: 84%
2020-21: 83%
Process was clear: 70% (-5 pts), significantly lower than total
2021-22: 75%
2020-21: 80%
2019-20: 80%
Clear process if had issue: 74% (no change), significantly lower than total
2021-22: 74%
2020-21: 78%
2019-20: 81%
Ease of getting help: 67% (-1 pt), significantly lower than total
2021-22: 68%
2020-21: 70%
2019-20: 73%
Base: CPP clients (n=768)
Margin of Error +/- 3.5 percentage points. Within this, sample size varies by statement.
Qualitative Highlights on CPP and OAS/GIS Client Journey
For some participants, the transition to retirement is a “scary” process. Compounding this is the general belief that CPP is inadequate in covering living expenses thus creating anxiety and stress in participants.
Some participants found the process of applying cumbersome, confusing and fraught.
Feelings of uncertainty and stress were common after submitting their applications due to lack of clarity on the amount they would be entitled to.
That said, participants tended to report positive experiences. This was particularly true for participants who were less financially reliant on CPP and OAS/GIS or had others in their lives to help them (e.g., financial planner). They were more likely to view the entire process as an administrative task and experienced few issues with the application forms.
Several participants encountered Service Canada representatives that were helpful, nice and cooperative. This left them feeling confident, as well as happy and relieved when the process was done.
When my husband passed, I was very lucky that I had my financial planner, and he said to me, “just leave this with me”, because I don't think I would have been emotionally able to do it. So I think it can be a kind of a scary process, and I was happy that my financial planner knew all the processes to make it quicker.
You just had to fill out an online form and yeah, they asked us some questions and the CPP one was easy.
[Service Canada representatives] were nice and very cooperative to me. It’s got to be there for me. But I wasn’t scared or nervous.
Frustration because I did it online and they either received the papers and lost them or they didn't receive them. I had to call in, in order to get it straightened out, and I had to get the information from somebody else where to call. I didn't know where to get an application to apply in person. I didn't know where to go. I felt like it was a good thing and then I waited, and I didn't get my old age and so then I went through trying to get a hold of somebody and they got it straightened out. Loss of income on my CPP and the old age picks up a little bit of it, but it isn't enough to live on. The income on the pensions ain't high enough for seniors. You don't even meet the cost of living.
CX Performance and Service Attributes – CPP-D
Figure long description
Overall satisfaction
58% rated 4 or 5
Stable with previous waves
Satisfaction was higher among men (63%) and lower among women (53%).
Channel satisfaction
Increased for eServiceCanada (73% vs. 49%) from 2021-22. In-person (65%), online (56%) and specialized call centres (62%) rated lower compared to all clients.
Aware
Ease of understanding information about program: 55% (+7 pts), significantly lower than total
2021-22: 48%
2020-21: 60%
2019-20: 48%
Ease of figuring out eligibility: 42% (-2 pts), significantly lower than total
2021-22: 44%
2020-21: 46%
2019-20: 39%
Apply
Ease of putting together the information needed to apply: 45% (+1 pt), significantly lower than total
2021-22: 44%
2020-21: 44%
2019-20: 43%
Ease of getting help on your application: 46% (-2 pts), significantly lower than total
2021-22: 48%
2020-21: 45%
Ease of MSCA registration: 38% (+3 pts), significantly lower than total
2021-22: 35%
2020-21: 43%
2019-20: 48%
Follow-up
Ease of following up on application: 52% (+4 pts), significantly lower than total
2021-22: 48%
2020-21: 52%
2019-20: 48%
Overall
Duration of client journey reasonable: 45% (-3 pts), significantly lower than total, top five driver of satisfaction
2021-22: 48%
2020-21: 57%
2019-20: 49%
Overall effectiveness: 56% (-2 pts), significantly lower than total, top five driver of satisfaction
2021-22: 58%
2020-21: 58%
2019-20: 57%
Confidence in issue resolution: 52% (-5 pts), significantly lower than total, top five driver of satisfaction
2021-22: 57%
2020-21: 56%
2019-20: 51%
Specialized call centre reps were helpful: 73% -1 pt), significantly lower than total, top five driver of satisfaction
2021-22: 74%
2020-21: 68%
2019-20: 68%
Needed to explain situation once: 51% (-6 pts), significantly lower than total
2021-22: 57%
2020-21: 55%
2019-20: 58%
Completing steps online made it easier: 52% (no change) , significantly lower than total, significantly higher than previous wave
2021-22: 52%
2020-21: 56%
2019-20: 51%
Process was clear: 48% (-4 pts), significantly lower than total
2021-22: 52%
2020-21: 56%
2019-20: 51%
Ease of getting help: 55% (+2 pts), significantly lower than total
2021-22: 53%
2020-21: 53%
2019-20: 58%
Base: CPP-D clients (n=752)
Margin of Error +/- 3.6 percentage points. Within this, sample size varies by statement.
Qualitative Highlights on CPP-D Client Journey
Many participants struggled with completing and gathering all the paperwork on top of the health condition they were dealing with. Several also faced challenges with accessing documentation from their doctors.
The delay in hearing back on an application and decision also contributed to frustration, fear of being denied and feeling “at the mercy” of the process.
These negative experiences reflected emotions of disappointment, feeling nervous, helpless, upset, lost and worthless.
A few participants mentioned feeling supported, lucky and thankful. One participant said they were “treated like gold” and another said they felt relieved and confident once the process was successfully completed.
I was in a traumatic head-on collision. So, when you're in a lot of pain, it was very hard to focus, very hard to remember events, especially I spread this out over I think it was a six-year time period, over the four applications. And so, trying to express how you're feeling and how it’s affecting your life is a little difficult for me anyway.
I had phoned to say, some of these questions don’t pertain to what I am going through as far as brain cancer, and what I have to deal with. The woman that answered, she was very flip and kind of just said, “Oh well, just do the best you can.” I thought, well, that’s not very helpful.
I felt… I was a bit nervous because I didn’t know if they were going to approve me or not, […] But I was lucky enough, when I did, whoever the [representative] was, she was a very nice person,[…] at the time, you know, out of job for so long and all my finances had dwindled and everything. So, it was good to hear some positivity from a [representative]. […] she came and lifted my spirit a bit. So, I was thankful for that, I must say.
CX Performance and Service Attributes – OAS/GIS
Figure long description
Overall satisfaction
84% rated 4 or 5
Stable with previous waves
Satisfaction was lower among Seniors 70+ (67%), although this represents only 5% of OAS/GIS clients.
Channel satisfaction
Stable with previous wave. Online (64%) and MSCA (59%) rated lower compared to all clients.
Aware
Ease of finding out what info you need to provide: 72% (+6 pts), top five driver of satisfaction
2021-22: 66%
2020-21: 72%
2019-20: 83%
Ease of finding info on program: 74% (+2 pts) , top five driver of satisfaction
2021-22: 72%
2020-21: 75%
2019-20: 76%
Ease of finding out the steps to apply: 71% (-1 pt), significantly lower than total, top five driver of satisfaction
2021-22: 72%
2020-21: 80%
2019-20: 76%
Ease of understanding info about program: 68% (+1 pt), significantly lower than total
2021-22: 67%
2020-21: 84%
2019-20: 82%
Ease of figuring out eligibility: 80% (+7 pts), significantly higher than total
2021-22: 73%
2020-21: 82%
2019-20: 84%
Apply
Ease of completing application form: 83% (+10 pts), significantly higher than previous wave
2021-22: 73%
2020-21: 76%
2019-20: 85%
Ease of getting help on your application: 62% (+8 pts), significantly lower than total, significantly higher than previous wave
2021-22: 54%
2020-21: 61%
Follow-up
Ease of following up on application: 60% (+1 pt), top five driver of satisfaction
2021-22: 59%
2020-21: 70%
2019-20: 77%
Overall
Overall ease: 87% (+7 pts), significantly higher than previous wave
2021-22: 80%
2020-21: 88%
2019-20: 92%
Trust: 76% (+6 pts), significantly lower than total, significantly higher than previous wave
2021-22: 70%
2020-21: 82%
2019-20: 81%
Completing steps online made it easier: 71% (+6 pts), significantly higher than previous wave
2021-22: 65%
2020-21: 69%
2019-20: 67%
Ease of getting help when needed: 64% (+7 pts), significantly lower than total, significantly higher than previous wave
2021-22: 57%
2020-21: 71%
2019-20: 74%
Duration of client journey reasonable: 81% (+4 pts), significantly higher than total
2021-22: 77%
2020-21: 85%
2019-20: 85%
Clear process if had issue: 74% (no change), significantly lower than total
2021-22: 74%
2020-21: 84%
2019-20: 80%
Confident personal info protected: 79% (+1 pt), significantly lower than total
2021-22: 78%
2020-21: 85%
2019-20: 79%
Travelled reasonable distance: 72% (no change), top five driver of satisfaction
2021-22: 72%
2020-21: 74%
2019-20: 83%
Base: OAS/GIS clients (n=862)
Margin of Error +/- 3.3 percentage points. Within this, sample size varies by statement.
OAS/GIS – Auto-Enroll and Non Auto-Enroll Clients
Overall satisfaction was consistent among Auto-Enroll and Non Auto-Enroll clients compared to all clients.
Compared to 2021-22, satisfaction has increased significantly among Non Auto-Enroll clients.
Non Auto-Enroll clients provided lower ratings for online than all clients.
Figure long description
Overall Satisfaction (% Rated 4 Or 5) – Trending
2018-19
Auto-Enroll, 88%
Non Auto-Enroll, 86%
2019-20
Auto-Enroll, 84%
Non Auto-Enroll, 92%
2020-21
Auto-Enroll, 88%
Non Auto-Enroll, 88%
2021-22
Auto-Enroll, 84%
Non Auto-Enroll, 78%
2022-23
Auto-Enroll, 84%
Non Auto-Enroll, 84%, significantly higher than previous wave
Figure long description
Service Channel Satisfaction (% Rated 4 or 5)
In person
Auto-Enroll
2018-19, 83%
2019-20, 88%
2022-23, 80% (Small sample size. Results should be interpreted with caution)
Non Auto-Enroll
2018-19, 85%
2019-20, 86%
2020-21, 84%
2021-22, 81%
2022-23, 77%
Online
Auto-Enroll
2018-19, 73%
2019-20, 77%
Non Auto-Enroll
2018-19, 75%
2019-20, 72%
2020-21, 78%
2021-22, 66%
2022-23, 64%, significantly lower than total
Specialized Call Centre
Auto-Enroll
2018-19, 785
2019-20, 68%
2020-21, 80%
2021-22, 71%
2022-23, 70%
Non Auto-Enroll
2018-19, 79%
2019-20, 61%
2020-21, 74%
2021-22, 74%
2022-23, 76%
1 800 O-Canada
Auto-Enroll
2018-19, 75%
2019-20, 87%
Non Auto-Enroll
2018-19, 71%
2019-20, 63%
2020-21, 67%
2021-22, 67%
My Service Canada Account
Auto-Enroll
2019-20, 77%
2020-21, 64%
2021-22, 70%
Non Auto-Enroll
2019-20, 69%
2020-21, 69%, (Small sample size. Results should be interpreted with caution)
2021-22, 60%, (Small sample size. Results should be interpreted with caution)
eServiceCanada
Auto-Enroll
2021-22, 69%
Non Auto-Enroll
2020-21, 56%, (Small sample size. Results should be interpreted with caution)
2021-22, 61%, (Small sample size. Results should be interpreted with caution)
* Small sample size. Results should be interpreted with caution. ** Sample sizes too small for reporting.
Base OAS/GIS Auto-enroll (n=393); OAS/GIS Non Auto-enroll (n=469)
Both Auto-Enroll and Non Auto-enroll clients provided lower ratings for the ease of getting help when needed and confidence that personal information is protected compared to all clients. Non-Auto Enroll clients also provided lower ratings for feeling respected throughout the process, being able to complete steps online made the process easier and getting help on the application compared to all clients. Auto-Enroll clients provided lower ratings for clarity of the issue resolution process and being protected during the COVID-19 pandemic. Both client groups provided higher ratings for the timeliness of service, while Non Auto-Enroll clients also provided higher ratings for the clarity of the issue resolution process.
Compared to 2021-22, Non Auto-enroll clients provided higher ratings on ease of getting help, clarity of the issue resolution process, timeliness of service, being able to complete steps online made the process easier, the ease of completing the form and getting assistance on the application and overall ease of applying.
Figure long description
Widest Gap Vs. Total & Change Vs. 2020-21 In Service Attributes (% Rated 4 Or 5)
It was easy to get help when you needed it
2018-19
Auto-Enroll, 69%
Non Auto-Enroll, 74%
2019-20
Auto-Enroll, 70%
Non Auto-Enroll, 80%
2020-21
Auto-Enroll, 70%
Non Auto-Enroll, 72%
2021-22
Auto-Enroll, 55%
Non Auto-Enroll, 59%
2022-23
Auto-Enrol, 60%, significantly lower than total
Non Auto-Enroll, 67%, significantly lower than total, significantly higher than previous wave
Confident that your personal information was protected
2018-19
Auto-Enroll, 82%
Non Auto-Enroll, 84%
2019-20
Auto-Enroll, 75%
Non Auto-Enroll, 86%
2020-21
Auto-Enroll, 86%
Non Auto-Enroll, 85%
2021-22
Auto-Enroll, 79%
Non Auto-Enroll, 78%
2022-23
Auto-Enroll, 78%, significantly lower than total
Non Auto-Enroll, 80%, significantly lower than total
It was clear what to do if you had a problem or question
2018-19
Auto-Enroll, 78%
Non Auto-Enroll, 79%
2019-20
Auto-Enroll, 75%
Non Auto-Enroll, 87%
2020-21
Auto-Enroll, 85%
Non Auto-Enroll, 83%
2021-22
Auto-Enroll, 75%
Non Auto-Enroll, 73%
2022-23
Auto-Enroll, 71%, significantly lower than total
Non Auto-Enroll, 87%, significantly higher than total, significantly higher than previous wave
The amount of time, from start to finish, was reasonable
2018-19
Auto-Enroll, 79%
Non Auto-Enroll, 80%
2019-20
Auto-Enroll, 84%
Non Auto-Enroll, 88%
2020-21
Auto-Enroll, 87%
Non Auto-Enroll, 82%
2021-22
Auto-Enroll, 79%
Non Auto-Enroll, 74%
2022-23
Auto-Enroll, 80%, significantly higher than total
Non Auto-Enroll, 81%, significantly higher than total, significantly higher than previous wave
You were provided service in a way that protected your health and safety during the COVID-19 pandemic
2020-21
Auto-Enroll, 72%
Non Auto-Enroll, 67%
2021-22
Auto-Enroll, 80%
Non Auto-Enroll, 79%
2022-23
Auto-Enroll, 72%, significantly lower than total, significantly lower than previous wave
Non Auto-Enroll, 80%
You felt respected throughout the process
2022-23
Auto-Enroll, 81%
Non Auto-Enroll, 89%, significantly lower than total
Being able to complete steps online made the process easier for you.
2020-21
Non Auto-Enroll, 56%
2021-22
Non Auto-Enroll, 52%
2022-23
Non Auto-Enroll, 71%, significantly lower than total, significantly higher than previous wave
Completing the application form
2020-21
Non Auto-Enroll, 76%
2021-22
Non Auto-Enroll, 73%
2022-23
Non Auto-Enroll, 83%, significantly higher than previous wave
Getting help on your application when you needed it
2020-21
Non Auto-Enroll, 61%
2021-22
Non Auto-Enroll, 54%
2022-23
Non Auto-Enroll, 62%, significantly lower than total, significantly higher than previous wave
Overall, it was easy for you to apply
2020-21
Non Auto-Enroll, 88%
2021-22
Non Auto-Enroll, 80%
2022-23
Non Auto-Enroll, 87%, significantly higher than previous wave
CX Performance and Service Attributes – SIN
Figure long description
Overall Satisfaction
94% rated 4 or 5
Increase in overall satisfaction from 2021-22 (89%).
Satisfaction was highest among clients in Atlantic Canada (100%).
Channel satisfaction
Increased for in-person (90% vs. 85%) from 2020-21. In-person (90%) and online (86%) rated higher compared to all clients.
Aware
Ease of finding info on program: 87% (- pts), significantly higher than total
2021-22: 87%
2020-21: 86%
2019-20: 81%
Ease of finding out the steps to apply: 85% (+3 pts), significantly higher than total
2021-22: 82%
2020-21: 85%
2019-20: 81%
Apply
Able to complete application in reasonable time: 86% (+2 pts), top five driver of satisfaction
2021-22: 84%
2020-21: 88%
2019-20: 87%
Ease of understanding requirements: 91% (+2 pts), significantly higher than total, top five driver of satisfaction
2021-22: 89%
2020-21: 90%
2019-20: 85%
Ease of getting help on your application: 83% (+5 pts), significantly higher than total, significantly higher than previous wave
2021-22: 78%
2020-21: 78%
Ease of completing application form: 92% (+2 pts), significantly higher than total
2021-22: 90%
2020-21: 89%
Follow-up
Ease of following up on application: 76% (+12 pts), significantly higher than total
2021-22: 64%
2020-21: 72%
2019-20: 73%
Overall
Duration of client journey reasonable: 87% (+5 pts), significantly higher than total, significantly higher, top five driver of satisfaction than previous wave
2021-22: 82%
2020-21: 85%
2019-20: 89%
Overall ease: 93% (+3 pts), significantly higher than total, significantly higher than previous wave
2021-22: 90%
Ease of getting help: 88% (+4 pts), significantly higher than total, significantly higher than previous wave
2021-22: 84%
2020-21: 83%
2019-20: 83%
Service Canada in-person representatives were helpful: 96% (+4 pts), significantly higher than total, significantly higher than previous wave, top five driver of satisfaction
Confidence in issue resolution: 86% (+1 pt), significantly higher than total, top five driver of satisfaction
2021-22: 85%
2020-21: 84%
2019-20: 87%
Clarity of process: 88% (+4 pts), significantly higher than total
2021-22: 84%
2020-21: 88%
2019-20: 83%
Base: SIN clients (n=783)
Margin of Error +/- 3.5 percentage points. Within this, sample size varies by statement.
Qualitative Highlights on SIN Client Journey
SIN clients were typically informed by those around them of the importance of obtaining a SIN number in order to gain employment. Most participants found the process easy and straightforward, with feelings of happiness and relief upon receiving their SIN.
The main negative emotion participants experienced was frustration with the long queues at Service Canada Centres.
Among a small number of participants who were unable to obtain their SIN number upon their first visit, feelings of disappointment, anxiety and anger were evident. In an extreme case, a participant’s SIN application was referred for further investigation. Follow-up calls to Service Canada for updates and to find out more about the issue with the application or how the participant could resolve the situation came to no avail, which in turn exacerbated the already frustrating situation for the participant. The case was finally resolved after 6 weeks which resulted in great relief for the participant, however, he continued to be dismayed at the lack of transparency on the reasons behind the delay. Moreover, the participant reported loss of income as a result of delays in obtaining their SIN number.
When I finally got to see somebody after waiting for two hours only to be told you don’t have the right documents, and I left and I was crying. So, my emotions were… I just wasted two and a half hours of my life, I’ll never get that back, and I still don’t have a Social Insurance Number.
It took me six weeks of many, many different phone calls. The emotions were very challenging, because without a SIN, I was not able to work, even though Service Canada would say that legally, I’m entitled to be employed, which is great. But every other company that I was applying for jobs quite clearly said, without a SIN, we cannot legally employ you. So, it was like Service Canada saying, don’t worry, you can still work. But actually, the employer is going, sorry, you can’t without a SIN. So, I spent six weeks unemployed.
It was just kind of like really straightforward, like I just went there with my health card and my birth certificate, but I went really early in the morning, so right when they opened up. So, it was pretty fast, the process.
SIN vs. eSIN
Overall satisfaction was consistent among SIN and eSIN clients, although a higher proportion of SIN clients provided a rating of 5 out of 5. Consistent with overall results for the program, satisfaction was higher among SIN and eSIN clients compared to all clients. Results were directionally higher among both groups compared to 2021-22, and notably a higher proportion of SIN clients provided a rating of 5 out of 5 compared to last year.
SIN clients provided higher ratings for the quality of service provided in person, online and through specialized call centres, while eSIN clients provided higher ratings for online. Results were consistent compared to 2021-22.
Figure long description
Overall Satisfaction
SIN
2022-23 (n=538)
5 – very satisfied, 74%, significantly higher than previous wave
Rated 4, 21%
Rated 3, 4%
Rated 2, 0%
1 – very dissatisfied, 1%
% Rated 4 or 5, 94%, significantly higher than total
2021-222 (n=564)
5 – very satisfied, 64%
Rated 4, 26%
Rated 3, 6%
Rated 2, 1%
1 – very dissatisfied, 1%
% Rated 4 or 5, 90%
eSIN
2022-23 (n=181)
5 – very satisfied, 66%
Rated 4, 26%
Rated 3, 6%
Rated 2, 2%
1 – very dissatisfied, 0%
% Rated 4 or 5, 92%, significantly higher than total
2021-22 (n=278)
5 – very satisfied, 58%
Rated 4, 29%
Rated 3, 9%
Rated 2, 2%
1 – very dissatisfied, 1%
% Rated 4 or 5, 87%
** Sample sizes too small for reporting.
Base: SIN / eSIN clients (n=783)
Figure long description
Service channel satisfaction (% rated 4 or 5)
SIN
In-person
2021-22, 87%
2022-23, 91%, significantly higher than total
Online
2021-22, 88%
2022-23, 83%, significantly higher than total
Specialized Call Centres
2021-22, 87%
2022-23, 88%, significantly higher than total, (Small sample size. Results should be interpreted with caution)
eServiceCanada
2021-22, 90%
2022-23, 83%, (Small sample size. Results should be interpreted with caution)
eSIN
In-person
2021-22, 77%
2022-23, 84%
Online
2021-22, 88%
2022-23, 89%, significantly higher than total
Specialized Call Centres
2021-22, 88%
eServiceCanada
2022-23, 79%, (Small sample size. Results should be interpreted with caution)
SIN and eSIN clients provided higher ratings across several service attributes compared to all clients.
Gaps were consistently larger among SIN clients, with the widest gaps for the ease of getting help in general and on the application, the helpfulness of specialized call centre representatives and timeliness of service. The largest gaps among eSIN clients were for the ease of understanding information about the program, ease of getting help on the application, ease of figuring out eligibility and timeliness of service.
Compared to 2021-22, ratings have increased among SIN clients for the ease of getting help and receiving consistent information, while eSIN clients provided higher ratings for the ease of getting help on the application.
Figure long description
Widest gap in service attributes (% rated 4 or 5 vs. Total)
Ease of getting help on your application
SIN, 86%, significantly higher than total
GAP vs. Total, +18 points
eSIN, 80%, significantly higher than total, significantly higher than previous wave
GAP vs. Total, +12 points
It was easy to get help when you needed it
SIN, 92%, significantly higher than total, significantly higher than previous wave
GAP vs. Total, +18 points
eSIN, 76%
GAP vs. Total, +2 points
Specialized call centre representatives were helpful
SIN, 100%, (Small sample size. Results should be interpreted with caution)
GAP vs. Total, +17 points
eSIN, 89%
GAP vs. Total, +6 points
The amount of time, from start to finish, was reasonable
SIN, 89%, significantly higher than total
GAP vs. Total, +14 points
eSIN, 85%
GAP vs. Total, +10 points
Ease of understanding information about the program
SIN, 81%
GAP vs. Total, +5 points
eSIN, 89%, significantly higher than total
GAP vs. Total, +14 points
It was clear what would happen next and when
SIN, 89%, significantly higher than total
GAP vs. Total, +13 points
eSIN, 85%, significantly higher than total
GAP vs. Total, +9 points
Confident that any issues or problems would have been easily resolved
SIN, 88%, significantly higher than total
GAP vs. Total, +13 points
eSIN, 79%, significantly higher than total
GAP vs. Total, +4 points
Needed to explain your situation only once
SIN, 87%, significantly higher than total
GAP vs. Total, +12 points
eSIN, 84%, significantly higher than total
GAP vs. Total, +9 points
Ease of putting together the information you needed to provide when applying
SIN, 91%, significantly higher than total
GAP vs. Total, +12 points
eSIN, 97%, significantly higher than total
GAP vs. Total, +8 points
Ease of figuring out if you are eligible for benefits/ SIN card
SIN, 80%, significantly higher than total
GAP vs. Total, +7 points
eSIN, 85%, significantly higher than total
GAP vs. Total, +12 points
It was clear what to do if you had a problem or question
SIN, 89%, significantly higher than total
GAP vs. Total, +11 points
eSIN, 83%
GAP vs. Total, +5 points
You received consistent information
SIN, 92%, significantly higher than total, significantly higher than previous wave
GAP vs. Total, +11 points
eSIN, 84%
GAP vs. Total, +3 points
Base: SIN / eSIN (n=783); SIN (n=532), eSIN (n=241)
Ease Service Attributes: Overall (1/3)
At more than nine in ten, clients were most likely to agree it was easy to access service in a language they could speak and understand well, followed by more than eight in ten who felt that overall it was easy to apply and that being able to complete steps online made the process easier. Three-quarters of clients agreed that it was clear what would happen next and when and that they needed to explain their situation only once.
Compared to 2021-22, clients were more likely to agree that it was easy to apply overall.
Figure long description
Ease
% Rated 4 or 5
It was easy to access service in a language I could speak and understand well
2022-23, 94%
2021-22, 93%,
2020-21, 95%
2019-20, 94%
2018-19, 94%
Overall, it was easy for you to apply for [PROGRAM], For the first time in 2021-22, the overall ease metric was asked among SIN clients. SIN data has therefore been included in calculations from 2021-22 onward. 2022-23, 87%, significantly higher than previous wave
2021-22, 85%
2020-21, 86%
2019-20, 84%
2018-19, 85%
2017-18, 84%
Being able to complete steps online made the process easier for you
2022-23, 84%
2021-22, 82%
2020-21, 84%
2019-20, 82%
2018-19, 82%
2017-18, 81%
Throughout the process, it was clear what would happen next and when it would happen
2022-23, 76%
2021-22, 74%,
2020-21, 81%
2019-20, 73%
2018-19, 77%
You need to explain your situation only once
2022-23, 75%
2021-22, 74%,
2020-21, 77%
2019-20, 78%
2018-19, 77%
2017-18, 77%
+ The overall ease metric was first asked to SIN clients in 2021-22 and is included in calculations for 2021-22 and 2022-23
Note: Statements asked differently with different scale in 2017-18, interpret with caution. Tracking data for “Being able to complete the steps online made the process easier for you” recalculated to be consistent with 2022-23, asked only to those who had used an online channel.
Q36b. Thinking about the service you received, how much do you agree or disagree with the following statements.
Base: All answering (n=varies)
Ease Service Attributes: by Program (2/3)
SIN clients were more likely to provide high ratings for the overall ease of applying, clarity of process and that they needed to explain their situation once. EI clients were more likely to provide high ratings for being able to complete steps online made the process easier and were less likely to provide high ratings for clarity of process, that it was easy to apply overall and that they needed to explain their situation once. CPP-D clients were less likely to provide high ratings across all aspects of ease compared to all clients, while CPP clients were less likely to provide higher ratings for being able to complete steps online made the process easier (along with OAS/GIS clients) and clarity of process. OAS/GIS clients were also less likely to provide high ratings that it was easy to access service in a language they could speak and understand well and being able to complete the steps online making the process easier.
Compared to 2021-22, EI clients were more likely to feel that being able to complete steps online made the process easier. SIN and OAS/GIS clients were more likely to agree that, overall, it was easy to apply.
Figure long description
Ease, % Rated 4 or 5
It was easy to access service in a language I could speak and understand well
TOTAL
2018-19, 94%
2019-20, 94%
2020-21, 95%
2021-22, 93%
2022-23, 94%
EI
2018-19, 96%
2019-20, 94%
2020-21, 95%
2021-22, 94%
2022-23, 95%
CPP
2018-19, 92%
2019-20, 95%
2020-21, 92%
2021-22, 93%
2022-23, 95%
CPP-D
2018-19, 90%
2019-20, 91%
2020-21, 85%
2021-22, 92%
2022-23, 89%, significantly lower than total
SIN
2018-19, 94%
2019-20, 94%
2020-21, 96%
2021-22, 93%
2022-23, 94%
OAS/GIS
2018-19, 92%
2019-20, 94%
2020-21, 93%
2021-22, 91%
2022-23, 91%, significantly lower than total
Overall, it was easy for you to apply for [PROGRAM]+
TOTAL
2017-18, 84%
2018-19, 85%
2019-20, 84%
2020-21, 86%
2021-22, 82%
2022-23, 87%, significantly higher than previous wave
EI
2017-18, 84%
2018-19, 86%
2019-20, 84%
2020-21, 87%
2021-22, 83%
2022-23, 85%, significantly lower than total
CPP
2017-18, 88%
2018-19, 88%
2019-20, 88%
2020-21, 85%
2021-22, 85%
2022-23, 85%
CPP-D
2017-18, 57%
2018-19, 60%
2019-20, 55%
2020-21, 56%
2021-22, 55%
2022-23, 54%, significantly lower than total
SIN
2017-18, 87%
2018-19, 87%
2021-22, 90%
2022-23, 93%, significantly higher than total, significantly higher than previous wave
OAS/GIS
2017-18, 84%
2018-19, 87%
2019-20, 92%
2020-21, 88%
2021-22, 80%
2022-23, 87%, significantly higher than previous wave
Being able to complete steps online made the process easier for you
TOTAL
2017-18, 81%
2018-19, 82%
2019-20, 82%
2020-21, 84%
2021-22, 82%
2022-23, 84%
EI
2017-18, 84%
2018-19, 87%
2019-20, 86%
2020-21, 88%
2021-22, 86%
2022-23, 89%, significantly higher than total, significantly higher than previous wave
CPP
2017-18, 64%
2018-19, 69%
2019-20, 73%
2020-21, 75%
2021-22, 72%
2022-23, 73%, significantly lower than total
CPP-D
2017-18, 47%
2018-19, 40%
2019-20, 51%
2020-21, 56%
2021-22, 52%
2022-23, 52%, significantly lower than total
SIN
2022-23, 81%
OAS/GIS
2017-18, 58%
2018-19, 47%
2019-20, 67%
2020-21, 69%
2021-22, 65%
2022-23, 71%, significantly lower than total
Throughout the process, it was clear what would happen next and when it would happen
TOTAL
2018-19, 77%
2019-20, 73%
2020-21, 81%
2021-22, 74%
2022-23, 76%
EI
2018-19, 74%
2019-20, 65%
2020-21, 77%
2021-22, 67%
2022-23, 70%, significantly lower than total
CPP
2018-19, 78%
2019-20, 80%
2020-21, 80%
2021-22, 75%
2022-23, 70%
CPP-D
2018-19, 53%
2019-20, 51%
2020-21, 56%
2021-22, 52%
2022-23, 48%, significantly lower than total
SIN
2018-19, 83%
2019-20, 83%
2020-21, 88%
2021-22, 84%
2022-23, 88%, significantly higher than total
OAS/GIS
2018-19, 78%
2019-20, 81%
2020-21, 83%
2021-22, 77%
2022-23, 78%
You needed to explain your situation only once
TOTAL
2017-18, 77%
2018-19, 77%
2019-20, 78%
2020-21, 77%
2021-22, 74%
2022-23, 75%
EI
2017-18, 73%
2018-19, 72%
2019-20, 71%
2020-21, 72%
2021-22, 70%
2022-23, 70%, significantly lower than total
CPP
2017-18, 80%
2018-19, 80%
2019-20, 83%
2020-21, 76%
2021-22, 75%
2022-23, 75%
CPP-D
2017-18, 55%
2018-19, 54%
2019-20, 58%
2020-21, 55%
2021-22, 57%
2022-23, 51%, significantly lower than total
SIN
2017-18, 85%
2018-19, 85%
2019-20, 88%
2020-21, 85%
2021-22, 84%
2022-23, 86%, significantly higher than total
OAS/GIS
2017-18, 74%
2018-19, 75%
2019-20, 80%
2020-21, 78%
2021-22, 69%
2022-23, 73%
+ The overall ease metric was first asked to SIN clients in 2021-22 and is included in calculations for 2021-22 and 2022-23
Note: Statements asked differently with different scale in 2017-18, interpret with caution. Tracking data for “Being able to complete the steps online made the process easier for you” recalculated to be consistent with 2022-23, asked only to those who had used an online channel.
Q36b. Thinking about the service you received, how much do you agree or disagree with the following statements.
Base: All answering (n=varies)
Ease of End-to-End Client Journey (3/3)
Figure long description
Ease of navigating end-to-end journey
It was easy to access service in a language I could speak and understand well
5 – Strongly agree, 83%
Rated 4, 11%
Rated 3, 3%
Rated 2, 1%
1 – Strongly disagree, 1%
% Rated 4 or 5
2019-20, 94%
2020-21, 95%
2021-22, 93%
2022-23, 94%
Overall, it was easy for you to apply for
5 – Strongly agree, 58%, significantly higher than previous wave
Rated 4, 26%
Rated 3, 9%
Rated 2, 4%
1 – Strongly disagree, 2%
% Rated 4 or 5
2017-18, 87%
2018-19, 85%
2019-20, 84%
2020-21, 86%
2021-22, 82%
2022-23, 84%
Being able to complete steps online made the process easier for you
5 – Strongly agree, 61%, significantly higher than previous wave
Rated 4, 23%
Rated 3, 8%
Rated 2, 2%
1 – Strongly disagree, 3%
Not applicable, 3%, significnatly higher than previous wave
% Rated 4 or 5
2017-18, 81%
2018-19, 82%
2019-20, 82%
2020-21, 84%
2021-22, 82%
2022-23, 84%
Throughout the process it was clear what would happen next and when it would happen
5 – Strongly agree, 53%
Rated 4, 23%
Rated 3, 13%,
Rated 2, 6%,
1 – Strongly disagree, 5%
% Rated 4 or 5
2018-19, 77%
2019-20, 78%
2020-21, 81%
2021-22, 74%
2022-23, 76%
You needed to explain your situation only once
5 – Strongly agree, 58%
Rated 4, 17%
Rated 3, 11%
Rated 2, 4%
1 – Strongly disagree, 7%
Not applicable, 2%
Don’t’ know, 1%
% Rated 4 or 5
2017-18, 77%
2018-19, 77%
2019-20, 73%
2020-21, 77%
2021-22, 74%
2022-23, 75%
+The overall ease metric was first asked to SIN clients in 2021-22 and is included in calculations for 2021-22 and 2022-23
Note: Tracking data for “Being able to complete the steps online made the process easier for you” recalculated to be consistent with 2022-23, asked only to those who had used an online channel.
Q36b. Thinking about the service you received, how much do you agree or disagree with the following statements.
Base: All answering (varies)
Qualitative Highlights on Level of Effort
The level of effort varied considerably by program. CPP-D participants who had lower satisfaction and/or experienced a barrier were especially negative. They highlighted: difficulties of describing their disability in words, the length of the form being a challenge given their disability; challenges of obtaining necessary documentation from their doctors in terms of timeliness and cost of forms; and feelings of hopelessness as they had been advised or had heard from others of the difficulty of obtaining the benefit.
Participants who applied to other programs (such as EI) also reported challenges related to ambiguous question formulation, delays related to the uploading of incorrect forms, wait times at Service Canada centres and perceived lack of knowledge of Service Canada representatives at time of application.
Participants who applied to CPP, OAS/GIS and SIN tended to indicate it took less effort to complete and submit their applications, describing the process as straightforward with easy steps to follow.
It was a lot of paperwork. Like tons; tons and tons. It was very intrusive, right, like I had to give my whole soul.
Easy. You just had to fill out an online form. […] Seriously, it took like 15 minutes.
“It was easy and clearly explained, because they gave an overview about what is this and who needs a SIN number. How to apply is also there, and they mentioned how to update and how to protect our required documents. So, it's all mentioned on the website. It's clear and detailed.”
Effectiveness Service Attributes: Overall (1/3)
At more than eight in ten, clients were most likely to agree that they were able to move smoothly through all steps, followed by closer to eight in ten who agreed they were provided service in a way that protected them during the pandemic and received consistent information. Just over three-quarters of clients agreed that it was clear what to do if they had a problem or question, followed by that the amount of time from start to finish was reasonable and that it was easy to get help when they needed it.
Compared to 2021-22, ratings have increased that it was clear what to do if they had a problem or question and that it was easy to get help when they needed it and have decreased for being provided service in a way that protected them during the pandemic.
Figure long description
Effectiveness, % Rated 4 or 5
You were able to move smoothly through all of the steps related to your application
2022-23, 84%
2021-22, 82%,
2020-21, 85%
2019-20, 82%
2018-19, 84%
2017-18, 82%
You were provided service in a way that protected your health and safety during the COVID-19 pandemic
2022-23, 81%, singificantly lower than previous wave
2021-22, 87%
2020-21, 88%
You received consistent information
2022-23, 81%
2021-22, 79%
2020-21, 84%
2019-20, 80%
2018-19, 82%
It was clear what to do if you had a problem or question
2022-23, 78%, significantly higher than previous wave
2021-22, 76%
2020-21, 79%
2019-20, 78%
2018-19, 78%
2017-18, 78%
The amount of time it took, from when you started gathering information to when you got a decision on your application, was reasonable
2022-23, 75%
2021-22, 75%
2020-21, 81%
2019-20, 77%
2018-19, 76%
2017-18, 77%
It was easy to get help when you needed it
2022-23, 74%, significantly higher than previous wave
2021-22, 68%
2020-21, 71%
2019-20, 76%
2018-19, 77%
2017-18, 77%
Note: Statements asked differently with different scale in 2017-18, interpret with caution.
Q36b. Thinking about the service you received, how much do you agree or disagree with the following statements.
Base: All answering (n=varies)
Effectiveness Service Attributes: by Program (2/3)
SIN clients were more likely to provide high ratings for all aspects of effectiveness compared to all clients, while CPP-D clients were less likely. EI clients were less likely to provide high ratings for being able to move smoothly through all steps, receiving consistent information, timeliness of service and ease of getting help. CPP and OAS/GIS clients were more likely to provide high ratings for timeliness of service and less likely to agree that they were provided service in a way that protected them during the pandemic, it was clear what to do if they had a problem or question and that it was easy to get help when needed.
Compared to 2021-22, EI, SIN and OAS/GIS clients provided higher ratings for the ease of getting help when needed, while SIN clients also provided higher ratings for timeliness of service. EI, CPP, CPP-D and SIN clients provided lower ratings for being provided service in a way that protected them during the pandemic.
Figure long description
Effectiveness, % Rated 4 or 5
You were able to move smoothly through all of the steps related to your application
TOTAL
2017-18, 82%
2018-19, 84%
2019-20, 82%
2020-21, 85%
2021-22, 82%
2022-23, 84%
EI
2017-18, 77%
2018-19, 81%
2019-20, 76%
2020-21, 83%
2021-22, 78%
2022-23, 79%, significantly lower than total
CPP
2017-18, 84%
2018-19, 83%
2019-20, 85%
2020-21, 80%
2021-22, 81%
2022-23, 83%
CPP-D
2017-18, 55%
2018-19, 62%
2019-20, 57%
2020-21, 58%
2021-22, 58%
2022-23, 56%, significantly lower than total
SIN
2017-18, 90%
2018-19, 91%
2019-20, 91%
2020-21, 91%
2021-22, 91%
2022-23, 93%, significantly higher than total
OAS/GIS
2017-18, 79%
2018-19, 84%
2019-20, 88%
2020-21, 87%
2021-22, 78%
2022-23, 84%
You were provided service in a way that protected your health and safety during the COVID-19 pandemic
TOTAL
2020-21, 88%
2021-22, 87%
2022-23, 81%, significantly lower than previous wave
EI
2020-21, 90%
2021-22, 88%
2022-23, 81%, significantly lower than previous wave
CPP
2020-21, 82%
2021-22, 84%
2022-23, 77%, significantly lower than total, significantly lower than previous wave
CPP-D
2020-21, 75%
2021-22, 81%
2022-23, 75%, significantly lower than total, significantly lower than previous wave
SIN
2020-21, 90%
2021-22, 90%
2022-23, 85%, significantly higher than total, significantly lower than previous wave
OAS/GIS
2020-21, 81%
2021-22, 80%
2022-23, 76%, significantly lower than total
You received consistent information
TOTAL
2018-19, 82%
2019-20, 80%
2020-21, 84%
2021-22, 79%
2022-23, 81%
EI
2018-19, 79%
2019-20, 76%
2020-21, 82%
2021-22, 76%
2022-23, 78%, significantly lower than total
CPP
2018-19, 83%
2019-20, 85%
2020-21, 83%
2021-22, 80%
2022-23, 80%
CPP-D
2018-19, 64%
2019-20, 59%
2020-21, 64%
2021-22, 63%
2022-23, 59%, significantly lower than total
SIN
2018-19, 87%
2019-20, 86%
2020-21, 89%
2021-22, 87%
2022-23, 89%, significantly higher than total
OAS/GIS
2018-19, 81%
2019-20, 82%
2020-21, 87%
2021-22, 76%
2022-23, 80%
It was clear what to do if you had a problem or question
TOTAL
2017-18, 78%
2018-19, 78%
2019-20, 78%
2020-21, 79%
2021-22, 76%
2022-23, 78%, significantly higher than previous wave
EI
2017-18, 75%
2018-19, 77%
2019-20, 74%
2020-21, 75%
2021-22, 72%
2022-23, 76%
CPP
2017-18, 77%
2018-19, 76%
2019-20, 81%
2020-21, 78%
2021-22, 74%
2022-23, 74%, significantly lower than total
CPP-D
2017-18, 62%
2018-19, 63%
2019-20, 61%
2020-21, 60%
2021-22, 60%
2022-23, 61%, significantly lower than total
SIN
2017-18, 85%
2018-19, 82%
2019-20, 84%
2020-21, 87%
2021-22, 85%
2022-23, 87%, significantly higher than total
OAS/GIS
2017-18, 74%
2018-19, 78%
2019-20, 80%
2020-21, 84%
2021-22, 74%
2022-23, 74%, significantly lower than total
The amount of time it took, from when you started gathering information to when you got a decision on your application, was reasonable
TOTAL
2017-18, 77%
2018-19, 76%
2019-20, 77%
2020-21, 81%
2021-22, 75%
2022-23, 75%
EI
2017-18, 73%
2018-19, 69%
2019-20, 68%
2020-21, 80%
2021-22, 69%
2022-23, 66%, significantly lower than total
CPP
2017-18, 80%
2018-19, 83%
2019-20, 83%
2020-21, 81%
2021-22, 82%
2022-23, 79%, significantly higher than total
CPP-D
2017-18, 47%
2018-19, 49%
2019-20, 49%
2020-21, 57%
2021-22, 48%
2022-23, 45%, significantly lower than total
SIN
2017-18, 85%
2018-19, 87%
2019-20, 89%
2020-21, 85%
2021-22, 82%
2022-23, 87%, significantly higher than total, significantly higher than previous wave
OAS/GIS
2017-18, 75%
2018-19, 80%
2019-20, 85%
2020-21, 85%
2021-22, 77%
2022-23, 81%, significantly higher than total
It was easy to get help when you needed it
TOTAL
2017-18, 77%
2018-19, 77%
2019-20, 76%
2020-21, 71%
2021-22, 68%
2022-23, 74%, significantly higher than previous wave
EI
2017-18, 74%
2018-19, 72%
2019-20, 70%
2020-21, 65%
2021-22, 63%
2022-23, 70%, significantly lower than total, significantly higher than previous wave
CPP
2017-18, 75%
2018-19, 73%
2019-20, 73%
2020-21, 70%
2021-22, 68%
2022-23, 67%, significantly lower than total
CPP-D
2017-18, 57%
2018-19, 59%
2019-20, 58%
2020-21, 53%
2021-22, 53%
2022-23, 55%, significantly lower than total
SIN
2017-18, 87%
2018-19, 89%
2019-20, 89%
2020-21, 83%
2021-22, 84%
2022-23, 88%, significantly higher than total, significantly higher than previous wave
OAS/GIS
2017-18, 67%
2018-19, 72%
2019-20, 74%
2020-21, 71%
2021-22, 57%
2022-23, 64%, significantly lower than total, significantly higher than previous wave
Note: Statements asked differently with different scale in 2017-18, interpret with caution.
Q36b. Thinking about the service you received, how much do you agree or disagree with the following statements.
Base: All answering (n=varies)
Effectiveness Service Attributes (3/3)
Figure long description
Effectiveness of End-to-End Journey
You were able to move smoothly through all of the steps related to your application
5 – Strongly agree, 60%
Rated 4, 24%
Rated 3, 9%
Rated 2, 4%
1 – Strongly disagree, 3%
% Rated 4 or 5
2017-18, 82%
2018-19, 84%
2019-20, 82%
2020-21, 85%
2021-22, 82%
2022-23, 84%
You were provided service in a way that protected your health and safety during the COVID-19 pandemic
5 – Strongly agree, 68%
Rated 4, 14%
Rated 3, 5%
Rated 2, 1%
1 – Strongly disagree, 2%
Not applicable, 9%
Don’t know, 1%
% Rated 4 or 5
2020-21, 88%
2021-22, 87%
2022-23, 81%, significantly lower than previous wave
You received consistent information
5 – Strongly agree, 61%, significantly higher than previous wave
Rated 4, 20%
Rated 3, 10%
Rated 2, 4%
1 – Strongly disagree, 4%
Not applicable, 1%
Don’t know, 1%
% Rated 4 or 5
2018-19, 82%
2019-20, 80%
2020-21, 84%
2021-22, 79%
2022-23, 81%
It was clear what to do if you had a problem or question
5 – Strongly agree, 56%
Rated 4, 23%
Rated 3, 12%
Rated 2, 4%
1 – Strongly disagree, 4%
Not applicable, 1%
% Rated 4 or 5
2017-18, 78%
2018-19, 78%
2019-20, 77%
2020-21, 79%
2021-22, 76%
2022-23, 78%, significantly higher than previous wave
The amount of time it took, from when you started gathering information to when you got a decision on your application, was reasonable
5 – Strongly agree, 52%
Rated 4, 23%
Rated 3, 12%
Rated 2, 6%
1 – Strongly disagree, 6%
Not applicable, 1%
% Rated 4 or 5
2017-18, 77%
2018-19, 76%
2019-20, 78%
2020-21, 81%
2021-22, 75%
2022-23, 75%
It was easy to get help when you needed it
5 – Strongly agree, 54%, significantly higher than previous wave
Rated 4, 20%
Rated 3, 12%
Rated 2, 5%
1 – Strongly disagree, 4%, significantly lower than previous wave
Not applicable, 4%
Don’t know, 1%
% Rated 4 or 5
2017-18, 77%
2018-19, 77%
2019-20, 76%
2020-21, 71%
2021-22, 68%
2022-23, 74%, significantly higher than previous wave
Q36b. Thinking about the service you received, how much do you agree or disagree with the following statements.
Base: All answering (varies)
Emotion Service Attributes: Overall (1/3)
At well over nine in ten, nearly all clients agreed that they were provided service in their choice of English or French. Just over nine in ten agreed that the Service Canada representatives that they dealt with in-person were helpful, followed by that they felt respected throughout the process and that they were confident their personal information was protected. Closer to eight in ten agreed that the Service Canada specialized call centre and 1 800 O-Canada representatives were helpful. More than three-quarters of clients agreed that they travelled a reasonable distance to access service, followed by that the eServiceCanada representatives were helpful and that they were confident any issues or problems would have been easily resolved.
Compared to 2021-22, ratings have increased for the helpfulness of Service Canada in-person representatives and that they travelled a reasonable distance to access service.
Figure long description
Emotion, % Rated 4 or 5
You were provided with service in your choice of English or French
2022-23, 96%
2021-22, 97%
2020-21, 96%
2019-20, 97%
2018-19, 96%
2017-18, 94%
Service Canada reps that you dealt with in person were helpful
2022-23, 92%, significantly higher than previous wave
2021-22, 88%
2020-21, 91%
2019-20, 92%
You felt respected throughout the process apply for [insert program]
2022-23, 89%
You were confident that your personal information was protected
2022-23, 88%
2021-22, 86%
2020-21, 87%
2019-20, 87%
2018-19, 87%
2017-18, 87%
1 800 O-Canada phone reps were helpful
2022-23, 83%
2021-22, 78%
2020-21, 88%
Service Canada specialized call centre phone reps were helpful
2022-23, 83%
2021-22, 82%
2020-21, 85%
2019-20, 73%
You travelled a reasonable distance to access the service
2022-23, 78%, significantly higher than previous wave
2021-22, 73%
2020-21, 79%
2019-20, 75%
The eServiceCanada reps that called you back after you completed an online form were helpful
2022-23, 76%
2021-22, 78%
2020-21, 85%
You were confident that any issues or problems would have been easily resolved
2022-23, 75%
2021-22, 73%
2020-21, 77%
2019-20, 78%
2018-19, 78%
2017-18, 76%
Note: Statements asked differently with different scale in 2017-18, interpret with caution.
Q36b. Thinking about the service you received, how much do you agree or disagree with the following statements.
Base: All answering (n=varies)
Emotion Service Attributes: by Program (2/3)
SIN clients were more likely to provide high ratings across nearly all aspects of emotion, while CPP-D clients provided lower ratings. EI and CPP clients provided lower ratings for the helpfulness of in-person representatives, while EI clients also provided lower ratings for confidence any issues or problems would have been easily resolved and CPP clients for confidence their personal information was protected, travelling a reasonable distance to access service and the helpfulness of eServiceCanada representatives. OAS/GIS clients provided lower ratings for feeling respected throughout the process and confidence their personal information was protected.
Compared to 2021-22, SIN clients provided higher ratings for the helpfulness of in-person representatives and for travelling a reasonable distance to access service. CPP clients provided lower ratings for the helpfulness of eServiceCanada representatives.
Figure long description
Emotion, % Rated 4 or 5
You were provided with service in your choice of English or French
TOTAL
2017-18, 94%
2018-19, 96%
2019-20, 97%
2020-21, 96%
2021-22, 97%
2022-23, 96%
EI
2017-18, 93%
2018-19, 97%
2019-20, 98%
2020-21, 97%
2021-22, 97%
2022-23, 97%
CPP
2017-18, 94%
2018-19, 94%
2019-20, 97%
2020-21, 95%
2021-22, 94%
2022-23, 95%
CPP-D
2017-18, 87%
2018-19, 93%
2019-20, 95%
2020-21, 92%
2021-22, 94%
2022-23, 94%, significantly lower than total
SIN
2017-18, 96%
2018-19, 95%
2019-20, 95%
2020-21, 96%
2021-22, 98%
2022-23, 96%
OAS/GIS
2017-18, 95%
2018-19, 98%
2019-20, 96%
2020-21, 94%
2021-22, 95%
2022-23, 95%
Service Canada reps that you dealt with in person were helpful
TOTAL
2019-20, 92%
2020-21, 91%
2021-22, 88%
2022-23, 92%
EI
2019-20, 89%
2020-21, 85%
2021-22, 83%
2022-23, 85%, significantly lower than total
CPP
2019-20, 93%
2020-21, 86%
2021-22, 87%
2022-23, 86%, significantly lower than total
CPP-D
2019-20, 85%
2020-21, 76%
2021-22, 79%
2022-23, 82%, significantly lower than total
SIN
2019-20, 96%
2020-21, 95%
2021-22, 92%
2022-23, 96%,- significantly higher than total, significantly higher than previous wave
OAS/GIS
2019-20, 92%
2020-21, 72%
2021-22, 82%
2022-23, 91%
You felt respected throughout the process applying for [INSERT PROGRAM]
TOTAL
2022-23, 89%
EI
2022-23, 88%
CPP
2022-23, 87%
CPP-D
2022-23, 75%, significantly lower than total
SIN
2022-23, 95%, significantly higher than total
OAS/GIS
2022-23, 85%, significantly lower than total
You were confident that your personal information was protected
TOTAL
2017-18, 87%
2018-19, 87%
2019-20, 87%
2020-21, 87%
2021-22, 86%
2022-23, 88%
EI
2017-18, 87%
2018-19, 88%
2019-20, 88%
2020-21, 86%
2021-22, 87%
2022-23, 89%
CPP
2017-18, 86%
2018-19, 79%
2019-20, 82%
2020-21, 82%
2021-22, 81%
2022-23, 82%, significantly lower than total
CPP-D
2017-18, 78%
2018-19, 82%
2019-20, 80%
2020-21, 78%
2021-22, 79%
2022-23, 78%, significantly lower than total
SIN
2017-18, 90%
2018-19, 92%
2019-20, 90%
2020-21, 92%
2021-22, 92%
2022-23, 93%, significantly higher than total
OAS/GIS
2017-18, 82%
2018-19, 83%
2019-20, 79%
2020-21, 85%
2021-22, 78%
2022-23, 79%, significantly lower than total
Service Canada specialized call centre phone reps were helpful
TOTAL
2019-20, 73%
2020-21, 85%
2021-22, 82%
2022-23, 83%
EI
2019-20, 73%
2020-21, 83%
2021-22, 80%
2022-23, 81%
CPP
2019-20, 72%
2020-21, 85%
2021-22, 83%
2022-23, 83%
CPP-D
2019-20, 68%
2020-21, 68%
2021-22, 74%
2022-23, 73%, significantly lower than total
SIN
2019-20, 74%
2020-21, 92%
2021-22, 89%
2022-23, 95%, significantly higher than total
OAS/GIS
2019-20, 83%
2020-21, 90%
2021-22, 90%
2022-23, 86%
1 800 O-Canada phone reps were helpful
TOTAL
2020-21, 88%
2021-22, 78%
2022-23, 83%
EI
2020-21, 88%
2021-22, 79%
2022-23, 82%
CPP
2020-21, 86%
2021-22, 82%
2022-23, 82%
CPP-D
2020-21, 67%
2021-22, 81%
2022-23, 77%
SIN
2020-21, 90%
2021-22, 75%
2022-23, 86%
OAS/GIS
2020-21, 89%
2021-22, 82%
2022-23, 84%
You travelled a reasonable distance to access the service
TOTAL
2019-20, 75%
2020-21, 79%
2021-22, 73%
2022-23, 78%, significantly higher than previous wave/li>
EI
2019-20, 71%
2020-21, 71%
2021-22, 72%
2022-23, 78%
CPP
2019-20, 77%
2020-21, 75%
2021-22, 78%
2022-23, 72%, significantly lower than total
CPP-D
2019-20, 59%
2020-21, 59%
2021-22, 66%
2022-23, 64%, significantly lower than total
SIN
2019-20, 79%
2020-21, 83%
2021-22, 73%
2022-23, 79%, significantly higher than previous wave
OAS/GIS
2019-20, 83%
2020-21, 74%
2021-22, 72%
2022-23, 72%
The eServiceCanada phone reps that called you back after you completed an online form were helpful
TOTAL
2020-21, 85%
2021-22, 78%
2022-23, 76%
EI
2020-21, 84%
2021-22, 78%
2022-23, 73%
CPP
2020-21, 83%
2021-22, 84%
2022-23, 63%, significantly lower than total, significantly lower than previous wave
CPP-D
2020-21, 76%
2021-22, 68%
2022-23, 72%
SIN
2020-21, 89%
2021-22, 78%
2022-23, 90%, significantly higher than total
OAS/GIS
2020-21, 85%
2021-22, 70%
2022-23, 75%
You were confident that any issues or problems would have been easily resolved
TOTAL
2017-18, 76%
2018-19, 78%
2019-20, 78%
2020-21, 77%
2021-22, 73%
2022-23, 75%
EI
2017-18, 79%
2018-19, 74%
2019-20, 72%
2020-21, 73%
2021-22, 69%
2022-23, 70%, significantly lower than total
CPP
2017-18, 81%
2018-19, 76%
2019-20, 81%
2020-21, 76%
2021-22, 73%
2022-23, 75%
CPP-D
2017-18, 63%
2018-19, 57%
2019-20, 51%
2020-21, 56%
2021-22, 57%
2022-23, 52%, significantly lower than total
SIN
2017-18, 88%
2018-19, 86%
2019-20, 87%
2020-21, 84%
2021-22, 85%
2022-23, 86%, significantly higher than total
OAS/GIS
2017-18, 80%
2018-19, 78%
2019-20, 77%
2020-21, 82%
2021-22, 68%
2022-23, 73%
Note: Statements asked differently with different scale in 2017-18, interpret with caution.
Q36b. Thinking about the service you received, how much do you agree or disagree with the following statements.
Base: All answering (n=varies)
Emotion During End-to-End Client Journey (3/3)
Figure long description
Emotion during end-to-end journey
You were provided with service in your choice of English or French
5 – Strongly agree, 88%
Rated 4, 8%
Rated 3, 2%
Not applicable, 1%
% Rated 4 or 5
2017-18, 94%
2019-20, 97%
2020-21, 96%
2021-22, 97%
2022-23, 96%
Service Canada reps that you dealt with in person were helpful
5 – Strongly agree, 79%, singificantly higher than previous wave
Rated 4, 12%
Rated 3, 4%
Rated 2, 1%
1 – strongly agree, 1%
Not applicable, 1%
Don’t know, 1%
% Rated 4 or 5
2019-20, 92%
2020-21, 91%
2021-22, 88%
2022-23, 92%, significantly higher than previous wave
You felt respected throughout the process applying
5 – Strongly agree, 74%
Rated 4, 16%
Rated 3, 6%
Rated 2, 2%
1 – strongly agree, 2%
Not applicable, 1%
% Rated 4 or 5
2022-23, 89%
You were confident that your personal information was protected
5 – Strongly agree, 70%
Rated 4, 18%
Rated 3, 7%
Rated 2, 2%
1 – strongly agree, 2%
Don’t know, 1%
% Rated 4 or 5
2017-18, 87%
2018-19, 87%
2019-20, 87%
2020-21, 87%
2021-22, 86%
2022-23, 88%
Service Canada specialized call centre phone reps were helpful
5 – Strongly agree, 63%
Rated 4, 20%
Rated 3, 10%
Rated 2, 4%
1 – strongly agree, 3%
Not applicable, 1%
% Rated 4 or 5
2019-20, 73%
2020-21, 85%
2021-22, 82%
2022-23, 83%
1 800 O-Canada phone representatives were helpful
5 – Strongly agree, 62%
Rated 4, 21%
Rated 3, 12%
Rated 2, 2%
1 – strongly agree, 2%
Not applicable, 1%
Don’t know, 1%
% Rated 4 or 5
2020-21, 88%
2021-22, 78%
2022-23, 83%
You travelled a reasonable distance to access the service
5 – Strongly agree, 58%
Rated 4, 20%
Rated 3, 12%, singificantly lower than previous wave
Rated 2, 3%
1 – strongly agree, 6%
Not applicable, 2%
Don’t know, 1%
% Rated 4 or 5
2022-23, 78%, significantly higher than previous wave
The eServiceCanada reps that called you back after you completed an online form were helpful
5 – Strongly agree, 54%
Rated 4, 21%
Rated 3, 9%
Rated 2, 3%
1 – strongly agree, 7%
Not applicable, 4%
Don’t know, 2%
% Rated 4 or 5
2020-21, 85%
2021-22, 78%
2022-23, 76%
You were confident that any issues or problems would have been easily resolved
5 – Strongly agree, 51%
Rated 4, 24%
Rated 3, 14%
Rated 2, 5%
1 – strongly agree, 5%
Not applicable, 1%
% Rated 4 or 5
2017-18, 76%
2018-19, 78%
2019-20, 78%
2020-21, 77%
2021-22, 73%
2022-23, 75%
Note The questionnaire was improved to pose ‘You were confident that any issues or problems would have been easily resolved’ to all survey respondents in 2018-19 and 2019-20, whereas in 2017-18 it was posed only to clients who did not experience a problem, therefore comparable data are not available.
Q36b. Thinking about the service you received, how much do you agree or disagree with the following statements.
Base: All answering (varies)
Ease of Follow-Up with Service Canada
Six in ten clients found it easy to follow-up with Service Canada about their application (before receiving a decision). CPP-D clients were less likely to have felt it was easy to follow-up compared to all clients, while SIN and CPP clients were more likely.
Compared to 2021-22, ratings have increased overall and among CPP clients.
Figure long description
Ease Of Follow-up With Service Canada Regarding Your Application (% Rated 4 Or 5) – Trending
TOTAL
2017-18, n=1296, 66%
2019-20, n=842, 61%
2020-21, n=1209, 63%
2021-22, n=1293, 55%
2022-23, n=1463, 60, significantly higher than previous wave%
EI
2017-18, n=1296, 68%
2019-20, n=842, 57%
2020-21, n=1209, 59%
2021-22, n=1293, 53%
2022-23, n=1463, 57%
CPP
2017-18, n=1296, 66%
2019-20, n=842, 68%
2020-21, n=1209, 68%
2021-22, n=1293, 64%
2022-23, n=1463, 73%, significantly higher than total, significantly higher than previous wave
CPP-D
2017-18, n=1296, 50%
2019-20, n=842, 48%
2020-21, n=1209, 52%
2021-22, n=1293, 48%
2022-23, n=1463, 52%, significantly lower than total
SIN
2017-18, n=1296, 62%
2019-20, n=842, 73%
2020-21, n=1209, 72%
2021-22, n=1293, 64%
2022-23, n=1463, 76%, significantly higher than total
OAS/GIS
2017-18, n=1296, 66%
2019-20, n=842, 77%
2020-21, n=1209, 70%
2021-22, n=1293, 59%
2022-23, n=1463, 60%
Q20a. Using a 5-point scale where 1 is very difficult and 5 is very easy, how difficult or easy was it to follow up with Service Canada about your application?
Base: Clients who followed-up before receiving a decision (n=1463)
Figure long description
Ease of follow up with Service Canada about your application
5- strongly agree, 35%
Rated 4, 25%
Rated 3, 19%
Rated 2, 10%
1 – strongly disagree, 10%
% Rated 4 or 5
2017-18, 66%
2019-20, 61%
2020-21, 63%
2021-22, 55%
2022-23, 60%, significantly higher than previous wave
Q20a. Using a 5-point scale where 1 was very difficult and 5 was very easy, how easy or difficult was it to follow up with Service Canada about your application?
Base: Clients who followed up (n=1463)
Changes That Would Have Improved Follow-up Experience: Overall
Among the 41% of clients who followed-up with Service Canada before receiving a decision, quicker assistance by phone would have improved the experience the most, followed by clearer information on the status of their application and real-time support through an online chat with a Service Canada representative.
CPP clients were more likely to say that none of the changes would have improved their experience.
Compared to 2021-22, SIN clients were more likely to feel that quicker assistance by phone would have improved the experience the most. CPP-D clients were more likely to feel that real-time support through an online chat with a Service Canada representative would have improved the experience the most.
Figure long description
Changes That Would Have Improved Follow-up Experience: Overall
Quicker to get assistance by phone
TOTAL
2021-22, 53%
2022-23, 53%
EI
2021-22, 56%
2022-23, 54%
CPP
2021-22, 48%
2022-23, 46%
CPP-D
2021-22, 60%
SIN
2021-22, 35%
2022-23, 53%, significantly higher than previous wave
OAS/GIS
2021-22, 48%
2022-23, 52%
Clearer information on the status of your application
TOTAL
2021-22, 23%
2022-23, 25%
EI
2021-22, 23%
2022-23, 26%
CPP
2021-22, 19%
2022-23, 22%
CPP-D
2021-22, 26%
2022-23, 26
SIN
2021-22, 36%
2022-23, 22%
OAS/GIS
2021-22, 19%
2022-23, 24%
Real-time support through online chat with a Service Canada representative
TOTAL
2021-22, 15%
2022-23, 12%
EI
2021-22, 14%
2022-23, 12%
CPP
2021-22, 18%
2022-23, 14%
CPP-D
2021-22, 4%
2022-23, 10, significnatly higher than previous wave
SIN
2021-22, 23%
2022-23, 16%
OAS/GIS
2021-22, 17%
2022-23, 11%
None of the above
TOTAL
2021-22, 8%
2022-23, 8%
EI
2021-22, 7%
2022-23, 6%
CPP
2021-22, 12%
2022-23, 16%, significantly higher than total
CPP-D
2021-22, 8%
2022-23, 10%
SIN
2021-22, 4%
2022-23, 9%
OAS/GIS
2021-22, 15%
2022-23, 9%
Q20c. Before you were notified of a decision on your [INSERT ABBREV] application, which of the following changes would have improved your experience in following up the most?
Base: Clients who followed-up before receiving a decision (n=1463)
Satisfaction Drivers Analysis
Drivers of Satisfaction – Background on Analysis
The Key Drivers Analysis was conducted by regression among all clients and by each of the five programs. Nearly all key service attributes were included in the overall or program level analysis in addition to benefit approval/denial, except for those statements with an insignificant relationship to overall satisfaction or strong inter-collinearity with another variable (in the latter instance, the variable more strongly related to overall satisfaction, or the variable asked among a larger sample size was kept).
Compared to 2021-22, the strength of the drivers’ analysis has remained consistent (R2 of 0.69 compared to 0.70).
Figure long description
Drivers of Satisfaction – Background on Analysis
AWARE
Understand the information about [PROGRAM]
Find out what information you need to provide when applying for [PROGRAM]
Figure out if you were eligible for benefits/ SIN card
Find information about [PROGRAM]
Find out the steps to apply
Find the information you needed within a reasonable amount of time
APPLY
You were able to complete the application in a reasonable amount of time
Understanding the requirements of the application
Completing the form
Putting together the information you needed to apply for [PROGRAM]
Ease of registering for/ signing into your My Service Canada Account
FOLLOW-UP
Ease of follow-up
OTHER VARIABLES
Received/ Denied Benefit
EASE
It was easy to access service in a language I could speak and understand well
Overall, it was easy for you to apply for [PROGRAM]?
You needed to explain your situation only once
Throughout the process it was clear what would happen next and when it would happen
EFFECTIVENESS
The amount of time it took was reasonable
It was easy to get help when you needed it
You received consistent information
It was clear what to do if you had a problem or question
You were able to move smoothly through all of the steps related to your [PROGRAM] application
You were provided service in a way that protected your health and safety during the COVID-19 pandemic
EMOTION
Service Canada specialized call centre phone representatives were helpful
Service Canada representatives that you dealt with in person were helpful
1 800 O-Canada phone representatives were helpful
The Service Canada phone representatives that called you back after you completed an online form were helpful
You were confident that any issues or problems would have been easily resolved
You were confident that your personal information was protected
You travelled a reasonable distance to access the service
You were provided with service in your choice of English or French
*not included due to strong inter-collinearity with Service Canada specialized call centre phone representatives were helpful
Summary: Drivers of Satisfaction – Overall
The primary driver of satisfaction was the timeliness of service. It remains the top driver of satisfaction throughout client experience. The helpfulness of in-person representatives also remained among the most prominent drivers, while receiving consistent information, understanding the requirements of the application and getting help on your application when needed have taken on increased importance in driving satisfaction.
The primary driver of satisfaction in the service experience was the amount of time it took from start to finish was reasonable. Prominent secondary drivers included the helpfulness of Service Canada in-person representatives, receiving consistent information, confidence in issue resolution, understanding the requirements of the application and getting help on the application when needed.
Compared to 2021-22, the top most important driver remained consistent, while receiving consistent information, understanding the requirements of the application, getting help on your application when needed and ease of completing the application form have taken on increased importance in driving satisfaction.
Improving the timeliness of service continued to be the greatest opportunity for improvement for Service Canada clientele as a whole.
In order to summarize what potential changes could result in an increase in overall satisfaction, the service attributes that most strongly drove satisfaction for Service Canada clients were determined and compared to Service Canada’s performance against these attributes.
The resulting analysis found that most common area for potential improvement was improving the timeliness of service. Areas of secondary importance for improvement include the ease of getting help on your application and to a lesser extent confidence in the issue resolution process.
The helpfulness of Service Canada in-person representatives and receiving consistent information are prominent strengths and areas that should be protected.
Summary: Drivers of Satisfaction – EI Program
EI Clients
Timeliness of service continued to be by far the top driver of satisfaction in the service experience. Prominent secondary drivers included the ease of getting help on your application when needed, receiving consistent information, ease of completing the form and that it was clear what would happen next and when.
The greatest opportunity to improve the service experience for EI clients is in improving the timeliness of service. Areas of secondary importance for improvement include the ease of getting help on the application and receiving consistent information, followed by the clarity of the process.
The helpfulness of Service Canada in-person and call centre representatives, ease of completing the application form and being provided service in a way that protected them during the pandemic are relative strengths this year and areas that should be protected.
The top most important driver of satisfaction remained consistent compared to 2021-22, while the ease of getting help on your application, ease of completing the application form, that it was clear what would happen next and when and confidence in the issue resolution process have taken on increased importance.
Summary: Drivers of Satisfaction – CPP Program
CPP Clients
The top driver of satisfaction in the service experience was the ease of following-up on your application. Prominent secondary drivers of satisfaction included timeliness of service, ease of finding what information you need to provide when applying, ease of finding information on the program, moving smoothly through all steps and the helpfulness of Service Canada call centre phone representatives.
The greatest opportunities to improve the service experience for CPP clients are improving the ease of follow-up. Areas of secondary importance include the ease of finding information on the program, ease of finding what information you need to provide when applying and timeliness of service.
The helpfulness of Service Canada call centre representatives, ease of understanding requirements of the application, moving smoothly through all steps and confidence that personal information was protected were prominent strengths and areas that should be protected.
The top drivers of satisfaction for CPP clients have changed compared to 2021-22. The ease of follow-up has increased in importance and become the top driver of satisfaction, while the timeliness of service, ease of finding what information you need to provide when applying, ease of finding information on the program and moving smoothly through all steps have also taken on increased importance.
Summary: Drivers of Satisfaction – CPP-D Program
CPP-D Clients
The top driver of satisfaction in the service experience was by far the timeliness of service. Prominent secondary drivers of satisfaction included whether the application was approved or denied, moving smoothly through all steps, the helpfulness of Service Canada call centre phone representatives and confidence in the issue resolution process.
The greatest opportunity to improve the service experience for CPP-D clients is improving the timeliness of service.
Areas of secondary importance for improvement include moving smoothly through all steps, the ease of gathering the information needed to apply, ease of getting help on their application and ease of follow-up.
Timeliness of service has taken on increased importance and become the top driver of satisfaction. Moving smoothly through all steps, confidence in issue resolution, and the ease of putting together the information needed to apply have also taken on increased importance in driving satisfaction.
Summary: Drivers of Satisfaction – SIN Program
SIN Clients
Top drivers of satisfaction in the service experience were the helpfulness of Service Canada in-person representatives and timeliness of service. Prominent secondary drivers of satisfaction included understanding the requirements of the application, being able to complete the application in a reasonable amount of time and confidence in issue resolution.
The greatest opportunities to improve the service experience for SIN clients are improving the ease of getting help on their application and ease of figuring out eligibility.
The helpfulness of Service Canada in-person representatives and timeliness of service in particular represent prominent strengths this year and areas that should be protected. Understanding the requirements of the application, overall ease of applying, ease of getting help when needed, being able to complete the application in a reasonable time and confidence in issue resolution are also areas of relatively stronger performance and should also be protected.
The helpfulness of Service Canada in-person representatives has increased in importance and become the top driver of satisfaction. The ease of understanding the requirements of the application has also taken on increased importance in driving satisfaction.
Summary: Drivers of Satisfaction – OAS/GIS Program
OAS/GIS Clients
The top driver of satisfaction in the service experience was the ease of following-up on your application. Prominent secondary drivers of satisfaction included the ease of finding out the steps to apply, information on the program and what information was needed to apply and travelling a reasonable distance to access service.
The greatest opportunity to improve the service experience for OAS/GIS clients is improving the ease of follow-up.
Secondary areas for improvement include the ease of finding the steps to apply, what information is needed when applying and information on the program, travelling a reasonable distance to access service and ease of getting help on their application.
Being provided service in their choice of English or French, accessing service in a language clients understand, moving smoothly through all steps, ease of completing the application form and timeliness of service are prominent strengths this year and areas that should be protected.
The ease of follow-up has taken on increased importance and become the top driver. The ease of finding information on the program, travelling a reasonable distance to access service and being able to find the information needed within a reasonable amount of time have also taken on increased importance in driving satisfaction.
Drivers of Satisfaction: Overall
The primary driver of satisfaction in the service experience was whether the amount of time it took from start to finish was reasonable. Secondary drivers included the helpfulness of Service Canada of in-person representatives, receiving consistent information, confidence in issue resolution, understanding the requirements of the application and getting help on the application when needed.
Compared to 2021-22, the top-most important drivers remained consistent, while receiving consistent information, understanding the requirements of the application, getting help on your application when needed, and ease of completing the application form have taken on increased importance in driving satisfaction.
The strength of the drivers’ analysis has remained consistent compared to 2021-22 (R2 of 0.69 compared to 0.70 in 2021-22).
Figure long description
Drivers of satisfaction: Overall
The amount of time it took was reasonable 0.340
Service Canada representatives that you dealt with in person were helpful 0.107
You received consistent information 0.101
You were confident that any issues or problems would have been easily resolved 0.088
Understanding the requirements of the application 0.088
Getting help on your application when you needed it 0.082
Service Canada specialized call centre phone representatives were helpful 0.072
Completing the application form 0.063 You needed to explain your situation only once 0.057
Throughout the process it was clear what would happen next and when it would happen 0.056
GRANTED/ DENIED 0.055
You were able to move smoothly through all of the steps 0.050
Easy/difficult to register for your My Service Canada Account 0.046
Find out the steps to apply 0.040 Understand the information about [PROGRAM] 0.039
You were able to complete the application in a reasonable amount of time 0.036
Figure out if you are eligible for benefits/ SIN card 0.035
You were provided service in a way that protected your health and safety during the COVID-19 pandemic 0.035
Find out what information you need to provide when applying for [PROGRAM] 0.035
Overall, it was easy for you to apply for [PROGRAM] 0.026
Find information about [PROGRAM] 0.024
You travelled a reasonable distance to access the service 0.022
It was easy to get help when you needed it 0.022
It was easy to access service in a language you could speak and understand well 0.019
You were able to find the information you needed within a reasonable amount of time 0.015
Easy/difficult to follow up with Service Canada about your application 0.014
It was clear what to do if you had a problem or question 0.012
Putting together the information you needed to apply for [PROGRAM] 0.012
You were provided with service in your choice of English or French 0.006
You were confident that your personal information was protected 0.003
Priority Matrix: Overview
READER’S NOTE: This slide was intended to assist the reader in interpreting data shown in a priority matrix. A priority matrix has been used to identify priority improvement areas with respect to service interactions with clients.
A priority matrix allows for decision makers to identify priorities for improvement by comparing how well clients feel you have performed in an area with how much impact that area has on clients’ overall satisfaction. It helps to answer the question, ‘what can we do to improve satisfaction?’. Each driver or component will fall into one of the quadrants explained below, depending on its impact on overall satisfaction and its performance score (provided by survey respondents).
The annual CX survey uses 80% satisfaction as a cut-off point for attributes falling under maintain or protect.
Figure long description
Priority Matrix: Overview
IMPROVE / FOCUS, 1st quadrant
Driver/component has more impact on satisfaction, and its performance score was lower relative to other drivers/ components. Focus on improving your performance in this area.
PROTECT / REINFORCE, 2nd quadrant
Driver/component has more impact on satisfaction, and its performance score was higher relative to other drivers/ components. This was a strength which needs to be protected.
IMPROVE SECONDARY/ BE AWARE, 3rd quadrant
Driver/component was not as impactful and it has a lower performance score relative to other drivers/ components
MAINTAIN, 4th quadrant
Driver/component was not as impactful as other drivers/ components and performance scores were high.
Overall Priority Matrix: Impact vs. Performance
The greatest opportunity to improve the service experience for Service Canada clientele as a whole is improving the timeliness of service. Areas of secondary importance for improvement include the ease of registering for MSCA and ease of getting help on your application and to a lesser extent confidence in the issue resolution process.
The helpfulness of Service Canada in-person representatives and receiving consistent information are prominent strengths and areas that should be protected.
Note: aspects of service that had an impact of 0.03 or lower were not included in the analysis below given their limited impact on satisfaction.
Figure long description
Overall Priority Matrix: Impact vs. Performance
Improve
Client journey took reasonable time
Protect
Consistent info
Service Canada in-person representatives were helpful
Secondary Improve
Ease of MSCA registration
Ease of getting help on application
Confident in issue resolution
Explain once
Clarity of process
Ease of understanding info
Ease of figuring out eligibility
Ease of finding info you need to provide
Ease of finding steps to apply
Maintain
Understanding requirements
Service Canada call centre representatives were helpful
Ease of completing application form
Moved smoothly through steps
Completed application in reasonable time
Protected during COVID
Drivers of Satisfaction: EI Clients
The primary driver of satisfaction in the service experience for EI clients was whether the amount of time it took from start to finish was reasonable. Secondary drivers of satisfaction included the ease of getting help on your application when needed, receiving consistent information, ease of completing the form and that it was clear what would happen next and when.
Compared to 2021-22, the top most important driver remained consistent, while the ease of getting help on your application, ease of completing the application form, that it was clear what would happen next and when and confidence in the issue resolution process have taken on increased importance.
The strength of the drivers’ analysis has remained consistent compared to 2021-22 (R2 of 0.68 compared to 0.73).
Figure long description
Drivers of Satisfaction: EI Clients
The amount of time it took was reasonable 0.353
Getting help on your application when you needed it 0.135
You received consistent information 0.099
Completing the application form 0.089
Throughout the process it was clear what would happen next and when it would happen 0.089
You were confident that any issues or problems would have been easily resolved 0.081
You needed to explain your situation only once 0.079
Figure out if you are eligible for benefits 0.079
Understanding the requirements of the application 0.067
Service Canada representatives that you dealt with in person were helpful 0.067
You were provided service in a way that protected your health and safety during the COVID-19 pandemic 0.064
GRANTED/ DENIED 0.059
Service Canada specialized call centre phone representatives were helpful 0.055
Find out the steps to apply 0.052
Find information about [PROGRAM] 0.037
You were able to move smoothly through all of the steps 0.037
You were able to find the information you needed within a reasonable amount of time 0.031
Understand the information about [PROGRAM] 0.029
Overall, it was easy for you to apply for [PROGRAM] 0.026
You were able to complete the application in a reasonable amount of time 0.025
It was easy to access service in a language you could speak and understand well 0.021
You were provided with service in your choice of English or French 0.020
Find out what information you need to provide when applying for [PROGRAM] 0.016
You travelled a reasonable distance to access the service 0.014
Putting together the information you needed to apply for [PROGRAM] 0.010
It was clear what to do if you had a problem or question 0.009
You were confident that your personal information was protected 0.009
Easy/difficult to register for your My Service Canada Account 0.005
Easy/difficult to follow up with Service Canada about your application 0.004
It was easy to get help when you needed it 0.003
Overall Priority Matrix: Impact vs. Performance – EI Clients
The greatest opportunity to improve the service experience for EI clients is in improving the timeliness of service. Areas of secondary importance for improvement include the ease of getting help on the application and receiving consistent information, followed by the clarity of process.
The helpfulness of Service Canada in-person and call centre representatives and ease of completing the application form are relative strengths this year and areas that should be protected.
Note: aspects of service that had an impact of 0.03 or lower were not included in the analysis below given their limited impact on satisfaction.
Figure long description
Overall Priority Matrix: Impact vs. Performance – EI Clients
Improve
Client journey took reasonable time
Ese of getting help on your application
Consistent info
Secondary Improve
Clarity of process
Ease of figuring out eligibility
Explain one
Understating requirement
Confident in issue resolution
Ease of finding steps to apply
Ease of finding info on program
Find info in reasonable time
Moved through steps
Maintain
Ease of completing application form
Protected you during COVID
Service Canada in-person representatives were helpful
Service Canada call centre representatives were helpful
Drivers of Satisfaction: CPP Clients
The primary driver of satisfaction in the service experience for CPP clients was the ease of following-up on your application. Secondary drivers included the amount of time it took from start to finish was reasonable, ease of finding what information you need to provide when applying, ease of finding information on the program, moving smoothly through all steps and the helpfulness of Service Canada call centre phone representatives.
Compared to 2021-22, the top drivers of satisfaction for CPP clients have changed. The ease of follow-up has increased in importance and has become the top driver of satisfaction, while the timeliness of service, ease of finding what information you need to provide when applying, ease of finding information on the program and moving smoothly through all steps have also taken on increased importance.
The strength of the drivers’ analysis has decreased compared to 2021-22 but remains strong (R2 of 0.78 compared to 0.93).
Figure long description
Drivers of Satisfaction: CPP Clients
How easy or difficult was it to follow up with Service Canada about your application? 0.435
The amount of time it took was reasonable 0.204
Find out what information you need to provide when applying for [PROGRAM] 0.195
Find information about [PROGRAM] 0.194 You were able to move smoothly through all of the steps 0.165
Service Canada specialized call centre phone representatives were helpful 0.161
You were confident that your personal information was protected 0.120
Understanding the requirements of the application 0.109
Understand the information about [PROGRAM] 0.103
Getting help on your application when you needed it 0.089
Figure out if you are eligible for benefits 0.084
Service Canada representatives that you dealt with in person were helpful 0.079
Throughout the process it was clear what would happen next and when it would happen 0.078
You received consistent information 0.075
You were able to complete the application in a reasonable amount of time 0.074
You were provided service in a way that protected your health and safety during the COVID-19 pandemic 0.050
It was clear what to do if you had a problem or question 0.049
You were able to find the information you needed within a reasonable amount of time 0.042
Decide the best age to start your pension 0.038 It was easy to get help when you needed it 0.031
It was easy to access service in a language you could speak and understand well 0.030
You were provided with service in your choice of English or French 0.028
You travelled a reasonable distance to access the service 0.026
You were confident that any issues or problems would have been easily resolved 0.026
Overall, it was easy for you to apply for [PROGRAM] 0.025
You needed to explain your situation only once 0.011
Completing the application form 0.011
GRANTED/ DENIED 0.006
Putting together the information you needed to apply for [PROGRAM] 0.002
Find out the steps to apply 0.001
Overall Priority Matrix: Impact vs. Performance – CPP Clients
The greatest opportunity to improve the service experience for CPP clients is improving the ease of follow-up. Areas of secondary importance include the ease of finding information on the program, ease of finding what information you need to provide when applying and timeliness of service.
The helpfulness of Service Canada call centre representatives, ease of understanding requirements of the application, moving smoothly through all steps and confidence that personal information was protected were prominent strengths and areas that should be protected.
Note: aspects of service that had an impact of 0.03 or lower were not included in the analysis below given their limited impact on satisfaction.
Figure long description
Overall Priority Matrix: Impact vs. Performance – CPP Clients
Improve
Ease of follow-up
Ease of finding info on program
Ease of finding info you need to provide
Client journey took reasonable time
Ease of understanding info
Protect
Moved smoothly through steps
Service Canada call centre representatives were helpful
Confident personal info protected
Understanding requirements
Secondary Improve
Ease of getting help in application
Ease of deciding age to start pension
Ease of getting help
Clarity of process
Find info in reasonable time
Clarity of issue resolution
Protected you during COVID
Ease of figuring out eligibility
Maintain
Consistent info
Complete application in reasonable time
Service Canada in-person representatives were helpful
Access service in a language I understand
Drivers of Satisfaction: CPP-D Clients
The primary driver of satisfaction in the service experience for CPP-D clients was the amount of time it took from start to finish was reasonable. Secondary drivers of satisfaction included whether the application was approved or denied, the helpfulness of Service Canada call centre phone representatives, moving smoothly through all steps and confidence in the issue resolution process.
Compared to 2021-22, timeliness of service has taken on increased importance and become the top driver of satisfaction. Moving smoothly through all steps, confidence in issue resolution and the ease of putting together the information needed to apply have also taken on increased importance in driving satisfaction.
The strength of the drivers’ analysis has decreased compared to 2021-22 but remains strong (R2 of 0.70 compared to 0.79).
Figure long description
Drivers of Satisfaction: CPP-D Clients
The amount of time it took was reasonable 0.323
GRANTED/ DENIED 0.192
Service Canada specialized call centre phone representatives were helpful 0.169
You were able to move smoothly through all of the steps 0.168
You were confident that any issues or problems would have been easily resolved 0.135
Putting together the information you needed to apply for [PROGRAM] 0.121
Easy/difficult to follow up with Service Canada about your application 0.116
Getting help on your application when you needed it 0.108
You were able to find the information you needed within a reasonable amount of time 0.092
Understand the information about [PROGRAM] 0.091
You were able to complete the application in a reasonable amount of time 0.090
Find out what information you need to provide when applying for [PROGRAM] 0.087
Find information about [PROGRAM] 0.076
It was clear what to do if you had a problem or question 0.069
It was easy to get help when you needed it 0.063
Figure out if you are eligible for benefits 0.058
Overall, it was easy for you to apply for [PROGRAM] 0.050
Find out the steps to apply 0.046
You received consistent information 0.038
Throughout the process it was clear what would happen next and when it would happen 0.030
Understanding the requirements of the application 0.030
You needed to explain your situation only once 0.028
It was easy to access service in a language you could speak and understand well 0.024
Completing the application form 0.022
You were provided service in a way that protected your health and safety during the COVID-19 pandemic 0.015
You were provided with service in your choice of English or French 0.014
You were confident that your personal information was protected 0.014
Overall Priority Matrix: Impact vs. Performance – CPP-D Clients
The greatest opportunity to improve the service experience for CPP-D clients is improving the timeliness of service.
Areas of secondary importance for improvement include moving smoothly through all steps, the ease of gathering the information needed to apply, ease of getting help on their application and ease of follow-up.
Note: aspects of service that had an impact of 0.03 or lower were not included in the analysis below given their limited impact on satisfaction.
Figure long description
Overall Priority Matrix: Impact vs. Performance – CPP-D Clients
Improve
Client journey took reasonable time
Ease of gathering info needed to apply
Ease of getting help on application
Ease of follow-up
Confident in issue resolution
Moved smoothly through steps
Service Canada call centre representatives were helpful
Secondary Improve
Ease of figuring out eligibility
Complete application in reasonable time
Clarity of process
Ease of getting help
Ease of applying
Ease of understanding info on program
Ease of finding info on program
Understanding requirements
Find info in reasonable time
Ease of finding info you need to apply
Clarity of issue resolution
Find out steps to apply
Consistent info
Drivers of Satisfaction: SIN Clients
The primary drivers of satisfaction in the service experience for SIN clients were the helpfulness of Service Canada in-person representatives and the amount of time it took from start to finish was reasonable. Secondary drivers of satisfaction included understanding the requirements of the application, being able to complete the application in a reasonable amount of time and confidence in issue resolution.
Compared to 2021-22, the helpfulness of Service Canada in-person representatives has increased in importance and become the top driver of satisfaction. The ease of understanding the requirements of the application has also taken on increased importance in driving satisfaction.
The strength of the drivers’ analysis has remained consistent compared to 2021-22 (R2 of 0.64 compared to 0.61).
Figure long description
Drivers of Satisfaction: SIN Clients
Service Canada representatives that you dealt with in person were helpful 0.203
The amount of time it took was reasonable 0.194
Understanding the requirements of the application 0.146
You were able to complete the application in a reasonable amount of time 0.135
You were confident that any issues or problems would have been easily resolved 0.128
Overall, it was easy for you to apply for [PROGRAM] 0.121
It was easy to get help when you needed it 0.103
You received consistent information 0.094
You were able to move smoothly through all of the steps 0.092
Getting help on your application when you needed it 0.080
You were provided with service in your choice of English or French 0.065
You were confident that your personal information was protected 0.033
Figure out if you are eligible for SIN card 0.032
It was clear what to do if you had a problem or question 0.030
Find information about [PROGRAM] 0.025
Understand the information about [PROGRAM] 0.025
You needed to explain your situation only once 0.024
Completing the application form 0.019
You travelled a reasonable distance to access the service 0.009
Find out what information you need to provide when applying for [PROGRAM] 0.008
Throughout the process it was clear what would happen next and when it would happen 0.007
It was easy to access service in a language you could speak and understand well 0.006
You were provided service in a way that protected your health and safety during the COVID-19 pandemic 0.004
You were able to find the information you needed within a reasonable amount of time 0.004
Putting together the information you needed to apply for [PROGRAM] 0.003
Find out the steps to apply 0.002
Overall Priority Matrix: Impact vs. Performance – SIN Clients
The greatest opportunities to improve the service experience for SIN clients are improving the ease of getting help on their application and ease of figuring out eligibility.
The helpfulness of Service Canada in-person representatives and timeliness of service in particular represent prominent strengths this year and areas that should be protected. Understanding the requirements of the application, overall ease of applying, ease of getting help when needed, being able to complete the application in a reasonable time and confidence in issue resolution are also areas of relatively stronger performance and should also be protected.
Note: aspects of service that had an impact of 0.03 or lower were not included in the analysis below given their limited impact on satisfaction.
Figure long description
Overall Priority Matrix: Impact vs. Performance – SIN Clients
Protect
Client journey took reasonable time
Service Canada in-person representatives were helpful
Complete application reasonable time
Understanding requirements
Confident in issue resolution
Ease of getting help
Ease of applying
Maintain
Ease of getting help on application
Consistent info
Moved smoothly through steps
Service in choice of EN or FR
Ease of figuring out eligibility
Clarity of issue resolution
Confident personal info protected
Drivers of Satisfaction: OAS/GIS Clients
The primary driver of satisfaction in the service experience for OAS/GIS clients was the ease of following-up on their application. Secondary drivers of satisfaction included the ease of finding out the steps to apply, information on the program and what information was needed to apply and travelling a reasonable distance to access service.
Compared to 2021-22, the ease of follow-up has taken on increased importance and has become the top driver. The ease of finding information on the program, travelling a reasonable distance to access service and being able to find the information needed within a reasonable amount of time have also taken on increased importance in driving satisfaction.
The strength of the drivers’ analysis has increased compared to 2021-22 (R2 of 0.94 compared to 0.71).
Figure long description
Drivers of Satisfaction: OAS/GIS Clients
Easy/difficult to follow up with Service Canada about your application 1.065
Find out the steps to apply 0.669
Find information about [PROGRAM] 0.656
Find out what information you need to provide when applying for [PROGRAM] 0.632
You travelled a reasonable distance to access the service 0.616
You were able to find the information you needed within a reasonable amount of time 0.518
Getting help on your application when you needed it 0.466
You received consistent information 0.445
Understanding the requirements of the application 0.418
Figure out if you are eligible for benefits 0.412
Decide the best age to start your pension 0.227
You were provided service in a way that protected your health and safety during the COVID-19 pandemic 0.224
Completing the application form 0.221
The amount of time it took was reasonable 0.214
You were confident that any issues or problems would have been easily resolved 0.211
It was easy to get help when you needed it 0.205
You were confident that your personal information was protected 0.199
It was clear what to do if you had a problem or question 0.164
You were able to move smoothly through all of the steps 0.159
It was easy to access service in a language you could speak and understand well 0.144
You were provided with service in your choice of English or French 0.141
You needed to explain your situation only once 0.122
Putting together the information you needed to apply for [PROGRAM] 0.116
Throughout the process it was clear what would happen next and when it would happen 0.056
Understand the information about [PROGRAM] 0.048
You were able to complete the application in a reasonable amount of time 0.020
Overall, it was easy for you to apply for [PROGRAM] 0.014
Overall Priority Matrix: Impact vs. Performance – OAS/GIS Clients
The greatest opportunity to improve the service experience for OAS/GIS clients is improving the ease of follow-up. Secondary areas for improvement include the ease of finding the steps to apply, what information is needed when applying and information on the program, travelling a reasonable distance to access service and ease of getting help on their application.
Being provided service in their choice of English or French, accessing service in a language clients understand, moving smoothly through all steps, ease of completing the application form and timeliness of service are prominent strengths this year and areas that should be protected.
Note: aspects of service that had an impact of 0.03 or lower were not included in the analysis below given their limited impact on satisfaction.
Figure long description
Overall Priority Matrix: Impact vs. Performance – OAS/GIS Clients
Improve
Ease of follow-up
Ease of finding out info you need to apply
Ease of finding steps to apply
Ease of finding info on program
Travelled reasonable distance
Ease of getting help on your application
Find info in reasonable time
Ease of deciding when to start pension
Ease of getting help
Confident in issue resolution
Explain once
Protected you during COVID
Clarity of issue resolution
Confident personal info protected
Protect
Consistent info
Understanding requirements
Ease of figuring out eligibility
Client journey took reasonable time
Ease of completing application form
Moved smoothly thought steps
Ease of gathering info to apply
Access service in language I understand
Provide service in choice of EN or FR
Secondary Improve
Ease of understanding info on program
Clarity of process
Impact of Outcome on Satisfaction
The proportion of EI, CPP and CPP-D who were granted benefits remained consistent compared to 2021-22.
Satisfaction among CPP-D clients who were approved for benefits decreased year over year. The vast majority of CPP clients, just over half of EI clients and four in ten CPP-D clients who were denied benefits were satisfied with their experience.
Figure long description
% Rating Satisfaction as 4 or 5
EI
2017-18, n=703
Approved, 85%
Denied, 73%
2018-19, n=1098
Approved, 84%
Denied, 55%
2019-20, n=701
Approved, 81%
Denied, 39%
2020-21, n=1162
Approved, 85%
Denied, 61%
2021-22, n=987
Approved, 78%
Denied, 51%
2022-23, n=1035
Approved, 81%
Denied, 54%
CPP
2017-18, n=652
Approved, 88%
Denied, 67%
2018-19, n=788
Approved, 87%
Denied, 72%
2019-20, n=389
Approved, 89%
Denied, 59%
2020-21, n=752
Approved, 86%
Denied, 81%
2021-22, n=768
Approved, 86%
Denied, 80%
2022-23, n=768
Approved, 85%
Denied 79%
CPPD
2018-19, n=766
Approved, 76%
Denied, 40%
2019-20, n=417
Approved, 77%
Denied, 40%
2020-21, n=692
Approved, 80%
Denied, 43%
2021-22, n=761
Approved, 82%
Denied, 39%
2022-23, n=752
Approved, 73%, significantly lower than previous wave
Denied 39%
Figure long description
% approved/denied in the survey sample
EI
2017-18, n=703
Approved, 81%
Denied, 19%
2018-19, n=1098
Approved, 88%
Denied, 12%
2019-20, n=701
Approved, 88%
Denied, 12%
2020-21, n=1162
Approved, 95%
Denied, 5%
2021-22, n=987
Approved, 90%
Denied, 10%
2022-23, n=1035
Approved, 89%
Denied, 11%
CPP
2017-18, n=652
Approved, 98%
Denied, 2%
2018-19, n=788
Approved, 98%
Denied, 2%
2019-20, n=389
Approved, 97%
Denied, 3%
2020-21, n=752
Approved, 96%
Denied, 4%
2021-22, n=768
Approved, 96%
Denied, 4%
2022-23, n=1035
Approved, 96%
Denied, 4%
CPPD
2017-18, n=658
Approved, 60%
Denied, 40%
2018-19, n=766
Approved, 61%
Denied, 39%
2019-20, n=417
Approved, 53%
Denied, 47%
2020-21, n=692
Approved, 54%
Denied, 46%
2021-22, n=761
Approved, 48%
Denied, 52%
2022-23, n=1035
Approved, 53%
Denied, 47%
Note: Clients who were denied benefit were present in the administrative databases of EI, CPP and CPP-D, but not other programs.
Note: Clients are asked specifically to assess the service delivery, not whether the application was approved or denied. While granted/denied is a driver of satisfaction, it must be remembered that approval is based on legislation.
Q38a. Again, thinking about the overall service from getting information about [INSERT ABBREV] to receiving a decision. How satisfied were you with the service you received from Service Canada related to your [insert abbrev] application? Please use a 5-point scale, where 1 means very dissatisfied, and 5 means very satisfied.
Service Levels And Channel Use
Self-Service and Assistance
Change in Multiple Channel Use Over Time
Overall, clients were more likely to utilize in-person service during the entire client journey compared to 2021-22, while fewer used self-service only.
Use of in-person service has increased for a second consecutive year but remained considerably lower than 2019-20 or earlier (i.e. prior to the pandemic), while those who used self-service only has steadily declined over the same timeframe. Assisted self-service has continued to see gradual increases in usage year-over-year.
Channels used, in particular in-person and online, has not returned to pre-pandemic levels, possibly indicating the longer-term impacts of service transformation changes and evolving service channel preferences. Overall, in 2022-23, channel use among clients sees more use of in-person but still far off levels observed prior to the pandemic.
Six percent utilized the touchless person-to-person service, while 4% were auto-enrolled only and 1% used mail only. The balance of clients (7% indicated either using no channels throughout their experience or did not fit a defined level of service. These figures are stable with previous years.
Multiple Channel Use definitions were mutually exclusive paths that track the client journey. The Multiple Channel Use variables were used to assess whether there has been an increase or decrease in a particular method of contact with Service Canada. Please note that the definitions used are based on those set in CX3.
In-Person: If a respondent goes into a Service Canada centre at any stage of their journey, they were considered to have used the “in person” service level.
Self-Service Only: These respondents use online offerings including the Government of Canada website and their My Service Canada Account. They engage online at all stages.
Assisted Self-Service: These respondents use online or mail services, but also contact Service Canada by phone, or a combination of phone and online or mail throughout their journey.
Auto-Enroll Only: These respondents were auto-enrolled in their program/benefit and made no additional contact with Service Canada.
Mail Only: These respondents only contact Service Canada by mail at every stage, making no use of the online, in person, or telephone services.
Touchless Person-to-Person: These respondents used an online application and had a service interaction with eServiceCanada at any point (no in-person at any point).
Figure long description
Multiple Channel use Changes – Trending
In-person at any Stage
2017-18, 60%
2018-20, 62%
2020-21, 30%
2021-22, 33%
2022-23, 39%, significnatly higher than previous wave
Self-service only
2017-18, 19%
2019-20, 17%
2020-21, 34%
2021-22, 31%
2022-23, 25%, significantly lower than previous wave
Assisted Self-Service
2017-18, 6%
2019-20, 10%
2020-21, 13%
2021-22, 15%
2022-23, 17%
Auto-Enroll Only
2017-18, 5%
2019-20, 4%
2020-21, 4%
2021-22, 5%
2022-23, 4%
Mail Only
2017-18, 0%
2019-20, 1%
2020-21, 1%
2021-22, 1%
2022-23, 1%
Touchless Person-to-Person
2020-21, 7%
2021-22, 6%
2022-23, 6%
Note On Multiple Channel Use:
There was a select number of clients who either did not indicate a channel at all stages or do not fit into any of the defined service levels. The proportion of these respondents as a part of the total sample was:
2022-23 – 7%
2021-22 – 8%
2020-21 – 6%
2019-20 – 6%
2017-18 – 10%
Service Levels by Stage in the Client Journey: Overall
Clients were most likely to have used self-service only at the aware and apply stages and assisted self-service at the follow-up stage.
Compared to 2021-22, use of in-person service increased at the aware and apply stages. Clients were also more likely to have used assisted-self-service at the aware stage and less likely to have used self-service only at the apply stage.
Figure long description
Service Levels by Stage in the Client Journey: Overall
Aware
In-person
2017-18, 42%
2019-20, 35%
2020-21, 18%
2021-22, 19%
2022-23, 24%, significnatly higher than previous wave
Self-Service Only
2017-18, 35%
2019-20, 44%
2020-21, 36%
2021-22, 37%
2022-23, 35%
Assisted Self-Service
2017-18, 7%
2019-20, 6%
2020-21, 8%
2021-22, 7%
2022-23, 9%, significnatly higher than previous wave
Auto-Enroll Only
2017-18, 0%
2019-20, 6%
2020-21, 6%
2021-22, 6%
2022-23, 5%
Mail Only
2017-18, 2%
2019-20, 2%
2020-21, 1%
2021-22, 2%
2022-23, 2%
Touchless Person-to-Person
2020-21, 3%
2021-22, 3%
2022-23, 2%
Apply
In-person
2017-18, 49%
2019-20, 53%
2020-21, 22%
2021-22, 25%
2022-23, 29%, significantly higher than previous wave
Self-Service Only
2017-18, 29%
2019-20, 29%
2020-21, 51%
2021-22, 46%
2022-23, 41%
Assisted Self-Service
2017-18, 7%
2019-20, 5%
2020-21, 9%
2021-22, 12%
2022-23, 13%
Auto-Enroll Only
2017-18, 0%
2019-20, 4%
2020-21, 6%
2021-22, 6%
2022-23, 5%
Mail Only
2017-18, 4%
2019-20, 3%
2020-21, 5%
2021-22, 4%
2022-23, 5%
Touchless Person-to-Person
2020-21, 3%
2021-22, 3%
2022-23, 3%
Follow-up
In-person
2017-18, 41%
2019-20, 40%
2020-21, 13%
2021-22, 19%
2022-23, 20%
Self-Service Only
2017-18, 10%
2019-20, 11%
2020-21, 14%
2021-22, 13%
2022-23, 15%
Assisted Self-Service
2017-18, 15%
2019-20, 24%
2020-21, 26%
2021-22, 30%
2022-23, 29%
Auto-Enroll Only
2017-18, 0%
2019-20, 0%
2020-21, 1%
2021-22, 0%
2022-23, 0%
Mail Only
2017-18, 1%
2019-20, 2%
2020-21, 3%
2021-22, 2%
2022-23, 1%
Touchless Person-to-Person
2020-21, 3%
2021-22, 1%
2022-23, 0%
Proportion who completed the client journey using only self-service (without assistance by phone or in-person): 25% of all clients
Proportion who used high-touch service (in-person and may have used other channels) at some point in the client journey: 39% of al clients
Percentages may not add to 100% due to rounding and not all clients choose to follow-up.
It should be noted that there was missing data for contact by auto-enrolled clients in the baseline survey
Note: In 2018-19 the channel use question was asked once at the beginning of the survey and pertaining to the apply stage. Caution should be used in making comparisons between years at the apply stage.
Base: Total aware; Total apply; Total follow-up
Service Levels by Stage in the Client Journey: EI
EI clients were most likely to have used self-service only at the aware and apply stages and assisted self-service at the follow-up stage.
Compared to 2021-22, EI clients were more likely to have used in-person service or assisted self-service at the aware and apply stages and less likely to have used self-service only at the apply stage.
Figure long description
Service Levels by Stage in the Client Journey: EI
Aware
In-person
2017-18, 35%
2019-20, 34%
2020-21, 10%
2021-22, 11%
2022-23, 16%, significantly higher than previous wave
Self-service Only
2017-18, 46%
2019-20, 52%
2020-21, 44%
2021-22, 45%
2022-23, 44%
Assisted Self-service
2017-18, 9%
2019-20, 7%
2020-21, 12%
2021-22, 11%
2022-23, 14%, significantly higher than previous wave
Mail Only
2017-18, 1%
2019-20, 1%
2020-21, 1%
2021-22, 0%
2022-23, 1%
Touchless Person-to-person
2020-21, 4%
2021-22, 3%
2022-23, 3%
Apply
In-person
2017-18, 34%
2019-20, 43%
2020-21, 6%
2021-22, 8%
2022-23, 12%, significantly higher than previous wave
Self-service Only
2017-18, 52%
2019-20, 47%
2020-21, 74%
2021-22, 67%
2022-23, 60%, significnatly lower than previous wave
Assisted Self-service
2017-18, 12%
2019-20, 8%
2020-21, 13%
2021-22, 17%
2022-23, 21%, significantly higher than previous wave
Mail Only
2017-18, 0%
2019-20, 0%
2020-21, 0%
2021-22, 0%
2022-23, 0%
Touchless Person-to-person
2020-21, 4%
2021-22, 5%
2022-23, 4%
Follow-up
In-person
2017-18, 35%
2019-20, 40%
2020-21, 11%
2021-22, 17%
2022-23, 19%
Self-service Only
2017-18, 13%
2019-20, 10%
2020-21, 17%
2021-22, 13%
2022-23, 14%
Assisted Self-service
2017-18, 19%
2019-20, 28%
2020-21, 30%
2021-22, 35%
2022-23, 34%
Mail Only
2017-18, 0%
2019-20, 1%
2020-21, 1%
2021-22, 1%
2022-23, 1%
Touchless Person-to-person
2020-21, 3%
2021-22, 0%
2022-23, 0%
Proportion who completed the client journey using only self-service (without assistance by phone or in-person): 36% of EI clients
Proportion who used high-touch service (in-person and may have used other channels) at some point in the client journey: 25% of EI clients
Percentages may not add to 100% due to rounding and not all clients choose to follow-up.
Note: In 2018-19 the channel use question was asked once at the beginning of the survey and pertaining to the apply stage. Caution should be used in making comparisons between years at the apply stage.
Base: Total aware; Total apply; Total follow-up (EI clients)
Service Levels by Stage in the Client Journey: CPP
CPP clients were most likely to have used self-service only at the aware and apply stages, while a roughly equal proportion used self-service only, assisted self-service or in-person service at the follow-up stage.
Compared to 2021-22, service levels among CPP clients remained consistent across all stages of the client journey.
Figure long description
Service Levels by Stage in the Client Journey: CPP
Aware
In-person
2017-18, 46%
2019-20, 28%
2020-21, 12%
2021-22, 16%
2022-23, 18%
Self-service Only
2017-18, 27%
2019-20, 50%
2020-21, 39%
2021-22, 39%
2022-23, 40%
Assisted Self-service
2017-18, 11%
2019-20, 12%
2020-21, 7%
2021-22, 9%
2022-23, 9%
Mail Only
2017-18, 6%
2019-20, 6%
2020-21, 5%
2021-22, 8%
2022-23, 7%
Touchless Person-to-person
2020-21, 2%
2021-22, 1%
2022-23, 1%
Apply
In-person
2017-18, 51%
2019-20, 38%
2020-21, 14%
2021-22, 19%
2022-23, 22%
Self-service Only
2017-18, 19%
2019-20, 38%
2020-21, 40%
2021-22, 40%
2022-23, 38%
Assisted Self-service
2017-18, 6%
2019-20, 9%
2020-21, 13%
2021-22, 10%
2022-23, 11%
Mail Only
2017-18, 16%
2019-20, 10%
2020-21, 19%
2021-22, 16%
2022-23, 18%
Touchless Person-to-person
2020-21, 3%
2021-22, 2%
2022-23, 1%
Follow-up
In-person
2017-18, 46%
2019-20, 38%
2020-21, 10%
2021-22, 19%
2022-23, 20%
Self-service Only
2017-18, 8%
2019-20, 15%
2020-21, 22%
2021-22, 19%
2022-23, 22%
Assisted Self-service
2017-18, 8%
2019-20, 16%
2020-21, 17%
2021-22, 18%
2022-23, 20%
Mail Only
2017-18, 6%
2019-20, 4%
2020-21, 3%
2021-22, 4%
2022-23, 6%
Touchless Person-to-person
2020-21, 0%
2021-22, 1%
2022-23,0 %
Proportion who completed the client journey using only self-service (without assistance by phone or in-person): 30% of CPP clients
Proportion who used high-touch service (in-person and may have used other channels) at some point in the client journey: 29% of CPP clients
Percentages may not add to 100% due to rounding and not all clients choose to follow-up.
Note: In 2018-19 the channel use question was asked once at the beginning of the survey and pertaining to the apply stage. Caution should be used in making comparisons between years at the apply stage.
Base: Total aware; Total apply; Total follow-up (CPP clients)
Service Levels by Stage in the Client Journey: CPP-D
CPP-D clients were most likely to have used self-service only at the aware stage, mail only at the apply stage and assisted self-service at the follow-up stage.
Compared to 2021-22, CPP-D clients were more likely to have used in-person service at the apply stage and less likely to have used mail-only. They were also more likely to have used self-service only at the follow-up stage.
Figure long description
Service Levels by Stage in the Client Journey: CPP-D
Aware
In-person
2017-18, 31%
2019-20, 29%
2020-21, 10%
2021-22, 12%
2022-23, 17%, significnatly higher than previous wave
Self-service Only
2017-18, 28%
2019-20, 33%
2020-21, 28%
2021-22, 23%
2022-23, 28%
Assisted Self-service
2017-18, 14%
2019-20, 10%
2020-21, 9%
2021-22, 11%
2022-23, 10%
Mail Only
2017-18, 5%
2019-20, 5%
2020-21, 5%
2021-22, 9%
2022-23, 7%
Touchless Person-to-person
2020-21, 5%
2021-22, 2%
2022-23, 2%
Apply
In-person
2017-18, 36%
2019-20, 38%
2020-21, 8%
2021-22, 11%
2022-23, 17%
Self-service Only
2017-18, 11%
2019-20, 15%
2020-21, 16%
2021-22, 14%
2022-23, 15%
Assisted Self-service
2017-18, 9%
2019-20, 5%
2020-21, 10%
2021-22, 13%
2022-23, 14%
Mail Only
2017-18, 28%
2019-20, 28%
2020-21, 44%
2021-22, 41%
2022-23, 34%, significantly lower than previous wave
Touchless Person-to-person
2020-21, 2%
2021-22, 2%
2022-23, 1%
Follow-up
In-person
2017-18, 26%
2019-20, 27%
2020-21, 13%
2021-22, 12%
2022-23, 16%
Self-service Only
2017-18, 3%
2019-20, 3%
2020-21, 6%
2021-22, 7%
2022-23, 13%, significnatly higher than previous wave
Assisted Self-service
2017-18, 10%
2019-20, 18%
2020-21, 21%
2021-22, 19%
2022-23, 22%
Mail Only
2017-18, 8%
2019-20, 9%
2020-21, 6%
2021-22, 5%
2022-23, 4%
Touchless Person-to-person
2020-21, 1%
2021-22, 0%
2022-23, 0%
Proportion who completed the client journey using only self-service (without assistance by phone or in-person): 7% of CPP-D clients
Proportion who used high-touch service (in-person and may have used other channels) at some point in the client journey: 27% of CPP-D clients
Percentages may not add to 100% due to rounding and not all clients choose to follow-up.
Note: In 2018-19 the channel use question was asked once at the beginning of the survey and pertaining to the apply stage. Caution should be used in making comparisons between years at the apply stage.
Base: Total aware; Total apply; Total follow-up (CPP-D clients)
Service Levels by Stage in the Client Journey: SIN
SIN clients were most likely to have used in-person at all stages of the client journey and in-particular at the apply stage.
Compared to 2021-22, SIN clients were more likely to have utilized in-person or mail only at the aware and apply stages and less likely to have used self-service only or assisted self-service. Service levels remained consistent at the follow-up stage compared to last year.
Figure long description
Service Levels by Stage in the Client Journey: SIN
Aware
In-person
2020-21, 38%
2021-22, 38%
2022-23, 45%, significantly higher than previous wave
Self-service Only
2020-21, 31%
2021-22, 31%
2022-23, 26%, significnatly lower than previous wave
Assisted Self-service
2020-21, 3%
2021-22, 2%
2022-23, 3%
Mail Only
2020-21, 1%
2021-22, 0%
2022-23, 2%, significnatly higher than previous wave
Touchless Person-to-person
2020-21, 2%
2021-22, 2%
2022-23, 1%
Apply
In-person
2020-21, 55%
2021-22, 61%
2022-23, 68%, significantly higher than previous wave
Self-service Only
2020-21, 33%
2021-22, 29%
2022-23, 22%, significnatly lower than previous wave
Assisted Self-service
2020-21, 5%
2021-22, 6%
2022-23, 3%, significantly lower than previous wave
Mail Only
2020-21, 1%
2021-22, 1%
2022-23, 2%, significantly higher than previous wave
Touchless Person-to-person
2020-21, 2%
2021-22, 1%
2022-23, 1%
Follow-up
In-person
2020-21, 32%
2021-22, 36%
2022-23, 32%
Self-service Only
2020-21, 4%
2021-22, 10%
2022-23, 15%
Assisted Self-service
2020-21, 19%
2021-22, 14%
2022-23, 13%
Mail Only
2020-21, 6%
2021-22, 4%
2022-23, 2%
Touchless Person-to-person
2020-21, 2%
2021-22, 3%
2022-23, 0%
Proportion who completed the client journey using only self-service (without assistance by phone or in-person): 14% of SIN clients
Proportion who used high-touch service (in-person and may have used other channels) at some point in the client journey: 75% of SIN clients
Percentages may not add to 100% due to rounding and not all clients choose to follow-up.
Note: Service levels were not reported for SIN clients in previous years due to differences in service delivery.
Base: Total aware; Total apply; Total follow-up (SIN clients)
Service Levels by Stage in the Client Journey: OAS/GIS
Half of OAS/GIS clients were auto-enrolled and did not engage in the aware or apply stage. Non auto-enrolled clients were most likely to use self-service only at the aware stage and mail only at the apply stage (followed closely by self-service only). Among those who followed up, in-person service was used most often, followed closely by self-service only and assisted self-service.
Compared to 2021-22, the proportion of clients auto-enrolled decreased which meant more OAS/GIS clients overall engaged in the aware or apply stages. OAS/GIS clients were more likely to have used mail only at the apply stage, while service levels remained consistent at the aware and follow-up stages.
Figure long description
Service Levels by Stage in the Client Journey: OAS/GIS
Aware
In-person
2017-18, 19%
2019-20, 12%
2020-21, 9%
2021-22, 6%
2022-23, 6%
Self-service Only
2017-18, 19%
2019-20, 23%
2020-21, 13%
2021-22, 15%
2022-23, 16%
Assisted Self-service
2017-18, 6%
2019-20, 6%
2020-21, 3%
2021-22, 3%
2022-23, 5%
Auto-enroll Only
2019-20, 51%
2020-21, 53%
2021-22, 58%
2022-23, 50%, significnatly lower than previous wave
Mail Only
2017-18, 7%
2019-20, 6%
2020-21, 4%
2021-22, 3%
2022-23, 6%
Touchless Person-to-person
2020-21, 1%
2021-22, 1%
2022-23, 2%
Apply
In-person
2017-18, 12%
2019-20, 16%
2020-21, 10%
2021-22, 8%
2022-23, 10%
Self-service Only
2017-18, 3%
2019-20, 8%
2020-21, 13%
2021-22, 12%
2022-23, 13%
Assisted Self-service
2017-18, 1%
2019-20, 2%
2020-21, 2%
2021-22, 5%
2022-23,5 %
Auto-enroll Only
2019-20, 38%
2020-21, 53%
2021-22, 58%
2022-23, 50%, significnatly lower than previous wave
Mail Only
2017-18, 9%
2019-20, 10%
2020-21, 15%
2021-22, 11%
2022-23, 16%, significantly higher than previous wave
Touchless Person-to-person
2020-21, 6%
2021-22, 1%
2022-23, 1%
Follow-up
In-person
2017-18, 45%
2019-20, 39%
2020-21, 9%
2021-22, 18%
2022-23, 19%
Self-service Only
2017-18, 2%
2019-20, 18%
2020-21, 9%
2021-22, 18%
2022-23, 17%
Assisted Self-service
2017-18, 4%
2019-20, 11%
2020-21, 22%
2021-22, 19%
2022-23, 16%
Auto-enroll Only
2019-20, 3%
2020-21, 8%
2021-22, 3%
2022-23, 3%
Mail Only
2017-18, 4%
2019-20, 7%
2020-21, 7%
2021-22, 7%
2022-23, 3%
Touchless Person-to-person
2020-21, 0%
2021-22, 0%
2022-23, 0%
Proportion who completed the client journey using only self-service (without assistance by phone or in-person): 8% of OAS/GIS clients
Proportion who used high-touch service (in-person and may have used other channels) at some point in the client journey: 15% of OAS/GIS clients
Percentages may not add to 100% due to rounding and not all clients choose to follow-up.
It should be noted that there was missing data for contact by auto-enrolled clients in the baseline survey
Note: In 2018-19 the channel use question was asked once at the beginning of the survey and pertaining to the apply stage. Caution should be used in making comparisons between years at the apply stage.
Base: Total aware; Total apply; Total follow-up (OAS/GIS clients)
Proactive Communication with CPP-D Clients (Reported)
Six in ten CPP-D clients reported receiving a call from Service Canada to discuss their application status and next steps prior to receiving a decision, higher than in 2021-22.
Satisfaction continued to be considerably higher among CPP-D clients who report being contacted by Service Canada before receiving a decision, compared to those who were not. However, satisfaction declined among those who were contacted by Service Canada compared to 2021-22.
Figure long description
Contact with Service Canada Prior to Decision,
A service Canada representative call to discuss your application status and the next
2022-23
Yes, 60%
No, 37%
Don’t know, 3%
% Yes
2022-23, n=752, 60%, significantly higher than previous wave
2021-22, n=861, 53%
2020-21, n=692, 47%
2019-20, n=417, 54%
Figure long description
Satisfaction among clients who were contacted by Service Canada
A service Canada representative called to discuss your application status and the next steps
Contacted
2022-23, 64%, significantly lower than previous wave
2021-22, 70%
2020-21, 72%
2019-20, 60%
Not contacted
2022-23, 49%
2021-22, 49%
2020-21, 54%
2019-20, 46%
Q20bx. Before you received a decision about your application to [PROGRAM ABBREV], did …
Base: CPP-D Clients (n=752)
Proactive Communication with EI Clients (Reported)
One-third of EI clients reported receiving a letter, email or telephone call from Service Canada about their application status prior to receiving a decision, higher than in 2021-22.
Whether or not an EI client was contacted by Service Canada did not have a significant difference on their overall satisfaction. Compared to 2021-22, satisfaction ratings have increased among those who were contacted by Service Canada prior to receiving a decision.
Figure long description
Contact with Service Canada prior to decision
A Service Canada representative contact you about you application status by email, letter or telephone call
2021-22
Yes, 33%, significnatly higher than previous wave
No, 64%
Don’t know, 3%
% Yes
2022-23, 33%, significantly higher than previous wave
2021-22, 28%
2020-21, 27%
Figure long description
Satisfaction among clients who were contacted by Service Canada, A Service Canada representative contact you about your application status by email, letter or telephon call (EI clients n=987)
Contacted
2022-23, 77%
2021-22, 73%
2020-21, 84%
Not Contacted
2022-23, 78%
2021-22, 77%
2020-21, 83%
Q20bx. Before you received a decision about your application to [PROGRAM ABBREV], did …
Base: EI Clients (n=1035)
Channel Use By Stage And Program
Channel Use: Overall
Across all stages of the client journey, just over three-quarters of clients (76%) used the online channel at some point, while nearly four in ten used in-person (39%) and slightly fewer telephone (35%). More than two in ten (22%) used mail and around one in ten (12%) eServiceCanada at some point during their client journey.
Compared to 2021-22, a higher proportion reported using in-person or telephone channels.
Figure long description
Overall Channel Use – Trending
In-person
2017-18, 59%
2019-20, 62%
2020-21, 30%
2021-22, 33%
2022-23, 39%, significantly higher than previous wave
Online
2017-18, 66%
2019-20, 60%
2020-21, 78%
2021-22, 77%
2022-23, 76%
Telephone
2017-18, 29%
2019-20, 32%
2020-21, 30%
2021-22, 31%
2022-23, 35%, significantly higher than previous wave
Mail
2017-18, 18%
2019-20, 17%
2020-21, 19%
2021-22, 21%
2022-23, 22%
eServiceCanada
2020-21, 13%
2021-22, 13%
2022-23, 12%
Q1a. Which of the following did you use to find out about [PROGRAM] or [PROGRAM ABBREV] before you applied? Did you …
Q9bx Thinking back to when you actually applied for [IF NOT SIN INSERT [PROGRAM ABBREV] benefits], [IF SIN INSERT: a SIN number], which of the following methods did you use when completing and submitting your application? Did you ...
Q18. How did you contact the government before you were notified of a decision on your [PROGRAM ABBREV] application? Was it ...
Base: All respondents (n=4200)
Channel Use by Stage: Overall
Online was the most used channel at the aware and apply stages and telephone at the follow-up stage.
Compared to 2021-22, use of the in-person channel increased at the aware and apply stages but continued to be much lower than levels observed in 2019-20 or earlier. A higher proportion also reported using the telephone channel at the aware stage, while fewer used the online channel at the apply stage.
Figure long description
Aware
In-person
2017-18, 37%
2019-20, 47%
2020-21, 24%
2021-22, 26%
2022-23, 30%, significnatly higher than previous wave
Online
2017-18, 54%
2019-20, 58%
2020-21, 75%
2021-22, 76%
2022-23, 74%
Telephone
2017-18, 21%
2019-20, 15%
2020-21, 16%
2021-22, 15%
2022-23, 18%, significnatly higher than previous wave
Mail
2017-18, 13%
2019-20, 10%
2020-21, 14%
2021-22, 16%
2022-23, 15%
eServiceCanada
2020-21, 6%
2021-22, 7%
2022-23, 5%
Apply
In-person
2017-18, 37%
2019-20, 59%
2020-21, 24%
2021-22, 27%
2022-23, 67%, significantly higher than previous wave
Online
2017-18, 72%
2019-20, 48%
2020-21, 72%
2021-22, 72%
2022-23, 31%, significantly lower than previous wave
Telephone
2017-18, 21%
2019-20, 13%
2020-21, 13%
2021-22, 14%
2022-23, 17%
Mail
2017-18, 14%
2019-20, 10%
2020-21, 11%
2021-22, 12%
2022-23, 13%
eServiceCanada
2020-21, 5%
2021-22, 5%
2022-23, 4%
Follow-up
In-person
2017-18, 36%
2019-20, 30%
2020-21, 13%
2021-22, 19%
2022-23, 20%
Online
2017-18, 48%
2019-20, 56%
2020-21, 51%
2021-22, 56%
2022-23, 57%
Telephone
2017-18, 68%
2019-20, 68%
2020-21, 70%
2021-22, 73%
2022-23, 71%
Mail
2017-18, 10%
2019-20, 15%
2020-21, 15%
2021-22, 11%
2022-23, 11%
eServiceCanada
2020-21, 24%
2021-22, 21%
2022-23, 19%
Q1a. Which of the following did you use to find out about [PROGRAM] or [PROGRAM ABBREV] before you applied? Did you …
Q9bx Thinking back to when you actually applied for [IF NOT SIN INSERT [PROGRAM ABBREV] benefits], [IF SIN INSERT: a SIN number], which of the following methods did you use when completing and submitting your application? Did you ...
Q18. How did you contact the government before you were notified of a decision on your [PROGRAM ABBREV] application? Was it ...
Base: All respondents (n=varies)
Channel Use at Aware Stage: by Program
Clients of all programs were most likely to have used online government sources to find out about the program they were applying for. EI clients continued to be more likely to use the online channel compared to all clients, while clients of all other programs were less likely. Telephone use was higher among EI and CPP-D clients, while CPP, CPP-D and OAS/GIS clients were more likely to use the mail channel. CPP-D clients were also more likely to use eServiceCanada, while SIN clients were more likely to use in-person service.
Compared to 2021-22, EI clients were more likely to have used in-person service, CPP-D clients were more likely to have gone online or used the mail channel, while OAS/GIS clients were more likely to have used the telephone channel. SIN clients were less likely to have gone online during the aware stage.
Figure long description
Channel Use at Aware Stage: by Program
Total
In-person
2017-18, 37%
2019-20, 47%
2020-21, 24%
2021-22, 26%
2022-23, 30%
Online
2017-18, 54%
2019-20, 58%
2020-21, 75%
2021-22, 76%
2022-23, 74%
Telephone
2017-18, 21%
2019-20, 15%
2020-21, 16%
2021-22, 15%
2022-23, 18%
Mail
2017-18, 13%
2019-20, 10%
2020-21, 14%
2021-22, 16%
2022-23, 15%
eServiceCanada
2020-21, 6%
2021-22, 7%
2022-23, 5%
EI
In-person
2017-18, 35%
2019-20, 42%
2020-21, 14%
2021-22, 14%
2022-23, 19%
Online
2017-18, 60%
2019-20, 71%
2020-21, 83%
2021-22, 85%
2022-23, 86%
Telephone
2017-18, 19%
2019-20, 20%
2020-21, 20%
2021-22, 19%
2022-23, 23%
Mail
2017-18, 8%
2019-20, 8%
2020-21, 8%
2021-22, 11%
2022-23, 10%
eServiceCanada
2020-21, 7%
2021-22, 6%
2022-23, 5%
CPP
In-person
2017-18, 46%
2019-20, 33%
2020-21, 15%
2021-22, 19%
2022-23, 20%
Online
2017-18, 41%
2019-20, 63%
2020-21, 66%
2021-22, 67%
2022-23, 69%
Telephone
2017-18, 24%
2019-20, 12%
2020-21, 19%
2021-22, 17%
2022-23, 19%
Mail
2017-18, 26%
2019-20, 21%
2020-21, 24%
2021-22, 29%
2022-23, 27%
eServiceCanada
2020-21, 5%
2021-22, 4%
2022-23, 4%
CPP-D
In-person
2017-18, 32%
2019-20, 34%
2020-21, 12%
2021-22, 15%
2022-23, 19%
Online
2017-18, 38%
2019-20, 44%
2020-21, 50%
2021-22, 53%
2022-23, 68%
Telephone
2017-18, 28%
2019-20, 18%
2020-21, 18%
2021-22, 23%
2022-23, 26%
Mail
2017-18, 30%
2019-20, 21%
2020-21, 28%
2021-22, 32%
2022-23, 40%
eServiceCanada
2020-21, 5%
2021-22, 6%
2022-23, 9%
SIN
In-person
2017-18, 62%
2019-20, 64%
2020-21, 48%
2021-22, 48%,
2022-23, 53%
Online
2017-18, 36%
2019-20, 37%
2020-21, 72%
2021-22, 68%
2022-23, 60%
Telephone
2017-18, 12%
2019-20, 6%
2020-21, 8%
2021-22, 6%
2022-23, 7%
Mail
2017-18, 10%
2019-20, 5%
2020-21, 15%
2021-22, 16%
2022-23, 15%
eServiceCanada
2020-21, 7%
2021-22, 9%
2022-23, 6%
OAS/GIS
In-person
2017-18, 34%
2019-20, 28%
2020-21, 23%
2021-22, 18%
2022-23, 14%
Online
2017-18, 33%
2019-20, 46%
2020-21, 54%
2021-22, 64%
2022-23, 61%
Telephone
2017-18, 21%
2019-20, 22%
2020-21, 20%
2021-22, 15%
2022-23, 22%
Mail
2017-18, 25%
2019-20, 34%
2020-21, 32%
2021-22, 29%
2022-23, 35%
eServiceCanada
2020-21, 4%
2021-22, 4%
2022-23, 6%
Q1a. Which of the following did you use to find out about or before you applied? Did you …
Base: All answering (n=varies)
Channel Use at Apply Stage: by Program
EI and CPP clients were most likely to have used the online channel at the apply stage, while CPP-D and OAS/GIS clients were most likely to have used mail and SIN clients in-person. EI clients were more likely to have used the online channel compared to all clients, EI and CPP-D clients the telephone channel, and CPP, CPP-D and OAS/GIS clients the mail channel. SIN clients were more likely to use in-person service compared to all clients.
Compared to 2021-22, EI, CPP-D and SIN clients were more likely to have used the in-person channel, while OAS/GIS clients were more likely to have used the mail channel. SIN clients were less likely to have used the online channel or eServiceCanada.
Figure long description
Channel Use at Apply Stage: by Program
Total
In-person
2017-18, 37%
2019-20, 59%
2020-21, 24%
2021-22, 27%
2022-23, 31%, significantly higher than previous wave
Online
2017-18, 72%
2019-20, 48%
2020-21, 72%
2021-22, 72%
2022-23, 67%, significantly lower than previous wave
Telephone
2017-18, 21%
2019-20, 13%
2020-21, 13%
2021-22, 14%
2022-23, 17%
Mail
2017-18, 14%
2019-20, 10%
2020-21, 11%
2021-22, 12%
2022-23, 13%
eServiceCanada
2020-21, 5%
2021-22, 5%
2022-23, 4%
EI
In-person
2017-18, 35%
2019-20, 44%
2020-21, 7%
2021-22, 8%
2022-23, 12%, significantly lower than total, significantly higher than previous wave
Online
2017-18, 87%
2019-20, 69%
2020-21, 94%
2021-22, 94%
2022-23, 91%t, significantly higher than total
Telephone
2017-18, 22%
2019-20, 15%
2020-21, 16%
2021-22, 19%
2022-23, 23%, significantly higher than total
Mail
2017-18, 6%
2019-20, 3%
2020-21, 3%
2021-22, 5%
2022-23, 4%, significantly lower than total
eServiceCanada
2020-21, 5%
2021-22, 6%
2022-23, 5%
CPP
In-person
2017-18, 51%
2019-20, 39%
2020-21, 15%
2021-22, 20%
2022-23, 22%, significantly lower than total
Online
2017-18, 30%
2019-20, 53%
2020-21, 59%
2021-22, 55%
2022-23, 53%, significnatly lower than total
Telephone
2017-18, 19%
2019-20, 16%
2020-21, 17%
2021-22, 16%
2022-23, 16%
Mail
2017-18, 36%
2019-20, 25%
2020-21, 35%
2021-22, 33%
2022-23, 35%, significnatly higher than total
eServiceCanada
2020-21, 5%
2021-22, 4%
2022-23, 3%
CPP-D
In-person
2017-18, 36%
2019-20, 42%
2020-21, 9%
2021-22, 11%
2022-23, 17%, significantly lower than total, significantly higher than previous wave
Online
2017-18, 23%
2019-20, 29%
2020-21, 28%
2021-22, 29%
2022-23, 33%, significantly lower than total
Telephone
2017-18, 21%
2019-20, 23%
2020-21, 17%
2021-22, 21%
2022-23, 26%, significnatly higher than total
Mail
2017-18, 60%
2019-20, 59%
2020-21, 68%
2021-22, 67%
2022-23, 64%, significantly higher than total
eServiceCanada
2020-21, 3%
2021-22, 3%
2022-23, 5%
SIN
In-person
2017-18, 87%
2019-20, 94%
2020-21, 56%
2021-22, 62%
2022-23, 69%, significantly higher than total, significantly higher than previous wave
Online
2017-18, 18%
2019-20, 13%
2020-21, 50%
2021-22, 47%
2022-23, 38%, significantly lower than total, significantly lower than previous wave
Telephone
2017-18, 11%
2019-20, 7%
2020-21, 7%
2021-22, 6%
2022-23, 6%, significnatly lower than total
Mail
2017-18, 9%
2019-20, 7%
2020-21, 7%
2021-22, 8%
2022-23, 11%
eServiceCanada
2020-21, 6%
2021-22, 6%
2022-23, 3%, significantly lower than previous wave
OAS/GIS
In-person
2017-18, 41%
2019-20, 43%
2020-21, 21%
2021-22, 20%
2022-23, 20%, significantly lower than total
Online
2017-18, 15%
2019-20, 28%
2020-21, 35%
2021-22, 46%
2022-23, 40%, significantly lower than total
Telephone
2017-18, 17%
2019-20, 16%
2020-21, 9%
2021-22, 15%
2022-23, 14%
Mail
2017-18, 46%
2019-20, 40%
2020-21, 45%
2021-22, 43%
2022-23, 52%
eServiceCanada
2020-21, 2%
2021-22, 2%
2022-23, 5%
Q9bx Thinking back to when you actually applied for [IF NOT SIN INSERT [INSERT ABBREV] benefits], [IF SIN INSERT: a SIN number], which of the following methods did you use when completing and submitting your application? Did you ...
Base: All respondents (n=varies)
In-Person Application Completion
More than half of those who used the in-person channel at the apply stage reported that they completed their application at the counter with a Service Canada representative, while three in ten used a computer and two in ten said they didn’t know.
CPP and CPP-D clients, along with OAS/GIS clients, were less likely to have used a computer, and CPP and OAS/GIS clients were more likely to have completed their application at the counter with a Service Canada representative. EI clients were more likely to have used a computer.
Figure long description
In-person Application Completion
At the counter
TOTAL, 53%
EI, 45%
CPP, 67%, significnatly higher than a total
CPP-D, 46%, significantly lower than total
OAS/GIS, 76%, significnatly higher than total
At a computer
TOTAL, 29%
EI, 42%, significantly higher than total
CPP, 7%, significantly lower than total
CPP-D, 4%, significantly lower than total
OAS/GIS, 4%, significantly lower than total
DK
TOTAL, 18%
EI, 13%
CPP, 26%, significnatly higher than total
CPP-D, 49%, significantly higher than total
OAS/GIS, 20%
Q9dx. You indicated you went into a government office. Did you complete your application …?
Base: Completed an application in a government office (n=548)
Channel Use at Follow-Up Stage: by Program
Clients of all programs were most likely to have used the telephone channel at the follow-up stage. CPP, CPP-D, SIN and OAS/GIS clients were more likely to have used the mail channel compared to all clients. SIN clients were also more likely to have used the in-person channel.
Compared to 2021-22, channel use at the follow-up stage remained very consistent across each program.
Figure long description
Channel Use at Follow-Up Stage: by Program
Total
In-person
2017-18, 36%
2019-20, 30%
2020-21, 13%
2021-22, 19%
2022-23, 20%
Online
2017-18, 48%
2019-20, 56%
2020-21, 51%
2021-22, 56%
2022-23, 57%
Telephone
2017-18, 68%
2019-20, 68%
2020-21, 70%
2021-22, 73%
2022-23, 71%
Mail
2017-18, 10%
2019-20, 15%
2020-21, 15%
2021-22, 11%
2022-23, 11%
eServiceCanada
2020-21, 24%
2021-22, 21%
2022-23, 19%
EI
In-person
2017-18, 35%
2019-20, 40%
2020-21, 11%
2021-22, 17%
2022-23, 19%
Online
2017-18, 52%
2019-20, 62%
2020-21, 56%
2021-22, 59%
2022-23, 61%
Telephone
2017-18, 61%
2019-20, 75%
2020-21, 71%
2021-22, 79%
2022-23, 77%
Mail
2017-18, 7%
2019-20, 11%
2020-21, 9%
2021-22, 6%
2022-23, 6%, significnatly lower than total
eServiceCanada
2020-21, 25%
2021-22, 21%
2022-23, 20%
CPP
In-person
2017-18, 46%
2019-20, 38%
2020-21, 10%
2021-22, 19%
2022-23, 20%
Online
2017-18, 30%
2019-20, 43%
2020-21, 46%
2021-22, 49%
2022-23, 51%
Telephone
2017-18, 56%
2019-20, 53%
2020-21, 62%
2021-22, 58%
2022-23, 53%, significantly lower than total
Mail
2017-18, 20%
2019-20, 28%
2020-21, 20%
2021-22, 20%
2022-23, 24%, significantly higher than total
eServiceCanada
2020-21, 17%
2021-22, 17%
2022-23, 15%
CPP-D
In-person
2017-18, 26%
2019-20, 27%
2020-21, 13%
2021-22, 12%
2022-23, 16%, significantly lower than total
Online
2017-18, 22%
2019-20, 31%
2020-21, 35%
2021-22, 36%
2022-23, 44%
Telephone
2017-18, 68%
2019-20, 76%
2020-21, 73%
2021-22, 76%
2022-23, 73%
Mail
2017-18, 32%
2019-20, 24%
2020-21, 21%
2021-22, 23%
2022-23, 20%, significantly higher than total
eServiceCanada
2020-21, 22%
2021-22, 19%
2022-23, 18%
SIN
In-person
2017-18, 70%
2019-20, 56%
2020-21, 32%
2021-22, 36%
2022-23, 32%, significnatly higher than total
Online
2017-18, 42%
2019-20, 45%
2020-21, 47%
2021-22, 53%
2022-23, 48%
Telephone
2017-18, 53%
2019-20, 44%
2020-21, 69%
2021-22, 55%
2022-23, 48%, significantly lower than total
Mail
2017-18, 26%
2019-20, 39%
2020-21, 28%
2021-22, 34%
2022-23, 27%, significantly higher than total
eServiceCanada
2020-21, 34%
2021-22, 31%
2022-23, 24%
OAS/GIS
In-person
2017-18, 44%
2019-20, 39%
2020-21, 9%
2021-22, 18%
2022-23, 19%
Online
2017-18, 18%
2019-20, 40%
2020-21, 35%
2021-22, 46%
2022-23, 45%, significnatly lower than toal
Telephone
2017-18, 68%
2019-20, 37%
2020-21, 68%
2021-22, 61%
2022-23, 62%, significnatly lower than total
Mail
2017-18, 17%
2019-20, 24%
2020-21, 26%
2021-22, 20%
2022-23, 22%, significantly higher than total
eServiceCanada
2020-21, 12%
2021-22, 17%
2022-23, 16%
Q18. How did you contact the government before you were notified of a decision on your [INSERT ABBREV] application? Was it ...
Base: All respondents (n=varies)
Sequence Of Channel Use
Qualitative Highlights on Channel Preferences
Decisions related to which channel to use to complete the application process were determined by following several primary main factors:
Age
Awareness of GoC programs in general
Familiarity with the specific Service Canada program
Confidence (or lack thereof) in one’s ability to successfully complete the application process on their own
Previous positive experiences using the chosen service channel
Desire for convenience and expediency
Access to and comfort with the use of a computer.
I just prefer to do everything online. I work online, I bank online. Just everything is much easier. I wouldn’t want to spend time waiting in line in person anywhere, and the phones are very difficult to get through.
I was hoping to do it online. But then I realized it wasn’t an immediate response, I wouldn’t get an immediate SIN number, so I decided to in person because it would take some time before I got the SIN number.
It was just because we had the paperwork from the doctor, the paperwork that my wife filled out. It was easier for us to fill it out manually as oppose to doing it online and stuff. It was just the old-school way of doing it. We can see it, we can look at it and see our mistakes and change stuff.
In person, sit down in person. It’s confidence. I’m very suspicious of things online or phone calls.
Multi-Channel Use: Online Channel Usage In-Depth
Clients most often used the online channel first at the aware and apply stages, while online was the second most used channel at follow-up. Among those who used online first, clients were more likely to have used phone as a second channel at the follow-up stage and the apply stage, while use of phone and in-person was consistent as a second channel at the aware stage.
Compared to 2021-22, those who used the online channel first at the aware stage were more likely to have use phone or in-person as a second channel. Among those who used online first at the apply stage, clients were more likely to use phone as a second channel.
Figure long description
Aware
First Channel
Online
2022-23, 58%
2021-22, 56%
2020-21, 57%
2019-20, 42%
2017-18, 43%
Second Channel
Online to phone
2022-23, 14%, significnatly higher than previous wave
2021-22, 11%
2020-21, 12%
2019-20, 12%
2017-18, 14%
Online to In-person
2022-23, 12%, significantly higher than previous wave
2021-22, 8%
2020-21, 10%
2019-20, 19%
2017-18, 18%
Third Channel
Phone to In-person
2022-23, 14%%
2021-22, 14%
2020-21, 9%
2019-20, 21%
2017-18, 25%
In-person to Phone
2022-23, 8%
2021-22, 11%
2020-21, 9%
2019-20, 7%
2017-18, 19%
Apply
First Channel
Online
2022-23, 61%, significantly lower than previous wave
2021-22, 66%
2020-21, 68%
2019-20, 41%
2017-18, 44%
Second Channel
Online to phone
2022-23, 17%, significnatly higher than previous wave
In-person was the second most used channel as a first point of contact at the aware or apply stage and the least used as a first point of contact at the follow-up stage. Among those who used in-person first, clients were more likely to have used online as a second channel at the aware stage and follow-up stage and to a lesser extent at the apply stage.
Compared to 2021-22, clients were more likely to have used the in-person channel as a first point of contact at the aware and apply stages. Among those who used in-person first at the follow-up stage, clients were more likely to use online as a second channel.
Figure long description
Aware
First Channel
In-person
2022-23, 16%, significnatly higher than previous wave
2021-22, 14%
2020-21, 12%
2019-20, 28%
2017-18, 21%
Second Channel
In-person to Phone
2022-23, 5%
2021-22, 4%
2020-21, 7%
2019-20, 4%
2017-18, 8%
In-person to Online
2022-23, 24%
2021-22, 25%
2020-21, 22%
2019-20, 16%
2017-18, 11%
Third Channel
Phone to Online
2022-23, 6%
2021-22, 6%
2020-21, 7%
2019-20, 5%
2017-18, 9%
Online to Phone
2022-23, 9%
2021-22, 10%
2020-21, 6%
2019-20, 17%
2017-18, 29%
Apply
First Channel
In-person
2022-23, 26%, significantly higher than previous wave
2021-22, 22%
2020-21, 19%
2019-20, 49%
2017-18, 40%
Second Channel
In-person to phone
2022-23, 3%
2021-22, 3%
2020-21, 2%
2019-20, 4%
2017-18, 7%
In-person to online
2022-23, 9%
2021-22, 8%
2020-21, 8%
2019-20, 6%
2017-18, 13%
Third Channel
Phone to Online
2022-23, 1%
2021-22, 2%
2020-21, 1%
2019-20, 3%
2017-18, 10%
Online to Phone
2022-23, 14%
2021-22, 9%
2020-21, 9%
2019-20, 21%
2017-18, 15%
Follow-up
First channel
In-person
2022-23, 7%
2021-22, 6%
2020-21, 4%
2019-20, 18%
2017-18, 24%
Second channel
In-person to phone
2022-23, 25%
2021-22, 30%
2020-21, 23%
2019-20, 39%
2017-18, 28%
In-person to online
2022-23, 31%, significnatly higher than previous wave
Telephone continues to be the most common channel for the first point of contact at the follow-up stage and the least used first channel at the aware and apply stages. Among those who used telephone first, clients were more likely to use the online channel as a second channel at all stages.
Compared to 2021-22, use of telephone as the first point of contact remained consistent across all stages. Among those who used telephone first at the aware stage, clients were more likely to use online as a second channel and less likely to use in-person. Use of online also increased as a second channel at the apply stage.
Figure long description
Aware
First Channel
Phone
2022-23, 5%
2021-22, 4%
2020-21, 5%
2019-20, 5%
2017-18, 7%
Second channel
Phone to online
2022-23, 48%, significantly higher than previous wave
2021-22, 33%
2020-21, 44%
2019-20, 16%
2017-18, 23%
Phone to in-person
2022-23, 13%, significnatly lower than previous wave
2021-22, 21%
2020-21, 11%
2019-20, 30%
2017-18, 19%
Third Channel
Online to In-person
2022-23, 7%
2021-22, 6%
2020-21, 5%
2019-20, 6%
2017-18, 20%
In-person to online
2022-23, 8%
2021-22, 10%
2020-21, 5%
2019-20, 5%
2017-18, 3%
Apply
First Channel
Phone
2022-23, 3%
2021-22, 3%
2020-21, 3%
2019-20, 2%
2017-18, 6%
Second channel
Phone to online
2022-23, 53%, significnatly higher than previous wave
2021-22, 42%
2020-21, 41%
2019-20, 29%
2017-18, 30%
Phone to in-person
2022-23, 8%
2021-22, 11%
2020-21, 9%
2019-20, 27%
2017-18, 33%
Third Channel
Online to In-person
2022-23, 7%
2021-22, 6%
2020-21, 5%
2019-20, 14%
2017-18, 10%
In-person to online
2022-23, 6%
2021-22, 7%
2020-21, 5%
2019-20, 4%
2017-18, 6%
Follow-up
First Channel
Phone
2022-23, 41%
2021-22, 42%
2020-21, 42%
2019-20, 36%
2017-18, 38%
Second channel
Phone to online
2022-23, 24%
2021-22, 23%
2020-21, 14%
2019-20, 22%
2017-18, 14%
Phone to in-person
2022-23, 10%
2021-22, 11%
2020-21, 6%
2019-20, 25%
2017-18, 24%
Third Channel
Online to In-person
2022-23, 14%
2021-22, 10%
2020-21, 2%
2019-20, 10%
2017-18, 19%
In-person to online
2022-23, 23%
2021-22, 19%
2020-21, 21%
2019-20, 6%
2017-18, 11%
Questions 1a, 2, 3, 9bx, 10x, 11x, 18, 19a, 19b
Base: All respondents, base may vary by statement
Multiple Channel Use Proportions
Overall, just under four in ten clients used one channel during their client journey, followed by one-third who used two, just under two in ten who used three and 7% who used 4 or more. SIN clients were more likely to have used only one channel, OAS/GIS clients no channels (due to auto-enrolled clients who did not use any service channel), while EI clients were more likely to have used three channels and CPP-D clients three or more channels.
Compared to 2021-22, EI and SIN clients were less likely to have used one channel, with EI clients more likely to have used three channels and SIN clients two channels. OAS/GIS clients were less likely to have used no channels (due to a higher proportion who were non-auto enrolled this year).
Figure long description
Proportions Overall and By Program – Trending
Total
2022-23, n=4200
No channel, 5%
1 channel, 38%, significantly lower than previous wave
2 channels, 33%, significnatly higher than previous wave
3 channels, 16%
4+ channels, 7%
2021-22, n=4200
No channel, 6%
1 channel, 42%
2 channels, 30%
3 channels, 14%
+4 channels, 7%
2020-21, m=4200
No channel, 6%
1 channel, 44%
2 channels, 30%
3 channels, 13%
+4 channels, 6%
EI
2022-23, n=1035
No channel, 0%, significantly lower than total
1 channel, 37%, significnatly lower than previous wave
2 channels, 35%
3 channels, 20%, significantly higher than total, significantly higher than previous wave
4+ channels, 8%
2021-22, n=987
No channel, 1%
1 channel, 43%
2 channels, 32%
3 channels, 16%
+4 channels, 8%
2020-21, n=1162
No channel, 1%
1 channel, 49%
2 channels, 30%
3 channels, 14%
+4 channels, 6%
CPP
2022-23, n=768
No channel, 2%, significnatly lower than total
1 channel, 41%
2 channels, 34%
3 channels, 15%
4+ channels, 7%
2021-22, n=768
No channel, 3%
1 channel, 42%
2 channels, 35%
3 channels, 15%
+4 channels, 6%
2020-21, n=752
No channel, 5%
1 channel, 41%
2 channels, 33%
3 channels, 13%
+4 channels, 7%
CPP-D
2022-23, n=752
No channel, 4%
1 channel, 24%
2 channels, 30%
3 channels, 27%, significnatly higher than total
4+ channels, 15%, significantly higher than total
2021-22, n=761
No channel, 4%
1 channel, 28%
2 channels, 30%
3 channels, 26%
+4 channels, 12%
2020-21, n=692
No channel, 3%
1 channel, 32%
2 channels, 34%
3 channels, 20%
+4 channels, 10%
SIN
2022-23, n=783
No channel, 3%, significantly lower than total, significantly higher than previous wave
1 channel, 44%, significantly higher than total, significantly lower than previous wave
2 channels, 35%, significantly higher than previous wave
3 channels, 13%, significantly lower than total
4+ channels, 6%
2021-22, n=875
No channel, 1%
1 channel, 50%
2 channels, 28%
3 channels, 14%
+4 channels, 7%
2020-21, n=749
No channel, 1%
1 channel, 45%
2 channels, 32%
3 channels, 14%
+4 channels, 7%
OAS/GIS
2022-23, n=862
No channel, 38%, significantly higher than total, significantly lower than previous wave
1 channel, 26%, significantly lower than total
2 channels, 19%, significantly lower than total
3 channels, 11%, significnatly lower than total
4+ channels, 5%, significantly lower than total
2021-22, n=809
No channel, 48%
1 channel, 22%
2 channels, 19%
3 channels, 8%
+4 channels, 3%
2020-21, n=845
No channel, 43%
1 channel, 23%
2 channels, 24%
3 channels, 6%
+4 channels, 4%
Base: All respondents (n=4200)
Impact of Multiple Channel Use
Clients who utilized three or more channels had lower overall satisfaction with their service experience compared to all clients, while those who used one channel had higher satisfaction.
Compared to 2021-22, satisfaction has increased among those who used two channels.
Figure long description
Satisfaction by Number of Channels Used – Trending
Total
2022-23, 83%, significantly higher than previous wave
2021-22, 81%
2020-21, 86%
No channel
2022-23, 85%
2021-22, 83%
2020-21, 88%
1 Channel
2022-23, 88%, significnatly higher than total
2021-22, 86%
2020-21, 89%
2 Channels
2022-23, 83%, significnatly higher than previous wave
2021-22, 78%
2020-21, 85%
3 Channels
2022-23, 78%, significantly lower than total
2021-22, 76%
2020-21, 80%
+4 Channels
2022-23, 71%, significnatly lower than total
2021-22, 69%
2020-21, 81%
Base: All respondents (n=4200)
Reason for Follow-Up: Overall
A higher proportion of clients reported following-up with Service Canada before receiving a decision compared to 2021-22 (41% vs. 37%). Among those who did, the primary reason continued to be to check on the status of their application/payment, followed by to provide additional information.
Compared to 2021-22, clients were more likely to have followed-up to check on the status of their application/payment or provide additional information.
Figure long description
Reason for Follow-Up: Overall
Check on the status of your application
2022-23, 29%, significantly higher than previous wave
2021-22, (n=3740), 25%
2020-21 (n=3838), 23%
2019-20 (n=2148), 21%
2017-18 (n=3405), 28%
Provide additional information about your application
2022-23, 17, significantly higher than previous wave%
2021-22, (n=3740), 14%
2020-21 (n=3838), 12%
2019-20 (n=2148), 17%
2017-18 (n=3405), 13%
For any other reason
2022-23, 9%
2021-22, (n=3740), 8%
2020-21 (n=3838), 6%
2019-20 (n=2148), 7%
2017-18 (n=3405), 7%
No follow-up
2022-23, 59%, significantly lower than previous wave
2021-22, (n=3740), 63%
2020-21 (n=3838), 66%
2019-20 (n=2148), 54%
2017-18 (n=3405), 59%
Q17. Before you received a decision, did you contact Service Canada to … (select all that apply).
Base: Completed an application (n=3736)
Reason for Follow-up: by Program
EI and CPP-D clients were more likely to have followed-up compared to all clients, while CPP, OAS/GIS and SIN clients were less likely.
Compared to 2021-22, EI clients were more likely to have followed-up to provide additional information, while OAS/GIS clients were more likely to have followed-up to check on the status of their application/ payment.
Figure long description
Reason for Follow-up: by Program
Check on the status of your application/payment
TOTAL
2017-18, 28%
2019-20, 31%
2020-21, 23%
2021-22, 25%
2022-23, 29%, significantly higher than previous wave
EI
2017-18, 39%
2019-20, 41%
2020-21, 28%
2021-22, 33%
2022-23, 38%, significnatly higher than total
CPP
2017-18, 17%
2019-20, 15%
2020-21, 17%
2021-22, 17%
2022-23, 20%, significantly lower than total
CPP-D
2017-18, 34%
2019-20, 40%
2020-21, 29%
2021-22, 40%
2022-23, 44%, significantly higher than total
OAS/GIS
2017-18, 32%
2019-20, 29%
2020-21, 10%
2021-22, 8%
2022-23, 12%, significantly lower than total, significantly higher than previous wave
SIN
2017-18, 11%
2019-20, 25%
2020-21, 20%
2021-22, 14%
2022-23, 16%, significantly lower than total
Provide additional information about your application
TOTAL
2017-18, 13%
2019-20, 17%
2020-21, 12%
2021-22, 14%
2022-23, 17%, significnatly higher than previous wave
EI
2017-18, 16%
2019-20, 21%
2020-21, 13%
2021-22, 19%
2022-23, 23%, significantly higher than total, significantly higher than previous wave
CPP
2017-18, 10%
2019-20, 8%
2020-21, 9%
2021-22, 9%
2022-23, 9%, significantly lower than total
CPP-D
2017-18, 21%
2019-20, 23%
2020-21, 17%
2021-22, 21%
2022-23, 22%, significnatly higher than total
OAS/GIS
2017-18, 11%
2019-20, 9%
2020-21, 13%
2021-22, 10%
2022-23, 11%, significnatly lower than total
SIN
2017-18, 7%
2019-20, 9%
2020-21, 9%
2021-22, 6%
2022-23, 8%, significnatly lower than total
For any other reason
TOTAL
2017-18, 7%
2019-20, 7%
2020-21, 6%
2021-22, 8%
2022-23, 9%
EI
2017-18, 9%
2019-20, 9%
2020-21, 7%
2021-22, 11%
2022-23, 12%, significnatly higher than total
CPP
2017-18, 6%
2019-20, 5%
2020-21, 4%
2021-22, 8%
2022-23, 7%
CPP-D
2017-18, 11%
2019-20, 6%
2020-21, 6%
2021-22, 11%
2022-23, 10%
OAS/GIS
2017-18, 7%
2019-20, 2%
2020-21, 4%
2021-22, 3%
2022-23, 4%, significantly lower than total
SIN
2017-18, 3%
2019-20, 11%
2020-21, 4%
2021-22, 3%
2022-23, 4%, significantly lower than total
No follow-up
TOTAL
2017-18, 59%
2019-20, 54%
2020-21, 66%
2021-22, 63%
2022-23, 59%, significantly lower than previous wave
EI
2017-18, 46%
2019-20, 47%
2020-21, 62%
2021-22, 55%
2022-23, 50%, significantly lower than total
CPP
2017-18, 71%
2019-20, 72%
2020-21, 74%
2021-22, 72%
2022-23, 71%, significnatly higher than total
CPP-D
2017-18, 49%
2019-20, 47%
2020-21, 58%
2021-22, 50%
2022-23, 45%, significantly lower than total
OAS/GIS
2017-18, 57%
2019-20, 63%
2020-21, 69%
2021-22, 72%
2022-23, 70%, significnatly higher than total
SIN
2017-18, 78%
2019-20, 63%
2020-21, 71%
2021-22, 80%
2022-23, 76%, significantly higher than total
Client Experience With Service Channels
Satisfaction by Service Channel: Overall (% Rated 4 or 5)
Satisfaction with in-person service remained the highest, followed by online, MSCA, specialized call centres, eService Canada and 1 800 O-Canada.
Compared to 2021-22, satisfaction increased for specialized call centres and 1 800 O-Canada and returned to levels observed in 2020-21. Satisfaction with all other service channels remained consistent, however ratings for eServiceCanada declined directionally for the second consecutive year and were significantly lower than in 2020-21.
Figure long description
Satisfaction with Service Channels (% Rated 4 or 5) – Trending
In-person
2017-18, (n=1324), 89%
2018-19, (n=2181), 87%
2019-20, (n=1245), 86%
2020-21, (n=1102), 86%
2021-22, (n=1226), 81%
2022-23, (n=1471), 83%
My Service Canada Account
2019-20, (n=576), 75%
2020-21, (n=848), 75%
2021-22, (n=603), 70%
2022-23, (n=989), 73%
1 800 O-Canada
2018-19, (n=561), 72%
2019-20, (n=221), 69%
2020-21, (n=315), 72%
2021-22, (n=147), 59%
2022-23, (n=334), 70%, significnatly higher than previous wave
Specialized Call Centre
2017-18, (n=511), 82%
2018-19, (n=855), 76%
2019-20, (n=642), 60%
2020-21, (n=1208), 72%
2021-22, (n=789), 64%
2022-23, (n=1281), 72%, significantly higher than previous wave
eServiceCanada
2020-21, (n=455), 82%
2021-22, (n=399), 76%
2022-23, (n=518), 72%
ǂ Excludes SIN clients
Q27. How satisfied were you with the overall quality of service you received from …
Base: All respondents (n=Base Varies)
Compared to 2021-22, satisfaction increased for specialized call centres and returned to levels observed in 2020-21. A higher proportion rated their satisfaction a 5 out of 5 for specialized call centres and 4 out of 5 for 1 800 O-Canada compared to last year, while there has also been an increase in those who rated their satisfaction 1 out of 5 (“very dissatisfied”) for eServiceCanada.
Figure long description
Satisfaction with Service Cannels – Trending
In-Person
2022-23, (n=1471)
5 – very satisfied, 63%
Rated 4, 21%
Rated 3, 9%
Rated 2, 4%
1 – very dissatisfied, 3%
2021-22 (n=1295)
5 - Very satisfied, 58%
Rated 4, 23%
Rated 3, 12%
Rated 2, 3%
1 - Very dissatisfied, 3%
2020-21 (n=1102)
5 - Very satisfied, 68%
Rated 4, 18%
Rated 3, 7%
Rated 2, 2%
1 - Very dissatisfied, 3%
2019-20 (n=1235)
5 - Very satisfied, 62%
Rated 4, 24%
Rated 3, 7%
Rated 2, 3%
1 - Very dissatisfied, 2%
2018-19 (n=2181)
5 - Very satisfied, 61%
Rated 4, 26%
Rated 3, 8%
Rated 2, 2%
1 - Very dissatisfied, 2%
2017-18 (n=1324)
5 - Very satisfied, 68%
Rated 4, 21%
Rated 3, 8%
Rated 2, 2%
1 - Very dissatisfied, 2%
Online
2022-23, (n=2643)
5 – very satisfied, 44%
Rated 4, 31%
Rated 3, 17%
Rated 2, 5%
1 – very dissatisfied, 3%
2021-22 (n=2643),
5 - Very satisfied, 43%
Rated 4, 32%
Rated 3, 17%
Rated 2, 4%
1 - Very dissatisfied, 4%
2020-21 (n=2680),
5 - Very satisfied, 47%
Rated 4, 31%
Rated 3, 15%
Rated 2, 4%
1 - Very dissatisfied, 2%
2019-20 (n=1227),
5 - Very satisfied, 41%
Rated 4, 32%
Rated 3, 17%
Rated 2, 5%
1 - Very dissatisfied, 3%
2018-19 (n=2317),
5 - Very satisfied, 43%
Rated 4, 36%
Rated 3, 14%
Rated 2, 4%
1 - Very dissatisfied, 2%
2017-18 (n=1089),
5 - Very satisfied, 47%
Rated 4, 32%
Rated 3, 13%
Rated 2, 4%
1 - Very dissatisfied, 3%
My Service Canada Account
2022-23, (n=989)
5 – very satisfied, 41%
Rated 4, 32%
Rated 3, 15%
Rated 2, 4%
1 – very dissatisfied, 6%
2021-22 (n=904),
5 - Very satisfied, 40%
Rated 4, 30%
Rated 3, 16%
Rated 2, 8%
1 - Very dissatisfied, 5%
2020-21 (n=848),
5 - Very satisfied, 44%
Rated 4, 31%
Rated 3, 16%
Rated 2, 5%
1 - Very dissatisfied, 3%
2019-20 (n=576),
5 - Very satisfied, 45%
Rated 4, 30%
Rated 3, 16%
Rated 2, 5%
1 - Very dissatisfied, 3%
Specialized Call Centreǂ
2022-23, (n=1281)
5 – very satisfied, 43%, significantly higher than previous wave
Rated 4, 29%
Rated 3, 14%, significnatly lower than previous wave
Rated 2, 6%
1 – very dissatisfied, 6%
2021-22 (n=1197),
5 - Very satisfied, 36%
Rated 4, 28%
Rated 3, 19%
Rated 2, 7%
1 - Very dissatisfied, 8%
2020-21 (n=1208),
5 - Very satisfied, 48%
Rated 4, 24%
Rated 3, 14%
Rated 2, 6%
1 - Very dissatisfied, 7%
2019-20 (n=642),
5 - Very satisfied, 36%
Rated 4, 24%
Rated 3, 17%
Rated 2, 12%
1 - Very dissatisfied, 9%
2018-19 (n=855),
5 - Very satisfied, 46%
Rated 4, 27%
Rated 3, 15%
Rated 2, 5%
1 - Very dissatisfied, 6%
2017-18 (n=511),
5 - Very satisfied, 54%
Rated 4, 28%
Rated 3, 12%
Rated 2, 4%
1 - Very dissatisfied, 3%
eServiceCanada
2022-23, (n=518)
5 – very satisfied, 49%
Rated 4, 23%
Rated 3, 12%
Rated 2, 4%
1 – very dissatisfied, 8%, significnatly higher than previous wave
2021-22 (n=504),
5 - Very satisfied, 54%
Rated 4, 22%
Rated 3, 11%
Rated 2, 3%
1 - Very dissatisfied, 4%
2020-21 (n=455),
5 - Very satisfied, 65%
Rated 4, 17%
Rated 3, 9%
Rated 2, 3%
1 - Very dissatisfied, 2%
1 800 O-Canada
2022-23, (n=334)
5 – very satisfied, 40%
Rated 4, 30%, significnatly higher than previous wave
Rated 3, 17%
Rated 2, 7%
1 – very dissatisfied, 5%
2021-22 (n=303),
5 - Very satisfied, 40%
Rated 4, 19%
Rated 3, 25%
Rated 2, 3%
1 - Very dissatisfied, 11%
2020-21 (n=315),
5 - Very satisfied, 47%
Rated 4, 25%
Rated 3, 16%
Rated 2, 7%
1 - Very dissatisfied, 3%
2019-20 (n=221),
5 - Very satisfied, 48%
Rated 4, 15%
Rated 3, 20%
Rated 2, 2%
1 - Very dissatisfied, 12%
2018-19 (n=561),
5 - Very satisfied, 41%
Rated 4, 29%
Rated 3, 15%
Rated 2, 7%
1 - Very dissatisfied, 7%
ǂ Excludes SIN clients
Q27. How satisfied were you with the overall quality of service you received from …
Base: All respondents (n=Base Varies)
Satisfaction with Service Channels: by Program
Satisfaction with service channels continued to differ by program: CPP-D clients rated their satisfaction with in-person service, specialized call centres and online lower compared to all clients, EI clients for in-person service and OAS/GIS clients for online and MSCA. SIN clients provided higher ratings for in-person and online.
Compared to 2021-22, EI clients provided higher ratings for their satisfaction with specialized call centres, CPP-D clients provided higher ratings for eServiceCanada and SIN clients for in-person service.
Figure long description
Satisfaction with Service Channels: by Program
EI
In-person
2017-18, 80%
2018-19, 80%
2019-20, 82%
2020-21, 77%
2021-22, 73%
2022-23, 73%, significnatly lower than total
My Service Canada Account
2019-20, 75%
2020-21, 76%
2021-22, 69%
2022-23, 75%
Online
2017-18, 79%
2018-19, 79%
2019-20, 71%
2020-21, 77%
2021-22, 71%
2022-23, 72%
1 800 O-Canada
2018-19, 70%
2019-20, 62%
2020-21, 68%
2021-22, 52%
2022-23, 66%
Specialized Call Centre
2017-18, 85%
2018-19, 74%
2019-20, 59%
2020-21, 70%
2021-22, 63%
2022-23, 71%, significnatly higher than previous wave
eServiceCanada
2020-21, 81%
2021-22, 74%
2022-23, 68%
CPP
In-person
2017-18, 87%
2018-19, 90%
2019-20, 86%
2020-21, 83%
2021-22, 86%
2022-23, 84%
My Service Canada Account
2019-20, 76%
2020-21, 74%
2021-22, 71%
2022-23, 73%
Online
2017-18, 80%
2018-19, 76%
2019-20, 73%
2020-21, 74%
2021-22, 68%
2022-23, 72%
1 800 O-Canada
2018-19, 77%
2019-20, 71%
2020-21, 68%
2021-22, 67%
2022-23, 71%
Specialized Call Centre
2017-18, 74%
2018-19, 80%
2019-20, 67%
2020-21, 81%
2021-22, 74%
2022-23, 78%
eServiceCanada
2020-21, 82%
2021-22, 76%
2022-23, 64%
CPP-D
In-person
2017-18, 72%
2018-19, 68%
2019-20, 72%
2020-21, 64%
2021-22, 67%
2022-23, 65%, significnatly lower than total
My Service Canada Account
2019-20, 59%
2020-21, 52%
2021-22, 69%
2022-23, 70%
Online
2017-18, 53%
2018-19, 59%
2019-20, 53%
2020-21, 59%
2021-22, 54%
2022-23, 56%, significnatly lower than total
1 800 O-Canada
2018-19, 61%
2019-20, 63%
2020-21, 52%
2021-22, 66%
2022-23, 66%
Specialized Call Centre
2017-18, 72%
2018-19, 64%
2019-20, 58%
2020-21, 59%
2021-22, 59%
2022-23, 62%, significnatly lower than total
eServiceCanada
2020-21, 66%
2021-22, 49%
2022-23, 73%, significnatly higher than previous wave
SIN
In-person
2017-18, 95%significantly higher than total, significantly higher than previous wave
2018-19, 94%
2019-20, 90%
2020-21, 91%
2021-22, 85%
2022-23, 90%
Online
2017-18, 82%
2018-19, 84%
2019-20, 83%
2020-21, 84%
2021-22, 87%
2022-23, 86%, significnatly higher than total
1 800 O-Canada
2018-19, 78%
2019-20, 88%
2020-21, 90%
2021-22, 66%
2022-23, 81%
eServiceCanada
2020-21, 89%
2021-22, 82%
2022-23, 83%
OAS/GIS
In-person
2017-18, 84%
2018-19, 84%
2019-20, 87%
2020-21, 84%
2021-22, 77%
2022-23, 78%
My Service Canada Account
2019-20, 75%
2020-21, 66%
2021-22, 66%
2022-23, 59%
Online
2017-18, 79%
2018-19, 74%
2019-20, 73%
2020-21, 78%
2021-22, 66%
2022-23, 64%
1 800 O-Canada
2018-19, 73%
2019-20, 65%
2020-21, 67%
2021-22, 67%
2022-23, 68%
Specialized Call Centre
2017-18, 76%
2018-19, 79%
2019-20, 64%
2020-21, 76%
2021-22, 73%
2022-23, 74%
eServiceCanada
2020-21, 61%
2021-22, 65%
2022-23, 79%
* Small sample size. Results should be interpreted with caution.
Q27. How satisfied were you with the overall quality of service you received from …
Base: All respondents (n=Base Varies)
Ease of Navigating Government of Canada Website: Overall
Clients were most likely to feel it was easy to find out the steps to apply, find information about the program and find out what information they need to provide when applying. Ratings remained lower for the ease of deciding the best age to start their pension (among relevant programs).
Compared to 2021-22, ratings have remained consistent across all aspects of the ease of navigating the Government of Canada (GoC) website.
Figure long description
% Rated 4 or 5
Find out the steps to apply
2022-21, 79%
2021-22, 76%
2020-21, 77%
2019-20, 81%
2017-18, 80%
Find information about [ABBREV]
2022-21, 78%
2021-22, 78%
2020-21, 78%
2019-20, 78%
2017-18, 79%
Find out what information you need to provide when applying for program
2022-21, 77%
2021-22, 76%
2020-21, 77%
2019-20, 80%
2017-18, 78%
Understand the information about program
2022-21, 75%
2021-22, 74%
2020-21, 78%
2019-20, 76%
2017-18, 76%
Figure out if you are eligible for benefits/ SIN card
2022-21, 73%
2021-22, 74%
2020-21, 76%
2019-20, 71%
2017-18, 76%
Decide the best age to start your pension
2022-21, 62%
2021-22, 64%
2020-21, 66%
2019-20, 72%
Agree able to find the information you needed (online, in person or by phone) within a reasonable amount of time
2022-21, 76%
2021-22, 74%,
2020-21, 78%
2019-20, 75%
2017-18, 78%
Q6. When you were looking for information about [INSERT ABBREV] on the Government of Canada website, how difficult or easy was it to …? Please use a scale of 1 to 5, where 1 was very difficult and 5 was very easy, how would you rate…?
Base: Those who used the Government of Canada W\website (n=varies)
Q7. How much do you agree or disagree that you were able to find the information you needed (online, in person or by phone) within a reasonable amount of time? Please use a scale of 1 to 5, where 1 is strongly disagree and 5 is strongly agree.
Base: Those who used the Government of Canada website (n=2877)
Ease of Using Government of Canada Website
Figure long description
Ease of Using Government of Canada Website
Find out the steps to apply
Very easy, 45%
Easy, 34%
Neutral, 14%
Difficult, 4%
Very difficult, 2%
Rated 4 or 5
2022-23, 79%
2021-22, 76%
2020-21, 77%
2019-20, 81%
2017-18, 80%
Find information about program
Very easy, 43%
Easy, 35%
Neutral, 15%
Difficult, 4%
Very difficult, 2%
Rated 4 or 5
2022-23, 78%
2021-22, 78%
2020-21, 78%
2019-20, 78%
2017-18, 79%
Find out what information you need to provide when applying for program
Very easy, 45%
Easy, 32%
Neutral, 15%
Difficult, 5%
Very difficult, 2%
Rated 4 or 5
2022-23, 77%
2021-22, 76%
2020-21, 77%
2019-20, 80%
2017-18, 78%
Understand the information about program
Very easy, 41%
Easy, 34%
Neutral, 18%
Difficult, 5%
Very difficult, 2%
Rated 4 or 5
2022-23, 75%
2021-22, 74%
2020-21, 78%
2019-20, 76%
2017-18, 76%
Figure out if you were eligible for benefits
Very easy, 46%
Easy, 26%
Neutral, 17%
Difficult, 5%
Very difficult, 4%
Rated 4 or 5
2022-23, 73%
2021-22, 74%
2020-21, 76%
2019-20, 71%
2017-18, 75%
Decide the best age to start your pension
Very easy, 39%
Easy, 23%
Neutral, 19%
Difficult, 7%
Very difficult, 5%
Rated 4 or 5
2022-23, 62%
2021-22, 64%
2020-21, 66%
2019-20, 72%
Q6. When you were looking for information about on the Government of Canada website, how easy or difficult was it to…? Please use a scale of 1 to 5, where 1 was very difficult and 5 was very easy, how would you rate…?
Base: All answering (n=2127)
Ease of Navigating Government of Canada Website: by Program
SIN clients were more likely to provide high ratings for all aspects of the ease of looking for information on the GoC website compared to all clients, while CPP-D clients were less likely. EI clients were less likely to feel it was easy to figure out eligibility, while CPP and OAS/GIS clients were more likely. OAS/GIS clients were less likely to feel it was easy to understand information about the program and find out the steps to apply.
Compared to 2021-22, ratings are consistent across all aspects of the ease of looking for information on the GoC website.
Figure long description
Ease of Navigating Government of Canada Website: by Program
Find out the steps to apply
TOTAL
2017-18, 80%
2019-20, 81%
2020-21, 77%
2021-22, 76%
2022-23, 79%
EI
2017-18, 80%
2019-20, 82%
2020-21, 74%
2021-22, 74%
2022-23, 78%
CPP
2017-18, 78%
2019-20, 81%
2020-21, 77%
2021-22, 73%
2022-23, 77%
CPP-D
2017-18, 62%
2019-20, 58%
2020-21, 60%
2021-22, 57%
2022-23, 59%, significantly lower than total
SIN
2017-18, 83%
2019-20, 81%
2020-21, 85%
2021-22, 82%
2022-23, 85%, significnatly higher than total
OAS/GIS
2017-18, 76%
2019-20, 76%
2020-21, 80%
2021-22, 72%
2022-23, 71%, signifIcantly lower than t
Find information about [PROGRAM ABBREV]
TOTAL
2017-18, 78%
2019-20, 78%
2020-21, 78%
2021-22, 78%
2022-23, 78%
EI
2017-18, 78%
2019-20, 77%
2020-21, 74%
2021-22, 74%
2022-23, 76%
CPP
2017-18, 76%
2019-20, 82%
2020-21, 76%
2021-22, 76%
2022-23, 75%
CPP-D
2017-18, 58%
2019-20, 57%
2020-21, 63%,
2021-22, 55%
2022-23, 58%, significnatly lower than toal
SIN
2017-18, 85%
2019-20, 81%
2020-21, 86%
2021-22, 87%
2022-23, 87%, significnatly higher than total
OAS/GIS
2017-18, 72%
2019-20, 76%
2020-21, 75%
2021-22, 72%
2022-23, 74%
Find out what information need to provide when applying for program
TOTAL
2017-18, 78%
2019-20, 80%
2020-21, 77%
2021-22, 76%
2022-23, 77%
EI
2017-18, 76%
2019-20, 80%
2020-21, 75%
2021-22, 74%
2022-23, 75%
CPP
2017-18, 78%
2019-20, 81%
2020-21, 78%
2021-22, 74%
2022-23, 76%
CPP-D
2017-18, 57%
2019-20, 55%
2020-21, 62%
2021-22, 54%
2022-23, 58%, significantly lower than total
SIN
2017-18, 84%
2019-20, 81%
2020-21, 83%
2021-22, 84%
2022-23, 84%, significnatly higher than total
OAS/GIS
2017-18, 75%
2019-20, 83%
2020-21, 72%
2021-22, 66%
2022-23, 72%
Understand the information about program
TOTAL
2017-18, 76%
2019-20, 76%
2020-21, 78%
2021-22, 74%
2022-23, 75%
EI
2017-18, 75%
2019-20, 72%
2020-21, 75%
2021-22, 69%
2022-23, 73%
CPP
2017-18, 73%
2019-20, 84%
2020-21, 76%
2021-22, 73%
2022-23, 74%
CPP-D
2017-18, 52%
2019-20, 48%
2020-21, 60%
2021-22, 48%
2022-23, 55%, significnatly lower than total
SIN
2017-18, 84%
2019-20, 86%
2020-21, 86%
2021-22, 87%
2022-23, 84%, significnatly higher than total
OAS/GIS
2017-18, 69%
2019-20, 82%
2020-21, 84%
2021-22, 67%
2022-23, 68%, significnatly lower than total
Figure out if you are eligible for benefits/SIN card
TOTAL
2017-18, 75%
2019-20, 71%
2020-21, 76%
2021-22, 74%
2022-23, 73%
EI
2017-18, 72%
2019-20, 66%
2020-21, 72%
2021-22, 69%
2022-23, 68%, significantly lower than total
CPP
2017-18, 79%
2019-20, 83%
2020-21, 80%
2021-22, 81%
2022-23, 78%, significantly higher than total
CPP-D
2017-18, 43%
2019-20, 39%
2020-21, 46%
2021-22, 44%
2022-23, 42%, significnatly lower than total
SIN
2017-18, 80%
2019-20, 81%
2020-21, 82%
2021-22, 84%
2022-23, 82%, significantly higher than total
OAS/GIS
2017-18, 72%
2019-20, 84%
2020-21, 82%
2021-22, 73%
2022-23, 80%, significantly higher than total
Decide the best age to start your pension
TOTAL
2019-20, 72%
2020-21, 66%
2021-22, 64%
2022-23, 62%
CPP
2019-20, 72%
2020-21, 64%
2021-22, 63%
2022-23, 62%
OAS/GIS
2019-20, 74%
2020-21, 71%
2021-22, 67%
2022-23, 63%
Agree able to find the information you needed (online, in person or by phone) within a reasonable amount of time
TOTAL
2017-18, 78%
2019-20, 75%
2020-21, 78%
2021-22, 74%
2022-23, 76%
EI
2017-18, 77%
2019-20, 70%
2020-21, 73%
2021-22, 69%
2022-23, 74%
CPP
2017-18, 76%
2019-20, 81%
2020-21, 79%
2021-22, 72%
2022-23, 74%
CPP-D
2017-18, 58%
2019-20, 53%
2020-21, 61%
2021-22, 55%
2022-23, 61%, significnatly lower than totall
SIN
2017-18, 83%
2019-20, 80%
2020-21, 87%
2021-22, 83%
2022-23, 82%, significantly higher than total
OAS/GIS
2017-18, 72%
2019-20, 80%
2020-21, 76%
2021-22, 71%
2022-23, 74%
Q6. When you were looking for information about [INSERT ABBREV] on the Government of Canada website, how easy or difficult was it to …? Please use a scale of 1 to 5, where 1 was very difficult and 5 was very easy, how would you rate…?
Base: Those who used the Government of Canada W\website (n=varies)
Q7. How much do you agree or disagree that you were able to find the information you needed (online, in person or by phone) within a reasonable amount of time? Please use a scale of 1 to 5, where 1 is strongly disagree and 5 is strongly agree.
Base: Those who used the Government of Canada W\website (n=varies)
Reported Increased Ease Provided by Digital Services
More than eight in ten clients agreed that being able to complete steps online made the process easier.
EI clients were more likely to agree compared to all clients, while CPP, OAS/GIS and CPP-D clients were less likely.
Compared to 2021-22, ratings have increased among EI clients.
Figure long description
Being Able to Complete Steps Online Made The Process Easier For You *% Rated 4 or 5) – Trending
Total
2017-18, n=1573, 810%
2018-19, n=1797, 82%
2019-20, n=1141, 82%
2020-21, n=2719, 84%
2021-22, n=2135, 82%
2022-23, n=2721, 81%
EI
2017-18, n=604, 84%
2018-19, n=833, 87%
2019-20, n=571, 86%
2020-21, n=1103, 88%
2021-22, n=936, 86%
2022-23, n=981, 89%, significantly higher than total, significantly higher than previous wave
CPP
2017-18, n=337, 64%
2018-19, n=474, 69%
2019-20, n=269, 73%
2020-21, n=516, 75%
2021-22, n=558, 72%
2022-23, n=542, 73%, significantly lower than total
CPP-D
2017-18, n=292, 47%
2018-19, n=349, 40%
2019-20, n=200, 51%
2020-21, n=368, 56%
2021-22, n=420, 52%
2022-23, n=466, 52%, significnatly lower than total
OAS/GIS
2017-18, n=337, 58%
2018-19, n=141, 47%
2019-20, n=101, 67%
2020-21, n=214, 69%
2021-22, n=221, 65%
2022-23, n=280, 71%, significantly lower than total
Q36b. Thinking about the overall service you received, from getting information about [INSERT ABBREV] to receiving a decision, how much do you agree or disagree with the following statements, using a 5-point scale (where 1 means strongly disagree, and 5 means strongly agree)?
Note: Tracking data for “Being able to complete the steps online made the process easier for you” recalculated to be consistent with 2022-23, asked only to those who had used an online channel.
Online Channel
Among those who went online at the aware stage, more than nine in ten were able to find the information they were looking for on the Government of Canada website. Six in ten were able to completely find the information they sought and one-third somewhat.
Results were consistent with 2021-22.
Figure long description
Able to Find Information on government of Canada Website (% Yes) – Trending
YES (NET)
2017-18, n=1419, 86%
2019-20, n=949, 86%
2020-21, n=2016, 93%
2021-22, n=2014, 92%
2022-23, n=2127, 93%
Yes, completely
2020-21, 60%
2021-22, 61%
2022-23, 61%
Yes, somewhat
2020-21, 33%
2021-22, 31%
2022-23, 32%
Note: In waves prior to 2020-21, response options included Yes or No only.
Q4. Did you get what you wanted from the Government of Canada website when you were looking for information on [INSERT ABBREV] before you applied?
Base: All answering (n=2127)
Qualitative Highlights on Online Service Channel
Participants who had visited program websites for more information reported mixed experiences. On the one hand, some felt that the websites were easy to find, provided clear information on the steps to apply and experienced no issues with navigation.
Others, meanwhile, described challenges such as reconciling the general eligibility information provided to their own unique circumstances; the verbose way of eligibility and required documentation for applications; and lack of clarity of how to apply online.
Most EI participants did not experience issues with the online application portal. The small number that did highlighted: confusing language, too many webpages and the inconvenience of having to use an online portal to apply then MSCA to check on progress.
I googled and I came up with the right place […] it said ‘income supplements’. […] I opened it and it explained everything, telling me what I could expect if I was in the right income bracket. So it was pretty helpful when I got on the site. It was quite easy
If I go on the website, I would prefer to see a simple six-point list over there that, hey, this is what you need to have in person, original, not a photocopy. That’s it, and that’s enough. But still, they mention huge paragraphs, and nobody is ready to read a huge paragraph nowadays. It just becomes too complicated.
So you go to a website and it asks you to sign in, and then it doesn't remember your password. And then you send a password, and then you get it, and then you finally sign in. And then it goes through a confirmation button, and then you have to read another thing and agree to the terms and services. Then you have to go to a website that says, okay, "What language do you want to be in?". And then you have to go to another button that then has more terms and conditions. And then you have to go to another button that says, "Describe your current situation". And none of them are exact and then you have to...like, it's just, it's not set up to say, let's do this, it's set up to be a process of data collection that's perhaps been folded together from 40 different people who clearly did not work together
Ease When Applying: Overall
More than eight in ten clients agreed they were able to complete the application in a reasonable amount of time.
Clients were most likely to find it easy to complete the application form, followed by understand the requirement of the application and put together the information needed to apply. Ratings remained lower for the ease of getting help on their application.
Compared to 2021-22, ratings have increasing for being able to complete the application in a reasonable amount of time and the ease of getting help on their application.
Figure long description
Ease When Applying: Overall
Agree able to complete application in a reasonable amount of time
2022-23, 84%, significnatly higher than previous wave
2021-22, n=3795, 81%
2020-21, n=3797, 83%
2019-20, n=2431, 84%
2017-18, n=3405, 82%
Completing the application form
2022-23, 85%
2021-22, n=3795, 82%
2020-21, n=3797, 84%
2019-20, n=2431, 81%
2017-18, n=3405, 83%
Understanding the requirements of the application
2022-23, 82%
2021-22, n=3795, 82%
2020-21, n=3797, 83%
2019-20, n=2431, 80%
2017-18, n=3405, 81%
Putting together the information you needed to apply for [ABBREV]
2022-23, 79%
2021-22, n=3795, 80%
2020-21, n=3797, 82%
2019-20, n=2431, 79%
2017-18, n=3405, 78%
Getting help on your application when you needed it
2022-23, 68%, significnatly higher than previous wave
2021-22, n=3795, 64%
2020-21, n=3797, 65%
Q12. How much do you agree or disagree that you were able to complete the application in a reasonable amount of time? (Please use a scale of 1 to 5, where 1 is strongly disagree and 5 is strongly agree.)
Base: All respondents (n=3807) Q13. On a scale of 1 to 5 where 1 is very difficult and 5 is very easy, how would you rate the following when you were applying for [INSERT ABBREV]? How about …?
Base: All answering (n=varies)
Ease When Applying: by Program
SIN clients were more likely to provide high ratings for all aspects of the application compared to all clients, with the exception of completing the application in the reasonable time where ratings were consistent. CPP-D clients were less likely to agree they were able to complete the application in a reasonable time, and along with EI clients, to provide high ratings for all aspects of the application. CPP and OAS/GIS clients were less likely to feel it was easy to get help on their application.
Compared to 2021-22, SIN and OAS/GIS clients were more likely to find it easy to get help on their application. OAS/GIS clients also provided higher ratings for the ease of completing the application form.
Figure long description
Ease When Applying: by Program
Agree able to complete application in a reasonable amount of time
TOTAL
2017-18, 82%
2019-20, 84%
2020-21, 83%
2021-22, 81%
2022-23, 84%, significantly higher than previous wave
EI
2017-18, 82%
2019-20, 83%
2020-21, 82%
2021-22, 81%
2022-23, 84%
CPP
2017-18, 82%
2019-20, 83%
2020-21, 80%
2021-22, 81%
2022-23, 82%
CPP-D
2017-18, 56%
2019-20, 55%
2020-21, 59%
2021-22, 57%
2022-23, 54%, significnatly lower than total
SIN
2017-18, 85%
2019-20, 87%
2020-21, 88%
2021-22, 84%
2022-23, 86%
OAS/GIS
2017-18, 81%
2019-20, 89%
2020-21, 83%
2021-22, 79%
2022-23, 82%
Completing the application form
TOTAL
2017-18, 83%
2019-20, 81%
2020-21, 84%
2021-22, 82%
2022-23, 85%
EI
2017-18, 81%
2019-20, 82%
2020-21, 84%
2021-22, 81%
2022-23, 82%, significantly lower than total
CPP
2017-18, 81%
2019-20, 82%
2020-21, 81%
2021-22, 80%
2022-23, 83%
CPP-D
2017-18, 53%
2019-20, 50%
2020-21, 50%
2021-22, 53%
2022-23, 53%, significantly lower than total
SIN
2017-18, 88%
2020-21, 89%
2021-22, 90%
2022-23, 92%, significantly higher than total
OAS/GIS
2017-18, 78%
2019-20, 85%
2020-21, 76%
2021-22, 73%
2022-23, 83%, significantly higher than previous wave
Understanding the requirements of the application
TOTAL
2017-18, 81%
2019-20, 80%
2020-21, 83%
2021-22, 82%
2022-23, 82%
EI
2017-18, 79%
2019-20, 78%
2020-21, 79%
2021-22, 80%
2022-23, 77%, significantly lower than total
CPP
2017-18, 79%
2019-20, 80%
2020-21, 85%
2021-22, 81%
2022-23, 84%
CPP-D
2017-18, 52%
2019-20, 53%
2020-21, 54%
2021-22, 54%
2022-23, 56%, significantly lower than total
SIN
2017-18, 89%
2019-20, 85%
2020-21, 90%
2021-22, 89%
2022-23, 91%, significantly higher than the total
OAS/GIS
2017-18,75%
2019-20, 83%
2020-21, 85%
2021-22, 79%
2022-23, 80%
Putting together the information you needed to apply for [PROGRAM ABBREV]
TOTAL
2017-18, 78%
2019-20, 79%
2020-21, 82%
2021-22, 80%
2022-23, 79%
EI
2017-18, 75%
2019-20, 75%
2020-21, 81%
2021-22, 77%
2022-23, 75%, significantly lower than total
CPP
2017-18, 77%
2019-20, 82%
2020-21, 81%
2021-22, 78%
2022-23, 80%
CPP-D
2017-18, 46%
2019-20, 43%
2020-21, 44%
2021-22, 44%
2022-23, 45%, significantly lower than total
SIN
2017-18, 87%
2019-20, 86%
2020-21, 88%
2021-22, 89%
2022-23, 89%, significantly higher than total
OAS/GIS
2017-18, 75%
2019-20, 79%
2020-21, 77%
2021-22, 74%
2022-23, 81%
Getting help on your application when you needed it
TOTAL
2020-21, 65%
2021-22, 64%
2022-23, 68%, significantly higher than previous wave
EI
2020-21, 58%
2021-22, 58%
2022-23, 63%, significantly lower than total
CPP
2020-21, 63%
2021-22, 59%
2022-23, 61%, significantly lower than total
CPP-D
2020-21, 45%
2021-22, 48%
2022-23, 46%, significantly lower than total
SIN
2020-21, 78%
2021-22, 78%
2022-23, 83%, significantly higher than total, significantly higher than previous wave
OAS/GIS
2020-21, 61%
2021-22, 54%
2022-23, 62%, significantly lower than total, significantly higher than previous wave
Q12. How much do you agree or disagree that you were able to complete the application in a reasonable amount of time? (Please use a scale of 1 to 5, where 1 is strongly disagree and 5 is strongly agree.)
Q13. On a scale of 1 to 5 where 1 is very difficult and 5 is very easy, how would you rate the following when you were applying for [INSERT ABBREV]? How about …?
Base: All respondents (n=varies)
Online Application Completion
Figure long description
Ease of Application
Completing the application form
5- very easy, 57%, significantly higher than previous wave
Rated 4, 27%
Rated 3, 10%, significantly lower than previous wave
Rated 2, 3%
1 – very difficult, 2%
% Rated 4 or 5
2017-18, 83%
2019-20, 81%
2020-21, 84%
2021-22, 82%
2022-23, 85%
Understanding the requirements of the application
5- very easy, 54%
Rated 4, 27%
Rated 3, 12%
Rated 2, 4%
1 – very difficult, 2%
% Rated 4 or 5
2017-18, 81%
2019-20, 80%
2020-21, 83%
2021-22, 82%
2022-23, 82%
Putting together the information you needed to apply
5- very easy, 52%
Rated 4, 27%
Rated 3, 13%
Rated 2, 4%
1 – very difficult, 3%
% Rated 4 or 5
2017-18, 78%
2019-20, 79%
2020-21, 82%
2021-22, 80%
2022-23, 79%
Getting help on your application when you needed it
5- very easy, 46%, significnatly higher than previous wave
Rated 4, 22%
Rated 3, 12%
Rated 2, 5%
1 – very difficult, 5%
% Rated 4 or 5
2020-21, 65%
2021-22, 64%
2022-23, 68%, significantly higher than previous wave
You were able to complete the application in a reasonable amount of time
5- Strongly agree, 58%
Rated 4, 26%
Rated 3, 10%
Rated 2, 3%
1 – Strongly disagree, 3%
% Rated 4 or 5
2017-18, 82%
2019-20, 84%
2020-21, 83%
2021-22, 81%
2022-23, 84%, significantly higher than previous wave
Q13. On a scale of 1 to 5 where 1 is very difficult and 5 is very easy, how would you rate the following when you were applying for [INSERT ABBREV]? How about …?
Q12. How much do you agree or disagree that you were able to complete the application in a reasonable amount of time? (Please use a scale of 1 to 5, where 1 is strongly disagree and 5 is strongly agree.)
Base: All respondents (n=3807)
Use of Online Chatbot on Canada.ca
One in ten clients used the online chat on the Canada.ca website, consistent with 2021-22. CPP-D clients were less likely to have used the chat compared to all clients. Of those who used the chat, nearly two-thirds agreed it was helpful and ratings were consistent with last year. CPP-D clients were less likely to feel the online chat was helpful.
Figure long description
% Used Online Chatbot
Total
2022-23, 9%
2021-22, 10%
EI
2022-23, 10%
2021-22, %9
CPP
2022-23, 7%
2021-22, 8%
CPP-D
2022-23, 6%, significnatly lower than total
2021-22, 5%
SIN
2022-23, 10%
2021-22, 11%
OAS/GIS
2022-23, 8%
2021-22, 6%
Helpfulness of Online Chatbot
2022-23, (n=328)
5 – strongly agree, 47%
Rated 4, 17%
Rated 3,14%
Rated 2, 8%
1 – Strongly disagree, 11%
Don’t know, 3%
% Rating 4 or 5
Total, 64%
EI, 61%
CPP, 63%
CPP-D, 35%, significantly lower than total
SIN, 71%
OAS/GIS, 73%
2021-22 (n=327)
5 – strongly agree, 40%
Rated 4, 21%
Rated 3,13%
Rated 2, 7%
1 – Strongly disagree, 16%
Don’t know, 3%
% Rating 4 or 5
Total, 61%
EI, 56%
CPP, 58%
CPP-D, 58%
SIN, 70%
OAS/GIS, 50%
Q14d. Did you use the online chat on the Canada.ca website (also called ‘virtual assistant’) at any point during the process of getting information about [INSERT ABBREV] and completing and submitting the application form?
Base: All respondents (n=3807)
Q14e. How much do you agree or disagree that the online chat on the Canada.ca website was helpful?(Please use a scale of 1 to 5, where 1 is strongly disagree and 5 is strongly agree.)
Base: Those who used the online chat (n=328)
Ease of Application Process: Self-Service Clients
At least eight in ten or higher, the vast majority of self-serve clients found it easy to understand the requirements of the application, put together the information needed and to complete the application in a reasonable amount of time. Closer to six in ten self-serve clients found it was easy to get help on their application when they needed it.
Compared to 2021-22, self-serve clients overall were more likely to feel it was easy to get help on their application.
Figure long description
Satisfaction with Service Channels - Trending
Understanding the requirements of the application
Overall
5 - Very easy, 58%
Rated 4, 27%
Rated 3, 11%
Rated 2, 3%
1 - Very difficult, 1%
EI
5 - Very easy, 54%
Rated 4, 28%
Rated 3, 13%
Rated 2, 4%
1 - Very difficult, 1%
CPP-RTR
5 - Very easy, 59%
Rated 4, 33%
Rated 3, 7%
Rated 2, 0%
1 - Very difficult, 1%
Putting together the information needed to apply
Overall
5 - Very easy, 51%
Rated 4, 31%
Rated 3, 13%
Rated 2, 3%
1 - Very difficult, 2%
EI
5 - Very easy, 47%
Rated 4, 32%
Rated 3, 14%
Rated 2, 4%
1 - Very difficult, 2%
CPP-RTR
5 - Very easy, 53%
Rated 4, 34%
Rated 3, 10%
Rated 2, 1%
1 - Very difficult, 2%
Don’t know, 1%
Getting help on your application when you needed it
Overall
5 - Very easy, 41%
Rated 4, 20%
Rated 3, 12%
Rated 2, 4%
1 - Very difficult, 4%
Don’t Know, 19%
EI
5 - Very easy, 40%
Rated 4, 20%
Rated 3, 13%
Rated 2, 4%
1 - Very difficult, 4%
Don’t Know, 18%
CPP-RTR
5 - Very easy, 37%
Rated 4, 17%
Rated 3, 9%
Rated 2, 2%
1 - Very difficult, 3%
Don’t Know, 33%
Able to complete the application in a reasonable amount of time
Overall
5 - Strongly agree, 61%
Rated 4, 26%
Rated 3, 8%
Rated 2, 2%
1 - Strongly disagree, 2%
EI
5 - Strongly agree, 59%
Rated 4, 27%
Rated 3, 7%
Rated 2, 3%
1 - Strongly disagree, 3%
CPP-RTR
5 - Strongly agree, 62%
Rated 4, 28%
Rated 3, 7%
Rated 2, 2%
1 - Strongly disagree, 1%
% Rating 4 or 5
Understanding the requirements of the application
Overall
2017-18, 88%
2019-20, 84%
2020-21, 85%
2021-22, 86%
2022-23, 85%
EI
2017-18, 89%
2019-20, 83%
2020-21, 83%
2021-22, 85%
2022-23, 82%
CPP-RTR
2017-18, 83%
2019-20, 87%
2020-21, 90%
2021-22, 88%
2022-23, 92%
Putting together the information needed to apply
Overall
2017-18, 82%
2019-20, 84%
2020-21, 85%
2021-22, 82%
2022-23, 82%
EI
2017-18, 83%
2019-20, 83%
2020-21, 84%
2021-22, 81%
2022-23, 79%
CPP-RTR
2017-18, 84%
2019-20, 88%
2020-21, 84%
2021-22, 86%
2022-23, 87%
Getting help on your application when you needed it
Overall
2020-21, 57%
2021-22, 56%
2022-23, 61%, significantly higher than previous wave
EI
2020-21, 55%
2021-22, 54%
2022-23, 60%
CPP-RTR
2020-21, 56%
2021-22, 49%
2022-23, 53%
Able to complete the application in a reasonable amount of time
Overall
2017-18, 86%
2019-20, 90%
2020-21, 87%
2021-22, 86%
2022-23, 87%
EI
2017-18, 87%
2019-20, 90%
2020-21, 87%
2021-22, 85%
2022-23, 87%
CPP-RTR
2017-18, 87%
2019-20, 85%
2020-21, 77%
2021-22, 87%
2022-23, 90%
Q12. How much do you agree or disagree that you were able to complete the application in a reasonable amount of time? (Please use a scale of 1 to 5, where 1 is strongly disagree and 5 is strongly agree.)
Q13. On a scale of 1 to 5 where 1 is very difficult and 5 is very easy, how would you rate the following when you were applying for [INSERT ABBREV]? How about …?
Base: Self-service clients – Overall (n=799), EI (n=353), CPP-RTR (n=213)
Use of My Service Canada Account (MSCA): Overall
Overall, two-thirds of clients used MSCA. Just over four in ten used their MSCA which they had registered for in the past, two in ten registered and used their MSCA for the first time and 5% tried unsuccessfully to register for their MSCA.
Compared to 2021-22, reported use of MSCA remained consistent.
Figure long description
Use of MSCA
Used MSCA (NET)
2022-23, 66%
2021-22, n=2972, 68%
2020-21, n=3103, 69%
2019-20, n=2069, 66%
Used your MSCA which you had registered for in the past
2022-23, 44%
2021-22, n=2972, 46%
2020-21, n=3103, 38%
2019-20, n=2069, 34%
Register and use your MSCA for the first time
2022-23, 22%
2021-22, n=2972, 22%
2020-21, n=3103, 31%
2019-20, n=2069, 32%
Try unsuccessfully to register for your MSCA
2022-23, 5%
2021-22, n=2972, 6%
2020-21, n=3103, 4%
2019-20, n=2069, 5%
None of the above
2022-23, 26%
2021-22, n=2972, 24%
2020-21, n=3103, 24%
2019-20, n=2069, 28%
Don’t know
2022-23, 3%
2021-22, n=2972, 2%
2020-21, n=3103, 3%
2019-20, n=2069, 2%
Q34aa. At any point in your recent experience with [INSERT ABBREV] did you …?
Base: All respondents excluding SIN (n=3043)
Use of My Service Canada Account (MSCA): by Program
Three-quarters of CPP clients, seven in ten EI clients and half of CPP-D and OAS/GIS clients used MSCA during their experience. CPP clients were more likely to have used their MSCA which they had registered for in the past.
Compared to 2021-22, a higher proportion of CPP-D and OAS/GIS clients used MSCA. Notably, CPP-D clients were more likely to have registered and used their MSCA for the first time.
Figure long description
% Rating 4 or 5
Used MSCA (NET)
TOTAL
2019-20, 66%
2020-21, 69%
2021-22, 68%
2022-23, 66%
EI
2019-20, 77%
2020-21, 75%
2021-22, 74%
2022-23, 70%
CPP
2019-20, 50%
2020-21, 77%
2021-22, 71%
2022-23, 74%, significantly higher than total
CPP-D
2019-20, 39%
2020-21, 48%
2021-22, 41%
2022-23, 48%, significantly lower than total, significantly higher than previous wave
OAS/GIS
2019-20, 32%
2020-21, 43%
2021-22, 43%
2022-23, 50%, significantly lower than total, significantly higher than previous wave
Use your MSCA which you had registered for in the past
TOTAL
2019-20, 34%
2020-21, 38%
2021-22, 46%
2022-23, 44%
EI
2019-20, 39%
2020-21, 40%
2021-22, 50%
2022-23, 46%
CPP
2019-20, 22%
2020-21, 43%
2021-22, 44%
2022-23, 51%, significantly higher than total
CPP-D
2019-20, 25%
2020-21, 32%
2021-22, 33%
2022-23, 35%, significantly lower than total
OAS/GIS
2019-20, 21%
2020-21, 29%
2021-22, 30%
2022-23, 33%, significantly higher than total
Register and use your MSCA for the first time
TOTAL
2019-20, 32%
2020-21, 31%
2021-22, 22%
2022-23, 22%
EI
2019-20, 38%
2020-21, 35%
2021-22, 24%
2022-23, 24%
CPP
2019-20, 28%
2020-21, 34%
2021-22, 27%
2022-23, 23%
CPP-D
2019-20, 14%
2020-21, 16%
2021-22, 8%
2022-23, 13%, significantly lower than total, significantly higher than previous wave
OAS/GIS
2019-20, 11%
2020-21, 14%
2021-22, 13%
2022-23, 17%, significantly lower than total
Try unsuccessfully to register for your MSCA
TOTAL
2019-20, 5%
2020-21, 4%
2021-22, 6%
2022-23, 5%
EI
2019-20, 3%
2020-21, 4%
2021-22, 6%
2022-23, 5%
CPP
2019-20, 8%
2020-21, 5%
2021-22, 3%
2022-23, 3%
CPP-D
2019-20, 5%
2020-21, 4%
2021-22, 9%
2022-23, 7%
OAS/GIS
2019-20, 7%
2020-21, 5%
2021-22, 7%
2022-23, 6%
None of the above
TOTAL
2019-20, 28%
2020-21, 24%
2021-22, 24%
2022-23, 26%
EI
2019-20, 18%
2020-21, 19%
2021-22, 19%
2022-23, 22%, significantly lower than total
CPP
2019-20, 38%
2020-21, 14%
2021-22, 22%
2022-23, 19%, significantly lower than total
CPP-D
2019-20, 53%
2020-21, 44%
2021-22, 46%
2022-23, 42%, significantly higher than total
OAS/GIS
2019-20, 59%
2020-21, 47%
2021-22, 46%
2022-23, 42%, significantly higher than total/li>
Don’t Know
TOTAL
2019-20, 2%
2020-21, 3%
2021-22, 2%
2022-23, 3%
EI
2019-20, 1%
2020-21, 3%
2021-22, 2%
2022-23, 3%
CPP
2019-20, 3%
2020-21, 5%
2021-22, 3%
2022-23, 4%
CPP-D
2019-20, 2%
2020-21, 4%
2021-22, 4%
2022-23, 3%
OAS/GIS
2019-20, 2%
2020-21, 4%
2021-22, 4%
2022-23, 3%
Q34aa. At any point in your recent experience with [INSERT ABBREV] did you …?
Base: All respondents excluding SIN (n=3043)
Ease of My Service Canada Account (MSCA) Registration: by Program
Six in ten clients found it easy to register for their MSCA, higher than in 2021-22. CPP-D and OAS/GIS clients were less likely to feel it was easy to register compared to all clients.
Compared to 2021-22, EI clients were more likely to feel it was easy to register.
Figure long description
Ease of MSCA Registration – Trending
2022-23, n=726
5 – very easy, 35%
Rated 4, 23%
Rated 3, 19%
Rated 2, 9%
1 – very difficult, 12%
2021-22, n=716
5 – very easy, 31%
Rated 4, 20%
Rated 3, 22%
Rated 2, 8%
1 – Very difficult, 17%
2020-21, n=882
5 – very easy, 39%
Rated 4, 24%
Rated 3, 17%
Rated 2, 9%
1 – Very difficult, 10%
2019-20, n=604
5 – very easy, 41%
Rated 4, 28%
Rated 3, 17%
Rated 2, 6%
1 – Very difficult, 9%
% Rating 4 or 5
2022-23, n=726
Total, 59%, significantly higher than previous wave
EI, 61%, significantly higher than previous wave
CPP, 62%
CPP-D, 38%, significantly lower than total
OAS./GIS, 49%, significantly lower than total
2021-22, n=716
Total, 51%
EI, 51%
CPP, 59%
CPP-D, 35%
OAS/GIS, 49%
2020-21, n=882
Total, 63%
EI, 65%
CPP, 57%
CPP-D, 43%
OAS/GIS, 51%
2019-20, n=604
Total, 69%
EI, 73%
CPP, 60%
CPP-D, 48%
OAS/GIS, 44%
Q34ab. Using a 5-point scale where 1 was very difficult and 5 was very easy, how difficult or easy was it to register for your My Service Canada Account?
Base: Registered or attempted to register for MSCA (n=726)
Reasons for Low Satisfaction with MSCA Registration
Among those who rated registering their MSCA as a 1 or 2 out of 5, the most common reasons were that they experienced problems with their personal access code or creating their profile, followed by problems verifying their identity using their online banking information. CPP-D clients were less likely to cite problems verifying their identity using online banking information and more likely to cite another reason for their low rating.
Results were consistent compared to 2021-22.
Figure long description
REASONS FOR RATING OF 1 OR 2, 21% of those who registered or attempted to register for MSCA
Problems with your Personal Access Code (PAC)
TOTAL
2021-22, 22%
2022-23, 21%
EI
2021-22, 22%
2022-23, 20%
CPP
2021-22, 34%
CPP-D
2021-22, 29%
2022-23, 24%
OAS/GIS
2021-22, 14%
2022-23, 25%
Problems creating your profile (such as entering your SIN, personal information, or creating security questions)
TOTAL
2021-22, 17%
2022-23, 21%
EI
2021-22, 17%
2022-23, 21%
CPP
2021-22, 7%
CPP-D
2021-22, 15%
2022-23, 15%
OAS/GIS
2021-22, 19%
2022-23, 18%
Problems verifying your identity using your online banking information
TOTAL
2021-22, 19%
2022-23, 17%
EI
2021-22, 21%
2022-23, 19%
CPP
2021-22, 6%
CPP-D
2021-22, 24%
2022-23, 6%
OAS/GIS
2021-22, 13%
2022-23, 10%
Problems with your security code (for multi-factor authentication)
TOTAL
2021-22, 7%
2022-23, 16%
EI
2021-22, 6%
2022-23, 15%
CPP
2021-22, 15%
CPP-D
2021-22, 6%
2022-23, 12%
OAS/GIS
2021-22, 11%
2022-23, 20%
My Service Canada Account was unavailable
TOTAL
2021-22, 5%
2022-23, 3%
EI
2021-22, 4%
2022-23, 3%
CPP
2021-22, 11%
CPP-D
2021-22, 4%
2022-23, 5%
OAS/GIS
2021-22, 9%
2022-23, 4%
Other reason
TOTAL
2021-22, 21%
2022-23, 14%
EI
2021-22, 21%
2022-23, 15%
CPP
2021-22, 15%
CPP-D
2021-22, 9%
2022-23, 25%, significantly higher than total
OAS/GIS
2021-22, 30%
2022-23, 6%
None of the above
TOTAL
2021-22, 5%
2022-23, 7%
EI
2021-22, 5%
2022-23, 6%
CPP
2021-22, 11%
CPP-D
2021-22, 6%
2022-23, 7%
OAS/GIS
2022-23, 10%
* Small sample size, interpret with caution. ** Sample size too small for reporting.
Q34ac. You provided a rating of [Q34ab RATING] out of 5 for registering for your My Service Canada Account. What would you say most contributed to your difficulty registering?
Base: Rating ease of MSCA registration a 1 or 2 (n=192)
Registered for MSCA in a Reasonable Amount of Time
Two-thirds of clients who registered or attempted to register for their MSCA agreed that they could do so in a reasonable amount of time, significantly higher than 2021-22.
CPP-D and OAS/GIS clients were less likely to feel they could register for their MSCA in a reasonable amount of time.
Figure long description
Registered in Reasonable Amount of Time
2022-23, n=726
5 – Strongly agree, 41%
Rated 4, 25%
Rated 3, 17%
Rated 2, 6%
1 – Strongly1 disagree, 10%
% Rating 4 or 5
Total, 66%
EI, 68%
CPP, 70%
CPP-D, 40%
OAS/GIS, 57%
2021-22, n=716
5 – Strongly agree, 35%
Rated 4, 25%
Rated 3, 20%
Rated 2, 5%
1 – Strongly1 disagree, 14%
% Rating 4 or 5
Total, 60%
EI, 60%
CPP, 64%
CPP-D, 37%
OAS/GIS, 60%
Q34ad. How much do you agree or disagree that you were able to register for My Service Canada Account within a reasonable amount of time? (Please use a scale of 1 to 5, where 1 is strongly disagree and 5 is strongly agree.)
Base: Registered/tried to register for MSCA (n=726)
Ease of Signing into Existing MSCA
Just over seven in ten of those with an existing MSCA found it easy to sign into their account, with half saying it was very easy.
CPP clients were more likely to find it easy to sign in compared to all clients and ratings have increased compared to 2021-22.
Figure long description
Ease of signing into existing MSCA account
2022-23, n=1203
Ease of Signing into Account
5 – Very easy, 50%
Rated 4, 22%
Rated 3, 16%
Rated 2, 6%
1 – Very difficult, 6%
% Rating 4 or 5
Total, 72%
EI, 72%
CPP, 81%,significantly higher than total, significantly higher than previous wave
CPP-D, 71%
OAS/GIS, 70%
2021-22, n=1129
Ease of Signing into Account
5 – Very easy, 53%
Rated 4, 22%
Rated 3, 14%
Rated 2, 5%
1 – Very difficult, 6%
% Rating 4 or 5
Total, 75%
EI, 77%
CPP, 68%
CPP-D, 67%
OAS/GIS, 72%
Q35a. Using a 5-point scale where 1 is very difficult and 5 is very easy, how difficult or easy was it to sign into your My Service Canada Account?
Base: Had existing MSCA (n=1203)
Reason for Difficulty Signing into MSCA: Overall
Among those who rated the ease of signing into their MSCA as a 1 or 2 out of 5, the most common reasons were problems with their security code, followed by that they forgot their username or password, their account was locked or MSCA was unavailable. Three in ten cited other reasons.
Results were consistent by program and compared to 2021-22.
Figure long description
Reasons For Rating of 1 or 2 – 12% of those who had an existing MSCA
Had problems with your security code (for multi-factor authentication)
TOTAL
2021-22, 7%
2022-23, 17%
EI
2021-22, 5%
2022-23, 18%
CPP
2021-22, 25%
CPP-D
2021-22, 3%
2022-23, 19%
Forgot your username or password
TOTAL
2021-22, 19%
2022-23, 15%
EI
2021-22, 17%
2022-23, 14%
CPP
2021-22, 12%
CPP-D
2021-22, 26%
2022-23, 18%
Your account was locked
TOTAL
2021-22, 13%
2022-23, 12%
EI
2021-22, 13%
2022-23, 12%
CPP
2021-22, 13%
CPP-D
2021-22, 9%
2022-23, 10%
My Service Canada Account was unavailable
TOTAL
2021-22, 16%
2022-23, 11%
EI
2021-22, 17%
2022-23, 11%
CPP
2021-22, 12%
CPP-D
2021-22, 11%
2022-23, 6%
Forgot the answers to your security questions
TOTAL
2021-22, 14%
2022-23, 7%
EI
2021-22, 16%
2022-23, 7%
CPP
2021-22, 10%
CPP-D
2021-22, 11%
2022-23, 4%
Other reason
TOTAL
2021-22, 23%
2022-23, 31%
EI
2021-22, 22%
2022-23, 31%
CPP
2021-22, 16%
CPP-D
2021-22, 40%
2022-23, 39%
None of the above
TOTAL
2021-22, 5%
2022-23, 8%
EI
2021-22, 5%
2022-23, 8%
CPP
2021-22, 11%
* Small sample size. Results should be interpreted with caution. ** Sample size too small for reporting.
Q35b. You provided a rating of [Q35A RATING] out of 5 for signing into your My Service Canada Account. What would you say most contributed to your difficulty signing into your account?
Base: Rating ease of signing into account 1 or 2 (n=125)
Satisfaction with My Service Canada Account (MSCA)
Nearly three-quarters of clients who used their MSCA were satisfied with the overall quality of service they received, consistent with 2021-22. OAS/GIS clients were less likely to be satisfied with the service received through MSCA.
When looking at results by client group, Racialized clients and OLMC were more likely to be highly satisfied, while clients with no devices, those who are E-vulnerable, those with a language barrier and non-English or French speakers were less likely.
Figure long description
Satisfaction with My Service Canada Account (MSCA)
Overall Satisfaction with MSCA (% Rated 4 or 5)
2022-23, n=989
Total, 73%
EI, 75%
CPP, 73%
CPP-D, 70%
OAS/GIS, 59%
, significantly lower than total
2021-22, n=904
Total, 70%
EI, 69%
CPP, 71%
CPP-D, 69%
OAS/GIS, 66%
Client Groups
Higher Satisfaction, (% Rated 4 Or 5)
Racialized Clients, 83%
OLMC, 83%
Lower Satisfaction, (% Rated 4 Or 5)
E-vulnerable, 52%
No Devices, 41%
Language Barrier, 49%
Non-English Or French Speaking, 47%
Q27. How satisfied were you with the overall quality of service you received from your My Service Canada Account? Please use a 5-point scale, where ‘1’ means very dissatisfied and ‘5’ means very satisfied.
Base: (n=989)
Qualitative Highlights on My Service Canada Account
OAS/GIS and CPP-D participants were among the least likely to use MSCA to complete their applications. This was largely a function of age, their health conditions and the nature of the application. Older participants of these programs did not have access to a computer or the internet and were generally more comfortable and confident in applying using the paper application form or in-person. For others, sitting at a computer was difficult due to their health condition, found it easier to express themselves by writing down their answers and in a small number of cases participants were unaware of the option to apply online.
Among those with experiences of using MSCA, participants reported few issues with registering or signing in to MSCA; most appeared to have had their accounts for several years now. Some used their GCKey out of habit. Others found the sign-in option via the bank more convenient and secure due to high levels of trust toward their banking institutions.
Most participants used MSCA to check on the status of their application. They were generally underwhelmed by the vague “status pending” message shown on MSCA. Participants explained that the status message is one reason why they proceeded to call a program's specialized call centre to ask for more detailed information.
Participants who used MSCA generally trusted that Service Canada is doing its best in protecting their personal information. There were some references to security breaches involving federal government departments, but this did not appear to affect their trust levels. Instead, participants adopted an attitude of resignation that security breaches happen and affect both private and public organizations.
I’m a one-finger typist at best. I’ve got friends that can help me out on the computer, and my daughter-in-law, she is very good on computers and things like that. But I’m not very comfortable with it. So, when I saw that I could just print it out and write things out, I thought, yeah, that’s what I’m going to do. . I’m kind of old-school.
It was pretty straightforward […] I’ve had very good service with my banking and Interac services before, so I figured if I logged in with that, because my MSCA account has all of your SIN numbers and that kind of information, it’s probably actually better to use the Interac verification because my bank has like fraud alerts and different ways to possibly protect me.
The options are "Status pending" or "Approved". And then "Status pending", like, what does that mean? And not even the people that you phone know what that means
Use of 1 800 O-Canada at Aware Stage and Channel Satisfaction: Overall and by Client Group
Overall, 6% of all clients used 1 800 O-Canada at the aware stage to learn about the program they applied for, consistent with 2021-22. Usage at the aware stage was higher among clients with restrictions.
Seven in ten were satisfied with the quality of service provided through 1 800 O-Canada, higher than 2021-22. Satisfaction was higher among remote clients, newcomers and Racialized clients compared to all clients who used 1 800 O-Canada and lower among those with a language barrier or clients with restrictions. Compared to 2021-22, satisfaction has increased among Indigenous clients, those who live in an urban area, clients with restrictions, clients with disabilities and Racialized clients.
Figure long description
1 800 O-Canada Channel Use and Satisfaction
Satisfied with channel (% rated 4 or 5)
2019-20, 69%
2020-21, 72%
2021-22, 59%
2022-23, 70%, significantly higher than previous wave
Used service at awareness stage
2019-20, 8%
2020-21, 6%
2021-22, 5%
2022-23, 6%
Figure long description
At-risk Client Groups
Satisfied (% Rated 4 or 5)
Youth (18 to 30)
2019-20, 79%
2020-21, 79%
2021-22, 47%
2022-23, 67%
Seniors (60+)
2019-20, 67%
2020-21, 65%
2021-22, 68%
2022-23, 72%
OLMC
2019-20, 78%
Non E or F Speaking
2019-20, 82%
High school or less
2019-20, 73%
2020-21, 80%
2021-22, 60%
2022-23, 69%
Indigenous
2019-20, 52%
2020-21, 83%, small sample size
2021-22, 56%
2022-23, 68%, significantly higher than previous wave
Clients with disabilities
2019-20, 70%
2020-21, 48%
2021-22, 51%
2022-23, 79%, significantly higher than previous wave/li>
Remote
2019-20, 74%
2020-21, 80%, small sample size
2021-22, 79%
2022-23, 88%, significnatly higher than total, small sample size
Urban
2019-20, 71%
2020-21, 71%
2021-22, 57%
2022-23, 73%, significnatly higher than previous wave
Rural
2019-20, 65%
2020-21, 74%
2021-22, 57%
2022-23, 65%
E-vulnerable
2019-20, 69%
2020-21, 75%
2021-22, 61%
2022-23, 61%
Newcomers (3 yrs. or fewer)
2019-20, 83%
2022-23, 94%, significantly higher than total, small sample size
Language barrier
2019-20, 8%
2020-21, 31%
2022-23, 31%, significantly lower than total, small sample size
Mobile only
2019-20, 54%
2020-21, 66%, small sample size
2021-22, 67%
2022-23, 73%
No devices
2019-20, 77%
2020-21, 85%
2021-22, 71%, small sample size
Clients with restrictions
2019-20, 55%
2020-21, 72%
2021-22, 47%
2022-23, 55%, significnatly higher than previous wave, significantly lower than total
Racialized
2020-21, 82%
2021-22, 63%
2022-23, 85%, significantly higher than previous wave, significantly higher than total
% Used At Awareness Stage
Youth (18 to 30)
2019-20, 5%
2020-21, 4%
2021-22, 5%
2022-23, 6%
Seniors (60+)
2019-20, 9%
2020-21, 7%
2021-22, 6%
2022-23, 7%
OLMC
2019-20, 3%
2020-21, 6%
2021-22, 5%
2022-23, 2%
Non E or F Speaking
2019-20, 3%
2020-21, 2%, small sample size
2021-22, 5%, small sample size
2022-23, 7%
High school or less
2019-20, 7%
2020-21, 7%
2021-22, 8%
2022-23, 8%
Indigenous
2019-20, 8%
2020-21, 6%
2021-22, 7%
2022-23, 9%
Clients with disabilities
2019-20, 11%
2020-21, 7%
2021-22, 10%
2022-23, 8%
Remote
2019-20, 6%
2020-21, 7%
2021-22, 7%
2022-23, 7%
Urban
2019-20, 7%
2020-21, 6%
2021-22, 5%
2022-23, 5%
Rural
2019-20, 9%
2020-21, 5%
2021-22, 5%
2022-23, 5%
E-vulnerable
2019-20, 11%
2020-21, 9%
2021-22, 8%
2022-23, 9%
Newcomers (3 yrs. Or fewer)
2019-20, 3%
2020-21, 3%
2021-22, 2%
2022-23, 5%
Language barrier
2019-20, 19%
2020-21, 12%
2021-22, 5%
2022-23, 4%
Mobile only
2019-20, 5%
2020-21, 13%
2021-22, 8%
2022-23, 6%
No devices
2019-20, 19%
2020-21, 11%
2021-22, 10%
2022-23, 3%, significnatly lower than previous waves
Clients with restrictions
2019-20, 8%
2020-21, 7%
2021-22, 7%
2022-23, 8%, significantly higher than total
Racialized
2020-21, 6%
2021-22, 5%
2022-23, 5%
* Small sample size. Results should be interpreted with caution. ** Sample sizes too small for reporting.
Q1a. Which of the following did you use to find out about [INSERT PROGRAM] or [INSERT ABBREV] before you applied? Did you ...?
Q27. How satisfied were you with the overall quality of service you received from …?
Base: All respondents (n=varies)
Satisfaction with eServiceCanada
At just over seven in ten, the majority of clients who used eServiceCanada were satisfied with the overall quality of service received, however ratings have declined directionally and there has also been an increase in those who rated their satisfaction 1 out of 5 (“very dissatisfied”).
Among those who used eServiceCanada, nearly eight in ten found the process easy, while roughly three-quarters found it effective and easy to find information about the program they were applying for on the GoC website; ratings across all measures were lower compared to all clients. Just over half felt it was easy to follow up.
Ratings were consistent with 2021-22.
Figure long description
Satisfaction with Overall Quality of Service
1 – Very Dissatisfied, 8%, significantly higher than previous wave
Rated 2, 3%
Rated 3, 12%
Rated 4, 23%
5 – Very Satisfied, 49%
% Rated 4 or 5
2020-21, 82%
2021-22, 76%
2022-23, 72%
Figure long description
Measures Of Ease And Effectiveness
Ease, Overall it was easy for you to apply for [Program Abbrev]
2022-23, 78%, significantly lower than total
2021-22, 82%
2020-21, 80%
Effective, You were able to move smoothly through all of the steps related to you [Program Abbrev] application
2022-23, 74%, significantly lower than total/li>
2021-22, 75%
2020-21, 78%
Ease of Follow-up, Ease of follow-up with Service Canada about application
2022-23, 55%
2021-22, 54%
2020-21, 62%
Ease of Finding Information, Ease of finding information about the program on the Government of Canada website
2022-23, 73%, significnatly lower than total
2021-22, 77%
2020-21, 69%
Q27. How satisfied were you with the overall quality of service you received from …?
Q36b. Thinking about the overall service you received, from getting information about [INSERT ABBREV] to receiving a decision, how much do you agree or disagree with the following statements, using a 5-point scale (where 1 means strongly disagree, and 5 means strongly agree)?
Q20a. Using a 5-point scale where 1 is very difficult and 5 is very easy, how difficult or easy was it to follow up with Service Canada about your application?
Q6. When you were looking for information about [INSERT ABBREV] on the Government of Canada website, how difficult or easy was it to …? Please use a scale of 1 to 5, where 1 is very difficult and 5 is very easy, how would you rate …?
At more than eight in ten, the vast majority of clients who used the in-person channel were satisfied with the quality of service received, consistent with 2021-22. More than nine in ten felt that Service Canada representatives were helpful and more than eight in ten found it easy to get help when they needed it; ratings have increased across both measures compared to 2021-22.
Just over two in ten clients who utilized in person services at the aware or apply stage booked an appointment prior to their visit and fewer reported doing so at the apply stage compared to 2021-22. Clients who booked an appointment at either the aware or apply stage have consistent levels of satisfaction with their experience compared to those who did not.
Figure long description
Satisfaction with Overall Quality Service
2022-23, n=1471
5 – Very Satisfied, 63%
Rated 4, 21%
Rated 3, 9%
Rated 2, 4%
1 –Very Dissatisfied, 3%
2021-22, n=1295
5 – Very Satisfied, 58%
Rated 4, 23%
Rated 3, 12%
Rated 2, 3%
1 –Very Dissatisfied, 3%
2020-21, n=1102
5 – Very Satisfied, 68%
Rated 4, 18%
Rated 3, 7%
Rated 2, 2%
1 – Very Dissatisfied, 3%
% Rated 4 or 5
2022-23, 83%
2021-22, 81%
2020-21, 86%
Figure long description
Helpfulness (% Rated 4 or 5)
Service Canada reps that you dealt with in-person were helpful
2020-21, 91%
2021-22, 88%
2022-23, 92%, significantly higher than previous wave
It was easy to get the help when you needed it
2020-21, 82%
2021-22, 80%
2022-23, 84%, significantly higher than previous wave
Booked Appointment Prior to Visit (% Yes)
Aware Stage
2020-21, 27%
2021-22, 28%
2022-23, 23%
Aware Stage (% rating overall quality 4 or 5)
2020-21, 87%
2021-22, 87%
2022-23, 85%
Apply Stage
2020-21, 27%
2021-22, 31%
2022-23, 23%
Apply Stage (% rating overall quality 4 or 5)
2020-21, 90%
2021-22, 84%
2022-23, 89%
Note: In-Person satisfaction results do not include the person-to-person touchless service – eServiceCanada.
Q27. How satisfied were you with the overall quality of service you received from…? Base: (n=1471)
Q36b. Thinking about the overall service you received, from getting information about [INSERT ABBREV] to receiving a decision, how much do you agree or disagree with the following statements, using a 5-point scale (where 1 means strongly disagree, and 5 means strongly agree.) Base: All answering (n=varies)
Q1c. You indicated that you went to a government office before you applied. Did you book an appointment prior to your visit? Base: (n=845)
Q9d. You indicated that you went to a government office when completing and submitting your application. Did you book an appointment prior to your visit? Base: Those who went to a government office before applying (n=1093)
Profile of In-Person Clientele – Proportion of Client Groups
The proportion of client groups among in-person clientele varied; with certain groups having relied more on in-person service.
Clients with restrictions to accessing service were more prevalent among those who used in-person at the aware and follow-up stages of the client journey. The proportion of Racialized clients, mobile-only clients, urban clients, the E-vulnerable and newcomers was higher among those who used in-person at the aware or apply stages.
The prevalence of those with a high school education or less was higher among those who used in-person service at the follow-up stage, as was rural clients. Urban clients and newcomers were least prevalent.
Figure long description
Proportion of At-risk Client Groups
Youth (18 to 30), n=652, 29%
Aware
2020-21, (n=646), 41%
2021-22, (n=757), 40%
2022-23, n=845, 37%
Apply
2020-21, (n=765), 47%
2021-22, (n=953), 43%
2022-23, n=1093, 41%, significnatly higher than total
Follow-up
2020-21, (n=168), 38%
2021-22, (n=241), 19%
2022-23, n=296, 27%, significnatly higher than previous wave
Seniors (60+), n=1981, 28%
Aware
2020-21, (n=646), 20%
2021-22, (n=757), 19%
2022-23, n=845, 19%, significantly lower than total
Apply
2020-21, (n=765), 18%
2021-22, (n=953), 15%
2022-23, n=1093, 19%, significnatly lower than total, significantly higher than previous wave
Follow-up
2020-21, (n=168), 21%
2021-22, (n=241), 26%
2022-23, n=296, 30%
OLMC, n=112, 4%
Aware
2020-21, (n=646), 6%
2021-22, (n=757), 4%
2022-23, n=845, 4%
Apply
2020-21, (n=765), 7%
2021-22, (n=953), 4%
2022-23, n=1093, 4%
Follow-up
2020-21, (n=168), 7%
2021-22, (n=241), 2%
2022-23, n=296, 7%, significnatly higher than previous wave
Non E or F speaking, n=81, 3%
Aware
2020-21, (n=646), 4%
2021-22, (n=757), 2%
2022-23, n=845, 1%
Apply
2020-21, (n=765), 4%
2021-22, (n=953), 4%
2022-23, n=1093, 5%
Follow-up
2020-21, (n=168), 6%
2021-22, (n=241), 2%
2022-23, n=296, 2%
High school or less, n=1446, 27%
Aware
2020-21, (n=646), 31%
2021-22, (n=757), 31%
2022-23, n=845, 28%
Apply
2020-21, (n=765), 26%
2021-22, (n=953), 26%
2022-23, n=1093, 26%
Follow-up
2020-21, (n=168), 37%
2021-22, (n=241), 40%
2022-23, n=296, 40%, significantly higher than total
Indigenous, n=427, 7%
Aware
2020-21, (n=646), 10%
2021-22, (n=757), 9%
2022-23, n=845, 7%
Apply
2020-21, (n=765), 10%
2021-22, (n=953), 7%
2022-23, n=1093, 7%
Follow-up
2020-21, (n=168), 15%
2021-22, (n=241), 9%
2022-23, n=296, 10%
Clients with disabilities, n=1012, 10%
Aware
2020-21, (n=646), 7%
2021-22, (n=757), 9%
2022-23, n=845, 6%, significnatly lower than previous wave, significantly lower than total
Apply
2020-21, (n=765), 6%
2021-22, (n=953), 7%
2022-23, n=1093, 6%, significnatly lower than total
Follow-up
2020-21, (n=168), 14%
2021-22, (n=241), 12%
2022-23, n=296, 12%
Remote, n=400, 2%
Aware
2020-21, (n=646), 3%
2021-22, (n=757), 3%
2022-23, n=845, 3%
Apply
2020-21, (n=765), 2%
2021-22, (n=953), 2%
2022-23, n=1093, 2%
Follow-up
2020-21, (n=168), 4%
2021-22, (n=241), 5%
2022-23, n=296, 3%
Urban, n=2123, 60%
Aware
2020-21, (n=646), 65%
2021-22, (n=757), 59%
2022-23, n=845, 64%, significantly higher than total, significantly higher than previousw ave
Apply
2020-21, (n=765), 69%
2021-22, (n=953), 65%
2022-23, n=1093, 70%, significantly hgiehr than total, significantly higher than previous wave
Follow-up
2020-21, (n=168), 50%
2021-22, (n=241), 47%
2022-23, n=296, 48%, significantly lower than total
Rural, n=1624, 38%
Aware
2020-21, (n=646), 32%
2021-22, (n=757), 35%
2022-23, n=845, 33%, significantly lower than total
Apply
2020-21, (n=765), 28%
2021-22, (n=953), 31%
2022-23, n=1093, 28%, significantly lower than total
Follow-up
2020-21, (n=168), 47%
2021-22, (n=241), 48%
2022-23, n=296, 49%, significantly higher than total
E-vulnerable, n=851, 14%
Aware
2020-21, (n=646), 18%
2021-22, (n=757), 21%
2022-23, n=845, 19%, significantly higher than total
Apply
2020-21, (n=765), 17%
2021-22, (n=953), 17%
2022-23, n=1093, 20%, significantly higher than total
Follow-up
2020-21, (n=168), 22%
2021-22, (n=241), 21%
2022-23, n=,296 17%
Newcomers (3 years or fewer),21%, n=528
Aware
2020-21, (n=646), 26%
2021-22, (n=757), 33%
2022-23, n=845, 35%, significantly higher than total
Apply
2020-21, (n=765), 33%
2021-22, (n=953), 43%
2022-23, n=1093, 45%, significantly higher than total
Follow-up
2020-21, (n=168), 21%
2021-22, (n=241), 9%
2022-23, n=896, 8%, significantly lower than total
Language barrier, n=280, 5%
Aware
2020-21, (n=646), 4%
2021-22, (n=757), 7%
2022-23, n=845, 4%, significantly lower than previous wave
Apply
2020-21, (n=765), 3%
2021-22, (n=953), 6%
2022-23, n=1093, 5%
Follow-up
2020-21, (n=168), 5%
2021-22, (n=241), 14%
2022-23, n=296, 5%, significantly lower than previous wave
Mobile only, n=461, 10%
Aware
2020-21, (n=646), 12%
2021-22, (n=757), 17%
2022-23, n=845, 16%, significantly higher than total
Apply
2020-21, (n=765), 13%
2021-22, (n=953), 17%
2022-23, n=1093, 16%, significantly higher than total
Follow-up
2020-21, (n=168), 14%
2021-22, (n=241), 12%
2022-23, n=296, 13%
No devices, n=224, 3%
Aware
2020-21, (n=646), 3%
2021-22, (n=757), 4%
2022-23, n=845, 4%
Apply
2020-21, (n=765), 3%
2021-22, (n=953), 4%
2022-23, n=1093, 5%
Follow-up
2020-21, (n=168), 3%
2021-22, (n=241), 7%
2022-23, n=296, 3%, singificantly lower than previous wave
Clients with restrictions, n=1936, 41%, significnatly lower than previous wave
Aware
2020-21, (n=646), 60%
2021-22, (n=757), 54%
2022-23, n=845, 47%, significantly higher than total, significantly lower than previous wave
Apply
2020-21, (n=765), 55%
2021-22, (n=953), 52%
2022-23, n=953, 44%, significantly lower than previous wave
Follow-up
2020-21, (n=168), 70%
2021-22, (n=241), 61%
2022-23, n=296, 52%, significantly higher than total, significantly lower than previous waves
Racialized, n=1037, 36%
Aware
2020-21, (n=646), 52%
2021-22, (n=757), 58%
2022-23, n=845, 53%, significantly higher than total, significantly lower than previous wave
Apply
2020-21, (n=765), 60%
2021-22, (n=953), 65%
2022-23, n=953, 59%, significantly higher than total, significantly lower than previous wave
Follow-up
2020-21, (n=168), 49%
2021-22, (n=241), 30%
2022-23, n=296, 33%
OLMC:
Official Language Minority Communities
In-Person Satisfaction by Region (% Rated 4 or 5)
Overall, more than eight in ten clients who utilized in-person services were satisfied with the service provided, consistent with 2021-22.
Clients in Atlantic Canada were more likely to be satisfied with the quality of service provided in-person and ratings have increased compared to 2021-22.
Figure long description
In-Person Satisfaction by Region (% Rated 4 or 5)
In-Person Satisfaction
2022-23, 83%
2021-22, 81%
2020-21, 86%
2019-20, 86%
West/Territories
2022-23, 81%
2021-22, 79%
2020-21, 89%
2019-20, 85%
Ontario
2022-23, 84%
2021-22, 83%
2020-21, 86%
2019-20, 83%
Quebec
2022-23, 83%
2021-22, 83%
2020-21, 83%
2019-20, 91%
Atlantic
2022-23, 92%, significantly higher than total, significantly higher than previous wave
2021-22, 80%
2020-21, 88%
2019-20, 88%
* Small sample size. Results should be interpreted with caution.
Q27. How satisfied were you with the overall quality of service you received from …
Qualitative Highlights on In-person Service Channel
SIN participants applied in-person largely due to being made aware of this channel by friends or professionals helping them with settlement in Canada. A few OAS/GIS participants also opted to apply in person as they did not have access to the internet or required additional support with their application.
The main pain point encountered by participants were long queues at Service Canada Centres. This was not a surprise for SIN participants; many had heard from their friends that wait times can be long. A small number of OAS/GIS participants believed that health measures at offices reduced the level of service during the COVID-19 pandemic.
Representatives at Service Canada Centres were the main positive highlight. They were described by SIN and OAS/GIS participants as “nice”, “professional”, “patient” and “providing excellent customer care”.
I personally preferred to go in and see somebody face-to-face. Knowing that it’s such an important piece of documentation to receive, I prefer to go in and see somebody, hand them the documentations, have a conversation, and hopefully come away with exactly what I was looking for.
I was just feeling so tired [of waiting], because there’s no appointment that I can book in advance I can only walk into that place. I went [at a Service Canada office at] 8:00 AM, so it’s really early, but there were obviously a lot of people waiting there. It took me an hour to get in, I found that there were still a really long line.
I went into the Service Canada office in Moncton, which is where I expected to go. I don’t have any internet or that sort of thing, so the office was there, there was a receptionist there and they said that they didn’t help anyone there. There were computers all turned on and all cordoned off, no one using them. I It was in the COVID thing, and they were shut down. So it was 50 kilometre trip wasted going in there.
In-Person and Telephone Experience
More than nine in ten clients who used in-person services felt that Service Canada representatives were helpful, while nearly eight in ten agreed that they travelled a reasonable distance to access the service; ratings have increased across both measures compared to 2021-22. More than eight in ten clients who used telephone services agreed that Service Canada specialized call centre telephone representatives were helpful, consistent with last year.
Clients who were satisfied with their overall experience provided higher ratings for the helpfulness of Service Canada in-person and specialized call centre representatives and travelling a reasonable distance to access service compared to all clients who used those services, while those who were dissatisfied provided considerably lower ratings.
Figure long description
In-person
Service Canada representatives that you dealt with in person were helpful
5 - Strongly agree, 79%
Rated 4, 12%
Rated 3, 4%
Rated 2, 1%
1 - Strongly disagree, 1%
Not Applicable, 1%
Don’t know, 1%
% Rated 4 or 5
2019-20, 92%, significantly higher than previous wave
2020-21, 91%
2021-22, 88%
2022-23, 92%
By Overall Satisfaction
Rated 4 or 5, 96%, significantly higher than total
Rated 1 or 2, 57%, significantly lower than total
You travelled a reasonable distance to access the service
5 - Strongly agree, 58%
Rated 4, 20%
Rated 3, 12%
Rated 2, 3%
1 - Strongly disagree, 6%
Not Applicable, 2%,
Don’t know, 1%
% Rated 4 or 5
2019-20, 75%
2020-21, 79%
2021-22, 73%
2022-23, 78%, significantly higher than previous wave
By Overall Satisfaction
Rated 4 or 5, 81%, significnatly higher than total
Rated 1 or 2, 53%, significnatly lower than total
Telephone
Service Canada specialized call centre phone representatives were helpful
5 - Strongly agree, 63%
Rated 4, 20%
Rated 3, 10%
Rated 2, 4%
1 - Strongly disagree, 3%
Not Applicable, 1%
% Rated 4 or 5
2019-20, 73%
2020-21, 85%
2021-22, 82%
2022-23, 83%
By Overall Satisfaction
Rated 4 or 5, 93%, significantly higher than total
Rated 1 or 2, 39%t, significnatly lower than total
Q36b. Thinking about the overall service you received, from getting information about [INSERT ABBREV] to receiving a decision, how much do you agree or disagree with the following statements, using a 5-point scale (where 1 means strongly disagree, and 5 means strongly agree)?
Base: All respondents (n=varies)
Reasons for Low Satisfaction with Specialized Call Centre Service: Overall
Among those who reported low satisfaction ratings of 1 to 3 out of 5 for the service provided by specialized call centres, the most common reason was long wait times, with nearly four in ten feeling it was too long. Other reasons included inconsistent or unclear information or that their questions were not answered.
Results were consistent with 2021-22.
Figure long description
Reason for Rating of 1 to 3, 34% of those who used a Specialized Call Centre
The telephone wait times were too long
2022-23, 37%
2021-22, n=344, 46%
2020-21, n=315, 54%
Inconsistent or unclear information
2022-23, 20%
2021-22, n=344, 18%
2020-21, n=315, 23%
Your questions were not answered
2022-23, 12%
2021-22, n=344, 7%
2020-21, n=315, 5%
Did not like the outcome of the call(s)
2022-23, 5%
2021-22, n=344, 4%
2020-21, n=315, 1%
Service Canada representatives were disrespectful
2022-23, 1%
2021-22, n=344, 1%
2020-21, n=315, 0%
Other
2022-23, 21%
2021-22, n=344, 21%
2020-21, n=315, 23%
(DK/NS)
2022-23, 5%
2021-22, n=344, 2%
2020-21, n=315, 3%
Q27a. You provided a rating of [INSERT RATING FOR 'AN [INSERT ABBREV] CALL CENTRE' AT Q27] out of 5 for the service provided by the [INSERT ABBREV] Call Centre. What would you say most contributed to your lower satisfaction with the overall quality of the service you received from the [PROGRAM ABBREV] call centre?
Base: Those who provided a rating of 1 to 3/5 on Q27 (n=355)
Reasons for Low Satisfaction with Specialized Call Centre Service: by Program
CPP and CPP-D clients were more likely to report that Service Canada representatives were disrespectful compared to all clients as the reason for their lower rating.
Results were consistent with 2021-22 by program.
Figure long description
Reason for Rating of 1 to 4
The telephone wait times were too long
Total
2020-21, (n=315), 54%
2021-22, (n=344), 46%
2022-23, n=355, 37%
EI
2020-21, (n=122), 59%
2021-22, (n=147), 45%
2022-23, n=135, 38%
CPP
2020-21, (n=38*), 52%
2021-22, (n=44), 53%
2022-23, n=39, 38%
CPP-D
2020-21, (n=90), 27%
2021-22, (n=106), 27%
2022-23, n=126, 28%, significantly lower than total
SIN
2020-21, (n=29*), 42%
OAS/GIS
2020-21, (n=36*), 50%
2021-22, (n=38*), 49%
2022-23, n=48, 34%
Inconsistent or unclear information
Total
2020-21, (n=315), 12%
2021-22, (n=344), 18%
2022-23, n=355, 20%
EI
2020-21, (n=122), 12%
2021-22, (n=147), 20%
2022-23, n=135, 21%
CPP
2020-21, (n=38*), 12%
2021-22, (n=44), 16%
2022-23, n=39, 20%
CPP-D
2020-21, (n=90), 16%
2021-22, (n=106), 22%
2022-23, n=126, 20%
SIN
2020-21, (n=29*), 0%
2022-23, n=7, 38%
OAS/GIS
2020-21, (n=36*), 11%
2021-22, (n=38*), 10%
2022-23, n=48, 11%
Your questions were not answered
Total
2020-21, (n=315), 5%
2021-22, (n=344), 7%
2022-23, n=355, 12%
EI
2020-21, (n=122), 4%
2021-22, (n=147), 7%
2022-23, n=135, 12%
CPP
2020-21, (n=38*), 4%
2021-22, (n=44), 4%
2022-23, n=39, 8%
CPP-D
2020-21, (n=90), 13%
2021-22, (n=106), 10%
2022-23, n=126, 17%, significantly higher than total
SIN
2020-21, (n=29*), 0%
OAS/GIS
2020-21, (n=36*), 2%
2021-22, (n=38*), 23%
2022-23, n=48, 14%
Did not like the outcome of the calls
Total
2020-21, (n=315), 1%
2021-22, (n=344), 4%
2022-23, n=355, 5%
EI
2020-21, (n=122), 2%
2021-22, (n=147), 4%
2022-23, n=135, 5%
CPP
2020-21, (n=38*), 4%
2021-22, (n=44), 2%
CPP-D
2020-21, (n=90), 8%
2021-22, (n=106), 7%
2022-23, n=126, 5%
SIN
2020-21, (n=29*), 12%
OAS/GIS
2021-22, (n=38*), 1%
2022-23, n=48, 8%
Service Canada representatives were disrespectful
Total
2020-21, (n=315), 0%
2021-22, (n=344), 1%
2022-23, n=355, 1%
EI
2021-22, (n=147), 1%
CPP
2022-23, n=39, 6%, significantly higher than total
CPP-D
2020-21, (n=90), 4%
2021-22, (n=106), 1%
2022-23, n=126, 3%, significantly higher than total
OAS/GIS
2020-21, (n=36*), 2%
2021-22, (n=38*), 2%
2022-23, n=48, 1%
Other
Total
2020-21, (n=315), 23%
2021-22, (n=344), 21%
2022-23, n=355, 21%
EI
2020-21, (n=122), 23%
2021-22, (n=147), 22%
2022-23, n=135, 19%
CPP
2020-21, (n=38*), 28%
2021-22, (n=44), 24%
2022-23, n=39, 23%
CPP-D
2020-21, (n=90), 28%
2021-22, (n=106), 26%
2022-23, n=126, 24%
SIN
2020-21, (n=29*), 17%
OAS/GIS
2020-21, (n=36*), 34%
2021-22, (n=38*), 16%
2022-23, n=48, 28%
Don’t know/not stated
Total
2020-21, (n=315), 3%
2021-22, (n=344), 2%
2022-23, n=,355 5%
EI
2020-21, (n=122), 1%
2021-22, (n=147), 1%
2022-23, n=135, 4%
CPP
2022-23, n=39, 7%
CPP-D
2020-21, (n=90), 4%
2021-22, (n=106), 7%
2022-23, n=126, 2%
OAS/GIS
2020-21, (n=36*), 2%
2022-23, n=48, 5%
* Small sample size. Results should be interpreted with caution. ** Sample sizes too small for reporting.
Q27a. You provided a rating of [INSERT RATING FOR 'AN [INSERT ABBREV] CALL CENTRE' AT Q27] out of 5 for the service provided by the [INSERT ABBREV] Call Centre. What would you say most contributed to your lower satisfaction with the overall quality of the service you received from the [PROGRAM ABBREV] call centre?
Base: Those who provided a rating of 1 to 3/5 on Q27
Qualitative Highlights on Specialized Call Centre Service Channel
Wait times was the most common pain point experienced by participants who contacted Specialized Call Centres. Several participants said they waited on hold for hours or were unable to reach a Service Canada representative. It was assumed there must be a high volume of calls.
A lack of information on the status of their application further contributed to negative perceptions of Specialized Call Centres.
In terms of positive comments, Call Centre representatives were described as “cordial” and “professional” by a small number of participants despite their frustration with the situation.
So when I called to help them guide me through the website, I was on hold for maybe an hour, hour-and-a-half. And then the line eventually tells you, "Call back another time", everyone's too busy
I had to phone three different times. Maybe it was more. The first time I phoned, it was no, we’re still looking into it. And then, it was they’re still looking into it, and then a month or two months later, I phoned again.
I applied and I heard nothing back for four weeks. So I was just incessantly phoning to say, "Can somebody please give me an answer?". They said, "Oh, love to help you out but nobody's started your application on this side". And they just did that over, and over, and over, and over again. By the time somebody got back to me I was already employed again.
Reasons for Low Satisfaction with Specialized Call Centre Service: by Region
Results were generally consistent by region.
Compared to 2021-22, clients in the West/Territories and Ontario were more likely to say their questions were not answered, while those in Ontario were also more likely to report that they did not like the outcome of the calls. However, clients in Ontario were less likely to mention telephone wait times being too long and those in the West/Territories that they did not like the outcome of the calls.
Figure long description
Reason for Rating of 1 to 3 – tending
The telephone wait times were too long
Total
2020-21, (n=315), 54%
2021-22, (n=344), 46%
2022-23, (n=355), 37%
West/territories
2020-21, (n=132), 45%
2021-22, (n=138), 41%
2022-23, (n=133), 40%
Ontario
2020-21, (n=79), 57%
2021-22, (n=118), 47%
2022-23, (n=128), 25%, significantly lower than total, significantly lower than previous wave
Quebec
2020-21, (n=78), 57%
2021-22, (n=65), 53%
2022-23, (n=61), 48%
Atlantic
2020-21, (n=29*), 75%
2021-22, (n=23*), 38%
2022-23, (n=33), 39%
Inconsistent or unclear information
Total
2020-21, (n=315), 12%
2021-22, (n=344), 18%
2022-23, (n=355), 20%
West/territories
2020-21, (n=132), 20%
2021-22, (n=138), 25%
2022-23, (n=133), 18%
Ontario
2020-21, (n=79), 10%
2021-22, (n=118), 21%
2022-23, (n=128), 27%
Quebec
2020-21, (n=78), 8%
2021-22, (n=65), 8%
2022-23, (n=61), 15%
Atlantic
2020-21, (n=29*), 12%
2021-22, (n=23*), 18%
2022-23, (n=33), 15%
Your questions were not answered
Total
2020-21, (n=315), 5%
2021-22, (n=344), 7%
2022-23, (n=355), 12%
West/territories
2020-21, (n=132), 6%
2021-22, (n=138), 7%
2022-23, (n=133), 15%, significantly higher than previous wave
Ontario
2020-21, (n=79), 2%
2021-22, (n=118), 3%
2022-23, (n=128), 14%, significantly higher than previous wave
Quebec
2020-21, (n=78), 8%
2021-22, (n=65), 16%
2022-23, (n=61), 9%
Atlantic
2020-21, (n=29*), 3%
2022-23, (n=33), 3%
Did not like the outcome of the calls
Total
2020-21, (n=315), 1%
2021-22, (n=344), 4%
2022-23, (n=355), 5%
West/territories
2020-21, (n=132), 2%
2021-22, (n=138), 7%
2022-23, (n=133), 2%, significnatly lower than previous wave
Ontario
2021-22, (n=118), 0%
2022-23, (n=128), 9%, significantly higher than previous wave
Quebec
2021-22, (n=65), 4%
2022-23, (n=61), 4%
Atlantic
2021-22, (n=23*), 8%
2022-23, (n=33), 1%
Service Canada representatives were disrespectful
Total
2020-21, (n=315), 0%
2021-22, (n=344), 1%
2022-23, (n=355), 1%
West/territories
2021-22, (n=138), 0%
2022-23, (n=133), 1%
Ontario
2021-22, (n=118), 0%
2022-23, (n=128), 1%
Quebec
2021-22, (n=65), 3%
2022-23, (n=61), 0%
Atlantic
2020-21, (n=29*), 1%
2022-23, (n=33), 1%
Other
Total
2020-21, (n=315), 23%
2021-22, (n=344), 21%
2022-23, (n=355), 21%
West/territories
2020-21, (n=132), 23%
2021-22, (n=138), 18%
2022-23, (n=133), 19%
Ontario
2020-21, (n=79), 27%
2021-22, (n=118), 27%
2022-23, (n=128), 22%
Quebec
2020-21, (n=78), 23%
2021-22, (n=65), 13%
2022-23, (n=61), 19%
Atlantic
2020-21, (n=29*), 6%
2021-22, (n=23*), 35%
2022-23, (n=33), 35%
Don’t know/not stated
Total
2020-21, (n=315), 3%
2021-22, (n=344), 2%
2022-23, (n=355), 5%
West/territories
2020-21, (n=132), 4%
2021-22, (n=138), 2%
2022-23, (n=133), 4%
Ontario
2020-21, (n=79), 4%
2021-22, (n=118), 2%
2022-23, (n=128), 3%
Quebec
2020-21, (n=78), 3%
2021-22, (n=65), 2%
2022-23, (n=61), 6%
Atlantic
2020-21, (n=29*), 3%
2022-23, (n=33), 7%
* Small sample size. Results should be interpreted with caution. ** Sample sizes too small for reporting.
Q27a. You provided a rating of [INSERT RATING FOR 'AN [INSERT ABBREV] CALL CENTRE' AT Q27] out of 5 for the service provided by the [INSERT ABBREV] Call Centre. What would you say most contributed to your lower satisfaction with the overall quality of the service you received from the [PROGRAM ABBREV] call centre?
Base: Those who provided a rating of 1 to 3/5 on Q27
Client Groups
Barriers/Restrictions to Accessing Service
Clients with Restrictions that Affect Accessing Service: Overall
Just over four in ten of all clients felt they had restrictions that made it more difficult to access services, lower than in 2021-22.
The most common type of restriction experienced was not being unable to visit SC offices during business hours, followed by needing assistance from someone other than SC representatives, not living in close proximity to a SC Office and that the application form was too long or complicated.
Compared to 2021-22, clients were less likely to report a restriction because of not living in close proximity to a SC Office.
Figure long description
% Yes To At Least One, 2021-22
2022-23, 41%, singificnatly lower than previous wave
2021-22, 45%
Figure long description
Restrictions to Accessing Service
You are unable to visit Service Canada during business hours
2022-23, 20%
2021-22, 21%
2020-21, 18%
2019-20, 17%
You needed assistance from someone other than Service Canada staff
2022-23, 13%
2021-22, 14%
2020-21, 11%
2019-20, 10%
You do not live in close proximity to a Service Canada office
2022-23, 12%
2021-22, 15%
2020-21, 12%
2019-20, 13%
Application form was too long or complicated
2022-23, 12%
2021-22, 13%
2020-21, 11%
You do not own a smart phone
2022-23, 9%
2021-22, 9%
2020-21, 8%
You do not have access to the internet
2022-23, 9%
2021-22, 8%
2020-21, 8%
2019-20, 6%
You could not use the computer in a Service Canada Centre
2022-23, 8%
2021-22, 9%
2020-21, 9%
2019-20, 8%
You do not have access to a computer
2022-23, 7%
2021-22, 8%
2020-21, 7%
2019-20, 6%
Q45a. Some people experience difficulties applying for [INSERT ABBREV] because of barriers to accessing service. Thinking about your overall experience from getting information about, to applying for [INSERT ABBREV], did you experience difficulties for any of the following reasons …? A response of ‘yes’ means it was a barrier for you and caused difficulties applying and a response of ‘no’ means it was not a barrier.
Base: All respondents (n=Base varies)
Clients with Restrictions that Affect Accessing Service: by Program
CPP-D clients were more likely to have nearly all restrictions, while OAS/GIS clients were more likely to say they were restricted by not having access to a computer and EI clients by not living in close proximity to a Service Canada office.
Compared to 2021-22, CPP clients were less likely to say they were unable to visit a Service Canada office during business hours, that they do not live in close proximity to a Service Canada office and that they could not use the computer in a Service Canada centre. OAS/GIS clients were less likely to say that the application form was too long or complicated and that they do not own a smart phone.
Figure long description
% Yes to At Least One
Total
2022-23, 41%, significnatly lower than preivous wave
2021-22, 45%
EI
2022-23, 40%
2021-22, 43%
CPP
2022-23, 39%
2021-22, 43%
CPP-D
2022-23, 66%, significnatly higher than total
2021-22, 67%
SIN
2022-23, 42%
2021-22, 46%
OAS/GIS
2022-23, 38%
2021-22, 43%
% Yes
You are unable to visit Service Canada during business hours
Total,
2019-20, 17%
2020-21, 18%
2021-22, 21%
2022-23, 20%
EI
2019-20, 16%
2020-21, 16%
2021-22, 21%
2022-23, 21%
CPP
2019-20, 16%
2020-21, 18%
2021-22, 19%
2022-23, 14%
CPPD
2019-20, 21%
2020-21, 26%
2021-22, 26%
2022-23, 23%
SIN
2019-20, 22%
2020-21, 23%
2021-22, 22%
2022-23, 23%
OAS/GIS
2019-20, 9%
2020-21, 14%
2021-22, 16%
2022-23, 14%
You do not live in close proximity to a Service Canada office
Total,
2019-20, 13%
2020-21, 12%
2021-22, 15%
2022-23, 12%, significantly lower than previous wave
EI
2019-20, 11%
2020-21, 11%
2021-22, 14%
2022-23, 11%
CPP
2019-20, 10%
2020-21, 12%
2021-22, 14%
2022-23, 10%, significantly lower than total, significantly lower than previous wave
CPPD
2019-20, 18%
2020-21, 20%
2021-22, 19%
2022-23, 20%, significantly higher than previous wave
SIN
2019-20, 17%
2020-21, 15%
2021-22, 17%
2022-23, 15%, significantly higher than previous wave
OAS/GIS
2019-20, 10%
2020-21, 10%
2021-22, 13%
2022-23, 13%
You needed assistance from someone other than Service Canada staff
Total,
2019-20, 10%
2020-21, 11%
2021-22, 14%
2022-23, 13%
EI
2019-20, 9%
2020-21, 11%
2021-22, 13%
2022-23, 12%
CPP
2019-20, 8%
2020-21, 11%
2021-22, 13%
2022-23, 11%
CPPD
2019-20, 41%
2020-21, 42%
2021-22, 36%
2022-23, 34%, significantly higher than total
SIN
2019-20, 9%
2020-21, 8%
2021-22, 14%
2022-23, 15%
OAS/GIS
2019-20, 10%
2020-21, 11%
2021-22, 14%
2022-23, 12%
Application form was too long or complicated
Total,
2020-21, 11%
2021-22, 13%
2022-23, 12%
EI
2020-21, 11%
2021-22, 15%
2022-23, 13%
CPP
2020-21, 10%
2021-22, 12%
2022-23, 11%
CPPD
2020-21, 41%
2021-22, 42%
2022-23, 42%, significantly higher than total
SIN
2020-21, 8%
2021-22, 7%
2022-23, 10%
OAS/GIS
2020-21, 11%
2021-22, 19%
2022-23, 12%, significantly lower than previous wave
You could not use the computer in a Service Canada Centre
Total,
2020-21, 9%
2021-22, 9%
2022-23, 8%
EI
2020-21, 9%
2021-22, 10%
2022-23, 8%
CPP
2020-21, 9%
2021-22, 11%
2022-23, 7%, significantly lower than previous wave
CPPD
2020-21, 24%
2021-22, 18%
2022-23, 15%, significantly higher than total
SIN
2020-21, 7%
2021-22, 7%
2022-23, 8%
OAS/GIS
2020-21, 11%
2021-22, 12%
2022-23, 9%
You do not have access to the internet
Total,
2019-20, 6%
2020-21, 8%
2021-22, 8%
2022-23, 9%
EI
2019-20, 7%
2020-21, 6%
2021-22, 7%
2022-23, 8%
CPP
2019-20, 8%
2020-21, 11%
2021-22, 8%
2022-23, 7%
CPPD
2019-20, 9%
2020-21, 15%
2021-22, 9%
2022-23, 11%, significantly higher than total
SIN
2019-20, 4%
2020-21, 9%
2021-22, 8%
2022-23, 9%
OAS/GIS
2019-20, 10%
2020-21, 8%
2021-22, 12%
2022-23, 10%
You do not own a smart phone
Total,
2019-20, 8%
2020-21, 8%
2021-22, 9%
2022-23, 9%
EI
2019-20, 6%
2020-21, 7%
2021-22, 7%
2022-23, 8%
CPP
2019-20, 8%
2020-21, 12%
2021-22, 13%
2022-23, 11%
CPPD
2019-20, 12%
2020-21, 16%
2021-22, 9%
2022-23, 10%
SIN
2019-20, 9%
2020-21, 9%
2021-22, 9%
2022-23, 9%
OAS/GIS
2019-20, 10%
2020-21, 11%
2021-22, 14%
2022-23, 10%, significantly lower than previous wave
You do not have access to a computer
Total,
2019-20, 6%
2020-21, 7%
2021-22, 8%
2022-23, 7%
EI
2019-20, 6%
2020-21, 6%
2021-22, 8%
2022-23, 7%
CPP
2019-20, 7%
2020-21, 8%
2021-22, 9%
2022-23, 8%
CPPD
2019-20, 14%
2020-21, 15%
2021-22, 11%
2022-23, 14%
SIN
2019-20, 5%
2020-21, 8%
2021-22, 6%
2022-23, 5%
OAS/GIS
2019-20, 6%
2020-21, 9%
2021-22, 11%
2022-23, 10%
Q45a. Some people experience difficulties applying for [INSERT ABBREV] because of barriers to accessing service. Thinking about your overall experience from getting information about, to applying for [INSERT ABBREV], did you experience difficulties for any of the following reasons …? A response of ‘yes’ means it was a barrier for you and caused difficulties applying and a response of ‘no’ means it was not a barrier.
Base: All answering (n=varies)
Clients with Restrictions that Affect Accessing Service
Clients with restrictions had lower overall satisfaction compared to all clients but were more satisfied compared to 2021-22.
Clients with restrictions had lower satisfaction with the service provided in-person, online, through specialized call centres and 1 800 O-Canada.
Compared to 2021-22, satisfaction has increased for the service provided through My Service Canada Account, online, specialized call centres and 1 800 O-Canada.
Figure long description
Overall Satisfaction (% Rated 4 or 5)
2018-20, 79%
2020-21, 80%
2021-22, 72%
2022-23, 77%, significnatly higher than previous wave
Figure long description
Service Channel Satisfaction (% Rated 4 or 5)
In-Person
2019-20, 80%
2020-21, 82%
2021-22, 76%
2022-23, 77%, significantly lower than total
My Service Canada Account
2019-20, 65%
2020-21, 69%
2021-22, 62%
2022-23, 69%, significantly higher than previous wave
Online
2019-20, 70%
2020-21, 71%
2021-22, 63%
2022-23, 67%, significantly lower than total, significantly higher than previous wave
1 800 O-Canada
2019-20, 55%
2020-21, 72%
2021-22, 47%
2022-23, 55%, significantly lower than total, significantly higher than previous wave
Specialized Call Centre
2019-20, 61%
2020-21, 68%
2021-22, 60%
2022-23, 67%, significantly lower than total, significantly higher than previous wave
eServiceCanada
2020-21, 83%
2021-22, 71%
2022-23, 70%
Base: Clients with restrictions that affect accessing service (n=1938)
There were also significant gaps in service attributes between clients with restrictions and clients overall. The largest gaps were for finding needed information in a reasonable amount of time, finding out what information was needed to apply, ease of completing the application form, ease of understanding the requirements of the application, ease of understanding information about the program and ease of figuring out eligibility.
Compared to 2021-22, ratings increased for ease of completing the application form, ease of finding out the steps to apply, receiving consistent information, being able to complete the application in a reasonable amount of time, it being clear what to do if there was a problem, clarity of process and confidence that problems could be resolved.
Figure long description
Widest gap vs. Total & change vs. 2021-22 in service attributes (% rated 4 or 5)
Ease of finding out what information you need to provide when applying
2022-23, 66%, significantly lower than total
GAP vs. TOTAL, -11pts
2021-22, 66%
You were able to find the information you needed (online, in person or by phone) within a reasonable amount of time
2022-23, 65%, significantly lower than total
GAP vs. TOTAL, -11pts
2021-22, 63%
Ease of understanding requirements of the application
2022-23, 73%, significantly lower than total
GAP vs. TOTAL, -9pts
2021-22, 73%
Ease of completing the application form
2022-23, 76%, significantly lower than total, significantly higher than previous wave
GAP vs. TOTAL, -9 pts
2021-22, 72%
Ease of figuring out eligibility
2022-23, 64%, significantly lower than total
GAP vs. TOTAL, -9 pts
2021-22, 65%
Ease of finding information about the program
2022-23, 69%, significantly lower than total
GAP vs. TOTAL, -9 pts
2021-22, 69%
1 800 O-Canada phone representatives were helpful
2022-23, 75%, significantly lower than total
GAP vs. TOTAL, -8 pts
2021-22, 68%
Ease of understanding information about the program
2022-23, 67%, significantly lower than total
GAP vs. TOTAL, -8 pts
2021-22, 63%
Ease of finding out the steps to apply
2022-23, 72%, significantly lower than total, significantly higher than previous wave
GAP vs. TOTAL, -7 pts
2021-22, 66%
You received consistent information
2022-23, 74%, significantly lower than total, significantly higher than previous wave
GAP vs. TOTAL, -7 pts
2021-22, 73%
You were able to complete the application in a reasonable amount of time
2022-23, 77%, significantly lower than total, significantly higher than previous wave
GAP vs. TOTAL, -7 pts
2021-22, 73%
It was clear what to do if you had a problem or question
2022-23, 72%, significantly lower than total, significantly higher than previous wave
GAP vs. TOTAL, -6 pts
2021-22, 67%
Throughout the process it was clear what would happen next and when
2022-23, 70%, significantly lower than total, significantly higher than previous wave
GAP vs. TOTAL, -6 pts
2021-22, 67%
You were confident that any issues or problems would have been easily resolved
2022-23, 70%<, significantly lower than total, significantly higher than previous wave/li>
GAP vs. TOTAL, -5 pts
2021-22, 66%
Compared to 2021-22, ratings also increased for it being easy to get help when needed, specialized call centre representatives being helpful, getting help on the application specifically, being confident that one’s personal information was protected and ease of accessing service in a language clients could speak and understand well.
Figure long description
Widest gap vs. Total & change vs. 2021-22 in service attributes (% rated 4 or 5)
It was easy to get help when you needed it
2022-23, 70%, significantly lower than total, significantly higher than previous wave
GAP vs. TOTAL, -4 pts
2021-22, 61%
Service Canada specialized call centre phone representatives were helpful
2022-23, 80%, significnatly higher than previous wave
GAP vs. TOTAL, -3 pts
2021-22, 75%
Ease of getting help on your application when you needed it
2022-23, 65%, significantly lower than total, significantly higher than previous wave
GAP vs. TOTAL, -3 pts
2021-22, 61%
You were confident that your personal information was protected
2022-23, 86%, significantly lower than total, significantly higher than previous wave
GAP vs. TOTAL, -2 pts
2021-22, 84%
It was easy to access service in a language I could speak and understand well
2022-23, 92%, significantly lower than total, significantly higher than previous wave
GAP vs. TOTAL, -2 pts
2021-22, 90%
Proportion of Client Groups with Restrictions That Affect Accessing Service
Figure long description
Proportion of Clients
Youth (18 to 30), 29%
% At Least One, 42%
You are unable to visit a Service Canada office during business hours, 23%
You do not live in close proximity to a Service Canada office, 13%
You needed assistance from someone other than Service Canada staff, 15%
Application form was too long or complicated, 10%
You do not have access to a computer, 4%, significantly lower than total
You do not have access to the internet, 6%, significantly lower than total
You do not own a smart phone, 6%, significantly lower than total
You could not use the computer in a Service Canada Centre, 6%
Seniors (60+), 28%
% At Least One, 41%
You are unable to visit a Service Canada office during business hours, 16
You do not live in close proximity to a Service Canada office, 12%
You needed assistance from someone other than Service Canada staff, 13%
Application form was too long or complicated, 12%
You do not have access to a computer, 10%, significantly higher than total
You do not have access to the internet, 11%, significantly higher than total
You do not own a smart phone, 12%, significantly higher than total
You could not use the computer in a Service Canada Centre, 10%, significantly higher than total
OLMC, 4%
% At Least One, 53%
You are unable to visit a Service Canada office during business hours, 28%
You do not live in close proximity to a Service Canada office, 21%, significantly higher than total
You needed assistance from someone other than Service Canada staff, 21
Application form was too long or complicated, 15%
You do not have access to a computer, 9%
You do not have access to the internet, 10%
You do not own a smart phone, 11%
You could not use the computer in a Service Canada Centre, 4%
Non E or F speaking, 3%
% At Least One, 46%
You are unable to visit a Service Canada office during business hours, 26%
You do not live in close proximity to a Service Canada office, 18%
You needed assistance from someone other than Service Canada staff, 21%
Application form was too long or complicated, 16%
You do not have access to a computer, 2%
You do not have access to the internet, 7%
You do not own a smart phone, 12%
You could not use the computer in a Service Canada Centre, 9%
High school or less, 29%
% At Least One, 48%
You are unable to visit a Service Canada office during business hours, 22%
You do not live in close proximity to a Service Canada office, 14%
You needed assistance from someone other than Service Canada staff, 17%, significantly higher than total
Application form was too long or complicated, 15%, significantly higher than total
You do not have access to a computer, 12%, significantly higher than total
You do not have access to the internet, 12%, significantly higher than total
You do not own a smart phone, 13%, significantly higher than total
You could not use the computer in a Service Canada Centre, 13%, significantly higher than total
Indigenous, 7%
% At Least One, 46%
You are unable to visit a Service Canada office during business hours, 25%
You do not live in close proximity to a Service Canada office, 17%, significantly higher than total
You needed assistance from someone other than Service Canada staff, 18%, significantly higher than total
Application form was too long or complicated, 15%
You do not have access to a computer, 12%, significantly higher than total
You do not have access to the internet, 15%, significantly higher than total
You do not own a smart phone, 12%
You could not use the computer in a Service Canada Centre, 11%
Clients with disabilities, 10%
% At Least One, 56%, significantly higher than total
You are unable to visit a Service Canada office during business hours, 27%, significantly higher than total
You do not live in close proximity to a Service Canada office, 22%, significantly higher than total
You needed assistance from someone other than Service Canada staff, 22%, significantly higher than total
Application form was too long or complicated, 24%,significantly higher than total
You do not have access to a computer, 17%, significantly higher than total
You do not have access to the internet, 17%significantly higher than total
You do not own a smart phone, 15%, significantly higher than total
You could not use the computer in a Service Canada Centre, 17%, significantly higher than total
Remote, 2%
% At Least One, 45%
You are unable to visit a Service Canada office during business hours, 26%, significantly higher than total
You do not live in close proximity to a Service Canada office, 25%, significantly higher than total
You needed assistance from someone other than Service Canada staff, 21%, significantly higher than total
Application form was too long or complicated, 18%, significantly higher than total
You do not have access to a computer, 10%
You do not have access to the internet, 12%, significantly higher than total
You do not own a smart phone, 11%
You could not use the computer in a Service Canada Centre, 14%, significantly higher than total
Urban, 60%
% At Least One, 40%
You are unable to visit a Service Canada office during business hours, 19%
You do not live in close proximity to a Service Canada office, 11%, significantly lower than total
You needed assistance from someone other than Service Canada staff, 12%
Application form was too long or complicated, 12%
You do not have access to a computer, 6%, significantly lower than total
You do not have access to the internet, 7%, significantly lower than total
You do not own a smart phone, 9%
You could not use the computer in a Service Canada Centre, 7%, significantly lower than total
Rural, 38%
% At Least One, 43%
You are unable to visit a Service Canada office during business hours, 22%
You do not live in close proximity to a Service Canada office, 14%
You needed assistance from someone other than Service Canada staff, 13%
Application form was too long or complicated, 13%
You do not have access to a computer, 9%, significantly higher than total
You do not have access to the internet, 11%, significantly higher than total
You do not own a smart phone, 9%
You could not use the computer in a Service Canada Centre, 9%
E-vulnerable, 14%
% At Least One, 58%, significantly higher than total
You are unable to visit a Service Canada office during business hours, 24%, significantly higher than total
You do not live in close proximity to a Service Canada office, 19%, significantly higher than total
You needed assistance from someone other than Service Canada staff, 22%, significantly higher than total
Application form was too long or complicated, 20%, significantly higher than total
You do not have access to a computer, 19%, significantly higher than total
You do not have access to the internet, 17%, significantly higher than total
You do not own a smart phone, 18%
You could not use the computer in a Service Canada Centre, 20%, significantly higher than total
Newcomers (3 yrs. or fewer), 21%
% At Least One, 44%
You are unable to visit a Service Canada office during business hours, 22%
You do not live in close proximity to a Service Canada office, 16%, significantly higher than total
You needed assistance from someone other than Service Canada staff, 16%
Application form was too long or complicated, 9%, significantly lower than total
You do not have access to a computer, 4%, significantly lower than total
You do not have access to the internet, 9%
You do not own a smart phone, 10%
You could not use the computer in a Service Canada Centre, 9%
Language barrier, 5%
% At Least One, 63%
You are unable to visit a Service Canada office during business hours, 38%, significantly higher than total
You do not live in close proximity to a Service Canada office, 22%, significantly higher than total
You needed assistance from someone other than Service Canada staff, 23%, significantly higher than total
Application form was too long or complicated, 33%, significantly higher than total
You do not have access to a computer, 10%
You do not have access to the internet, 11%
You do not own a smart phone, 15%, significantly higher than total
You could not use the computer in a Service Canada Centre, 17%, significantly higher than total
Mobile only, 10%
% At Least One, 59%, significantly higher than total
You are unable to visit a Service Canada office during business hours, 31%, significantly higher than total
You do not live in close proximity to a Service Canada office, 19%, significantly higher than total
You needed assistance from someone other than Service Canada staff, 23%, significantly higher than total
Application form was too long or complicated, 18%, significantly higher than total
You do not have access to a computer, 22%, significantly higher than total
You do not have access to the internet, 20%, significantly higher than total
You do not own a smart phone, 17%, significantly higher than total
You could not use the computer in a Service Canada Centre, 19%, significantly higher than total
No devices, 3%
% At Least One, 59%, significantly higher than total
You are unable to visit a Service Canada office during business hours, 22%
You do not live in close proximity to a Service Canada office, 23%, significantly higher than total
You needed assistance from someone other than Service Canada staff, 19%
Application form was too long or complicated, 24%, significantly higher than total
You do not have access to a computer, 31%, significantly higher than total
You do not have access to the internet, 31%, significantly higher than total
You do not own a smart phone, 23%, significantly higher than total
You could not use the computer in a Service Canada Centre, 20%, significantly higher than total
Clients with restrictons, 41%
% At Least One, 100%
You are unable to visit a Service Canada office during business hours, 49%, significantly higher than total
You do not live in close proximity to a Service Canada office, 31%, significantly higher than total
You needed assistance from someone other than Service Canada staff, 33%, significantly higher than total
Application form was too long or complicated, 30%, significantly higher than total
You do not have access to a computer, 18%, significantly higher than total
You do not have access to the internet, 21%, significantly higher than total
You do not own a smart phone, 22%, significantly higher than total
You could not use the computer in a Service Canada Centre, 20%, significantly higher than total
Racialized, 36%
% At Least One, 46%
You are unable to visit a Service Canada office during business hours, 23%, significantly higher than total
You do not live in close proximity to a Service Canada office, 14%
You needed assistance from someone other than Service Canada staff, 15%
Application form was too long or complicated, 12%
You do not have access to a computer, 7%
You do not have access to the internet, 9%
You do not own a smart phone, 10%
You could not use the computer in a Service Canada Centre, 8%
OLMC:
Official Language Minority Communities
Q45a. Some people experience difficulties applying for [INSERT ABBREV] because of barriers to accessing service. Thinking about your overall experience from getting information about, to applying for [INSERT ABBREV], did you experience difficulties for any of the following reasons …?
Base: All answering (n=varies)
Client Groups
Client Groups With Lower Satisfaction
Satisfaction was lower among clients with a language barrier, clients with disabilities, those with restrictions to accessing service, remote clients and rural clients compared to all clients.
Figure long description
Overall Satisfaction (% Rated 4 or 5)
Clients with a language barrier
2022-23, 50%
2021-22, 53%
Clients with disabilities
2022-23, 71%
2021-22, 69%
Clients with restrictions
2022-23, 77%
2021-22, 72%
Clients with no devices
2022-23, 80%
2021-22, 81%
E-vulnerable clients
2022-23, 82%
2021-22, 80%
To improve the client experience among these groups, focus should be placed on the service areas with the largest gaps compared to all clients.
Figure long description
Largest gaps in service attributes vs. all clients
Clients with a language barrier
Helpfulness of 1 800 O-Canada representatives
Ease of finding out the information needed to apply
Helpfulness of specialized call center representatives
Ease of finding out information about the program
Clients with disabilities
Ease of putting together the information needed to apply
Ability to move smoothly through all of the steps
Ease of finding out information about the program
Needing to explain your situation only once
Clients with access restrictions
Ease of finding out the information needed to apply
Ability to find the needed information in a reasonable amount of time
Ease of understanding requirements of the application
Ease of understanding information about the program
Remote clients
Ease of understanding information about the program
You needed to explain your situation only once
Confidence in issue resolution
The amount of time it took was reasonable
Rural clients
Ease of finding out the steps to apply
You received consistent information
Proportion of Client Groups: by Program
Presence of client groups differed significantly by program due in large part to program design.
Figure long description
2021-22 Proportion of Clients
Youth (18 to 30) 29%
EI
2020-21, 29%
2021-22, 28%
2022-23, 26%, significantly lower than total
CPPD
2020-21, 3%
2021-22, 5%
2022-23, 5%, significantly lower than total
SIN
2020-21, 57%
2021-22, 58%
2022-23, 55%, significantly higher than total
Seniors (60+), 28%
EI
2020-21, 15%
2021-22, 13%
2022-23, 14%, significantly lower than total
CPP
2020-21, 96%
2021-22, 96%
2022-23, 94%, significantly higher than total
CPPD
2020-21, 25%
2021-22, 20%
2022-23, 15%, significantly lower than total
SIN
2020-21, 4%
2021-22, 2%
2022-23, 5%, significantly higher than total, significantly higher than previous wave
OAS/GIS
2020-21, 100%
2021-22, 100%
2022-23, 100%, significantly higher than total
OLMC 4%
EI
2020-21, 4%
2021-22, 4%
2022-23, 4%
CPP
2020-21, 2%
CPPD
2020-21, 2%
2021-22, 1%
2022-23, 1%, significantly lower than total
SIN
2020-21, 9%
2021-22, 5%
2022-23, 5%, significantly higher than total
OAS/GIS
2020-21, 5%
2021-22, 4%
2022-23, 3%
Non E or F speaking 3%
EI
2020-21, 2%
2021-22, 1%
2022-23, 1%, significantly lower than total
CPP
2020-21, 1%
2021-22, 2%
CPPD
2020-21, 3%
2021-22, 1%
2022-23, 1%, significantly lower than total
SIN
2020-21, 6%
2021-22, 5%
2022-23, 6%, significantly higher than total
OAS/GIS
2020-21, 1%
2021-22, 1%
2022-23, 1%, significantly lower than total
High school or less 29%
EI
2020-21, 33%
2021-22, 35%
2022-23, 32%, significantly higher than total
CPP
2020-21, 41%
2021-22, 34%
2022-23, 32%
CPPD
2020-21, 41%
2021-22, 36%
2022-23, 36%, significantly higher than total
SIN
2020-21, 19%
2021-22, 20%
2022-23, 20%, significantly lower than total
OAS/GIS
2020-21, 43%
2021-22, 35%
2022-23, 35%, significantly higher than total
Indigenous 7%
EI
2020-21, 12%
2021-22, 7%
2022-23, 8%
CPP
2020-21, 5%
2021-22, 5%
2022-23, 3%, significantly higher than total, significantly lower than previous wave
CPPD
2020-21, 8%
2021-22, 9%
2022-23, 8%
SIN
2020-21, 7%
2021-22, 7%
2022-23, 7%
OAS/GIS
2020-21, 3%
2021-22, 4%
2022-23, 4%, significantly lower than total
Clients with disabilities 10%
EI
2020-21, 6%
2021-22, 7%
2022-23, 9%
CPP
2020-21, 11%
2021-22, 12%
2022-23, 12%, significantly higher than total
CPPD
2020-21, 84%
2021-22, 83%
2022-23, 81%, significantly higher than total
SIN
2020-21, 3%
2021-22, 3%
2022-23, 2%, significantly lower than total
OAS/GIS
2020-21, 15%
2021-22, 11%
2022-23, 16%, significantly higher than total, significantly higher than previous wave
Remote 2%
EI
2020-21, 3%
2021-22, 3%
2022-23, 4%
CPP
2020-21, 2%
2021-22, 2%
2022-23, 2%
CPPD
2020-21, 3%
2021-22, 2%
2022-23, 2%
SIN
2020-21, 1%
2021-22, 1%
2022-23, 1%
OAS/GIS
2020-21, 2%
2021-22, 2%
2022-23, 1%, significantly lower than total
Urban 60%
EI
2020-21, 56%
2021-22, 51%
2022-23, 51%, significantly lower than total
CPP
2020-21, 54%
2021-22, 54%
2022-23, 54%, significantly lower than total
CPPD
2020-21, 53%
2021-22, 53%
2022-23, 53%t, significantly lower than total
SIN
2020-21, 79%
2021-22, 75%
2022-23, 81%, significantly higher than total, significantly higher than previous wave
OAS/GIS
2020-21, 52%
2021-22, 51%
2022-23, 50%, significantly lower than total
Rural 38%
EI
2020-21, 41%
2021-22, 45%
2022-23, 46%, significantly higher than total
CPP
2020-21, 44%
2021-22, 43%
2022-23, 43%, significantly higher than total
CPPD
2020-21, 44%
2021-22, 44%
2022-23, 44%, significantly higher than total
SIN
2020-21, 18%
2021-22, 22%
2022-23, 18%, significantly lower than total
OAS/GIS
2020-21, 46%
2021-22, 47%
2022-23, 44%, significantly higher than total
E-vulnerable 14%
EI
2020-21, 11%
2021-22, 14%
2022-23, 10%, significantly lower than total, significantly lower than previous wave
CPP
2020-21, 26%
2021-22, 27%
2022-23, 19%, significantly higher than total, significantly lower than previous wave
CPPD
2020-21, 26%
2021-22, 19%
2022-23, 20%, significantly higher than total
SIN
2020-21, 9%
2021-22, 11%
2022-23, 15%, significantly higher than previous wave
OAS/GIS
2020-21, 22%
2021-22, 24%
2022-23, 23%, significantly higher than total
Newcomers (3 yrs. or fewer) 21%
EI
2020-21, 2%
2021-22, 2%
2022-23, 5%, significantly lower than total, significantly higher than previous wave
SIN
2020-21, 44%
2021-22, 58%
2022-23, 62%, significantly higher than total
Language barrier 5%
EI
2020-21, 4%
2021-22, 5%
2022-23, 5%
CPP
2020-21, 7%
2021-22, 5%
2022-23, 4%
CPPD
2020-21, 13%
2021-22, 7%
2022-23, 10%, significantly higher than total
SIN
2020-21, 4%
2021-22, 6%
2022-23, 6%
OAS/GIS
2020-21, 5%
2021-22, 7%
2022-23, 6%
Mobile only 10%
EI
2020-21, 9%
2021-22, 9%
2022-23, 10%
CPP
2020-21, 5%
2021-22, 6%
2022-23, 5%, significantly lower than total
CPPD
2020-21, 11%
2021-22, 13%,
2022-23, 12%, significantly higher than total
SIN
2020-21, 9%
2021-22, 15%
2022-23, 14%, significantly higher than total
OAS/GIS
2020-21, 9%
2021-22, 6%
2022-23, 7%
No devices 3%
EI
2020-21, 2%
2021-22, 1%
2022-23, 1%, significantly lower than total
CPP
2020-21, 8%
2021-22, 5%
2022-23, 6%, significantly higher than total
CPPD
2020-21, 7%
2021-22, 4%
2022-23, 6%, significantly higher than total
SIN
2020-21, 1%
2021-22, 2%
2022-23, 3%
OAS/GIS
2020-21, 9%
2021-22, 10%
2022-23, 6%, significantly higher than total, significantly lower than previous wave
Clients with restrictions 41%
EI
2020-21, 46%
2021-22, 43%
2022-23, 40%
CPP
2020-21, 47%
2021-22, 43%
2022-23, 39%
CPPD
2020-21, 80%
2021-22, 67%
2022-23, 66%, significantly higher than total
SIN
2020-21, 52%
2021-22, 46%
2022-23, 42%
OAS/GIS
2020-21, 43%
2021-22, 38%
2022-23, 35%, significantly lower than total
Racialized 36%
EI
2020-21, 24%
2021-22, 24%
2022-23, 24%significantly lower than total
CPP
2020-21, 11%
2021-22, 11%
2022-23, 8%, significantly lower than total
CPPD
2020-21, 16%
2021-22, 18%
2022-23, 15%, significantly lower than total
SIN
2020-21, 72%
2021-22, 79%
2022-23, 76%, significantly higher than total
OAS/GIS
2020-21, 9%
2021-22, 8%
2022-23, 6%
OLMC:
Official Language Minority Communities
Proportion of Client Groups: by Region
Among clients in the West and the Territories, there was a higher portion of non-English or French speaking clients, Indigenous clients, remote clients and those with a language barrier compared to all clients.
Among clients in Ontario, there was a higher portion of youth, urban clients, Racialized clients and newcomers.
Among clients in Quebec, there was a higher proportion of OLMC clients, those with a high school education or less, the E-vulnerable and those with mobile only.
Among clients in Atlantic Canada, there was a higher proportion of OLMC clients, remote clients and rural clients.
Figure long description
2021-22 Proportion of clients
Youth (18 to 30) 29%
West/ Territories
2020-21, n=1626, 30%
2021-22, n=1533, 30%
2022-23, n=1524, 30%
Ontario
2020-21, n=1148, 34%
2021-22, n=1501, 37%
2022-23, n=1701, 34%, significantly higher than total
Quebec
2020-21, n=1006, 28%
2021-22, n=750, 24%
2022-23, n=570, 20%, significantly lower than total
Atlantic
2020-21, n=420, 26%
2021-22, n=416, 26%
2022-23, n=405, 24%
Seniors (60+) 28%
West/ Territories
2020-21, n=1626, 29%
2021-22, n=1533, 29%
2022-23, n=1524, 28%
Ontario
2020-21, n=1148, 29%
2021-22, n=1501, 26%
2022-23, n=1701, 27%
Quebec
2020-21, n=1006, 28%
2021-22, n=750, 26%
2022-23, n=570, 29%
Atlantic
2020-21, n=420, 33%
2021-22, n=416, 33%
2022-23, n=405, 32%
OLMC 4%
West/ Territories
2020-21, n=1626, 1%
Ontario
2020-21, n=1148, 2%
2022-23, n=1701, 1%, significantly lower than total
Quebec
2020-21, n=1006, 17%
2021-22, n=750, 17%
2022-23, n=570, 13%, significantly higher than total, significantly lower than previous wave
Atlantic
2020-21, n=420, 8%
2021-22, n=1416, 1%
2022-23, n=405, 4%, significantly higher than total, significantly higher than previous wave
Non E or F speaking 3%
West/ Territories
2020-21, n=1626, 3%
2021-22, n=1533, 3%
2022-23, n=,1524 4%
Ontario
2020-21, n=1148, 3%
2021-22, n=1501, 3%
2022-23, n=1701, 3%
Quebec
2020-21, n=1006, 2%
2021-22, n=750, 2%
2022-23, n=570, 1%
Atlantic
2020-21, n=420, 2%
2022-23, n=405, 4%
High school or less 29%
West/ Territories
2020-21, n=1626, 35%
2021-22, n=1533, 31%
2022-23, n=1524, 30%
Ontario
2020-21, n=1148, 27%
2021-22, n=1501, 27%
2022-23, n=1701, 23%, significantly lower than total, significantly lower than previous wave
Quebec
2020-21, n=1006, 30%
2021-22, n=750, 35%
2022-23, n=570, 36%, significantly higher than total
Atlantic
2020-21, n=420, 35%
2021-22, n=1416, 35%
2022-23, n=405, 33%
Indigenous 7%
West/ Territories
2020-21, n=1626, 10%
2021-22, n=1533, 11%
2022-23, n=1524, 9%, significantly higher than total
Ontario
2020-21, n=1148, 7%
2021-22, n=1501, 4%
2022-23, n=1701, 6%, significnatly higher than previous wave
Quebec
2020-21, n=1006, 8%
2021-22, n=750, 4%
2022-23, n=570, 6%, significantly higher than previous wave
Atlantic
2020-21, n=420, 10%
2021-22, n=416, 6%
2022-23, n=405, 5%
Clients with disabilities 10%
West/ Territories
2020-21, n=1626, 10%
2021-22, n=1533, 10%
2022-23, n=1524, 10%
Ontario
2020-21, n=1148, 7%
2021-22, n=1501, 10%
2022-23, n=1701, 10%
Quebec
2020-21, n=1006, 8%
2021-22, n=750, 2%
2022-23, n=570, 6%, significantly lower than total
Atlantic
2020-21, n=420, 10%
2021-22, n=416, 10%
2022-23, n=405, 14%
Remote 2%
West/ Territories
2020-21, n=1626, 4%
2021-22, n=1533, 6%
2022-23, n=1524, 3%, significantly higher than total, significantly lower than previous wave
Ontario
2020-21, n=1148, 1%
2022-23, n=1701, 1%, significantly lower than total
Quebec
2020-21, n=1006, 1%
2021-22, n=750, 2%
2022-23, n=570, 3%
Atlantic
2020-21, n=420, 4%
2021-22, n=416, 1%
2022-23, n=405, 6%, significantly higher than total, significantly higher than previous wave
Urban 60%
West/ Territories
2020-21, n=1626, 62%
2021-22, n=1533, 55%
2022-23, n=1524, 59%
Ontario
2020-21, n=1148, 69%
2021-22, n=1501, 70%
2022-23, n=1701, 72%, significantly higher than total
Quebec
2020-21, n=1006, 65%
2021-22, n=750, 56%
2022-23, n=1701, 56%
Atlantic
2020-21, n=420, 30%
2021-22, n=416, 25%,
2022-23, n=405, 23%, significantly lower than total
Rural 38%
West/ Territories
2020-21, n=1626, 33%
2021-22, n=1533, 38%
2022-23, n=1524, 37%
Ontario
2020-21, n=1148, 30%
2021-22, n=1501, 29%
2022-23, n=1701, 28%, significantly lower than total
Quebec
2020-21, n=1006, 33%
2021-22, n=750, 41%
2022-23, n=570, 42%
Atlantic
2020-21, n=420, 67%
2021-22, n=1416, 72%
2022-23, n=405, 70%, significantly higher than total
E-vulnerable 14%
West/ Territories
2020-21, n=1626, 14%
2021-22, n=1533, 14%
2022-23, n=1524, 13%
Ontario
2020-21, n=1148, 13%
2021-22, n=1501, 15%
2022-23, n=1701, 13%
Quebec
2020-21, n=1006, 13%
2021-22, n=750, 16%
2022-23, n=570, 17%, significantly higher than total
Atlantic
2020-21, n=420, 16%
2021-22, n=416, 17%
2022-23, n=405, 14%
Newcomers (3 yrs. or fewer) 21%
West/ Territories
2020-21, n=1626, 14%
2021-22, n=1533, 17%
2022-23, n=1524, 21%, significantly higher than previous wave
Ontario
2020-21, n=1148, 18%
2021-22, n=1501, 21%
2022-23, n=1701, 24%, significantly higher than total, significantly higher than previous wave
Quebec
2020-21, n=1006, 11%
2021-22, n=750, 16%
2022-23, n=570, 17%
Atlantic
2020-21, n=420, 9%
2021-22, n=1416, 11%
2022-23, n=405, 10%, significantly lower than total
Language barrier 5%
West/ Territories
2020-21, n=1626, 5%
2021-22, n=1533, 8%
2022-23, n=1524, 7%, significantly higher than total
Ontario
2020-21, n=1148, 3%
2021-22, n=1501, 5%
2022-23, n=1701, 5%
Quebec
2020-21, n=1006, 6%
2021-22, n=750, 5%
2022-23, n=570, 4%
Atlantic
2020-21, n=420, 5%
2021-22, n=416, 4%
2022-23, n=405, 3%
Mobile only 10%
West/ Territories
2020-21, n=1626, 11%
2021-22, n=1533, 9%
2022-23, n=1524, 10%
Ontario
2020-21, n=1148, 8%
2021-22, n=1501, 9%
2022-23, n=1701, 9%, significantly lower than total
Quebec
2020-21, n=1006, 9%
2021-22, n=750, 12%
2022-23, n=570, 14%, significantly higher than total
Atlantic
2020-21, n=420, 5%
2021-22, n=416, 12%
2022-23, n=405, 11%
No devices 3%
West/ Territories
2020-21, n=1626, 3%
2021-22, n=1533, 3%
2022-23, n=1524, 3%
Ontario
2020-21, n=1148, 3%
2021-22, n=1501, 3%
2022-23, n=1701, 2%
Quebec
2020-21, n=1006, 3%
2021-22, n=750, 3%
2022-23, n=570, 3%
Atlantic
2020-21, n=420, 4%
2021-22, n=1416, 2%
2022-23, n=405, 4%
Clients with restrictions 41%
West/ Territories
2020-21, n=1626, 51%
2021-22, n=1533, 44%
2022-23, n=1524, 42%
Ontario
2020-21, n=1148, 49%
2021-22, n=1501, 46%
2022-23, n=1701, 39%, significantly lower than previous wave
Quebec
2020-21, n=1006, 46%
2021-22, n=750, 42%
2022-23, n=570, 44%
Atlantic
2020-21, n=420, 38%
2021-22, n=1416, 38%
2022-23, n=405, 35%
Racialized 36%
West/ Territories
2020-21, n=1626, 35%
2021-22, n=1533, 33%
2022-23, n=1524, 36%
Ontario
2020-21, n=1148, 44%
2021-22, n=1501, 47%
2022-23, n=1701, 43%, significantly higher than total, significantly lower than previous wave
Quebec
2020-21, n=1006, 26%
2021-22, n=750, 30%
2022-23, n=570, 31%, significantly lower than total
Atlantic
2020-21, n=420, 18%
2021-22, n=1416, 19%
2022-23, n=405, 14%, significantly lower than total
OLMC:
Official Language Minority Communities
Client Groups: Satisfaction
Figure long description
Proportion of Client Groups Satisfiefied (% Rated 4 or 5)
Youth (18 to 30) 29%
2018-19, 86%
2019-20, 84%
2020-21, 85%
2021-22, 79%
2022-23, 85%, significantly higher than previous wave
Seniors (60+) 28%
2018-19, 87%
2019-20, 86%
2020-21, 87%
2021-22, 84%
2022-23, 85%, significantly higher than total
OLMC 4%
2018-19, 91%
2019-20, 90%
2020-21, 90%
2021-22, 8%
2022-23, 85%
Non-E or F speaking 3%
2018-19, 80%
2019-20, 92%
2020-21, 90%
2021-22, 89%
2022-23, 89%
High school or less 29%
2018-19, 85%
2019-20, 84%
2020-21, 86%
2021-22, 80%
2022-23, 83%, significantly higher than previous wave
Indigenous 7%
2018-19, 85%
2019-20, 79%
2020-21, 83%
2021-22, 80%
2022-23, 83%
Clients with disabilities 10%
2018-19, 79%
2019-20, 76%
2020-21, 76%
2021-22, 69%
2022-23, 71%, significantly lower than total
Remote 2%
2018-19, 88%
2019-20, 80%
2020-21, 88%
2021-22, 81%
2022-23, 80%
Urban 60%
2018-19, 86%
2019-20, 85%
2020-21, 86%
2021-22, 81%
2022-23, 84%, significantly higher than previous wave
Rural 38%
2018-19, 83%
2019-20, 82%
2020-21, 85%
2021-22, 80%
2022-23, 82%
E-vulnerable 14%
2018-19, 84%
2019-20, 85%
2020-21, 82%
2021-22, 79%
2022-23, 85%, significantly higher than previous wave
Newcomers (≤3 years) 21%
2018-19, 93%
2019-20, 94%
2020-21, 93%
2021-22, 90%
2022-23, 94%, significantly higher than total, significantly higher than previous wave
Language barrier 5%
2018-19, 42%
2019-20, 52%
2020-21, 55%
2021-22, 53%
2022-23, 50%, significantly lower than total
Mobile only 10%
2018-19, 85%
2019-20, 85%
2020-21, 83%
2021-22, 82%
2022-23, 83%
No devices 3%
2018-19, 83%
2019-20, 81%
2020-21, 80%
2021-22, 71%
2022-23, 83%, significnatly higher than previous wave
Clients with access restrictions 41%
2019-20, 79%
2020-21, 80%
2021-22, 72%
2022-23, 77%, significantly lower than total, significantly higher than previous wave
Racialized 36%
2020-21, 89%
2021-22, 84%
2022-23, 89%, significantly higher than total, significantly higher than previous wave
OLMC:
Official Language Minority Communities
Q45a. Some people experience difficulties applying for [INSERT ABBREV] because of barriers to accessing service. Thinking about your overall experience from getting information about, to applying for [INSERT ABBREV], did you experience difficulties for any of the following reasons …? A response of ‘yes’ means it was a barrier for you and caused difficulties applying and a response of ‘no’ means it was not a barrier.
Base: All answering (n=varies)
Client Groups: Proportion with a Disability
Figure long description
Proportion of Client Groups, Proportion with a disability
Youth (18 to 30) 29%
2018-19, 3%
2019-20, 3%
2020-21, 4%
2021-22, 6%
2022-23, 5%, significantly lower than total
Seniors (60+) 28%
2018-19, 17%
2019-20, 12%
2020-21, 13%
2021-22, 11%
2022-23, 13%, significantly higher than total
OLMC 4%
2018-19, 3%
2019-20, 2%
2020-21, 3%
2021-22, 4%
2022-23, 10%, significantly higher than previous wave
Non-E or F speaking 3%
2018-19, 5%
2019-20, 5%
2020-21, 2%
2021-22, 3%
2022-23, 5%
High school or less 29%
2018-19, 13%
2019-20, 11%
2020-21, 13%
2021-22, 9%
2022-23, 13%, significantly higher than total, significantly higher than previous wave
Indigenous 7%
2018-19, 14%
2019-20, 13%
2020-21, 13%
2021-22, 14%
2022-23, 16%, significantly higher than total
Clients with disabilities 10%
2018-19, 100%
2019-20, 100%
2020-21, 100%
2021-22, 100%
2022-23, 100%, significantly higher than total
Remote 2%
2018-19, 9%
2019-20, 4%
2020-21, 12%
2021-22, 11%
2022-23, 12%
Urban 60%
2018-19, 9%
2019-20, 6%
2020-21, 7%
2021-22, 8%
2022-23, 8%, significantly lower than total
Rural 38%
2018-19, 10%
2019-20, 9%
2020-21, 11%
2021-22, 8%
2022-23, 11%, significantly higher than total, significnatly higher than previous wave
E-vulnerable 14%
2018-19, 18%
2019-20, 14%
2020-21, 16%
2021-22, 11%
2022-23, 15%, significantly higher than total, significantly higher than previous wave
Newcomers (≤3 years) 21%
2018-19, 1%
2019-20, 1%
2020-21, 0%
2021-22, 2%
2022-23, 2%, significantly lower than total
Language barrier 5%
2018-19, 18%
2019-20, 19%
2020-21, 16%
2021-22, 12%
2022-23, 12%
Mobile only 10%
2018-19, 11%
2019-20, 8%
2020-21, 32%
2021-22, 12%
2022-23, 10%
No devices 3%
2018-19, 23%
2019-20, 15%
2020-21, 10%
2021-22, 20%
2022-23, 31%, significantly higher than total, significantly higher than previous wave
Clients with access restrictions 41%
2019-20, 14%
2020-21, 13%
2021-22, 12%
2022-23, 13%, significantly higher than total
Racialized 36%
2020-21, 3%
2021-22, 4%
2022-23, 5%, significantly lower than total
OLMC:
Official Language Minority Communities
Q45a. Some people experience difficulties applying for [INSERT ABBREV] because of barriers to accessing service. Thinking about your overall experience from getting information about, to applying for [INSERT ABBREV], did you experience difficulties for any of the following reasons …? A response of ‘yes’ means it was a barrier for you and caused difficulties applying and a response of ‘no’ means it was not a barrier.
Base: All answering (n=varies)
Client Groups by Channel
Figure long description
Proportion of client group, satisfaction with service channels (% Rated 4 or 5)
Total
In-person
2019-20, 86%
2020-21, 86%
2021-22, 81%
2022-23, 83%
Canada.ca
2019-20, 73%
2020-21, 78%
2021-22, 74%
2022-23, 75%
MSCA
2019-20, 75%
2020-21, 75%
2021-22, 70%
2022-23, 73%
Sample Youth (18 to 30) 29%
In-person
2019-20, 86%
2020-21, 88%
2021-22, 82%
2022-23, 86%
Canada.ca
2019-20, 77%
2020-21, 77%
2021-22, 75%
2022-23, 77%
MSCA
2019-20, 76%
2020-21, 83%
2021-22, 68%
2022-23, 77%
Seniors (60+) 28%
In-person
2019-20, 84%
2020-21, 83%
2021-22, 81%
2022-23, 77%, significantly lower than total
Canada.ca
2019-20, 70%
2020-21, 78%
2021-22, 70%
2022-23, 72%
MSCA
2019-20, 74%
2020-21, 71%
2021-22, 72%
2022-23, 70%
OLMC 4%
In-person
2019-20, 89%
2020-21, 88%
2021-22, 88%
2022-23, 82%
Canada.ca
2019-20, 83%
2020-21, 83%
2021-22, 80%
2022-23, 79%
MSCA
2019-20, 89%
2020-21, 88%
Non-E or F speaking 3%
In-person
2019-20, 91%
2020-21, 99%
2021-22, 81%
2022-23, 91%
Canada.ca
2019-20, 80%
2020-21, 83%
2021-22, 79%
2022-23, 76%
MSCA
2019-20, 67%
High school or less 29%
In-person
2019-20, 88%
2020-21, 80%
2021-22, 78%
2022-23, 82%
Canada.ca
2019-20, 74%
2020-21, 79%
2021-22, 72%
2022-23, 73%
MSCA
2019-20, 77%
2020-21, 78%
2021-22, 71%
2022-23, 74%
Indigenous 7%
In-person
2019-20, 84%
2020-21, 77%
2021-22, 71%
2022-23, 83%, significantly higher than previous wave
Canada.ca
2019-20, 65%
2020-21, 73%
2021-22, 69%
2022-23, 74%
MSCA
2019-20, 76%
2020-21, 73%
2021-22, 78%
2022-23, 78%
Clients with disabilities 10%
In-person
2019-20, 80%
2020-21, 67%
2021-22, 70%
2022-23, 70%, significantly lower than total
Canada.ca
2019-20, 73%
2020-21, 62%
2021-22, 54%
2022-23, 61%, significantly lower than total, significnatly higher than previous wave
MSCA
2019-20, 69%
2020-21, 56%
2021-22, 68%
2022-23, 69%
Remote 2%
In-person
2019-20, 89%
2020-21, 82%
2021-22, 88%
2022-23, 85%
Canada.ca
2019-20, 76%
2020-21, 74%
2021-22, 82%
2022-23, 73%, significantly lower than previous wave
MSCA
2019-20, 89%
2020-21, 68%
2021-22, 66%
2022-23, 73%
Urban 60%
In-person
2019-20, 85%
2020-21, 89%
2021-22, 80%
2022-23, 83%
Canada.ca
2019-20, %73
2020-21, 79%
2021-22, 76%
2022-23, 77%
MSCA
2019-20, 73%
2020-21, 75%
2021-22, 72%
2022-23, 72%
Rural 38%
In-person
2019-20, 87%
2020-21, 80%
2021-22, 83%
2022-23, 83%
Canada.ca
2019-20, 73%
2020-21, 77%
2021-22, 70%
2022-23, 72%
MSCA
2019-20, 77%
2020-21, 74%
2021-22, 69%
2022-23, 75%
E-vulnerable 14%
In-person
2019-20, 85%
2020-21, 79%
2021-22, 83%
2022-23, 86%
Canada.ca
2019-20, 67%
2020-21, 74%
2021-22, 63%
2022-23, 67%, significantly lower than total
MSCA
2019-20, 74%
2020-21, 68%
2021-22, 58%
2022-23, 52%, significantly lower than total
Newcomers (≤3 years) 21%
In-person
2019-20, 88%
2020-21, 95%
2021-22, 88%
2022-23, 92%, significantly higher than total
Canada.ca
2019-20, 86%
2020-21, 89%
2021-22, 87%
2022-23, 86%, significantly higher than total
MSCA
2019-20, 69%
2020-21, 84%
Language barrier 5%
In-person
2020-21, 55%
2021-22, 51%
2022-23, 63%
Canada.ca
2020-21, 44%
2021-22, 46%
2022-23, 46%
MSCA
2020-21, 42%
2021-22, 49%
2022-23, 41%
Mobile only 10%
In-person
2019-20, 90%
2020-21, 85%
2021-22, 87%
2022-23, 87%
Canada.ca
2019-20, 63%
2020-21, 71%
2021-22, 76%
2022-23, 70%
MSCA
2019-20, 95%
2020-21, 78%
2021-22, 72%
2022-23, 73%
No devices 3%
In-person
2019-20, 81%
2020-21, 75%
2021-22, 80%
2022-23, 73%, significantly lower than total
Canada.ca
2019-20, 44%
2020-21, 75%
2021-22, 51%
2022-23, 61%, significantly lower than total
Clients with access restrictions 41%
In-person
2019-20, 80%
2020-21, 82%
2021-22, 76%
2022-23, 77%, significantly lower than total
Canada.ca
2019-20, 70%
2020-21, 71%
2021-22, 63%
2022-23, 67%, significantly lower than total, significantly higher than previous wave
MSCA
2019-20, 65%
2020-21, 69%
2021-22, 62%
2022-23, 69%, significnatly higher than previous wave
Racialized 36%
In-person
2020-21, 92%
2021-22, 85%
2022-23, 87%, significantly higher than total
Canada.ca
2020-21, 85%
2021-22, 79%
2022-23, 84%, significantly higher than total, significantly higher than previous wave
MSCA
2020-21, 81%
2021-22, 81%
2022-23, 83%, significantly higher than total
* Small sample size. Results should be interpreted with caution. ** Sample sizes too small for reporting.
OLMC:
Official Language Minority Communities
Base: All answering (n=varies)
Figure long description
Proportion of client group, satisfaction with service channels (% Rated 4 or 5)
Total Sample
Specialized call centres
2019-20, 60%
2020-21, 72%
2021-22, 64%
2022-23, 72%, singificantly higher than previous wave
1 800 O-Canada
2019-20, 69%
2020-21, 72%
2021-22, 59%
2022-23, 70%
eServiceCanada
2020-21, 82%
2021-22, 76%
2022-23, 72%
Youth (18 to 30) 29%
Specialized call centres
2019-20, 67%
2020-21, 76%
2021-22, 64%
2022-23, 71%
1 800 O-Canada
2019-20, 69%
2020-21, 72%
2021-22, 59%
2022-23, 70%
eServiceCanada
2020-21, 82%
2021-22, 76%
2022-23, 72%
Seniors (60+) 28%
Specialized call centres
2019-20, 63%
2020-21, 76%
2021-22, 64%
2022-23, 77%, significantly higher than previous wave
1 800 O-Canada
2019-20, 79%
2020-21, 79%
2021-22, 47%
2022-23, 67%
eServiceCanada
2020-21, 88%
2021-22, 83%
2022-23, 81%
OLMC 4%
Specialized call centres
2019-20, 82%
2020-21, 68%
2021-22, 74%
2022-23, 83%
1 800 O-Canada
2019-20, 78%
Non-E or F speaking 3%
Specialized call centres
2019-20, 80%
2020-21, 96%
1 800 O-Canada
2019-20, 82%
High school or less 29%
Specialized call centres
2019-20, 64%
2020-21, 74%
2021-22, 67%
2022-23, 73%
1 800 O-Canada
2019-20, 73%
2020-21, 80%
2021-22, 60%
2022-23, 69%
eServiceCanada
2020-21, 83%
2021-22, 83%
2022-23, 72%
Indigenous 7%
Specialized call centres
2019-20, 63%
2020-21, 73%
2021-22, 62%
2022-23, 75%, significantly higher than preivous wave
1 800 O-Canada
2019-20, 52%
2020-21, 83%
2021-22, 56%
2022-23, 68%, significantly higher than previous wave
eServiceCanada
2020-21, 89%
2021-22, 75%
2022-23, 76%
Clients with disabilities 10%
Specialized call centres
2019-20, 66%
2020-21, 60%
2021-22, 57%
2022-23, 67%, significantly lower than total, significnatly higher than previous wave
1 800 O-Canada
2019-20, 70%
2020-21, 48%
2021-22, 51%
2022-23, 78%, significantly higher than previous wave
eServiceCanada
2020-21, 71%
2021-22, 70%
2022-23, 68%
Remote 2%
Specialized call centres
2019-20, 71%
2020-21, 72%
2021-22, 75%
2022-23, 77%
1 800 O-Canada
2019-20, 74%
2020-21, 80%
2021-22, 79%
2022-23, 88%, significantly higher than total
eServiceCanada
2020-21, 73%
2021-22, 63%
2022-23, 64%
Urban 60%
Specialized call centres
2019-20, 62%
2020-21, 72%
2021-22, 68%
2022-23, 74%, significantly higher than previous wave
1 800 O-Canada
2019-20, 71%
2020-21, 71%
2021-22, 57%
2022-23, 73%, significantly higher than previous wave
eServiceCanada
2020-21, 84%
2021-22, 74%
2022-23, 76%
Rural 38%
Specialized call centres
2019-20, 60%
2020-21, 73%
2021-22, 64%
2022-23, 72%, significantly higher than previous wave
1 800 O-Canada
2019-20, 65%
2020-21, 74%
2021-22, 57%
2022-23, 65%
eServiceCanada
2020-21, 80%
2021-22, 79%
2022-23, 65%, signficantly lower than previous wave
E-vulnerable 14%
Specialized call centres
2019-20, 70%
2020-21, 74%
2021-22, 70%
2022-23, 73%
1 800 O-Canada
2019-20, 69%
2020-21, 75%
2021-22, 61%
2022-23, 61%
eServiceCanada
2020-21, 73%
2021-22, 68%
2022-23, 70%
Newcomers (≤3 years) 21%
Specialized call centres
2019-20, 77%
2020-21, 87%
2021-22, 85%
2022-23, 94%, significantly higher than total
1 800 O-Canada
2019-20, 83%
2022-23, 94%, significantly higher than total
eServiceCanada
2020-21, 92%
2021-22, 90%
2022-23, 84%, significnatly lower than previous wave
Language barrier 5%
Specialized call centres
2020-21, 32%
2021-22, 39%
2022-23, 39%, significantly lower than total
1 800 O-Canada
2020-21, 31%
2022-23, 31%, significantly lower than total
eServiceCanada
2020-21, 53%
2021-22, 53%
2022-23, 36%, significantly lower than total
Mobile only 10%
Specialized call centres
2019-20, 67%
2020-21, 77%
2021-22, 72%
2022-23, 71%
1 800 O-Canada
2019-20, 54%
2020-21, 66%
2021-22, 67%
2022-23, 73%
eServiceCanada
2020-21, 86%
2021-22, 78%
2022-23, 74%
No devices 3%
Specialized call centres
2019-20, 71%
2020-21, 70%
2021-22, 40%
2022-23, 78%, significnatly higher than previous wave
1 800 O-Canada
2019-20, 77%
2020-21, 85%
2021-22, 71%
Clients with access restrictions 41%
Specialized call centres
2019-20, 61%
2020-21, 68%
2021-22, 60%
2022-23, 67%, significantly lower than total, significantly higher than previous wave
1 800 O-Canada
2019-20, 55%
2020-21, 72%
2021-22, 47%
2022-23, 55%, significantly lower than total, significantly higher than previous wave
eServiceCanada
2020-21, 83%
2021-22, 71%
2022-23, 70%
Racialized 36%
Specialized call centres
2020-21, 80%
2021-22, 71%
2022-23, 80%, significantly higher than total, significantly higher than previous wave
1 800 O-Canada
2020-21, 82%
2021-22, 63%
2022-23, 85%, significantly higher than total, significantly higher than previous wave
eServiceCanada
2020-21, 88%
2021-22, 83%
2022-23, 79%, significantly higher than total
* Small sample size. Results should be interpreted with caution. ** Sample sizes too small for reporting.
OLMC:
Official Language Minority Communities
Base: All answering (n=varies)
Proportion of Clients with Disabilities: Overall and by Program
One in ten clients identified as a person with a disability. CPP-D clients remained most likely, OAS/GIS clients also had a higher presence of disability compared to the proportion among all clients, while SIN clients had a lower proportion.
Compared to 2021-22, the proportion of OAS/GIS clients who identified as a person with a disability increased.
Figure long description
Have a Disability (% Yes) – Trending
Total
2018-19, n=4401, 9%
2019-20, n=2431, 7%
2020-21, n=4200, 8%
2021-22, n=4200, 8%
2022-23, n=4200, 10%
EI
2018-19, n=4401, 6%
2019-20, n=2431, 5%
2020-21, n=4200, 6%
2021-22, n=4200, 7%
2022-23, n=4200, 9%
CPP
2018-19, n=4401, 16%
2019-20, n=2431, 7%
2020-21, n=4200, 11%
2021-22, n=4200, 12%
2022-23, n=4200, 12%
CPPD
2018-19, n=4401, 92%
2019-20, n=2431, 83%
2020-21, n=4200, 84%
2021-22, n=4200, 83%
2022-23, n=4200, 81%, significantly higher than total
SIN
2018-19, n=4401, 3%
2019-20, n=2431, 3%
2020-21, n=4200, 3%
2021-22, n=4200, 3%
2022-23, n=4200, 2%, significantly lower than total
OAS/GIS
2018-19, n=4401, 19%
2019-20, n=2431, 17%
2020-21, n=4200, 15%
2021-22, n=4200, 11%
2022-23, n=4200, 16%, significantly higher than total, significantly higher than previous wave
Q44A. Do you identify as a person with a disability?
Base: All respondents (n=4200)
Type of Disability: Overall and by Program
The most common disability was a mobility restriction, followed by mental health-related and cognitive disabilities. The proportion who have a mental health-related disability decreased directionally compared to 2021-22, while the proportion who have a seeing disability increased.
CPP and OAS/GIS clients were more likely to have a mobility disability, and OAS/GIS clients were also more likely to have a seeing disability. Compared to 2021-22, OAS/GIS and CPP-D clients were less likely to have reported having a mental health-related disability while CPP-D clients were more likely to have reported having a seeing disability.
Figure long description
Type of Disability
Mobility (such as flexibility, dexterity, or pain)
Total
2020-21, n=916, 50%
2021-22, n=935, 45%
2022-23, n=1012, 46%
EI
2020-21, n=83, 38%
2021-22, n=66, 35%
2022-23, n=101, 31%
CPP
2020-21, n=95, 65%
2021-22, n=92, 64%
2022-23, n=95, 69, significantly higher than total
CPPD
2020-21, n=592, 55%
2021-22, n=628, 56%
2022-23, n=619, 58%
OAS/GIS
2020-21, n=123, 72%
2021-22, n=126, 61%
2022-23, n=110, 69%, significantly higher than total
Mental health-related
Total
2020-21, n=916, 21%
2021-22, n=935, 27%
2022-23, n=1012, 20%
EI
2020-21, n=83, 22%
2021-22, n=66, 31%
2022-23, n=101, 27%
CPP
2020-21, n=95, 13%
2021-22, n=92, 16%
2022-23, n=95, 11%, significantly lower than total
CPPD
2020-21, n=592, 30%
2021-22, n=628, 35%
2022-23, n=619, 26%, significantly lower than previous wave
OAS/GIS
2020-21, n=123, 2%
2021-22, n=126, 18%
2022-23, n=110, 7%, significantly lower than previous wave
Cognitive (such as learning, developmental, or memory)
Total
2020-21, n=916, 13%
2021-22, n=935, 18%
2022-23, n=1012, 20%
EI
2020-21, n=83, 19%
2021-22, n=66, 25%
2022-23, n=101, 24%
CPP
2020-21, n=95, 14%
2021-22, n=92, 11%
2022-23, n=95, 14%
CPPD
2020-21, n=592, 16%
2021-22, n=628, 15%
2022-23, n=619, 20%
OAS/GIS
2020-21, n=123, 2%
2021-22, n=126, 8%
2022-23, n=110, 12%, significantly lower than total
Seeing
Total
2020-21, n=916, 8%
2021-22, n=925, 4%
2022-23, n=1012, 9%, significantly higher than previous wave
EI
2020-21, n=83, 5%
2022-23, n=101, 6%
CPP
2020-21, n=95, 6%
2021-22, n=92, 7%
2022-23, n=95, 9%
CPPD
2020-21, n=592, 6%
2021-22, n=628, 4%
2022-23, n=619, 7%, significantly higher than previous wave
OAS/GIS
2020-21, n=123, 19%
2021-22, n=126, 8%
2022-23, n=,110 15%, significantly higher than total
Hearing
Total
2020-21, n=916, 9%
2021-22, n=935, 8%
2022-23, n=1012, 8%
EI
2020-21, n=83, 10%
2021-22, n=66, 7%
2022-23, n=101, 8%
CPP
2020-21, n=95, 11%
2021-22, n=92, 9%
2022-23, n=95, 13%
CPPD
2020-21, n=592, 5%
2021-22, n=628, 3%
2022-23, n=619, 4%
OAS/GIS
2020-21, n=123, 10%
2021-22, n=126, 14%
2022-23, n=110, 6%
Communicating
Total
2020-21, n=916, 2%
2021-22, n=935, 5%
2022-23, n=1012, 4%
EI
2020-21, n=83, 1%
2021-22, n=66, 2%
2022-23, n=101, 2%
CPP
2020-21, n=95, 1%
2021-22, n=92, 5%
2022-23, n=95, 3%
CPPD
2020-21, n=592, 3%
2021-22, n=628, 4%
2022-23, n=619, 5%
OAS/GIS
2020-21, n=123, 1%
2021-22, n=126, 1%
2022-23, n=110, 2%
** Sample sizes too small for reporting.
Q46A. What type of disability do you have?
Base: Have a disability (n=1012)
Clients with Disabilities
Clients who identified as a person with a disability had lower overall satisfaction compared to all clients and ratings were consistent compared to 2021-22.
Clients with disabilities were less satisfied with the service provided in-person, online and through specialized call centres.
Compared to 2021-22, clients with disabilities provided higher ratings for the quality of service provided online, through specialized call centres and through 1 800 O-Canada.
Figure long description
Overall Satisfaction (% Rated 4 or 5)
2018-19, 79%
2019-20, 76%
2020-21, 76%
2021-22, 69%
2022-23, 71%, significantly higher than total
Figure long description
Service Channel Satisfaction (% Rated 4 or 5)
1 800 O-Canada
2018-19, 50%
2019-20, 70%
2020-21, 48%, small sample size
2021-22, 51%
2022-23, 79%, significantly higher than previous wave/li>
eServiceCanada
2018-19, 71%
2019-20, 73%
2020-21, 62%
2021-22, 70%
2022-23, 68%
My Service Canada Account
2019-20, 69%
2020-21, 56%
2021-22, 68%
2022-23, 69%
Online
2020-21, 71%
2021-22, 54%
2022-23, 61%, significantly lower than total, significantly higher than previous wave
Specialized Call Centre
2018-19, 79%
2019-20, 80%
2020-21, 67%
2021-22, 57%
2022-23, 67%, significantly lower than total, significantly higher than previous wave
In person
2018-19, 69%
2019-20, 66%
2020-21, 60%
2021-22, 70%
2022-23, 70%, significantly lower than total
* Small sample size. Results should be interpreted with caution.
There were also many significant gaps in service attributes between clients with disabilities and clients overall. The largest gaps were for ease of putting together the information to apply, being able to move smoothly through all steps, ease of finding information about the program, needing to explain their situation only once and being confident any issues or problems would be easily resolved.
Compared to 2021-22, ratings have increased for the ease of figuring our eligibility, ease of applying overall, that completing steps online made the process easier, ease of getting help when needed, clarity of the issue resolution process, ease of finding out the information needed to apply and ease of finding out the steps to apply.
Figure long description
Widest gap vs. Total & change vs. 2021-22 in service attributes (% rated 4 or 5)
Ease of putting together the information needed to apply
2022-23, 61%, significantly lower than total
Gap vs. total, -18 pts
2021-22, 61%
You were able to move smoothly through all of the steps
2022-23, 68%, significantly lower than total
Gap vs. total, -16 pts
2021-22, 66%
Ease of finding out information about the program
2022-23, 63%, significantly lower than total
Gap vs. total, -15 pts
2021-22, 59%
You needed to explain your situation only once
2022-23, 60%, significantly lower than total
Gap vs. total, -15 pts
2021-22, 61%
You were confident that any issues or problems would have been easily resolved
2022-23, 61%, significantly lower than total
Gap vs. total, -14 pts
2021-22, 60%
You felt respected throughout the process applying
2022-23, 76%, significantly lower than total
Gap vs. total, -13 pts
2021-22, 67%
Throughout the process it was clear what would happen next and when it would happen
2022-23, 61%, significantly lower than total, significnatly higher than previous wave
Gap vs. total, -12 pts
2021-22, 48%
Ease of figuring out if you are eligible for benefits/ SIN card
2022-23, 80%, significantly lower than total
Gap vs. total, -12 pts
2021-22, 88%
Service Canada representatives that you dealt with in person were helpful
2022-23, 76%, significantly lower than total, significnatly higher than previous wave
Gap vs. total, -11 pts
2021-22, 69%
Overall, it was easy for you to apply for the program
2022-23, 75%, significantly lower than total, significnatly higher than previous wave
Gap vs. total, -11 pts
2021-22, 69%
Being able to complete steps online made the process easier
2022-23, 75%, significantly lower than total, significnatly higher than previous wave
Gap vs. total, -9 pts
2021-22, 59%
It was easy to get help when you needed it
2022-23, 65%, significantly lower than total, significnatly higher than previous wave
Gap vs. total, -9 pts
2021-22, 58%
It was clear what to do if you had a problem or question
2022-23, 69%, significantly lower than total, significnatly higher than previous wave
Gap vs. total, -9 pts
2021-22, 63%
Ease of finding out what information you need to provide when applying
2022-23, 69%, significantly lower than total, significnatly higher than previous wave
Gap vs. total, -8 pts
2021-22, 56%
Ease of finding out the steps to apply
2022-23, 72%, significantly lower than total, significnatly higher than previous wave
Gap vs. total, -7 pts
2021-22, 54%
Clients with Disabilities: Overall Satisfaction by Program
Among clients with disabilities, OAS/GIS and CPP clients were more likely to be satisfied while CPP-D and EI clients were less likely to be satisfied compared to all clients with disabilities.
Compared to 2021-22, satisfaction decreased among CPP-D clients with disabilities, while it increased among OAS/GIS clients with disabilities.
Figure long description
Overall Satisfaction (% Rated 4 or 5) – Trending
EI
2017-18, 59%
2018-19, 82%
2018-20, 74%
2020-21, 76%
2021-22, 64%
2022-23, 67%, significantly lower than total
CPP
2017-18, 69%
2018-19, 79%
2018-20, 76%
2020-21, 83%
2021-22, 81%
2022-23, 82%, significantly higher than total
CPPD
2017-18, 49%
2018-19, 62%
2018-20, 58%
2020-21, 63%
2021-22, 60%
2022-23, 55%, significantly lower than total, significantly lower than previous wave
SIN
2017-18, 81%
2018-19, 84%
2019-20, 100%
OAS/GIS
2018-19, 86%
2018-20, 88%
2020-21, 85%
2021-22, 75%
2022-23, 85%, significantly higher than total, significnatly higher the previous wave
** Sample sizes among SIN clients was too small for reporting in 2020-21, 2021-22 and 2022-23.
Note: Q44A wording was revised starting 2019-20 as well as the types of disabilities listed were also expanded. Interpret tracking results with caution.
Q44A. Do you identify as a person with a disability?
Base: All respondents
Indigenous Clients
Overall satisfaction among Indigenous clients was consistent compared to all clients and compared to 2021-22.
Compared to 2021-22, Indigenous clients provided higher ratings for the quality of service provided through specialized call centres and in-person.
Figure long description
Overall Satisfaction (R% Rated 4 or 5)
Total
2017-18, 79%
2018-19, 85%
2019-20, 79%
2020-21, 83%
2021-22, 80%
2022-23, 83%
Urban
2018-19, 82%
2019-20, 73%
2020-21, 88%
2021-22, 80%
2022-23, 79%
Rural
2018-19, 86%
2019-20, 82%
2020-21, 80%
2021-22, 79%
2022-23, 86%
Remote
2018-19, 93%
2019-20, 75%
2020-21, 87%
2021-22, 88%
2022-23, 86%
Figure long description
Service Channel Satisfaction (% Rated 4 or 5)
eServiceCanada
2020-21, 87%, small sample size
2021-22, 75%
2022-23, 76%
My Service Canada Account
2019-20, 76%
2020-21, 73%
2021-22, 78%
2022-23, 78%
Online
2017-18, 75%
2018-19, 82%
2019-20, 65%
2020-21, 73%
2021-22, 69%
2022-23, 74%
Specialized Call Centres
2017-18, 77%
2018-19, 78%
2019-20, 63%
2020-21, 73%
2021-22, 62%
2022-23, 75%, significantly higher than previous wave
In person
2017-18, 77%
2018-19, 87%
2019-20, 84%
2020-21, 77%
2021-22, 71%
2022-23, 83%, significnatly higher than previous wave
1 800 O-Canada
2017-18, 68%
2018-19, 71%
2019-20, 52%
2020-21, 83%, small sample size
2021-22, 56%
2022-23, 68%
Figure long description
Profile of Indigenous clients
First nations
2018-19, 58%
2019-20, 78%
2020-21, 62%
2021-22, 61%
2022-23, 61%
Metis
2018-19, 34%
2019-20, 16%
2020-21, 32%
2021-22, 33%
2022-23, 31%
Inuit
2018-19, 10%
2019-20, 6%
2020-21, 6%
2021-22, 5%
2022-23, 9%
* Small sample size. Results should be interpreted with caution.
± Note: Fieldwork was cut short in 2019-20 and data was not gathered from the full sample. Data from this year is therefore not shown.
Base: Indigenous clients (n=460)
Indigenous clients provided lower ratings across certain service attributes. The largest gaps were for the ease of figuring out eligibility for benefits/SIN card, ease of finding out the steps to apply, ease of finding out the information needed to apply and ease of completing the application form. Indigenous clients were more likely to find it easy to follow-up compared to all clients.
Compared to 2021-22, Indigenous clients provided higher ratings across a number of service attributes including the helpfulness of 1 800 O-Canada phone representatives, being able to complete steps online made the process easier, moving smoothly through all steps and ease of follow up. Indigenous clients provided lower ratings for the ease of figuring out eligibility compared to last year.
Figure long description
Widest gap vs. Total & change vs. 2021-22 in service attributes (% rated 4 or 5)
Figure out if you are eligible for benefits/ SIN card
2022-23, 60%, significantly lower than total, significantly lower than previous wave
GAP vs. Total, - 13pts
2021-22, 75%
Ease of finding out the steps to apply
2022-23, 69%, significantly lower than total
GAP vs. Total, -10 pts
2021-22, 73%
Ease of finding out what information you need to provide when applying
2022-23, 68%, significantly lower than total, significantly lower than total
GAP vs. Total, -9 pts
2021-22, 67%
Ease of completing the application form
2022-23, 79%, significantly lower than total
GAP vs. Total, -6 pts
2021-22, 77%
1 800 O-Canada phone representatives were helpful
2022-23, 78%, significantly higher than previous wave
GAP vs. Total, -5 pts
2021-22, 50%
Being able to complete steps online made the process easier for you
2022-23, 87%, significantly higher than previous wave
GAP vs. Total, 3 pts
2021-22, 76%
You were able to move smoothly through all of the steps related to your application.
2022-23, 84%, significantly higher than previous wave
GAP vs. Total, 0 pts
2021-22, 75%
Ease of follow-up
2022-23, 68%, significantly hogher than total, significantly higher than previous wave
GAP vs. Total, 8 pts
2021-22, 52%
The Service Canada phone representatives that called you back after you completed an online form were helpful
2022-23, 84%
GAP vs. Total, 8 pts
2021-22, 75%
Urban, Rural and Remote Clients
Overall satisfaction was consistent among urban, rural and remote clients compared to all clients and has increased among urban clients compared to 2021-22.
Remote clients were more satisfied with service provided through 1 800 O-Canada than all clients.
Compared to 2021-22, urban clients provided higher ratings for specialized call centres and 1 800 O-Canada. Rural clients provided higher ratings for specialized call centres and lower ratings for eServiceCanada. Remote clients provided lower ratings for online.
Figure long description
Overall Satisfaction (% Rated 4 or 5)
Urban
2018-19, 86%
2019-20, 85%
2020-21, 86%
2021-22, 81%
2022-23, 84%, significantly higher than previous wave
Rural
2018-19, 83%
2019-20, 82%
2020-21, 85%
2021-22, 80%
2022-23, 82%
Remote
2018-19, 88%
2019-20, 80%
2020-21, 88%
2021-22, 81%
2022-23, 80%
Figure long description
Service Channel Satisfaction (% rated 4 or 5)
In person
Urban
2018-19, 88%
2019-20, 85%
2020-21, 89%
2021-22, 80%
2022-23, 83%
Rural
2018-19, 85%
2019-20, 87%
2020-21, 80%
2021-22, 83%
2022-23, 83%
Remote
2018-19, 87%
2019-20, 89%
2020-21, 82%
2021-22, 88%
2022-23, 85%
Online
Urban
2018-19, 78%
2019-20, 73%
2020-21, 79%
2021-22, 76%
2022-23, 76%
Rural
2018-19, 81%
2019-20, 73%
2020-21, 77%
2021-22, 70%
2022-23, 65%
Remote
2018-19, 80%
2019-20, 76%
2020-21, 74%
2021-22, 82%
2022-23, 64%, significnatly lower than previous wave
Specialized Call Centres
Urban
2018-19, 73%
2019-20, 62%
2020-21, 72%
2021-22, 68%
2022-23, 74%, significnatly higher than previous wave
Rural
2018-19, 76%
2019-20, 60%
2020-21, 73%
2021-22, 64%
2022-23, 72%, significnatly higher than previous wave
Remote
2018-19, 79%
2019-20, 71%
2020-21, 72%
2021-22, 75%
2022-23, 77%
1 800 O-Canada
Urban
2018-19, 70%
2019-20, 71%
2020-21, 71%
2021-22, 57%
2022-23, 73%, significantly higher than previous wave
Rural
2018-19, 76%
2019-20, 65%
2020-21, 74%
2021-22, 57%
2022-23, 65%
Remote
2018-19, 69%
2019-20, 74%
2020-21, 80%, small sample size
2021-22, 79%, small sample size
2022-23, 88%, significantly higher than total
My Service Canada Account
Urban
2019-20, 73%
2020-21, 75%
2021-22, 72%
2022-23, 72%
Rural
2019-20, 77%
2020-21, 74%
2021-22, 69%
2022-23, 75%
Remote
2019-20, 89%
2020-21, 68%
2021-22, 66%
2022-23, 73%
eServiceCanada
Urban
2020-21, 84%
2021-22, 74%
2022-23, 76%
Rural
2020-21, 80%
2021-22, 79%
2022-23, 65%, significnatly lower than previous wave
Remote
2020-21, 73%, small sample size
2021-22, 63%
2022-23, 64%
* Small sample size. Results should be interpreted with caution.
Urban clients provided higher ratings for receiving consistent information and finding out the steps to apply compared to all clients. Rural clients provided lower ratings for receiving consistent information and finding out the steps to apply. Remote clients provided lower ratings for clarity of process, the amount of time the application took being reasonable, ease of understanding information about the program, needing to explain the situation only once and confidence in issue resolution.
Compared to 2021-22, urban clients provided higher ratings for clarity of process, receiving consistent information and ease of finding out the steps to apply. Rural clients provided higher ratings of being able to move smoothly through all the steps and it being clear what to do if there was a problem or question. Remote clients provided lower ratings of ease of understanding information about the program and ease of figuring out eligibility. Urban and rural clients provided higher ratings of being able to complete the application in a reasonable amount of time.
Figure long description
WIDEST GAP VS. TOTAL & CHANGE VS. 2020-21 IN SERVICE ATTRIBUTES (% RATED 4 OR 5)
Throughout the process it was clear what would happen next and when
Urban
2018-19, 75%
2019-20, 73%
2020-21, 80%
2021-22, 74%
2022-23, 77%, significantly higher than previous wave
Rural
2018-19, 79%
2019-20, 74%
2020-21, 81%
2021-22, 73%
2022-23, 74%
Remote
2018-19, 79%
2019-20, 68%
2020-21, 77%
2021-22, 68%
2022-23, 71%, significantly lower than total
The amount of time it took was reasonable
Urban
2018-19, 76%
2019-20, 78%
2020-21, 81%
2021-22, 75%
2022-23, 76%
Rural
2018-19, 77%
2019-20, 80%
2020-21, 82%
2021-22, 74%
2022-23, 73%
Remote
2018-19, 75%
2019-20, 77%
2020-21, 84%
2021-22, 73%
2022-23, 70%, significantly lower than total
You received consistent information
Urban
2018-19, 81%
2019-20, 81%
2020-21, 85%
2021-22, 81%
2022-23, 84%, significantly higher than total, significantly higher than previous wave
Rural
2018-19, 82%
2019-20, 80%
2020-21, 84%
2021-22, 77%
2022-23, 76%, significantly lower than total
Remote
2018-19, 84%
2019-20, 77%
2020-21, 81%
2021-22, 80%
2022-23, 80%
Ease of understanding information about the program
Urban
2019-20, 75%
2020-21, 80%
2021-22, 75%
2022-23, 76%
Rural
2019-20, 78%
2020-21, 74%
2021-22, 72%
2022-23, 74%
Remote
2019-20, 78%
2020-21, 72%
2021-22, 76%
2022-23, 64%, significantly lower than total, significantly lower than previous wave
Ease of finding out the steps to apply
Urban
2019-20, 82%
2020-21, 80%
2021-22, 77%
2022-23, 82%, significantly higher than total, significantly higher than previous wave
Rural
2019-20, 79%
2020-21, 72%
2021-22, 74%
2022-23, 75%, significantly lower than total
Remote
2019-20, 77%
2020-21, 73%
2021-22, 79%
2022-23, 74%
You need to explain your situation only once
Urban
2019-20, 79%
2020-21, 76%
2021-22, 75%
2022-23, 75%
Rural
2019-20, 76%
2020-21, 79%
2021-22, 73%
2022-23, 75%
Remote
2019-20, 76%
2020-21, 75%
2021-22, 72%
2022-23, 69%, significantly lower than total
You were able to move smoothly through all of the steps
Urban
2018-19, 83%
2019-20, 83%
2020-21, 85%
2021-22, 84%
2022-23, 85%
Rural
2018-19, 85%
2019-20, 81%
2020-21, 84%
2021-22, 78%
2022-23, 82%, significnatly higher than previous wave
Remote
2018-19, 88%
2019-20, 81%
2020-21, 88%
2021-22, 84%
2022-23, 81%
It was clear what to do if you had a problem or question
Urban
2018-19, 77%
2019-20, 76%
2020-21, 79%
2021-22, 77%
2022-23, 79%
Rural
2018-19, 78%
2019-20, 80%
2020-21, 79%
2021-22, 73%
2022-23, 77%, significnatly higher than previous wave
Remote
2018-19, 84%
2019-20, 83%
2020-21, 73%
2021-22, 80%
2022-23, 75%
Confident that any issues or problems would have been easily resolved
Urban
2018-19, 79%
2019-20, 79%
2020-21, 78%
2021-22, 75%
2022-23, 77%
Rural
2018-19, 76%
2019-20, 76%
2020-21, 75%
2021-22, 71%
2022-23, 73%
Remote
2018-19, 81%
2019-20, 76%
2020-21, 68%
2021-22, 74%
2022-23, 70%, significantly lower than total
Ease of figuring out if you are eligible for benefits/ SIN card
Urban
2019-20, 72%
2020-21, 77%
2021-22, 73%
2022-23, 74%
Rural
2019-20, 70%
2020-21, 74%
2021-22, 72%
2022-23, 70%
Remote
2019-20, 70%
2020-21, 80%
2021-22, 80%
2022-23, 69%, significantly lower than previous wave
You were able to complete the application in a reasonable amount of time
Urban
2019-20, 83%
2020-21, 84%
2021-22, 81%
2022-23, 84%, significnatly higher than previous wave
Rural
2019-20, 84%
2020-21, 82%
2021-22, 81%
2022-23, 84%, significnatly higher than previous wave
Remote
2019-20, 84%
2020-21, 86%
2021-22, 86%
2022-23, 82%
Remote clients provided lower ratings for feeling respected compared to all clients.
Compared to 2021-22, urban and rural clients provided higher ratings on traveling a reasonable distance to access the service. Urban, rural and remote clients provided lower ratings on feeling protected during the COVID-19 pandemic. Rural clients provided higher ratings on a number of items including ease of follow up, ease of application, getting help on their application and the helpfulness of Service Canada phone representatives, but provided lower ratings on the helpfulness of 1 800 O-Canada representatives.
Figure long description
Widest Gap Vs. Total & Change Vs. 2020-21 In Service Attributes (% Rated 4 Or 5)
Ease of follow-up
Urban
2019-20, 58%
2020-21, 62%
2021-22, 55%
2022-23, 59%
Rural
2019-20, 64%
2020-21, 64%
2021-22, 55%
2022-23, 61%, significnatly higher than previous wave
Remote
2019-20, 59%
2020-21, 65%
2021-22, 66%
2022-23, 67%
Overall, it was easy for you to apply
Urban
2018-19, 83%
2019-20, 82%
2020-21, 85%
2021-22, 86%
2022-23, 88%
Rural
2018-19, 87%
2019-20, 86%
2020-21, 86%
2021-22, 82%
2022-23, 86%, significantly higher than previous wave
Remote
2018-19, 90%
2019-20, 85%
2020-21, 93%
2021-22, 88%
2022-23, 87%
Putting together the information you needed to apply
Urban
2019-20, 80%
2020-21, 83%
2021-22, 81%
2022-23, 80%
Rural
2019-20, 77%
2020-21, 81%
2021-22, 79%
2022-23, 78%
Remote
2019-20, 78%
2020-21, 76%
2021-22, 83%
2022-23, 77%, significantly lower than previous wave
Getting help on your application when you needed it
Urban
2020-21, 66%
2021-22, 67%
2022-23, 69%
Rural
2020-21, 61%
2021-22, 59%
2022-23, 68%, significnatly higher than previous wave
Remote
2020-21, 68%
2021-22, 71%
2022-23, 71%
You travelled a reasonable distance to access the service
Urban
2019-20, 76%
2020-21, 81%
2021-22, 73%
2022-23, 78%, significantly higher than previous wave
Rural
2019-20, 75%
2020-21, 75%
2021-22, 71%
2022-23, 78%, significnatly higher than previous wave
Remote
2019-20, 72%
2020-21, 67%
2021-22, 77%
2022-23, 76%
Service Canada phone representatives that called you back after you completed an online form were helpful
Urban
2020-21, 85%
2021-22, 74%
2022-23, 77%
Rural
2020-21, 87%
2021-22, 85%
2022-23, 74%, significnatly higher than previous wave
Remote
2020-21, 66%
2021-22, 84%
2022-23, 75%
You were provided service in a way that protected your health and safety during the COVID-19 pandemic
Urban
2020-21, 89%
2021-22, 88%
2022-23, 83%, significnatly lower than previosu wave
Rural
2020-21, 87%
2021-22, 86%
2022-23, 80%, significnatly lower than previous wave
Remote
2020-21, 76%
2021-22, 86%
2022-23, 79%, significantly lower than previous wave
1 800 O-Canada phone representatives were helpful
Urban
2020-21, 87%
2021-22, 77%
2022-23, 82%
Rural
2020-21, 90%
2021-22, 79%
2022-23, 83%, significantly lower than previous wave
Remote
2020-21, 93%
2021-22, 86%
2022-23, 93%
You felt respected throughout the process
Urban
2022-23, 90%
Rural
2022-23, 89%
Remote
2022-23, 85%, significnatly lower than total
Youth and Senior Clients
Overall satisfaction was higher among seniors compared to all clients and consistent among youth and adults.
Satisfaction has increased among youth compared to 2021-22.
Seniors provided lower ratings for the quality of service provided in-person and higher ratings of service provided by specialized call centres compared to all clients.
Compared to 2021-22, adults and seniors were more satisfied with the quality of service provided by specialized call centres.
Figure long description
Overall Satisfaction (% Rated 4 or 5)
Youth (18-30)
2018-19, 86%
2019-20, 84%
2020-21, 85%
2021-22, 79%
2022-23. 85%, significantly higher than previous wave
Adults (31-59)
2018-19, 82%
2019-20, 82%
2020-21, 85%
2021-22, 80%
2022-23. 81%
Seniors (60+)
2018-19, 87%
2019-20, 86%
2020-21, 87%
2021-22, 84%
2022-23. 85%, significantly hogher than total
Figure long description
Service Channel Satisfaction (% Rated 4 or 5)
In person
Youth (18-30)
2018-19, 91%
2019-20, 86%
2020-21, 88%
2021-22, 82%
2022-23. 86%
Adults (31-59)
2018-19, 82%
2019-20, 86%
2020-21, 87%
2021-22, 81%
2022-23. 84%
Seniors (60+)
2018-19, 88%
2019-20, 84%
2020-21, 83%
2021-22, 81%
2022-23. 77%, significantly lower than total
Online
Youth (18-30)
2018-19, 81%
2019-20, 77%
2020-21, 77%
2021-22, 75%
2022-23. 77%
Adults (31-59)
2018-19, 80%
2019-20, 72%
2020-21, 79%
2021-22, 75%
2022-23. 74%
Seniors (60+)
2018-19, 75%
2019-20, 70%
2020-21, 78%
2021-22, 70%
2022-23, 73%
Specialized Call Centres
Youth (18-30)
2018-19, 63%
2019-20, 67%
2020-21, 76%
2021-22, 64%
2022-23. 71%
Adults (31-59)
2018-19, 77%
2019-20, 58%
2020-21, 69%
2021-22, 66%
2022-23. 72%
Seniors (60+)
2018-19, 80%
2019-20, 63%
2020-21, 75%
2021-22, 70%
2022-23. 77%, significantly higher than total, significantly higher than previous wave
1 800 O-Canada
Youth (18-30)
2018-19, 79%
2019-20, 79%
2020-21, 79%, small sample size
2021-22, 47%
2022-23. 67%
Adults (31-59)
2018-19, 72%
2019-20, 63%
2020-21, 72%
2021-22, 62%
2022-23. 71%
Seniors (60+)
2018-19, 67%
2019-20, 67%
2020-21, 65%
2021-22, 68%
2022-23. 72%
My Service Canada Account
Youth (18-30)
2019-20, 76%
2020-21, 83%
2021-22, 68%
2022-23. 77%
Adults (31-59)
2019-20, 76%
2020-21, 74%
2021-22, 71%
2022-23. 74%
Seniors (60+)
2019-20, 74%
2020-21, 71%
2021-22, 72%
2022-23. 70%
eServiceCanada
Youth (18-30)
2020-21, 88%, small sample size
2021-22, 83%
2022-23. 81%
Adults (31-59)
2020-21, 83%
2021-22, 71%
2022-23. 66%
Seniors (60+)
2020-21, 72%
2021-22, 74%
2022-23. 73%
* Small sample size. Results should be interpreted with caution.
Compared to all clients, youth provided higher ratings for feeling respected during the application process, being protected during the COVID-19 pandemic, that it was easy to get help when needed, getting help on their application and clarity of the issue resolution process. Seniors provided higher ratings for the timeliness of service, while adults provided lower ratings. Seniors provided lower ratings for completing steps online made the process easier, feeling respected through the application process, getting help in general and on the application, confidence that personal information was protected and in-person service representatives being helpful.
Compared to 2021-22, youth, adults and seniors provided higher ratings on the ease of getting help when needed, while adults and seniors provided higher ratings on completing steps online made the process easier and ease of getting help on the application. Youth and seniors provided higher ratings on the overall ease of applying, while youth also provided higher ratings for the clarity of the issue resolution process. Seniors and adults provided lower ratings on being protected during the COVID-19 pandemic.
Figure long description
WIDEST GAP VS. TOTAL & CHANGE VS. 2020-21 IN SERVICE ATTRIBUTES (% RATED 4 OR 5)
Completing steps online made the process easier
Youth
2018-19, 89%
2019-20, 86%
2020-21, 85%
2021-22, 85%
2022-23, 86%
Adults
2018-19, 80%
2019-20, 79%
2020-21, 83%
2021-22, 82%
2022-23, 86%, significantly higher than previous wave
Seniors
2018-19, 56%
2019-20, 62%
2020-21, 70%
2021-22, 66%
2022-23, 77%, significantly lower than total, significantly higher than previous wave
You felt respected throughout the process applying for…
Youth
2022-23, 92%, significantly higher than total
Adults
2022-23, 89%
Seniors
2022-23, 88%, significantly lower than total
You were provided service in a way that protected your health and safety during the COVID-19 pandemic
Youth
2020-21, 91%
2021-22, 88%
2022-23, 88%, significantly higher than total
Adults
2020-21, 89%
2021-22, 89%
2022-23, 79%, significantly lower than previous wave
Seniors
2020-21, 83%
2021-22, 83%
2022-23, 79%, significantly lower than total, significantly lower than previous wave
It was easy to get help when you needed it
Youth
2019-20, 80%
2020-21, 76%
2021-22, 73%
2022-23, 80% significantly higher than total, signigicantly higher than previous wave
Adults
2019-20, 74%
2020-21, 69%
2021-22, 68%
2022-23, 74%, significnatly higher than previous wave
Seniors
2019-20, 73%
2020-21, 70%
2021-22, 64%
2022-23, 68%, significantly lower than total, significantly higher the previous wave
The amount of time it took was reasonable
Youth
2019-20, 76%
2020-21, 80%
2021-22, 73%
2022-23, 74%
Adults
2019-20, 74%
2020-21, 82%
2021-22, 73%
2022-23, 72%, significantly lower than total
Seniors
2019-20, 83%
2020-21, 82%
2021-22, 79%
2022-23, 80%, significantly higher than total
You were confident that your personal information was protected
Youth
2019-20, 91%
2020-21, 90%
2021-22, 91%
2022-23, 93%, significantly higher than total
Adults
2019-20, 87%
2020-21, 88%
2021-22, 86%
2022-23, 88%
Seniors
2019-20, 81%
2020-21, 83%
2021-22, 82%
2022-23, 82%, significantly higher than total
Ease of getting help on your application when you needed it
Youth
2020-21, 69%
2021-22, 69%
2022-23, 73%, significantly higher than total
Adults
2020-21, 63%
2021-22, 62%
2022-23, 68%, significantly higher than previous wave
Seniors
2020-21, 62%
2021-22, 60%
2022-23, 64%, significantly lower than total, significantly higher than previous wave
Overall, it was easy for you to apply for…
Youth
2019-20, 78%
2020-21, 83%
2021-22, 84%
2022-23, 89%, significantly higher than previous wave
Adults
2019-20, 84%
2020-21, 86%
2021-22, 85%
2022-23, 86%
Seniors
2019-20, 88%
2020-21, 87%
2021-22, 85%
2022-23, 87%, significantly higher than previous wave
The Service Canada representatives that you dealt with in person were helpful
Youth
2019-20, 94%
2020-21, 93%
2021-22, 90%
2022-23, 94%
Adults
2019-20, 91%
2020-21, 92%
2021-22, 88%
2022-23, 91%
Seniors
2019-20, 91%
2020-21, 83%
2021-22, 85%
2022-23, 88%, significantly lower than total
It was clear what to do if you had a problem or question
Youth
2019-20, 76%
2020-21, 81%
2021-22, 78%
2022-23, 83%, significantly higher than total, significnatly higher than previous wave
Adults
2019-20, 78%
2020-21, 77%
2021-22, 75%
2022-23, 76%
Seniors
2019-20, 80%
2020-21, 79%
2021-22, 75%
2022-23, 77%
E-vulnerable Clients
Satisfaction among E-vulnerable clients was consistent compared to all clients and higher compared to 2021-22.
E-vulnerable clients were less satisfied with the quality of service provided online and through MSCA compared to all clients.
Figure long description
Overall Satisfaction (% Rated 4 or 5)
2017-18, 87%
2018-19, 84%
2019-20, 85%
2020-21, 82%
2021-22, 79%
2022-23, 84%, significantly higher than previous wave
Figure long description
Service Channel Satisfaction (% Rated 4 or 5)
In person
2017-18, 91%
2018-19, 86%
2019-20, 85%
2020-21, 79%
2021-22, 83%
2022-23, 86%
Online
2017-18, 74%
2018-19, 76%
2019-20, 67%
2020-21, 74%
2021-22, 63%
2022-23, 67%, significantly lower than total
Specialized Call Centre Centres
2017-18, 83%
2018-19, 68%
2019-20, 70%
2020-21, 74%
2021-22, 70%
2022-23, 73%
1 800 O-Canada
2018-19, 68%
2019-20, 69%
2020-21, 75%
2021-22, 61%
2022-23, 61%
My Service Canada Account
2019-20, 74%
2020-21, 68%
2021-22, 58%
2022-23, 52%, significantly lower than total
eServiceCanada
2020-21, 73%
2021-22, 68%
2022-23, 70%
Base: E-vulnerable clients (n=varies)
E-vulnerable clients provided lower ratings across a number of service attributes compared to all clients. The largest gaps were for completing steps online made the process easier, ease of figuring out eligibility, ease of finding out the information needed to apply and ease of finding out the steps to apply.
Compared to 2021-22, E-vulnerable clients provided higher ratings for completing steps online made things easier, ease of understanding requirements and information about the program, ease of completing the application form, moving smoothly through the process, in-person representatives being helpful and ease of getting help when needed.
Figure long description
Widest gap vs. Total & change vs. 2021-22 in service attributes (% rated 4 or 5)
Completing steps online made the process easier
2022-23, 68%, significantly lower than total, significantly higher than previous wave
GAP vs. TOTAL, -16 pts
2021-22, 58%
Ease of figuring out if you are eligible for benefits/ SIN card
2022-23, 62%, significantly lower than total
GAP vs. TOTAL, -11 pts
2021-22, 64%
Ease of finding out what information you need to provide when applying
2022-23, 67%, significantly lower than total
GAP vs. TOTAL, -10 pts
2021-22, 71%
Ease of finding out the steps to apply
2022-23, 71%, significantly lower than total
GAP vs. TOTAL, -8 pts
2021-22, 66%
Able to complete the application in a reasonable amount of time
2022-23, 78%, significantly lower than total
GAP vs. TOTAL, -6 pts
2021-22, 78%
Ease of understanding the requirements of the application
2022-23, 77%, significantly lower than total, significantly higher than previous wave
GAP vs. TOTAL, -5 pts
2021-22, 70%
Ease of completing the application form
2022-23, 80%, significantly lower than total, significantly higher than previous wave
GAP vs. TOTAL, -5 pts
2021-22, 75%
You felt respected throughout the process of applying
2022-23, 86%, significantly lower than total
GAP vs. TOTAL, -3 pts
Ease of understanding the information about the program
2022-23, 73%, significantly higher than previous wave
GAP vs. TOTAL, -2 pts
2021-22, 61%
You were able to move smoothly through all the steps of your application
2022-23, 83%, significantly higher than previous wave
GAP vs. TOTAL, -1 pts
2021-22, 78%
Service Canada representatives that you dealt with in person were helpful
2022-23, 93%, significantly higher than previous wave
GAP vs. TOTAL, 1 pts
2021-22, 87%
It was easy to get help when you needed it
2022-23, 78%, significantly higher than previous wave
GAP vs. TOTAL, 4 pts
2021-22, 68%
Clients with No Devices or Mobile Only
Overall satisfaction was consistent between clients with a mobile device only and those with no devices. Satisfaction increased among clients with no devices compared to 2021-22.
Clients with no devices were less satisfied with the quality of service provided in-person and online.
Compared to 2021-22, clients with no devices were more satisfied with service provided from specialized call centres.
Figure long description
Overall Satisfaction (% Rated 4 or 5) – Trending
No Devices
2019-19, 83%
2019-20, 81%
2020-21, 80%
2021-22, 71%
2022-23, 83%, significantly higher than previous wave
Mobile only
2018-19, 85%
2019-20, 85%
2020-21, 83%
2021-22, 82%
2022-23, 83%
Figure long description
Overall Satisfaction by Channel (% Rated 4 or 5)
In person
No devices
2018-19, 85%
2019-20, 81%
2020-21, 75%
2021-22, 80%
2022-23, 73%, signicantly lower than total
Mobile only
2018-19, 85%
2019-20, 90%
2020-21, 85%
2021-22, 87%
2022-23, 87%
Online
No devices
2018-19, 62%
2019-20, 44%
2020-21, 75%
2021-22, 51%
2022-23, 61%, significantly lower than total
Mobile only
2018-19, 84%
2019-20, 63%
2020-21, 71%
2021-22, 76%
2022-23, 70%
Specialized Call Centres
No devices
2018-19, 79%
2019-20, 71%
2020-21, 70%
2021-22, 40%
2022-23, 78%, significantly higher than previous wave
Mobile only
2018-19, 77%
2019-20, 67%
2020-21, 77%
2021-22, 72%
2022-23, 71%
1 800 O-Canada
No devices
2018-19, 71%
2019-20, 77%
2020-21, 85%, small sample size
2021-22, 71%, small sample size
Mobile only
2018-19, 73%
2019-20, 54%
2020-21, 66%, small sample size
2021-22, 67%
2022-23, 73%
My Service Canada Account
No devices
2019-20, 56%
Mobile only
2019-20, 95%
2020-21, 78%
2021-22, 72%
2022-23, 73%
eServiceCanada
Mobile only
2020-21, 86%, small sample size
2021-22, 78%
2022-23, 74%
* Small sample size. Results should be interpreted with caution. ** Sample sizes too small for reporting.
Base: No device clients (n=varies); Mobile only clients (n=varies)
Figure long description
Widest gap vs. Total & change vs. 2021-22 in service attributes (% rated 4 or 5)
Clients with no devices provided lower ratings across most service attributes compared to all clients. The largest gaps were for completing steps online made it easier, the ease of finding out the information needed to apply, understanding info about the program and putting together the info needed to apply. Mobile only clients provided higher ratings for the ease of getting help in general and on the application, and provided lower ratings for the ease of follow up and figuring out eligibility.
Compared to 2021-22, clients with no devices provided higher ratings on a number of attributes including the ease of follow up, ease of getting help on the application and clarity of process, among others. Mobile only clients provided higher ratings on the ease of getting help on their application and finding out what info they needed to apply as well as being able to complete steps online made the process easier, and provided lower ratings for the ease of putting together the information needed to apply.
Ease of follow-up
No Devices
2022-23, 83%, significantly higher than total, significantly higher than previous wave
GAP vs. TOTAL, 23pts
2021-22, 39%
Mobile Only
2022-23, 47%, significantly higher than total
GAP vs. TOTAL, -13pts
2021-22, 57%
Ease of getting help on your application
No Devices
2022-23, 74%, significantly higher than previous wave
GAP vs. TOTAL, 6pts
Mobile Only
2022-23, 75%, significantly higher than total, significantly higher than previous wave
GAP vs. TOTAL, 7pts
2021-22, 68%
It was easy to get help when you needed it
No Devices
2022-23, 79%, significantly higher than previous wave
GAP vs. TOTAL, 5pts
2021-22, 61%
Mobile Only
2022-23, 80%, significnatly higher than total
GAP vs. TOTAL, 6pts
2021-22, 76%
Mobile Only
2022-23, 80%, significnatly higher than total
GAP vs. TOTAL, 4pts
2021-22, 80%
You were confident that any issues would have been easily resolved
No Devices
2022-23, 76%, significantly higher than previous wave
GAP vs. TOTAL, 1pts
2021-22, 66%
Mobile Only
2022-23, 79%
GAP vs. TOTAL, 4pts
2021-22, 81%
You felt respected throughout the process of applying
No Devices
2022-23, 86%
GAP vs. TOTAL, -3pts
Mobile Only
2022-23, 90%
GAP vs. TOTAL, 1pts
Throughout the process it was clear what would happen next and when
No Devices
2022-23, 73%,significantly higher than previous wave
GAP vs. TOTAL, -3pts
2021-22, 64%
Mobile Only
2022-23, 80%
GAP vs. TOTAL, 4pts
2021-22, 80%
Overall, it was easy for you to apply
No Devices
2022-23, 84%, significantly higher than previous wave
GAP vs. TOTAL, -3pts
2021-22, 66%
Mobile Only
2022-23, 84%
GAP vs. TOTAL, -3pts
2021-22, 85%
Service Canada reps that you dealt with in person were helpful
No Devices
2022-23, 83%, significantly higher than previous wave
GAP vs. TOTAL, -3pts
2021-22, 77%
Mobile Only
2022-23, 92%
GAP vs. TOTAL, 0pts
2021-22, 95%
You were confident that your personal information was protected
No Devices
2022-23, 83%, significantly lower than total, significantly higher than previous wave
GAP vs. TOTAL, -5pts
2021-22, 80%
Mobile Only
2022-23, 87%
GAP vs. TOTAL, -1pts
2021-22, 84%
Provided service in your choice of English or French
No Devices
2022-23, 90%, significantly lower than total
GAP vs. TOTAL, -6pts
2021-22, 88%
Mobile Only
2022-23, 95%
GAP vs. TOTAL, -1pts
2021-22, 98%
Ease of completing the application form
No Devices
2022-23, 79%, significantly lower than total
GAP vs. TOTAL, -6pts
2021-22, 63%
Mobile Only
2022-23, 82%
GAP vs. TOTAL, -3pts
2021-22, 78%
It was clear what to do if you had a problem or question
No Devices
2022-23, 71%, significantly lower than total, significantly higher than previous wave
GAP vs. TOTAL, -7pts
2021-22, 68%
Mobile Only
2022-23, 80%
GAP vs. TOTAL, -2pts
2021-22, 79%
Ease of putting together the information you needed to apply
No Devices
2022-23, 72%,significantly lower than total, significantly higher than previous wave
GAP vs. TOTAL, -7pts
2021-22, 70%
Mobile Only
2022-23, 77%, significantly lower than previous wave
GAP vs. TOTAL, -2pts
2021-22, 85%
Ease of figuring out if you are eligible for benefits/ SIN card
No Devices
2022-23, 65%
GAP vs. TOTAL, -8pts
2021-22, 69%
Mobile Only
2022-23, 66%, significantly lower than total
GAP vs. TOTAL, -7pts
2021-22, 71%
It was easy to access service in a language I could speak and understand well
No Devices
2022-23, 85%, significantly lower than total
GAP vs. TOTAL, -9pts
2021-22, 81%
Mobile Only
2022-23, 93%
GAP vs. TOTAL, -1pts
2021-22, 93%
Ease of understanding the requirements of the application
No Devices
2022-23, 72%, significantly lower than total
GAP vs. TOTAL, -10pts
2021-22, 64%
Mobile Only
2022-23, 79%
GAP vs. TOTAL, -3pts
2021-22, 78%
Service Canada specialized call centre phone reps were helpful
No Devices
2022-23, 70%, significantly lower than total
GAP vs. TOTAL, -13pts
2021-22, 62%
Mobile Only
2022-23, 89%
GAP vs. TOTAL, 6pts
2021-22, 81%
Ease of understanding information about the program
No Devices
2022-23, 59%, significantly lower than total
GAP vs. TOTAL, -16pts
2021-22, 57%
Mobile Only
2022-23, 76%
GAP vs. TOTAL, 1pts
2021-22, 76%
Ease of finding out what information you need to provide when applying for the program
No Devices
2022-23, 61%, significantly lower than total
GAP vs. TOTAL, -16pts
2021-22, 56%
Mobile Only
2022-23, 80%, significantly higher than previous wave
GAP vs. TOTAL, 3pts
2021-22, 70%
Ease of finding out the steps to apply
No Devices
2022-23, 59%, significantly lower than total
GAP vs. TOTAL, -20pts
2021-22, 53%
Mobile Only
2022-23, 77%
GAP vs. TOTAL, -2pts
2021-22, 70%
Being able to complete the steps online made things easier for you
No Devices
2022-23, 55%, significantly lower than total, significantly higher than previous wave
GAP vs. TOTAL, -29pts
2021-22, 37%
Mobile Only
2022-23, 85%, significantly higher than previous wave
GAP vs. TOTAL, 1pts
2021-22, 72%
* Small sample size. Results should be interpreted with caution.
Access to Service via Mobile: Overall
More than eight in ten clients reported owning or having access to a smartphone (86%) or a personal computer (82%), and roughly four in ten (46%) reported owning or having access to a tablet. Only 3% of clients neither own nor have access to any devices.
Compared to 2021-22, the proportion of clients who reported owning or having access to a smartphone has increased.
Figure long description
Own or Have Access to
Personal computer
2022-23, 82%
2021-22, n=4200, 83%
2020-21, n=4200, 83%
Smartphone
2022-23, 86%, significnatly higher than previous wave
2021-22, n=4200, 82%
2020-21, n=4200, 80%
Tablet
2022-23, 46%
2021-22, n=4200, 44%
2020-21, n=4200, 45%
No device
2022-23, 3%
2021-22, n=4200, 3%
2020-21, n=4200, 3%
Q39d. Which of the following do you own or have access to?
Base: All respondents (n=4200)
Clients with a Language Barrier
Overall satisfaction was lower among those with a language barrier compared to all clients and consistent compared to 2021-22.
Clients with a language barrier provided lower ratings for the quality of service provided through all channels and on all service attributes compared to all clients.
The largest gaps were for the helpfulness of 1 800 O-Canada and specialized call centre representatives, the ease of finding out the information needed to apply and the ease of finding and understanding information about the program.
Compared to 2021-22, clients with a language barrier provided lower ratings on ease of finding out the information needed to apply, the specialized call centre representatives being helpful, ease of finding out the information about the program, ease of understanding the information about the program and needing to explain their situation only once.
Figure long description
Overall Satisfaction (% Rated 4 or 5)
2020-21, n=285, 55%
2021-22, n=277, 53%
2022-23, n=280, 50%, significantly lower than total
Figure long description
Service Channel Satisfaction (% Rated 4 or 5)
In person
2020-21, 55%
2021-22, 51%
2022-23, 63%, significantly lower than total
Online
2020-21, 44%
2021-22, 46%
2022-23, 46%, significantly lower than total
Specialized Call Centres
2020-21, 32%
2021-22, 39%
2022-23, 39%, significantly lower than total
1 800 O-Canada
2020-21, 31%
2022-23, 31%, significantly lower than total
My Service Canada Account
2020-21, 42%
2021-22, 49%
2022-23, 41%, significantly lower than total
eServiceCanada
2020-21, 53%
2021-22, 53%
2022-23, 36%, significantly lower than total
Figure long description
Widest Gap in Service Attributes (% Rated 4 or 5 Vs. Total)
1 800 O-Canada phone representatives were helpful
2022-23, 35%, significantly lower than total
GAP vs. TOTAL, -48pts
2021-22, 38%
Ease of finding out the information needed to apply
2022-23, 32%, significantly lower than total, significantly lower than previous wave
GAP vs. TOTAL, -45pts
2021-22, 54%
Service Canada specialized call centre phone representatives were helpful
2022-23, 38%, significantly lower than total, significnatly lower than previous wave
GAP vs. TOTAL, -45pts
2021-22, 56%
Ease of finding out the information about the program
2022-23, 35%,significantly lower than total, significnatly lower than previous wave
GAP vs. TOTAL, -43pts
2021-22, 56%
It was clear what to do if you had a problem or question
2022-23, 38%,significantly lower than total
GAP vs. TOTAL, -40pts
2021-22, 42%
Ease of understanding information about the program
2022-23, 35%,significantly lower than total, significnatly lower than previous wave
GAP vs. TOTAL, -39pts
2021-22, 52%
You needed to explain your situation only once
2022-23, 36%,significantly lower than total, significnatly lower than previous wave
GAP vs. TOTAL, -39pts
2021-22, 52%
It was easy to get help when you needed it
2022-23, 35%, significantly lower than total
GAP vs. TOTAL, -39pts
2021-22, 39%
You received consistent information
2022-23, 43%, significantly lower than total
GAP vs. TOTAL, -38pts
2021-22, 46%
You were confident any issues or problems would have been easily resolved
2022-23, 37%, significantly lower than total
GAP vs. TOTAL, -38pts
2021-22, 43%
* Small sample size. Results should be interpreted with caution. ** Sample sizes too small for reporting.
Base: Language barrier clients
Provision of Services in Official Languages
Nearly all clients agreed they were provided service in their choice of English or French, and that it was easy to access service in a language they could speak and understand well. CPP-D clients and OAS/GIS clients were less likely to agree to both statements.
Results were consistent with 2021-22.
Figure long description
Provided with Service in Your Choice of English or French (% Rated 4 or 5)
Total
2018-19, 96%
2019-20, 97%
2020-21, 96%
2021-22, 97%
2022-23, 96%
EI
2017-18, 93%
2018-19, 97%
2019-20, 98%
2020-21, 97%
2021-22, 97%
2022-23, 97%
CPP
2017-18, 94%
2018-19, 94%
2019-20, 97%
2020-21, 95%
2021-22, 94%
2022-23, 95%
CPPD
2017-18, 87%
2018-19, 93%
2019-20, 95%
2020-21, 92%
2021-22, 94%
2022-23, 94%, significantly lower than total
SIN
2017-18, 96%
2018-19, 95%
2019-20, 95%
2020-21, 96%
2021-22, 98%
2022-23, 96%
OAS/GIS
2017-18, 95%
2018-19, 98%
2019-20, 96%
2020-21, 94%
2021-22, 95%
2022-23, 95%, significantly lower than total
Figure long description
Easy to Access Service in a Language I could Speak and Understand Well (% Rated 4 or 5)
Total
2018-19, 94%
2019-20, 94%
2020-21, 95%
2021-22, 93%
2022-23, 94%
EI
2018-19, 96%
2019-20, 94%
2020-21, 95%
2021-22, 94%
2022-23, 95%
CPP
2018-19, 92%
2019-20, 95%
2020-21, 92%
2021-22, 93%
2022-23, 95%
CPPD
2018-19, 90%
2019-20, 91%
2020-21, 85%
2021-22, 92%
2022-23, 89%, significantly lower than total
SIN
2018-19, 94%
2019-20, 94%
2020-21, 96%
2021-22, 93%
2022-23, 94%
OAS/GIS
2018-19, 92%
2019-20, 94%
2020-21, 93%
2021-22, 91%
2022-23, 91%, significantly lower than total
Q36b. Thinking about the service you received, from getting information about [INSERT ABBREV] to receiving a decision, how much do you agree or disagree with the following statements
Base: All respondents (n=4200)
Official Language Minority Community (OLMC)
Overall satisfaction among OLMC clients was consistent with all clients and has increased directionally compared to 2021-22.
Nine in ten OLMC clients were provided service in their choice of English or French, lower compared to all clients.
Figure long description
Overall Satisfaction (% Rated 4 or 5)
2017-18, 89%
2018-19, 91%
2019-20, 90%
2020-21, 90%
2021-22, 81%
2022-23, 85%
Figure long description
Service Channel Satisfaction (% Rated 4 or 5)
In person
2018-19, 93%
2019-20, 89%
2020-21, 88%, small sample size
2021-22, 88%
2022-23, 82%
Online
2018-19, 87%
2019-20, 83%
2020-21, 83%
2021-22, 80%
2022-23, 79%
Specialized Call Centres
2018-19, 78%
2019-20, 82%
2020-21, 68%, small sample size
2021-22, 74%, small sample size
2022-23, 82%
1 800 O-Canada
2018-19, 58%
2019-20, 78%
My Service Canada Account
2019-20, 89%
2020-21, 88%, small sample size
* Small sample size. Results should be interpreted with caution. ** Sample sizes too small for reporting.
Figure long description
Provided with Service in Your Choice of English or French (% Agree)
2018-19, 95%
2019-20, 97%
2020-21, 93%
2021-22, 94%
2022-23, 91%, significantly lower than total
Base: OLMC clients
OLMC clients provided higher ratings for completing the steps online making the process easier and ratings for the provision of service in their choice of English or French compared to all clients.
Compared to 2021-22, OLMC clients provided higher ratings for completing the steps online being easier but lower ratings on ease of figuring out eligibility, ease of understanding the information about the program and ease of putting together the information needed to apply.
Figure long description
Widest Gap Vs. Total & Change Vs. 2021-22 In Service Attributes (% Rated 4 Or 5)
Completing steps online made the process easier
2022-23, 93%, significantly higerh than total, significantly higher than previous wave
GAP vs. TOTAL, 9pts
2021-22, 80%
Ease of figuring out if you are eligible for benefits/ SIN card
2022-23, 82%, significantly lower than previous wave
GAP vs. TOTAL, 9pts
2021-22, 86%
Understand the information about the program
2022-23, 81%, significantly lower than previous wave
GAP vs. TOTAL, 6pts
2021-22, 90%
Ease of putting together the information you needed to apply
2022-23, 80%, significantly lower than previous wave
GAP vs. TOTAL, 1pts
2021-22, 86%
Newcomers (Arrived in Past 3 Years)
Overall satisfaction among newcomers continued to be higher than all clients and increased compared to 2021-22.
Newcomers were more satisfied with the service they received in-person, online, through specialized call centres and 1 800 O-Canada compared to all clients.
Compared to 2021-22, satisfaction decreased for the service provided through eServiceCanada.
Figure long description
Overall Satisfaction (% Rated 4 or 5)
2018-19, 93%
2019-20, 94%
2020-21, 93%
2021-22, 90%
2022-23, 94%, significantly higher than total, significnatly higher than previous wave
Figure long description
Service Channel Satisfaction (% Rated 4 or 5)
In person
2018-19, 96%
2019-20, 88%
2020-21, 95%
2021-22, 88%
2022-23, 92%, significantly higher than total
Online
2018-19, 85%
2019-20, 86%
2020-21, 89%
2021-22, 87%
2022-23, 86, significantly higher than total%
Specialized Call Centres
2018-19, 63%
2019-20, 77%
2020-21, 87%, small sample size
2021-22, 85%
2022-23, 94%, significantly higher than total
1 800 O-Canada
2018-19, 79%
2019-20, 83%
2022-23, 94%
My Service Canada Account
2019-20, 69%
2020-21, 84%, small sample size
eServiceCanada
2020-21, 92%, small sample size
2021-22, 90%
2022-23, 84%, small sample size, significantly lower than previous wave
* Small sample size. Results should be interpreted with caution. ** Sample sizes too small for reporting.
Base: Newcomer clients
Newcomers were also more likely to provide high ratings on several service attributes. The largest gaps were for ease of getting help when needed, ease of follow-up, that it was clear what would happen next and when, explaining their situation only once and ease of putting together the information needed to apply.
Compared to 2021-22, newcomers were more likely to agree that it was easy to get help when they needed it.
Figure long description
Widest gap vs. Total & change vs. 2021-22 in service attributes (% rated 4 or 5)
It was easy to get help when you needed it
2022-23, 90%, significantly higher than total, significnatly higher than previous wave
GAP vs. TOTAL, 16pts
2021-22, 86%
Ease of follow-up
2022-23, 74%, significantly higher than total
GAP vs. TOTAL, 14pts
2021-22, 73%
It was clear what would happen next and when
2022-23, 89%, significantly higher than total
GAP vs. TOTAL, 13pts
2021-22, 86%
You needed to explain your situation only once
2022-23, 87%, significantly higher than total
GAP vs. TOTAL, 12pts
2021-22, 83%
Ease of putting together the information you needed to apply
2022-23, 91%, significantly higher than total
GAP vs. TOTAL, 12pts
2021-22, 90%
It was clear what to do if you had a problem or question
2022-23, 89%, significantly higher than total
GAP vs. TOTAL, 11pts
2021-22, 86%
The amount of time, from start to finish, was reasonable
2022-23, 86%, significantly higher than total
GAP vs. TOTAL, 11pts
2021-22, 83%
Racialized and Black Clients
Overall satisfaction and trust in Service Canada were higher among Racialized clients compared to all clients and consistent among those who identify as ‘Black’ specifically. Satisfaction has increased among Racialized and Black clients compared to 2021-22.
Racialized clients provided higher ratings for all service channels, while Black clients provided higher ratings for in-person service and online. Both groups had higher overall trust compared to all clients.
Compared to 2021-22, Racialized and Black clients provided higher ratings for online and specialized call centres, while Racialized clients also provided higher ratings for 1 800 O-Canada. Racialized clients were more likely to express trust compared to 2021-22.
Figure long description
Overall Satisfaction (% Rated 4 or 5) – Trending
Racialized
2020-21, 89%
2021-22, 84%
2022-23, 89%, significantly higher than total, significnatly higher than previous wave
Black
2020-21, 87%
2021-22, 78%
2022-23, 86%, significantly higher than previous wave
Figure long description
Overall Trust
Racialized
2020-21, 90%
2021-22, 88%
2022-23, 91%, significantly higher than total, significnatly higher than previous wave
Black
2020-21, 84%
2021-22, 83%
2022-23, 88%, significantly higher than total
Service Channel Satisfaction (% Rated 4 or 5)
In person
Racialized
2020-21, 92%
2021-22, 85%
2022-23, 87%, significantly higher than total
Black
2020-21, 89%, small sample size
2021-22, 89%
2022-23, 92%, significantly higher than total
Online
Racialized
2020-21, 85%
2021-22, 79%
2022-23, 84%, significantly higher than total, significantly higher than previous wave
Black
2020-21, 81%
2021-22, 63%
2022-23, 86%, significantly higher than total, significnatly higher than previous wave
Specialized Call Centres
Racialized
2020-21, 80%
2021-22, 71%
2022-23, 80%, significantly higher than total, significantly higher previous wave
Black
2020-21, 75%, small sample size
2021-22, 58%
2022-23, 83%, significantly higher than previous wave
1 800 O-Canada
Racialized
2020-21, 82%
2021-22, 63%
2022-23, 85%, significantly higher than total, significnatly higher than previous wave
My Service Canada Account
Racialized
2020-21, 81%
2021-22, 81%
2022-23, 83%, significantly higher than total
Black
2021-22, 62%, small sample size
eServiceCanada
Racialized
2020-21, 88%
2021-22, 83%
2022-23, 79%, significantly higher than total
Black
2020-21, 85%
2021-22, 82%, small sample size
* Small sample size. Results should be interpreted with caution. ** Sample sizes too small for reporting.
Base: Racialized clients
Racialized clients provided higher ratings across several service attributes. The largest gaps were for the ease of getting help when needed, the Service Canada phone representatives being helpful, ease of getting help on the application and the 1 800 O-Canada representatives being helpful.
Compared to 2021-22, Racialized clients provided lower ratings for the ease of finding information about the program and higher ratings for the ease of getting help when needed, the 1 800 O-Canada and specialized call centre representatives being helpful, receiving consistent information, completing the application in a reasonable amount of time, ease of follow up and completing the steps online being easier.
Figure long description
Widest gap vs. Total & change vs. 2021-22 in service attributes (% rated 4 or 5)
It was easy to get help when you needed it
2022-23, 84%t, significantly higher than total, significnatly higher than previous wave
GAP vs. TOTAL, 10pts
2021-22, 78%
The Service Canada phone representatives that called you back after you completed an online form were helpful
2022-23, 85%, significantly higher than total
GAP vs. TOTAL, 9pts
2021-22, 80%
Ease of getting help on your application when you needed it
2022-23, 76%, significantly higher than total
GAP vs. TOTAL, 8pts
2021-22, 74%
1 800 O-Canada phone representatives were helpful
2022-23, 91%, significnatly higher than previous wave
GAP vs. TOTAL, 8pts
2021-22, 78%
Throughout the process it was clear what would happen next and when
2022-23, 83%
GAP vs. TOTAL, 7pts
2021-22, 80%
You were confident that any issues or problems would have been easily resolved
2022-23, 82%, significantly higher than total
GAP vs. TOTAL, 7pts
2021-22, 82%
Service Canada specialized call centre phone representatives were helpful
2022-23, 89%, significantly higher than total, significnatly higher than previous wave
GAP vs. TOTAL, 6pts
2021-22, 82%
You received consistent information
2022-23, 86%, significantly higher than total, significantly higer than previous wave
GAP vs. TOTAL, 5pts
2021-22, 82%
You were able to complete the application in a reasonable amount of time
2022-23, 87%, significantly higher than total, signicantly higher than previous wave
GAP vs. TOTAL, 3pts
2021-22, 82%
Ease of follow up
2022-23, 63%, significnatly higher than previous wave
GAP vs. TOTAL, 3pts
2021-22, 54%
Ease of finding information about the program
2022-23, 80%, significnatly lower than previous wave
GAP vs. TOTAL, 2pts
2021-22, 85%
Completing steps online made the process easier
2022-23, 85%, significantly higher than previous wave/li>
GAP vs. TOTAL, 1pts
2021-22, 80%
Conclusions
Satisfaction with the service experience has increased, largely reversing the declines observed last year, and returned to levels observed prior to the pandemic. Directional improvement has been made on ease, effectiveness and emotion, and clients were more trusting that Service Canada was delivering its service effectively.
The overall increase in satisfaction (83% vs. 81%) was driven by higher ratings on ease (87% vs. 85%), and directionally higher ratings on effectiveness (84% vs. 82%) and emotion (75% vs. 73%), and a higher proportion of clients expressed trust in Service Canada (82% vs. 78%). Improvement has also been made in the helpfulness of in-person representatives (92% vs. 88%) and getting help on your application (68% vs.64%), both of which were among the top drivers of satisfaction this year. Notably, ratings for timeliness of service (75% vs. 75%) were unchanged.
The greatest opportunity to improve satisfaction continued to be in reducing the time the client journey takes; this remained by far the most prominent driver and an aspect of service where ratings were lower relative to other areas. Secondary areas of importance included the ease of getting help on your application and, to a lesser extent, confidence in the issue resolution process.
The overall improvement in satisfaction was due primarily to higher ratings among SIN clients for the timeliness of service and quality of service provided in-person. Satisfaction provided through specialized call centres has also improved among EI clients.
Overall satisfaction has increased among SIN clients (94% vs. 89%), who provided higher ratings across certain aspects of service including the timeliness of service and helpfulness of Service Canada in-person representatives, which were the top two strongest drivers of satisfaction. SIN clients were also more satisfied with the overall ease of applying and the reasonableness of the distance travelled to access service.
Satisfaction was stable for all other programs; however, ratings have declined directionally among CPP-D clients (58% vs. 60%) for the second consecutive year and were lower compared to 2020-21 (63%). Satisfaction declined this year among those who received approval for the benefit, while approval/denial decisions were a top driver of satisfaction. A higher proportion utilized online government sources during the aware stage, which, among CPP-D clients, was the service channel with the lowest satisfaction (55%).
Ratings were more consistent among clients of other programs; however, there has been an increase in trust for CPP and OAS/GIS clients. Improvement has also been made among OAS/GIS clients for the overall ease of applying and with the ease of getting help and completing the form, among CPP clients for the ease of follow-up and among EI clients for the ease of getting help when needed.
Satisfaction with the quality of service has increased for specialized call centres, while ratings for eServiceCanada have declined directionally, continuing the downward trend observed last year. The in-person experience continued to receive the highest ratings while both telephone channels and eServiceCanada received the lowest.
The highest rated aspects of service included the helpfulness of in-person representatives, feeling respected throughout the process and confidence in information security. The overall ease and effectiveness of the process including ease of completing the application form and being able to complete the application in a reasonable amount of time were also among the highest rated areas.
The lowest rated areas remained consistent year-over-year and included the ease of follow-up, ease of deciding the best age to start their pension, ease of getting help on the application when needed and ease of figuring out program eligibility.
Channels used, in particular in-person and online, has not returned to pre-pandemic levels, possibly indicating the longer-term impacts of service transformation changes and evolving service channel preferences. Overall, in 2022-23, channel use among clients sees more use of in-person but still far off levels observed prior to the pandemic.
Compared to 2021-22, clients were more likely to have used in-person service at the aware and apply stages and to less likely to have used self-service only at the apply stage. Use of assisted-self-service has also increased at the aware stage.
Online continued to be the most commonly used channel and first point of contact at the aware and apply stages while telephone was used slightly more for following up. Use of in-person has increased as the first point of contact for the aware and apply stages, while fewer used the online channel at the apply stage.
SIN and EI clients were more likely to have used in-person service at the aware and apply stages and CPP-D clients when applying.
SIN clients were less likely to self-serve at the aware or apply stage and to use assisted self-service when applying. EI clients were more likely to use assisted self-service at the aware and apply stage and less likely to use self-service when applying. CPP-D clients were more likely to use self-service only at the follow-up stage and less likely to use mail-only at the apply stage.
OAS/GIS clients were less likely to be auto-enrolled this year which meant more OAS/GIS clients overall engaged in the aware or apply stages. OAS/GIS clients were more likely to have used mail only at the apply stage and less likely to have used online in the apply stage, while service levels remained consistent at the aware and follow-up stages.
While use of self-service continued to decline this year, it remained higher than pre-pandemic levels. Improvement has been made in the ease of getting assistance among self-serve clients. Use of MSCA was higher among CPP-D and OAS/GIS clients this year but registration continued to be more difficult and time-consuming for both groups.
A higher proportion of EI clients agreed that completing steps online made the process easier this year. However, consistent with previous results, CPP, OAS/GIS and CPP-D clients had more difficulty.
Three-quarters of CPP clients, seven in ten EI clients and half of CPP-D and OAS/GIS clients used MSCA during their experience. CPP-D and OAS/GIS clients were more likely to have used MSCA this year but continued to experience more difficulty registering compared to all clients and provided lower ratings for being able to register in a reasonable amount of time.
The ease of registering for MSCA has rebounded this year among EI clients after declining in 2021-22, while CPP clients found it easier to sign-into an existing account. The ease of signing into MSCA continued to be rated highly by the vast majority with an existing account, while impressions of the ease of registering remained lower despite improvement year over year. Among those who had difficulty registering, the most common reasons were consistent with last year and included problems with their personal access code or creating their profile, followed by problems verifying their identity using their online banking information.
The declines in satisfaction observed among most client groups last year have largely been reversed and ratings have increased across several groups. Satisfaction was notably higher among youth, seniors, newcomers and Racialized clients compared to all clients.
Satisfaction was lower, compared to all clients, among those with a language barrier, clients with disabilities and clients with restrictions to accessing service.
Overall satisfaction with the service experience increased among several client groups including youth, those with a high school education or less, urban clients, E-vulnerable clients, clients with no devices, clients with restrictions, newcomers and Racialized clients. Ratings among all other client groups increased directionally, with the exception of those with a language barrier.
Consistent with previous years, clients with a language barrier continued to experience the most difficulty among all client groups although they represent a very small proportion of clients (3% overall). They provided considerably lower ratings across all aspects of their experience and the largest gaps were for the helpfulness of 1 800 O-Canada and specialized call centre representatives, the ease of finding out the information needed to apply and the ease of finding and understanding information about the program.
University certificate/ diploma below bachelor's level 6%
Bachelor's degree 21%
Post graduate degree 14%
Figure long description
Province
British Columbia, 14%
Alberta, 11%
Saskatchewan, 3%
Manitoba, 3%
Ontario, 39%
Quebec, 20%
New Brunswick, 3%
Nova Scotia, 3%
Prince Edward Island, 1%
Newfoundland, 3%
Region
Ontario, 40%
West/ Territories 30%
Quebec, 20%
Atlantic, 9%
* Gender Reported by the client in the application form and/or during intake process. Clients who reported as non-binary were not excluded from the survey but represent a small population and their results cannot be published because of small sample sizes. The gender reported may be different from sex assigned at birth or gender at the time of responding to the survey. Not all programs have a third non-binary category.
ǂ12 respondents resided in the Territories.
Figure long description
Service Language Preference
English, 79%
French, 17%
Both, 1%
Other, 3%
Figure long description
Identify as Person with Disabilities
Yes, 10%
No, 90%
Figure long description
Use of Online Service
Routinely/all the time, 64%
Sometimes, 21%
Rarely, 7%
Never, 7%
Figure long description
Identify as Indigenous
Yes, 7%
No, 93%
Figure long description
Indigenous Groups
First Nations, 4%
Metis, 2%
Inuk, 1%
None of the above, 87%
Don’t know, 6%
Figure long description
Racial/Cultural Group
White, 54%
South Asian, 10%
Black, 8%
Chinese, 4%
Latin American, 4%
Filipino, 4%
Southeast Asian, 2%
Aran, 3%
Indigenous/First Nations, 3%
Other, 2%
Don’t know, 4%
Appendix A – Details On Call Disposition And Definition Of Client Groups
Call Disposition
Up to seven calls were placed in an effort to reach a selected respondent. The overall response rate achieved was 12% which is consistent with client-supplied sample studies (10%-15%). The response rate was on par with 2021-22 (12%), which marked a decrease in the response rate achieved in 2020-21 (16%).
Of the 4,200 completed interviews, 3,664 were conducted in English and 513 conducted in French.
The final call outcomes are as follows:
Figure long description
Call Outcome
Call backs, 1993
Completed Interviews, 4200
Disqualified, 1586
Language Barriers, 1270
No Answers, 22183
Not In Service (Out of Scope), 4686
Over quota, 6
Refusals, 18110
Terminations, 1013
TOTAL IN SCOPE, 50361
TOTAL RESPONDING, 5786
OVERALL RESPONSE RATE, 12%
Definition of Client Groups
Different client groupsǂ make up 95% of the total sample universe.z
The CX Survey aims to better understand the client experience of Service Canada’s client groups whose levels of satisfaction are lower or who encounter barriers to service.
Figure long description
Definition of Client Groups
Newcomers
Not born in Canada and arrived within the previous 3 years
Non-English or French speakers
Identify “other” as preferred language of service
Lower education
High school or less
Youth
Aged 18 to 30
Seniors
Aged 60 and over
Clients with disabilities
Self-identified
Clients with access restrictions
Self-identified as having experienced a restriction to access services
Indigenous people
Self-identified as First Nations, Inuit or Métis
E-vulnerable
Clients who rarely or never use online services
Mobile only
Self-reported as clients with only a smartphone, no computer or tablet
No devices
Self-reported as clients with no devices (mobile, tablet, computer)
Remote clients
Sample variable
Rural clients
Sample variable
Urban clients
Sample variable
Official language minorities (OLMC)
Clients in Quebec who prefer service in English, and clients outside Quebec who prefer service in French (sample variable and (Q41b)
Language barrier
Clients who rated “It was easy to access service in a language I could speak and understand well” a 1 or 2
Racialized
Clients who identify as belonging to a racial or cultural group other than White (Can be in addition to also identifying as white)