Grants and Contributions Applicants Client Experience Research (Year 3)
Employment and Social Development Canada [ESDC]
October 25, 2023
POR# 099-22
CONTRACT AWARD DATE: 2022-12-19
CONTRACT #: CW2266044 (G9292-24-2550)
Contract value: $149,885.85 (tax included)
Ce rapport est aussi disponible en français.
For more information on this report, please contact nc-por-rop-gd@hrsdc-rhdcc.gc.ca
Grants and Contributions Applicants Client Experience Research (Year 3)
It is available upon request in multiple formats (large print, MP3,
braille, e-text, DAISY), by contacting 1-800 O-Canada
(1-800-622-6232).
By teletypewriter (TTY), call 1-800-926-9105.
© His Majesty the King in Right of Canada, as represented by the
Minister of Families, Children and Social Development, 2023
https://publications.gc.ca/site/eng/services/copyPageTemplate.html
For information regarding reproduction rights: droitdauteur.copyright@HRSDC-RHDCC.gc.ca.
PDF
Cat. No.: Em20-148/2024E-PDF
ISBN: 978-0-660-67643-2
Recherche sur l’expérience client des subventions et contributions (Année 3)
Ce document offert sur demande en médias substituts (gros
caractères, MP3, braille, fichiers de texte, DAISY) auprès du 1-800
O-Canada (1-800-622-6232).
Si vous utilisez un téléscripteur (ATS), composez le 1-800-926-9105.
© Sa Majesté le Roi du Chef du Canada, représenté par le ministre de
la Famille, des Enfants et du Développement social, 2022
https://publications.gc.ca/site/fra/services/modeleDroitsAuteur.html
Pour des renseignements sur les droits de reproduction: droitdauteur.copyright@HRSDC-RHDCC.gc.ca.
PDF
Nº de cat. : Em20-148/2024F-PDF
ISBN : 978-0-660-67644-9
List of Acronyms
| Acronyms | ||||
| PROGRAM RELATED | ||||
| AS | Apprenticeship Service | |||
| CSJ | Canada Summer Jobs | |||
| EAF | Enabling Accessibility Fund | |||
| FELIP | Financial Empowerment of Low-Income People | |||
| NAAW | National AccessAbility Week | |||
| NHSP | New Horizons for Seniors Program | |||
| SIP | Sectoral Initiatives Program | |||
| STAR | Skilled Trades Awareness and Readiness Program | |||
| SDPP-C&F | Social Development Partnerships Program – Children and Families | |||
| SDPP-D | Social Development Partnerships Program – Disability Inclusion | |||
| SSLP | Supports for Student Learning Program | |||
| WER | Women’s Employment Readiness | |||
| WORBE | Workplace Opportunities: Removing Barriers to Equity | |||
| MISCELLANEOUS | ||||
| CX | Client Experience | |||
| ESDC | Employment and Social Development Canada | |||
| FY | Fiscal year | |||
| GBA+ | Gender Based Analysis Plus | |||
| GoC | Government of Canada | |||
| Gs&Cs | Grants and Contributions | |||
| GCOS | Grants and Contributions Online Services | |||
| MP | Member of Parliament | |||
| N/A | Non applicable | |||
| PO | Program Officer | |||
| POB | Program Operations Branch | |||
| SC | Service Canada | |||
Political Neutrality Statement
I hereby certify as Senior Officer of Ipsos that the deliverables fully comply with the Government of Canada political neutrality requirements outlined in the Policy on Communications and Federal Identity and the Directive on the Management of Communications. Specifically, the deliverables do not include information on electoral voting intentions, political party preferences, standings with the electorate or ratings of the performance of a political party or its leaders.

Mike Colledge
President
Ipsos Public Affairs
Additional information
Supplier Name: Ipsos Limited Partnership
PSPC Contract Number: CW2266044 (G9292-24-2550)
Contract Award Date: 2022-12-19
Executive Summary
Grants & Contributions CX Survey – Results At a Glance (Year 3)
- 3,041 SURVEYS CONDUCTED
- METHODOLOGY: ONLINE SURVEY
- FIELDWORK: April 19 to June 9, 2023
Overall Service Experience

Click for larger view
Figure 1: Overall Service Experience
This horizontal bar chart shows responses to three questions about the overall service experience and presents results for Year 1, Year 2 and Year 3. Respondents were asked to provide ratings on a 5-pt scale and results were grouped by those who provided a rating of 4 or 5. All 3041 respondents in Year 3 answered as follows:
- Overall Satisfaction: Year 3 68%. Year 2 77%. Year 1 70%.
- Ease: Year 3 78%. Year 2 79%. Year 1 74%.
- Effectiveness: Year 3 75%. Year 2 78%. Year 1 70%.
Satisfaction with Service Channels

Click for larger view
Figure 2: Satisfaction with Service Channels
This horizontal bar chart shows responses to a question about satisfaction with the overall quality of service provided by the service channels used during the applicant process and presents results for Year 1, Year 2 and Year 3. Respondents were asked to provide ratings on a 5-pt scale and results were grouped by those who provided a rating of 4 or 5. Sample sizes vary by service channel, only those who used each channel during their experience were asked about it.
- Email support from Program Officer (842 respondents answered this question in Year 3): Year 3 77%. Year 2 79%. Year 1 80%.
- GCOS Web Portal (881 respondents answered this question in Year 3): Year 3 72%. Year 2 76%. Year 1 67%.
- Email support from SC (2442 respondents answered this question in Year 3): Year 3 68%. Year 2 70%. Year 1 65%.
- Online (1871 respondents answered this question in Year 3): Year 3 66%. Year 2 71%. Year 1 66%.
- Mail (154 respondents answered this question in Year 3): Year 3 65%. Year 2 58%. Year 1 63%.
- Phone support from SC (573 respondents answered this question in Year 3): Year 3 62%. Year 2 61%. Year 1 61%.
- In-Person (44 respondents answered this question in Year 3): Year 3 52%. Year 2 62%. Year 1 66%.
- 1 800 O Canada (94 respondents answered this question in Year 3): Year 3 42%. Year 2 48%. Year 1 49%.
Satisfaction with Client Experience by Program

Click for larger view
Figure 3: Satisfaction with Client Experience by Program
This vertical bar chart shows responses to a question about satisfaction with overall service experience by program and presents results for Year 1, Year 2 and Year 3. Respondents were asked to provide ratings on a 5-pt scale and results were grouped by those who provided a rating of 4 or 5. Sample sizes vary by program.
- EAF (300 respondents answered this question in Year 3): Year 3 72%. Year 2 78%. Year 1 77%.
- NHSP (1296 respondents answered this question in Year 3): Year 3 82%. Year 2 83%. Year 1 73%.
- CSJ (1004 respondents answered this question in Year 3): Year 3 68%. Year 2 79%. Year 1 69%.
- SDPP (214 respondents answered this question in Year 3): Year 3 42%. Year 2 72%. Year 1 53%.
- AS (11 respondents answered this question in Year 3): Year 3 36%.
- WORBE (22 respondents answered this question in Year 3): Year 3 59%.
- SSLP (24 respondents answered this question in Year 3): Year 3 50%.
- WER (51 respondents answered this question in Year 3): Year 3 35%.
- STAR (3 respondents answered this question in Year 3): Year 3 33%.
- SIP (116 respondents answered this question in Year 3): Year 3 28%.
Funding approval

Click for larger view
Figure description: Funding approval
This horizontal bar chart shows whether the applicants received funding approval or not and presents results for Year 1, Year 2 and Year 3 as follows:
- Year 3: Approved 79%. Denied 20%.
- Year 2: Approved 93%. Denied 7%.
- Year 1: Approved 90%. Denied 10%.
Satisfaction by Approval Status |
|||||
|---|---|---|---|---|---|
| 73% | 82% | 74% | 49% | 47% | 41% |
| Year 3 | Year 2 | Year 1 | Year 3 | Year 2 | Year 1 |
| Approved | Denied | ||||
Strengths

Click for larger view
Figure description: Strengths
- Service in choice of official language 91%
- Completing steps online made the process easier 84%
- Ease of finding general information on the program 82%
- Confident personal information protected 81%
- Ease of determining steps to apply 81%
Areas for Improvement

Click for larger view
Figure description: Areas for Improvement
- Ease of follow-up before receiving a decision 52%
- Ease of determining the amount of time each phase is anticipated to take 56%
- Client journey took reasonable time 58%
- It was easy to get help when needed 63%
- It was clear what would happen next and when 64%
* referred to as [program] web portal in Year 1
Note: Program types, intakes, and streams in grants and contributions vary widely, meaning that some year-to-year or program comparisons should be done with caution.
Year 3 Year 2 Year 1
Top 5 driver of satisfaction
Significantly higher / lower than total
Significantly higher / lower than Year 2
Key Findings
Overall Satisfaction and Applicants Experiencing an Issue
Overall satisfaction with the service experience among applicants to Grants and Contributions programs declined compared to Year 2, returning to levels observed in Year 1.
- Nearly seven in ten (68%) applicants were satisfied with their overall experience, a decrease of nine points from Year 2 (77%) and consistent with results in Year 1 (70%). The proportion of applicants who were very satisfied has declined (33%, -9 pts), while those who were very dissatisfied has increased (7%, +4 pts).
- Satisfaction was highest among applicants to New Horizons for Seniors Program (NHSP) (82%), followed by Enabling Accessibility Fund (EAF) (72%), Canada Summer Jobs (CSJ) (68%) and Workplace Opportunities: Removing Barriers to Equity (WORBE) (59%). Half of Supports for Student Learning Program (SSLP) applicants were satisfied (50%), while ratings were considerably lower for applicants of Social Development Partnerships Program (SDPP) (42%), Apprenticeship Service (AS) (36%), Women’s Employment Readiness (WER) (35%), Skilled Trades Awareness and Readiness Program (STAR) (33%) and Sectoral Initiatives Program (SIP) (28%). Among programs included in Year 2, overall satisfaction has decreased among CSJ and SDPP applicants.
- The overall ease (79%) and effectiveness (78%) of the application process continued to be rated high by the vast majority of applicants. However, those who applied to higher complexity programs and most notably SDPP, SIP and WER experienced more difficultly with nearly all aspects of the ease and effectiveness.
- Trust in Service Canada to deliver services effectively to Canadians has also declined compared to Year 2 (76%, -8 pt). This measure continued to be highly correlated to overall satisfaction and ratings have declined among CSJ and SDPP applicants.
Applicants to CSJ and SDPP experienced more issues related to the timeliness of service and had more difficulty following up or getting assistance during the application process than in Year 2 which negatively impacted their satisfaction.
- The overall decrease in satisfaction was due primarily to lower ratings among applicants to CSJ, who represent the vast majority of Grants and Contributions applicants, and to a lesser extent SDPP applicants.
- CSJ applicants provided lower ratings for the timeliness of service, clarity of the application process and what to do if they had a problem or question. They experienced more challenges getting assistance during the application process and were more likely to feel it took too long to receive an update on their application or to receive a decision.
- SDPP applicants provided lower ratings across all aspects of the ease and effectiveness of the application process and in particular for the timeliness of service, clarity of process and ease of getting assistance. They were more likely to have experienced a problem compared to all clients and to have encountered problems. The most prominent problems were that it took too long to receive an update or decision on their application and that the application form was too long or confusing.
Satisfaction Drivers and Awareness of Service Standards
The timeliness of service had the largest impact on satisfaction with service experience, followed by the ease of follow-up before receiving a decision, and confidence in the issue resolution process. In Year 3, all these aspects of service have increased in importance in driving overall satisfaction. Ratings in each of these aspects of service have declined compared to Year 2.
- The greatest opportunity to increase overall satisfaction is in reducing the amount of time the application process takes to complete and improving the ability of applicants to follow-up more easily before receiving a decision.
- Reducing the amount of time from the start of the application process to receiving a decision also aligned with the change applicants felt would have improved their experience the most. Timeliness is notably the most common suggested change across all programs.
Awareness of service standards remained relatively low and fewer knew of the time to acknowledge the submission and issue a funding decision than in Year 2. Applicants who were aware of each service standard continued to have a more positive experience. Notably, impressions have weakened year over year across several aspects of service among those who were not aware.
- More than four in ten applicants (44%, -4 pts) were aware of the stated service standards regarding issuing payment once a payment claim has been submitted, followed by fewer than four in ten (37%, -6 pts) for acknowledging the submission of a funding application and one third (33%, -6 pts) for issuing a funding decision notification. Compared to Year 2, awareness of the service standard for time to acknowledge submission and issue a funding decision declined.
- NHSP applicants were more likely to be aware of all service standards and EAF applicants of the time to issue a decision, while applicants to SDPP program were less likely to be aware of all service and SIP applicants of the time to issue payment.
Selected Applicant Profiles and the online experience
Those not approved for funding continued to be much less satisfied and fewer applicants were approved for funding compared to Year 2, which has contributed to the decline in overall results. Applicants who were not approved had much more difficulty getting help with their application, were less likely to feel the process was clear and timeliness of service reasonable and few reported having received a debrief on the outcome or being satisfied with the explanation provided.
- Eight in ten applicants received approval for funding (79%, -14 pts), statistically lower than the figure reported in Year 2. Applicants to EAF, SDPP, WER and SIP were less likely to have received funding approval compared to all clients, while NHSP and CSJ applicants were more likely to have received funding.
- Among those who did not receive approval, only one in ten (13%, -29 pts) were provided with an explanation why, statistically lower than in Year 2 (42%), and among those who were provided with an explanation, three in ten (29%, +6 pts) were satisfied with the outcome. EAF, NHSP and SDPP applicants were more likely to have received an explanation, while CSJ applicants were less likely.
Virtually all applicants reported submitting their application online and ratings for the ease and timeliness of the process remained strong and consistent with Year 2. Applicants to higher complexity programs continued to find all steps of the process more difficult.
- Six in ten applicants (59%) submitted their application using the online fillable form, followed by one third (34%) who used the GCOS web portal. Fewer downloaded the application documents and submitted by email (5%) or mail (3%). Applicants to EAF, NHSP, SDPP, WER and SIP were more likely to have downloaded the application documents and submitted them by email, however the vast majority submitted online. Compared to Year 2, NHSP and CSJ applicants were more likely to have submitted using the online fillable form, while SDPP applicants were more likely to have used the GCOS web portal.
- Impression of the ease of completing the application process remained consistent compared to Year 2. Applicants to CSJ continued to provide higher ratings for nearly all aspects of the application process, while applicants to SDPP, SIP, WER and to a lesser extent EAF and NHSP experienced more difficulty with all elements of the application process.
Satisfaction with Service Channels
Satisfaction with the service provided through most service channels was largely consistent and remained highest for support provided by email from a program officer, followed by the online channels. Fewer were satisfied with the Government of Canada website compared to Year 2 due to lower ratings among SDPP applicants who also had weaker impressions of the service provided by email.
- Eight in ten (77%) were satisfied with email support from a program officer, followed by the GCOS web portal (72%), email support from a Service Canada office (68%), the Government of Canada website (66%) and mail service (65%). Fewer were satisfied with telephone support from a Service Canada office (62%), service at a Service Canada Office (52%), and 1 800 O-Canada phone line (42%).
- The highest rated aspects of service were the provision of service in choice of official language, completing steps online made the process easier, confidence in security of their personal information and ease of finding general information about the program or determining the steps to apply.
- Aspects of service with lower ratings included the ease of follow-up, ease of determining how long each phase of the process was anticipated to take, the timeliness of service, ease of getting help when needed and that it was clear what would happen next and when. Ratings across nearly all these service attributes declined compared to Year 2.
Learning about the program
Email outreach from Service Canada or the program, the Government of Canada website and program applicant guides were the primary ways applicants learnt about the program they applied for. The vast majority who relied on the Government of Canada website continued to find it easy to navigate, however applicants to higher complexity programs had more difficulty. Further, more could be done to improve the ease of determining how long each phase of the process is anticipated to take.
- When learning about the program, applicants were most likely to have received an email from the GoC, ESDC, or the program they applied to directly (52%), followed by the Government of Canada website for the program (48%), the applicant guide (45%), talked to peers/community networks (27%) and the general Government of Canada website (20%). More applicants talked to peers/community networks than in Year 2, while fewer received an email directly from the program they applied, went to the general GoC website, participated in a GoC information session or talked to their local MP.
- NHSP applicants relied more heavily on the applicant guide, peers/ community networks, GoC info sessions and their local MP, while applicants to EAF and other higher complexity programs like SDPP, WER and SIP, were more likely to have used the GoC website and to have participated in a GoC information session. Those who applied to higher complexity programs and in particular SDPP, while more reliant on the GoC website, also had more difficulty finding the information they needed.
- The vast majority who used the GoC website continued to feel it was easy to find most types of information. Ratings were highest for the ease of finding general information about the program (82%), determining the steps to apply (81%) and if their organization was eligible for funding (80%). Applicants felt it was more difficult to determine the amount of time each phase of the process was anticipated to take and improving the ease of finding this information was the change identified by applicants that would have improved their experienced the most.
Populations served by funding and project close-out
Funding sought by applicant organizations continued to be targeted largely at supporting diverse communities, however slightly less so than in Year 2.
- Nine in ten applicants (90%) reported that the funding they applied for would support diverse (GBA+) communities, clients or people. Seven in ten (71%) said the funding would support those who identify as youth, followed by women (56%), those belonging to a minority racial or ethnic background (49%), low socio-economic status (45%), Black Canadians (40%) and those who identify as Indigenous (39%).
- Satisfaction remained consistent among applicants who assist GBA+ communities and those who do not but has declined among those who assist GBA+ communities compared to Year 2 mirroring the trend observed overall.
The vast majority of funding recipients found it easy to complete the tasks associated with funding agreement close-out. Recipients of EAF and higher complexity programs had more difficulty and fewer recipients of CSJ felt the tasks were easy compared to Year 2.
- Among applicants approved for funding, seven in ten felt that it was easy to submit the final budget (70%, unchanged), complete the final project report (70%, -1 pt), submit the final project report (70%, -1 pts), and complete the final budget/final claim (68%, -1 pt). Fewer felt it was easy to resolve any outstanding issues with funding (49%, -2 pts).
- NHSP applicants were more likely to find it easy to complete most aspects of the funding agreement close-out. EAF applicants and those who applied to higher complexity programs were less likely and ratings have declined for recipients of CSJ for the ease of submitting and completing the final report and completing the final budget/claim.
Qualitative Research
Organizational Capacity to Complete the Application Process
- Many applicants felt well-equipped to complete the Gs&Cs application process and much of this was underpinned by past experiences of completing funding applications.
- Applicants from larger organizations tended to agree that the application process favours organizations such as their own, which have more resources and the necessary staff expertise at their disposal. Some applicants from smaller organizations shared this perspective based on their experiences, but this view was not universal. In contrast, other applicants from smaller organizations felt that the process of applying was “straightforward” and stressed that it was their responsibility to “educate” themselves about the process.
- When asked about inclusivity and catering to the diverse backgrounds of applicants, applicants reported few inclusivity or accessibility barriers.
Top-of-mind Associations with the Application Process
- When asked to reflect on the entire application process, applicants highlighted a number of aspects of the process which impressed them. This included:
- Reminder notifications and outreach from programs about upcoming funding opportunities.
- Smooth and straightforward application process.
- The existence of grants and contributions for important projects.
- Shift to digital application channels.
- Shorter forms.
- Helpfulness of Service Canada agents.
- Applicants tended to be more vocal around the negative than the positive experiences. This was especially true among applicants who recorded lower overall satisfaction scores in the quantitative survey. The common frustrations were:
- Extensive delays in notification of funding decisions, particularly in the case of Sectoral Initiative Program and the Skilled Trades Awareness and Readiness Program.
- Lack of success in receiving funding, underscored by a few Social Development Partnerships Program and Sectoral Initiative Program applicants specifically.
- Too much detail required of applicants, notably in the case of Social Development Partnerships Program and Women's Employment Readiness Pilot Program
- Often-tight project turnaround times after receiving a funding decision.
- Detailed Findings on the Application Journey
- Overall, regardless of whether an organization received funding or not, ESDC was seen by many as doing an excellent job of raising awareness about the various funding programs that are available. Past applicants heavily relied on alerts from each program about upcoming rounds of funding.
- Program websites were the main source of support used by applicants and their feedback on the websites and supporting documents was predominantly positive.
- Program information sessions were appreciated but opinions were mixed on their perceived value. The main criticism was that the sessions mainly shared information already listed on the website. Still, many applicants appreciated the opportunity to learn more about programs and take part in the Q&A (if offered).
- Past experiences of funding application writing resulted in high levels of comfort with the application forms. The application forms were described as “standard” or “typical” to what applicants were used to filling out. Further, the clarity of instructions was appreciated. Perceived repetitiveness of questions and complexity of filling out budget forms were the main issues experienced by some applicants.
- The majority of applicants opted to fill out the applications online – via GCOS or program websites. The main pain points found were the perceived complicated multi-step process of creating a GCOS account and logging into GCOS, and the linking of personal and organizational accounts within GCOS. The latter did not make intuitive sense to some applicants. Experiences of using GCOS once within the site were largely positive.
- The research suggests that greater use of GCOS in future could be achieved through: raising awareness of GCOS and potential benefits and simplifying the steps for creating an account and logging into the system.
- Many were satisfied with the level of guidance offered in the applicant guide and did not have to turn to any additional resources.
- Delays in receiving a funding decision were a common and major pain point among applicants. Some reported waiting for 6-12 months, in some cases even longer, to receive a funding decision. The lack of communication on when decisions will be made and the provision of very vague timelines exacerbated negative perceptions. Having to wait for an extended period forced many organizations into limbo and created feelings of uncertainty.
- Using GCOS to submit their reports tended to be a positive experience for funded applicants, because the portal provided a centralized place to submit feedback and upload documents.
Future Improvements and the Ideal Experience
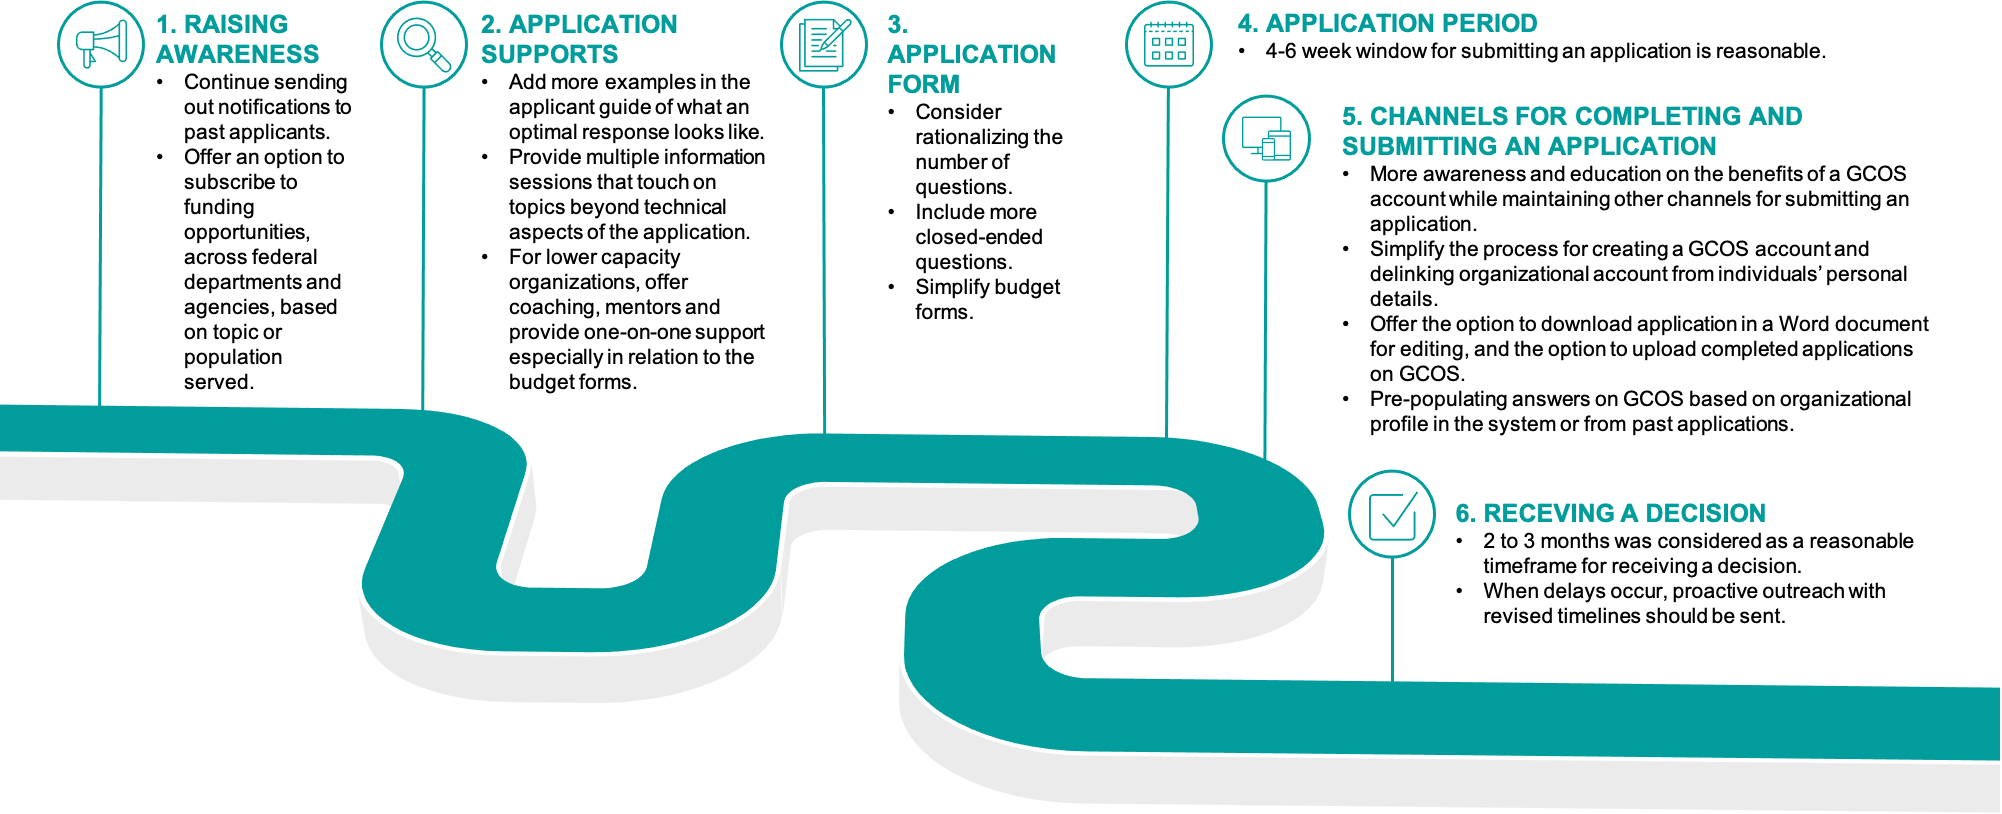
Applicants offered numerous improvement suggestions. Highlights include:
- Raising Awareness. Offer an option to subscribe to funding opportunities, across federal departments and agencies, based on topic or population served.
- Application Supports. Add more examples in the applicant guide of what an optimal response looks like. For lower capacity organizations, offer coaching, mentors and provide one-on-one support especially in relation to the budget forms.
- Application Form. Consider rationalizing the number of questions, including more closed-ended questions and simplifying budget forms.
- Channels for Completing and Submitting an Application. More awareness and education on the benefits of a GCOS account while maintaining other channels for submitting an application. Opportunities also exist in simplifying the process for creating a GCOS account, offering the option to download application in a Word document for editing, and the option to upload completed applications on GCOS.
- Receiving a Decision. 2 to 3 months was considered a reasonable timeframe for receiving a decision. When delays occur, proactive outreach with revised timelines should be sent.
- Reporting and Managing Funded Organizations. More education and support on collecting GBA+ data and more flexibility in adjusting projects based on changing context.
The Impact of Funding
- The most positive and most significant impact of receiving funding was on communities served by the organizations, as members of those communities were able to access services and supports they needed. In contrast, unfunded applications meant that programs or activities did not move forward or did so but in a reduced capacity.
Interest in future ESDC funding opportunities
- Most organizations, whether they have been successful or unsuccessful in their application, shared that they would certainly be applying for ESDC grants and contributions again in the future.
- The main consideration for determining whether to apply for funding in future were identifying if there is a need for a program, and whether organizations have the capacity to execute it.
Objectives and Methodology
Background: Gs&Cs Client Experience Research
The Program Operations Branch (POB) within Employment and Social Development Canada (ESDC) handles the operation and coordination of most Grants and Contributions (Gs&Cs) programs across the Department. The Branch actively works to improve the design, administration and delivery of Grants and Contributions programs. This notably includes making the process of applying for funding accessible, efficient and effective through quick and easy online services and standardized forms and agreements.
To comply with the Treasury Board Policy on Service and Digital and the Employment and Social Development Canada (ESDC) Service Strategy, POB requires the gathering of data on the client experience to assist in effectively managing service delivery. To meet these requirements, POB uses the Client Experience (CX) Performance Measurement Framework to guide the research on the Gs&Cs business line of client service delivery experience. The data collected with the framework, which includes qualitative and quantitative dimensions, will provide key insights and diagnostics on client experience to help:
- Better understand the needs and expectations of organizations, including organizations of different types and serving different client groups;
- Identify obstacles and challenges from the perspective of the organization;
- Identify strengths and opportunities to improve CX, including opportunities to implement changes and test new approaches related to program design and delivery;
- Assess the extent to which clients’ expectations are being met;
- Identify and prioritize resources and opportunities tied to CX improvements;
- Assess the impact of improvements made to the CX over time; and
- Explore how ESDC’s leadership at all levels can play an important role in creating a positive CX.
This is the third year of POB’s Client Experience Research Program (FY 2022/23 into 2023/24). Year 3 will build on previous years of research to support the systematic and integrated approach to measure and improve CX in Gs&Cs service delivery which also allows the department to track process on consistent and comparable CX indicators over time.
The detailed methodology and research instruments for all aspects of the research are available under a separate cover.
Note: Program intakes in grants and contributions vary widely, meaning that some year-to-year or program comparisons should be done with caution.
Research Objectives
The Client Experience Research Project is carried out in two phases, a quantitative phase and a qualitative phase.
The overarching objectives of the Year 3 quantitative research are to:
- Focus on monitoring selected POB Gs&Cs programs that were previously studied in Year 1 and Year 2;
- Capture CX insights from additional programs that have not previously been studied; and
- Increase awareness of organizational characteristics and diversity considerations in the CX space.
The research objectives for the quantitative research were to:
- Measure service satisfaction, ease, and effectiveness of the end-to-end client experience, taking into account the CX with various service channels and the CX of different client groups;
- Assess year-over-year changes for programs included in previous years;
- Provide diagnostic insights regarding the strengths and opportunities for improvement; and
- Assess how potential changes in service delivery might affect the CX.
The qualitative research explored the lived experiences of Gs&Cs applicants through focus group discussions and individual interviews. Building on the quantitative research, the qualitative phase of this project was structured around the following:
- Organizational capacity to effectively and efficiently complete the application process and the extent to which the process is inclusive;
- What impressed and what frustrated applicants when it came to their overall experience with Gs&Cs;
- A deep dive into all aspects of the application journey, including GCOS;
- The ideal application journey and opportunities for future improvements;
- The impact of funding and non-funding decisions; and
- The future interest in funding opportunities.
Methodology – Quantitative Research
An online survey was conducted with 3,041 Service Canada applicants across 11 programs. The survey was fielded from April 19 to June 9, 2023, and took on average approximately 16 minutes to complete. The survey sample size has a margin of error of +/-1.75%.
Applicants were defined as organizations that applied for grants and contributions funding (including both funded and unfunded) within the last two intake years (FY 2020/21 and 2021/22). A random sampling of organizations that applied to CSJ or NHSP were included, while all organizations that applied for the remaining programs were invited to complete the survey. ESDC distributed the survey links to participating organizations.
The exact intake periods referred to in this study are as follows:
Fiscal Year 2021-22:
- Enabling Accessibility Fund (EAF)
- Enabling Accessibility Fund: Mid-sized (Contribution) – June 4, 2021 to August 3, 2021
- Enabling Accessibility Fund: Early Learning and Child Care (Grant) – December 3, 2021 to January 28, 2022
- Enabling Accessibility Fund: Youth Innovation (Grant) – June 4, 2021 to October 29 2021
- New Horizons for Seniors Program (NHSP)
- Community Based stream – November 23, 2021 to December 21, 2021
- Canada Summer Jobs (CSJ) – December 16, 2021 to January 25, 2022
- Apprenticeship Service (AS) – August 3, 2021 to September 14, 2021
- Workplace Opportunities: Removing Barriers to Equity (WORBE) – January 18, 2022 to February 15, 2022
- Social Development Partnerships Program – Children and Families (SDPP-C&F) – May 25, 2021 to July 6, 2021
- Financial Empowerment of Low-Income People
- Social Inclusion of Vulnerable Children and Youth
- Social Development Partnerships Program – Disability (SDPP-D) – Disability Inclusion – August 4, 2022 to September 17, 2022
- National AccessAbility Week (Grant)
- Phase 1 – Partnerships (Contribution)
- Supports for Student Learning Program (SSLP) – August 6, 2021 to September 2, 2021
- Women’s Employment Readiness (WER) Pilot Program – June 1, 2021 to June 25, 2021
- Skilled Trades Awareness and Readiness Program (STAR) – May 13, 2021 to June 28, 2021
Fiscal Year 2020-21:
- Sectoral Initiatives Program (SIP*) – January 22, 2021 to March 4, 2021
*SIP has been replaced by The Sectoral Workforce Solutions Program (SWSP). The SWSP builds on and replaces the SIP.
Three (3) of the programs included in the survey have different streams that applicants can apply for.
The relevant streams referred to in this study are as follows:
- Enabling Accessibility Fund (EAF):
- Enabling Accessibility Fund: Mid-Sized (Contribution)
- Enabling Accessibility Fund: Early Learning and Child Care (Grant)
- Enabling Accessibility Fund: Youth Innovation (Grant)
- Social Development Partnerships Program – Children and Families (SDPP-C&F):
- Financial Empowerment of Low-Income People
- Social Inclusion of Vulnerable Children and Youth
- Social Development Partnerships Program – Disability (SDPP-D) – Disability Inclusion:
- Accessible Canada - Phase 1 Partnerships (Contribution)
- National AccessAbility Week (NAAW) (Grant)
Of the 9,862 organizations that were invited to participate, a total of 3,041 organizations completed the survey. The response rate for the survey was 31% which is considered strong compared to industry standards for a survey of this nature.
| Total | |
| Invited to participate | 9862 |
| Click-through | 3924 |
| Partial Completes | 883 |
| Terminates | 0 |
| Over Quota | 0 |
| Completed Surveys | 3041 |
| Response Rate | 31% |
| Abbreviation | Invited | Completed | Response rate | |
| CSJ | Canada Summer Jobs | 3250 | 1004 | 31% |
| EAF | Enabling Accessibility Fund | 1063 | 300 | 28% |
| NHSP | New Horizons for Seniors Program | 3250 | 1296 | 40% |
| SDPP- C&F | Social Development Partnerships Program – Children and Families | 904 | 168 | 19% |
| SDPP- D | Social Development Partnerships Program – Disability Inclusion | 200 | 46 | 23% |
| AS | Apprenticeship Service | 36 | 11 | 31% |
| WORBE | Workplace Opportunities: Removing Barriers to Equity | 79 |
22 | 28% |
| SSLP | Supports for Student Learning Program | 80 | 24 | 30% |
| WER | Women’s Employment Readiness | 214 | 51 | 24% |
| STAR | Skilled Trades Awareness and Readiness Program | 23 | 3 | 13% |
| SIP | Sectoral Initiatives Program | 763 | 116 | 15% |
| Total | 9862 | 3041 | 31% | |
|---|---|---|---|---|
Note: “n=” represents the number of respondents to a question, it is known in statistical language as the size of the sample. Sample sizes below n=30 are considered small and below n=10 considered very small. Results of small and very small sample sizes should be interpreted with caution and findings viewed as directional in nature.
The quantitative survey also served as a recruitment tool for the qualitative research, by asking if organizations would be interested in voluntarily participating in focus groups or in-depth interviews at a later date.
Only those organizations with email contact information on file were invited to participate, which does not represent the total volume of applicants.
Calibration of the Data – Quantitative Approach
Weighting adjustments were made to bring the sample into proportion with the universe by program volume (depending on the most recent intake for the particular program).
The final data was weighted by the number of respondents in each program in proportion to the total number of applicants as detailed below. The universe proportions used to develop the targets were based on figures provided by ESDC.
| Program | #Of Applicants | %Of Total |
| Canada Summer Jobs | 41463 | 84.94% |
| Enabling Accessibility Fund | 1040 | 2.13% |
| New Horizons for Seniors Program | 4176 | 8.56% |
| All programs but CSJ, EAF and NHSP | 1252 | 2.56% |
| Social Development Partnerships Program – Children and Families | 881 | 1.80% |
| Social Development Partnerships Program – Disability Inclusion | 195 | 0.40% |
| Apprenticeship Service | 36 | 0.07% |
| Workplace Opportunities: Removing Barriers to Equity | 74 |
0.15% |
| Supports for Student Learning Program | 75 | 0.15% |
| Women’s Employment Readiness | 210 | 0.43% |
| Skilled Trades Awareness and Readiness Program | 23 | 0.05% |
| Sectoral Initiatives Program | 639 | 1.31% |
| Total | 48812 |
|---|
Note Regarding Program Complexity
For the purpose of this study, program complexity has been defined as low, moderate, and high as outlined in the following table. These service standard clusters are informed by departmental reporting in the Performance Measurement and Management Framework.
Note: Canada Summer Jobs does not fit into these distinct clusters and has been analyzed as a separate group.
| Program Complexity Level | Description | Programs Included |
|---|---|---|
| Low complexity programs | Grant programs in the 112 days/16 week review period |
|
| Moderate delivery-complexity programs | Contribution streams in the 126 days/18 week review period |
|
| High-delivery complexity programs | Contribution streams in the 154 days/22 week review period |
|
Note on Reporting Conventions – Quantitative Data
Throughout the report, subgroup results have been compared to average of all applicants (i.e., total) and statistically significant differences at the 95% confidence level noted using green and red boxes.
Where subgroup results are statistically higher than the total a green box has been used and where results are statistically lower than the total a red box has been used.
Additionally, where results in Year 3 were statistically higher than Year 2, a green arrow has been used and where results in Year 3 were statistically lower than Year 2, a red arrow has been used.
Significantly higher / lower than total
Significantly higher / lower than Year 2
For the purposes of legibility, values of less than 3% have not been labelled in charts throughout the report.
Bases marked with a * indicate a small sample size and with ** indicate very small sample size, so results should be interpreted with caution and findings viewed as directional in nature.
As part of the analysis, a key drivers’ analysis was conducted to identify the factors which have the greatest impact on overall satisfaction. Throughout the report, the top 5 drivers have been identified using a yellow box.
Top 5 driver of satisfaction
Methodology – Qualitative Research
Respondents from the Gs&Cs client experience survey were asked a question whether they would be interested in taking part in follow-up qualitative research. After conducting an analysis of the sample that opted-in to ensure a mix of programs, regions, and to ensure inclusion of applicants in both official languages, potential applicants were contacted randomly and asked if they would like to be taken through the screening questionnaire to confirm their eligibility for an in-depth interview or online focus group.

Click for larger view
As shown in the tables below, 4 focus groups and 26 in-depth interviews were conducted.
| Focus Groups Composition | Date and Time |
|---|---|
| Group 1: Unfunded applicants to any program NATIONAL - ENGLISH |
July 26 at 10AM ET 6 Applicants |
| Group 2: Funded applicants to any program NATIONAL - ENGLISH |
July 26 at 3PM ET 8 Applicants |
| Group 3: Unfunded applicants to any program QUEBEC or Official Language Minority Communities (OLMC) - FRENCH |
July 27 at 10AM ET 7 Applicants |
| Group 4: Funded applicants to any program QUEBEC or Official Language Minority Communities (OLMC) - FRENCH |
July 27 at 1PM ET 7 Applicants |
| In-depth Interviews Composition | Date and Time |
|---|---|
| In-depth interviews. The following programs were prioritized: Apprenticeship Service (AS), Workplace Opportunities: Removing Barriers to Equity (WORBE), Social Development Partnerships Program - Disability (SDPP-D), Supports for Student Learning Program (SSLP), Sectoral Initiatives Program (SIP). | July 18 to August 10 19 English Applicants 7 French Applicants |
Methodology – Qualitative Research Data Collection, Analysis
Data Collection
With applicants’ consent, all qualitative research sessions are both audio and video taped. Verbatim transcripts from each and every focus group and interview is created; however, names or personal identifying details are not captured and/or scrubbed or redacted by the moderator to ensure applicants’ privacy.
Moderators also capture high level findings on each topic of their own observations – what the overall reaction was, any nuances, and any non-verbal cues on body language or tone. Because our transcripts are anonymous, it is not possible to comment on any variations by group or audience, if they have not been placed in separate groups – for example, moderators cannot provide a sense of different opinions by older vs. younger applicants, or males vs. females, depending on the topic.
Data Analysis
We identify the following elements in the qualitative analysis:
- Universal agreement where applicants all agree, or there is agreement across different groups of stakeholders
- Consensus perspectives that reflect the view of most applicants; areas of wide agreement without much counter point (Many, most, several)
- Conflicting or polarized perspectives where views are much more divided, or if there is a spectrum or variety of views (Some vs others)
- Minority perspectives, often expressed by one or two applicants as a counterpoint to a consensus viewpoint, or if they have an individual take or example/story (a few, a couple, mention)
- Verbatim commentary, providing examples of what applicants actually said during a discussion (direct unattributed quotes)
- External context, for this project it is the results of quantitative research that provided a foundation for the qualitative research conducted and the discussion questions posed.
Note on Interpretation of Qualitative Findings
The value of qualitative research is in exploring the issues and experiences of research participants in depth, free from the constraints of a structured quantitative questionnaire. Qualitative evidence is rich and allows researchers to hear first-hand the underlying factors shaping experiences and opinions, as well as the interplay between factors.
Qualitative findings should not be extrapolated to the broader population, as they are not statistically projectable. Notable nuances that emerged in the interviews have been highlighted where relevant and these should be treated as strictly directional.
The qualitative findings should thus be viewed as complementary to the quantitative survey findings in terms of building a more complete understanding of the Gs&Cs client experience.
Service Canada’s Grants & contributions Client Experience Survey Model
ESDC’s Gs&Cs CX Survey Measurement Model
ESDC’s Gs&Cs model is inspired by the CX measurement model developed by the ESDC’s Citizen Services Branch. It details the service dimensions, service attributes and the client journey that are assessed to evaluate the overall client experience and satisfaction.

Click for larger view
Service Canada CX Survey Measurement Model: Service Attributes
The following was the full set of detailed service attributes in the model that guided the development of the survey questionnaire.
| Easy | Simplicity |
|
||
|---|---|---|---|---|
| Clarity |
|
Client perception |
||
| Convenience |
|
|||
| Effectiveness | Availability |
|
Satisfaction with overall service experience |
|
| Timeliness |
|
|||
| Consistency |
|
|||
| Efficiency |
|
Would speak positively to others about service experience |
||
| Emotion | Attitude |
|
||
| Assurance |
|
Detailed Quantitative findings
Overall Performance
Satisfaction with Service Experience
- Fewer applicants were satisfied with their service experience compared to Year 2 with results returning to levels observed in Year 1. Overall, nearly seven in ten (68%) applicants were satisfied (4 or 5 on a 5-point scale), a decrease of nine points from Year 2. Close to two in ten (16%) provided a neutral rating (+2 pts) and slightly fewer (14%) were dissatisfied (+7 pts, defined as 1 or 2 on a 5-point scale).
- Applicants to NHSP were more likely to be satisfied with the service experience compared to all clients, while applicants to all programs but EAF, NHSP and CSJ and in particular WER, SDPP and SIP were less likely to be satisfied. Compared to Year 2, satisfaction has decreased among applicants to CSJ and SDPP.
How satisfied or dissatisfied were you with the overall service you received from Service Canada from getting information about [PROGRAM] to receiving a funding decision?

Click for larger view
Note: values less than 3% not labelled
* small sample size
** very small sample size
Significantly higher / lower than total
Significantly higher / lower than Year 2
Q31. On a scale from 1 to 5, where 1 means ‘very dissatisfied’, and 5 means ‘very satisfied’, how dissatisfied or satisfied were you with the overall service you received from Service Canada from getting information about [INSERT PROGRAM] to receiving a funding decision?
Base: All respondents n=3041
Figure 5: Satisfaction with Service Experience
This vertical bar chart shows responses to a question about how satisfied or dissatisfied the applicant was with the overall service they received from Service Canada from getting information about the program they applied for to receiving a funding decision and presents results for Year 1, Year 2 and Year 3. Respondents were asked to provide ratings on a 5-pt scale.
- Total: Year 3 33% very satisfied, 36% somewhat satisfied, 16% neutral, 7% somewhat dissatisfied, 7% very dissatisfied. A total of 3041 respondents answered this question. Year 2 42% very satisfied, 35% somewhat satisfied, 14% neutral, 4% somewhat dissatisfied, 3% very dissatisfied. Year 1 32% very satisfied, 37% somewhat satisfied, 18% neutral, 8% somewhat dissatisfied, 4% very dissatisfied, 1% Don’t know.
- EAF: Year 3 72% very/somewhat satisfied. A total of 300 respondents answered this question. Year 2 78% very/somewhat satisfied. Year 1 77% very/somewhat satisfied.
- NHSP: Year 3 82% very/somewhat satisfied. A total of 1296 respondents answered this question. Year 2 83% very/somewhat satisfied. Year 1 73% very/somewhat satisfied.
- CSJ: Year 3 68% very/somewhat satisfied. A total of 1004 respondents answered this question. Year 2 79% very/somewhat satisfied. Year 1 69% very/somewhat satisfied.
- SDPP: Year 3 42% very/somewhat satisfied. A total of 214 respondents answered this question. Year 2 72% very/somewhat satisfied. Year 1 53% very/somewhat satisfied.
- AS: Year 3 36% very/somewhat satisfied. A total of 11 respondents answered this question.
- WORBE: Year 3 59% very/somewhat satisfied. A total of 22 respondents answered this question.
- SSLP: Year 3 50% very/somewhat satisfied. A total of 24 respondents answered this question.
- WER: Year 3 35% very/somewhat satisfied. A total of 51 respondents answered this question.
- STAR: Year 3 33% very/somewhat satisfied. A total of 3 respondents answered this question.
- SIP: Year 3 28% very/somewhat satisfied. A total of 116 respondents answered this question.
- All but EAF, NHSP, CSJ: Year 3 38% very/somewhat satisfied. A total of 441 respondents answered this question. Year 2 58% very/somewhat satisfied. Year 1 61% very/somewhat satisfied.
Ease of End-to-End Journey
- Fewer applicants agreed (4 or 5 on a 5-point scale) that throughout the process it was clear what would happen next and when and that it was easy to get help when needed compared to Year 2. At nine in ten (90%, -1 pt), nearly all applicants found it easy to access service in a language they could understand. More than eight in ten (84%, -4 pts) said that being able to complete steps online made the process easier, followed by fewer than eight in ten (78%, -1 pt) who thought the application process overall was easy. Two-thirds said they needed to explain their situation only once (65%, -2 pts), that it was clear what would happen next and when (64%, -5 pts) and that it was easy to get help when needed (63%, -6 pts).
Thinking about the overall service you received, from getting information about [PROGRAM] to receiving funding decision, how much do you agree or disagree with the following statements?

Click for larger view
Note: values less than 3% not labelled
* small sample size
** very small sample size
Year 3 Year 2 Year 1
Top 5 driver of satisfaction
Significantly higher / lower than total
Significantly higher / lower than Year 2
Q30. Thinking about the overall service you received, from getting information about [INSERT PROGRAM] to receiving funding decision, how much do you agree or disagree with the following statements, using a 5-point scale where 1 means ‘strongly disagree’ and 5 means ‘strongly agree’.
Figure 6: Ease of End-to-end Journey
This horizontal bar chart shows the extent to which respondents agree or disagree with a variety of statements related to the ease of the overall service experience and presents results for Year 1, Year 2 and Year 3. Respondents were asked to provide ratings on a 5-pt scale. Sample sizes vary by statement.
- It was easy to access service in a language I could speak and understand well: Year 3 64% strongly agree, 26% somewhat agree, 5% neutral, 1% somewhat disagree, 1% strongly disagree, 3% Don’t know. 90% agree. A total of 3041 respondents answered this question. Year 2 91% agree. Year 1 95% agree
- Being able to complete steps online made the process easier for me: Year 3 47% strongly agree, 37% somewhat agree, 11% neutral, 3% somewhat disagree, 2% strongly disagree, 1% Don’t know. 84% agree. A total of 881 respondents answered this question. Year 2 88% agree. Year 1 82% agree.
- Overall, it was easy for me to apply: Year 3 36% strongly agree, 42% somewhat agree, 15% neutral, 5% somewhat disagree, 2% strongly disagree, 1% Don’t know. 78% agree. A total of 3041 respondents answered this question. Year 2 79% agree. Year 1 74% agree
- I needed to explain my situation only once: Year 3 34% strongly agree, 31% somewhat agree, 13% neutral, 6% somewhat disagree, 4% strongly disagree, 12% Don’t know. 65% agree. A total of 3041 respondents answered this question. Year 2 67% agree. Year 1 62% agree.
- Throughout the process it was clear what would happen next and when it would happen: Year 3 29% strongly agree, 36% somewhat agree, 18% neutral, 9% somewhat disagree, 6% strongly disagree, 2% Don’t know. 64% agree. A total of 3041 respondents answered this question. Year 2 69% agree. Year 1 58% agree.
- It was easy to get help when I needed it: Year 3 30% strongly agree, 34% somewhat agree, 17% neutral, 7% somewhat disagree, 5% strongly disagree, 8% Don’t know. 63% agree. A total of 3041 respondents answered this question. Year 2 69% agree. Year 1 61% agree.
Ease of End-to-End Journey by Program
- NHSP applicants were more likely to say it was easy to access service in a language they could understand, that it was easy to get help, and that it was clear what would happen next and when. EAF applicants were more likely to say that it was clear what would happen next. Those who applied to SDPP and SIP (and to a lesser extent WER) experienced more difficulty with all aspects of the application process.
- Compared to Year 2, applicants to SDPP provided lower ratings across most aspects of ease and were less likely to feel the application process was easy overall. Applicants to CSJ were less likely to agree that it was clear what would happen next and when and that it was easy to get help when needed.
Thinking about the overall service you received, from getting information about [PROGRAM] to receiving a funding decision, how much do you agree or disagree with the following statements?
| TOP2BOX (% RATED 4/5) | ||||||||||||||||||||||||
| TOTAL | EAF | NHSP | CSJ | SDPP | AS | WOR BE | SSLP | WER | STAR | SIP | All but EAF, NHSP, CSJ | |||||||||||||
| Year 3 | Year 2 | Year 1 | Year 3 | Year 2 | Year 1 | Year 3 | Year 2 | Year 1 | Year 3 | Year 2 | Year 1 | Year 3 | Year 2 | Year 1 | Year 3 | Year 3 | Year 3 | Year 3 | Year 3 | Year 3 | Year 3 | Year 2 | Year 1 | |
| Base: All respondents – n= | 3041 | 1942 | 1549 | 300 | 207 | 56 | 1296 | 384 | 431 | 1004 | 865 | 942 | 214 | 153 | 17* | 11* | 22* | 24** | 51 | 3** | 116 | 441 | 486 | 120 |
| It was easy to access service in a language I could speak and understand well | 90% | 91% | 95% | 89% | 89% | 96% | 92% | 92% | 94% | 91% | 91% | 95% | 84% | 88% | 82% | 73% | 96% | 88% | 82% | 67% | 77% | 82% | 84% | 88% |
| Base: Applicants who used online channel – n= | 881 | 623 | 1067 | 44 | 27* | 30 | 285 | 69 | 175 | 373 | 375 | 802 | 88 | 23* | 5** | 6** | 4** | 15* | 20* | 6** | 46 | 179 | 152 | 60 |
| Being able to complete steps online made the process easier for me | 84% | 88% | 82% | 82% | 93% | 90% | 82% | 81% | 75% | 85% | 89% | 83% | 77% | 80% | 60% | 33% | 75% | 80% | 95% | - | 72% | 76% | 74% | 73% |
| Base: All respondents – n= | 3041 | 1942 | 1549 | 300 | 207 | 56 | 1296 | 384 | 431 | 1004 | 865 | 942 | 214 | 153 | 17* | 11* | 22* | 24* | 51 | 3** | 116 | 441 | 486 | 120 |
| Overall, it was easy for me to apply | 79% | 79% | 74% | 74% | 75% | 84% | 77% | 78% | 71% | 79% | 82% | 74% | 48% | 69% | 59% | 55% | 73% | 58% | 57% | 100% | 50% | 52% | 61% | 64% |
| I needed to explain my situation only once | 69% | 67% | 62% | 66% | 67% | 63% | 75% | 75% | 69% | 66% | 67% | 62% | 40% | 63% | 41% | 27% | 73% | 46% | 41% | 33% | 46% | 43% | 53% | 62% |
| Throughout the process it was clear what would happen next and when it would happen | 64% | 69% | 58% | 70% | 66% | 71% | 76% | 77% | 65% | 65% | 71% | 57% | 37% | 60% | 53% | 27% | 50% | 42% | 35% | - | 31% | 35% | 45% | 51% |
| It was easy to get help when I needed it | 63% | 69% | 61% | 64% | 66% | 63% | 72% | 75% | 69% | 64% | 70% | 61% | 38% | 70% | 65% | 36% | 73% | 58% | 29% | 33% | 38% | 39% | 58% | 62% |
Q30. Thinking about the overall service you received, from getting information about [INSERT PROGRAM] to receiving funding decision, how much do you agree or disagree with the following statements, using a 5-point scale where 1 means ‘strongly disagree’ and 5 means ‘strongly agree’.
* small sample size
** very small sample size
Top 5 driver of satisfaction
Significantly higher / lower than total
Significantly higher / lower than Year 2
Effectiveness of End-to-End Journey
- Fewer applicants agreed they received consistent information, that it was clear what to do if they had a problem or question and that the amount of time it took was reasonable compared to Year 2. Three-quarters (75%) agreed that they were able to move smoothly through all steps (75%, -3 pts), followed closely by that they received consistent information (73%, -3 pts). Two-thirds were confident any issues would have been resolved (67%, -3 pts) or thought it was clear what to do if they had a problem or question (65% -5 pts), while slightly fewer than six in ten said the process took a reasonable amount of time (58%, -8 pts). Just over half (54%, +13 pts) of those who used the in-person channel said they travelled a reasonable distance to access a Service Canada office.
Thinking about the overall service you received, from getting information about [PROGRAM] to receiving funding decision, how much do you agree or disagree with the following statements?

Click for larger view
Note: values less than 3% not labelled
* small sample size
** very small sample size
Significantly higher / lower than total
Significantly higher / lower than Year 2
Q30. Thinking about the overall service you received, from getting information about [INSERT PROGRAM] to receiving funding decision, how much do you agree or disagree with the following statements, using a 5-point scale where 1 means ‘strongly disagree’ and 5 means ‘strongly agree’.
Figure 7: Effectiveness of End-to-End Journey
This horizontal bar chart shows the extent to which respondents agree or disagree with a variety of statements related to the effectiveness of the overall service experience and presents results for Year 1, Year 2 and Year 3. Respondents were asked to provide ratings on a 5-pt scale. Sample sizes vary by statement.
- I was able to move smoothly through all of the steps related to the application: Year 3 36% strongly agree, 39% somewhat agree, 17% neutral, 5% somewhat disagree, 2% strongly disagree, 1% Don’t know. 75% agree. A total of 3041 respondents answered this question. Year 2 78% agree. Year 1 70% agree.
- I received consistent information: Year 3 37% strongly agree, 36% somewhat agree, 15% neutral, 6% somewhat disagree, 3% strongly disagree, 4% Don’t know. 73% agree. A total of 3041 respondents answered this question. Year 2 76% agree. Year 1 72% agree.
- I was confident that any issues or problems would have been easily resolved: Year 3 30% strongly agree, 37% somewhat agree, 19% neutral, 5% somewhat disagree, 4% strongly disagree, 5% Don’t know. 67% agree. A total of 3041 respondents answered this question. Year 2 70% agree. Year 1 63% agree.
- It was clear what to do if I had a problem or question: Year 3 30% strongly agree, 35% somewhat agree, 19% neutral, 8% somewhat disagree, 4% strongly disagree, 5% Don’t know. 65% agree. A total of 3041 respondents answered this question. Year 2 70% agree. Year 1 62% agree.
- The amount of time it took, from when I started gathering information to when I got a decision on my application, was reasonable: Year 3 26% strongly agree, 32% somewhat agree, 20% neutral, 9% somewhat disagree, 11% strongly disagree, 2% Don’t know. 58% agree. A total of 3041 respondents answered this question. Year 2 66% agree. Year 1 56% agree.
- I travelled a reasonable distance to access the Service Canada Office: Year 3 36% strongly agree, 18% somewhat agree, 13% neutral, 0% somewhat disagree, 23% strongly disagree, 10% Don’t know. 54% agree. A total of 44 respondents answered this question. Year 2 41% agree. Year 1 55% agree.
Effectiveness of End-to-End Journey by Program
- NHSP applicants were more likely to say they received consistent information, to have confidence in issue resolution, feel it was clear what to do if they had a problem or question, and that the overall time it took was reasonable. EAF applicants were more likely to agree that the amount of time it took was reasonable. As with measures related to ease of the process, those who applied to SDPP, WER and SIP were less likely to provide high ratings for nearly all aspects of the effectiveness of the process.
- Compared to Year 2, applicants to SDPP provided lower ratings across nearly all aspects of effectiveness and CSJ applicants provided lower ratings for the clarity of the issue resolution process and that the amount of time it took was reasonable.
Thinking about the overall service you received, from getting information about [PROGRAM] to receiving funding decision, how much do you agree or disagree with the following statements?
| TOP2BOX (% RATED 4/5) | ||||||||||||||||||||||||
| TOTAL | EAF | NHSP | CSJ | SDPP | AS | WOR BE | SSLP | WER | STAR | SIP | All but EAF, NHSP, CSJ | |||||||||||||
| Year 3 | Year 2 | Year 1 | Year 3 | Year 2 | Year 1 | Year 3 | Year 2 | Year 1 | Year 3 | Year 2 | Year 1 | Year 3 | Year 2 | Year 1 | Year 3 | Year 3 | Year 3 | Year 3 | Year 3 | Year 3 | Year 3 | Year 2 | Year 1 | |
| Base: All respondents – n= | 3041 | 1942 | 1549 | 300 | 207 | 56 | 1296 | 384 | 431 | 1004 | 865 | 942 | 214 | 153 | 17* | 11* | 22* | 24* | 51 | 3** | 116 | 441 | 486 | 120 |
| I was able to move smoothly through all of the steps related to the application | 75% | 78% | 70% | 73% | 73% | 79% | 75% | 77% | 74% | 77% | 80% | 69% | 54% | 71% | 65% | 64% | 77% | 58% | 53% | 67% | 53% | 55% | 66% | 61% |
| I received consistent information | 73% | 76% | 72% | 75% | 73% | 79% | 79% | 81% | 76% | 73% | 77% | 71% | 47% | 68% | 59% | 27% | 77% | 58% | 43% | 33% | 48% | 48% | 59% | 62% |
| I was confident that any issues or problems would have been easily resolved | 67% | 70% | 63% | 67% | 71% | 75% | 73% | 75% | 69% | 68% | 71% | 62% | 43% | 65% | 41% | 18% | 68% | 46% | 49% | - | 34% | 41% | 54% | 50% |
| It was clear what to do if I had a problem or question | 65% | 70% | 62% | 63% | 66% | 70% | 74% | 75% | 70% | 65% | 71% | 61% | 40% | 69% | 71% | 46% | 82% | 71% | 51% | - | 42% | 44% | 59% | 63% |
| The amount of time it took, from when I started gathering information to when I got a decision on my application, was reasonable | 58% | 66% | 56% | 70% | 70% | 68% | 75% | 75% | 59% | 58% | 68% | 56% | 35% | 46% | 53% | 36% | 50% | 38% | 24% | 33% | 31% | 33% | 39% | 46% |
| Base: Applicants who used in-person channel – n= | 44 | 29* | 64 | 3** | 2** | 2** | 20* | 12** | 24* | 16* | 10* | 33 | 2** | 2** | 0 | 0 | 0 | 1** | 0 | 0 | 2** | 5** | 5** | 5** |
| I travelled a reasonable distance to access the Service Canada Office | 54% | 41% | 55% | 33% | - | - | 45% | 42% | 58% | 58% | 40% | 58% | - | 100% | - | - | - | 100% | - | - | - | 13% | 55% | 31% |
Q30. Thinking about the overall service you received, from getting information about [INSERT PROGRAM] to receiving funding decision, how much do you agree or disagree with the following statements, using a 5-point scale where 1 means strongly disagree and 5 means strongly agree.
* small sample size
** very small sample size
Top 5 driver of satisfaction
Significantly higher / lower than total
Significantly higher / lower than Year 2
Emotion of End-to-End Journey
- Ratings across aspects of emotion of the end-to-end journey remained consistent compared to Year 2. At more than nine in ten (91%, -2 pts), nearly all applicants were provided service in their choice of English or French, followed by eight in ten who were confident their personal information was protected (81%, -2 pts). Nearly seven in ten of those who used the phone channel said the Service Canada representatives were helpful (67%, -2 pts), while almost the same proportion of those who used the in-person channel felt that the Service Canada representatives were helpful (68%, +9 pts).
Thinking about the overall service you received, from getting information about [PROGRAM] to receiving funding decision, how much do you agree or disagree with the following statements?

Click for larger view
Note: values less than 3% not labelled
* small sample size
** very small sample size
Significantly higher / lower than Year 2
Q30. Thinking about the overall service you received, from getting information about [INSERT PROGRAM] to receiving funding decision, how much do you agree or disagree with the following statements, using a 5-point scale where 1 means ‘strongly disagree’ and 5 means ‘strongly agree’.
Figure 8: Emotion of End-to-End Journey
This horizontal bar chart shows the extent to which respondents agree or disagree with a variety of statements related to about the emotion of the overall service experience and presents results for Year 1, Year 2 and Year 3. Respondents were asked to provide ratings on a 5-pt scale. Sample sizes vary by statement.
- I was provided with service in my choice of English or French: Year 3 69% strongly agree, 22% somewhat agree, 3% neutral, 1% somewhat disagree, 0% strongly disagree, 4% Don’t know. 91% agree. A total of 3041 respondents answered this question. Year 2 93% agree. Year 1 96% agree.
- I was confident that my personal information was protected: Year 3 46% strongly agree, 35% somewhat agree, 10% neutral, 2% somewhat disagree, 1% strongly disagree, 7% Don’t know. 81% agree. A total of 3041 respondents answered this question. Year 2 83% agree. Year 1 88% agree.
- Service Canada representatives that I dealt with in person were helpful: Year 3 50% strongly agree, 18% somewhat agree, 8% neutral, 5% somewhat disagree, 11% strongly disagree, 7% Don’t know. 68% agree. A total of 44 respondents answered this question. Year 2 59% agree. Year 1 73% agree.
- Service Canada phone representatives were helpful: Year 3 42% strongly agree, 25% somewhat agree, 14% neutral, 3% somewhat disagree, 3% strongly disagree, 14% Don’t know. 67% agree. A total of 629 respondents answered this question. Year 2 69% agree. Year 1 72% agree.
Emotion of End-to-End Journey by Program
- Applicants to SDPP and WER were less likely to report being provided service in their choice of English or French, while SDPP applicants were also less likely to say they were confident that their personal information was protected. Applicants to NHSP were more likely to report being provided service in their choice of official language, to have felt confident their personal information was protected and that the Service Canada phone representative was helpful.
- Compared to Year 2, applicants to SDPP were less likely to agree that the Service Canada phone representative was helpful.
Thinking about the overall service you received, from getting information about [PROGRAM] to receiving funding decision, how much do you agree or disagree with the following statements?
| TOP2BOX (% RATED 4/5) | ||||||||||||||||||||||||
| TOTAL | EAF | NHSP | CSJ | SDPP | AS | WOR BE | SSLP | WER | STAR | SIP | All but EAF, NHSP, CSJ | |||||||||||||
| Year 3 | Year 2 | Year 1 | Year 3 | Year 2 | Year 1 | Year 3 | Year 2 | Year 1 | Year 3 | Year 2 | Year 1 | Year 3 | Year 2 | Year 1 | Year 3 | Year 3 | Year 3 | Year 3 | Year 3 | Year 3 | Year 3 | Year 2 | Year 1 | |
| Base: All respondents – n= | 3041 | 1942 | 1549 | 300 | 207 | 56 | 1296 | 384 | 431 | 1004 | 865 | 942 | 214 | 153 | 17* | 11 | 22* | 24 | 51 | 3** | 116 | 441 | 486 | 120 |
| I was provided with service in my choice of English or French | 91% | 93% | 69% | 92% | 92% | 93% | 93% | 95% | 96% | 91% | 93% | 96% | 86% | 89% | 94% | 73% | 91% | 100% | 82% | 100% | 88% | 87% | 89% | 92% |
| I was confident that my personal information was protected | 81% | 83% | 88% | 85% | 83% | 86% | 85% | 87% | 88% | 81% | 83% | 88% | 72% | 80% | 88% | 82% | 86% | 92% | 82% | 67% | 78% | 76% | 77% | 88% |
| Base: Applicants who used in-person channel – n= | 44* | 29% | 64 | 3** | 2** | 2** | 20* | 12* | 24* | 16* | 10* | 33 | 2** | 2** | 0 | 0 | 0 | 1** | 0 | 0 | 2* | 5** | 5** | 5** |
| Service Canada representatives that I dealt with in person were helpful | 68% | 59% | 73% | 67% | 50% | 100% | 60% | 75% | 79% | 69% | 50% | 73% | 50% | 100% | - | - | - | 100% | - | - | 50% | 56% | 66% | 38% |
| Base: Applicants who used phone channel – n= | 629 | 468 | 324 | 88 | 83% | 18* | 271 | 94% | 92 | 220 | 176% | 183 | 27* | 58% | 12* | 0 | 2** | 4* | 3* | 1** | 13** | 50 | 115 | 31 |
| Service Canada phone representatives were helpful | 67% | 69% | 72% | 68% | 69% | 67% | 77% | 75% | 78% | 66% | 68% | 72% | 44% | 82% | 100% | - | 50% | 25% | 67% | - | 46% | 44% | 63% | 69% |
Q30. Thinking about the overall service you received, from getting information about [INSERT PROGRAM] to receiving funding decision, how much do you agree or disagree with the following statements, using a 5-point scale where 1 means ‘strongly disagree’ and 5 means ‘strongly agree’.
* small sample size
** very small sample size
Significantly higher / lower than total
Significantly higher / lower than Year 2
Most Impactful Changes to Improve Overall Experience
- When asked what change would have improved their overall experience the most, three in ten applicants (31%) said the amount of time from start to finish was more reasonable, followed by if it was easier to complete steps online (16%), it was more clear what would happen next and when (12%) and that the amount of time to prepare the application was more reasonable.
- Applicants to NHSP were more likely to say if it was easier to complete steps online, the amount of time to prepare the application was more reasonable and being able to move more smoothly through all steps. SDPP applicants were more likely to say if it was more clear what would happen next and when and what to do if they had a problem or question and EAF applicants if it was it is clearer what to do if they had a problem or question and easier to resolve any issues or problems. EAF, NSHP and SDPP applicants were also more likely to say if it was easier to access service in a language they understand well.
Thinking about the entire process applying for [PROGRAM], which of the following changes would have improved your overall experience the most? – (Single select)
| EAF | NHSP | CSJ | SDPP | AS | WORBE | SSLP | WER | STAR | SIP | All but EAF, NHSP, CSJ | ||
| Year 3 | Year 3 | Year 3 | Year 3 | Year 3 | Year 3 | Year 3 | Year 3 | Year 3 | Year 3 | Year 3 | ||
| (n=300) | (n=1296) | (n=1004) | (n=214) | (n=11*) | (n=22*) | (n=24*) | (n=51) | (n=3**) | (n=116) | (n=441) | ||
| The amount of time was more reasonable | 31% | 18% | 19% | 32% | 35% | 36% | 23% | 46% | 43% | - | 41% | 37% |
| It was easier to complete steps online | 16% | 15% | 18% | 16% | 6% | 9% | 14% | 8% | 6% | - | 10% | 7% |
| It was more clear what will happen next in the process and when it would happen | 12% | 13% | 10% | 12% | 18% | - | 36% | 21% | 20% | - | 15% | 17% |
| The amount of time to prepare the application was more reasonable | 12% | 14% | 17% | 11% | 12% | 27% | 14% | 4% | 6% | 33% | 17% | 13% |
| Being able to move more smoothly through all of the steps | 8% | 8% | 11% | 8% | 8% | 18% | 5% | 17% | 4% | - | 4% | 7% |
| It was easier to get help when I needed it | 8% | 8% | 8% | 8% | 6% | - | 9% | 4% | 12% | - | 3% | 6% |
| It is clearer what to do if I had a problem or question | 7% | 13% | 8% | 7% | 11% | - | - | - | 2% | - | 5% | 7% |
| It was easier to resolve any issues or problems | 4% | 7% | 5% | 4% | 2% | 9% | - | - | 4% | 67% | 3% | 3% |
| It was easier to access service in a language I speak and understand well | 2% | 4% | 4% | 2% | 4% | - | - | - | 4% | - | 3% | 3% |
* small sample size
** very small sample size
Significantly higher / lower than total
Qualitative Findings: The Ideal Journey
Applicants who took part in the qualitative research were asked to describe what an ideal application journey would look like. They offered many suggestions on how they could be better supported as well as how the process could be streamlined and simplified.
Click for larger view
Profile of Applicants Who Were Satisfied
- Compared to Year 2, a lower proportion of applicants were satisfied with their experience.
- Applicants who were satisfied were more likely to have applied for the same program several times before, were in contact with Service Canada fewer times, were less likely to encounter problems (and among those who did were more likely to say it was easy to resolve), were more likely to have been contacted by Service Canada to provide more information and less likely to have followed up before receiving a decision.
- Satisfied applicants were more likely to have received funding approval, to be aware of all service standards, to operate or deliver services in Quebec and were less likely to have felt discriminated against on the basis of identity. They were also more likely to express trust in Service Canada.
| Overall satisfaction (% rated 4/5) | Year 3 (n=2139) | Year 2 (n=1443) | Year 1 (n=1086) |
|---|---|---|
| 68% | 77% | 70% |
| Prominent differences among those satisfied | |
|---|---|
| Apply for the same program several times before | 29% |
| Fewer number of contacts with Service Canada (average contacts) | 6.6 |
| Lower incidence of problems | 15% |
| 35% | |
| More likely to have been contacted by Service Canada to provide additional information on application | 29% |
| Less likely to have followed up with Service Canada before receiving a decision (% who did not) | 71% |
| Received funding approval | 85% |
| More likely to be aware of all service standards: | |
| 49% | |
| |
41% |
| |
39% |
| More likely to operate (27%) and deliver services in Quebec (28%) | |
| Less likely to have felt discriminated against on basis of identity | 2% |
| More likely to trust Service Canada | 91% |
Top 5 driver of satisfaction
Profile of Applicants Who Were Not Satisfied
- Compared to Year 2, more applicants were dissatisfied with their experience.
- Applicants who were not satisfied were more likely to report having a greater number of contacts with Service Canada, to encounter problems or issues, to contact Service Canada before receiving a decision, to have been denied funding and not provided an explanation why.
- Applicants who were not satisfied were less likely to be aware of all service standards, more likely to operate or deliver services in the West or Territories, to have more than 50 employees and were less likely to operate in the Not-for-profit sector. They were also more likely to have felt discriminated against on the basis of identity and less likely to trust Service Canada.
| Overall satisfaction (% rated 1/2) | Year 3 (n=354) | Year 2 (n=176) | Year 1 (n=170) |
|---|---|---|
| 14% | 7% | 12% |
| Prominent differences among those not satisfied | |
|---|---|
| Higher number of contacts with Service Canada (average contacts) | 9.8% |
| Higher incidence of problems | 64% |
| Higher incidence of problems | |
| More likely to have contacted Service Canada to check on the status of their application (37%) or determine timelines for funding decision (27%) | |
| Denied funding approval | 40% |
| 78% | |
| Less likely to trust Service Canada | 32% |
| Less likely to be aware of all service standards: | |
| 30% | |
| 35% | |
| 17% | |
| More likely to operate (51%) and deliver services in the West/ Territories (52%) | |
| Felt discriminated against on basis of identity | 7% |
| Less likely to operate in the Not-for-profit sector | 62% |
| More likely to have 50 or more employees | 22% |
Profile of Applicants – Funded and Not Funded
- Applicants who were approved for funding were more likely to be satisfied with their experience than those who were not. Applicants who were not approved for funding were more likely to experience a problem or issue, were less satisfied with the service provided through most Service Canada channels and were less likely to have received an email from the funding program directly when learning about the program. Unfunded applicants were also less likely to provide high ratings for the ease of several aspects of the awareness and application stages of the process and were more likely to have contacted Service Canada before receiving a decision and to have felt it was difficult to do so.
- Compared to Year 1, applicants who were approved for funding were more likely to be satisfied overall and with the service provided online, through email support from a SC office and the GCOS web portal and were less likely to have experienced a problem. They were also more likely to provide high ratings for the ease of several aspects of the awareness and application stages and were less likely to have contacted SC prior to receiving a decision or to have felt it was difficult to do so. Applicants who were not approved were more likely to have received an email from the program directly (along with those approved) and were less likely to feel it was easy to find out what information they needed to provide.
| OVERALL SATISFACTION (% RATED 4/5) | |||||
|---|---|---|---|---|---|
| Year 3 (n=2106) | Year 2 (n=1604) | Year 1 (n=1304) | Year 3 (n=845) | Year 2 (n=216) | Year 1 (n=187) |
| Funded | Not Funded | ||||
| 73% | 82% | 74% | 49% | 47% | 41% |
| Funded | Not Funded | |||||
|---|---|---|---|---|---|---|
| Year 3 | Year 2 | Year 1 | Year 3 | Year 2 | Year 1 | |
| EXPERIENCED A PROBLEM OR ISSUE | ||||||
| % Yes | 23% | 20% | 34% | 39% | 39% | 36% |
| SERVICE CHANNEL SATISFACTION | ||||||
| Government of Canada website | 70% | 73% | 67% | 52% | 59% | 52% |
| Email support from SC office | 73% | 72% | 68% | 50% | 47% | 44% |
| Email support from program officer | 82% | 81% | 82% | 60% | 47% | 58% |
| 1 800 O-Canada phone line | 50% | 51% | 50% | 18% | 39% | 49% |
| Telephone support from a Service Canada office | 64% | 61% | 62% | 52% | 54% | 51% |
| 78% | 62% | 70% | 32% | 20% | 32% | |
| GCOS web portal | 75% | 76% | 68% | 58% | 61% | 50% |
| CHANNEL USED TO LEARN ABOUT PROGRAM | ||||||
| Received an email from the funding program directly | 55% | 59% | 53% | 42% | 46% | 36% |
Significantly higher / lower than total
Significantly higher / lower than Year 2
- Applicants who were not approved for funding were less likely to provide high ratings across several service attributes. The largest service attribute gaps were for ease of getting help when needed, confidence that any issues would be easily resolved, that it was clear what would happen next and when, the amount of time it took was reasonable, being able to move smoothly through all steps and receiving consistent information.
- Compared to Year 2, applicants who were approved for funding provided lower ratings for the ease of getting help when needed, clarity of and confidence in the issue resolution process and that the amount of time it took was reasonable. Applicants who were not approved provided higher ratings for the ease of accessing service in a language that they could understand.
| Funded | Not Funded | |||||
|---|---|---|---|---|---|---|
| Year 3 (n=2106) | Year 2 (n=1604) | Year 1 (n=1304) | Year 3 (n=845) | Year 2 (n=216) | Year 1 (n=187) | |
| WIDEST GAPS/ SHIFTS IN SERVICE ATTRIBUTES (% RATED 4/5) | ||||||
| I was able to move smoothly through all of the steps | 80% | 80% | 72% | 59% | 65% | 51% |
| It was clear what to do if I had a problem or question | 69% | 73% | 65% | 50% | 43% | 41% |
| It was clear what would happen next and when it would happen | 69% | 72% | 61% | 47% | 46% | 35% |
| I was confident that any issues or problems would have been easily resolved | 72% | 73% | 66% | 48% | 47% | 39% |
| I needed to explain my situation only once | 69% | 70% | 66% | 51% | 44% | 38% |
| It was easy to get help when I needed it | 69% | 73% | 65% | 43% | 40% | 36% |
| Overall, it was easy for me to apply | 82% | 83% | 77% | 63% | 56% | 49% |
| Provided with service in my choice of English or French. | 92% | 94% | 96% | 88% | 86% | 91% |
| Confident that my personal information was protected | 83% | 84% | 89% | 74% | 73% | 82% |
| I received consistent information | 77% | 79% | 75% | 57% | 52% | 45% |
| Easy to access service in a language I could understand | 91% | 92% | 95% | 86% | 80% | 88% |
| The amount of time it took was reasonable | 63% | 70% | 60% | 42% | 41% | 31% |
Top 5 driver of satisfaction
Significantly higher / lower than total
Significantly higher / lower than Year 2
- Applicants who were not approved for funding were less likely to provide high ratings for all aspects of the ease of navigating the Government of Canada website and the application process. They were also were more likely to have contacted Service Canada before receiving a decision and less likely to have felt it was easy to do so.
- Compared to Year 2, applicants who were not approved for funding were more likely to say it was easy to find out what information they need to provide, determine the amount of time each phase of the application process is anticipated to take and to complete the project timeline, while applicants who were approved for funding were less likely to say it was easy to determine when the application period takes place and among those who followed up that it was easy to do so.
| FUNDED | NOT FUNDED | |||||
|---|---|---|---|---|---|---|
| Year 3 | Year 2 | Year 1 | Year 3 | Year 2 | Year 1 | |
| EASE OF NAVIGATING GoC WEBSITE (% RATED 4/5) | ||||||
| Find general information | 86% | 84% | 83% | 70% | 63% | 70% |
| Understand the information | 80% | 82% | 77% | 68% | 58% | 64% |
| Determine if your organization is eligible for funding | 84% | 86% | 86% | 68% | 62% | 64% |
| Determine the steps to apply for funding | 83% | 83% | 79% | 73% | 68% | 67% |
| Find out what information you need to provide | 82% | 81% | 80% | 68% | 54% | 67% |
| Determine the amount of time each phase of the application process is anticipated to take | 57% | 61% | - | 50% | 35% | - |
| Determine when the application period for [program] takes place | 81% | 85% | - | 72% | 71% | - |
| EASE OF APPLICATION PROCESS (% RATED 4/5) | ||||||
| Understanding the requirements of the application | 78% | 78% | 76% | 60% | 56% | 53% |
| Putting together the information you needed to apply | 75% | 77% | 71% | 61% | 54% | 51% |
| Completing the narrative questions | 73% | 73% | 65% | 59% | 54% | 47% |
| Completing the budget document | 71% | 69% | 69% | 51% | 55% | 52% |
| Completing the project timeline | 78% | 76% | 76% | 64% | 55% | 64% |
| Meeting the requirements of the application process | 80% | 82% | 80% | 64% | 59% | 50% |
| Application took reasonable amount of time to complete | 71% | 71% | 66% | 57% | 54% | 55% |
| CONTACTED SERVICE CANADA BEFORE RECEIVING A DECISION | ||||||
| % Contacted SC (for any reason) | 32% | - | - | 42% | - | - |
| Felt it was ‘easy’ to follow-up with SC | 57% | 69% | 66% | 39% | 43% | 36% |
Top 5 driver of satisfaction
Significantly higher / lower than total
Significantly higher / lower than Year 2
- Applicants who were not approved for funding were more likely to have been a first-time applicant to the program or applied once or twice before, to have applied to a different Gs&Cs program in the past 5 years and to have felt discriminated against on the basis of identity. They were also more likely to report operating in the private sector and less likely operating in the not-for-profit sector.
- Compared to Year 2, a greater proportion of both groups said they have applied for the same program once or twice or apply annually and fewer that they were applying for the first time. They were also more likely to report operating in the private sector (and less likely to say the not-for-profit sector). Applicants who were approved for funding were also less likely to have applied to a different Gs&Cs program in the past 5 years and to have felt discriminated against on the basis of identity.
| FUNDED | NOT FUNDED | |||||
|---|---|---|---|---|---|---|
| Year 3 | Year 2 | Year 1 | Year 3 | Year 2 | Year 1 | |
| SECTOR | ||||||
| Not-for-profit | 72% | 83% | 79% | 64% | 80% | 71% |
| Public | 15% | 14% | 18% | 16% | 18% | 25% |
| Private | 25% | 14% | 14% | 36% | 19% | 18% |
| APPLICATION FREQUENCY | ||||||
| First application | 8% | 17% | 12% | 16% | 47% | 24% |
| Applied once or twice before | 22% | 19% | 19% | 30% | 21% | 25% |
| Applied several times before | 27% | 26% | 27% | 25% | 14% | 18% |
| Apply for the same program on an annual basis | 42% | 37% | 42% | 27% | 14% | 34% |
| EXPERIENCE WITH SUBMITTING APPLCIATIONS TO OTHER PROGRAMS IN THE PAST 5 YEARS | ||||||
| Applied to different Gs&Cs program (among first time applicants) | 30% | 40% | - | 54% | 53% | - |
| FELT DISCRIMINATED AGAINST ON BASIS OF IDENTITY | ||||||
| % Yes | 1% | 3% | 1% | 6% | 9% | 7% |
Significantly higher / lower than total
Significantly higher / lower than Year 2
Trust in Service Canada
- Fewer applicants were trusting of Service Canada to deliver services effectively to Canadians compared to Year 2. Overall, three-quarters (76%, -8 pt) of applicants trust Service Canada to deliver services effectively to Canadians. As in previous years, this measure remains strongly correlated to overall satisfaction.
- Applicants to NHSP were more likely to express trust in Service Canada compared to all clients, while applicants to SDPP, WER, and SIP were less likely.
- Compared to Year 2, applicants to CSJ and SDPP were less likely to express trust in Service Canada.
How much would you say you trust or distrust Service Canada to deliver services effectively to Canadians?

Click for larger view
Note: values less than 3% not labelled
* small sample size
** very small sample size
Significantly higher / lower than total
Significantly higher / lower than Year 2
Q32. On a scale from 1 to 5, where 1 means ‘do not trust’ at all and 5 means ‘trust a great deal’, how much do you trust or distrust Service Canada to deliver services effectively to Canadians? Base: All respondents
Figure 9: Trust in Service Canada
This vertical bar chart shows responses to a question about the extent the applicant trusts or distrusts Service Canada and Department of Employment and Social Development Canada (ESDC) to deliver services effectively to Canadians and presents results for Year 1, Year 2 and Year 3. Respondents were asked to provide ratings on a 5-pt scale.
- Total: Year 3 37% trust a great deal, 38% somewhat trust, 16% neutral, 5% somewhat not trust, 2% do not trust at all, 2% Don’t know. A total of 3041 respondents answered this question. Year 2 47% trust a great deal, 36% somewhat trust, 12% neutral, 3% somewhat not trust, 1% do not trust at all, 2% Don’t know. Year 1 43% trust a great deal, 39% somewhat trust, 12% neutral, 3% somewhat not trust, 1% do not trust at all, 2% Don’t know.
- EAF: Year 3 79% trust a great deal/ trust somewhat. A total of 300 respondents answered this question. Year 2 82% trust a great deal/ trust somewhat. Year 1 77% trust a great deal/ trust somewhat.
- NHSP: Year 3 86% trust a great deal/ trust somewhat. A total of 1296 respondents answered this question. Year 2 85% trust a great deal/ trust somewhat. Year 1 73% trust a great deal/ trust somewhat.
- CSJ: Year 3 76% trust a great deal/ trust somewhat. A total of 1004 respondents answered this question. Year 2 85% trust a great deal/ trust somewhat. Year 1 69% trust a great deal/ trust somewhat.
- SDPP: Year 3 57% trust a great deal/ trust somewhat. A total of 214 respondents answered this question. Year 2 82% trust a great deal/ trust somewhat. Year 1 53% trust a great deal/ trust somewhat.
- AS: Year 3 55% trust a great deal/ trust somewhat. A total of 11 respondents answered this question.
- WORBE: Year 3 82% trust a great deal/ trust somewhat. A total of 22 respondents answered this question.
- SSLP: Year 3 71% trust a great deal/ trust somewhat. A total of 24 respondents answered this question.
- WER: Year 3 63% trust a great deal/ trust somewhat. A total of 51 respondents answered this question.
- STAR: Year 3 33% trust a great deal/ trust somewhat. A total of 3 respondents answered this question.
- SIP: Year 3 55% trust a great deal/ trust somewhat. A total of 116 respondents answered this question.
- ALL BUT EAF, NHSP, CSJ: Year 3 58% trust a great deal/ trust somewhat. A total of 441 respondents answered this question. Year 2 70% trust a great deal/ trust somewhat. Year 1 61% trust a great deal/ trust somewhat.
Program Level Highlights
Enabling Accessibility Fund (EAF)
Program level-highlights
| Satisfaction | ||
|---|---|---|
| Overall service experience | ||
| Year 3 | Year 2 | Year 1 |
| 72% | 78% | 77% |
| Ease | ||
|---|---|---|
| Overall, it was easy for me to apply | ||
| Year 3 | Year 2 | Year 1 |
| 74% | 75% | 84% |
| Effectiveness | ||
|---|---|---|
| I was able to move smoothly through all of the steps | ||
| Year 3 | Year 2 | Year 1 |
| 73% | 73% | 79% |

Click for larger view
Figure 10: Satisfaction with Service Channels
This vertical bar chart shows responses to a question about how satisfied or dissatisfied the applicant was with the service they received from the service channels they used throughout the application process and presents results for Year 1, Year 2 and Year 3. Respondents were asked to provide ratings on a 5-pt scale and results were grouped by those who provided a rating of 4 or 5. Sample sizes vary by service channel, only those who used each channel during their experience were asked about it.
- GCOS Web Portal: Year 3 75%. Year 2 78%. Year 1 77%.
- Email Support from Program Officer: Year 3 74%. Year 2 80%. Year 1 83%.
- SC Office: Year 3 67%.
- GoC Website: Year 3 66%. Year 2 72%. Year 1 76%.
- Phone Support from SC: Year 3 61%. Year 2 65%. Year 1 65%.
- Email Support from SC: Year 3 61%. Year 2 64%. Year 1 68%.
- Mail: Year 3 56%. Year 2 47%. Year 1 100%.
- 1-800-OCanada: Year 3 43%. Year 2 67%.
| Complete application in reasonable time | Experienced a problem | ||||
|---|---|---|---|---|---|
| Year 3 | Year 2 | Year 1 | Year 3 | Year 2 | Year 1 |
| 68% | 68% | 66% | 26% | 21% | 23% |

Click for larger view
Figure 11: Funding approval:
This horizontal bar chart shows whether the applicants to this program received funding approval or not and presents results for Year 3 as follows:
- Year 3: Approved 60%. Denied 31%. TBD 9%.
| SERVICE ATTRIBUTE PERFORMANCE | |||
|---|---|---|---|
| STRENGTHS | Year 3 | Year 2 | Year 1 |
| I was confident that my personal information was protected | 85% | 83% | 86% |
| Determine if the organization is eligible for EAF funding | 82% | 77% | 84% |
| Completing steps online made the process easier | 82% | 93% | 90% |
| Find general information about EAF | 79% | 82% | 89% |
| AREAS FOR IMPROVEMENT | Year 3 | Year 2 | Year 1 |
| Determine the amount of time each phase is anticipated to take | 63% | 62% | n/a |
| It was clear what to do if I had a problem or question | 63% | 66% | 70% |
| Putting together the information you needed to apply for EAF | 61% | 58% | 61% |
| Completing the budget document | 54% | 59% | 66% |
Base: EAF applicants – Year 3 (n=300); Year 2 (n=207); Year 1 (n=56) Analysis was also conducted by program stream and results have been presented on the following slides. Note: Figures for ‘[PROGRAM] web portal’ is reported in Year 1 and compared with ‘GCOS web portal’ in Year 2.
Significantly higher / lower than total
Enabling Accessibility Fund (EAF) – Mid-sized
Program Stream level-highlights
| Satisfaction |
|---|
| Overall service experience |
| 52% |
| Ease |
|---|
| Overall, it was easy for me to apply |
| 57% |
| Effectiveness |
|---|
| I was able to move smoothly through all of the steps |
| 65% |

Click for larger view
Figure 12: Satisfaction with Service Channels
This vertical bar chart shows responses to a question about how satisfied or dissatisfied the applicant was with the service they received from the service channels they used throughout the application process. Respondents were asked to provide ratings on a 5-pt scale and results were grouped by those who provided a rating of 4 or 5. Sample sizes vary by service channel, only those who used each channel during their experience were asked about it.
- Email Support from Program Officer: 72%.
- GCOS Web Portal: 69%.
- GoC Website: 61%.
- Mail: 50%.
- Email Support from SC: 41%.
- 1-800-OCanada: 25%.
- Phone Support from SC: 20%.
| Complete application in reasonable time | Experienced a problem |
|---|---|
| 56% | 43% |

Click for larger view
Figure 13: Funding Approval
This horizontal bar chart shows whether the applicants to this program received funding approval or not and presents results for Year 3 as follows:
- Year 3: Approved 5%. Denied 61%. TBD 34%.
| Service attribute performance | |
|---|---|
| STRENGTHS | |
| I was confident that my personal information was protected | 87% |
| Determine if the organization is eligible for EAF-Mid-sized funding | 78% |
| Find general information about EAF-Mid-sized | 78% |
| Determine the steps to apply for funding | 76% |
| AREAS FOR IMPROVEMENT | |
| The amount of time it took was reasonable | 53% |
| I needed to explain my situation only once. | 49% |
| Completing the budget document | 47% |
| Determine the amount of time each phase is anticipated to take | 46% |
| Putting together the information you needed to apply for EAF | 46% |
Base: EAF Mid-sized applicants – Year 3 (n=77)
Top 5 driver of satisfaction
Significantly higher / lower than total
Enabling Accessibility Fund (EAF) Early Learning and Child Care
Program Stream level-highlights
| Satisfaction |
|---|
| Overall service experience |
| 79% |
| Ease |
|---|
| Overall, it was easy for me to apply |
| 78% |
| Effectiveness |
|---|
| I was able to move smoothly through all of the steps |
| 73% |

Click for larger view
Figure 14: Satisfaction with Service Channels
This vertical bar chart shows responses to a question about how satisfied or dissatisfied the applicant was with the service they received from the service channels they used throughout the application process. Respondents were asked to provide ratings on a 5-pt scale and results were grouped by those who provided a rating of 4 or 5. Sample sizes vary by service channel, only those who used each channel during their experience were asked about it.
- SC Office: 100%.
- Email Support from Program Officer: 76%.
- GCOS Web Portal: 73%.
- GoC Website: 67%.
- 1-800-OCanada: 67%.
- Email Support from SC: 66%.
- Phone Support from SC: 65%.
- Mail: 57%.
| Complete application in reasonable time | Experienced a problem |
|---|---|
| 69% | 22% |

Click for larger view
Figure 15: Funding Approval
This horizontal bar chart shows whether the applicants to this program received funding approval or not and presents results for Year 3 as follows:
- Year 3: Approved 75%. Denied 25%.
| Service attribute performance | |
|---|---|
| STRENGTHS | |
| Completing steps online made the process easier | 85% |
| I was confident that my personal information was protected | 83% |
| Determine if the organization is eligible for EAF-L&CC funding | 82% |
| Determine when the application period for EAF-L&CC takes place | 80% |
| AREAS FOR IMPROVEMENT | |
| Completing the narrative questions | 64% |
| It was easy to get help when needed | 63% |
| Putting together the information you needed to apply for EAF | 63% |
| Completing the budget document | 52% |
Base: EAF Early Learning and Child Care applicants – Year 3 (n=177)
* small sample size
Significantly higher / lower than total
Enabling Accessibility Fund (EAF) Youth Innovation
Program Stream level-highlights
| Satisfaction |
|---|
| Overall service experience |
| 82% |
| Ease |
|---|
| Overall, it was easy for me to apply |
| 84% |
| Effectiveness |
|---|
| I was able to move smoothly through all of the steps |
| 84% |
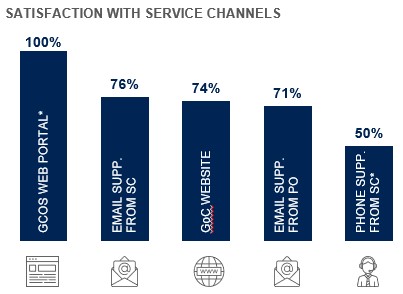
Click for larger view
Figure 14-1: Satisfaction with Service Channels
This vertical bar chart shows responses to a question about how satisfied or dissatisfied the applicant was with the service they received from the service channels they used throughout the application process. Respondents were asked to provide ratings on a 5-pt scale and results were grouped by those who provided a rating of 4 or 5. Sample sizes vary by service channel, only those who used each channel during their experience were asked about it.
- GCOS Web Portal: 100%.
- Email Support from SC: 76%.
- GoC Website: 74%.
- Email Support from Program Officer: 71%.
- Phone Support from SC: 50%.
| Complete application in reasonable time | Experienced a problem |
|---|---|
| 87% | 16% |

Click for larger view
Figure 15-1: Funding Approval
This horizontal bar chart shows whether the applicants to this program received funding approval or not and presents results for Year 3 as follows:
- Year 3: Approved 96%. Denied 4%.
| Service attribute performance | |
|---|---|
| STRENGTHS | |
| The amount of time it took was reasonable | 89% |
| I was confident that my personal information was protected | 89% |
| Meeting the requirements of the application process | 89% |
| AREAS FOR IMPROVEMENT | |
| It was clear what to do if I had a problem or question | 69% |
| Completing the narrative questions | 69% |
| I was confident that any issues or problems would have been easily resolved | 76% |
| I needed to explain my situation only once | 76% |
Base: EAF Youth Innovation applicants – Year 3 (n=45)
* small sample size
Top 5 driver of satisfaction
Significantly higher / lower than total
New Horizons For Seniors Program (NHSP)
Program level-highlights
| Satisfaction | ||
|---|---|---|
| Overall service experience | ||
| Year 3 | Year 2 | Year 1 |
| 82% | 83% | 73% |
| Ease | ||
|---|---|---|
| Overall, it was easy for me to apply | ||
| Year 3 | Year 2 | Year 1 |
| 77% | 78% | 71% |
| Effectiveness | ||
|---|---|---|
| I was able to move smoothly through all of the steps | ||
| Year 3 | Year 2 | Year 1 |
| 75% | 77% | 74% |

Click for larger view
Figure 16: Satisfaction with Service Channels
This vertical bar chart shows responses to a question about how satisfied or dissatisfied the applicant was with the service they received from the service channels they used throughout the application process and presents results for Year 1, Year 2 and Year 3. Respondents were asked to provide ratings on a 5-pt scale and results were grouped by those who provided a rating of 4 or 5. Sample sizes vary by service channel, only those who used each channel during their experience were asked about it.
- Email Support from Program Officer: Year 3 83%. Year 2 80%. Year 1 81%.
- Email Support from SC: Year 3 73%. Year 2 76%. Year 1 72%.
- GCOS Web Portal: Year 3 73%. Year 2 73%. Year 1 67%.
- GoC Website: Year 3 72%. Year 2 74%. Year 1 70%.
- Phone Support from SC: Year 3 72%. Year 2 68%. Year 1 68%.
- SC Office: Year 3 70%. Year 2 75%. Year 1 71%.
- Mail: Year 3 69%. Year 2 56%. Year 1 56%.
- 1-800-OCanada: Year 3 57%. Year 2 50%. Year 1 68%.
| Complete application in reasonable time | Experienced a problem | ||||
|---|---|---|---|---|---|
| Year 3 | Year 2 | Year 1 | Year 3 | Year 2 | Year 1 |
| 64% | 66% | 62% | 23% | 27% | 32% |

Click for larger view
Figure 17: Funding Approval
This horizontal bar chart shows whether the applicants to this program received funding approval or not and presents results for Year 3 as follows:
- Year 3: Approved 80%. Denied 20%.
| SERVICE ATTRIBUTE PERFORMANCE | |||
|---|---|---|---|
| STRENGTHS | Year 3 | Year 2 | Year 1 |
| I was confident that my personal information was protected | 85% | 87% | 88% |
| Find general information about NHSP | 84% | 85% | 85% |
| Determine if your organization is eligible for NHSP funding | 84% | 85% | 84% |
| Completing steps online made the process easier | 82% | 81% | 75% |
| Understand the information about NHSP | 81% | 85% | 80% |
| AREAS FOR IMPROVEMENT | Year 3 | Year 2 | Year 1 |
| Determine amount of time each phase of the is anticipated to take | 69% | 65% | n/a |
| Putting together the information you needed to apply for NHSP | 66% | 69% | 65% |
| Completing the narrative questions | 65% | 67% | 60% |
| Completing the budget document | 60% | 62% | 61% |
Base: NHSP applicants – Year 3 (n=1296); Year 2 (n=384); Year 1 (n=431)
There were different stream(s) for this program, in past years, comparisons should be done with caution.
Small grant (n=52); Community-based projects (n=332) Note: Figures for ‘[PROGRAM] web portal’ is reported in Year 1 and compared with ‘GCOS web portal’ in Year 2.
Significantly higher / lower than total
Significantly higher / lower than Year 2
Canada Summer Jobs (CSJ)
Program level-highlights
| Satisfaction | ||
|---|---|---|
| Overall service experience | ||
| Year 3 | Year 2 | Year 1 |
| 68% | 79% | 69% |
| Ease | ||
|---|---|---|
| Overall, it was easy for me to apply | ||
| Year 3 | Year 2 | Year 1 |
| 79% | 82% | 74% |
| Effectiveness | ||
|---|---|---|
| I was able to move smoothly through all of the steps | ||
| Year 3 | Year 2 | Year 1 |
| 77% | 80% | 69% |

Click for larger view
Figure 18: Satisfaction with Service Channels
This vertical bar chart shows responses to a question about how satisfied or dissatisfied the applicant was with the service they received from the service channels they used throughout the application process and presents results for Year 1, Year 2 and Year 3. Respondents were asked to provide ratings on a 5-pt scale and results were grouped by those who provided a rating of 4 or 5. Sample sizes vary by service channel, only those who used each channel during their experience were asked about it.
- Email Support from Program Officer: Year 3 79%. Year 2 80%. Year 1 80%.
- GCOS Web Portal: Year 3 73%. Year 2 77%. Year 1 66%.
- Email Support from SC: Year 3 70%. Year 2 71%. Year 1 64%.
- Mail: Year 3 68%. Year 2 61%. Year 1 65%.
- GoC Website: Year 3 67%. Year 2 71%. Year 1 65%.
- Phone Support from SC: Year 3 62%. Year 2 59%. Year 1 60%.
- SC Office: Year 3 50%. Year 2 60%. Year 1 67%.
- 1-800-OCanada: Year 3 41%. Year 2 49%. Year 1 48%.
| Complete application in reasonable time | Experienced a problem | ||||
|---|---|---|---|---|---|
| Year 3 | Year 2 | Year 1 | Year 3 | Year 1 | Year 1 |
| 70% | 72% | 65% | 26% | 20% | 35% |

Click for larger view
Figure 19: Funding Approval
This horizontal bar chart shows whether the applicants to this program received funding approval or not and presents results for Year 3 as follows:
- Year 3: Approved 83%. Denied 17%.
| Service attribute performance | |||
|---|---|---|---|
| STRENGTHS | Year 3 | Year 2 | Year 1 |
| Completing steps online made the process easier | 85% | 89% | 83% |
| Find general information about CSJ | 83% | 83% | 82% |
| Determine the steps to apply for funding | 81% | 82% | 77% |
| I was confident that my personal information was protected | 81% | 83% | 88% |
| AREAS FOR IMPROVEMENT | Year 3 | Year 2 | Year 1 |
| It was easy to get help when I needed it | 64% | 70% | 61% |
| The amount of time it took from gathering information to getting a decision was reasonable | 58% | 68% | 56% |
| Determine amount of time each phase of the is anticipated to take | 55% | 59% | n/a |
Base: CSJ applicants – Year 3 (n=1004); Year 2 (n=865); Year 1 (n=942) Note: Figures for ‘[PROGRAM] web portal’ is reported in Year 1 and compared with ‘GCOS web portal’ in Year 2.
Significantly higher / lower than total
Significantly higher / lower than Year 2
Social Development Partnerships Program (SDPP)
Program level-highlights
| Satisfaction | ||
|---|---|---|
| Overall service experience | ||
| Year 3 | Year 2 | Year 1 |
| 42% | 72% | 53% |
| Ease | ||
|---|---|---|
| Overall, it was easy for me to apply | ||
| Year 3 | Year 2 | Year 1 |
| 48% | 69% | 59% |
| Effectiveness | ||
|---|---|---|
| I was able to move smoothly through all of the steps | ||
| Year 3 | Year 2 | Year 1 |
| 54% | 71% | 65% |

Click for larger view
Figure 20: Satisfaction with Service Channels
This vertical bar chart shows responses to a question about how satisfied or dissatisfied the applicant was with the service they received from the service channels they used throughout the application process and presents results for Year 1, Year 2 and Year 3. Respondents were asked to provide ratings on a 5-pt scale and results were grouped by those who provided a rating of 4 or 5. Sample sizes vary by service channel, only those who used each channel during their experience were asked about it.
- GCOS Web Portal: Year 3 66%. Year 2 69%. Year 1 80%.
- Phone Support from SC: Year 3 56%. Year 2 61%. Year 1 100%.
- GoC Website: Year 3 54%. Year 2 70%. Year 1 33%.
- SC Office: Year 3 50%.
- Email Support from Program Officer: Year 3 50%. Year 2 83%. Year 1 75%.
- Email Support from SC: Year 3 36%. Year 2 73%. Year 1 38%.
- Mail: Year 3 30%. Year 2 50%.
- 1-800-OCanada: Year 3 20%.
| Complete application in reasonable time | Experienced a problem | ||||
|---|---|---|---|---|---|
| Year 3 | Year 2 | Year 1 | Year 3 | Year 1 | Year 1 |
| 44% | 61% | 47% | 41% | 33% | 47% |

Click for larger view
Figure 21: Funding Approval
This horizontal bar chart shows whether the applicants to this program received funding approval or not and presents results for Year 3 as follows:
- Year 3: Approved 9%. Denied 76%. TBD 15%.
SERVICE ATTRIBUTE PERFORMANCE |
|||
|---|---|---|---|
| STRENGTHS | Year 3 | Year 2 | Year 1 |
Completing steps online made the process easier |
77% | 80% | 60% |
Determine if your organization is eligible for SDPP funding |
74% | 65% | 44% |
I was confident that my personal information was protected |
72% | 80% | 88% |
Determine when the application period for SDPP takes place |
71% | 68% | n/a |
| AREAS FOR IMPROVEMENT | Year 3 | Year 2 | Year 1 |
I needed to explain my situation only once. |
40% | 63% | 41% |
It was easy to get help when I needed it |
38% | 70% | 61% |
It was clear what would happen next and when it would happen |
37% | 60% | 53% |
The amount of time it took was reasonable |
35% | 46% | 53% |
Base: SDPP applicants – Year 3 (n=214); Year 2 (n=153); Year 1 (n=17*)
Analysis was also conducted for SDPP-C&F and SDPP-D applicants and have been provided on the following slides
Note: Figures for ‘[PROGRAM] web portal’ is reported in Year 1 and compared with ‘GCOS web portal’ in Year 2.
* small sample size
Top 5 driver of satisfaction
Significantly higher / lower than total
Significantly higher / lower than Year 2
Social Development Partnerships (SDPP-C&F)
Children And Families
Program level-highlights
| Satisfaction |
|---|
| Overall service experience |
| 39% |
| Ease |
|---|
| Overall, it was easy for me to apply |
| 49% |
| Effectiveness |
|---|
| I was able to move smoothly through all of the steps |
| 53% |

Click for larger view
Figure 22: Satisfaction with Service Channels
This vertical bar chart shows responses to a question about how satisfied or dissatisfied the applicant was with the service they received from the service channels they used throughout the application process. Respondents were asked to provide ratings on a 5-pt scale and results were grouped by those who provided a rating of 4 or 5. Sample sizes vary by service channel, only those who used each channel during their experience were asked about it.
- GCOS Web Portal: 69%.
- Phone Support from SC: 58%.
- GoC Website: 53%.
- SC Office: 50%.
- Email Support from Program Officer: 46%.
- Email Support from SC: 36%.
- Mail: 22%.
- 1-800-OCanada: 20%.
| Complete application in reasonable time | Experienced a problem |
|---|---|
| 44% | 42% |

Click for larger view
Figure 23: Funding Approval
This horizontal bar chart shows whether the applicants to this program received funding approval or not and presents results for Year 3 as follows:
- Year 3: Approved 7%. Denied 93%.
SERVICE ATTRIBUTE PERFORMANCE |
|
|---|---|
| STRENGTHS | |
| Completing steps online made the process easier | 79% |
| Determine if the organization is eligible for SDPP – C&F funding | 74% |
| I was confident that my personal information was protected | 71% |
AREAS FOR IMPROVEMENT |
|
| I needed to explain my situation only once. | 38% |
| It was easy to get help when I needed it | 36% |
| It was clear what would happen next and when it would happen | 36% |
| The amount of time it took was reasonable | 32% |
Base: SDPP applicants – Year 3 (n=214); Year 2 (n=153); Year 1 (n=17*)
Analysis was also conducted for SDPP-C&F and SDPP-D applicants and have been provided on the following slides
Note: Figures for ‘[PROGRAM] web portal’ is reported in Year 1 and compared with ‘GCOS web portal’ in Year 2.
* small sample size
Top 5 driver of satisfaction
Significantly higher / lower than total
Significantly higher / lower than Year 2
SDPP - C&F - Financial Empowerment Of Low Income People
Program Stream Highlights
| Satisfaction |
|---|
| Overall service experience |
| 40% |
| Ease |
|---|
| Overall, it was easy for me to apply |
| 47% |
| Effectiveness |
|---|
| I was able to move smoothly through all of the steps |
| 51% |

Click for larger view
Figure 24: Satisfaction with Service Channels
This vertical bar chart shows responses to a question about how satisfied or dissatisfied the applicant was with the service they received from the service channels they used throughout the application process. Respondents were asked to provide ratings on a 5-pt scale and results were grouped by those who provided a rating of 4 or 5. Sample sizes vary by service channel, only those who used each channel during their experience were asked about it.
- GCOS Web Portal: 70%.
- Email Support from Program Officer: 60%.
- Phone Support from SC: 50%.
- Mail: 50%.
- GoC Website: 43%.
- Email Support from SC: 39%.
| Complete application in reasonable time | Experienced a problem |
|---|---|
| 38% | 34% |

Click for larger view
Figure 25: Funding Approval
This horizontal bar chart shows whether the applicants to this program received funding approval or not and presents results for Year 3 as follows:
- Year 3: Approved 9%. Denied 89%. TBD 2%.
SERVICE ATTRIBUTE PERFORMANCE |
|
|---|---|
| STRENGTHS | |
| Determine the steps to apply for funding | 77% |
| Completing steps online made the process easier | 75% |
| Determine if the organization is eligible for SDPP – FELIP funding | 71% |
AREAS FOR IMPROVEMENT |
|
| I needed to explain my situation only once. | 36% |
| It was easy to get help when I needed it | 36% |
| I received consistent information | 34% |
| The amount of time it took was reasonable | 34% |
Base: SDPP-C&F – Financial Empowerment of Low-income People– Year 3 (n=47)
Note: Figures for ‘[PROGRAM] web portal’ is reported in Year 1 and compared with ‘GCOS web portal’ in Year 2.
* small sample size
Top 5 driver of satisfaction
Significantly higher / lower than total
SDPP - C&F - Social Inclusion Of Vulnerable Children And Youth
Program Stream Highlights
| Satisfaction |
|---|
| Overall service experience |
| 39% |
| Ease |
|---|
| Overall, it was easy for me to apply |
| 50% |
| Effectiveness |
|---|
| I was able to move smoothly through all of the steps |
| 54% |

Click for larger view
Figure 26: Satisfaction with Service Channels
This vertical bar chart shows responses to a question about how satisfied or dissatisfied the applicant was with the service they received from the service channels they used throughout the application process. Respondents were asked to provide ratings on a 5-pt scale and results were grouped by those who provided a rating of 4 or 5. Sample sizes vary by service channel, only those who used each channel during their experience were asked about it.
- GCOS Web Portal: 68%.
- Phone Support from SC: 60%.
- GoC Website: 57%.
- SC Office: 50%.
- Email Support from Program Officer: 42%.
- Email Support from SC: 34%.
- 1-800-OCanada: 20%.
- Mail: 14%.
| Complete application in reasonable time | Experienced a problem |
|---|---|
| 46% | 46% |

Click for larger view
Figure 27: Funding Approval
This horizontal bar chart shows whether the applicants to this program received funding approval or not and presents results for as follows:
- Year 3: Approved 6%. Denied 94%.
SERVICE ATTRIBUTE PERFORMANCE |
|
|---|---|
| STRENGTHS | |
| Determine if the organization is eligible for EAF funding | 75% |
| I was confident that my personal information was protected | 73% |
| Determine when the application period for SDPP takes place | 70% |
| Find general information about SDPP – SIVC&Y | 70% |
AREAS FOR IMPROVEMENT |
|
| I needed to explain my situation only once. | 37% |
| It was easy to get help when I needed it | 36% |
| I received consistent information | 35% |
| The amount of time it took was reasonable | 31% |
Base: SDPP-C&F – Social Inclusion of Vulnerable Children and Youth – Year 3 (n=121)
Note: Figures for ‘[PROGRAM] web portal’ is reported in Year 1 and compared with ‘GCOS web portal’ in Year 2.
* small sample size
Top 5 driver of satisfaction
Significantly higher / lower than total
Social Development Partnerships (SDPP-D)
Disability
Program Stream Highlights
| Satisfaction |
|---|
| Overall service experience |
| 57% |
| Ease |
|---|
| Overall, it was easy for me to apply |
| 44% |
| Effectiveness |
|---|
| I was able to move smoothly through all of the steps |
| 59% |

Click for larger view
Figure 28: Satisfaction with Service Channels
This vertical bar chart shows responses to a question about how satisfied or dissatisfied the applicant was with the service they received from the service channels they used throughout the application process. Respondents were asked to provide ratings on a 5-pt scale and results were grouped by those who provided a rating of 4 or 5. Sample sizes vary by service channel, only those who used each channel during their experience were asked about it.
- GoC Website: 59%.
- Email Support from Program Officer: 59%.
- GCOS Web Portal: 57%.
- Phone Support from SC: 50%.
- Mail: 50%.
- Email Support from SC: 38%.
| Complete application in reasonable time | Experienced a problem |
|---|---|
| 41% | 37% |

Click for larger view
Figure 29: Funding Approval
This horizontal bar chart shows whether the applicants to this program received funding approval or not and presents results for as follows:
- Year 3: Approved 17%. Denied 83%.
SERVICE ATTRIBUTE PERFORMANCE |
|
|---|---|
| STRENGTHS | |
| Determine when the application period for SDPP-D takes place | 84% |
| I was confident that my personal information was protected | 76% |
| Determine if the organization is eligible for SDPP-D funding | 76% |
AREAS FOR IMPROVEMENT |
|
| It was easy to get help when I needed it. | 44% |
| I needed to explain my situation only once. | 44% |
| It was clear what would happen next and when it would happen | 44% |
| Completing the budget document | 37% |
Base: SDPP – Disability Inclusion – Year 3 (n=46)
Analysis was also conducted by program stream and no statistically significant differences were observed in survey responses due in part to small samples sizes: National AccessAbility Week (n=22*); Phase 1 Partnerships (n=24*)
Note: Figures for ‘[PROGRAM] web portal’ is reported in Year 1 and compared with ‘GCOS web portal’ in Year 2.
* small sample size
Top 5 driver of satisfaction
Significantly higher / lower than total
SDPP-D – National Accessability Week Grant (GRANT)
Program Stream Highlights
| Satisfaction |
|---|
| Overall service experience |
| 41% |
| Ease |
|---|
| Overall, it was easy for me to apply |
| 46% |
| Effectiveness |
|---|
| I was able to move smoothly through all of the steps |
| 55% |

Click for larger view
Figure 30: Satisfaction with Service Channels
This vertical bar chart shows responses to a question about how satisfied or dissatisfied the applicant was with the service they received from the service channels they used throughout the application process. Respondents were asked to provide ratings on a 5-pt scale and results were grouped by those who provided a rating of 4 or 5. Sample sizes vary by service channel, only those who used each channel during their experience were asked about it.
- GCOS Web Portal: 86%.
- Phone Support from SC: 67%.
- GoC Website: 62%.
- Mail: 50%.
- Email Support from Program Officer: 43%.
- Email Support from SC: 33%.
| Complete application in reasonable time | Experienced a problem |
|---|---|
| 55% | 41% |

Click for larger view
Figure 31: Funding Approval
This horizontal bar chart shows whether the applicants to this program received funding approval or not and presents results for as follows:
- Year 3: Approved 18%. Denied 82%.
SERVICE ATTRIBUTE PERFORMANCE |
|
|---|---|
| STRENGTHS | |
| Completing steps online made the process easier | 100% |
| I was confident that my personal information was protected | 82% |
| Determine when the application period for SDPP – NAW takes place | 82% |
AREAS FOR IMPROVEMENT |
|
| It was clear what would happen next and when it would happen | 46% |
| Determine amount of time each phase of the is anticipated to take | 36% |
| Completing the budget document | 36% |
| I needed to explain my situation only once. | 36% |
Base: SDPP-D – National AccessAbility Week (Grant) – Year 3 (n=22*)
Note: Figures for ‘[PROGRAM] web portal’ is reported in Year 1 and compared with ‘GCOS web portal’ in Year 2.
* small sample size
Top 5 driver of satisfaction
Significantly higher / lower than total
SDPP-D – Phase 1 Partnerships (CONTRIBUTION)
Program Stream Highlights
| Satisfaction |
|---|
| Overall service experience |
| 71% |
| Ease |
|---|
| Overall, it was easy for me to apply |
| 42% |
| Effectiveness |
|---|
| I was able to move smoothly through all of the steps |
| 63% |

Click for larger view
Figure 32: Satisfaction with Service Channels
This vertical bar chart shows responses to a question about how satisfied or dissatisfied the applicant was with the service they received from the service channels they used throughout the application process. Respondents were asked to provide ratings on a 5-pt scale and results were grouped by those who provided a rating of 4 or 5. Sample sizes vary by service channel, only those who used each channel during their experience were asked about it.
- Email Support from Program Officer: 70%.
- GoC Website: 57%.
- Mail: 50%.
- GCOS Web Portal: 43%.
- Email Support from SC: 42%.
- Phone Support from SC: 33%.
| Complete application in reasonable time | Experienced a problem |
|---|---|
| 29% | 33% |

Click for larger view
Figure 33: Funding Approval
This horizontal bar chart shows whether the applicants to this program received funding approval or not and presents results for as follows:
- Year 3: Approved 17%. Denied 83%.
SERVICE ATTRIBUTE PERFORMANCE |
|
|---|---|
| STRENGTHS | |
| Determine if the organization is eligible for SDPP – P1P funding | 93% |
| Determine when the application period for SDPP – P1P takes place | 86% |
| Understand the information about SDPP – P1P | 79% |
AREAS FOR IMPROVEMENT |
|
| It was clear what would happen next and when it would happen | 42% |
| It was easy to get help when I needed it | 42% |
| Completing the budget document | 38% |
| Service Canada phone representatives were helpful | 33% |
Base: SDPP-D – Phase 1 Partnerships (Contribution) – Year 3 (n=24*)
Note: Figures for ‘[PROGRAM] web portal’ is reported in Year 1 and compared with ‘GCOS web portal’ in Year 2.
* small sample size
Top 5 driver of satisfaction
Significantly higher / lower than total
Program Levels Highlights- New Programs Added in Year 3
Please note that the following programs were added in Year 3 and as such, there is no Year 1 or Year 2 data for comparison.
- Apprenticeship Service (AS) – (n=11*)
- Workplace Opportunities: Removing Barriers to Equity (WORBE) – (n=22*)
- Supports for Student Learning Program (SSLP) – (n=24*)
- Women’s Employment Readiness (WER) Pilot Program – (n=51)
- Skilled Trades Awareness and Readiness Program (STAR) – (n=3**)
- Sectoral Initiatives Program (SIP) .- (n=106) Please note that this program is now called the "Sectoral Initiatives Program (SWSP), which builds on and replaces the Sectoral Initiatives Program (SIP)
* small sample size
* very small sample size
Apprenticeship Service (AS)
Program Level Highlights
| Satisfaction |
|---|
| Overall service experience |
| 36% |
| Ease |
|---|
| Overall, it was easy for me to apply |
| 55% |
| Effectiveness |
|---|
| I was able to move smoothly through all of the steps |
| 64% |

Click for larger view
Figure 34: Satisfaction with Service Channels
This vertical bar chart shows responses to a question about how satisfied or dissatisfied the applicant was with the service they received from the service channels they used throughout the application process. Respondents were asked to provide ratings on a 5-pt scale and results were grouped by those who provided a rating of 4 or 5. Sample sizes vary by service channel, only those who used each channel during their experience were asked about it.
- Email Support from Program Officer: 50%.
- GCOS Web Portal: 33%.
- GoC Website: 25%.
- Email Support from SC: 18%.
| Complete application in reasonable time | Experienced a problem |
|---|---|
| 36% | 27% |

Click for larger view
Figure 35: Funding Approval
This horizontal bar chart shows whether the applicants to this program received funding approval or not and presents results for as follows:
- Year 3: Approved 73%. Denied 27%.
SERVICE ATTRIBUTE PERFORMANCE |
|
|---|---|
| STRENGTHS | |
| Determine if the organization is eligible for AS funding | 88% |
| Determine when the application period for AS takes place | 88% |
| I was confident that my personal information was protected | 82% |
AREAS FOR IMPROVEMENT |
|
| I needed to explain my situation only once. | 27% |
| It was clear what would happen next and when it would happen | 27% |
| I was confident that any issues would have been easily resolved | 18% |
| Determine amount of time each phase of the is anticipated to take | 13% |
Base: AS applicants (n=11*)
* small sample size
Top 5 driver of satisfaction
Significantly higher / lower than total
Workplace Opportunities Removing Barriers To Equity (WORBE)
Program Level-Highlights
| Satisfaction |
|---|
| Overall service experience |
| 59% |
| Ease |
|---|
| Overall, it was easy for me to apply |
| 73% |
| Effectiveness |
|---|
| I was able to move smoothly through all of the steps |
| 77% |

Click for larger view
Figure 36: Satisfaction with Service Channels
This vertical bar chart shows responses to a question about how satisfied or dissatisfied the applicant was with the service they received from the service channels they used throughout the application process. Respondents were asked to provide ratings on a 5-pt scale and results were grouped by those who provided a rating of 4 or 5. Sample sizes vary by service channel, only those who used each channel during their experience were asked about it.
- GCOS Web Portal: 100%.
- GoC Website: 81%.
- Email Support from Program Officer: 80%.
- Email Support from SC: 55%.
- Mail: 50%.
- Phone Support from SC: 50%.
| Complete application in reasonable time | Experienced a problem |
|---|---|
| 64% | 14% |

Click for larger view
Figure 37: Funding Approval
This horizontal bar chart shows whether the applicants to this program received funding approval or not and presents results for as follows:
- Year 3: Approved 9%. Denied 90%.
SERVICE ATTRIBUTE PERFORMANCE |
|
|---|---|
| STRENGTHS | |
| I was confident that my personal information was protected | 86% |
| Determine the steps to apply for funding | 84% |
| Understand the information about WORBE | 84% |
| It was clear what to do if I had a problem or question | 82% |
AREAS FOR IMPROVEMENT |
|
| Completing the budget document | 55% |
| The amount of time it took was reasonable | 50% |
| It was clear what would happen next and when it would happen | 50% |
Base: WORBE applicants (n=22*)
* small sample size
Top 5 driver of satisfaction
Significantly higher / lower than total
Supports For Student Learning Program (SSLP)
Program Level-Highlights
| Satisfaction |
|---|
| Overall service experience |
| 50% |
| Ease |
|---|
| Overall, it was easy for me to apply |
| 58% |
| Effectiveness |
|---|
| I was able to move smoothly through all of the steps |
| 58% |

Click for larger view
Figure 38: Satisfaction with Service Channels
This vertical bar chart shows responses to a question about how satisfied or dissatisfied the applicant was with the service they received from the service channels they used throughout the application process. Respondents were asked to provide ratings on a 5-pt scale and results were grouped by those who provided a rating of 4 or 5. Sample sizes vary by service channel, only those who used each channel during their experience were asked about it.
- SC Office: 100%.
- Email Support from Program Officer: 79%.
- GCOS Web Portal: 60%.
- GoC Website: 44%.
- Email Support from SC: 41%.
- Phone Support from SC: 25%.
| Complete application in reasonable time | Experienced a problem |
|---|---|
| 46% | 63% |

Click for larger view
Figure 39: Funding Approval
This horizontal bar chart shows whether the applicants to this program received funding approval or not and presents results for as follows:
- Year 3: Approved 75%. Denied 17%. TBD 8%.
SERVICE ATTRIBUTE PERFORMANCE |
|
|---|---|
| STRENGTHS | |
| I was confident that my personal information was protected | 92% |
| Find general information about SSLP | 92% |
| Understand the information about SSLP | 83% |
| Find out what information you need to provide when applying | 83% |
AREAS FOR IMPROVEMENT |
|
| Completing the budget document | 42% |
| It was clear what would happen next and when it would happen | 42% |
| The amount of time it was reasonable | 38% |
Base: SSLP applicants (n=24*)
* small sample size
Top 5 driver of satisfaction
Significantly higher / lower than total
Women’s Employment Readiness (WER) Pilot Program
Program Level-Highlights
| Satisfaction |
|---|
| Overall service experience |
| 35% |
| Ease |
|---|
| Overall, it was easy for me to apply |
| 57% |
| Effectiveness |
|---|
| I was able to move smoothly through all of the steps |
| 53% |

Click for larger view
Figure 40: Satisfaction with Service Channels
This vertical bar chart shows responses to a question about how satisfied or dissatisfied the applicant was with the service they received from the service channels they used throughout the application process. Respondents were asked to provide ratings on a 5-pt scale and results were grouped by those who provided a rating of 4 or 5. Sample sizes vary by service channel, only those who used each channel during their experience were asked about it.
- GCOS Web Portal: 75%.
- GoC Website: 67%.
- Phone Support from SC: 50%.
- 1-800-OCanada: 50%.
- Email Support from SC: 31%.
- Email Support from Program Officer: 29%.
| Complete application in reasonable time | Experienced a problem |
|---|---|
| 51% | 31% |

Click for larger view
Figure 41: Funding Approval
This horizontal bar chart shows whether the applicants to this program received funding approval or not and presents results for as follows:
- Year 3: Approved 24%. Denied 75%. TBD 1%.
SERVICE ATTRIBUTE PERFORMANCE |
|
|---|---|
| STRENGTHS | |
| Completing steps online made the process easier | 95% |
| I was confident that my personal information was protected | 82% |
| Understand the information about WER | 74% |
| Determine the steps to apply for funding | 74% |
| Determine if your organization is eligible for funding | 74% |
AREAS FOR IMPROVEMENT |
|
| It was clear what would happen next and when it would happen | 35% |
| It was easy to get help when I needed it | 29% |
| The amount of time it took was reasonable | 24% |
Base: WER applicants (n=51)
* small sample size
Top 5 driver of satisfaction
Significantly higher / lower than total
Skilled Trades Awareness And Readiness Program (STAR)
Program Level-Highlights
| Satisfaction |
|---|
| Overall service experience |
| 33% |
| Ease |
|---|
| Overall, it was easy for me to apply |
| 100% |
| Effectiveness |
|---|
| I was able to move smoothly through all of the steps |
| 67% |

Click for larger view
Figure 42: Satisfaction with Service Channels
This vertical bar chart shows responses to a question about how satisfied or dissatisfied the applicant was with the service they received from the service channels they used throughout the application process. Respondents were asked to provide ratings on a 5-pt scale and results were grouped by those who provided a rating of 4 or 5. Sample sizes vary by service channel, only those who used each channel during their experience were asked about it.
- GoC Website: 100%.
| Complete application in reasonable time | Experienced a problem |
|---|---|
| 67% | 67% |

Click for larger view
Figure 43: Funding Approval
This horizontal bar chart shows whether the applicants to this program received funding approval or not and presents results for as follows:
- Year 3: Denied 100%.
SERVICE ATTRIBUTE PERFORMANCE |
|
|---|---|
| STRENGTHS | |
| Determine if the organization is eligible for STAR funding | 100% |
| Determine the steps to apply for funding | 100% |
| Find general information about STAR | 100% |
| Find out what information you need to provide when applying | 100% |
| Determine when the application period for takes place | 100% |
AREAS FOR IMPROVEMENT |
|
| Completing the budget document | 33% |
| It was easy to get help when I needed it | 33% |
| The amount of time it took was reasonable | 33% |
| I received consistent information | 33% |
| I needed to explain my situation only once | 33% |
Base: STAR applicants (n=3**)
* small sample size
Top 5 driver of satisfaction
Significantly higher / lower than total
Sectoral Initiatives Program (SIP)*
Program Level-Highlights
| Satisfaction |
|---|
| Overall service experience |
| 28% |
| Ease |
|---|
| Overall, it was easy for me to apply |
| 50% |
| Effectiveness |
|---|
| I was able to move smoothly through all of the steps |
| 53% |

Click for larger view
Figure 44: Satisfaction with Service Channels
This vertical bar chart shows responses to a question about how satisfied or dissatisfied the applicant was with the service they received from the service channels they used throughout the application process. Respondents were asked to provide ratings on a 5-pt scale and results were grouped by those who provided a rating of 4 or 5. Sample sizes vary by service channel, only those who used each channel during their experience were asked about it.
- 1-800-OCanada: 100%.
- Email Support from Program Officer: 54%.
- SC Office: 50%.
- GoC Website: 44%.
- GCOS Web Portal: 44%.
- Email Support from SC: 37%.
- Phone Support from SC: 31%.
- Mail: 20%.
| Complete application in reasonable time | Experienced a problem |
|---|---|
| 48% | 29% |

Click for larger view
Figure 45: Funding Approval
This horizontal bar chart shows whether the applicants to this program received funding approval or not and presents results for as follows:
- Year 3: Approved 2%. Denied 97%. TBD 1%.
SERVICE ATTRIBUTE PERFORMANCE |
|
|---|---|
| STRENGTHS | |
| Determine the steps to apply for funding | 82% |
| Determine if the organization is eligible for SIP funding | 79% |
| I was confident that my personal information was protected | 78% |
AREAS FOR IMPROVEMENT |
|
| I was confident that any issues would have been easily resolved | 34% |
| It was clear what would happen next and when it would happen | 31% |
| The amount of time it took was reasonable | 31% |
Base: SIP applicants (n=116)
* The program is now called the "Sectoral Initiatives Program (SWSP), which builds on and replaces the Sectoral Initiatives Program (SIP)
* small sample size
Top 5 driver of satisfaction
Significantly higher / lower than total
Service Channel Assessments
Satisfaction with Service Channels
- Satisfaction with the quality of service decreased among those using the Government of Canada website (66%, -5 pts) compared to Year 2 (71%). At nearly eight in ten (77%), applicants remained most satisfied with email support from a program officer, followed by more than seven in ten (72%) who were satisfied with the GCOS web portal. Roughly two thirds were satisfied with email support from a Service Canada office (68%), the Government of Canada website (66%) and mail service (65%). Six in ten were satisfied with telephone support from a Service Canada office (62%) and five in ten with in-person service at a Service Canada Office (52%). Satisfaction remained lowest for the 1 800 O-Canada phone line (42%).
How satisfied or dissatisfied were you with the overall quality of service you received from each of the following?

Click for larger view
Figure 46: Satisfaction with Service Channels
This horizontal bar chart shows responses to a question about how satisfied or dissatisfied the applicant was with the overall quality of service provided by the service channels used during the applicant process and presents results for Year 1, Year 2 and Year 3. Respondents were asked to provide ratings on a 5-pt scale. Sample sizes vary by service channel, only those who used each channel during their experience were asked about it.
- Email support from a Program Officer: Year 3 49% very satisfied, 29% somewhat satisfied, 10% neutral, 6% somewhat dissatisfied, 4% very dissatisfied, 3% Don’t know. 77% very/somewhat satisfied. A total of 842 respondents answered this question. Year 2 79% very/somewhat satisfied. Year 1 80% very/somewhat satisfied.
- GCOS Web portal: Year 3 32% very satisfied, 40% somewhat satisfied, 20% neutral, 6% somewhat dissatisfied, 2% very dissatisfied, 1% Don’t know. 72% very/somewhat satisfied. A total of 881 respondents answered this question. Year 2 76% very/somewhat satisfied. Year 1 67% very/somewhat satisfied.
- Email support from a Service Canada office: Year 3 37% very satisfied, 32% somewhat satisfied, 14% neutral, 5% somewhat dissatisfied, 2% very dissatisfied, 11% Don’t know. 68% very/somewhat satisfied. A total of 2442 respondents answered this question. Year 2 70% very/somewhat satisfied. Year 1 65% very/somewhat satisfied.
- Government of Canada website: Year 3 24% very satisfied, 42% somewhat satisfied, 23% neutral, 5% somewhat dissatisfied, 2% very dissatisfied, 4% Don’t know. 66% very/somewhat satisfied. A total of 1871 respondents answered this question. Year 2 71% very/somewhat satisfied. Year 1 66% very/somewhat satisfied.
- Mail: Year 3 36% very satisfied, 29% somewhat satisfied, 10% neutral, 5% somewhat dissatisfied, 3% very dissatisfied, 17% Don’t know. 65% very/somewhat satisfied. A total of 154 respondents answered this question. Year 2 58% very/somewhat satisfied. Year 1 63% very/somewhat satisfied.
- Telephone support from a Service Canada office: Year 3 36% very satisfied, 27% somewhat satisfied, 12% neutral, 7% somewhat dissatisfied, 3% very dissatisfied, 17% Don’t know. 62% very/somewhat satisfied. A total of 573 respondents answered this question. Year 2 61% very/somewhat satisfied. Year 1 61% very/somewhat satisfied.
- Service Canada office: Year 3 43% very satisfied, 9% somewhat satisfied, 17% neutral, 6% somewhat dissatisfied, 17% very dissatisfied, 8% Don’t know. 52% very/somewhat satisfied. A total of 44 respondents answered this question. Year 2 62% very/somewhat satisfied. Year 1 66% very/somewhat satisfied.
- 1800 O-Canada phone line: Year 3 17% very satisfied, 25% somewhat satisfied, 32% neutral, 4% somewhat dissatisfied, 6% very dissatisfied, 17% Don’t know. 42% very/somewhat satisfied. A total of 94 respondents answered this question. Year 2 48% very/somewhat satisfied. Year 1 49% very/somewhat satisfied.
Q26. On a scale from 1 to 5, where 1 means “very dissatisfied”, and 5 means “very satisfied". How dissatisfied or satisfied were you with the overall quality of service you received from each of the following?
Base: Used channel at aware, apply or follow-up stage. Note: Figures for ‘[PROGRAM] web portal’ is reported in Year 1 and compared with ‘GCOS web portal’ in Year 2 and Year 3.
Note: values less than 3% not labelled
* small sample size
** very small sample size
Significantly higher / lower than Year 2
Satisfaction with Service Channels by Program
- Applicants to SDPP and SIP were less satisfied with many service channels used during their experience, while applicants to EAF and WER were less satisfied with email support from a Service Canada office. NHSP applicants were more likely to be satisfied with the GoC website and telephone support from a SC office.
- Compared to Year 2, applicants to SDPP were less likely to be satisfied with the GoC website and email support form a Service Canada office or from a program officer. Satisfaction with service channels for all other programs remained statistically consistent.
How satisfied or dissatisfied were you with the overall quality of service you received from each of the following?
| TOP2BOX (% RATED 4/5) | ||||||||||||||||||||||||
|---|---|---|---|---|---|---|---|---|---|---|---|---|---|---|---|---|---|---|---|---|---|---|---|---|
| TOTAL | EAF | NHSP | CSJ | SDPP | AS | WORBE | SSLP | WER | STAR | SIP | All but EAF, NHSP, CSJ | |||||||||||||
| Year 3 | Year 2 | Year 1 | Year 3 | Year 2 | Year 1 | Year 3 | Year 2 | Year 1 | Year 3 | Year 2 | Year 1 | Year 3 | Year 2 | Year 1 | Year 3 | Year 3 | Year 3 | Year 3 | Year 3 | Year 3 | Year 3 | Year 2 | Year 1 | |
| Email support from a Program Officer | (n=842) | (n=627) | (n=445) | (n=93) | (n=74) | (n=12*) | (n=404) | (n=141) | (n=140) | (n=209) | (n=213) | (n=249) | (n=58) | (n=43) | (n=8**) | (n=4**) | (n=10*) | (n=14*) | (n=7**) | (n=2**) | (n=41) | (n=136) | (n=199) | (n=44) |
| 77% | 79% | 80% | 74% | 80% | 83% | 83% | 80% | 81% | 79% | 80% | 80% | 50% | 83% | 75% | 50% | 80% | 79% | 29% | - | 54% | 52% | 69% | 76% | |
| GCOS web portal | (n=881) | (n=623) | (n=1070) | (n=44) | (n=27*) | (n=30) | (n=285) | (n=69) | (n=177) | (n=373) | (n=375) | (n=803) | (n=88) | (n=23*) | (n=5*) | (n=6**) | (n=4**) | (n=15*) | (n=20*) | (n=0) | (n=46) | (n=179) | (n=152) | (n=60) |
| 72% | 76% | 67% | 75% | 78% | 77% | 73% | 73% | 67% | 73% | 77% | 66% | 66% | 69% | 80% | 33% | 100% | 60% | 75% | - | 44% | 60% | 62% | 75% | |
| Email support from a Service Canada office | (n=2442) | (n=1580) | (n=1243) | (n=248) | (n=165) | (n=50) | (n=1123) | (n=323) | (n=356) | (n=713) | (n=675) | (n=738) | (n=177) | (n=138) | (n=16*) | (n=11*) | (n=20*) | (n=17*) | (n=45) | (n=3**) | (n=85) | (n=358) | (n=417) | (n=99) |
| 68% | 70% | 65% | 61% | 64% | 68% | 73% | 76% | 72% | 70% | 71% | 64% | 36% | 73% | 38% | 18% | 55% | 41% | 31% | - | 37% | 36% | 58% | 55% | |
| Government of Canada website | (n=1871) | (n=1365) | (n=1159) | (n=186) | (n= 150) | (n=42) | (n=796) | (n=252) | (n=301) | (n=565) | (n=621) | (n=728) | (n=155) | (n=100) | (n=12*) | (n=8**) | (n=21*) | (n=16*) | (n=42) | (n=2**) | (n=80) | (n=324) | (n=342) | (n=88) |
| 66% | 71% | 66% | 66% | 72% | 76% | 72% | 74% | 70% | 67% | 71% | 65% | 54% | 70% | 33% | 25% | 81% | 44% | 67% | 100% | 44% | 53% | 60% | 51% | |
| (n=154) | (n=139) | (n=138) | (n=9**) | (n= 15*) | (n=2**) | (n=89) | (n=52) | (n=81) | (n=34) | (n=46) | (n=49) | (n=13*) | (n=14) | (n=1**) | (n=0) | (n=2**) | (n=1**) | (n=1**) | (n=0) | (n=5**) | (n=22*) | (n=26*) | (n=6**) | |
| 65% | 58% | 63% | 56% | 47% | 100% | 69% | 56% | 56% | 68% | 61% | 65% | 30% | 50% | - | - | 50% | - | - | - | 20% | 26% | 53% | 30% | |
| Telephone support from a Service Canada office | (n=573) | (n=427) | (n=286) | (n=83) | (n=81) | (n=17*) | (n=244) | (n=82) | (n=80) | (n=199) | (n=155) | (n=159) | (n=25*) | (n=33) | (n=2**) | (n=0) | (n=2**) | (n=4**) | (n=2**) | (n=1**) | (n=13*) | (n=47) | (n=109) | (n=30) |
| 62% | 61% | 61% | 61% | 65% | 65% | 72% | 68% | 68% | 62% | 59% | 60% | 56% | 61% | 100% | - | 50% | 25% | 50% | - | 31% | 45% | 55% | 63% | |
| Service Canada office | (n=44) | (n=29) | (n=64) | (n=3**) | (n=2**) | (n=2**) | (n=20*) | (n=12*) | (n=24*) | (n=16*) | (n=10**) | (n=33) | (n=2**) | (n=2**) | (n=0) | (n=0) | (n=0) | (n=1**) | (n=0) | (n=0) | (n=2**) | (n=5**) | (n=5** | (n=5**) |
| 52% | 62% | 66% | 67% | - | 50% | 70% | 75% | 71% | 50% | 60% | 67% | 50% | 50% | - | - | - | 100% | - | - | 50% | 56% | 45% | 38% | |
| 1-800 O-Canada phone line | (n=94) | (n=72) | (n=72) | (n=7**) | (n=6**) | (n=2**) | (n=46) | (n=18*) | (n=25*) | (n=32) | (n=37) | (n=44) | (n=5**) | (n=5**) | (n=0) | (n=0) | (n=0) | (n=0) | (n=2**) | (n=1**) | (n=1**) | (n=9**) | (n=11*) | (n=1**) |
| 42% | 48% | 49% | 43% | 67% | - | 57% | 50% | 68% | 41% | 49% | 48% | 20% | 71% | - | - | - | - | 50% | - | 100% | 31% | 30% | 100% | |
Q26. On a scale from 1 to 5, where 1 means “very dissatisfied”, and 5 means “very satisfied". How dissatisfied or satisfied were you with the overall quality of service you received from each of the following?
Base: Used channel at aware, apply or follow-up stage
* small sample size
** very small sample size
Significantly higher / lower than total
Significantly higher / lower than Year 2
Number of Contacts with Service Channels
- Consistent with Year 1 and Year 2, there were significant differences in the number of contacts applicants had with Service Canada depending on the channel they used. Applicants who went to a Service Canada office, called a Service Canada office directly, emailed a Service Canada office and to a lesser extent communicated with the Government of Canada by mail were more likely to have been in contact with Service Canada only once during their experience. Those who used the GCOS web portal, went online to the Government of Canada website or emailed a program officer directly were much more likely to have used the channel 5 times or more.
- Compared to Year 2, applicants report using the GCOS web portal, going online to the GoC website and calling 1 800 O-Canada more times and having fewer contacts emailing a Service Canada office.
Thinking about your overall experience, how many times did you use each of the following?

Click for larger view
Figure 47: Number of Contacts with Service Channels (1/2)
This horizontal bar chart shows responses to a question about how many times the applicant used each service channels during their experience and presents results for Year 1, Year 2 and Year 3. Sample sizes vary by service channel, only those who used each channel during their experience were asked about it.
- Go to a Service Canada office: Year 3 32% one time, 6% two times, 5% three times, 0% four times, 6% five or more times, 50% Don’t know. Year 2 40% one time, 3% two times, 8% three times, 0% four times, 3% five or more times, 47% Don’t know. Year 1 42% one time, 6% two times, 7% three times, 3% four times, 1% five or more times, 41% Don’t know.
- Communicate by mail with the Government of Canada: Year 3 25% one time, 10% two times, 4% three times, 2% four times, 5% five or more times, 54% Don’t know. Year 2 31% one time, 7% two times, 6% three times, 1% four times, 8% five or more times, 47% Don’t know. Year 1 42% one time, 11% two times, 6% three times, 2% four times, 4% five or more times, 35% Don’t know.
- Call a Service Canada office directly: Year 3 29% one time, 13% two times, 6% three times, 2% four times, 6% five or more times, 43% Don’t know. Year 2 31% one time, 12% two times, 10% three times, 3% four times, 10% five or more times, 34% Don’t know. Year 1 25% one time, 18% two times, 10% three times, 4% four times, 20% five or more times, 24% Don’t know.
- Call 1800 O-Canada: Year 3 22% one time, 23% two times, 11% three times, 0% four times, 7% five or more times, 37% Don’t know. Year 2 40% one time, 16% two times, 6% three times, 3% four times, 5% five or more times, 31% Don’t know. Year 1 23% one time, 18% two times, 9% three times, 5% four times, 14% five or more times, 31% Don’t know.
Q25. Thinking about your overall experience, how many times did you [IF MULTIPLE SOURCES ‘use each of the following’ IF ONLY ONE SOURCE ‘use the following’]? Please provide one response per item.
Base: Used channel at aware, apply or follow-up stage n= Base Varies
Note: values less than 3% not labelled
* small sample size
** very small sample size
Significantly higher / lower than Year 2
Thinking about your overall experience, how many times did you use each of the following?

Click for larger view
Figure 48: Number of Contacts with Service Channels (2/2) Continuation
This horizontal bar chart shows the continuation on the responses to the question about how many times the applicant used each service channels during their experience and presents results for Year 1, Year 2 and Year 3. Sample sizes vary by service channel, only those who used each channel during their experience were asked about it.
- Email a Service Canada Office: Year 3 28% one time, 12% two times, 7% three times, 4% four times, 12% five or more times, 38% Don’t know. Year 2 22% one time, 12% two times, 8% three times, 5% four times, 16% five or more times, 37% Don’t know. Year 1 19% one time, 13% two times, 11% three times, 6% four times, 22% five or more times, 30% Don’t know.
- Go online to the Government of Canada website: Year 3 14% one time, 12% two times, 11% three times, 5% four times, 27% five or more times, 31% Don’t know. Year 2 14% one time, 15% two times, 9% three times, 5% four times, 27% five or more times, 29% Don’t know. Year 1 18% one time, 15% two times, 9% three times, 6% four times, 28% five or more times, 25% Don’t know.
- Go online to the program they applied for web portal: Year 3 6% one time, 8% two times, 11% three times, 7% four times, 48% five or more times, 20% Don’t know. Year 2 8% one time, 12% two times, 13% three times, 7% four times, 44% five or more times, 16% Don’t know. Year 1 13% one time, 12% two times, 10% three times, 7% four times, 37% five or more times, 21% Don’t know.
- Email a Program Officer directly: Year 3 14% one time, 18% two times, 13% three times, 8% four times, 27% five or more times, 21% Don’t know. Year 2 13% one time, 16% two times, 11% three times, 8% four times, 31% five or more times, 20% Don’t know. Year 1 9% one time, 22% two times, 16% three times, 9% four times, 37% five or more times, 7% Don’t know.
Q25. Thinking about your overall experience, how many times did you [IF MULTIPLE SOURCES ‘use each of the following’ IF ONLY ONE SOURCE ‘use the following’]? Please provide one response per item.
Base: Used channel at aware, apply or follow-up stage n= Base Varies
Note: values less than 3% not labelled
* small sample size
** very small sample size
Significantly higher / lower than Year 2
Number of Contacts by Program
- Across all service channels, a greater proportion of applicants report having been in contact with Service Canada 1 to 3 times and fewer 7 to 9 times or 10+ times compared to Year 2. More than two in ten applicants were in contact with Service Canada 1 to 3 times (22%, +3 pts), 4 to 6 times (23%, +2 pts) or 10 or more times (23%, -5 pts), while one in ten (9%, -4 pts) were in contact 7 to 9 times.
- As observed in Year 1 and Year 2, satisfaction with the service experience declined with the number of times the client contacted Service Canada and continued to be lower among those who had 10 or more contacts through any channel during the client journey.
- Those applying to all programs but EAF, NHSP and CSJ and in particular SDPP (37%, +14 pts) and SIP (33%) were more likely to have been in contact with Service Canada 10 or more times. Applicants to NHSP were more likely to have been in contact 1 to 3 times or 7 to 9 times.
- Compared to Year 2, applicants to NHSP and CSJ were more likely to have been in contact with Service Canada 1 to 3 times, while applicants to SDPP were more likely to report being in contact 10 or more times.
Thinking about your overall experience, how many times did you use each of the following?
| Number of contacts by program | |||||||||||||||||||||||||||
|---|---|---|---|---|---|---|---|---|---|---|---|---|---|---|---|---|---|---|---|---|---|---|---|---|---|---|---|
| TOTAL # OF TIMES | OVERALL SATISFACTION (% T2B) | EAF | NHSP | CSJ | SDPP | AS | WORBE | SSLP | WER | STAR | SIP | All but EAF, NHSP, CSJ | |||||||||||||||
| Year 3 | Year 2 | Year 1 | Year 3 | Year 2 | Year 1 | Year 3 | Year 2 | Year 1 | Year 3 | Year 2 | Year 1 | Year 3 | Year 2 | Year 1 | Year 3 | Year 2 | Year 1 | Year 3 | Year 3 | Year 3 | Year 3 | Year 3 | Year 3 | Year 3 | Year 2 | Year 1 | |
| Base: All respondents – n= | 2948 | 1905 | 1547 | 3041 | 1905 | 1547 | 297 | 204 | 56 | 1278 | 379 | 430 | 940 | 845 | 942 | 212 | 148 | 17* | 11* | 22* | 23* | 50 | 3** | 112 | 433 | 477 | 119 |
| 1-3 times | 22% | 19% | 12% | 79% | 83% | 79% | 23% | 26% | 14% | 26% | 21% | 18% | 22% | 18% | 12% | 14% | 19% | 12% | 9% | 5% | 4% | 12% | 33% | 12% | 13% | 13% | 8% |
| 4-6 times | 23% | 21% | 19% | 72% | 82% | 75% | 19% | 17% | 18% | 24% | 22% | 25% | 24% | 21% | 19% | 12% | 21% | 12% | - | 18% | 13% | 14% | - | 11% | 12% | 16% | 8% |
| 7-9 times | 9% | 13% | 15% | 76% | 76% | 75% | 9% | 12% | 14% | 11% | 16% | 16% | 9% | 13% | 15% | 9% | 10% | 12% | - | 5% | 4% | 14% | 33% | 11% | 10% | 8% | 4% |
| 10+ times | 23% | 28% | 41% | 59% | 73% | 62% | 19% | 20% | 36% | 18% | 21% | 26% | 23% | 29% | 42% | 37% | 23% | 41% | 36% | 46% | 57% | 34% | 33% | 33% | 37% | 37% | 61% |
| Don’t know | 22% | 20% | 13% | 67% | 76% | 69% | 30% | 25% | 18% | 22% | 20% | 15% | 21% | 19% | 12% | 27% | 26% | 24% | 55% | 27% | 22% | 26% | - | 34% | 29% | 27% | 19% |
Q25. Thinking about your overall experience, how many times did you [IF MULTIPLE SOURCES ‘use each of the following’ IF ONLY ONE SOURCE ‘use the following’]? Please provide one response per item.
* small sample size
** very small sample size
Significantly higher / lower than total
Significantly higher / lower than Year 2
Barriers and Issue Resolution
Explanation of Problem or Issue
- The most common problems or issues were that it took too long to receive a funding decision (44%, +10 pts), took too long to receive an update on their application (31%, +8 pts), and technical difficulties (24%, -3 pts).
- Compared to Year 2, a greater proportion of applicants said it took too long to receive a funding decision or to receive an update on their application, while fewer reported experiencing confusion with the online application process or program website information, felt the application form was complicated or that they received different answers from different program officers.
How would you describe the problem or issue you experienced?

Click for larger view
Figure 49: Explanation of Problem or Issue
This horizontal bar chart shows coded responses to an open-ended question about how the applicant would describe the problem or issue they experienced and presents results for Year 1, Year 2 and Year 3. A total of 800 respondents from Year 3 who experienced problem or issue answered as follows:
- Took too long to receive a funding decision: Year 3 44%. Year 2 34%. Year 1 43%.
- Took too long to receive an update on my application: Year 3 31%. Year 2 23%. Year 1 37%.
- Technical difficulties: Year 3 24%. Year 2 27%.
- Application form was too long: Year 3 15%. Year 2 21%.
- Application requirements were difficult to understand: Year 3 14%. Year 2 13%. Year 1 16%.
- Online application process was confusing: Year 3 14%. Year 2 19%.
- Program website information was confusing: Year 3 13%. Year 2 19%. Year 1 15%.
- Online account creation was confusing: Year 3 13%. Year 2 18%.
- Application form was complicated: Year 3 12%. Year 2 19%. Year 1 25%.
- Staff were not knowledgeable / could not answer my questions: Year 3 10%. Year 2 10%. Year 1 13%.
- Telephone lines were busy: Year 3 10%. Year 2 11%. Year 1 16%.
- Government of Canada website information was confusing: Year 3 10%. Year 2 11%.
- I received different answers from different Program Officers: Year 3 9%. Year 2 16%. Year 1 22%.
- Information on the program was difficult to understand: Year 3 7%. Year 2 11%. Year 1 16%.
- The information session was confusing: Year 3 2%.
Note: Only responses of 3% or more for Year 2 are shown.
Q28. How would you describe the problem or issue you experienced? Select all that apply.
Base: Experienced problem or issue (n=800)
Significantly higher / lower than Year 2
Encountered a Problem – % Yes
- One quarter (26%) of applicants encountered a problem or issue during the application process, an increase of 4 points from Year 2.
- Those applying to SDPP and all programs but EAF, NHSP, CSJ were more likely to say they encountered a problem, while applicants to NHSP were less likely.
- Compared to Year 2, applicants to CSJ were more likely to have experienced a problem or issue.
Thinking about your overall experience getting information and applying for [PROGRAM], did you experience any problems or issues during this process? – % Yes

Click for larger view
Figure 50: Encountered a Problem
This vertical bar chart shows responses to a question about whether the applicant experienced any problems or issues during the application process and presents results for Year 1, Year 2 and 3.
- Total: Year 3 26%. A total of 3041 respondents answered this question. Year 2 22%. Year 1 35%.
- EAF: Year 3 26%. A total of 300 respondents answered this question. Year 2 21%. Year 1 23%.
- NHSP: Year 3 23%. A total of 1296 respondents answered this question. Year 2 27%. Year 1 32%.
- CSJ: Year 3 26%. A total of 1004 respondents answered this question. Year 2 20%. Year 1 35%.
- SDPP: Year 3 41%. A total of 214 respondents answered this question. Year 2 33%. Year 1 47%.
- AS: Year 3 27%. A total of 11 respondents answered this question.
- WORBE: Year 3 14%. A total of 22 respondents answered this question.
- SSLP: Year 3 63%. A total of 24 respondents answered this question.
- WER: Year 3 31%. A total of 51 respondents answered this question.
- STAR: Year 3 67%. A total of 3 respondents answered this question.
- SIP: Year 3 29%. A total of 116 respondents answered this question.
- ALL BUT EAF, NHSP, CSJ: Year 3 37%. A total of 441 respondents answered this question. Year 2 35%. Year 1 31%.
Q27. Thinking about your overall experience getting information and applying for [INSERT PROGRAM], did you experience any problems or issues during this process?
Base: All respondents n=3041
* small sample size
** very small sample size
Significantly higher / lower than total
Significantly higher / lower than Year 2
Explanation of Problem or Issue by Program
- Among those who experienced a problem or issue, SDPP and SIP applicants were more likely to mention nearly all problems or issues. NHSP and EAF applicants were more likely to say that the application requirements or program information were difficult to understand, the application form was complicated and the information session was confusing. EAF applicants were also more likely to say the website information was confusing, while NHSP applicants were also more likely to cite technical difficulties, that the application form was too long or the online application process was confusing.
- Compared to Year 2, SDPP applicants were more likely to mention several problems or issues of which the greatest increase was for the application form being too long and too complicated, while CSJ applicants were more likely to say that it took too long to receive a funding decision or an update on their application.
How would you describe the problem or issue you experienced?
| Number of contacts by program | ||||||||||||||||||||||||
|---|---|---|---|---|---|---|---|---|---|---|---|---|---|---|---|---|---|---|---|---|---|---|---|---|
| TOTAL | EAF | NHSP | CSJ | SDPP | AS | WORBE | SSLP | WER | STAR | SIP | All but EAF, NHSP, CSJ | |||||||||||||
| Year 3 | Year 2 | Year 1 | Year 3 | Year 2 | Year 1 | Year 3 | Year 2 | Year 1 | Year 3 | Year 2 | Year 1 | Year 3 | Year 2 | Year 1 | Year 3 | Year 3 | Year 3 | Year 3 | Year 3 | Year 3 | Year 3 | Year 2 | Year 1 | |
| Base: Experienced problem or issue – n= | 800 | 482 | 517 | 78 | 43 | 13* | 298 | 104 | 137 | 263 | 175 | 332 | 88 | 51 | 8** | 3** | 3** | 15* | 16* | 2** | 34 | 161 | 160 | 35 |
| Took too long to receive a funding decision | 44% | 34% | 43% | 31% | 23% | 39% | 18% | 20% | 39% | 45% | 33% | 43% | 55% | 57% | 25% | 33% | 33% | 47% | 69% | 50% | 71% | 59% | 62% | 44% |
| Took too long to receive an update on my application | 31% | 23% | 37% | 24% | 19% | 31% | 10% | 11% | 18% | 32% | 21% | 38% | 51% | 55% | 38% | 33% | 33% | 27% | 44% | - | 65% | 51% | 48% | 42% |
| Technical difficulties | 24% | 27% | - | 27% | 42% | 44% | 33% | 22% | 27% | 25% | 9% | - | - | 27% | 6% | - | 27% | 23% | 15% | |||||
| Application form was too long | 15% | 21% | 19% | 14% | 29% | 24% | 13% | 21% | 35% | 10% | - | - | 13% | 38% | - | 35% | 32% | 18% | ||||||
| Application requirements were difficult to understand | 14% | 13% | 16% | 28% | 14% | 46% | 22% | 21% | 31% | 12% | 9% | 14% | 32% | 25% | - | 67% | - | 20% | 31% | - | 29% | 30% | 22% | 22% |
| Online application process was confusing | 14% | 19% | 18% | 12% | 33% | 27% | 11% | 20% | 15% | 2% | 33% | - | 13% | 19% | - | 21% | 17% | 7% | ||||||
| Website information was confusing | 13% | 19% | 15% | 21% | 16% | 23% | 13% | 15% | 14% | 13% | 20% | 15% | 16% | 9% | 13% | 100% | - | 7% | 19% | - | 18% | 17% | 18% | 19% |
| Online account creation was confusing | 13% | 18% | 8% | 5% | 13% | 13% | 13% | 21% | 17% | 1% | - | - | 7% | 19% | - | 27% | 18% | 9% | ||||||
| Application form was complicated | 12% | 19% | 27% | 19% | 31% | 21% | 9% | 18% | 41% | 13% | 67% | - | 13% | 19% | - | 32% | 34% | 20% | ||||||
| Staff were not knowledgeable / could not answer my questions | 10% | 10% | 13% | 8% | 5% | 8% | 5% | 8% | 9% | 10% | 10% | 13% | 18% | 8% | - | 33% | - | - | 19% | 50% | 12% | 16% | 14% | 26% |
| Telephone lines were busy | 10% | 11% | 16% | 5% | 2% | 23% | 5% | 7% | 10% | 10% | 13% | 16% | 10% | 10% | 13% | 33% | - | - | 13% | - | 9% | 9% | 9% | 11% |
| Government of Canada website information was confusing | 10% | 11% | 14% | 7% | 7% | 11% | 9% | 12% | 20% | 4% | 33% | - | - | 13% | - | 21% | 18% | 11% | ||||||
| I received different answers from different Program Officers | 9% | 16% | 22% | 3% | 9% | 15% | 7% | 9% | 18% | 10% | 18% | 22% | 7% | 21% | 25% | - | 33% | 20% | 6% | - | 6% | 8% | 18% | 37% |
| Information on the program was difficult to understand | 7% | 11% | 16% | 17% | 12% | 31% | 13% | 16% | 20% | 5% | 7% | 15% | 25% | 16% | 13% | 33% | 33% | 13% | 31% | 50% | 24% | 25% | 22% | 34% |
| The information session was confusing | 2% | n/a | n/a | 5% | n/a | n/a | 4% | n/a | n/a | 2% | n/a | n/a | 10% | n/a | n/a | - | - | - | 6% | - | 6% | 8% | n/a | n/a |
Note: Only responses of 3% or more for Year 2 Totals are shown.
Q28. How would you describe the problem or issue you experienced? Select all that apply.
Base: Experienced problem or issue (n=800)
* small sample size
** very small sample size
Significantly higher / lower than total
Significantly higher / lower than Year 2
Ease of Issue Resolution
- Among those who experienced a problem or issue, fewer than two in ten (17%) felt it was easily resolved, a decrease of 12 points from Year 2 (28%). While nearly half (47%) disagree that the problem or issue was easily resolved, an increase of 10 points from the previous year (37%).
- Those who applied to NHSP and experienced a problem or issue were more likely to say it was easily resolved, while applicants to all programs but EAF, NHSP and CSJ were less likely.
- Compared to Year 2, applicants to CSJ were less likely to feel their problem was easily resolved.
The problem or issue was easily resolved.

Click for larger view
Figure 51: Ease of Issue Resolution
This vertical bar chart shows responses to a question about the extent to which the applicant agrees or disagrees that the problem or issue was easily resolved and presents results for Year 1, Year 2 and 3. Those who experienced problem or issue answered as follows:
- Total: Year 3: 6% strongly agree, 11% somewhat agree, 30% neutral, 20% somewhat disagree, 27% strongly disagree. A total of 800 respondents answered this question. Year 2: 10% strongly agree, 18% somewhat agree, 31% neutral, 18% somewhat disagree, 19% strongly disagree. Year 1: 10% strongly agree, 16% somewhat agree, 30% neutral, 25% somewhat disagree, 17% strongly disagree.
- EAF: Year 3 23% strongly/somewhat agree. A total of 78 respondents answered this question. Year 2 35% strongly/somewhat agree. Year 1 39% strongly/somewhat agree.
- NHSP: Year 3 27% strongly/somewhat agree. A total of 298 respondents answered this question. Year 2 29% strongly/somewhat agree. Year 1 25% strongly/somewhat agree.
- CSJ: Year 3 16% strongly/somewhat agree. A total of 263 respondents answered this question. Year 2 30% strongly/somewhat agree. Year 1 26% strongly/somewhat agree.
- SDPP: Year 3 12% strongly/somewhat agree. A total of 88 respondents answered this question. Year 2 24% strongly/somewhat agree. Year 1 13% strongly/somewhat agree.
- AS: Year 3 67% strongly/somewhat agree. A total of 3 respondents answered this question.
- WORBE: Year 3 0% strongly/somewhat agree. A total of 3 respondents answered this question.
- SSLP: Year 3 20% strongly/somewhat agree. A total of 15 respondents answered this question.
- WER: Year 3 6% strongly/somewhat agree. A total of 16 respondents answered this question.
- STAR: Year 3 0% strongly/somewhat agree. A total of 2 respondents answered this question.
- SIP: Year 3 0% strongly/somewhat agree. A total of 34 respondents answered this question.
- ALL BUT EAF, NHSP, CSJ: Year 3 10% strongly/somewhat agree. A total of 161 respondents answered this question. Year 2 17% strongly/somewhat agree. Year 1 16% strongly/somewhat agree.
Q29. On a scale from 1 to 5, where 1 is “strongly disagree” and 5 is “strongly agree”, how much would you agree or disagree that the problem or issue was easily resolved?
Base: Experienced problem or issue (n=800)
* small sample size
** very small sample size
Significantly higher / lower than total
Significantly higher / lower than Year 2
Drivers of Satisfaction
Drivers of Satisfaction
The primary driver of satisfaction in the service experience was the amount of time it took from start to finish was reasonable, followed by the ease of follow-up before receiving a decision and confidence that any issues or problems would have been easily resolved.
- Other prominent drivers included whether the applicant received funding approval, that it was clear what would happen next and when, being able to complete steps online made the process easier, ease of understanding information about the program and putting together the information needed for the application.
When comparing the drivers of satisfaction between Year 2 and Year 3, timeliness of service has increased in importance and become the most prominent driver overall (consistent with Year 1), while the ease of follow-up has also increased in importance and become the second most prominent driver.
- Other aspects of service which have increased in importance in driving satisfaction include confidence in issue resolution and whether the applicant received funding approval, while the helpfulness of Service Canada phone representatives and ease of getting help when needed have decreased in importance.
Overall, the greatest opportunities to improve the service experience are improving the timeliness of service and ease of follow-up.
- In order to summarize what potential changes could result in an increase in overall satisfaction, the service attributes that most strongly drive satisfaction for Service Canada clients are determined and compared to Service Canada’s performance against these attributes.
- The resulting analysis found that common areas for potential improvement include improving the timeliness of service and ease of follow-up (before receiving a decision). The most prominent secondary areas for improvement include confidence in the issue resolution process and overall clarity of process.
- The provision of service in either Official Language, the ease gained from completing steps online, ease of finding information about the program and ease of determining eligibility are relative strengths and areas that should be maintained.
- In Year 3, the primary driver of satisfaction in the service experience was the amount of time it took from start to finish was reasonable, followed by the ease of follow-up (before receiving a decision) and confidence that any issues or problems would have been easily resolved.
- The strength of the drivers’ analysis was strong and had an R2 of 0.62 (consistent with Year 1 and Year 2, 0.63).

Click for larger view
Figure 52: Drivers of Satisfaction
This horizontal bar chart shows results of a regression analysis that was conducted to identify the primary service attributes driving overall satisfaction with the service experience. Results were reported by impact score per service attribute as follows:
- The amount of time it took was reasonable 0.344
- Ease of follow-up 0.259
- I was confident that any issues or problems would have been easily resolved 0.132
- Received funding approval 0.080
- Throughout the process it was clear what would happen next and when it would happen 0.076
- Being able to complete steps online made the process easier for me 0.074
- Understanding the requirements of the application 0.072
- Putting together the information you needed to apply for [Program] 0.071
- Find general information about [Program] 0.061
- I received consistent information 0.059
- Overall, it was easy for me to apply for [Program] 0.053
- It was clear what to do if I had a problem or question 0.050
- Find out what information you need to provide when applying for [Program] 0.048
- Completing the narrative questions (i.e. funding objectives, description of project, scope of project, etc.) 0.040
- Determine the steps to apply for funding 0.039
- I needed to explain my situation only once 0.033
- The application took a reasonable amount of time to complete 0.033
- I was provided with service in my choice of English or French 0.032
- Completing the budget document 0.029
- Meeting the requirements of the application process 0.028
- It was easy to get help when I needed it 0.024
- You were able to find the information you needed (online, in person, or by phone) within a reasonable amount of time 0.022
- It was easy to access service in a language I could speak and understand well 0.014
- I was confident that my personal information was protected 0.013
- Understand the information about [Program] 0.009
- Service Canada phone representatives were helpful 0.007
- I was able to move smoothly through all of the steps related to the [Program] application 0.005
- Completing the project timeline 0.001
- Determine if your organization is eligible for [Program] funding 0.001
R2 = 0.62
Top of Drivers of Satisfaction – Trending
- When comparing the drivers of satisfaction between Year 2 and Year 3, timeliness of service has increased in importance and become the most prominent driver overall (consistent with Year 1). The ease of follow-up, confidence in issue resolution and whether the applicant received funding approval have also increased in importance, while the helpfulness of Service Canada phone representatives and ease of getting help when needed have decreased in importance.
| Year 3 | Year 2 | Year 1 |
|---|---|---|
| The amount of time it took was reasonable | Service Canada phone representatives were helpful | The amount of time it took was reasonable |
| Ease of follow-up | The amount of time it took was reasonable | Service Canada phone representatives were helpful |
| I was confident that any issues or problems would have been easily resolved | It was easy to get help when I needed it | Overall, it was easy to apply |
| Received funding approval | It was clear what would happen next and when | Find general information about [program] |
| It was clear what would happen next and when | Find general information about [program] | I needed to explain my situation only once |
Priority Matrix – Overview
READER’S NOTE: This slide was intended to assist the reader in interpreting data shown in a priority matrix. A priority matrix has been used to identify priority improvement areas with respect to service interactions with applicants.
A priority matrix allows for decision makers to identify priorities for improvement by comparing how well applicants feel you have performed in an area with how much impact that area has on applicants’ overall satisfaction. It helps to answer the question ‘what can we do to improve satisfaction’. Each driver or component will fall into one of the quadrants explained below, depending on its impact on overall satisfaction and its performance score (provided by survey respondents).

Click for larger view
Overall Priority Matrix – Impact vs. Performance
- The greatest opportunities to improve the service experience are in improving the timeliness of service and ease of follow-up before receiving a decision. The most prominent secondary areas for improvement include confidence in the issue resolution process and overall clarity of the process.
- The provision of service in either Official Language, the ease gained from completing steps online, ease of finding information about the program and ease of determining eligibility are relative strengths and areas that should be maintained.

Click for larger view
*factors with standardized coefficients below 0.03 were excluded
Pre-Application
Information Gathering about the Program
Channel Use Pre-Application to Learn About the Program
- At just over half (52%, -5 pts), applicants were most likely to have received an email from the GoC, ESDC, or the program they applied to during the aware stage, followed by slightly fewer who went to the Government of Canada website for the program (48%) or used the applicant guide (45%). Roughly one quarter (27%, +4 pts) talked to peers/community networks and two in ten went to the general Government of Canada website (20%, -5 pts).
- Compared to Year 2, a greater proportion talked to peers/community networks (27%, +4 pts), while fewer received an email directly (52%, -5 pts), went to the GoC website (20%, -5 pts), participated in a GoC info session (10%, -2 pts) or talked to their local MP (9%, -6pts).
Which of the following did you use to find out about [PROGRAM] before you applied?

Click for larger view
Figure 53: Channel use pre-application- to learn about the program
This horizontal bar chart shows responses to a question about which channels the applicant used to find out about the program before they applied and presents results for Year 1, Year 2 and Year 3. All the 3041 respondents from Year 3 answered as follows:
- Received an email from the funding program directly: Year 3 52%. Year 2 57%. Year 1 51%.
- Went online to the Government of Canada website for the [program]: Year 3 48%. Year 2 48%.
- Used the applicant guide: Year 3 45%.
- Talked to my peers / community network: Year 3 27%. Year 2 23%. Year 1 29%.
- Went online to the Government of Canada website: Year 3 20%. Year 2 25%. Year 1 60%.
- Emailed a Program Officer for [program] directly: Year 3 10%. Year 2 11%. Year 10%.
- Participated in Government of Canada info session / webinar. Year 3 10%. Year 2 12%. Year 1 10%.
- Talked to my local Member of Parliament (MP): Year 3 9%. Year 2 15%. Year 1 18%.
- Used social media to get information: Year 3 5%. Year 2 5%. Year 1 5%.
- Went online to websites for other levels of government: Year 3 4%. Year 2 5%. Year 1 8%.
- Went online to other websites: Year 3 3%. Year 2 3%. Year 1 4%.
- Emailed a Service Canada office: Year 3 3%. Year 2 4%. Year 1 5%.
- Called a Service Canada office directly: Year 3 2%. Year 2 3%. Year 1 5%.
- Called 1 800 O Canada phone line: Year 3 1%. Year 2 2% Year 1 2%.
- Went to a Service Canada office: Year 3 0%. Year 2 1% Year 1 1%.
- NONE OF THESE: Year 3 3%. Year 2 4%. Year 1 4%.
Q2. Which of the following did you use to find out about [INSERT PROGRAM] before you applied? Consider all the methods you used to learn about the program before filling out the application. Please select all that apply.
Base: All respondents.
Note: In Year 3 the response option "Used the applicant guide for [program]“ was added. In Year 1 the following answer choice wording did not mention the specific program applied to: “Emailed a program officer directly” and “Received an email from the funding program directly”.
Significantly higher / lower than Year 2
Channel Use Pre-Application to Learn About the Program by Program
- NHSP applicants were more likely to have used several channels when learning about the program and most notably the applicant guide, talked to peers/ community networks, participated in a GoC info session and talked to their local MP. Applicants to all programs but EAF, NHSP and CSJ and in particular SDPP, SIP and to a lesser extent WER were also more likely to used several channels of which the most notable differences were for going to the GoC website and participated in a GoC info session, while SIP applicants were also much more likely to have talked to peers/ community network. EAF applicants were more likely to have gone online to the GoC website, participated in a GoC info session, used social media and or to have gone to other government websites.
- Compared to Year 2, applicants to EAF and NHSP were more likely to have talked to peers/ community network (along with CSJ applicants) and to have participated in a GoC info session (along with SDPP applicants), while EAF and SDPP applicants were also more likely more likely to have received an email from the GoC, ESDC or the program directly.
Which of the following did you use to find out about [PROGRAM] before you applied?
| TOTAL | EAF | NHSP | CSJ | SDPP | AS | WORBE | SSLP | WER | STAR | SIP | All but EAF, NHSP, CSJ | |||||||||||||
| Year 3 | Year 2 | Year 1 | Year 3 | Year 2 | Year 1 | Year 3 | Year 2 | Year 1 | Year 3 | Year 2 | Year 1 | Year 3 | Year 2 | Year 1 | Year 3 | Year 3 | Year 3 | Year 3 | Year 3 | Year 3 | Year 3 | Year 2 | Year 1 | |
| Base: All respondents – n= | 3041 | 1942 | 1549 | 300 | 207 | 56 | 1296 | 384 | 431 | 1004 | 865 | 942 | 214 | 153 | 17* | 2** | 5** | 5** | 13* | 1** | 40 | 133 | 486 | 120 |
| Received an email from the Government of Canada, ESDC or [program] directly | 52% | 57% | 51% | 37% | 23% | 32% | 49% | 57% | 50% | 54% | 62% | 52% | 42% | 26% | 41% | 36% | 32% | 71% | 28% | 67% | 38% | 40% | 34% | 41% |
| Went online to the Government of Canada website for the [program] | 48% | 48% | n/a | 49% | 52% | n/a | 49% | 51% | n/a | 48% | 47% | n/a | 51% | 43% | n/a | 55% | 73% | 42% | 59% | 67% | 54% | 53% | 49% | n/a |
| Used the applicant guide for | 45% | - | - | 45% | - | - | 49% | - | - | 44% | - | - | 49% | - | - | 46% | 59% | 33% | 43% | 100% | 47% | 48% | - | - |
| Talked to my peers / community network | 27% | 23% | 29% | 30% | 21% | 30% | 34% | 26% | 34% | 26% | 21% | 29% | 30% | 43% | 24% | 27% | 41% | 8% | 28% | 67% | 41% | 33% | 40% | 32% |
| Went online to the Government of Canada website (servicecanada.gc.ca) | 20% | 25% | 60% | 27% | 28% | 66% | 23% | 21% | 52% | 18% | 24% | 61% | 39% | 31% | 53% | 18% | 50% | 25% | 49% | 67% | 41% | 41% | 33% | 57% |
| Emailed a Program Officer for [program] directly | 10% | 11% | 10% | 12% | 12% | 7% | 11% | 14% | 14% | 10% | 10% | 9% | 9% | 11% | - | - | 23% | 21% | 4% | 67% | 19% | 13% | 18% | 13% |
| Participated in a Government of Canada information session or webinar | 10% | 12% | 10% | 15% | 6% | 7% | 16% | 11% | 20% | 8% | 12% | 8% | 27% | 11% | 12% | 18% | 41% | 13% | 28% | 100% | 32% | 29% | 18% | 32% |
| Talked to my local Member of Parliament (MP) | 9% | 15% | 18% | 7% | 8% | 14% | 17% | 17% | 15% | 9% | 16% | 19% | 10% | 5% | - | - | 9% | 17% | - | 33% | 3% | 7% | 5% | 3% |
| Used social media to get information | 5% | 5% | 5% | 7% | 6% | 5% | 7% | 7% | 3% | 4% | 4% | 5% | 7% | 14% | 6% | - | - | - | 4% | 33% | 5% | 6% | 8% | 4% |
| Went online to websites for other levels of government (provincial, territorial or municipal) | 4% | 5% | 8% | 6% | 11% | 7% | 6% | 5% | 8% | 3% | 5% | 8% | 10% | 4% | 18% | - | 9% | 4% | 14% | 67% | 8% | 10% | 5% | 9% |
| Went online to other websites | 3% | 3% | 4% | 4% | 4% | 11% | 3% | 4% | 4% | 3% | 3% | 3% | 9% | 9% | 6% | - | 9% | 4% | 6% | 67% | 4% | 7% | 6% | 6% |
| Emailed a Service Canada office | 3% | 4% | 5% | 2% | 2% | 5% | 3% | 4% | 6% | 3% | 5% | 5% | 3% | 3% | - | - | 9% | 13% | 2% | 33% | 3% | 4% | 2% | 6% |
| Called a Service Canada office directly | 2% | 3% | 5% | 1% | 1% | 5% | 3% | 3% | 4% | 2% | 3% | 5% | 2% | 3% | - | - | - | - | 2% | 33% | 3% | 3% | 4% | 4% |
| Called 1800 O Canada phone line | 1% | 2% | 2% | 1% | 1% | - | 1% | 1% | 3% | 1% | 2% | 2% | 2% | 2% | - | - | - | - | 2% | 33% | 1% | 2% | 2% | 0% |
| Went to a Service Canada office | 0% | 1% | 1% | 1% | - | - | 0% | 1% | 2% | 0% | 1% | 1% | - | 1% | - | - | - | - | - | - | 1% | 0% | 0% | 0% |
| None of These | 3% | 4% | 4% | 6% | 9% | 7% | 2% | 3% | 5% | 4% | 4% | 4% | 5% | 4% | 12% | 9% | - | - | 2% | - | 2% | 3% | 5% | 8% |
Q2. Which of the following did you use to find out about [INSERT PROGRAM] before you applied? Consider all the methods you used to learn about the program before filling out the application. Please select all that apply.
Base: All respondents.
Note: In Year 3 the response option "Used the applicant guide for [program]“ was added. In Year 1 the following answer choice wording did not mention the specific program applied to: “Emailed a program officer directly” and “Received an email from the funding program directly”.
* small sample size
** very small sample size
Significantly higher / lower than total
Significantly higher / lower than Year 2
Ease of Use of Government of Canada Website
- Of those who used the Government of Canada website during the aware stage, the vast majority felt nearly all aspects of learning about the program were easy. Applicants were most likely to feel it was easy finding general information about the program they applied for (82%), to determine the steps to apply for funding (81%) and to determine if their organization was eligible for funding (80%). Ratings were lowest for the determining the amount of time each phase of the application process was anticipated to take (56%).
- Compared to Year 2, applicants were less likely to feel it was easy to determine if their organization was eligible for funding (80%, -4 pts).
How difficult or easy was it to find the following information about [PROGRAM] on the Government of Canada website?

Click for larger view
Figure 54: Ease of Use of Government of Canada website
This horizontal bar chart shows responses to a question about how difficult or easy it was for the applicant to find different types of information about the program they applied for on the Government of Canada website and presents results for Year 1, Year 2 and Year 3. Respondents were asked to provide ratings on a 5-pt scale. All 1,682 respondents from Year 3 who used government of Canada website responded as follows:
- Find general information about the [program]: Year 3 44% very easy, 38% somewhat easy, 15% neutral, 3% somewhat difficult, 1% very difficult, 0% Don’t know. 82% easy. Year 2 82% easy. Year 1 82% easy.
- Determine the steps to apply for funding: Year 3 41% very easy, 40% somewhat easy, 15% neutral, 3% somewhat difficult, 1% very difficult, 0% Don’t know. 81% easy. Year 2 81% easy. Year 1 78% easy.
- Determine if your organization is eligible for [program] funding: Year 3 50% very easy, 30% somewhat easy, 14% neutral, 5% somewhat difficult, 2% very difficult, 0% Don’t know. 80% easy. Year 2 84% easy. Year 1 83% easy.
- Find out what information they need to provide when applying for the [program]: Year 3 39% very easy, 40% somewhat easy, 16% neutral, 3% somewhat difficult, 1% very difficult, 0% Don’t know. 79% easy. Year 2 79% easy. Year 1 78% easy.
- Determine when the application period for [program] takes place: Year 3 50% very easy, 29% somewhat easy, 15% neutral, 4% somewhat difficult, 2% very difficult, 0% Don’t know. 79% easy. Year 2 83% easy. Year 1 n/a easy.
- Understand the information about the [program]: Year 3 38% very easy, 39% somewhat easy, 19% neutral, 4% somewhat difficult, 1% very difficult, 0% Don’t know. 77% easy. Year 2 80% easy. Year 1 76% easy.
- Determine the amount of time each phase of the application process is anticipated to take: Year 3 24% very easy, 31% somewhat easy, 23% neutral, 14% somewhat difficult, 6% very difficult, 2% Don’t know. 56% easy. Year 2 58% easy. Year 1 n/a.
Q5. On a scale from 1 to 5, where 1 is ‘very difficult’ and 5 is ‘very easy’, how difficult or easy was it to find the following information about [INSERT PROGRAM] on the Government of Canada website? Select one response per item.
Base: Used Government of Canada website (n=1682)
Note: values less than 3% not labelled
* small sample size
** very small sample size
Significantly higher / lower than total
Significantly higher / lower than Year 2
Ease of Use of Government of Canada Website by Program
- Of those who used the GoC website, applicants to all programs but EAF, NHSP, and CSJ and in particular SDPP were less likely think it was easy to find all types of information related to their program. WER and SIP applicants were less likely to feel it was easy to find general information, while WER applicants less likely to say it was easy to find out what information they need to provide when applying and SIP applicants to determine the amount of time ease phase was anticipated to take.
- Compared to Year 2, NHSP applicants were less likely to feel it was easy to determine the steps to apply. CSJ applicants were less likely to feel it was easy to determine if their organization was eligible for funding, while applicants to all programs but EAF, NHSP and CSJ found it easier and were also more likely to find it easy to determine the amount of time ease phase is anticipated to take.
How difficult or easy was it to find the following information about [PROGRAM] on the Government of Canada website?
| TOP2BOX (% RATED 4/5) | ||||||||||||||||||||||||
|---|---|---|---|---|---|---|---|---|---|---|---|---|---|---|---|---|---|---|---|---|---|---|---|---|
| TOTAL | EAF | NHSP | CSJ | SDPP | AS | WORBE | SSLP | WER | STAR | SIP | All but EAF, NHSP, CSJ | |||||||||||||
| Year 3 | Year 2 | Year 1 | Year 3 | Year 2 | Year 1 | Year 3 | Year 2 | Year 1 | Year 3 | Year 2 | Year 1 | Year 3 | Year 2 | Year 1 | Year 3 | Year 3 | Year 3 | Year 3 | Year 3 | Year 3 | Year 3 | Year 2 | Year 1 | |
| Base: Used GoC website – n= | 1682 | 1092 | 902 | 166 | 125 | 37 | 706 | 203 | 224 | 519 | 473 | 573 | 135 | 87 | 9** | 8** | 19* | 12* | 38 | 2** | 77 | 291 | 291 | 68 |
| Find general information | 82% | 82% | 82% | 79% | 82% | 89% | 84% | 85% | 85% | 83% | 83% | 82% | 68% | 66% | 44% | 75% | 79% | 92% | 68% | 100% | 66% | 69% | 67% | 64% |
| Determine the steps to apply for funding | 81% | 81% | 78% | 77% | 78% | 87% | 79% | 86% | 82% | 81% | 82% | 77% | 68% | 63% | 44% | 63% | 84% | 67% | 74% | 100% | 82% | 74% | 68% | 70% |
| Determine if your organization is eligible for funding | 80% | 84% | 83% | 82% | 77% | 84% | 84% | 85% | 84% | 80% | 87% | 83% | 74% | 65% | 44% | 88% | 63% | 75% | 74% | 100% | 79% | 76% | 66% | 67% |
| Find out what information you need to provide when applying for | 79% | 79% | 78% | 75% | 75% | 78% | 78% | 80% | 79% | 80% | 80% | 79% | 67% | 66% | 33% | 63% | 79% | 83% | 66% | 100% | 74% | 70% | 67% | 64% |
| Determine when the application period for takes place | 79% | 83% | n/a | 77% | 80% | n/a | 80% | 83% | n/a | 79% | 84% | n/a | 71% | 68% | n/a | 88% | 79% | 67% | 68% | 100% | 77% | 74% | 71% | n/a |
| Understand the information about | 77% | 80% | 76% | 71% | 79% | 78% | 81% | 85% | 80% | 77% | 81% | 76% | 63% | 69% | 33% | 63% | 84% | 83% | 74% | 50% | 73% | 69% | 67% | 55% |
| Determine the amount of time each phase of the application process is anticipated to take | 56% | 58% | n/a | 63% | 62% | n/a | 69% | 65% | n/a | 55% | 59% | n/a | 46% | 40% | n/a | 13% | 58% | 58% | 42% | 50% | 35% | 43% | 34% | n/a |
Q5. On a scale from 1 to 5, where 1 is ‘very difficult’ and 5 is ‘very easy’, how difficult or easy was it to find the following information about [INSERT PROGRAM] on the Government of Canada website? Select one response per item.
* small sample size
** very small sample size
Significantly higher / lower than total
Significantly higher / lower than Year 2
Able to Find Information in Reasonable Amount of Time
- More than three quarters (77%) of applicants said they were able to find the information needed (online, in person, or by phone) within a reasonable amount of time.
- NHSP applicants were more likely to agree they found the information needed in a reasonable time, while applicants to all programs but EAF, NHSP, CSJ and in particular SDPP and SIP were less likely.
How much do you agree or disagree that you were able to find the information you needed (online, in person, or by phone) within a reasonable amount of time?

Click for larger view
Figure 55: Able to Find Information in Reasonable Amount of Time
This vertical bar chart shows responses to a question about the extent to which the applicant agrees or disagrees that they were able to find the information they needed within a reasonable amount of time and presents results for Year 3. Those who used at least one channel (online, in person or by phone) answered as follows:
- Total: Year 3: 42% strongly agree, 36% somewhat agree, 15% neutral, 4% somewhat disagree, 4% strongly disagree. A total of 2944 respondents answered this question.
- EAF: Year 3 76% strongly/somewhat agree. A total of 282 respondents answered this question.
- NHSP: Year 3 83% strongly/somewhat agree. A total of 1266 respondents answered this question.
- CSJ: Year 3 77% strongly/somewhat agree. A total of 969 respondents answered this question.
- SDPP: Year 3 67% strongly/somewhat agree. A total of 204 respondents answered this question.
- AS: Year 3 70% strongly/somewhat agree. A total of 10 respondents answered this question.
- WORBE: Year 3 82% strongly/somewhat agree. A total of 22 respondents answered this question.
- SSLP: Year 3 63% strongly/somewhat agree. A total of 24 respondents answered this question.
- WER: Year 3 70% strongly/somewhat agree. A total of 50 respondents answered this question.
- STAR: Year 3 67% strongly/somewhat agree. A total of 3 respondents answered this question.
- SIP: Year 3 67% strongly/somewhat agree. A total of 114 respondents answered this question.
- ALL BUT EAF, NHSP, CSJ: Year 3 68% strongly/somewhat agree. A total of 427 respondents answered this question.
5b. How much do you agree or disagree that you were able to find the information you needed (online, in person, or by phone) within a reasonable amount of time? Please use a scale of 1 to 5, where 1 is “strongly disagree” and 5 is “strongly agree”.
Base: Used at least one channel during aware stage (n=2944)
New question added in Year 3
Note: values less than 3% not labelled
Qualitative Findings: Awareness of Gs&Cs

Overall, regardless of whether an organization received funding or not, ESDC was seen by many as doing an excellent job of raising awareness about the various funding programs that are available.
“We know they exist. Canada Summer Jobs is very well advertised. Pretty much everybody knows about it. So, there’s a knowledge mobilization component to that program is very well done. And it is very prominent and present.”
Program websites were the main source of support used by applicants and the feedback on the websites and supporting documents was predominantly positive.
“We definitely consulted the websites as well as the frequently asked questions. These resources I think are well done. The eligibility requirements, the concept of what they’re looking for, I haven’t found it unclear… I thought it was clearly put together and didn’t often require additional information. The FAQs are usually quite helpful too. And what I’ve seen them do in the past, is that they also host these Ask Me Anything sessions where people who are interested in applying can show up and pose questions to the ESDC staff that’s assigned to this.”
Most Impactful Changes to Improve Ease of GoC Website
- At nearly four in ten (38%), applicants were most likely to say that if it were easier to determine the amount of time each phase of the application process takes it would have improved their experience the most, followed by two in ten (19%) that said finding out the information needed when applying and one in ten (11%) for being able to determine when the application period for the program takes place.
- EAF and NHSP applicants were more likely to say being able to find out the information needed when applying, while NHSP applicants were also more likely to mention to determine when the application period for the program takes place and understand information about the program and EAF applicants to determine the steps to apply. SDPP applicants were more likely to mention to find general information about the program.
When learning about [INSERT PROGRAM] on the Government of Canada website, which of the following changes would have improved your experience the most? If it were easier to…
| EAF | NHSP | CSJ | SDPP | AS | WORBE | SSLP | WER | STAR | SIP | All but EAF, NHSP, CSJ | ||
| Year 3 | Year 3 | Year 3 | Year 3 | Year 3 | Year 3 | Year 3 | Year 3 | Year 3 | Year 3 | Year 3 | ||
| (n=166) | (n=706) | (n=519) | (n=135) | (n=8**) | (n=19*) | (n=12*) | (n=38) | (n=2**) | (n=77) | (n=291) | ||
| Determine the amount of time each phase of the application process is anticipated to take | 38% | 26% | 25% | 40% | 31% | 50% | 58% | 58% | 37% | 50% | 39% | 36% |
| Find out what information you need to provide when applying for [PROGRAM] | 19% | 27% | 24% | 19% | 18% | - | 21% | 17% | 18% | - | 18% | 18% |
| Determine when the application period for [PROGRAM] takes place | 11% | 10% | 16% | 11% | 12% | - | - | 8% | 13% | - | 10% | 11% |
| Understand the information about [PROGRAM] | 9% | 11% | 11% | 9% | 12% | 13% | 11% | - | 13% | 50% | 13% | 12% |
| Determine if your organization is eligible for [PROGRAM] funding | 8% | 8% | 7% | 8% | 8% | 13% | 11% | - | 11% | - | 10% | 9% |
| Find general information about [PROGRAM] | 8% | 7% | 8% | 7% | 13% | 13% | - | 8% | 3% | - | 5% | 9% |
| Determine the steps to apply for funding | 7% | 11% | 8% | 7% | 7% | 13% | - | 8% | 5% | - | 4% | 6% |
5c. When learning about [INSERT PROGRAM] on the Government of Canada website, which of the following changes would have improved your experience the most? If it were easier to… SINGLE SELECT
Base: Used Government of Canada website (n=1682)
New question added in Year 3
Significantly higher / lower than total
Application Process
Applying for Funding
Channel Use for Application Preparation
- Applicants were most likely to use the applicant guide for the program to prepare and complete their application (59%), followed by going online to the GoC website for the program (45%). Just over two in ten (22%, -2 pts) said they talked to their peers/community network, went online to the GoC website (19%, -24 pts) or emailed a program officer directly (18%, -6 pts). Around one in ten (14%) applicants reported they used none of the channels outlined.
- Compared to Year 2, fewer reported going to the general GoC website, emailing a program officer directly, participating in a GoC info session, talking to their local MP, going to other websites for information or calling Service Canada directly.
To prepare and complete your application (up until when you submitted) did you consult with any of the following?

Click for larger view
Figure 56: Channel Use for Application Preparation
This horizontal bar chart shows responses to a question about which channels the applicant used to prepare and complete their application (up until when they submitted) and presents results for Year 1, Year 2 and Year 3. All 3041 respondents from Year 2 answered as follows:
- Used the applicant guide for [program]: Year 3 59%. Year 2 n/a. Year 1 n/a.
- Went online to the Government of Canada website for [program]: Year 3 45%. Year 2 n/a. Year 1 n/a.
- Talked to my peers / community network: Year 3 22%. Year 2 24%. Year 1 26%.
- Went online to the Government of Canada website: Year 3 19%. Year 2 43%. Year 1 49%.
- Emailed a Program Officer directly: Year 3 18%. Year 2 24%. Year 1 23%.
- Participated in a Government of Canada information session or webinar: Year 3 12%. Year 2 17%Year 1 11%.
- Talked to my local Member of Parliament (MP): Year 3 6%. Year 2 11%. Year 1 15%.
- Went online to other websites for information: Year 3 6%. Year 2 11%. Year 1 11%.
- Called a Service Canada office directly: Year 3 5%. Year 2 8%. Year 1 11%.
- Emailed a Service Canada office: Year 3 4%. Year 2 5%. Year 1 11%.
- Called 1800 O Canada phone line: Year 3 2%. Year 2 3%. Year 1 4%.
- Used social media to get information: Year 3 2%. Year 2 3%. Year 1 3%.
- Worked with a private consultant: Year 3 1%. Year 2 2%. Year 1 n/a.
- Went to a Service Canada office : Year 3 0%. Year 2 0%. Year 1 1%.
- NONE OF THESE: Year 3 14%. Year 2 21%. Year 1 19%.
Q6. To prepare and complete your application (up until when you submitted) did you consult with any of the following? Please select all that apply.
Base: All respondents.
Note: In Year 3 the response options "Used the applicant guide for [program]“ and ‘Went online to the GoC website for [program] were added. Year 1 wave had the following answer choice wording that did not mention the specific program applied to: “Emailed a program officer directly”. N/A means the response option was not included in the questionnaire.
Significantly higher / lower than Year 2
Channel Use for Application Preparation by Program
- Applicants to EAF, NHSP, SDPP and to a lesser extent WER and SIP were more likely to have used several channels to prepare and complete their application, while CSJ applicants were generally less likely. Notably, the applicant guide was the most commonly used channel across all programs, followed by the GoC website for the program.
- Compared to Year 2, CSJ applicants were less likely to have used most channels outlined. Applicants to EAF and NHSP were less likely to have used the general GoC website, while NHSP applicants were also less likely to have emailed a program officer or a Service Canada office. SDPP applicants were more likely to say they participated in a GoC info session or talked to their local MP.
| TOTAL | EAF | NHSP | CSJ | SDPP | |||||||||||
| Year 3 | Year 2 | Year 1 | Year 3 | Year 2 | Year 1 | Year 3 | Year 2 | Year 1 | Year 3 | Year 2 | Year 1 | Year 3 | Year 2 | Year 1 | |
| Base: All respondents – n= | 3041 | 1942 | 1549 | 300 | 207 | 56 | 1296 | 384 | 431 | 1004 | 865 | 942 | 214 | 153 | 17* |
| Used the applicant guide for [PROGRAM] | 59% | n/a | n/a | 67% | n/a | n/a | 71% | n/a | n/a | 57% | n/a | n/a | 67% | n/a | n/a |
| Went online to the Government of Canada website for [PROGRAM] | 45% | n/a | n/a | 54% | n/a | n/a | 49% | n/a | n/a | 44% | n/a | n/a | 52% | n/a | n/a |
| Talked to my peers/community network | 22% | 24% | 26% | 29% | 26% | 36% | 33% | 38% | 36% | 20% | 20% | 25% | 37% | 33% | 35% |
| Went online to the Government of Canada website | 19% | 43% | 49% | 22% | 41% | 45% | 20% | 35% | 47% | 18% | 46% | 49% | 32% | 32% | 53% |
| Emailed a Program Officer for [program] directly | 18% | 24% | 23% | 28% | 33% | 18% | 27% | 33% | 27% | 16% | 21% | 22% | 24% | 23% | 47% |
| Participated in a Government of Canada info session/webinar | 12% | 17% | 11% | 18% | 8% | 4% | 19% | 21% | 28% | 10% | 15% | 8% | 35% | 15% | 41% |
| Talked to my local Member of Parliament (MP) | 6% | 11% | 15% | 6% | 7% | 16% | 15% | 12% | 14% | 5% | 12% | 15% | 9% | 3% | 6% |
| Went online to other websites for information | 6% | 11% | 11% | 11% | 16% | 11% | 8% | 10% | 13% | 6% | 9% | 11% | 15% | 15% | 6% |
| Called a Service Canada office directly | 5% | 8% | 11% | 3% | 5% | 11% | 7% | 10% | 12% | 5% | 8% | 11% | 6% | 4% | - |
| Emailed a Service Canada office | 4% | 5% | 11% | 4% | 5% | 16% | 5% | 8% | 12% | 4% | 4% | 10% | 7% | 8% | 6% |
| Called 1-800 O-Canada phone line | 2% | 3% | 4% | 2% | 3% | 2% | 3% | 4% | 4% | 2% | 3% | 4% | 1% | 2% | - |
| Used social media to get information | 2% | 3% | 3% | 3% | 3% | 2% | 4% | 4% | 4% | 1% | 2% | 3% | 5% | 5% | 6% |
| Worked with a private consultant | 1% | 2% | n/a | 7% | 3% | n/a | 4% | 2% | n/a | 1% | 2% | n/a | 6% | 9% | n/a |
| Went to a Service Canada office | 0% | - | 1% | 0% | - | - | 1% | 1% | 2% | 0% | - | 1% | 1% | 1% | - |
| None of These | 14% | 21% | 19% | 9% | 20% | 23% | 6% | 17% | 14% | 15% | 23% | 20% | 5% | 25% | 24% |
Q6. To prepare and complete your application (up until when you submitted) did you consult with any of the following? Please select all that apply.
Base: All respondents.
Note: In Year 3 the response options "Used the applicant guide for [program]“ and ‘Went online to the GoC website for [program] were added. Year 1 wave had the following answer choice wording that did not mention the specific program applied to: “Emailed a program officer directly”. N/A means the response option was not included in the questionnaire.
| TOP2BOX (% RATED 4/5) | ||||||||||||
|---|---|---|---|---|---|---|---|---|---|---|---|---|
| TOTAL | AS | WORBE | SSLP | WER | STAR | SIP | All but EAF, NHSP, CSJ | |||||
| Year 3 | Year 2 | Year 1 | Year 3 | Year 3 | Year 3 | Year 3 | Year 3 | Year 3 | Year 3 | Year 2 | Year 1 | |
| Base: All respondents – n= | 3041 | 1942 | 1549 | 11* | 22* | 24* | 51 | 3** | 116 | 441 | 486 | 120 |
| Used the applicant guide for [PROGRAM] | 59% | n/a | n/a | 82% | 77% | 67% | 69% | 100% | 77% | 71% | n/a | n/a |
| Went online to the Government of Canada website for [PROGRAM] | 45% | n/a | n/a | 64% | 68% | 63% | 55% | 67% | 58% | 55% | n/a | n/a |
| Talked to my peers/community network | 22% | 24% | 26% | 55% | 36% | 29% | 35% | 67% | 40% | 38% | 35% | 35% |
| Went online to the Government of Canada website | 19% | 43% | 49% | 27% | 36% | 25% | 31% | 67% | 28% | 31% | 36% | 51% |
| Emailed a Program Officer for [program] directly | 18% | 24% | 23% | 36% | 36% | 50% | 14% | 67% | 28% | 26% | 34% | 35% |
| Participated in a Government of Canada info session/webinar | 12% | 17% | 11% | 64% | 41% | 29% | 47% | 100% | 38% | 38% | 24% | 49% |
| Talked to my local Member of Parliament (MP) | 6% | 11% | 15% | - | 5% | 4% | 2% | 33% | 3% | 7% | 4% | 8% |
| Went online to other websites for information | 6% | 11% | 11% | 27% | 27% | 17% | 20% | 67% | 8% | 14% | 19% | 13% |
| Called a Service Canada office directly | 5% | 8% | 11% | - | - | 4% | 4% | - | 6% | 5% | 5% | 11% |
| Emailed a Service Canada office | 4% | 5% | 11% | - | 14% | - | - | - | 7% | 6% | 8% | 9% |
| Called 1-800 O-Canada phone line | 2% | 3% | 4% | - | - | - | 2% | - | 1% | 1% | 2% | 1% |
| Used social media to get information | 2% | 3% | 3% | - | 9% | - | 8% | - | 3% | 4% | 4% | 2% |
| Worked with a private consultant | 1% | 2% | n/a | - | - | 8% | 12% | 33% | 6% | 7% | 7% | - |
| Went to a Service Canada office | 0% | - | 1% | - | - | 4% | - | - | - | 0% | - | - |
| None of these | 14% | 21% | 19% | - | 5% | - | 12% | - | 7% | 6% | 18% | 11% |
Q6. To prepare and complete your application (up until when you submitted) did you consult with any of the following? Please select all that apply.
Base: All respondents.
Note: In Year 3 the response options "Used the applicant guide for [program]“ and ‘Went online to the GoC website for [program] were added. Year 1 wave had the following answer choice wording that did not mention the specific program applied to: “Emailed a program officer directly”. N/A means the response option was not included in the questionnaire.
* small sample size
** very small sample size
Significantly higher / lower than total
Significantly higher / lower than Year 2
Ease of Application Process
- All aspects of the ease of completing the application remained consistent compared to Year 2. At more than three quarters, applicants were most likely to feel it was easy to meet the requirements of the application process (77%, -3 pts), followed by complete the project timeline (75%, unchanged) and understand the requirements of the application (74%, -2 pts). Closer to seven in ten said it was easy to put together the information needed to apply (72%, -2 pts) and to complete the narrative questions (70%, unchanged), while fewer felt it was easy to complete the budget document (67%, unchanged).
How would you rate the following elements of the application for [PROGRAM]?

Click for larger view
Figure 57: Ease of Application Process
This horizontal bar chart shows responses to a question about how difficult or easy the applicant found different elements of the application process in Year 3. Respondents were asked to provide ratings on a 5-pt scale. All 3041 respondents from Year 2 answered as follows:
- Meeting the requirements of the application: Year 3 34% very easy, 43% somewhat easy, 17% neutral, 4% somewhat difficult, 2% very difficult, 1% Don’t know. 77% easy. Year 2 80% easy. Year 1 77% easy.
- Completing the project timeline: Year 3 34% very easy, 41% somewhat easy, 18% neutral, 4% somewhat difficult, 2% very difficult, 2% Don’t know. 75% easy. Year 2 75% easy. Year 1 75% easy.
- Understanding the requirements of the application: Year 3 31% very easy, 43% somewhat easy, 20% neutral, 4% somewhat difficult, 1% very difficult, 0% Don’t know. 74% easy. Year 2 76% easy. Year 1 73% easy.
- Putting together the information they needed to apply for the program: Year 3 31% very easy, 41% somewhat easy, 22% neutral, 4% somewhat difficult, 1% very difficult, 1% Don’t know. 72% easy. Year 2 74% easy. Year 1 69% easy.
- Completing the narrative questions: Year 3 27% very easy, 43% somewhat easy, 23% neutral, 5% somewhat difficult, 2% very difficult, 0% Don’t know. 70% easy. Year 2 70% easy. Year 1 64% easy.
- Completing the budget document: Year 3 25% very easy, 41% somewhat easy, 23% neutral, 6% somewhat difficult, 2% very difficult, 2% Don’t know. 67% easy. Year 2 67% easy. Year 1 67% easy.
Q7. On a scale of 1 to 5, where 1 is ‘very difficult’ and 5 is ‘very easy’, how would you rate the following elements of the application for [INSERT PROGRAM]? Select one response per item.
Base: All respondents
Note: values less than 3% not labelled
* small sample size
** very small sample size
Significantly higher / lower than total
Significantly higher / lower than Year 2
Qualitative Findings: What Impressed and What Frustrated Applicants
When asked to reflect on the entire application process, applicants in the qualitative research highlighted a number of aspects of the process which impressed them. However, they tended to be more vocal around what frustrated them.
IMPRESSED THEM
- Reminder notifications and outreach from programs about upcoming funding opportunities.
- Smooth and straightforward application process.
- The existence of grants and contributions for important projects.
- Shift to digital application channels.
- Shorter forms.
- Helpfulness of Service Canada agents.
“What impressed me is there was actually a program available. There was funding available to do something like that… And that they’re supporting the types of activities that your organization does. I was very impressed that it was there, New Horizon. And it also kind of gives you some of the framework as to what they wanted you to do with that money for the seniors.”
COMMON FRUSTRATIONS
- Extensive delays in notification of funding decisions, especially in the case of Sectoral Initiative Program and the Skilled Trades Awareness and Readiness Program.
- Lack of success in receiving funding and the reasons behind such decisions. This was underscored by a few Social Development Partnerships Program and Sectoral Initiative Program applicants in particular.
- Too much detail required of applicants, notably in the case of Social Development Partnerships Program and Women's Employment Readiness Pilot Program.
- Often-tight project turnaround times after receiving a funding decision.
“On n'avait jamais eu de réponse pourquoi on avait été refusés à deux reprises. Alors, en bout de ligne, j'ai dû essayer d'imaginer, avec la municipalité, un plan d'action qui nous permettrait d'avoir de meilleures chances.”
Ease of Application Process by Program
- Applicants to SDPP, SIP, WER and to a lesser extent EAF and NHSP experienced more difficulty with all elements of the application process. CSJ applicants were more likely to find it easy to complete the project timeline, put together the information needed to apply and complete the budget document.
- Compared to Year 2, CSJ and SDPP applicants were less likely to find it easy to meet the requirements of the application process (along with applicants to all programs but EAF, NHSP and CSJ) and understand the requirements of the application. CSJ applicants were also less likely to say it was easy to put together the information needed to apply.
How would you rate the following elements of the application for [PROGRAM]?
| TOTAL | EAF | NHSP | CSJ | SDPP | AS | WORBE | SSLP | WER | STAR | SIP | All but EAF, NHSP, CSJ | |||||||||||||
| Year 3 | Year 2 | Year 1 | Year 3 | Year 2 | Year 1 | Year 3 | Year 2 | Year 1 | Year 3 | Year 2 | Year 1 | Year 3 | Year 2 | Year 1 | Year 3 | Year 3 | Year 3 | Year 3 | Year 3 | Year 3 | Year 3 | Year 2 | Year 1 | |
| Base: All respondents – n= | 3041 | 1942 | 1549 | 300 | 207 | 56 | 1296 | 384 | 431 | 1004 | 865 | 942 | 214 | 153 | 17* | 11* | 22* | 24* | 51 | 3** | 116 | 441 | 486 | 120 |
| Meeting the requirements of the application process | 77% | 80% | 77% | 71% | 69% | 75% | 73% | 75% | 68% | 78% | 83% | 79% | 57% | 68% | 53% | 36% | 73% | 71% | 61% | 67% | 59% | 59% | 66% | 57% |
| Completing the project timeline | 75% | 75% | 75% | 67% | 60% | 75% | 71% | 70% | 70% | 77% | 78% | 76% | 52% | 56% | 77% | 55% | 77% | 63% | 61% | 67% | 59% | 56% | 55% | 60% |
| Understanding the requirements of the application | 74% | 76% | 73% | 70% | 68% | 80% | 73% | 72% | 68% | 75% | 79% | 73% | 55% | 67% | 65% | 46% | 68% | 71% | 63% | 67% | 60% | 58% | 62% | 62% |
| Putting together the information you needed to apply for [program] | 72% | 74% | 69% | 61% | 58% | 61% | 66% | 69% | 65% | 74% | 78% | 70% | 51% | 60% | 41% | 46% | 68% | 63% | 51% | 100% | 50% | 52% | 57% | 56% |
| Completing the narrative questions | 70% | 70% | 64% | 64% | 69% | 68% | 65% | 67% | 60% | 71% | 72% | 64% | 58% | 67% | 41% | 46% | 68% | 75% | 53% | 100% | 58% | 59% | 63% | 55% |
| Completing the budget document | 67% | 67% | 67% | 54% | 59% | 66% | 60% | 62% | 61% | 69% | 71% | 68% | 44% | 50% | 29% | 36% | 55% | 42% | 39% | 33% | 41% | 43% | 46% | 43% |
Q7. On a scale of 1 to 5, where 1 is ‘very difficult’ and 5 is ‘very easy’, how would you rate the following elements of the application for [INSERT PROGRAM]? Select one response per item.
* small sample size
** very small sample size
Significantly higher / lower than total
Significantly higher / lower than Year 2
Ease of Use of Budget Calculator- EAF Applicants
- Among EAF Mid-Sized and Early Learning and Child Care applicants, nearly six in ten (58%) agreed that the budget calculator made it easy to complete the budget for the application, followed closely by that it was easy to use (56%) and that it helped to ensure they requested sufficient funding for the project (56%).
The application process for Enabling Accessibility Fund involved the use of a budget calculator. On a scale from 1 to 5, where 1 is “strongly disagree” and 5 is “strongly agree”, how much do you agree or disagree with the following statements? The budget calculator…

Click for larger view
Figure 58: Ease of Use of Budget Calculator- EAF Applicants
This horizontal bar chart shows responses to a question about the extent to which the applicant agrees or disagrees with some aspects of the usability of the budget calculator for the Enabling Accessibility Fund application process and presents results for Year 3. Respondents were asked to provide ratings on a 5-pt scale. 254 EAF Mid-Sized and Early Learning and Child Care applicants from Year 3 answered as follows:
- Made it easy to complete the budget for the application: Year 3 22% strongly agree, 36% somewhat agree, 26% neutral, 12% somewhat disagree, 4% strongly disagree, 1% Don’t know. 58% strongly/somewhat agree.
- Was easy to use: Year 3 21% strongly agree, 35% somewhat agree, 29% neutral, 9% somewhat disagree, 6% strongly disagree, 0% Don’t know. 56% strongly/somewhat agree.
- Helped to ensure I requested sufficient funding for my project: Year 3 24% strongly agree, 32% somewhat agree, 26% neutral, 10% somewhat disagree, 6% strongly disagree, 2% Don’t know. 56% strongly/somewhat agree.
Q7b. The application process for Enabling Accessibility Fund involved the use of a budget calculator. On a scale from 1 to 5, where 1 is “strongly disagree” and 5 is “strongly agree”, how much do you agree or disagree with the following statements? The budget calculator…
Base: EAF Mid-Sized -OR- EAF Early Learning and Child Care (n=254)
New question added in Year 3
Significantly higher / lower than total
Funding Determined using Budget Calculator- EAF Applicants
- Among EAF Mid-Sized and Early Learning and Child Care applicants who were approved for funding, just over half (52%) said that the funding determined by using the budget calculator was the right amount, while four in ten (41%) reported it was too little and less than one in ten (7%) too much.
Thinking about the amount of funding determined using the budget calculator, would you say this was too little, too much or the right amount for your project?

Click for larger view
Figure 59: Funding Determined using Budget Calculator- EAF Applicants
This horizontal bar chart shows responses to a question about applicants perception of the amount of funding determined by the budget calculator and presents results for Year 3. Respondents were asked to provide ratings on a 5-pt scale. 136 EAF Mid-Sized and Early Learning and Child Care applicants who were approved for funding in Year 3 answered as follows:
- The amount of funding determined using the budget calculator: Year 3 3% too much, 4% much, 52% right amount, 21% little, 20% too little. 7% much/too much. 41% little/too little
Q7c. Thinking about the amount of funding determined using the budget calculator, would you say this was too little, too much or the right amount for your project?
Base: EAF Mid-Sized -OR- EAF Early Learning and Child Care AND received approval for funding (n=136)
New question added in Year 3
Significantly higher / lower than total
Reasons for Submission Method by Method
- The most common reason for submitting their application through the method used continued to be that it was the easiest/most familiar way to apply (53%, +2 pts), followed by that they felt more confident their application would be submitted properly (18%, -3 pts) or that it was the method they were directed to use (15%, -1 pt).
- CSJ applicants were more likely to say the way they applied was the easiest/most familiar method. EAF and NHSP applicants were more likely to say that they felt more confident their application would be submitted properly, or that they didn’t know any other way, while NHSP applicants were also were more likely to say it was the only method available. SDPP applicants and applicants to all programs but EAF, NHSP and CSJ were more likely to indicate it was the method they were directed to use or that it was the only method provided.
- Compared to Year 2, NHSP and CSJ applicants were more likely to say they didn’t know any other way to apply.
Why did you choose this method to submit your application?
| TOTAL | EAF | NHSP | CSJ | SDPP | AS | WORBE | SSLP | WER | STAR | SIP | All but EAF, NHSP, CSJ | |||||||||||||
| Year 3 | Year 2 | Year 1 | Year 3 | Year 2 | Year 1 | Year 3 | Year 2 | Year 1 | Year 3 | Year 2 | Year 1 | Year 3 | Year 2 | Year 1 | Year 3 | Year 3 | Year 3 | Year 3 | Year 3 | Year 3 | Year 3 | Year 2 | Year 1 | |
| Base: Excluding ‘None of the above’ at Q10 – n= | 3031 | 1929 | 1539 | 298 | 205 | 56 | 1293 | 383 | 428 | 1001 | 861 | 936 | 214 | 151 | 16* | 11* | 22* | 24* | 51 | 3** | 114 | 439 | 480 | 117 |
| It was the easiest / most familiar way to apply | 53% | 51% | 47% | 43% | 36% | 45% | 43% | 39% | 40% | 55% | 55% | 47% | 36% | 36% | 19% | 36% | 36% | 33% | 41% | 33% | 40% | 38% | 37% | 40% |
| I felt more confident my application would be submitted properly | 18% | 21% | 18% | 22% | 23% | 13% | 24% | 24% | 30% | 17% | 20% | 17% | 20% | 22% | 19% | 18% | 32% | 29% | 18% | 67% | 18% | 20% | 19% | 18% |
| It was the method I was directed to use | 15% | 16% | 21% | 14% | 14% | 27% | 15% | 21% | 17% | 15% | 14% | 21% | 22% | 25% | 38% | 18% | 14% | 8% | 20% | - | 20% | 20% | 24% | 24% |
| I did not know any other way to apply | 9% | 6% | 9% | 15% | 16% | 7% | 10% | 6% | 4% | 9% | 6% | 9% | 10% | 12% | 6% | 18% | 5% | 4% | 12% | - | 14% | 11% | 10% | 6% |
| It was the only method available | 3% | 4% | 5% | 3% | 6% | 7% | 6% | 6% | 4% | 3% | 3% | 5% | 7% | 5% | 19% | - | 9% | 21% | 6% | - | 5% | 7% | 9% | 11% |
| Other | 2% | 2% | 2% | 3% | 4% | 2% | 2% | 4% | 4% | 2% | 2% | 1% | 6% | - | - | 9% | 5% | 4% | 4% | - | 2% | 4% | 2% | 2% |
Q11. Why did you choose this method to submit your application? Please select one reason only.
* small sample size
** very small sample size
Significantly higher / lower than total
Significantly higher / lower than Year 2
Time it Took to Complete Application was Reasonable
- Slightly fewer than seven in ten (68%, -2 pts) applicants felt the application took a reasonable amount of time to complete, consistent with Year 2 (70%).
- CSJ applicants were more likely to feel the application took a reasonable amount of time to complete, while those applying to NHSP, SDPP, WER and SIP were less likely.
- Compared to Year 2, SDPP applicants were less likely to feel the application took a reasonable amount of time to complete.
Please rate the following statement: The application took a reasonable amount of time to complete.

Click for larger view
Figure 60: Time It Took to Complete Application Was Reasonable
This vertical bar chart shows responses to a question about the extent to which the applicant would agree or disagree that the application took a reasonable amount of time to complete and presents results for Year 1, Year 2 and Year 3. Respondents were asked to provide ratings on a 5-pt scale.
- Total: Year 29% strongly agree, 40% somewhat agree, 23% neutral, 7% somewhat disagree, 2% strongly disagree, 0% don’t know. A total of 3041 respondents answered this question. Year 2 31% strongly agree, 39% somewhat agree, 21% neutral, 6% somewhat disagree, 3% strongly disagree, 0% don’t know. Year 1 25% strongly agree, 40% somewhat agree, 23% neutral, 8% somewhat disagree, 4% strongly disagree,1% don’t know.
- EAF: Year 3 68% strongly/somewhat agree. A total of 300 respondents answered this question. Year 2 68% strongly/somewhat agree. Year 1 66% strongly/somewhat agree.
- NHSP: Year 3 64% strongly /somewhat agree. A total of 1296 respondents answered this question. Year 2 66% strongly /somewhat agree. Year 1 62% strongly /somewhat agree.
- CSJ: Year 3 70% strongly /somewhat agree. A total of 1004 respondents answered this question. Year 2 72% strongly /somewhat agree. Year 1 65% strongly /somewhat agree.
- SDPP: Year 3 44% strongly/somewhat agree. A total of 214 respondents answered this question. Year 2 61% strongly/somewhat agree. Year 1 47% strongly/somewhat agree.
- AS: Year 3 36% strongly/somewhat agree. A total of 11 respondents answered this question.
- WORBE: Year 3 64% strongly/somewhat agree. A total of 22 respondents answered this question.
- SSLP: Year 3 46% strongly/somewhat agree. A total of 24 respondents answered this question.
- WER: Year 3 51% strongly/somewhat agree. A total of 51 respondents answered this question.
- STAR: Year 3 67% strongly/somewhat agree. A total of 3 respondents answered this question.
- SIP: Year 3 48% strongly/somewhat agree. A total of 116 respondents answered this question.
- ALL BUT EAF, NHSP, CSJ: Year 3 47% strongly/somewhat agree. A total of 441 respondents answered this question. Year 2 54% strongly/somewhat agree. Year 1 55% strongly/somewhat agree.
Q9. On a scale from 1 to 5, where 1 is ‘strongly disagree’ and 5 is ‘strongly agree’, please rate the following statement: The application took a reasonable amount of time to complete.
Base: All respondents
Note: values less than 3% not labelled
* small sample size
** very small sample size
Significantly higher / lower than total
Significantly higher / lower than Year 2
Channel Use for Application Submission by Program
- Six in ten applicants (59%, +8 pts) submitted their application using the online fillable form, followed by one third (34%, -1 pt) who used the GCOS web portal. Considerably fewer applicants downloaded the application documents and submitted by email (5%, -5 pts) or mail (3%, -2 pts).
- Applicants to EAF, NHSP, SDPP, WER and SIP were more likely to have downloaded the application documents and submitted them by email.
- Compared to Year 2, NHSP and CSJ applicants were more likely to have submitted their application using the online fillable form, while SDPP applicants were more likely to have used the GCOS web portal.
Which of the following methods did you use to submit your application?
| TOTAL | EAF | NHSP | CSJ | SDPP | AS | WORBE | SSLP | WER | STAR | SIP | All but EAF, NHSP, CSJ | |||||||||||||
| Year 3 | Year 2 | Year 1 | Year 3 | Year 2 | Year 1 | Year 3 | Year 2 | Year 1 | Year 3 | Year 2 | Year 1 | Year 3 | Year 2 | Year 1 | Year 3 | Year 3 | Year 3 | Year 3 | Year 3 | Year 3 | Year 3 | Year 2 | Year 1 | |
| Base: All respondents – n= | 3041 | 1942 | 1549 | 300 | 207 | 56 | 1296 | 384 | 431 | 1004 | 865 | 942 | 214 | 153 | 17* | 11* | 22* | 24* | 51 | 3** | 116 | 441 | 486 | 120 |
| Submitted an application using the online fillable form | 59% | 51% | n/a | 54% | 45% | n/a | 59% | 52% | n/a | 60% | 53% | n/a | 33% | 36% | n/a | 9% | 32% | 13% | 26% | - | 35% | 32% | 30% | n/a |
| Submitted an application using the GCOS account/web portal | 34% | 35% | n/a | 14% | 11% | n/a | 20% | 16% | n/a | 35% | 41% | n/a | 40% | 12% | n/a | 55% | 18% | 63% | 39% | - | 39% | 39% | 26% | n/a |
| Downloaded the application documents and then submitted by email | 5% | 10% | 13% | 28% | 36% | 41% | 17% | 21% | 40% | 2% | 3% | 9% | 24% | 47% | 59% | 36% | 46% | 21% | 33% | 100% | 21% | 25% | 40% | 40% |
| Downloaded the application documents and then submitted by mail | 1% | 3% | 4% | 1% | 4% | 2% | 2% | 7% | 15% | 1% | 2% | 4% | 2% | 3% | 6% | - | 5% | - | - | - | - | 1% | 2% | 2% |
| Submitted application documents to a Service Canada office | 1% | 1% | 2% | - | 1% | 4% | 1% | 2% | 3% | 1% | 0% | 2% | 1% | 1% | - | - | - | - | - | - | 1% | 1% | 1% | 4% |
| Submitted on my behalf by my local Member of Parliament | 0% | 0% | 0% | 0% | 1% | - | 0% | 1% | 1% | 0% | - | - | 1% | - | - | - | - | - | - | - | 1% | 1% | - | 0% |
| Other | 0% | 0% | n/a | 2% | 2% | n/a | 1% | 0% | n/a | 0% | - | n/a | 0% | - | n/a | - | - | 4% | 2% | - | 2% | 1% | 1% | n/a |
| None of these | 0% | 1% | 1% | 1% | 1% | - | 0% | 0% | 1% | 0% | 1% | 1% | - | 1% | 6% | - | - | - | - | - | 2% | 1% | 1% | 3% |
Q10. Which of the following methods did you use to submit your application? Please select only one.
* small sample size
** very small sample size
Significantly higher / lower than total
Significantly higher / lower than Year 2
Reasons for Submission Method by Method
- Across nearly all methods, most applicants said they used the method they did because it was the easiest way to apply / the one they were most familiar with. Among those who downloaded the application and submitted by mail, the most common reason was because they felt confident that the application would be submitted properly.
- Those who submitted their application using the online fillable form were more likely to do so because it was the easiest way to apply. Those who downloaded the application and submitted by mail or email were more likely to feel confident that the application would be submitted properly or because it was the only method available (along with those who submitted to a SC office). Those who submitted through the GCOS web portal were more likely to say they did so because it was the method they were directed to use.
Why did you choose this method to submit your application?
| TOTAL | Submitted using online fillable form | Submitted using GCOS account/web portal | Downloaded docs, then submitted by email | Downloaded docs, then submitted by mail | Submitted to SC office | Submitted by MP | ||||||||
| Year 3 | Year 2 | Year 3 | Year 2 | Year 3 | Year 2 | Year 3 | Year 2 | Year 3 | Year 2 | Year 3 | Year 2 | Year 3 | Year 2 | |
| Base: Excluding ‘None of the above’ at Q10 – n= | 3031 | 1929 | 1662 | 890 | 826 | 585 | 443 | 362 | 44 | 63 | 21 | 16* | 8** | 3** |
| It was the easiest/most familiar way to apply | 53% | 51% | 59% | 56% | 44% | 46% | 51% | 45% | 30% | 41% | 36% | 46% | 68% | 78% |
| I felt more confident my application would be submitted properly | 18% | 21% | 16% | 18% | 20% | 22% | 23% | 23% | 39% | 31% | 4% | 19% | 24% | 22% |
| It was the method I was directed to use | 15% | 16% | 11% | 13% | 23% | 22% | 9% | 12% | 10% | - | 25% | 33% | - | - |
| I did not know any other way to apply | 9% | 6% | 10% | 7% | 9% | 5% | 7% | 10% | 1% | 2% | 1% | - | - | - |
| It was the only method available | 3% | 4% | 3% | 5% | 3% | 3% | 5% | 6% | 9% | 6% | 22% | - | 8% | - |
| Other | 2% | 2% | 1% | 2% | 1% | 2% | 5% | 4% | 10% | 20% | 12% | 2% | - | - |
Q11. Why did you choose this method to submit your application? Please select one reason only.
* small sample size
** very small sample size
Significantly higher / lower than total
Significantly higher / lower than Year 2
Ease of Submitting Application Using Web Portal
- Eight in ten (82%) applicants who used the GCOS portal found it easy to submit their application online. Three-quarters (76%) said it was easy to complete the steps of the application using the portal, followed by two thirds (66%) of those who were approved for funding that said it was easy to manage their active project from the portal. Just over half (53%) felt it was easy to register for a GCOS account.
How difficult or easy was it to…

Click for larger view
Figure 61: Ease of Submitting Application Using Web Portal
This horizontal bar chart shows responses to a question about how difficult or easy it was for the applicant to submit their application using an online web portal and presents results for Year 1, Year 2 and Year 3. Only those who submitted their application using an online web portal were asked this question. A total of 2488 respondents were asked to provide ratings on a 5-pt scale.
- Submit your application online for [program]: Year 3 44% very easy, 38% somewhat easy, 13% neutral, 3% somewhat difficult, 1% very difficult, 1% Don’t know. 82% very/somewhat easy. Year 2 82% very/somewhat easy. Year 1 72% very/somewhat easy.
- Complete the steps of the application process for [program] using the GCOS Portal: Year 3 34% very easy, 42% somewhat easy, 17% neutral, 5% somewhat difficult, 2% very difficult, 0% Don’t know. 76% very/somewhat easy. Year 2 n/a. Year 1 n/a.
- Manage your active project using the GCOS portal (e.g., create, modify, and submit claim and activity reports, supporting documents, forecast of project expenditures, etc.): Year 3 28% very easy, 38% somewhat easy, 24% neutral, 8% somewhat difficult, 1% very difficult, 1% Don’t know. 66% very/somewhat easy. Year 2 n/a. Year 1 n/a.
- Register for a Grants and Contributions Online Services (GCOS) account: Year 3 20% very easy, 33% somewhat easy, 25% neutral, 12% somewhat difficult, 4% very difficult, 6% Don’t know. 53% very/somewhat easy. Year 2 n/a. Year 1 n/a.
Q12. On a scale from 1 to 5, where 1 means “very difficult” and 5 means “very easy”, how difficult or easy was it to...
Base: Submitted application using online fillable form or using the Grants and Contributions Online Services (GCOS) online web portal
Note: values less than 3% not labelled
* small sample size
** very small sample size
Significantly higher / lower than total
Significantly higher / lower than Year 2
Qualitative Findings: Completing the Application

The majority of applicants who took part in the qualitative research opted to fill out the applications online – via GCOS or program websites.
The preference was to work on a draft copy of the application in a Word document, or a shared document if a team was involved, prior to submitting final answers.
“I do feel that GCOS is a huge improvement from the paper forms. And it is quite easy to use for sure. GCOS is one of the things that I have some positive feedback about. It saves very well. It’s easy to log in. It’s quite clearly laid out.”
“Je me plus habitué à faire ça en ligne, mais je ne me fie jamais, jamais au système. J’écris tout dans Word, je le sauve. Puis là, je transfère mes réponses. Ça évite les ennuis.”
Ease of Submitting Application Using Web Portal
- Among those who used the online fillable form or GCOS online portal, CSJ applicants were more likely to say they found it easy to submit their application online, while EAF applicants were more likely to feel it was easy to register for a GCOS account. Those applying to NSHP, SDPP and SIP were less likely to feel it was easy to submit their application online and complete the steps of the application using the GCOS portal.
- Compared to Year 2, SDPP applicants were less likely to say submitting their application online through the GCOS portal was easy.
How difficult or easy was it to…?
| TOP2BOX (% RATED 4/5) | ||||||||||||||||||||||||
| TOTAL | EAF | NHSP | CSJ | SDPP | AS | WORBE | SSLP | WER | STAR | SIP | All but EAF, NHSP, CSJ | |||||||||||||
| Year 3 | Year 2 | Year 1 | Year 3 | Year 2 | Year 1 | Year 3 | Year 2 | Year 1 | Year 3 | Year 2 | Year 1 | Year 3 | Year 2 | Year 1 | Year 3 | Year 3 | Year 3 | Year 3 | Year 3 | Year 3 | Year 3 | Year 2 | Year 1 | |
| Base: All respondents – n= | 2488 | 1475 | 1067 | 204 | 116 | 30 | 1015 | 262 | 175 | 959 | 812 | 802 | 155 | 75 | 5** | 7** | 11* | 18* | 33 | 0 | 86 | 310 | 285 | 60 |
|---|---|---|---|---|---|---|---|---|---|---|---|---|---|---|---|---|---|---|---|---|---|---|---|---|
| Submit your application online for [PROGRAM] | 82% | 82% | 72% | 79% | 75% | 90% | 72% | 70% | 63% | 84% | 84% | 72% | 63% | 83% | 80% | 29% | 73% | 78% | 76% | - | 57% | 63% | 77% | 76% |
| Complete the steps of the application process for [PROGRAM] using the GCOS portal | 76% | n/a | n/a | 73% | n/a | n/a | 71% | n/a | n/a | 77% | n/a | n/a | 59% | n/a | n/a | 17% | 100% | 73% | 80% | - | 53% | 60% | n/a | n/a |
| Manage your active project using the GCOS portal (e.g., create, modify, and submit claim and activity reports, supporting documents, forecast of project expenditures, etc.) | 66% | n/a | n/a | 70% | n/a | n/a | 66% | n/a | n/a | 66% | n/a | n/a | 67% | n/a | n/a | - | 100% | 55% | 100% | - | - | 64% | n/a | n/a |
| Register for a Grants and Contributions Online Services (GCOS) account | 53% | n/a | n/a | 78% | n/a | n/a | 51% | n/a | n/a | 53% | n/a | n/a | 51% | n/a | n/a | 50% | 75% | 73% | 60% | - | 49% | 53% | n/a | n/a |
Q12. On a scale from 1 to 5, where 1 means “very difficult” and 5 means “very easy”, how difficult or easy was it to...
Base: Submitted application using online fillable form or using the Grants and Contributions Online Services (GCOS) online web portal
Note: values less than 3% not labelled
* small sample size
** very small sample size
Significantly higher / lower than total
Significantly higher / lower than Year 2
Contacted by Service Canada to Provide Additional Information – % Yes
- Just over one quarter (27%, -9 pts) of applicants were contacted by Service Canada to provide additional information to support their application, which is significantly lower than in Year 2 (36%).
- EAF and NHSP applicants were more likely to have been contacted, while CSJ applicants were less likely.
- Compared to Year 2, fewer NHSP, CSJ and SDPP applicants were contacted to provide additional information.
After you submitted your application, were you contacted by Service Canada to provide additional information to support your application? – % Yes

Click for larger view
Figure 62: Contacted by Service Canada to Provide Additional Information
This vertical bar chart shows responses to a question about whether the applicant was contacted by Service Canada after they submitted their application to provide additional information to support their application and presents results for Year 1, Year 2 and Year 3.
- Total: Year 3 27% contacted. A total of 3041 respondents answered this question. Year 2 36% contacted. Year 1 41% contacted.
- EAF: Year 3 47% contacted. A total of 300 respondents answered this question. Year 2 42% contacted. Year 1 39% contacted.
- NHSP: Year 3 46% contacted. A total of 1296 respondents answered this question. Year 2 52% contacted. Year 1 63% contacted.
- CSJ: Year 3 24% contacted. A total of 1004 respondents answered this question. Year 2 31% contacted. Year 1 38% contacted.
- SDPP: Year 3 24% contacted. A total of 214 respondents answered this question. Year 2 58% contacted. Year 1 53% contacted.
- AS: Year 3 64% contacted. A total of 11 respondents answered this question.
- WORBE: Year 3 32% contacted. A total of 22 respondents answered this question.
- SSLP: Year 3 46% contacted. A total of 24 respondents answered this question.
- WER: Year 3 20% contacted. A total of 51 respondents answered this question.
- STAR: Year 3 100% contacted. A total of 3 respondents answered this question.
- SIP: Year 3 25% contacted. A total of 116 respondents answered this question.
- ALL BUT EAF, NHSP, CSJ: Year 3 26% contacted. A total of 441 respondents answered this question. Year 2 45% contacted. Year 1 52% contacted.
Q13. After you submitted your application, were you contacted by Service Canada to provide additional information to support your application?
Base: All respondents
* small sample size
** very small sample size
Significantly higher / lower than total
Significantly higher / lower than Year 2
Reason for Contact by Service Canada
- Among those contacted by Service Canada, by far the most common reason was to clarify information on their application (57%, +2 pts), followed by missing documents or information (18%, -5 pts) or that the budget template needed modifications (13%, -2 pts). Fewer applicants reported being contacted by Service Canada to provide missing documents or information than in Year 2.
- EAF and SDPP applicants were more likely to report missing documents or information in their application or budget template modifications.
- Compared to Year 2, EAF, SDPP and applicants to all programs but EAF, NHSP and CSJ were more likely to report being contacted by Service Canada to make budget template modifications.
Why were you contacted by Service Canada?
| TOTAL | EAF | NHSP | CSJ | SDPP | AS | WORBE | SSLP | WER | STAR | SIP | All but EAF, NHSP, CSJ | |||||||||||||
| Year 3 | Year 2 | Year 1 | Year 3 | Year 2 | Year 1 | Year 3 | Year 2 | Year 1 | Year 3 | Year 2 | Year 1 | Year 3 | Year 2 | Year 1 | Year 3 | Year 3 | Year 3 | Year 3 | Year 3 | Year 3 | Year 3 | Year 2 | Year 1 | |
| Base: Contacted by Service Canada for additional information – n= | 1094 | 776 | 721 | 141 | 86 | 22* | 592 | 198 | 272 | 243 | 271 | 362 | 51 | 87 | 9** | 7** | 7** | 11* | 10* | 3** | 29* | 118 | 221 | 65 |
|---|---|---|---|---|---|---|---|---|---|---|---|---|---|---|---|---|---|---|---|---|---|---|---|---|
| Clarify information in my application | 57% | 55% | 52% | 55% | 58% | 64% | 45% | 46% | 51% | 60% | 59% | 52% | 47% | 46% | 56% | 29% | 29% | 18% | 60% | 33% | 41% | 42% | 47% | 71% |
| Missing documents or information in my application | 18% | 23% | 21% | 33% | 40% | 41% | 37% | 44% | 49% | 14% | 16% | 16% | 30% | 38% | 22% | 71% | 14% | - | 10% | - | 21% | 24% | 27% | 16% |
| Budget template needed modifications | 13% | 15% | 7% | 24% | 12% | 5% | 21% | 20% | 17% | 10% | 13% | 4% | 34% | 15% | 56% | 43% | 29% | 36% | 60% | 67% | 28% | 35% | 23% | 42% |
| An outstanding issue with a previous application | 2% | 2% | 1% | 1% | 5% | - | 1% | 1% | 2% | 2% | 3% | 0% | - | 1% | - | - | - | - | - | - | 3% | 1% | 2% | 0% |
| My organization or project was not eligible | 1% | 1% | 2% | 1% | 2% | 5% | 2% | 1% | 1% | 0% | 0% | 2% | 2% | 6% | - | - | - | 9% | - | - | 3% | 3% | 5% | 3% |
| Other reason | 17% | 12% | 30% | 6% | 9% | - | 12% | 8% | 7% | 19% | 13% | 35% | 13% | 16% | 11% | - | 29% | 27% | 20% | - | 7% | 12% | 17% | 15% |
| Don’t know | 9% | 4% | 3% | 5% | 1% | 9% | 2% | 5% | 1% | 11% | 4% | 3% | 8% | 4% | - | - | - | 9% | - | - | 10% | 7% | 4% | 0% |
Q14. Why were you contacted by Service Canada? Select all that apply.
Base: Those who were contacted by Service Canada to provide additional information
* small sample size
** very small sample size
Significantly higher / lower than total
Significantly higher / lower than Year 2
Key Differences by Intake type: Call for Proposals vs. Solicited
- Applicant organizations who were solicited to apply were less likely to have been satisfied with their service experience. Nearly seven in ten (76%) applicant organizations who responded to a call for proposals (which represents virtually all survey respondents) were satisfied compared to just over half (52%) of those who were solicited to apply.
- Applicant organizations who were solicited to apply were more likely to have experienced a problem, less likely to have received funding approval and less likely to be satisfied with the service provided through email support from a program officer or Service Canada office, mail, and telephone support from a Service Canada office. They were also more likely to be satisfied with the in-person service provided through a Service Canada office.
| OVERALL SATISFACTION (% RATED 4/5) | |
| CALL FOR PROPOSALS | SOLICITED |
| 68% | 52% |
| Year 3 | Year 3 |
| (n=2973) | (n=49) |
| TOTAL | CALL FOR PROPOSALS | SOLICITED | |
| Year 3 | Year 3 | Year 3 | |
| Experienced a Problem | |||
|---|---|---|---|
| % Yes | 26% | 26% | 42% |
| Funding Approval | |||
| % Approved | 79% | 79% | 37% |
| Service Channel Satisfaction | |||
| Email support from a Program Officer | 77% | 77% | 66% |
| GCOS web portal | 72% | 72% | 69% |
| Email support from a Service Canada office | 68% | 68% | 41% |
| Government of Canada website | 66% | 66% | 69% |
| 65% | 65% | 34% | |
| Telephone support from a Service Canada office | 62% | 62% | 24% |
| Service Canada office | 52% | 52% | 100% |
| 1 800 O-Canada phone line | 42% | 42% | - |
Significantly higher / lower than total
- Applicant organizations who were solicited to apply were more likely to have been in contact with SC 10 or more times during their service experience and were less likely to feel it was easy to complete the budget document or to agree it was clear what would happen next and when, to be confident in the issue resolution process and that the amount of time the process took was reasonable.
| TOTAL | CALL FOR PROPOSALS | SOLICITED | |
| Year 3 | Year 3 | Year 3 | |
| Total Number of Times Contacting SC | |||
|---|---|---|---|
| 1-3 times | 22% | 23% | 8% |
| 4-6 times | 23% | 23% | 14% |
| 7-9 times | 9% | 9% | 8% |
| 10+ times | 23% | 23% | 49% |
| Ease of Application Process (% Rated 4/5) | |||
| Understanding the requirements of the application | 74% | 74% | 69% |
| Putting together the information you needed to apply for [program] | 72% | 72% | 70% |
| Completing the narrative questions | 70% | 70% | 75% |
| Completing the budget document | 67% | 67% | 46% |
| Completing the project timeline | 75% | 75% | 69% |
| Meeting the requirements of the application process | 77% | 77% | 71% |
| Widest Gaps/ Shifts in Service Attributes (% Rated 4/5) | |||
| Throughout the process it was clear what would happen next and when it would happen | 64% | 64% | 40% |
| I was confident that any issues or problems would have been easily resolved | 67% | 67% | 49% |
| The amount of time it took was reasonable | 58% | 58% | 42% |
Top 5 driver of satisfaction
Significantly higher / lower than total
- Applicant organizations who were solicited to apply were more likely to be first-time applicants and to have applied to a different Gs&Cs program in the past five years. They were also more likely to be organizations that have been in operation for less than three years and to be in the not-for-profit sector.
| TOTAL | CALL FOR PROPOSALS | SOLICITED | |
| Year 3 | Year 3 | Year 3 | |
| Application frequency | |||
|---|---|---|---|
| First application | 10% | 10% | 77% |
| Applied once or twice before | 24% | 24% | 13% |
| Applied several times before | 26% | 26% | 6% |
| Apply for the same program on an annual basis | 39% | 39% | 2% |
| Applied to a different Gs&Cs program in the past five years | |||
| % Yes | 39% | 38% | 78% |
| Years in operation | |||
| Less than one year | 0% | 0% | 2% |
| One year to less than three years | 3% | 2% | 8% |
| Three years to less than five years | 5% | 5% | 8% |
| Five or more years | 92% | 92% | 83% |
| Sector | |||
| Not-for-profit (NET) | 70% | 70% | 96% |
| Public Sector (NET) | 16% | 16% | 14% |
| Private Sector (NET) | 27% | 27% | 14% |
Significantly higher / lower than total
Key Differences by Funding Type: Grants vs. Contributions
- Grant applicants were more likely to have been satisfied with their service experience, while those who applied to Contribution programs were less likely. Eight in ten (81%) of those who applied to Grant programs were satisfied compared to four in ten (39%) of those who applied to Contribution programs.
- Grant applicants were more likely to have been satisfied with the service provided through most channels and to have been in contact with Service Canada 1-3 times during their experience.
- Contributions applicants were more likely to have experienced a problem, less likely to have received funding approval and to have been satisfied with the service provided through virtually all channels. They also required a higher number of contacts with Service Canada during their experience.
| OVERALL SATISFACTION (% RATED 4/5) | |
| GRANTS | CONTRIBUTIONS |
| 81% | 39% |
| Year 3 | Year 3 |
| (n=1541) | (n=496) |
| TOTAL | GRANTS | CONTRIBUTIONS | |
| Year 3 | Year 3 | Year 3 | |
| Experienced a Problem | |||
|---|---|---|---|
| % Yes | 26% | 23% | 37% |
| Funding Approval | |||
| % Approved | 79% | 79% | 10% |
| Service Channel Satisfaction | |||
| Email support from a Program Officer | 77% | 81% | 55% |
| GCOS web portal | 72% | 74% | 59% |
| Email support from a Service Canada office | 68% | 72% | 37% |
| Government of Canada website | 66% | 71% | 54% |
| 65% | 67% | 26% | |
| Telephone support from a Service Canada office | 62% | 70% | 42% |
| Service Canada office | 52% | 73% | 49% |
| 1 800 O-Canada phone line | 42% | 57% | 30% |
| Total Number of Times Contacting SC | |||
| 1-3 times | 22% | 26% | 12% |
| 4-6 times | 23% | 23% | 13% |
| 7-9 times | 9% | 10% | 11% |
| 10+ times | 23% | 18% | 35% |
Significantly higher / lower than total
- Grant applicants were more likely to feel it was easy to determine in their organization was eligible for funding, understand information about the program, and determine the amount of time each phase of the application process is anticipated to take. They were also more likely to agree that it was clear what would happen next and when, that they needed to explain their situation only once and the amount of time the application took was reasonable. They were less likely to feel it was easy to determine the steps to apply and to feel that nearly all aspects of the application process were easy to complete.
- Contribution applicants were less likely to feel it was easy to navigate the Government of Canada website and to complete all aspects of the application process. They were also less likely to agree that it was clear what would happen next and when, that they needed to explain their situation only once and the amount of time the application took was reasonable.
| TOTAL | GRANTS | CONTRIBUTIONS | |
| Year 3 | Year 3 | Year 3 | |
| Ease of Navigating GoC website (% Rated 4/5) | |||
|---|---|---|---|
| Find general information about [program] | 82% | 83% | 70% |
| Understand the information about the program | 77% | 79% | 68% |
| Determine if your organization is eligible for funding | 80% | 83% | 77% |
| Determine the steps to apply for funding | 81% | 78% | 75% |
| Find out what information you need to provide when applying for [program] | 79% | 78% | 71% |
| Determine when the application period for [program] takes place | 79% | 80% | 73% |
| Determine the amount of time each phase of the application process is anticipated to take | 56% | 68% | 43% |
Ease of Application Process (% Rated 4/5) |
|||
| Understanding the requirements of the application | 74% | 73% | 59% |
| Putting together the information you needed to apply for [program] | 72% | 66% | 51% |
| Completing the narrative questions | 70% | 65% | 59% |
| Completing the budget document | 67% | 59% | 44% |
| Completing the project timeline | 75% | 71% | 57% |
| Meeting the requirements of the application process | 77% | 73% | 58% |
| Widest Gaps/ Shifts in Service Attributes (% Rated 4/5) | |||
| Throughout the process it was clear what would happen next and when it would happen | 64% | 75% | 37% |
| I needed to explain my situation only once | 65% | 74% | 44% |
| The amount of time it took was reasonable | 58% | 74% | 35% |
Top 5 driver of satisfaction
Significantly higher / lower than total
Key Differences by Grants or Contributions
- Contribution applicants were much more likely to be first-time applicants, and were also more likely to have applied to a different Gs&Cs program in the past five years. They were also more likely to be organizations in the not-for-profit sector.
- Grant applicants were more likely to be first-time applicants or to have applied once or twice before and to be organizations in the not-for-profit or public sectors.
| TOTAL | GRANTS | CONTRIBUTIONS | |
| Year 3 | Year 3 | Year 3 | |
| Application frequency | |||
|---|---|---|---|
| First application | 10% | 26% | 53% |
| Applied once or twice before | 24% | 35% | 22% |
| Applied several times before | 26% | 27% | 15% |
| Apply for the same program on an annual basis | 39% | 10% | 2% |
| Applied to a different Gs&Cs program in the past five years | |||
| % Yes | 39% | 32% | 66% |
| Years in operation | |||
| Less than one year | 0% | 0% | 0% |
| One year to less than three years | 3% | 3% | 3% |
| Three years to less than five years | 5% | 6% | 6% |
| Five or more years | 92% | 90% | 91% |
| Sector | |||
| Not-for-profit (NET) | 70% | 86% | 88% |
| Public Sector (NET) | 16% | 19% | 16% |
| Private Sector (NET) | 27% | 16% | 11% |
Significantly higher / lower than total
Post-application
Decision
Channel Use for Follow-up Before Receiving Decision
- Overall, fewer applicants contacted Service Canada before receiving a funding decision compared to Year 2. Of those who did, the most common reason was to check the status of their application (21%, -3 pts), followed by to find out timelines for receiving a funding decision (14%, unchanged) and to modify their application (8%, -1 pts). Fewer reported contacting Service Canada for a reason other than those provided compared to Year 2.
- Those applying to SDPP, WER and SIP were more likely to say they contacted Service Canada to check the status of their application or to find out timelines for receiving a funding decision. NHSP applicants were less likely to have contacted Service Canada for any reason.
- Compared to Year 2, EAF, NHSP and SDPP applicants were less likely to say they contacted Service Canada to check the status of their application, while NHSP were also less likely to have done so to find out timelines for a funding decision. CSJ applicants were less likely to have contacted SC to modify their application.
Did you contact Service Canada for any of the following reasons before receiving your funding decision?
| TOTAL | EAF | NHSP | CSJ | SDPP | AS | WORBE | SSLP | WER | STAR | SIP | All but EAF, NHSP, CSJ | |||||||||||||
| Year 3 | Year 2 | Year 1 | Year 3 | Year 2 | Year 1 | Year 3 | Year 2 | Year 1 | Year 3 | Year 2 | Year 1 | Year 3 | Year 2 | Year 1 | Year 3 | Year 3 | Year 3 | Year 3 | Year 3 | Year 3 | Year 3 | Year 2 | Year 1 | |
| Base: All respondents – n= | 3041 | 1942 | 1549 | 300 | 207 | 56 | 1296 | 384 | 431 | 1004 | 865 | 942 | 214 | 153 | 17* | 11* | 22* | 24* | 51 | 3** | 116 | 441 | 486 | 120 |
| To check the status of your application | 21% | 24% | 36% | 18% | 30% | 29% | 16% | 24% | 28% | 21% | 21% | 37% | 26% | 40% | 53% | 18% | 27% | 38% | 39% | 33% | 47% | 34% | 44% | 43% |
| To find out timelines for receiving a funding decision | 14% | 14% | 25% | 12% | 10% | 18% | 8% | 12% | 17% | 14% | 12% | 26% | 20% | 22% | 24% | 18% | 14% | 29% | 26% | - | 36% | 25% | 32% | 38% |
| To modify your application | 8% | 9% | 18% | 6% | 7% | 5% | 4% | 6% | 8% | 8% | 11% | 19% | 3% | 3% | 6% | - | - | 4% | - | - | 4% | 3% | 4% | 4% |
| To withdraw your application | 1% | 1% | 1% | 0% | - | - | 0% | 0% | - | 1% | 1% | 1% | 1% | - | - | - | 5% | - | - | - | - | 1% | - | 0% |
| Other reason | 4% | 13% | 13% | 4% | 13% | 11% | 4% | 15% | 13% | 4% | 13% | 13% | 7% | 10% | 18% | - | - | - | 2% | 33% | 3% | 5% | 11% | 11% |
| Don’t know | 2% | 51% | 34% | 3% | 47% | 55% | 3% | 50% | 43% | 2% | 53% | 32% | 5% | 41% | 24% | 27% | 9% | 8% | 2% | - | 2% | 4% | 33% | 30% |
| Did not contact Service Canada | 66% | n/a | n/a | 66% | n/a | n/a | 72% | n/a | n/a | 66% | n/a | n/a | 57% | n/a | n/a | 55% | 59% | 50% | 55% | 33% | 42% | 52% | n/a | n/a |
Q15. Did you contact Service Canada for any of the following reasons before receiving your funding decision? Select all that apply.
Base: All respondents
* small sample size
** very small sample size
Significantly higher / lower than total
Significantly higher / lower than Year 2
Ease of Follow-up
- Among those who followed up with Service Canada before receiving a funding decision, just over half (52%, -13 pts) said they found it easy to do so, which is significantly lower than in Year 2 (65%). While a quarter of them (26%, +14 pts) found it difficult to follow-up with Service Canada, significantly higher than Year 2.
- Those applying to all programs but EAF, NHSP, and CSJ and most notably SDPP and SIP applicants were less likely to have found it easy to follow-up.
- Compared to Year 2, CSJ and SDPP applicants were less likely to have found it easy to follow-up.
How was your experience following up with Service Canada about your application?

Click for larger view
Figure 63: Ease of Follow-up
This vertical bar chart shows responses to a question about how difficult or easy the applicant found the experience of following up with Service Canada about their application and presents results for Year 1, Year 2 and Year 3. Only those who indicated following up with Service Canada were asked this question. Respondents were asked to provide ratings on a 5-pt scale.
- Total: Year 3 23% very easy, 29% somewhat easy, 22% neutral, 14% somewhat difficult, 12% very difficult, 0% Don’t know. A total of 931 respondents answered this question. Year 2 35% very easy, 30% somewhat easy, 19% neutral, 7% somewhat difficult, 5% very difficult, 4% Don’t know. Year 1 29% very easy, 33% somewhat easy, 19% neutral, 10% somewhat difficult, 8% very difficult, 1% Don’t know.
- EAF: Year 3 62% very/somewhat easy. A total of 93 respondents answered this question. Year 2 67% very/somewhat easy. Year 1 72% very/somewhat easy.
- NHSP: Year 3 65% very/somewhat easy. A total of 328 respondents answered this question. Year 2 70% very/somewhat easy. Year 1 64% very/somewhat easy.
- CSJ: Year 3 53% very/somewhat easy. A total of 322 respondents answered this question. Year 2 67% very/somewhat easy. Year 1 62% very/somewhat easy.
- SDPP: Year 3 21% very/somewhat easy. A total of 80 respondents answered this question. Year 2 56% very/somewhat easy. Year 1 62% very/somewhat easy.
- AS: Year 3 0% very/somewhat easy. A total of 2 respondents answered this question.
- WORBE: Year 3 57% very/somewhat easy. A total of 7 respondents answered this question.
- SSLP: Year 3 40% very/somewhat easy. A total of 10 respondents answered this question.
- WER: Year 3 18% very/somewhat easy. A total of 22 respondents answered this question.
- STAR: Year 3 0% very/somewhat easy. A total of 2 respondents answered this question.
- SIP: Year 3 34% very/somewhat easy. A total of 65 respondents answered this question.
- ALL BUT EAF, NHSP, CSJ: Year 3 27% very/somewhat easy. A total of 188 respondents answered this question. Year 2 47% very/somewhat easy. Year 1 51% very/somewhat easy.
Q16. On a scale from 1 to 5, where 1 is ‘very difficult’ and 5 is ‘very easy’, how was your experience following up with Service Canada about your application?
Base: Followed-up with Service Canada before receiving funding decision
Note: values less than 3% not labelled
* small sample size
** very small sample size
Top 5 driver of satisfaction
Significantly higher / lower than total
Method of Funding Decision Notification
- Seven in ten (71%, -5 pts) applicants were notified of their funding decision by email, followed by just over two in ten (22%, -1 pt) by their local MP and more than one in ten by telephone (14%, +3 pts). Compared to Year 2, fewer reported being notified by email while a greater proportion said they had not received a decision.
- EAF, NHSP, and SDPP applicants were more likely to have been notified by email, while CSJ applicants were also more likely to say through their local MP and EAF applicants by telephone. SIP applicants were more likely to say they had not received a decision.
- Compared to Year 2, NHSP applicants were more likely to have been notified by email and CSJ applicants by telephone, while CSJ and SDPP applicants were more likely to say they had not received a decision.
How were you notified of the funding decision about your application for [PROGRAM]?
| TOTAL | EAF | NHSP | CSJ | SDPP | AS | WORBE | SSLP | WER | STAR | SIP | All but EAF, NHSP, CSJ | |||||||
| Year 3 | Year 2 | Year 3 | Year 2 | Year 3 | Year 2 | Year 3 | Year 2 | Year 3 | Year 2 | Year 3 | Year 3 | Year 3 | Year 3 | Year 3 | Year 3 | Year 3 | Year 2 | |
| Base: All respondents – n= | 3041 | 1942 | 300 | 207 | 1296 | 384 | 1004 | 865 | 214 | 153 | 11* | 22* | 24* | 51 | 3** | 116 | 441 | 486 |
|---|---|---|---|---|---|---|---|---|---|---|---|---|---|---|---|---|---|---|
| By email | 71% | 76% | 77% | 72% | 83% | 77% | 69% | 76% | 79% | 86% | 91% | 77% | 54% | 80% | 33% | 65% | 74% | 81% |
| From my local Member of Parliament (MP) | 22% | 23% | 8% | 5% | 17% | 21% | 23% | 26% | 5% | 6% | 18% | 5% | 33% | - | - | 7% | 6% | 9% |
| By telephone | 14% | 11% | 25% | 35% | 11% | 12% | 14% | 9% | 4% | 18% | - | 9% | 13% | - | - | 5% | 4% | 17% |
| Online through your GCOS account | 6% | 7% | 2% | 2% | 5% | 3% | 7% | 9% | 7% | 3% | 9% | - | - | 2% | - | 4% | 5% | 4% |
| By mail | 3% | 4% | 2% | 4% | 5% | 7% | 3% | 3% | 4% | 7% | - | 5% | 4% | 2% | - | 4% | 4% | 4% |
| By receiving a direct deposit | 1% | 2% | 1% | 2% | 4% | 3% | 1% | 2% | 2% | 5% | - | - | - | - | - | 1% | 1% | 3% |
| I did not receive a funding decision | 14% | 8% | 2% | 2% | 2% | 5% | 15% | 9% | 9% | 1% | - | 18% | 8% | 18% | 67% | 24% | 15% | 4% |
Q17. How were you notified of the funding decision about your application for [INSERT PROGRAM]? Please select all that apply.
Note: “Online through [PROGRAM] web portal in 2020 has been changed to “Online through your GCOS account”. *Comparisons to Year 1 cannot be made due to a change in question logic to select all that apply from select one.
* small sample size
** very small sample size
Significantly higher / lower than total
Funding Approval and Satisfaction
- Over seven in ten (73%, -9 pts) applicants who received funding approval were satisfied with their experience, compared to just under half (49%, +2 pts) of those who did not receive approval. Compared to Year 2, satisfaction has decreased among those who received approval for funding.
- NHSP and EAF applicants who received approval were more likely to be satisfied compared to all applicants who were approved, while SDPP and AS applicants who received funding were less likely. Applicants to NHSP who were not approved were also more likely to be satisfied compared to all clients who were denied, while applicants to SDPP, WER and SIP who were not approved were less likely. Compared to Year 2, overall satisfaction decreased among those who were approved for funding from NHSP, CSJ and SDPP, while NHSP applicants who did not receive approval were more likely to be satisfied.
- Overall, eight in ten survey respondents received approval for funding (79%, -14 pts), statistically lower than the figure reported in Year 2. Applicants to EAF, SDPP, WER and SIP were less likely to have received funding approval compared to all clients, while NHSP and CSJ applicants were more likely. Compared to Year 2, fewer applicants across all comparable programs reported having received approval for funding.
How satisfied or dissatisfied were you with the overall service you received from Service Canada from getting information about [PROGRAM] to receiving a funding decision?
| TOTAL | EAF | NHSP | CSJ | SDPP | AS | WORBE | SSLP | WER | STAR | SIP | |||||||||||
| Year 3 | Year 2 | Year 1 | Year 3 | Year 2 | Year 1 | Year 3 | Year 2 | Year 1 | Year 3 | Year 2 | Year 1 | Year 3 | Year 2 | Year 1 | Year 3 | Year 3 | Year 3 | Year 3 | Year 3 | Year 3 | |
| Base: All respondents – n= | 3041 | 1820 | 1491 | 300 | 203 | 56 | 1296 | 364 | 392 | 1004 | 784 | 926 | 214 | 151 | 17* | 11* | 22* | 24* | 51 | 3** | 116 |
|---|---|---|---|---|---|---|---|---|---|---|---|---|---|---|---|---|---|---|---|---|---|
| % top2box satisfaction (% rated 4/5) | |||||||||||||||||||||
| Approved | 73% | 82% | 74% | 84% | 86% | 90% | 86% | 90% | 85% | 72% | 81% | 73% | 52% | 74% | 62% | 38% | 100% | 56% | 75% | - | 50% |
| Denied | 49% | 47% | 41% | 55% | 56% | 50% | 65% | 40% | 39% | 51% | 64% | 41% | 38% | 50% | 25% | 33% | - | - | 24% | 33% | 27% |
| % approved or denied | |||||||||||||||||||||
| Approved | 79% | 93% | 90% | 60% | 79% | 68% | 80% | 88% | 82% | 83% | 97% | 92% | 9% | 90% | 77% | 73% | 9% | 75% | 24% | - | 2% |
| Denied | 20% | 7% | 10% | 31% | 21% | 32% | 20% | 12% | 18% | 17% | 3% | 8% | 76% | 10% | 23% | 27% | - | 17% | 75% | 100% | 97% |
Q31. On a scale from 1 to 5, where 1 means very dissatisfied and 5 means very satisfied, how satisfied or dissatisfied were you with the overall service you received from Service Canada from getting information about [INSERT PROGRAM] to receiving a funding decision?
* small sample size
** very small sample size
Top 5 driver of satisfaction
Significantly higher / lower than total
Significantly higher / lower than Year 2
Qualitative Findings: The Impact of Receiving Funding

Overall, the most positive and most significant impact of receiving funding was on communities served by the organizations, as members of those communities were able to access services and supports they needed.
“We could run two programs at the same time. One is we provide the kids camp program for deaf and hard of hearing kids throughout the summer. But the other half of our program is hiring deaf and hard of hearing youth and training them to become employable.”
“Quand on avait reçu le premier financement, ça nous avait permis de jumeler nos aînés avec des aînés d'autres nationalités, surtout des aînés d'origine canadienne, avec des aînés d'autres origines. Donc, ça les a sortis de leur isolement. C'est un apport critique, vraiment critique”
Explanation Provided for Not Receiving Funding Approval – % Yes
- Among those who did not receive approval, just over one in ten (13%, -29 pts) were provided with an explanation why, statistically lower than in Year 2 (42%).
- EAF, NHSP and SDPP applicants were more likely to have received an explanation, while CSJ applicants were less likely.
- Compared to Year 2, applicants to all comparable programs were less likely to have received an explanation why of they did not receive funding.
You indicated that your organization did not receive an approval for funding. Did you receive an explanation why? – % Yes

Click for larger view
Figure 64: Explanation Provided for Not Receiving Funding Approval
This vertical bar chart shows responses to a question about whether applicants who were denied funding received an explanation why and presents results for Year 1, Year 2 and Year 3. Only applicants who were denied funding approval were asked this question.
- Total: Year 3 13% yes. A total of 845 respondents answered this question. Year 2 42% yes. Year 1 46% yes.
- EAF: Year 3 31% yes. A total of 94 respondents answered this question. Year 2 52% yes. Year 1 67% yes.
- NHSP: Year 3 28% yes. A total of 262 respondents answered this question. Year 2 46% yes. Year 1 48% yes.
- CSJ: Year 3 8% yes. A total of 172 respondents answered this question. Year 2 36% yes. Year 1 44% yes.
- SDPP: Year 3 23% yes. A total of 156 respondents answered this question. Year 2 67% yes. Year 1 25% yes.
- AS: Year 3 33% yes. A total of 3 respondent answered this question.
- WORBE: Year 3 0% yes. A total of 0 respondents answered this question.
- SSLP: Year 3 0% yes. A total of 4 respondents answered this question.
- WER: Year 3 13% yes. A total of 38 respondents answered this question.
- STAR: Year 3 33% yes. A total of 3 respondents answered this question.
- SIP: Year 3 17% yes. A total of 113 respondents answered this question.
- ALL BUT EAF, NHSP, CSJ: Year 3 20% yes. A total of 317 respondents answered this question. Year 2 40% yes. Year 1 30% yes.
[IF FUNDING STATUS = DENIED] Q19. Did your organization receive an explanation why you did not receive an approval for funding?“
Base: Did not receive funding approval
* small sample size
** very small sample size
Significantly higher / lower than total
Significantly higher / lower than Year 2
Satisfaction with Explanation Provided
- Among those who were provided an explanation for why their organization did not receive funding, three in ten (29%, -6 pts) said they were satisfied with the explanation, which is statistically consistent with Year 2 (36%).
- Due to small sample sizes, there were no statistically significant differences in satisfaction by the program.
- Compared to Year 2, NHSP applicants who did not receive funding were more likely to be satisfied with the explanation provided.
How dissatisfied or satisfied were you with the explanation of the decision?

Click for larger view
Figure 65: Satisfaction with Explanation Provided
This vertical bar chart shows responses to a question about how satisfied the applicant was with the explanation provided for why their organization did not receive funding approval and presents results for Year 1, Year 2 and Year 3. Only applicants who were denied funding approval and provided an explanation why were asked this question. Respondents were asked to provide ratings on a 5-pt scale.
- Total: Year 3 9% very satisfied, 20% somewhat satisfied, 22% neutral, 20% somewhat dissatisfied, 29% very dissatisfied, 1% Don’t know. A total of 178 respondents answered this question. Year 2 11% very satisfied, 24% somewhat satisfied, 22% neutral, 16% somewhat dissatisfied, 27% very dissatisfied, 1% Don’t know. Year 1 7% very satisfied, 17% somewhat satisfied, 25% neutral, 31% somewhat dissatisfied, 19% very dissatisfied, 1% Don’t know.
- EAF: Year 3 28% very/somewhat satisfied. A total of 29 respondents answered this question. Year 2 55% very/somewhat satisfied. Year 1 17% very/somewhat satisfied.
- NHSP: Year 3 36% very/somewhat satisfied. A total of 73 respondents answered this question. Year 2 10% very/somewhat satisfied. Year 1 12% very/somewhat satisfied.
- CSJ: Year 3 29% very/somewhat satisfied. A total of 14 respondents answered this question. Year 2 67% very/somewhat satisfied. Year 1 29% very/somewhat satisfied.
- SDPP: Year 3 19% very/somewhat satisfied. A total of 36 respondent answered this question. Year 2 30% very/somewhat satisfied. Year 1 0% very/somewhat satisfied.
- AS: Year 3 100% very/somewhat satisfied. A total of 1 respondent answered this question.
- WORBE: Year 3 0% very/somewhat satisfied. A total of 0 respondent answered this question.
- SSLP: Year 3 0% very/somewhat satisfied. A total of 0 respondent answered this question.
- WER: Year 3 20% very/somewhat satisfied. A total of 5 respondent answered this question.
- STAR: Year 3 0% very/somewhat satisfied. A total of 1 respondent answered this question.
- SIP: Year 3 32% very/somewhat satisfied. A total of 19 respondent answered this question.
- ALL BUT EAF, NHSP, CSJ: Year 3 24% very/somewhat satisfied. A total of 62 respondents answered this question. Year 2 14% very/somewhat satisfied. Year 1 0% very/somewhat satisfied.
Q20. On a scale from 1 to 5, where 1 is ‘very dissatisfied’ and 5 is ‘very satisfied’, how dissatisfied or satisfied were you with the explanation of the decision?
Base: Did not receive funding approval and received an explanation why
* small sample size
** very small sample size
Significantly higher / lower than total
Significantly higher / lower than Year 2
Changes Made During Negotiation of Funding Agreement
- Among those who received funding approval, just over one quarter (27%) had to make changes to their project timelines, followed by two in ten who had to make changes to their project scope (21%) and one in ten changes to project funding (12%). Fewer applicants had to make changes to project activities (6%) or COVID-19 related changes (5%). Compared to Year 2, fewer applicants who received approval reported having to make all types of changes.
- Applicants to all programs other than EAF, NHSP and CSJ who received approval were more likely to say they had to make all types of changes, while NHSP and EAF applicants were less likely say they had to make changes to the project timelines or scope and were more likely to mention changes to project activities. NHSP applicants were also more likely to have had to make COVID-19 related changes.
- Compared to Year 2, SDPP applicants were more likely to have had to make all types of changes, while CSJ applicants and to a lesser extent NHSP were less likely.
Once your program began and the details of the funding agreement were finalized with [PROGRAM], did you have to work with a Service Canada Program Officer to make any of the following changes to your project and/or submit an amendment to the funding agreement?

Click for larger view
Figure 66: Changes Made During Negotiation of Funding Agreement
This horizontal bar chart presents responses to a question about whether the applicant had to make changes to their project and/or submit an amendment to the funding agreement when details of the funding agreement were finalized and presents results for Year 3. Only applicants approved for funding were asked this question.
- Total: Year 3 27% changes to their project timeline. 21% changes to your project scope. 12% changes to project funding. 6% changes to project activities. 5% COVID-19 related changes. 8% other. A total of 2106 respondents answered this question.
| YEAR 3 TOTAL | TOTAL | EAF | NHSP | CSJ | SDPP | AS | WORBE | SSLP | WER | STAR | SIP | All but EAF, NHSP, CSJ | ||||||
| Year 2 | Year 3 | Year 2 | Year 3 | Year 2 | Year 3 | Year 2 | Year 3 | Year 2 | Year 3 | Year 3 | Year 3 | Year 3 | Year 3 | Year 3 | Year 3 | Year 2 | ||
| (n=1604) | (n=180) | (n=161) | (n=1033) | (n=320) | (n=832) | (n=759) | (n=19*) | (n=136) | (n=8**) | (n=2**) | (n=18*) | (n=12*) | (n=0) | (n=2**) | (n=61) | (n=364) | ||
| Changes to project timelines | 27% | 36% | 19% | 13% | 15% | 24% | 28% | 39% | 54% | 29% | 75% | 50% | 78% | 42% | - | 50% | 59% | 43% |
|---|---|---|---|---|---|---|---|---|---|---|---|---|---|---|---|---|---|---|
| Changes to your project scope | 21% | 26% | 14% | 13% | 16% | 18% | 21% | 27% | 53% | 19% | 63% | - | 72% | 42% | - | 100% | 57% | 31% |
| Changes to project funding | 12% | 16% | 9% | 9% | 8% | 9% | 12% | 15% | 64% | 27% | 50% | 50% | 72% | 42% | - | 50% | 59% | 38% |
| Changes to project activities | 6% | 13% | 11% | 11% | 10% | 18% | 5% | 11% | 47% | 9% | 75% | - | 44% | 25% | - | - | 42% | 19% |
| Covid-19 related changes | 5% | 25% | 6% | 10% | 11% | 35% | 5% | 25% | 20% | 10% | - | - | 6% | 8% | - | 50% | 13% | 25% |
| Other reason | 8% | 8% | 4% | 4% | 5% | 3% | 8% | 10% | 6% | 8% | 38% | - | 17% | 8% | - | - | 12% | 10% |
Q22. Once your project began and the details of the funding agreement were finalized with [INSERT PROGRAM], did you have to work with a Service Canada Program Officer to request changes to your project and/or submit an amendment to the funding agreement? Examples could include changes to project timelines, project description, budget, etc.
Base: Received approval for program funding (n=2106)
* small sample size
** very small sample size
Significantly higher / lower than total
Significantly higher / lower than Year 2
Amount of Time it Took to Make Changes
- Among those who had to make changes, the vast majority were able to complete them within a week (ranging from 75% to 86%) and around six in ten were made in under three days (except for changes to project funding).
- Compared to Year 2, those who had to make changes to project funding were more likely to say it required one week to complete, while fewer who had to make changes to project scope, COVID-19 related changes and other types of changes said they needed more than a week.
How long did the following take to complete?

Click for larger view
Figure 67: Amount of Time It Took to Make Changes
This horizontal bar chart shows responses to a question about how long it took to make changes to their project or submit an amendment to the funding agreement and presents results for Year 3 and Year 2. Only applicants who had to made changes to project or submit an amendment to the funding agreement were asked this question. Sample sizes vary by task:
- Changes to project timeline: Year 3 More than 7 days 16%. 4 to 7 days 23%. 2 to 3 days 36%. 1 day 25%. A total of 455 respondents answered this question. Year 2 More than 7 days 22%. 4 to 7 days 28%. 2 to 3 days 29%. 1 day 21%.
- Changes to your project scope: Year 3 More than 7 days 14%. 4 to 7 days 29%. 2 to 3 days 28%. 1 day 29%. A total of 401 respondents answered this question. Year 2 More than 7 days 24%. 4 to 7 days 25%. 2 to 3 days 27%. 1 day 25%.
- COVID-19 related changes: Year 3 More than 7 days 15%. 4 to 7 days 29%. 2 to 3 days 32%. 1 day 25%. A total of 174 respondents answered this question. Year 2 More than 7 days 29%. 4 to 7 days 24%. 2 to 3 days 30%. 1 day 18%.
- Changes to project funding: Year 3 More than 7 days 20%. 4 to 7 days 40%. 2 to 3 days 21%. 1 day 19%. A total of 231 respondents answered this question. Year 2 More than 7 days 29%. 4 to 7 days 24%. 2 to 3 days 26%. 1 day 21%.
- Changes to project activities: Year 3 More than 7 days 15%. 4 to 7 days 29%. 2 to 3 days 35%. 1 day 21%. A total of 188 respondents answered this question. Year 2 More than 7 days 27%. 4 to 7 days 27%. 2 to 3 days 27%. 1 day 19%.
- Other reasons: Year 3 More than 7 days 26%. 4 to 7 days 16%. 2 to 3 days 32%. 1 day 27%. A total of 132 respondents answered this question. Year 2 More than 7 days 42%. 4 to 7 days 18%. 2 to 3 days 21%. 1 day 20%.
Q23. How long did the following take to complete? If you are uncertain, please provide your best guess.
Base: Had to make changes to project or submit an amendment to funding agreement (n=varies)
* small sample size
** very small sample size
Significantly higher / lower than total
Significantly higher / lower than Year 2
Amount of Time it Took to Make Changes by Program
- Although base sizes were small, changes to EAF projects generally took more time to complete, particularly for other types of changes, COVID-19 related changes and to a lesser extent changes to project timelines and funding. Compared to Year 2, a higher proportion of those who had to make changes to project scope were able to complete them in 4 to 7 days.
- Similar to overall trends, the vast majority of changes to NHSP projects were resolved within a week, however, changes to project scope and timelines took longer compared to all those who had to make these changes.
How long did the following take to complete?

Click for larger view
Figure 68: Amount of Time It Took to Make Changes for EAF Applications
This vertical bar chart shows responses to a question about how long it took to make changes to their project or submit an amendment to the funding agreement among EAF applicants. Sample sizes vary by task and only applicants who had to made changes to a project or submit an amendment to the funding agreement were asked this question. EAF applicants presents results for Year 3 and Year 2 as follows:
- Changes to project scope: Year 3 More than 7 days 28%. 4 to 7 days 32%. 2 to 3 days 32%. 1 day 8%. A total of 25 respondents answered this question. Year 2 More than 7 days 38%. 4 to 7 days 5%. 2 to 3 days 29%. 1 day 29%.
- Changes to project timeline: Year 3 More than 7 days 41%. 4 to 7 days 12%. 2 to 3 days 35%. 1 day 12%. A total of 34 respondents answered this question. Year 2 More than 7 days 33%. 4 to 7 days 14%. 2 to 3 days 24%. 1 day 29%.
- Changes to project activities: Year 3 More than 7 days 30%. 4 to 7 days 15%. 2 to 3 days 15%. 1 day 40%. A total of 20 respondents answered this question. Year 2 More than 7 days 50%. 4 to 7 days 11%. 2 to 3 days 17%. 1 day 22%.
- Changes to project funding: Year 3 More than 7 days 41%. 4 to 7 days 18%. 2 to 3 days 24%. 1 day 18%. A total of 17 respondents answered this question. Year 2 More than 7 days 57%. 4 to 7 days 7%. 2 to 3 days 7%. 1 day 29%.
- COVID-19 related changes: Year 3 More than 7 days 60%. 4 to 7 days 30%. 2 to 3 days 10%. 1 day 0%. A total of 10 respondents answered this question. Year 2 More than 7 days 38%. 4 to 7 days 31%. 2 to 3 days 6%. 1 day 25%.
- Other reasons: Year 3 More than 7 days 75%. 4 to 7 days 0%. 2 to 3 days 13%. 1 day 13%. A total of 8 respondents answered this question. Year 2 More than 7 days 17%. 4 to 7 days 0%. 2 to 3 days 0%. 1 day 83%.

Click for larger view
Figure 68-1: Amount of Time It Took to Make Changes for NHSP Applications
This vertical bar chart shows responses to a question about how long it took to make changes to their project or submit an amendment to the funding agreement among NHSP applicants. Sample sizes vary by task and only applicants who had to made changes to a project or submit an amendment to the funding agreement were asked this question. NHSP applicants presents results for Year 3 and Year 2 as follows:
- Changes to project scope: Year 3 More than 7 days 19%. 4 to 7 days 32%. 2 to 3 days 27%. 1 day 22%. A total of 163 respondents answered this question. Year 2 More than 7 days 29%. 4 to 7 days 21%. 2 to 3 days 27%. 1 day 23%.
- Changes to project timeline: Year 3 More than 7 days 23%. 4 to 7 days 31%. 2 to 3 days 28%. 1 day 18%. A total of 154 respondents answered this question. Year 2 More than 7 days 32%. 4 to 7 days 20%. 2 to 3 days 29%. 1 day 20%.
- Changes to project activities: Year 3 More than 7 days 22%. 4 to 7 days 32%. 2 to 3 days 26%. 1 day 20%. A total of 98 respondents answered this question. Year 2 More than 7 days 29%. 4 to 7 days 22%. 2 to 3 days 29%. 1 day 20%.
- Changes to project funding: Year 3 More than 7 days 18%. 4 to 7 days 28%. 2 to 3 days 33%. 1 day 21%. A total of 82 respondents answered this question. Year 2 More than 7 days 28%. 4 to 7 days 17%. 2 to 3 days 41%. 1 day 14%.
- COVID-19 related changes: Year 3 More than 7 days 31%. 4 to 7 days 23%. 2 to 3 days 32%. 1 day 15%. A total of 117 respondents answered this question. Year 2 More than 7 days 30%. 4 to 7 days 20%. 2 to 3 days 30%. 1 day 20%.
- Other reasons: Year 3 More than 7 days 30%. 4 to 7 days 20%. 2 to 3 days 26%. 1 day 24%. A total of 46 respondents answered this question. Year 2 More than 7 days 50%. 4 to 7 days 0%. 2 to 3 days 30%. 1 day 20%.
Q23. How long did the following take to complete? If you are uncertain, please provide your best guess.
Base: Had to make changes to project or submit an amendment to funding agreement (n=varies)
* small sample size
** very small sample size
Significantly higher / lower than total
- Changes to CSJ projects were generally resolved within one week and in most cases were resolved within 3 days. Compared to Year 2, fewer who had to make changes to project scope, COVID-19 related changes or other types of changes said it took more than a week to complete, while a higher proportion who had to make changes to project funding said it took 4 to 7 days.
- Changes to SDPP projects generally took longer to resolve and in particular changes to project scope or timelines and COVID-19 related changes.
How long did the following take to complete?

Click for larger view
Figure 69: Amount of Time It Took to Make Changes for CSJ Applications
This vertical bar chart shows responses to a question about how long it took to make changes to their project or submit an amendment to the funding agreement among CSJ applicants. Sample sizes vary by task and only applicants who had to made changes to a project or submit an amendment to the funding agreement were asked this question. CSJ applicants presents results for Year 3 and Year 2 as follows:
- Changes to project scope: Year 3 More than 7 days 13%. 4 to 7 days 29%. 2 to 3 days 29%. 1 day 30%. A total of 178 respondents answered this question. Year 2 More than 7 days 22%. 4 to 7 days 25%. 2 to 3 days 27%. 1 day 26%.
- Changes to project timeline: Year 3 More than 7 days 15%. 4 to 7 days 23%. 2 to 3 days 37%. 1 day 26%. A total of 230 respondents answered this question. Year 2 More than 7 days 19%. 4 to 7 days 29%. 2 to 3 days 30%. 1 day 22%.
- Changes to project activities: Year 3 More than 7 days 11%. 4 to 7 days 30%. 2 to 3 days 39%. 1 day 21%. A total of 44 respondents answered this question. Year 2 More than 7 days 24%. 4 to 7 days 30%. 2 to 3 days 27%. 1 day 19%.
- Changes to project funding: Year 3 More than 7 days 19%. 4 to 7 days 42%. 2 to 3 days 20%. 1 day 20%. A total of 96 respondents answered this question. Year 2 More than 7 days 25%. 4 to 7 days 25%. 2 to 3 days 28%. 1 day 22%.
- COVID-19 related changes: Year 3 More than 7 days 10%. 4 to 7 days 30%. 2 to 3 days 33%. 1 day 28%. A total of 40 respondents answered this question. Year 2 More than 7 days 27%. 4 to 7 days 25%. 2 to 3 days 30%. 1 day 18%.
- Other reasons: Year 3 More than 7 days 24%. 4 to 7 days 16%. 2 to 3 days 33%. 1 day 27% A total of 70 respondents answered this question. Year 2 More than 7 days 42%. 4 to 7 days 19%. 2 to 3 days 21%. 1 day 18%.

Click for larger view
Figure 69-1: Amount of Time It Took to Make Changes for SDPP Applications
This vertical bar chart shows responses to a question about how long it took to make changes to their project or submit an amendment to the funding agreement among SDPP applicants. Sample sizes vary by task and only applicants who had to made changes to a project or submit an amendment to the funding agreement were asked this question. SDPP applicants presents results for Year 3 and Year 2 as follows:
- Changes to project scope: Year 3 More than 7 days 63%. 4 to 7 days 11%. 2 to 3 days 9%. 1 day 18%. A total of 10 respondents answered this question. Year 2 More than 7 days 29%. 4 to 7 days 26%. 2 to 3 days 17%. 1 day 29%.
- Changes to project timeline: Year 3 More than 7 days 53%. 4 to 7 days 21%. 2 to 3 days 17%. 1 day 9%. A total of 10 respondents answered this question. Year 2 More than 7 days 34%. 4 to 7 days 21%. 2 to 3 days 22%. 1 day 24%.
- Changes to project activities: Year 3 More than 7 days 44%. 4 to 7 days 24%. 2 to 3 days 22%. 1 day 10%. A total of 9 respondents answered this question. Year 2 More than 7 days 48%. 4 to 7 days 18%. 2 to 3 days 18%. 1 day 16%.
- Changes to project funding: Year 3 More than 7 days 36%. 4 to 7 days 32%. 2 to 3 days 18%. 1 day 14%. A total of 12 respondents answered this question. Year 2 More than 7 days 28%. 4 to 7 days 23%. 2 to 3 days 12%. 1 day 37%.
- COVID-19 related changes: Year 3 More than 7 days 53%. 4 to 7 days 24%. 2 to 3 days 0%. 1 day 24%. A total of 4 respondents answered this question. Year 2 More than 7 days 81%. 4 to 7 days 2%. 2 to 3 days 2%. 1 day 16%.
- Other reasons: Year 3 More than 7 days 0%. 4 to 7 days 0%. 2 to 3 days 100%. 1 day 0%. A total of 1 respondent answered this question. Year 2 More than 7 days 46%. 4 to 7 days 9%. 2 to 3 days 27%. 1 day 18%.
Q23. How long did the following take to complete? If you are uncertain, please provide your best guess.
Base: Had to make changes to project or submit an amendment to funding agreement (n=varies)
* small sample size
** very small sample size
Significantly higher / lower than total
- Though both programs have very small sample sizes, changes to AS and WORBE projects generally took more than a week to complete.
How long did the following take to complete?

Click for larger view
Figure 70: Amount of Time It Took to Make Changes for AS Applications
This vertical bar chart shows responses to a question about how long it took to make changes to their project or submit an amendment to the funding agreement among AS applicants. Sample sizes vary by task and only applicants who had to made changes to a project or submit an amendment to the funding agreement were asked this question. AS applicants presents results for Year 3 as follows:
- Changes to project scope: Year 3 More than 7 days 80%. 4 to 7 days 20%. 2 to 3 days 0%. 1 day 0%. A total of 5 respondents answered this question.
- Changes to project timeline: Year 3 More than 7 days 83%. 4 to 7 days 17%. 2 to 3 days 0%. 1 day 0%. A total of 6 respondents answered this question.
- Changes to project activities: Year 3 More than 7 days 83%. 4 to 7 days 17%. 2 to 3 days 0%. 1 day 0%. A total of 6 respondents answered this question.
- Changes to project funding: Year 3 More than 7 days 100%. 4 to 7 days 0%. 2 to 3 days 0%. 1 day 0%. A total of 4 respondents answered this question.
- COVID-19 related changes: Year 3 N/A.
- Other reasons: Year 3 More than 7 days 67%. 4 to 7 days 0%. 2 to 3 days 33%. 1 day 0% A total of 3 respondents answered this question.

Click for larger view
Figure 70-1: Amount of Time It Took to Make Changes for WORBE Applications
This vertical bar chart shows responses to a question about how long it took to make changes to their project or submit an amendment to the funding agreement among WORBE applicants. Sample sizes vary by task and only applicants who had to made changes to a project or submit an amendment to the funding agreement were asked this question. WORBE applicants presents results for Year 3 as follows:
- Changes to project scope: Year 3 N/A.
- Changes to project timeline: Year 3 More than 7 days 100%. A total of 1 respondent answered this question.
- Changes to project activities: Year 3 N/A.
- Changes to project funding: Year 3 More than 7 days 100%. A total of 1 respondent answered this question.
- COVID-19 related changes: Year 3 N/A.
- Other reasons: Year 3 N/A.
Q23. How long did the following take to complete? If you are uncertain, please provide your best guess.
Base: Had to make changes to project or submit an amendment to funding agreement (n=varies)
* small sample size
** very small sample size
Significantly higher / lower than total
- Though both programs have very small sample sizes, roughly half of the changes to SSLP projects took more than a week.
- Changes to WER projects were generally resolved within a week.
How long did the following take to complete?

Click for larger view
Figure 71: Amount of Time It Took to Make Changes for SSLP Applications
This vertical bar chart shows responses to a question about how long it took to make changes to their project or submit an amendment to the funding agreement among SSLP applicants. Sample sizes vary by task and only applicants who had to made changes to a project or submit an amendment to the funding agreement were asked this question. SSLP applicants presents results for Year 3 as follows:
- Changes to project scope: Year 3 More than 7 days 46%. 4 to 7 days 15%. 2 to 3 days 39%. 1 day 0%. A total of 13 respondents answered this question.
- Changes to project timeline: Year 3 More than 7 days 50%. 4 to 7 days 14%. 2 to 3 days 36%. 1 day 0%. A total of 14 respondents answered this question.
- Changes to project activities: Year 3 More than 7 days 63%. 4 to 7 days 0%. 2 to 3 days 38%. 1 day 0%. A total of 8 respondents answered this question.
- Changes to project funding: Year 3 More than 7 days 54%. 4 to 7 days 15%. 2 to 3 days 31%. 1 day 0%. A total of 13 respondents answered this question.
- COVID-19 related changes: Year 3 2 to 3 days 100%. A total of 1 respondent answered this question.
- Other reasons: Year 3 2 to 3 days 100%. A total of 3 respondents answered this question.

Click for larger view
Figure 71-1: Amount of Time It Took to Make Changes for WER Applications
This vertical bar chart shows responses to a question about how long it took to make changes to their project or submit an amendment to the funding agreement among WER applicants. Sample sizes vary by task and only applicants who had to made changes to a project or submit an amendment to the funding agreement were asked this question. WER applicants presents results for Year 3 as follows:
- Changes to project scope: Year 3 More than 7 days 40%. 4 to 7 days 20%. 2 to 3 days 20%. 1 day 20%. A total of 5 respondents answered this question.
- Changes to project timeline: Year 3 More than 7 days 40%. 4 to 7 days 40%. 2 to 3 days 0%. 1 day 20%. A total of 5 respondents answered this question.
- Changes to project activities: Year 3 More than 7 days 33%. 4 to 7 days 0%. 2 to 3 days 33%. 1 day 33%. A total of 3 respondents answered this question.
- Changes to project funding: Year 3 More than 7 days 100%. A total of 5 respondents answered this question.
- COVID-19 related changes: Year 3 More than 7 days 100%. A total of 1 respondent answered this question.
- Other reasons: Year 3 More than 7 days 100%. A total of 1 respondent answered this question.
Q23. How long did the following take to complete? If you are uncertain, please provide your best guess.
Base: Had to make changes to project or submit an amendment to funding agreement (n=varies)
* small sample size
** very small sample size
Significantly higher / lower than total
- Though caution should be exercised due to very small sample sizes, changes to SIP projects generally took longer than a week to be resolved.
- There were no STAR applicants who reported having to make changes.
How long did the following take to complete?

Click for larger view
Figure 72: Amount of Time It Took to Make Changes for SIP Applications
This vertical bar chart shows responses to a question about how long it took to make changes to their project or submit an amendment to the funding agreement among SIP applicants. Sample sizes vary by task and only applicants who had to made changes to a project or submit an amendment to the funding agreement were asked this question. SIP applicants present results for Year 3 as follows:
- Changes to project scope: Year 3 More than 7 days 100%. A total of 2 respondents answered this question.
- Changes to project timeline: Year 3 More than 7 days 100%. A total of 1 respondent answered this question.
- Changes to project activities: Year 3 N/A.
- Changes to project funding: Year 3 More than 7 days 100%. A total of 1 respondent answered this question.
- COVID-19 related changes: Year 3 2 to 3 days 100%. A total of 1 respondent answered this question.
- Other reasons: Year 3 N/A.
Q23. How long did the following take to complete? If you are uncertain, please provide your best guess.
Base: Had to make changes to project or submit an amendment to funding agreement (n=varies)
* small sample size
** very small sample size
Significantly higher / lower than total
Post-Agreement
Monitoring, Follow-up, and Close-Out
Ease of Funding Agreement Close-Out
- Among applicants approved for funding, a strong majority felt each aspect of the funding agreement closeout was easy and overall ratings were consistent with Year 2 (however, fewer felt each aspect was very easy).
- Seven in ten applicants felt that it was easy to submit the final budget (70%, unchanged), complete the final project report (70%, -1 pt), submit the final project report (70%, -1 pts), and complete the final budget/final claim (68%, -1 pt). Fewer felt it was easy to resolve any outstanding issues with funding (49%, -2 pts).
How would you rate the following tasks related to your funding agreement with [PROGRAM]?

Click for larger view
Figure 73: Ease of Funding Agreement Close-out
This horizontal bar chart shows responses to a question about how difficult or easy the applicant found different tasks required to close out their funding agreement and presents results for Year 1, Year 2 and Year 3. All 2106 Year 3 respondents who received funding approval answered as follows:
- Submitting the final budget: Year 3 27% very easy, 43% somewhat easy, 17% neutral, 3% somewhat difficult, 1% very difficult, 9% not applicable. 70% easy. Year 2 70% easy. Year 1 72% easy.
- Completing the final project report: Year 3 27% very easy, 43% somewhat easy, 17% neutral, 3% somewhat difficult, 1% very difficult, 9% not applicable. 70% easy. Year 2 71% easy. Year 1 72% easy.
- Submitting the final project report: Year 3 28% very easy, 41% somewhat easy, 17% neutral, 3% somewhat difficult, 1% very difficult, 9% not applicable. 70% easy. Year 2 71% easy. Year 1 73% easy.
- Completing the final budget: Year 3 27% very easy, 41% somewhat easy, 18% neutral, 4% somewhat difficult, 1% very difficult, 9% not applicable. 68% easy. Year 2 69% easy. Year 1 70% easy.
- Resolving any outstanding issues with funding: Year 3 19% very easy, 30% somewhat easy, 13% neutral, 3% somewhat difficult, 2% very difficult, 32% not applicable. 49% easy. Year 2 51% easy. Year 1 51% easy.
Q24. On a scale of 1 to 5, where 1 is ‘very difficult’ and 5 is ‘very easy’, how would you rate the following tasks related to your funding agreement with [INSERT PROGRAM]? Select one response per item or select not applicable if you did not have to complete the task as part of your agreement.
Base: Received approval for program funding (n=2106)
Note: values less than 3% not labelled
*small sample size
**very small sample size
Ease of Funding Agreement Close-Out by Program
- NHSP applicants were more likely to find it easy to complete most aspects of the funding agreement closeout, while EAF applicants and those who applied to all programs except for EAF, NHSP and CSJ were less likely.
- Compared to Year 2, those who received funding from EAF and NHSP were more likely to feel it was easy to submit the final report, while NHSP applicants were also more likely to say it was easy to complete the final report and EAF applicants to submit the final budget. CSJ applicants were less likely to feel it was easy to submit and complete the final report and complete the final budget/claim.
How would you rate the following tasks related to your funding agreement with [PROGRAM]?
| Top2box (% rated 4/5) | ||||||||||||||||||||||||
| TOTAL | EAF | NHSP | CSJ | SDPP | AS | WORBE | SSLP | WER | STAR | SIP | All but EAF, NHSP, CSJ | |||||||||||||
| Year 3 | Year 2 | Year 1 | Year 3 | Year 2 | Year 1 | Year 3 | Year 2 | Year 1 | Year 3 | Year 2 | Year 1 | Year 3 | Year 2 | Year 1 | Year 3 | Year 3 | Year 3 | Year 3 | Year 3 | Year 3 | Year 3 | Year 2 | Year 1 | |
| Base: Received funding approval – n= | 2106 | 1604 | 1304 | 180 | 161 | 38 | 1033 | 320 | 323 | 832 | 759 | 848 | 19* | 136 | 13* | 8* | 2** | 18* | 12* | 0 | 2** | 61 | 364 | 95 |
|---|---|---|---|---|---|---|---|---|---|---|---|---|---|---|---|---|---|---|---|---|---|---|---|---|
| Submitting the final project report and/or program-specific requirement(s) | 70% | 71% | 73% | 49% | 33% | 61% | 75% | 68% | 67% | 70% | 77% | 74% | 30% | 32% | 54% | 50% | 50% | 50% | 17% | - | - | 33% | 36% | 56% |
| Completing the final project report and/or program-specific requirement(s) | 70% | 71% | 72% | 47% | 36% | 55% | 73% | 65% | 66% | 70% | 77% | 73% | 16% | 29% | 46% | 38% | 50% | 44% | 25% | - | - | 27% | 33% | 52% |
| Submitting the final budget | 70% | 70% | 72% | 56% | 42% | 71% | 71% | 68% | 67% | 71% | 74% | 72% | 20% | 41% | 46% | 38% | 50% | 67% | 25% | - | - | 34% | 42% | 53% |
| Completing the final budget/final claim | 68% | 69% | 70% | 51% | 41% | 66% | 69% | 66% | 68% | 69% | 74% | 71% | 31% | 38% | 39% | 38% | 50% | 39% | 17% | - | - | 30% | 39% | 50% |
| Resolving any outstanding issues with funding | 49% | 51% | 51% | 34% | 29% | 47% | 48% | 46% | 51% | 50% | 54% | 51% | 38% | 27% | 46% | 13% | 50% | 50% | 33% | - | 100% | 40% | 34% | 50% |
Q24. On a scale of 1 to 5, where 1 is ‘very difficult’ and 5 is ‘very easy’, how would you rate the following tasks related to your funding agreement with [INSERT PROGRAM]? Select one response per item or select not applicable if you did not have to complete the task as part of your agreement.
Base: Received approval for program funding (n=2106)
* small sample size
** very small sample size
Significantly higher / lower than total
Significantly higher / lower than Year 2
Service Standards
Awareness of Service Standards
- More than four in ten applicants (44%, -4 pts) were aware of the stated service standards regarding issuing payment once a payment claim has been submitted, followed by fewer than four in ten (37%, -6 pts) for acknowledging the submission of a funding application and one third (33%, -6 pts) for issuing a funding decision notification. Compared to Year 2, awareness of the service standard for time to acknowledge submission and issue a funding decision declined.
- NHSP applicants were more likely to be aware of all service standards and EAF applicants of the time to issue a decision, while applicants to SDPP were less likely to be aware of all service standards and SIP applicants of the time to issue payment.
- Compared to Year 2, EAF applicants were more likely to be aware of the time to issue a decision, while applicants to CSJ were less likely (along with the time to acknowledge the submission). SDPP applicants were less likely to be aware of the time to issue payment.
Before today, were you aware of each of these service standards? – % Yes

Click for larger view
Figure 74: Awareness of Service Standards
This horizontal bar chart shows responses to a question about whether the applicant was aware of service standards related to the time to acknowledge the submission and time to issue payment in and presents results for Year 3. Results were reported based on those who said yes, they were aware.
- Total: 37% time to acknowledge the submission of a funding application, 33% time to issue a funding decision notification, 44% time to issue payment once payment claim is submitted. A total of 3041 respondents answered this question.
| % YES | |||||||||||||||||
| TOTAL | EAF | NHSP | CSJ | SDPP | AS | WORBE | SSLP | WER | STAR | SIP | All but EAF, NHSP, CSJ | ||||||
| Year 2 | Year 3 | Year 2 | Year 3 | Year 2 | Year 3 | Year 2 | Year 3 | Year 2 | Year 3 | Year 3 | Year 3 | Year 3 | Year 3 | Year 3 | Year 3 | Year 2 | |
| (n=1942) | (n=300) | (n=207) | (n1296) | (n=384) | (n=1004) | (n=865) | (n=214) | (n=153) | (n=11*) | (n=22*) | (n=24*) | (n=51) | (n=3*) | (n=116) | (n=441) | (n=486) | |
| Time to acknowledge the submission of a funding application (within 14 calendar days of receiving your application package) | 43% | 40% | 42% | 44% | 49% | 36% | 42% | 29% | 36% | 27% | 50% | 29% | 47% | 67% | 38% | 35% | 40% |
|---|---|---|---|---|---|---|---|---|---|---|---|---|---|---|---|---|---|
| Time to issue a funding decision notification (within 84 to 154 calendar days from the date it was received or the end date of the intake process, depending on the intake method and program stream) | 39% | 43% | 33% | 46% | 51% | 31% | 38% | 25% | 25% | 18% | 36% | 13% | 35% | 33% | 29% | 27% | 29% |
| Time to issue payment once payment claim is submitted (for contributions, within 14 calendar days of receiving your completed claim package / for grants, within 14 calendar days of the approved project start date) | 48% | 48% | 47% | 51% | 53% | 44% | 47% | 31% | 42% | 18% | 41% | 21% | 39% | 33% | 35% | 33% | 41% |
Q33. Before today, were you aware of each of these service standards?
Base: All respondents (n=3041). Note: Service Canada commits to meeting three (3) service standards 80% of the time (under normal circumstances). “Time to issue a funding decision notification” was new in fiscal year 2021/22 and may not have been in place when the organization applied.
* small sample size
** very small sample size
Significantly higher / lower than total
Impact of Awareness of Service Standards – Acknowledge Proposal
- Applicants who were aware of the service standard for the time to acknowledge the submission were more likely to be satisfied with their experience overall than those who were not. They were more satisfied with the service provided through the Government of Canada website and telephone phone support from a Service Canada office and were less likely to report having experienced a problem or issue. They were also more likely to provide high ratings for several aspects of service, in particular for timeliness of service, clarity of the process, helpfulness of SC phone representatives, clarity and confidence in the issue resolution process, receiving consistent information and ease of getting help.
- Compared to Year 2, applicants of both groups were less likely to be satisfied with their experience overall and provided lower ratings for the timeliness of service, clarity of process overall and regarding issue resolution and ease of getting help. Applicants who were not aware of the service standard for the time to acknowledge the submission also provided lower ratings for receiving consistent information, for the service provided through all service channels and were more likely to have experienced a problem.
| Overall satisfaction (% rated 4/5) |
|||||
|---|---|---|---|---|---|
| Year 3 | Year 2 | Year 1 | Year 3 | Year 2 | Year 1 |
| Aware | Not Aware | ||||
| 76% | 83% | 80% | 64% | 73% | 64% |
| Aware | Not Aware | |||||
|---|---|---|---|---|---|---|
| Year 3 | Year 2 | Year 1 | Year 3 | Year 2 | Year 1 | |
| Experienced a problem |
||||||
| % Yes |
20% | 18% | 26% | 30% | 26% | 39% |
| Service channel satisfaction |
||||||
| Email support from a Program Officer | 83% | 83% | 87% | 74% | 83% | 77% |
| GCOS web portal | 76% | 78% | 74% | 70% | 78% | 63% |
| Government of Canada website | 73% | 74% | 75% | 63% | 74% | 61% |
| Email support from a Service Canada office | 71% | 74% | 74% | 67% | 74% | 60% |
| Telephone support from a Service Canada office | 73% | 67% | 68% | 56% | 67% | 58% |
| Aware | Not Aware | |||||
|---|---|---|---|---|---|---|
| Year 3 | Year 2 | Year 1 | Year 3 | Year 2 | Year 1 | |
| Widest gap in service attributes (% rated 4/5 vs. Total) |
||||||
| The amount of time it took was reasonable | 69% | 76% | 71% | 52% | 76% | 49% |
| Throughout the process it was clear what would happen next and when it would happen | 74% | 78% | 74% | 59% | 78% | 50% |
| Service Canada phone representatives were helpful | 76% | 72% | 80% | 62% | 66% | 68% |
| It was clear what to do if I had a problem or question | 73% | 78% | 75% | 60% | 64% | 54% |
| I received consistent information | 80% | 80% | 81% | 68% | 73% | 67% |
| I was confident that any issues or problems would have been easily resolved | 74% | 76% | 75% | 63% | 66% | 57% |
| It was easy to get help when I needed it | 70% | 75% | 73% | 59% | 65% | 55% |
Note: Figures for ‘[PROGRAM] web portal’ is reported in Year 1 and compared with ‘GCOS web portal’ in Year 2.
Top 5 driver of satisfaction
Significantly higher / lower than total
Significantly higher / lower than Year 2
Impact of Awareness of Service Standards – Decision Notification
- Applicants who were aware of the service standard for the time to issue a funding decision were more likely to be satisfied with their experience overall than those who were not. They were more satisfied with all service channels they used and were less likely to report having experienced a problem or issue. They were also more likely to provide high ratings for several aspects of service including the timeliness of service, clarity of the process overall, ease of getting help, confidence in and clarity of the issue resolution process and needing to explain their situation only once.
- Compared to Year 2, applicants of both groups were less likely to be satisfied with their experience overall. Applicants who were aware of the service standard for the time to issue a funding decision were less likely to have experienced a problem, were more satisfied with the service provided through telephone support from a Service Canada office but provided lower ratings for needing to explain their situation only once. Those not aware provided lower ratings for the service provided through the GoC website and for several aspects of service including timeliness of service, clarity of the process overall and regarding issue resolution, ease of getting help, and were also more likely to have experienced a problem.
| Overall satisfaction (% rated 4/5) |
|||
|---|---|---|---|
| Year 3 | Year 2 | Year 3 | Year 2 |
| Aware | Not Aware | ||
| 81% | 85% | 62% | 73% |
| Aware | Not Aware | |||
| Year 3 | Year 2 | Year 3 | Year 2 | |
| Experienced a problem |
||||
|---|---|---|---|---|
| % Yes |
16% | 19% | 31% | 24% |
| Service channel satisfaction |
||||
| Email support from a Program Officer | 88% | 84% | 72% | 74% |
| GCOS web portal | 81% | 82% | 68% | 72% |
| Government of Canada website | 78% | 75% | 61% | 68% |
| Email support from a Service Canada office | 73% | 75% | 66% | 66% |
| Telephone support from a Service Canada office | 73% | 65% | 56% | 58% |
| Aware | Not Aware | |||
| Year 3 | Year 2 | Year 3 | Year 2 | |
| Widest gap in service attributes (% rated 4/5 vs. Total) |
||||
|---|---|---|---|---|
| The amount of time it took was reasonable. | 75% | 77% | 50% | 60% |
| Throughout the process it was clear what would happen next and when it would happen | 80% | 80% | 57% | 63% |
| It was easy to get help when I needed it | 77% | 80% | 57% | 65% |
| It was clear what to do if I had a problem or question | 78% | 79% | 58% | 65% |
| I needed to explain my situation only once | 77% | 73% | 60% | 63% |
| I was confident that any issues or problems would have been easily resolved | 77% | 78% | 62% | 66% |
New question added in Year 2 to measure awareness of service standard for decision notification.
Note: Figures for ‘[PROGRAM] web portal’ is reported in Year 1 and compared with ‘GCOS web portal’ in Year 2.
Top 5 driver of satisfaction
Significantly higher / lower than total
Significantly higher / lower than Year 2
Impact of Awareness of Service Standards – Issue Payment
- Applicants who were aware of the service standard for the time to issue payment were more likely to be satisfied with their experience overall than those who were not. They were more satisfied with all service channels they used and were less likely to report having experienced a problem or issue. They were also more likely to provide high ratings for several aspects of service including the clarity of the process overall, timeliness of service, ease of getting help, confidence in and clarity of the issue resolution process and needing to explain their situation only once.
- Compared to Year 2, applicants of both groups were less likely to be satisfied with their experience overall and provided lower ratings for the timeliness of service, ease of getting help and clarity of the issue resolution process; both groups were also more likely to have experienced a problem. Applicants who were aware of the service standard for the time to issue payment also provided lower ratings for the service provided through email support from a SC office and for confidence in the issue resolution process, while those who were not aware also gave lower ratings for the clarity of process overall.
| Overall satisfaction (% rated 4/5) |
|||||
|---|---|---|---|---|---|
| Year 3 | Year 2 | Year 1 | Year 3 | Year 2 | Year 1 |
| Aware | Not Aware | ||||
| 76% | 84% | 78% | 62% | 71% | 65% |
| Aware | Not Aware | |||||
|---|---|---|---|---|---|---|
| Year 3 | Year 2 | Year 1 | Year 3 | Year 2 | Year 1 | |
| Experienced a problem |
||||||
| % Yes |
20% | 17% | 26% | 31% | 27% | 40% |
| Service channel satisfaction |
||||||
| Email support from a Program Officer | 83% | 83% | 85% | 73% | 73% | 78% |
| GCOS web portal | 78% | 79% | 73% | 68% | 73% | 63% |
| Email support from a Service Canada office | 72% | 77% | 75% | 65% | 64% | 59% |
| Government of Canada website | 72% | 75% | 75% | 63% | 67% | 61% |
| Telephone support from a Service Canada office | 71% | 65% | 66% | 55% | 56% | 59% |
| Aware | Not Aware | |||||
|---|---|---|---|---|---|---|
| Year 3 | Year 2 | Year 1 | Year 3 | Year 2 | Year 1 | |
| Widest gap in service attributes (% rated 4/5 vs. Total) |
||||||
| Throughout the process it was clear what would happen next and when it would happen. | 75% | 77% | 74% | 56% | 62% | 50% |
| The amount of time it took, from when I started gathering information to when I got a decision on my application, was reasonable. | 68% | 75% | 69% | 51% | 58% | 49% |
| It was easy to get help when I needed it. | 73% | 77% | 74% | 56% | 62% | 54% |
| It was clear what to do if I had a problem or question. | 74% | 80% | 76% | 58% | 62% | 54% |
| I needed to explain my situation only once | 74% | 74% | 74% | 59% | 61% | 56% |
| I was confident that any issues or problems would have been easily resolved | 75% | 79% | 76% | 61% | 63% | 56% |
Note: Figures for ‘[PROGRAM] web portal’ is reported in Year 1 and compared with ‘GCOS web portal’ in Year 2.
Top 5 driver of satisfaction
Significantly higher / lower than total
Significantly higher / lower than Year 2
GBA+
Communities Supported by Funding Application
- Nine in ten applicants (90%) reported that the funding they applied for would support at least one of the communities, clients or people outlined, statistically lower than in Year 2 (97%).
- Seven in ten (71%) applicant organizations said the funding would support those who identify as youth, followed by women (56%), those belonging to a minority racial or ethnic background (49%), low socio-economic status (45%), Black Canadians (40%) and those who identify as Indigenous (39%). Compared to Year 2, fewer applicants indicated that funding would support most of the groups outlined, particularly those belonging to a minority racial or ethnic background and Black Canadians.
- EAF, NHSP, SDPP, WER and SIP applicants were more likely to say that funding would support at least once of the groups outlined, while CSJ applicants were less likely. Notably, SDPP and to a lesser extent WER and SIP applicants were more likely to support multiple groups.
- Compared to Year 2, a higher proportion of SDPP applicants reported that funding would support several groups outlined, while CSJ applicants were less likely. EAF applicants were more likely to report that funding would support those belonging to a minority racial or ethnic group, those who identify as Indigenous, those who identify as newcomers and those who identify as an immigrant.
Would the funding you applied for assist any of the following communities, clients or people?
| TOTAL UP | EAF | NHSP | CSJ | SDPP | AS | WORBE | SSLP | WER | STAR | SIP | All but EAF, NHSP, CSJ | |||||||||||||
| Year 3 | Year 2 | Year 1 | Year 3 | Year 2 | Year 1 | Year 3 | Year 2 | Year 1 | Year 3 | Year 2 | Year 1 | Year 3 | Year 2 | Year 1 | Year 3 | Year 3 | Year 3 | Year 3 | Year 3 | Year 3 | Year 3 | Year 2 | Year 1 | |
| Base: All respondents – n= | 3041 | 1942 | 1549 | 300 | 207 | 56 | 1296 | 384 | 431 | 1004 | 865 | 942 | 214 | 153 | 17* | 11* | 22* | 24* | 51 | 3** | 116 | 441 | 486 | 120 |
|---|---|---|---|---|---|---|---|---|---|---|---|---|---|---|---|---|---|---|---|---|---|---|---|---|
| At least one (NET) | 90% | 97% | - | 95% | 98% | - | 98% | 99% | - | 88% | 96% | - | 99% | 100% | - | 100% | 100% | 100% | 100% | 100% | 97% | 98% | 98% | - |
| Those who identify as youth | 71% | 73% | - | 53% | 44% | - | 27% | 28% | - | 76% | 83% | - | 74% | 75% | - | 64% | 59% | 100% | 51% | 100% | 60% | 68% | 72% | - |
| Those who identify as women | 56% | 63% | 64% | 54% | 47% | 43% | 59% | 60% | 63% | 55% | 64% | 65% | 67% | 65% | 53% | 91% | 73% | 63% | 100% | 100% | 78% | 74% | 70% | 68% |
| Those who identify as belonging to a minority racial or ethnic background | 49% | 62% | 58% | 52% | 39% | 32% | 50% | 51% | 56% | 48% | 64% | 58% | 69% | 81% | 47% | 91% | 73% | 79% | 84% | 100% | 69% | 72% | 76% | 68% |
| Those who identify as a low socio-economic status | 45% | 53% | - | 49% | 44% | - | 60% | 55% | - | 42% | 52% | - | 75% | 61% | - | 36% | 50% | 79% | 77% | 100% | 54% | 68% | 65% | - |
| Those who identify as Black Canadians | 40% | 52% | 45% | 36% | 32% | 29% | 32% | 35% | 38% | 40% | 54% | 46% | 58% | 96% | 18% | 82% | 64% | 71% | 65% | 100% | 55% | 59% | 74% | 51% |
| Those who identify as Indigenous | 39% | 45% | 48% | 47% | 33% | 38% | 33% | 35% | 41% | 38% | 47% | 48% | 52% | 21% | 35% | 100% | 68% | 71% | 57% | 100% | 66% | 59% | 48% | 60% |
| Those who identify as having a mental or physical disability | 35% | 43% | 42% | 81% | 84% | 91% | 48% | 49% | 51% | 32% | 40% | 40% | 59% | 28% | 47% | 55% | 55% | 63% | 41% | 100% | 43% | 53% | 43% | 58% |
| Those who identify as lesbians, gay, bisexuals, queers or other sexual minorities | 35% | 40% | - | 30% | 31% | - | 28% | 32% | - | 35% | 42% | - | 44% | 27% | - | 82% | 36% | 58% | 43% | 100% | 50% | 47% | 39% | - |
| Those who identify as newcomers to Canada | 33% | 41% | - | 42% | 32% | - | 42% | 38% | - | 31% | 40% | - | 57% | 67% | - | 73% | 41% | 71% | 61% | 100% | 51% | 56% | 59% | - |
Q34. Would the funding you applied for assist any of the following communities, clients or people?
* small sample size
** very small sample size
Significantly higher / lower than total
Significantly higher / lower than Year 2
Would the funding you applied for assist any of the following communities, clients or people?
| TOTAL | EAF | NHSP | CSJ | SDPP | AS | WORBE | SSLP | WER | STAR | SIP | All but EAF, NHSP, CSJ | |||||||||||||
| Year 3 | Year 2 | Year 1 | Year 3 | Year 2 | Year 1 | Year 3 | Year 2 | Year 1 | Year 3 | Year 2 | Year 1 | Year 3 | Year 2 | Year 1 | Year 3 | Year 3 | Year 3 | Year 3 | Year 3 | Year 3 | Year 3 | Year 2 | Year 1 | |
| Base: All respondents – n= | 3041 | 1942 | 1549 | 300 | 207 | 56 | 1296 | 384 | 431 | 1004 | 865 | 942 | 214 | 153 | 17* | 11* | 22* | 24* | 51 | 3** | 116 | 441 | 486 | 120 |
|---|---|---|---|---|---|---|---|---|---|---|---|---|---|---|---|---|---|---|---|---|---|---|---|---|
| At least one (NET) | 90% | 97% | - | 95% | 98% | - | 98% | 99% | - | 88% | 96% | - | 99% | 100% | - | 100% | 100% | 100% | 100% | 100% | 97% | 98% | 98% | - |
| Those who identify as trans, non-binary, other gender, gender-diverse or queer people | 33% | 37% | - | 31% | 30% | - | 24% | 28% | - | 33% | 39% | - | 47% | 25% | - | 82% | 32% | 63% | 45% | 100% | 50% | 49% | 38% | - |
| Those who identify as Two-Spirited or Indigenous LGBTQIA+ people | 29% | 33% | - | 28% | 25% | - | 23% | 27% | - | 29% | 35% | - | 41% | 16% | - | 82% | 36% | 63% | 43% | 100% | 50% | 46% | 32% | - |
| Those who identify as an immigrant or a non-permanent resident | 28% | 35% | - | 41% | 28% | - | 37% | 37% | - | 26% | 33% | - | 52% | 58% | - | 46% | 36% | 58% | 53% | 100% | 45% | 50% | 51% | - |
| Those who identify as senior | 27% | 37% | - | 39% | 71% | - | 95% | 96% | - | 19% | 26% | - | 38% | 43% | - | 9% | 23% | 8% | 24% | 33% | 29% | 32% | 29% | - |
| English or French-language minority community | 25% | 29% | - | 28% | 24% | - | 25% | 31% | - | 25% | 29% | - | 32% | 29% | - | 27% | 36% | 46% | 33% | 100% | 36% | 35% | 31% | - |
| Those who identify as belonging to a religious group | 25% | 27% | 32% | 25% | 30% | 30% | 21% | 25% | 34% | 25% | 27% | 32% | 19% | 36% | 24% | 18% | 9% | 25% | 24% | 67% | 15% | 19% | 29% | 27% |
| Those who are experiencing homelessness and/or currently unhoused | 14% | 17% | - | 15% | 21% | - | 17% | 16% | - | 13% | 16% | - | 40% | 23% | - | 9% | 14% | 38% | 35% | 67% | 23% | 33% | 27% | - |
| Those who identify as veterans | 13% | 17% | - | 19% | 31% | - | 30% | 34% | - | 12% | 13% | - | 17% | 15% | - | 9% | 5% | 8% | 10% | 67% | 18% | 16% | 13% | - |
| None of the above | 10% | 3% | - | 5% | 2% | - | 2% | 1% | - | 12% | 4% | - | 1% | - | 6% | - | - | - | - | - | 3% | 2% | 2% | - |
Q34. Would the funding you applied for assist any of the following communities, clients or people?
* small sample size
** very small sample size
Significantly higher / lower than total
Significantly higher / lower than Year 2
Profile of Applicants Who Assist GBA+ Communities
- Overall satisfaction remained consistent among applicants who assist GBA+ communities and those who do not but has declined among those who assist GBA+ communities compared to Year 2.
- Ratings across most aspects of service were consistent between groups; however applicants who assist GBA+ communities were more likely to provide high ratings for the ease of navigating the GoC website including finding and understanding information about the program and determining if their organization was eligible for funding. They were also more likely to agree that they were able to find the information they needed during the aware stage in a reasonable amount of time.
- Applicants who assist GBA+ communities also had a greater number of contacts with Service Canada during their experience, were more likely to operate or intend on providing services in the West/ Territories and Ontario, were less likely to be solely responsible for the funding application, were more likely to be a non-for-profit organization (and less likely to be in the private sector) and were more likely to have 50 or more employees or volunteers.
| Overall satisfaction (% rated 4/5) |
|||||
|---|---|---|---|---|---|
| Assist GBA+ | Do Not | ||||
| Year 3 | Year 2 | Year 1 | Year 3 | Year 2 | Year 1 |
| 66% | 77% | 70% | 73% | 73% | 69% |
PROMINENT DIFFERENCES AMONG APPLICANTS WHO ASSIST GBA+ COMMUNITIES (COMPARED TO THOSE WHO DO NOT)
- Those who assist GBA+ communities were more likely to provide high ratings for the ease of navigating the GoC website (compared to those who do not):
- Find general information about the program (84% vs. 69%)
- Understand information about the program (79% vs. 62%)
- Determine if your organization is eligible for funding (82% vs. 69%)
- A greater ability to find the information they needed (online, in person, or by phone) during the aware stage within a reasonable amount of time (78% vs. 70%)
- A higher number of contacts with Service Canada (27% were in contact 10 times or more vs. 10%)
- More likely to operate and intend on providing services in the West/ Territories (34% and 36% vs. 22% and 22%) and Ontario (37% and 37% vs. 21% and 21%)
- Less likely to be solely responsible for completing the funding application (68% vs. 87%)
- More likely to be not-for-profit (75% vs. 52%) and less likely to be in the private sector (23% vs. 43%)
- More likely to have 50 or more employees (17% vs. 9%) or volunteers (18% vs. 8%)
Experienced Discrimination in Application Process
- Overall, 2% of applicants reported having felt discriminated against on the basis of identity during their experience with Service Canada, which is consistent with Year 2 (3%). Among those who felt discriminated, the most common grounds were religion or race and compared to Year 1 a greater proportion cite religion while applicants were less likely to mention race or colour.
- SDPP, WER and SIP applicants were more likely to have felt discriminated against on the basis of identity.
Thinking about your experience with Service Canada, throughout the entire application process, have you ever felt discriminated against on the basis of your identity? On which grounds did you feel discriminated against?

Click for larger view
Figure 75: Experienced Discrimination in Application Process.
This horizontal bar chart shows responses to a question about whether the applicant felt discriminated against on the basis of their identity through the application process and presents results for Year 1, Year 2 and Year 3. A total of 3041 Year 2 respondents answered this question.
- Total: Year 3 2% of respondents felt discriminated against. Year 2 3%. Year 1 2%.
- Religious identity: Year 3 35%. Year 2 9%. Year 1 28%.
- Race: Year 3 27%. Year 2 50%. Year 1 30%.
- National or ethnic origin: Year 3 14%. Year 2 19%. Year 1 19%.
- Colour: Year 3 13%. Year 2 32%. Year 1 0%.
- Language: Year 3 10%. Year 2 21%. Year 1 13%.
- Age: Year 3 7%. Year 2 8%. Year 1 8%.
- Family status: Year 3 6%. Year 2 3%. Year 1 0%.
- Gender identity or expression: Year 3 6%. Year 2 0%. Year 1 0%.
- Sexual orientation: Year 3 5%. Year 2 1%. Year 1 0%.
- Sex: Year 3 5%. Year 2 11%. Year 1 7%.
- Ability/disability: Year 3 4%. Year 2 5%. Year 1 9%.
- Marital status: Year 3 1%. Year 2 3%. Year 1 0%.
- Genetic characteristics: Year 3 1%. Year 2 0%. Year 1 0%.
- A conviction for which a pardon or record suspension was granted: Year 3 0%. Year 2 1%. Year 1 0%.
- Other: Year 3 23%. Year 2 16%. Year 1 24%.
Q43. Thinking about your experience with Service Canada, throughout the entire application process, have you ever felt discriminated against on the basis of your identity?
Q44. On which grounds did you feel discriminated against? Select all that apply.
Note: these questions were optional and applicants were not required to provide a response.
Significantly higher / lower than Year 2
Analysis By Applicant Groups
Key differences by region, program complexity, application frequency, number of employees and industry sector
Overall Satisfaction by Region (Operate in)
- At three-quarters (76%), applicant organizations which operate in Quebec reported the highest level of satisfaction with their experience and were more likely to be satisfied compared to all clients. More than seven in ten (73%) organizations in Atlantic Canada were satisfied, followed by two-thirds (67%) of those in Ontario, and six in ten (59%) applicant organizations in the West or Territories which was lower compared to all clients.
- Compared to Year 2, satisfaction has decreased among applicant organizations which operate in all regions.
Note: Applicants were asked about the province or territory where their organization operates and where it would deliver project activities to better understand regional variation in results.
Service Canada operates in 5 regions however given applicants would be unaware of where their applications were processed it is difficult to capture regional satisfaction at that level.
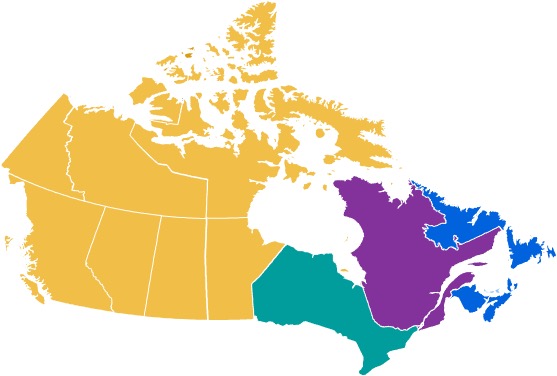
| Overall satisfaction (% rated 4/5) |
|
|---|---|
| Year 3 | 68% |
| Year 2 | 77% |
| Year 1 | 70% |
| West/Territories | |
|---|---|
| Year 3 | 59% |
| Year 2 | 72% |
| Year 1 | 70% |
| Ontario | |
|---|---|
| Year 3 | 67% |
| Year 2 | 76% |
| Year 1 | 62% |
| Atlantic | |
|---|---|
| Year 3 | 73% |
| Year 2 | 81% |
| Year 1 | 70% |
| Quebec | |
|---|---|
| Year 2 | 76% |
| Year 2 | 83% |
| Year 1 | 75% |
Q31. On a scale from 1 to 5, where 1 means very dissatisfied and 5 means very satisfied, how satisfied or dissatisfied were you with the overall service you received from Service Canada from getting information about [INSERT PROGRAM] to receiving a funding decision?
Base: All respondents
Significantly higher / lower than total
Significantly higher / lower than Year 2
Key Differences by Region (Operate in)
- Applicant organizations in the West/ Territories provided lower ratings for the GCOS web portal, GoC website and email support from a SC office. They were more likely to have experienced a problem and were less likely to have received funding approval and to feel it was easy to navigate most aspects of the GoC website. Those in Atlantic Canada were more likely to feel it was easy to navigate the GoC website and were more satisfied with email support form a program officer (while those in Ontario were less likely).
- Compared to Year 2, applicant organizations in West/ Territories were more likely to have experienced a problem, were less satisfied with the GoC website and with email support from SC office (along with those in Quebec) and were also less likely feel it was easy to navigate most aspects of the GoC website. Those in Ontario were less likely to have been satisfied with the email support from a PO, while those in Atlantic Canada were more likely to feel it was easy to navigate most aspects of the GoC website.
| TOTAL | WEST/ TERR | ONTARIO | QUEBEC | ATLANTIC | |||||||||||
| Year 3 | Year 2 | Year 1 | Year 3 | Year 2 | Year 1 | Year 3 | Year 2 | Year 1 | Year 3 | Year 2 | Year 1 | Year 3 | Year 2 | Year 1 | |
| Experienced a Problem | |||||||||||||||
|---|---|---|---|---|---|---|---|---|---|---|---|---|---|---|---|
| % Yes | 26% | 22% | 35% | 35% | 25% | 34% | 26% | 22% | 45% | 24% | 21% | 30% | 22% | 19% | 26% |
| Funding Approval | |||||||||||||||
| % Approved | 79% | 93% | 90% | 72% | 91% | 90% | 81% | 95% | 88% | 80% | 95% | 91% | 81% | 92% | 91% |
| Service Channel Satisfaction | |||||||||||||||
| GCOS web portal | 72% | 76% | 67% | 64% | 73% | 63% | 74% | 75% | 64% | 72% | 80% | 72% | 79% | 82% | 73% |
| Government of Canada website | 66% | 71% | 66% | 60% | 70% | 63% | 68% | 69% | 64% | 66% | 71% | 68% | 70% | 74% | 70% |
| Email support from SC office | 68% | 70% | 65% | 60% | 66% | 63% | 71% | 69% | 58% | 62% | 71% | 66% | 72% | 71% | 76% |
| Email support from a Program Officer | 77% | 79% | 80% | 79% | 76% | 84% | 71% | 79% | 74% | 76% | 76% | 80% | 86% | 87% | 87% |
| Telephone support from a Service Canada office | 62% | 61% | 61% | 63% | 55% | 59% | 58% | 68% | 59% | 63% | 56% | 53% | 55% | 58% | 77% |
| Ease of Navigating GoC website (% Rated 4/5) | |||||||||||||||
| Understand the information about [program] | 77% | 80% | 76% | 74% | 76% | 76% | 78% | 81% | 72% | 76% | 78% | 75% | 85% | 75% | 77% |
| Determine if your organization is eligible for funding | 80% | 84% | 83% | 76% | 83% | 82% | 82% | 84% | 82% | 78% | 84% | 84% | 87% | 80% | 85% |
| Determine the steps to apply for funding | 81% | 81% | 78% | 76% | 82% | 80% | 82% | 83% | 76% | 84% | 81% | 76% | 85% | 74% | 80% |
| Find out what information you need to provide when applying for [program] | 79% | 79% | 78% | 76% | 77% | 77% | 81% | 82% | 77% | 77% | 79% | 79% | 85% | 71% | 80% |
| Determine the amount of time each phase of the process is anticipated to take | 56% | 58% | - | 45% | 57% | - | 56% | 57% | - | 63% | 59% | - | 67% | 58% | - |
| Determine when the application period for [program] takes place | 79% | 83% | - | 74% | 82% | - | 83% | 82% | - | 80% | 81% | - | 84% | 84% | - |
Significantly higher / lower than total
Significantly higher / lower than Year 2
- Applicant organizations in the West/Territories were less likely to find several aspects of the application process easy and were more likely to have been first-time applicants. Those in Ontario were more likely to report being in contact with Service Canada (SC) 10 or more times during the process and were more likely to feel it was easy to understand and meet the requirements of the application.
- Organizations in Quebec were more likely to have been in contact with Service Canada 1 to 3 times during the process (and fewer 10+ times) and were less likely to be first-time applicants, while those in Atlantic Canada were more likely to say they apply for the same program on an annual basis.
- Compared to Year 2, applicant organizations in the West/ Territories were less likely to feel it was easy to complete all aspects of the application process. Organizations in all regions were less likely to have had a higher number of contacts with Service Canada and except for those in Atlantic Canada were also less likely to be first-time applicants.
| TOTAL | WEST/ TERR | ONTARIO | QUEBEC | ATLANTIC | |||||||||||
| Year 3 | Year 2 | Year 1 | Year 3 | Year 2 | Year 1 | Year 3 | Year 2 | Year 1 | Year 3 | Year 2 | Year 1 | Year 3 | Year 2 | Year 1 | |
| Ease of Application Process (% Rated 4/5) | |||||||||||||||
|---|---|---|---|---|---|---|---|---|---|---|---|---|---|---|---|
| Understanding the requirements of the application | 74% | 76% | 73% | 68% | 76% | 70% | 78% | 78% | 71% | 75% | 73% | 75% | 78% | 80% | 76% |
| Putting together the information you needed to apply for [program] | 72% | 74% | 69% | 67% | 73% | 64% | 73% | 75% | 66% | 74% | 72% | 78% | 76% | 75% | 68% |
| Completing the narrative questions | 70% | 70% | 64% | 67% | 72% | 61% | 72% | 72% | 65% | 69% | 64% | 68% | 75% | 72% | 60% |
| Completing the project budget | 67% | 67% | 67% | 63% | 68% | 64% | 67% | 68% | 64% | 68% | 66% | 72% | 68% | 64% | 70% |
| Meeting the requirements of the application process | 77% | 80% | 77% | 73% | 79% | 74% | 80% | 81% | 77% | 73% | 77% | 78% | 80% | 84% | 76% |
| Total Number of Times of Contacting SC | |||||||||||||||
| 1-3 times | 22% | 19% | 12% | 20% | 15% | 10% | 17% | 16% | 10% | 27% | 24% | 17% | 26% | 20% | 11% |
| 4-6 times | 23% | 21% | 19% | 24% | 22% | 16% | 21% | 18% | 15% | 25% | 22% | 24% | 20% | 19% | 23% |
| 7-9 times | 9% | 13% | 15% | 9% | 15% | 18% | 10% | 14% | 15% | 8% | 11% | 12% | 7% | 11% | 15% |
| 10+ times | 23% | 28% | 41% | 25% | 30% | 44% | 31% | 34% | 48% | 16% | 23% | 34% | 19% | 28% | 37% |
| Application Frequency | |||||||||||||||
| First application | 10% | 19% | 13% | 13% | 23% | 13% | 11% | 20% | 12% | 7% | 18% | 14% | 10% | 14% | 13% |
| Applied once or twice before | 24% | 19% | 20% | 25% | 19% | 20% | 24% | 19% | 22% | 24% | 21% | 17% | 20% | 19% | 18% |
| Applied several times before | 26% | 25% | 26% | 25% | 25% | 29% | 27% | 24% | 26% | 29% | 27% | 24% | 22% | 21% | 24% |
| Apply for the same program on an annual basis | 39% | 35% | 41% | 36% | 32% | 38% | 37% | 34% | 39% | 37% | 35% | 43% | 46% | 45% | 46% |
Significantly higher / lower than total
Significantly higher / lower than Year 2
- Applicant organizations in Atlantic Canada and to a lesser extent those in Quebec were more likely to provide high ratings across most aspects of service, while those in the West/ Territories were less likely.
- Compared to Year 2, applicant organizations in West/ Territories were less likely to provide high ratings on nearly all aspects of service, while those in Quebec were less likely to agree it was clear what to do if they have a problem, that it was easy to get help when needed and that the amount of time the application took was reasonable.
| TOTAL | WEST/ TERR | ONTARIO | QUEBEC | ATLANTIC | |||||||||||
| Year 3 | Year 2 | Year 1 | Year 3 | Year 2 | Year 1 | Year 3 | Year 2 | Year 1 | Year 3 | Year 2 | Year 1 | Year 3 | Year 2 | Year 1 | |
| Widest Gap/ Shifts in Service Attributes (% Rated 4/5) | |||||||||||||||
|---|---|---|---|---|---|---|---|---|---|---|---|---|---|---|---|
| I was able to move smoothly through all of the steps | 75% | 78% | 70% | 70% | 75% | 69% | 75% | 77% | 68% | 79% | 82% | 71% | 79% | 79% | 72% |
| It was clear what to do if I had a problem or question. | 65% | 70% | 62% | 58% | 67% | 59% | 66% | 68% | 57% | 67% | 73% | 67% | 70% | 75% | 67% |
| Throughout the process it was clear what would happen next and when it would happen. | 64% | 69% | 58% | 51% | 62% | 53% | 62% | 64% | 51% | 77% | 82% | 66% | 70% | 72% | 64% |
| I was confident that any issues or problems would have been easily resolved. | 67% | 70% | 63% | 59% | 65% | 60% | 67% | 68% | 55% | 70% | 74% | 67% | 73% | 74% | 72% |
| I needed to explain my situation only once. | 65% | 67% | 62% | 57% | 65% | 63% | 64% | 64% | 54% | 71% | 71% | 69% | 71% | 72% | 70% |
| It was easy to get help when I needed it. | 63% | 69% | 61% | 55% | 64% | 59% | 65% | 68% | 53% | 64% | 72% | 70% | 67% | 72% | 68% |
| Overall, it was easy for me to apply for [program] | 78% | 79% | 74% | 70% | 75% | 71% | 79% | 80% | 71% | 81% | 84% | 78% | 81% | 79% | 71% |
| I was provided with service in my choice of English or French. | 91% | 93% | 96% | 88% | 92% | 94% | 93% | 92% | 94% | 90% | 93% | 99% | 95% | 93% | 97% |
| I was confident that my personal information was protected. | 81% | 83% | 88% | 76% | 83% | 85% | 83% | 82% | 90% | 80% | 84% | 89% | 87% | 85% | 89% |
| I received consistent information | 73% | 76% | 72% | 64% | 72% | 69% | 70% | 73% | 61% | 80% | 82% | 83% | 78% | 79% | 77% |
| It was easy to access service in a language I could speak and understand well | 90% | 91% | 95% | 87% | 89% | 95% | 91% | 91% | 93% | 90% | 92% | 96% | 95% | 93% | 96% |
| The amount of time it took was reasonable. | 58% | 66% | 56% | 50% | 63% | 54% | 57% | 62% | 52% | 61% | 72% | 59% | 67% | 70% | 65% |
Top 5 driver of satisfaction
Significantly higher / lower than total
Significantly higher / lower than Year 2
Overall Satisfaction by Region (Deliver Project Activities*)
- Organizations were also asked which provinces or territories they would deliver project activities in related to the program they applied for.
- As observed in Year 2, responses to the question were nearly identical to provinces or territories which organizations operate in and the same trends were observed across differences in the service experience by region of operation as presented on the previous slides.
- At three-quarters (76%), applicant organizations which operate in Quebec reported the highest level of satisfaction with their experience and were more likely to be satisfied compared to all clients. More than seven in ten (73%) organizations in Atlantic Canada were satisfied, followed by two-thirds (67%) of those in Ontario, and six in ten (59%) applicant organizations in the West or Territories which was lower compared to all client. Overall satisfaction decreased in all regions compared to Year 2.
| Overall satisfaction (Rated 4 or 5) |
|
|---|---|
| Year 3 | 68% |
| Year 2 | 77% |
| West/Territories | |
|---|---|
| Year 3 | 59% |
| Year 2 | 72% |
| Ontario | |
|---|---|
| Year 3 | 67% |
| Year 2 | 75% |
| Atlantic | |
|---|---|
| Year 3 | 73% |
| Year 2 | 80% |
| Quebec | |
|---|---|
| Year 3 | 76% |
| Year 2 | 82% |
Q31. On a scale from 1 to 5, where 1 means very dissatisfied and 5 means very satisfied, how satisfied or dissatisfied were you with the overall service you received from Service Canada from getting information about [INSERT PROGRAM] to receiving a funding decision?
Base: All respondents
*classification question regarding which region organizations deliver project activities in was added in Year 2
Significantly higher / lower than total
Significantly higher / lower than Year 2
Key Differences by Program Complexity
- For the purpose of this study, program complexity follows the Gs&Cs service standard program complexity clusters. Program complexity is defined as low, moderate and high as outlined in the table below and is based on the length of time to complete the review of an application. Canada Summer Jobs does not fit into these distinct clusters and has been analyzed as a separate group. Overall, applicants to low complexity programs were more likely to be satisfied with their service experience while applicants to moderate complexity programs were less likely. Eight in ten (81%) applicants to low complexity programs were satisfied, followed by nearly seven in ten CSJ applicants (68%) and four in ten (39%) applicants to moderate complexity programs.
- Compared to Year 2, satisfaction has decreased among CSJ applicants and applicants to moderate complexity programs.
| OVERALL SATISFACTION (% RATED 4/5) | |||||||||||
|---|---|---|---|---|---|---|---|---|---|---|---|
| CSJ | Low Complexity | Moderate Complexity | High Complexity | ||||||||
| 68% | 79% | 69% | 81% | 78% | 74% | 39% | 63% | 60% | - | 19% | 66% |
| Year 3 | Year 2 | Year 1 | Year 3 | Year 2 | Year 1 | Year 3 | Year 2 | Year 1 | Year 3 | Year 2 | Year 1 |
| (n=1004) | (n=865) | (n=942) | (n=1563) | (n=817) | (n=487) | (n=474) | (n=195) | (n=93) | (N/A) | (n=65) | (n=27)* |
| Program Complexity Level | Programs Included |
|---|---|
| CSJ |
|
| Low complexity |
|
| Moderate delivery-complexity programs |
|
| High-delivery complexity programs |
|
*small sample size
Significantly higher / lower than total
Significantly higher / lower than Year 2
- Applicants to moderate complexity programs were more likely to have experienced a problem, provided lower ratings for the service provided through all channels and were less likely to find it easy to navigate all aspects of the GoC website. Applicants to low complexity programs were less likely to have experienced a problem, more likely to be satisfied with the service provided through the GoC website and email support from a program officer and to feel it was easy to determine the amount of time each phase of the process was anticipated to take.
- Compared to Year 2, applicants to moderate complexity programs were more likely to have experienced a problem, provided lower ratings for the service provided through email support from a SC office and a program officer, and were less likely to feel it was easy to find and understand information about the program, determine if their organization was eligible for funding and find out what information they needed to provide when applying.
| TOTAL | CSJ | LOW | MODERATE | HIGH | |||||||||||
| Year 3 | Year 2 | Year 1 | Year 3 | Year 2 | Year 1 | Year 3 | Year 2 | Year 1 | Year 3 | Year 2 | Year 1 | Year 3 | Year 2 | Year 1 | |
| Experienced a Problem | |||||||||||||||
|---|---|---|---|---|---|---|---|---|---|---|---|---|---|---|---|
| % Yes | 26% | 22% | 35% | 26% | 20% | 35% | 23% | 28% | 30% | 38% | 25% | 31% | - | 52% | 31% |
| Service Channel Satisfaction | |||||||||||||||
| Government of Canada website | 66% | 71% | 66% | 67% | 71% | 65% | 72% | 71% | 71% | 53% | 61% | 50% | - | 45% | 58% |
| Email support from a Service Canada office | 68% | 70% | 65% | 70% | 71% | 64% | 71% | 71% | 71% | 36% | 56% | 58% | - | 24% | 42% |
| Email support from a program officer | 77% | 79% | 80% | 79% | 80% | 80% | 81% | 78% | 82% | 54% | 84% | 82% | - | 30% | 57% |
| GCOS web portal | 72% | 76% | 67% | 73% | 77% | 66% | 74% | 71% | 70% | 59% | 68% | 76% | - | 44% | 69% |
| Telephone support from a Service Canada office | 62% | 61% | 62% | 59% | 70% | 65% | 41% | 59% | - | 33% | 63% | ||||
| Ease of Navigating GoC website (% Rated 4/5) | |||||||||||||||
| Find general information about [program] | 82% | 82% | 82% | 83% | 83% | 82% | 83% | 79% | 86% | 70% | 81% | 87% | - | 49% | 43% |
| Understand the information about the program | 77% | 80% | 76% | 77% | 81% | 76% | 79% | 78% | 80% | 68% | 81% | 58% | - | 62% | 43% |
| Determine if your organization is eligible for funding | 80% | 84% | 83% | 80% | 87% | 83% | 83% | 77% | 84% | 77% | 88% | 69% | - | 57% | 57% |
| Determine the steps to apply for funding | 81% | 81% | 78% | 81% | 82% | 77% | 78% | 79% | 83% | 74% | 80% | 72% | - | 67% | 64% |
| Find out what information you need to provide when applying for [program] | 79% | 79% | 78% | 80% | 80% | 79% | 78% | 75% | 79% | 70% | 84% | 68% | - | 51% | 43% |
| Determine when the application period for [program] takes place | 79% | 83% | - | 79% | 84% | - | 80% | 79% | - | 73% | 81% | - | - | 51% | - |
| Determine the amount of time each phase of the application process is anticipated to take | 56% | 58% | - | 55% | 59% | - | 68% | 57% | - | 43% | 41% | - | - | 19% | - |
Significantly higher / lower than total
Significantly higher / lower than Year 2
- Applicants to moderate complexity programs were less likely to find it easy to complete all aspects of the application process and provided lower ratings across virtually all aspects of service. While applicants to low complexity programs also had more difficulty with most aspects of the application process, they were more likely to provide high ratings across several aspects of service overall.
- Compared to Year 2, applicants to moderate complexity programs provided lower ratings for all service attributes and were less likely to find it easy to understand the requirements of the application, put together the information needed, complete the narrative questions and meet the requirements of the application. Applicants to low complexity programs were more likely to feel it was easy to complete the project timeline and to agree it was clear what would happen and when, that they needed to explain their situation only once and that the amount of time it took was reasonable. Nearly identical shifts compared to Year 2 were observed among applicants to CSJ as seen overall.
| TOTAL | CSJ | LOW | MODERATE | HIGH | |||||||||||
| Year 3 | Year 2 | Year 1 | Year 3 | Year 2 | Year 1 | Year 3 | Year 2 | Year 1 | Year 3 | Year 2 | Year 1 | Year 3 | Year 2 | Year 1 | |
| Ease of Application Process (% Rated 4/5) | |||||||||||||||
|---|---|---|---|---|---|---|---|---|---|---|---|---|---|---|---|
| Understanding the requirements of the application | 74% | 76% | 73% | 75% | 79% | 73% | 73% | 69% | 71% | 59% | 69% | 63% | - | 45% | 56% |
| Putting together the information you needed to apply for [pipe: Q1] | 72% | 74% | 69% | 74% | 78% | 70% | 66% | 64% | 64% | 51% | 62% | 57% | - | 46% | 53% |
| Completing the narrative questions | 70% | 70% | 64% | 71% | 72% | 64% | 65% | 67% | 62% | 59% | 71% | 55% | - | 49% | 53% |
| Completing the budget document | 67% | 67% | 67% | 69% | 71% | 68% | 59% | 59% | 62% | 43% | 44% | 44% | - | 46% | 41% |
| Completing the project timeline | 75% | 75% | 75% | 77% | 78% | 76% | 71% | 65% | 71% | 56% | 58% | 63% | - | 48% | 50% |
| Meeting the requirements of the application | 77% | 80% | 77% | 78% | 83% | 79% | 73% | 72% | 70% | 58% | 76% | 57% | - | 46% | 59% |
| Widest Gap in Service Attributes (% Rated 4/5 vs. Total) | |||||||||||||||
| I was able to move smoothly through all of the steps | 75% | 78% | 70% | 77% | 80% | 69% | 75% | 74% | 75% | 56% | 77% | 64% | - | 40% | 50% |
| It was clear what to do if I had a problem or question | 65% | 70% | 62% | 65% | 71% | 61% | 73% | 71% | 70% | 44% | 62% | 66% | - | 26% | 53% |
| Throughout the process it was clear what would happen next and when it would happen | 64% | 69% | 58% | 65% | 71% | 57% | 75% | 69% | 67% | 37% | 46% | 49% | - | 20% | 56% |
| I was confident that any issues or problems would have been easily resolved | 67% | 70% | 63% | 68% | 71% | 62% | 72% | 71% | 71% | 42% | 53% | 50% | - | 23% | 50% |
| I needed to explain my situation only once | 65% | 67% | 62% | 66% | 67% | 62% | 74% | 70% | 67% | 43% | 51% | 51% | - | 31% | 47% |
| It was easy to get help when I needed it | 63% | 69% | 61% | 64% | 70% | 61% | 71% | 71% | 68% | 40% | 62% | 65% | - | 23% | 50% |
| Overall, it was easy for me to apply for [program] | 78% | 79% | 74% | 79% | 82% | 74% | 77% | 75% | 74% | 52% | 62% | 66% | - | 32% | 59% |
| I received consistent information | 73% | 76% | 72% | 73% | 77% | 71% | 79% | 76% | 76% | 49% | 63% | 64% | - | 34% | 53% |
| The amount of time it took was reasonable | 58% | 66% | 56% | 58% | 68% | 56% | 74% | 66% | 61% | 34% | 44% | 53% | - | 22% | 25% |
Top 5 driver of satisfaction
Significantly higher / lower than total
Significantly higher / lower than Year 2
- Applicants to moderate complexity programs were more likely to have been in contact with Service Canada 10 or more times, while applicants to low complexity programs were less likely. Applicants to low and moderate complexity programs were also more likely to report being first-time applicants (or to have applied once or twice before among low complexity program applicants). CSJ applicants were more likely to report having applied for the same program on an annual basis and to have received funding approval, while applicants to moderate complexity programs were less likely. Applicants to moderate complexity programs were more likely to have applied for a different Gs&Cs program in the past five years, while applicants to low complexity programs and CSJ applicants were less likely.
- Compared to Year 2, nearly identical shifts were observed among applicants to CSJ as seen overall. Applicants to CSJ, low and moderate complexity programs were all less likely to have been in contact with Service Canada 10 or more times and to have received funding approval. Applicants to moderate complexity programs were also more likely to report it was their organizations first application to the program, while all other groups were less likely.
| TOTAL | CSJ | LOW | MODERATE | HIGH | |||||||||||
| Year 3 | Year 2 | Year 1 | Year 3 | Year 2 | Year 1 | Year 3 | Year 2 | Year 1 | Year 3 | Year 2 | Year 1 | Year 3 | Year 2 | Year 1 | |
| Total Number of Times Contacting SC | |||||||||||||||
|---|---|---|---|---|---|---|---|---|---|---|---|---|---|---|---|
| 1-3 times | 22% | 19% | 12% | 22% | 18% | 12% | 26% | 21% | 17% | 13% | 10% | 9% | - | 9% | 7% |
| 4-6 times | 23% | 21% | 19% | 24% | 21% | 19% | 23% | 20% | 23% | 13% | 9% | 9% | - | 22% | 3% |
| 7-9 times | 9% | 13% | 15% | 9% | 13% | 15% | 10% | 14% | 16% | 11% | 5% | 4% | - | 8% | 6% |
| 10+ times | 23% | 28% | 41% | 23% | 29% | 42% | 18% | 23% | 29% | 35% | 54% | 60% | - | 38% | 65% |
| Application Frequency | |||||||||||||||
| First application | 10% | 19% | 13% | 6% | 8% | 10% | 26% | 51% | 29% | 52% | 34% | 42% | - | 79% | 38% |
| Applied once or twice before | 24% | 19% | 20% | 23% | 17% | 17% | 35% | 26% | 36% | 22% | 26% | 26% | - | 15% | 22% |
| Applied several times before | 26% | 25% | 26% | 27% | 28% | 26% | 26% | 16% | 25% | 16% | 26% | 20% | - | 0% | 19% |
| Apply for the same program on an annual basis | 39% | 35% | 41% | 44% | 46% | 46% | 10% | 5% | 8% | 2% | 11% | 9% | - | 0% | 16% |
| Funding Approval | |||||||||||||||
| % Approved | 79% | 93% | 90% | 83% | 97% | 92% | 77% | 86% | 79% | 10% | 89% | 79% | - | 13% | 75% |
| Applied to a different Gs&Cs program in the past five years | |||||||||||||||
| % Yes | 39% | 42% | - | 29% | 54% | - | 33% | 33% | - | 66% | 72% | - | - | 63% | - |
Significantly higher / lower than total
Significantly higher / lower than Year 2
Key Differences by Application Frequency
- Applicants who have applied to the program several times before were more likely to be satisfied with their experience, while those who have applied once or twice before were less likely. Three-quarters of applicants who have applied several times before (75%) were satisfied, followed by nearly seven in ten first-time applicants (69%) and two-thirds who apply to the same program annually (66%) or have applied once or twice before (65%). Satisfaction has decreased among those who apply annually or have applied once or twice before.
- Those who have applied several times before were less likely to have experienced a problem and more satisfied with the service provided through the GoC website and email support from a SC office or program officer. First-time applicants and those who have applied once or twice before were less likely to have received funding approval, while those who apply annually were more likely. First-time applicants were also less satisfied with the service provided through email support form a SC office and those who have applied once or twice before with the GCOS web portal. Compared to Year 2, those who have applied once or twice before or annually were more likely to have experienced a problem. First-time applicants and those who apply annually were less satisfied with the service provided by email support from a SC office, while those who have applied once or twice before were less satisfied with the GoC website and GCOS web portal. All groups of applicants were less likely to have received funding approval compared to Year 2.
| Overall satisfaction (Rated 4 or 5) | |||||||||||
|---|---|---|---|---|---|---|---|---|---|---|---|
| First application | Once or twice before | Several times before | Apply annually | ||||||||
| 69% | 69% | 68% | 65% | 79% | 69% | 75% | 77% | 71% | 66% | 81% | 70% |
| Year 3 | Year 2 | Year 1 | Year 3 | Year 2 | Year 1 | Year 3 | Year 2 | Year 1 | Year 3 | Year 2 | Year 1 |
| (n=709) | (n=649) | (n=256) | (n=877) | (n=393) | (n=378) | (n=760) | (n=404) | (n=404) | (n=603) | (n=454) | (n=497) |
| TOTAL | FIRST | ONCE OR TWICE | SEVERAL TIMES | ANNUALLY | |||||||||||
| Year 3 | Year 2 | Year 1 | Year 3 | Year 2 | Year 1 | Year 3 | Year 2 | Year 1 | Year 3 | Year 2 | Year 1 | Year 3 | Year 2 | Year 1 | |
| Experienced a Problem | |||||||||||||||
|---|---|---|---|---|---|---|---|---|---|---|---|---|---|---|---|
| % Yes | 26% | 22% | 35% | 29% | 33% | 31% | 29% | 21% | 34% | 21% | 20% | 33% | 27% | 20% | 37% |
| Funding Approval | |||||||||||||||
| % Approved | 79% | 93% | 90% | 64% | 83% | 82% | 74% | 92% | 87% | 80% | 96% | 93% | 86% | 97% | 92% |
| Service Channel Satisfaction | |||||||||||||||
| Government of Canada website | 66% | 71% | 66% | 66% | 66% | 62% | 63% | 73% | 66% | 72% | 70% | 62% | 65% | 72% | 69% |
| Email support from a Service Canada office | 68% | 70% | 65% | 60% | 66% | 63% | 68% | 67% | 64% | 73% | 69% | 66% | 68% | 75% | 66% |
| Email support from a Program Officer | 77% | 79% | 80% | 73% | 67% | 76% | 77% | 84% | 80% | 85% | 79% | 85% | 73% | 82% | 79% |
| GCOS web portal | 72% | 76% | 67% | 69% | 65% | 63% | 65% | 84% | 64% | 71% | 75% | 69% | 77% | 77% | 67% |
Application frequency was based in Q38. Was this the first application your organization submitted to [PROGRAM], or have you applied to [PROGRAM] in the past?
* small sample size
Significantly higher / lower than total
Significantly higher / lower than Year 2
- Those who have applied to the same program several times were more likely to find it easy to navigate nearly all aspects of the GoC website and to understand the requirements of the application, complete the budget document and the project timeline. First-time applicants and those who have applied once or twice before were less likely to find it easy to navigate most areas of the GoC website and to feel all aspects of the application process were easy.
- Compared to Year 2, those who have applied once or twice before were less likely to say that nearly all aspects of the application process were easy. Those who have applied several times before were more likely to find it easy to determine the steps to apply or complete the project timeline (along with first-time applicants).
| TOTAL | FIRST | ONCE OR TWICE | SEVERAL TIMES | ANNUALLY | |||||||||||
| Year 3 | Year 2 | Year 1 | Year 3 | Year 2 | Year 1 | Year 3 | Year 2 | Year 1 | Year 3 | Year 2 | Year 1 | Year 3 | Year 2 | Year 1 | |
| Ease of Navigating GoC website (% Rated 4/5) | |||||||||||||||
|---|---|---|---|---|---|---|---|---|---|---|---|---|---|---|---|
| Find general information about [program] | 82% | 82% | 82% | 74% | 72% | 76% | 78% | 80% | 84% | 88% | 82% | 79% | 83% | 88% | 84% |
| Understand the information about the program | 77% | 80% | 76% | 67% | 72% | 66% | 68% | 77% | 77% | 83% | 81% | 74% | 82% | 85% | 80% |
| Determine if your organization is eligible for funding | 80% | 84% | 83% | 77% | 73% | 75% | 73% | 85% | 82% | 82% | 83% | 82% | 84% | 91% | 87% |
| Determine the steps to apply for funding | 81% | 81% | 78% | 71% | 75% | 70% | 77% | 81% | 78% | 86% | 77% | 77% | 82% | 87% | 80% |
| Find out what information you need to provide when applying for [program] | 79% | 79% | 78% | 72% | 71% | 69% | 76% | 77% | 79% | 83% | 78% | 75% | 81% | 84% | 83% |
| Determine the amount of time each phase of the application process is anticipated to take | 56% | 58% | - | 54% | 49% | - | 48% | 55% | - | 62% | 56% | - | 57% | 65% | - |
| Determine when the application period for [program] takes place | 79% | 83% | - | 75% | 74% | - | 72% | 83% | - | 87% | 83% | - | 80% | 87% | - |
| Ease of Application Process (% Rated 4/5) | |||||||||||||||
| Understanding the requirements of the application | 74% | 76% | 73% | 69% | 64% | 60% | 66% | 74% | 76% | 79% | 78% | 72% | 79% | 83% | 76% |
| Putting together the information you needed to apply for [program] | 72% | 74% | 69% | 63% | 62% | 59% | 65% | 76% | 66% | 78% | 76% | 69% | 76% | 80% | 73% |
| Completing the narrative questions | 70% | 70% | 64% | 66% | 63% | 56% | 65% | 69% | 64% | 73% | 72% | 63% | 74% | 74% | 67% |
| Completing the budget document | 67% | 67% | 67% | 62% | 56% | 59% | 58% | 67% | 65% | 72% | 69% | 68% | 71% | 72% | 70% |
| Completing the project timeline | 75% | 75% | 75% | 69% | 60% | 67% | 66% | 75% | 74% | 83% | 76% | 73% | 78% | 81% | 80% |
| Meeting the requirements of the application process | 77% | 80% | 77% | 73% | 69% | 69% | 72% | 81% | 77% | 80% | 80% | 77% | 80% | 85% | 80% |
Significantly higher / lower than total
Significantly higher / lower than Year 2
- First-time applicants and those who have applied once or twice before were less likely to provide high ratings across nearly all aspects of service, while those who have applied several times were more likely to agree they moved smoothly through all steps, it was clear what to do if they had a problem and what would happen next and when, they were confident that any issues would be easily resolved, received consistent information and that the amount of time it took was reasonable.
- Compared to Year 2, those who have applied once or twice before were less likely to provide high ratings across most aspects of service. Among those who have applied annually, nearly identical shifts were observed as seen overall.
| TOTAL | FIRST | ONCE OR TWICE | SEVERAL TIMES | ANNUALLY | |||||||||||
| Year 3 | Year 2 | Year 1 | Year 3 | Year 2 | Year 1 | Year 3 | Year 2 | Year 1 | Year 3 | Year 2 | Year 1 | Year 3 | Year 2 | Year 1 | |
| Widest Gap/ Shifts in Service Attributes (% Rated 4/5) | |||||||||||||||
|---|---|---|---|---|---|---|---|---|---|---|---|---|---|---|---|
| I was able to move smoothly through all of the steps related to the [program] application. | 75% | 78% | 70% | 69% | 68% | 70% | 69% | 77% | 70% | 79% | 78% | 69% | 79% | 83% | 70% |
| It was clear what to do if I had a problem or question. | 65% | 70% | 62% | 64% | 62% | 63% | 60% | 71% | 59% | 70% | 70% | 66% | 65% | 74% | 59% |
| Throughout the process it was clear what would happen next and when it would happen. | 64% | 69% | 58% | 60% | 59% | 48% | 59% | 67% | 58% | 69% | 69% | 59% | 66% | 77% | 61% |
| I was confident that any issues or problems would have been easily resolved. | 67% | 70% | 63% | 63% | 63% | 57% | 61% | 72% | 66% | 72% | 71% | 66% | 69% | 73% | 61% |
| I needed to explain my situation only once. | 65% | 67% | 62% | 61% | 61% | 55% | 62% | 69% | 60% | 66% | 66% | 67% | 68% | 70% | 62% |
| It was easy to get help when I needed it. | 63% | 69% | 61% | 62% | 64% | 60% | 58% | 68% | 57% | 67% | 68% | 64% | 65% | 73% | 62% |
| Overall, it was easy for me to apply for [program] | 78% | 79% | 74% | 69% | 69% | 68% | 71% | 79% | 74% | 80% | 80% | 75% | 83% | 85% | 74% |
| I was provided with service in my choice of English or French | 91% | 93% | 96% | 91% | 92% | 95% | 88% | 92% | 94% | 91% | 92% | 98% | 94% | 95% | 96% |
| I was confident that my personal information was protected | 81% | 83% | 88% | 77% | 78% | 86% | 76% | 82% | 90% | 83% | 85% | 87% | 84% | 86% | 88% |
| I received consistent information | 73% | 76% | 72% | 69% | 67% | 69% | 69% | 75% | 70% | 77% | 76% | 73% | 74% | 82% | 72% |
| It was easy to access service in a language I could speak and understand well | 90% | 91% | 95% | 90% | 87% | 92% | 88% | 91% | 96% | 90% | 90% | 95% | 93% | 94% | 94% |
| The amount of time it took was reasonable | 58% | 66% | 56% | 58% | 60% | 58% | 56% | 65% | 64% | 63% | 66% | 52% | 57% | 71% | 55% |
Top 5 driver of satisfaction
Significantly higher / lower than total
Significantly higher / lower than Year 2
- First-time applicants were more likely to report their organization has between 10 to 19 employees or no employees and between 1 to 4 volunteers and were more likely to report having been in contact with Service Canada 10 times or more during the process. Those who have applied once or twice before were more likely to report having between 1 to 4 employees or no volunteers, while those who apply annually were more likely to report their organization has 50 or more employees and volunteers. Those who have applied several times before were more likely to have contacted SC 1 to 3 times.
- Compared to Year 2, applicants who have applied once or twice or several times before were more likely to report being in contact with Service Canada fewer times (1 to 3 times), while those who apply annually were more likely to have contacted Service Canada 4 to 6 times. First-time applicants and to a lesser extent those who have applied once or twice, or several times before were more likely to report having a greater number of employees. All groups of applicants were more likely to report their organization has no volunteers.
| TOTAL | FIRST | ONCE OR TWICE | SEVERAL TIMES | ANNUALLY | |||||||||||
| Year 3 | Year 2 | Year 1 | Year 3 | Year 2 | Year 1 | Year 3 | Year 2 | Year 1 | Year 3 | Year 2 | Year 1 | Year 3 | Year 2 | Year 1 | |
| Total Number of Times Contacting SC | |||||||||||||||
|---|---|---|---|---|---|---|---|---|---|---|---|---|---|---|---|
| 1-3 times | 22% | 19% | 12% | 16% | 17% | 13% | 22% | 14% | 13% | 26% | 19% | 13% | 22% | 22% | 11% |
| 4-6 times | 23% | 21% | 19% | 16% | 19% | 16% | 22% | 26% | 16% | 24% | 20% | 17% | 25% | 19% | 22% |
| 7-9 times | 9% | 13% | 15% | 11% | 11% | 15% | 10% | 11% | 18% | 9% | 14% | 16% | 8% | 13% | 14% |
| 10+ times | 23% | 28% | 41% | 27% | 27% | 39% | 25% | 29% | 42% | 19% | 29% | 42% | 25% | 29% | 41% |
| Number of employees | |||||||||||||||
| None | 8% | 12% | 10% | 11% | 24% | 16% | 8% | 17% | 13% | 7% | 10% | 10% | 8% | 4% | 8% |
| 1-4 | 26% | 28% | 31% | 29% | 36% | 37% | 30% | 33% | 32% | 24% | 24% | 31% | 24% | 24% | 30% |
| 5-9 | 20% | 19% | 18% | 16% | 13% | 19% | 18% | 20% | 16% | 23% | 18% | 19% | 20% | 22% | 16% |
| 10-19 | 16% | 15% | 17% | 21% | 8% | 16% | 18% | 10% | 17% | 15% | 18% | 18% | 15% | 20% | 16% |
| 20-49 | 15% | 14% | 13% | 12% | 8% | 7% | 14% | 12% | 12% | 16% | 15% | 11% | 14% | 16% | 16% |
| 50+ | 15% | 12% | 11% | 10% | 10% | 6% | 11% | 9% | 9% | 15% | 15% | 11% | 19% | 13% | 13% |
| Number of volunteers | |||||||||||||||
| None | 26% | 14% | 19% | 27% | 13% | 27% | 38% | 13% | 24% | 25% | 17% | 20% | 20% | 14% | 13% |
| 1-4 | 14% | 16% | 13% | 17% | 21% | 21% | 16% | 18% | 13% | 12% | 16% | 14% | 13% | 14% | 10% |
| 5-9 | 13% | 15% | 15% | 15% | 13% | 15% | 13% | 18% | 16% | 12% | 13% | 13% | 15% | 16% | 16% |
| 10-19 | 15% | 18% | 20% | 13% | 19% | 13% | 11% | 20% | 20% | 17% | 14% | 18% | 16% | 19% | 23% |
| 20-49 | 14% | 16% | 13% | 13% | 18% | 10% | 12% | 16% | 11% | 15% | 14% | 13% | 14% | 16% | 15% |
| 50+ | 16% | 18% | 19% | 12% | 13% | 13% | 8% | 14% | 15% | 17% | 25% | 21% | 21% | 19% | 21% |
Significantly higher / lower than total
Significantly higher / lower than Year 2
Key Differences by Number of Employees
- Applicant organizations with no employees were more likely to have been satisfied with their service experience, while those with 50 or more were less likely. Three-quarters (76%) of organizations with no employees were satisfied, followed by nearly seven in ten (69%) with 1 to 9 or 10 to 49 employees (68%) and slightly more than six in ten (63%) with 50 or more. Satisfaction has decreased among organizations with at least 1 employee compared to Year 2.
- Applicant organizations with no employees were more likely to have experienced a problem but were also more likely to provide high ratings for email support from a PO and SC office and telephone support from a SC office. Those with 1-9 employees were less satisfied with the 1 800 O-Canada phone line, while those with 50 or more were less satisfied with mail service.
- Compared to Year 2, those who no employees were more satisfied with email and telephone support from a SC office and mail service (along with those with 1-9 employees), while those with 1-9 employees or 50 or more were less satisfied with the GoC website and telephone. All groups were less likely to have received funding approval compared to Year 2.
| Overall satisfaction (Rated 4/5) | |||||||||||
|---|---|---|---|---|---|---|---|---|---|---|---|
| None | 1-9 | 10-49 | 50+ | ||||||||
| 76% | 77% | 74% | 69% | 79% | 71% | 68% | 77% | 70% | 63% | 73% | 59% |
| Year 3 | Year 2 | Year 1 | Year 3 | Year 2 | Year 1 | Year 3 | Year 2 | Year 1 | Year 3 | Year 2 | Year 1 |
| (n=510) | (n=297) | (n=245) | (n=1282) | (n=855) | (n=722) | (n=802) | (n=498) | (n=401) | (n=434) | (n=278) | (n=173) |
| TOTAL | NONE | 9-Jan | Oct-49 | 50+ | |||||||||||
| Year 3 | Year 2 | Year 1 | Year 3 | Year 2 | Year 1 | Year 3 | Year 2 | Year 1 | Year 3 | Year 2 | Year 1 | Year 3 | Year 2 | Year 1 | |
| Experienced a Problem | |||||||||||||||
|---|---|---|---|---|---|---|---|---|---|---|---|---|---|---|---|
| % Yes | 26% | 22% | 35% | 33% | 30% | 33% | 27% | 21% | 33% | 22% | 22% | 35% | 29% | 21% | 43% |
| Funding Approval | |||||||||||||||
| % Approved | 79% | 93% | 90% | 81% | 88% | 90% | 79% | 94% | 90% | 80% | 94% | 90% | 77% | 95% | 90% |
| Service Channel Satisfaction | |||||||||||||||
| Email support from a Program Officer | 77% | 79% | 80% | 86% | 78% | 78% | 77% | 78% | 80% | 79% | 80% | 85% | 71% | 79% | 75% |
| GCOS web portal | 72% | 76% | 67% | 80% | 73% | 68% | 72% | 77% | 66% | 73% | 78% | 68% | 69% | 69% | 63% |
| Email support from a Service Canada office | 68% | 70% | 65% | 78% | 71% | 80% | 68% | 70% | 66% | 67% | 69% | 61% | 64% | 70% | 56% |
| Government of Canada website | 66% | 71% | 66% | 68% | 66% | 68% | 66% | 72% | 65% | 68% | 70% | 65% | 64% | 73% | 64% |
| 65% | 58% | 63% | 80% | 56% | 73% | 71% | 53% | 63% | 68% | 71% | 49% | 33% | 67% | 73% | |
| Telephone support from a Service Canada office | 62% | 61% | 61% | 83% | 65% | 75% | 58% | 62% | 66% | 61% | 58% | 55% | 62% | 59% | 46% |
| 1 800 O-Canada phone line | 42% | 48% | 49% | 44% | 49% | 52% | 23% | 34% | 57% | 52% | 73% | 46% | 100% | 59% | 22% |
Significantly higher / lower than total
Significantly higher / lower than Year 2
- Applicant organizations with no employees were more likely to have been in contact with SC 1 to 3 times and to feel it was easy to determine the amount of time each phase was anticipated to take, however they were less likely to find it easy to put together the info they needed, to complete the budget document and meet the requirements of the application process. Organizations with 50 or more employees were more likely to have been in contact with SC 10 or more times and to feel it was easy to determine if their organization was eligible for funding (but were less likely to find it easy to complete the budget document), while those with 10-49 employees were less likely to find it easy to understand information about the program.
- Compared to Year 2, applicants in all groups were less likely to report being in contact with SC a greater number of times (7-9 or 10+ times). Those with no employees were more likely to feel it was easy to determine the amount of time each phase was anticipated to take, while those with 1 to 9 employees were less likely to feel it was easy to meet the requirements of the application process and to determine if their organization was eligible for funding. Organizations with 10 to 49 employees were less likely to feel it was easy to understand the information about the program, determine if they were eligible for funding and determine the steps to apply, while those with 50 or more were less likely to feel that it was easy to complete the budget document.
| TOTAL | NONE | 9-Jan | Oct-49 | 50+ | |||||||||||
| Year 3 | Year 2 | Year 1 | Year 3 | Year 2 | Year 1 | Year 3 | Year 2 | Year 1 | Year 3 | Year 2 | Year 1 | Year 3 | Year 2 | Year 1 | |
| Total Number of Times Contacting SC | |||||||||||||||
|---|---|---|---|---|---|---|---|---|---|---|---|---|---|---|---|
| 1-3 times | 22% | 19% | 12% | 38% | 25% | 14% | 22% | 19% | 13% | 23% | 19% | 10% | 15% | 11% | 12% |
| 4-6 times | 23% | 21% | 19% | 18% | 22% | 30% | 26% | 21% | 19% | 22% | 21% | 17% | 20% | 18% | 16% |
| 7-9 times | 9% | 13% | 15% | 10% | 15% | 14% | 9% | 12% | 14% | 10% | 11% | 18% | 8% | 15% | 15% |
| 10+ times | 23% | 28% | 41% | 13% | 20% | 28% | 23% | 28% | 41% | 22% | 30% | 45% | 33% | 33% | 45% |
| Ease of Navigating GoC website (% Rated 4/5) | |||||||||||||||
| Find general information about [program] | 82% | 82% | 82% | 76% | 79% | 80% | 83% | 83% | 82% | 79% | 80% | 80% | 86% | 84% | 88% |
| Understand the information about [program] | 77% | 80% | 76% | 78% | 74% | 74% | 78% | 81% | 78% | 72% | 80% | 76% | 82% | 82% | 70% |
| Determine if your organization is eligible for [program] funding | 80% | 84% | 83% | 77% | 76% | 89% | 80% | 85% | 84% | 78% | 85% | 83% | 86% | 88% | 79% |
| Determine the steps to apply for funding | 81% | 81% | 78% | 78% | 75% | 80% | 83% | 80% | 77% | 77% | 84% | 77% | 80% | 83% | 77% |
| Determine the amount of time each phase of the application process is anticipated to take | 56% | 58% | - | 71% | 49% | - | 55% | 58% | - | 52% | 59% | - | 57% | 64% | - |
| Determine when the application period for [program] takes place | 79% | 83% | - | 77% | 80% | - | 77% | 81% | - | 79% | 82% | - | 84% | 90% | - |
| Ease of Application Process (% Rated 4/5) | |||||||||||||||
| Understanding the requirements of the application | 74% | 76% | 73% | 73% | 69% | 71% | 76% | 77% | 75% | 71% | 76% | 72% | 77% | 82% | 66% |
| Putting together the information you needed to apply for [program] | 72% | 74% | 69% | 66% | 65% | 61% | 74% | 77% | 69% | 73% | 76% | 73% | 68% | 72% | 65% |
| Completing the narrative questions | 70% | 70% | 64% | 66% | 62% | 61% | 70% | 71% | 66% | 71% | 72% | 64% | 70% | 73% | 60% |
| Completing the budget document | 67% | 67% | 67% | 61% | 57% | 64% | 67% | 67% | 67% | 70% | 70% | 70% | 62% | 72% | 64% |
| Meeting the requirements of the application process | 77% | 80% | 77% | 72% | 73% | 72% | 77% | 81% | 78% | 77% | 79% | 78% | 79% | 83% | 77% |
Significantly higher / lower than total
Significantly higher / lower than Year 2
- Organizations with no employees were more likely to operate in the non-profit sector, report being first-time applicants and to have a team of volunteers completing the funding application, while organizations with 50 or more employees were more likely to operate in the public sector, to apply to the same program on an annual basis and to have a team of employees (along with those with 10-49 employees) or an in-house proposal writer dedicated to completing the application. Those with 1 to 9 employees were more likely to be solely responsible for the application or have a team of employees and volunteers who complete the application.
- Compared to Year 2, organizations from all groups were more likely to report being solely responsible for the funding application and fewer reported having applied for the first-time (except those with 10 to 49 employees) . Those with 1 to 49 employees were more likely to operate in the private sector.
| TOTAL | NONE | 9-Jan | Oct-49 | 50+ | |||||||||||
| Year 3 | Year 2 | Year 1 | Year 3 | Year 2 | Year 1 | Year 3 | Year 2 | Year 1 | Year 3 | Year 2 | Year 1 | Year 3 | Year 2 | Year 1 | |
| Application frequency | |||||||||||||||
|---|---|---|---|---|---|---|---|---|---|---|---|---|---|---|---|
| First application | 10% | 19% | 13% | 14% | 39% | 20% | 10% | 20% | 15% | 11% | 11% | 10% | 7% | 16% | 7% |
| Applied once or twice before | 24% | 19% | 20% | 25% | 26% | 25% | 25% | 21% | 20% | 25% | 15% | 19% | 17% | 13% | 16% |
| Applied several times before | 26% | 25% | 26% | 23% | 21% | 24% | 27% | 22% | 26% | 27% | 29% | 26% | 26% | 31% | 26% |
| Apply for the same program on an annual basis | 39% | 35% | 41% | 37% | 13% | 32% | 37% | 35% | 39% | 36% | 45% | 45% | 48% | 37% | 50% |
| Role in application | |||||||||||||||
| I am solely responsible | 71% | 62% | - | 68% | 49% | - | 77% | 67% | - | 72% | 64% | - | 57% | 49% | - |
| A team of employees are dedicated to completing the funding application | 17% | 20% | - | 3% | 3% | - | 11% | 15% | - | 21% | 26% | - | 36% | 41% | - |
| A dedicated in-house proposal writer completes the funding application | 1% | 2% | - | 1% | 2% | - | 1% | 2% | - | 1% | 3% | - | 4% | 3% | - |
| A team of both employees and volunteers completes the funding application | 4% | 5% | - | 1% | 2% | - | 6% | 7% | - | 2% | 3% | - | 1% | 2% | - |
| A team of volunteers complete the funding application | 4% | 9% | - | 26% | 40% | - | 4% | 7% | - | 1% | 1% | - | 0% | 0% | - |
| Sector | |||||||||||||||
| Not-for-profit (NET) | 70% | 83% | 77% | 95% | 96% | 94% | 73% | 86% | 82% | 59% | 77% | 69% | 71% | 72% | 67% |
| Public Sector (NET) | 16% | 15% | 14% | 11% | 10% | 10% | 13% | 11% | 9% | 15% | 18% | 17% | 27% | 25% | 34% |
| Private Sector (NET) | 27% | 14% | 19% | 13% | 10% | 12% | 28% | 15% | 20% | 38% | 16% | 23% | 12% | 12% | 13% |
Significantly higher / lower than total
Significantly higher / lower than Year 2
- Organizations with no employees were more likely to provide high ratings across most aspects of service, while those with 50 or more were less likely to agree they received consistent information and were provided with service in their choice of English or French.
- Compared to year 2, organizations with no employees were more likely to agree they needed to explain their situation only once and that the amount of time the application took was reasonable (while all other groups were less likely). Those with 1 to 9 employees provided lower ratings for most aspects of service, while those with 10 to 49 were less likely to agree it was clear what would happen next and when, that it was easy to apply overall and that their personal info was protected and those with 50+ employees were less likely to agree it was easy to get help when needed and that they were provided with service in their choice of English or French.
| TOTAL | NONE | 9-Jan | Oct-49 | 50+ | |||||||||||
| Year 3 | Year 2 | Year 1 | Year 3 | Year 2 | Year 1 | Year 3 | Year 2 | Year 1 | Year 3 | Year 2 | Year 1 | Year 3 | Year 2 | Year 1 | |
| Widest Gaps/ Shifts in Service Attributes (% Rated 4/5) | |||||||||||||||
|---|---|---|---|---|---|---|---|---|---|---|---|---|---|---|---|
| I was able to move smoothly through all of the steps related to the [program] application | 75% | 78% | 70% | 75% | 73% | 69% | 75% | 79% | 70% | 76% | 79% | 70% | 75% | 76% | 65% |
| It was clear what to do if I had a problem or question | 65% | 70% | 62% | 74% | 72% | 70% | 62% | 71% | 62% | 66% | 68% | 61% | 65% | 70% | 53% |
| Throughout the process it was clear what would happen next and when it would happen | 64% | 69% | 58% | 72% | 71% | 61% | 63% | 69% | 59% | 65% | 71% | 59% | 63% | 67% | 51% |
| I was confident that any issues or problems would have been easily resolved | 67% | 70% | 63% | 75% | 68% | 73% | 66% | 72% | 64% | 67% | 69% | 59% | 66% | 70% | 58% |
| I needed to explain my situation only once | 65% | 67% | 62% | 76% | 69% | 70% | 64% | 69% | 63% | 65% | 64% | 60% | 63% | 67% | 56% |
| It was easy to get help when I needed it | 63% | 69% | 61% | 73% | 68% | 63% | 61% | 69% | 62% | 65% | 70% | 63% | 60% | 70% | 52% |
| Overall, it was easy for me to apply for [program] | 78% | 79% | 74% | 78% | 70% | 73% | 78% | 80% | 75% | 77% | 83% | 73% | 78% | 80% | 68% |
| I was confident that my personal information was protected | 81% | 83% | 88% | 88% | 86% | 93% | 79% | 81% | 87% | 80% | 86% | 88% | 84% | 85% | 89% |
| I received consistent information | 73% | 76% | 72% | 82% | 74% | 78% | 73% | 77% | 70% | 73% | 77% | 74% | 67% | 74% | 65% |
| It was easy to access service in a language I could speak and understand well | 90% | 91% | 95% | 92% | 94% | 95% | 89% | 91% | 95% | 90% | 91% | 94% | 92% | 90% | 95% |
| The amount of time it took was reasonable | 58% | 66% | 56% | 71% | 63% | 62% | 56% | 66% | 57% | 59% | 68% | 56% | 56% | 64% | 48% |
| I was provided with service in my choice of English or French | 91% | 93% | 96% | 96% | 94% | 98% | 91% | 92% | 96% | 93% | 93% | 95% | 88% | 93% | 94% |
Top 5 driver of satisfaction
Significantly higher / lower than total
Significantly higher / lower than Year 2
Key Differences by Sector
- Overall satisfaction was consistent across sectors in which applicant organizations operates in, however there were some notable differences across aspects of service, specifically among private sector organizations. Seven in ten not-for-profit and public sector organizations were satisfied (70%), followed closely by two-thirds of private sector organizations (66%). Satisfaction has decreased among not-for-profit and private sector organizations compared to Year 2.
- Private sector organizations were less likely to have received funding approval and to find it easy to navigate all aspects of the GoC website, while public sector organizations were less likely to find it easy to determine if their organization was eligible for funding or the amount of time each phase was anticipated to take. Not-for-profit organizations were more likely to find it easy to understand the information about the program.
- Compared to Year 2, not-for-profit organizations were less likely to feel it was easy to determine if their organization was eligible for funding, along with public organizations who also were less likely to find it easy to determine the amount of time each phase was anticipated to take. Those operating in the private sector were less likely to feel it easy to determine when the application period takes place.
| Overall satisfaction (Rated 4/5) | ||||||||
|---|---|---|---|---|---|---|---|---|
| Not-For-Profit | Public | Private | ||||||
| 70% | 78% | 70% | 70% | 76% | 66% | 66% | 76% | 67% |
| Year 3 | Year 2 | Year 1 | Year 3 | Year 2 | Year 1 | Year 3 | Year 2 | Year 1 |
| (n=2442) | (n=1641) | (n=1268) | (n=518) | (n=296) | (n=220) | (n=583) | (n=265) | (n=251) |
| TOTAL | NOT-FOR-PROFIT | PUBLIC | PRIVATE | |||||||||
| Year 3 | Year 2 | Year 1 | Year 3 | Year 2 | Year 1 | Year 3 | Year 2 | Year 1 | Year 3 | Year 2 | Year 1 | |
| Funding Approval | ||||||||||||
|---|---|---|---|---|---|---|---|---|---|---|---|---|
| % Approved | 79% | 93% | 90% | 81% | 93% | 91% | 78% | 91% | 88% | 73% | 91% | 86% |
| Ease of Navigating GoC website (% Rated 4/5) | ||||||||||||
| Find general information about [program] | 82% | 82% | 82% | 83% | 81% | 83% | 78% | 78% | 77% | 74% | 76% | 78% |
| Understand the information about [program] | 77% | 80% | 76% | 80% | 80% | 77% | 75% | 82% | 65% | 65% | 74% | 73% |
| Determine if your organization is eligible for [program] funding | 80% | 84% | 83% | 82% | 86% | 85% | 70% | 79% | 74% | 73% | 73% | 76% |
| Determine the steps to apply for funding | 81% | 81% | 78% | 81% | 82% | 79% | 79% | 80% | 70% | 74% | 76% | 70% |
| Determine the amount of time each phase of the application process is anticipated to take | 56% | 58% | - | 57% | 58% | - | 49% | 62% | - | 49% | 51% | - |
| Determine when the application period for [program] takes place | 79% | 83% | - | 80% | 82% | - | 83% | 83% | - | 72% | 81% | - |
Significantly higher / lower than total
Significantly higher / lower than Year 2
- Private sector organizations were less likely to find nearly all aspects of the application process easy, were more likely to report being first-time applicants or having applied once or twice before and to have been solely responsible for the application. Not-for-profit and public sector organizations were more likely to have applied for the same program on an annual basis. Public sector organizations were less likely to find it easy to get help when needed.
- Compared to Year 2, organizations operating in all sectors were less likely to report being first-time applicants. Not-for-profit organizations were less likely to agree it was clear what would happen next and when, to get help when needed (along with public sector organizations) and that the amount of time it took was reasonable and were more likely to report that they apply for the same program annually. Public sector organizations were less likely to feel confident that any issues would have been easily resolved and that they received consistent information, while private sector organizations were less likely to agree it was easy to apply overall.
| TOTAL | NOT-FOR-PROFIT | PUBLIC | PRIVATE | |||||||||
| Year 3 | Year 2 | Year 1 | Year 3 | Year 2 | Year 1 | Year 3 | Year 2 | Year 1 | Year 3 | Year 2 | Year 1 | |
| Widest Gaps/ Shifts in Service Attributes (% Rated 4/5) | ||||||||||||
|---|---|---|---|---|---|---|---|---|---|---|---|---|
| I was able to move smoothly through all of the steps | 75% | 78% | 70% | 76% | 78% | 70% | 76% | 79% | 57% | 70% | 75% | 68% |
| Throughout the process it was clear what would happen next and when it would happen | 64% | 69% | 58% | 65% | 70% | 58% | 67% | 73% | 54% | 60% | 65% | 57% |
| I was confident that any issues or problems would have been easily resolved | 67% | 70% | 63% | 69% | 70% | 63% | 66% | 73% | 60% | 62% | 62% | 54% |
| It was easy to get help when I needed it | 63% | 69% | 61% | 65% | 70% | 63% | 57% | 73% | 60% | 61% | 62% | 54% |
| Overall, it was easy for me to apply | 78% | 79% | 74% | 78% | 79% | 75% | 78% | 81% | 66% | 72% | 79% | 69% |
| I received consistent information | 73% | 76% | 72% | 75% | 77% | 72% | 69% | 80% | 74% | 68% | 71% | 65% |
| The amount of time it took was reasonable | 58% | 66% | 56% | 58% | 67% | 56% | 61% | 67% | 55% | 57% | 60% | 57% |
| Application frequency | ||||||||||||
| First application | 10% | 19% | 13% | 10% | 20% | 11% | 10% | 17% | 11% | 13% | 22% | 23% |
| Applied once or twice before | 24% | 19% | 20% | 19% | 19% | 17% | 15% | 15% | 14% | 37% | 27% | 30% |
| Applied several times before | 26% | 25% | 26% | 28% | 25% | 27% | 30% | 24% | 28% | 21% | 19% | 25% |
| Apply for the same program on an annual basis | 39% | 35% | 41% | 42% | 35% | 45% | 43% | 41% | 46% | 28% | 32% | 22% |
| Role in application | ||||||||||||
| I am solely responsible | 71% | 62% | - | 68% | 58% | - | 71% | 67% | - | 81% | 76% | - |
| A team of employees are dedicated to completing the funding application | 17% | 20% | - | 18% | 21% | - | 21% | 22% | - | 13% | 15% | - |
| A team of both employees and volunteers completes the funding application | 4% | 5% | 4% | 5% | 2% | 3% | 1% | 3% | - | |||
| A team of volunteers complete the funding application | 4% | 9% | - | 6% | 10% | - | 3%% | 3% | - | 2% | 4% | - |
Top 5 driver of satisfaction
Significantly higher / lower than total
Significantly higher / lower than Year 2
How Well-Equipped Organizations Felt to Complete an Application
- Many applicants felt well-equipped to complete the Gs&Cs application process and much of this was underpinned by personal past experiences of completing funding applications.
- Applicants from larger organizations tended to agree that the application process favours organizations such as their own, which have more resources and staff expertise at their disposal. Some larger mentioned they helped smaller organizations go through the process.
- Some applicants from smaller organizations shared the perspective that the process favours larger organizations based on their experiences, but this view was not universal. In contrast, other applicants from smaller organizations felt that the process of applying was “straightforward” and stressed that it was their responsibility to “educate” themselves about the process.
- When asked about inclusivity and catering to the diverse backgrounds of applicants, applicants reported few inclusivity or accessibility barriers.
“We do our own applications in the office itself… They do have the expertise… That helps, definitely, if you applied before. You kind of have an idea, what they’re going to ask you for. And you can almost collect it earlier or pull it up from all the applications.”
"Je vous dirais, pour ma part, c'est la première fois que je faisais une demande de subvention. Je me suis enfargé un peu, beaucoup; j'ai trébuché beaucoup au début. Après des discussions avec quelqu'un du programme de Nouveaux Horizons, ça m'a permis d'avoir des éclaircissements."
Demographic Profile Of Survey Participants
Demographic Profile of Survey Participants

Click for larger view
Figure 76: Language organization Prefers to receive service in:
This horizontal bar chart shows responses to a question about which official language the applicant’s organization prefers to be receive service in. All 3041 respondents answered as follows:
- English: 71%
- French: 23%
- Both: 6%

Click for larger view
Figure 77: Language organization provides service in:
This horizontal bar chart shows responses to a question about which official language the applicant’s organization provides service in. All 3041 respondents answered as follows:
- English: 61%
- French: 16%
- Both: 22%

Click for larger view
Figure 78: Language Client Population Speaks
This horizontal bar chart shows responses to a question about which official language the applicant organization’s client population speaks. All 3041 respondents answered as follows:
- English: 59%
- French: 15%
- Both: 23%

Click for larger view
Figure 79: Percentage of Completed Survey’s by Language
This horizontal bar chart shows the proportion of surveys completed by applicants in English and French. All 3041 respondents answered as follows:
- English 77%
- French 23%

Click for larger view
Figure 80: Region(s) applicant organization operates
A map of Canada shows responses to a question about which province the applicant organization operates in. All 3041 respondents answered as follows:
- British Columbia: 13%
- Alberta: 12%
- Saskatchewan: 6%
- Manitoba: 5%
- Ontario: 33%
- Quebec: 25%
- New Brunswick: 6%
- Nova Scotia: 7%
- Prince Edward Island: 3%
- Newfoundland and Labrador: 5%
- Nunavut: 1%
- Northwest Territories: 1%
- Yukon: 1%

Click for larger view
Figure 81: Years in Operation
This horizontal bar chart shows responses to a question about how many years the applicant organization has been in operation. All 3041 respondents answered as follows:
- <1 year: 0%
- 1 - <3 years: 3%
- 3 - <5 years: 5%
- 5+ years: 92%

Click for larger view
Figure 82: Region(s) the Applicant’s Organization Delivers Project Activities in
A map of Canada shows responses to a question about which province the applicant organization delivers project activities in. All 3041 respondents answered as follows:
- British Columbia: 14%
- Alberta: 12%
- Saskatchewan: 6%
- Manitoba: 5%
- Ontario: 33%
- Quebec: 25%
- New Brunswick: 7%
- Nova Scotia: 7%
- Prince Edward Island: 3%
- Newfoundland and Labrador: 5%
- Nunavut: 1%
- Northwest Territories: 1%
- Yukon: 1%
Frequency of Applying for Other Funding in Last Five Years
How often does your organization apply for international, federal, provincial/territorial, and/or municipal/local funding of any kind?

Click for larger view
Figure 83: Frequency of Applying for Other Funds in last Five Years
This horizontal bar chart shows responses to a question about how often the applicant organization applies for international, federal, provincial/territorial, and/or municipal/local funding. All 3041 respondents answered as follows:
- International: monthly 2%, quarterly 2%, bi-annually 1%, annually 20%, less often than annually 6%, never 60%, don’t know 10%, at least annually 25%.
- Federal: monthly 1%, quarterly 6%, bi-annually 6%, annually 61%, less often than annually 11%, never 7%, don’t know 9%, at least annually 74%.
- Provincial/territorial: monthly 3%, quarterly 8%, bi-annually 7%, annually 40%, less often than annually 13%, never 17%, don’t know 12%, at least annually 58%.
- Municipal/local: monthly 2%, quarterly 5%, bi-annually 5%, annually 31%, less often than annually 13%, never 30%, don’t know 13%, at least annually 43%.
Q38c. Thinking about the last five years, how often does your organization apply for international, federal, provincial/territorial, and/or municipal/local funding of any kind?
Base: All applicants (n=1942)
*values less than 3% not labelled
Who Completes the Application?
Which statement best describes your organization as it relates to completing the application for funding?
| TOTAL | EAF | NHSP | CSJ | SDPP | AS | WORBE | SSLP | WER | STAR | SIP | All but EAF, NHSP, CSJ | |
| Base: All respondents (n=) | 3041 | 300 | 1296 | 1004 | 214 | 11 | 22 | 24 | 51 | 3 | 116 | 441 |
|---|---|---|---|---|---|---|---|---|---|---|---|---|
| I am solely responsible for completing the funding application | 71% | 56% | 46% | 76% | 45% | 18% | 32% | 33% | 29% | - | 37% | 39% |
| A team of employees are dedicated to completing the funding application | 17% | 24% | 15% | 16% | 37% | 64% | 50% | 46% | 53% | 67% | 47% | 43% |
| A dedicated in-house proposal writer completes the funding application | 1% | 4% | 3% | 1% | 2% | 18% | 5% | - | 4% | - | 3% | 3% |
| A team of both employees and volunteers completes the funding application | 4% | 6% | 9% | 3% | 8% | - | 9% | 8% | 8% | 33% | 6% | 8% |
| A team of volunteers complete the funding application | 4% | 6% | 23% | 3% | 5% | - | 5% | - | - | - | 2% | 3% |
| We hire (a) consultant(s) to complete the funding application | 1% | 2% | 2% | 1% | 1% | - | - | 4% | 6% | - | 3% | 2% |
| I am not personally involved, although I oversee this or have some awareness | 1% | 2% | 1% | 1% | 1% | - | - | 8% | - | - | 2% | 2% |
Q37. Which statement best describes your organization as it relates to completing the application for funding? Select one response.
Base: All respondents (n=1942)
* small sample size
** very small sample size
Significantly higher / lower than total
Demographic Profile

Click for larger view
Figure 84: Submitted application in past 5 years
This horizontal bar chart shows responses to a question about whether the applicant organization has submitted an application to a different Grant or Contribution program from Service Canada program in the past five years. All 3041 respondents answered as follows:
- Yes: 39%
- No: 42%
- Unsure/Don’t know: 19%

Click for larger view
Figure 85: Frequency of Application
This vertical bar chart shows responses to a question about whether this was the applicant organization’s first application or if they had applied to the program in the past. All 3041 respondents answered as follows:
- First application: 10%
- Applied once or twice 24%
- Applied several times: 26%
- Apply annually: 39%
- Don’t know: 1%

Click for larger view
Figure 86: Number of Employees Part of Organization
This vertical bar chart shows responses to a question about how many employees work (full-time or part-time) for the applicant’s organization. All 3041 respondents answered as follows:
- None: 8%
- 1-4: 26%
- 5-9: 20%
- 10-19: 16%
- 20-49: 15%
- 50+: 15%
- Don’t Know: 0%

Click for larger view
Figure 87: Number of Volunteers Part of Organization
This vertical bar chart shows responses to a question about how many volunteers work (full-time or part-time) for the applicant’s organization. All 3041 respondents answered as follows:
- None: 26%
- 1-4: 14%
- 5-9: 13%
- 10-19: 15%
- 20-49: 14%
- 50+: 16%
- Don’t Know: 2%
Repeat Applicants
Perception of Change in Quality of Service Received

Click for larger view
Figure 88: Sector
This horizontal bar chart shows responses to a question about what sector the applicant’s organization operates in. All 3041 respondents answered as follows:
- Not-for-profit (NET): 70%
- Community, charitable or voluntary organizations, including faith-based organizations (for example, churches, synagogues: 48%
- Non-governmental organizations: 12%
- Associations of workers or employers as well as professional and industrial organizations: 3%
- Indigenous not-for-profit organizations: 3%
- Unions: 1%
- Other: 10%
- Public Sector (NET): 16%
- Municipal governments and agencies, including regional legislative bodies and departments: 6%
- Public health, including public hospitals, nursing homes, senior citizen homes, rehabilitation homes: 2%
- Public degree-granting universities and colleges: 1%
- School boards and elementary and secondary institutions: 1%
- Public community colleges and vocational schools: 1%
- Other: 6%
- Private Sector (NET): 27%
- Business, incorporated or unincorporated bodies including partnerships and sole proprietorships: 21%
- Other: 6%
Change in Quality of Service Received (Repeat Applicants)
- Roughly one in three of those who have applied to the same program previously said that their experience has improved in some way. The highest ratings were for overall satisfaction with the service received, improvement in the ease of completing the application and the ease of submitting the application (33% for all three). Fewer repeat applicants said that the quality of the service they received declined and almost half felt that the service level remained the same.
- Compared to Year 2, fewer repeat applicants reported that their experience improved in some way, while more felt that the overall level of satisfaction with the service received, the ease of getting assistance when needed and the amount of time all the application took declined.
Do you feel the quality of service has improved, declined, or stayed about the same?

Click for larger view
Figure 89: Change in Quality of Service Received (Repeat Applicants)
This horizontal bar chart shows responses to a question about whether the quality of services improved or declined among repeat applicants and presents results for Year 2 and Year 3. Only those who have applied in the past were asked this question. A total of 2240 respondents answered as follows:
- Overall level of satisfaction with service received: Year 3 improved significantly 13%, improved somewhat 20%, about the same 44%, declined somewhat 7%, declined significantly 4%, don’t know 13%. Improved 33%. Declined 10%. Year 2 Improved 38%. Declined 5%.
- Ease of completing application: Year 3 improved significantly 12%, improved somewhat 21%, about the same 50%, declined somewhat 3%, declined significantly 0%, don’t know 15%. Improved 33%. Declined 3%. Year 2 Improved 38%. Declined 4%.
- Ease of submitting application: Year 3 improved significantly 14%, improved somewhat 19%, about the same 50%, declined somewhat 2%, declined significantly 1%, don’t know 15%. Improved 33%. Declined 3%. Year 2 Improved 39%. Declined 4%.
- Clarity of information on [program] website: Year 3 improved significantly 12%, improved somewhat 20%, about the same 49%, declined somewhat 3%, declined significantly 1%, don’t know 16%. Improved 31%. Declined 4%. Year 2 Improved 35%. Declined 3%.
- Ease of getting assistance when needed: Year 3 improved significantly 10%, improved somewhat 17%, about the same 45%, declined somewhat 5%, declined significantly 3%, don’t know 20%. Improved 27%. Declined 8%. Year 2 Improved 32%. Declined 5%.
- The amount of time it took from when I started gathering information to when I got a decision on my application: Year 3 improved significantly 9%, improved somewhat 15%, about the same 46%, declined somewhat 8%, declined significantly 6%, don’t know 16%. Improved 24%. Declined 15%. Year 2 Improved 28%. Declined 5%.
Q44a. Comparing the service you received for [INSERT PROGRAM] in the past with your most recent experience, do you feel the quality of service has improved, declined, or stayed about the same?
Base: Repeat applicants (n=2240)
*values less than 3% not labelled
Significantly higher / lower than Year 2
Change in Quality of Service Received (Repeat Applicants) by Program
- NHSP applicants were more likely to say that their experience has improved in some way, while applicants to all programs but EAF, NHSP and CSJ were less likely to feel that the overall level of satisfaction with the service received has improved.
- Compared to Year 2, applicants to CSJ and SDPP were less likely to feel that the service received has improved (mirroring overall trends), while NHSP applicants gave higher ratings across nearly all aspects of service.
Do you feel the quality of service has improved, declined, or stayed about the same?
| TOP2BOX (% RATED 4/5) | ||||||||||||||||||
| TOTAL | EAF | NHSP | CSJ | SDPP | AS | WORBE | SSLP | WER | STAR | SIP | All but EAF, NHSP, CSJ | |||||||
| Year 3 | Year 2 | Year 3 | Year 2 | Year 3 | Year 2 | Year 3 | Year 2 | Year 3 | Year 2 | Year 3 | Year 3 | Year 3 | Year 3 | Year 3 | Year 3 | Year 3 | Year 2 | |
| Base: All respondents (n=) | 2240 | 1251 | 121 | 40 | 1025 | 261 | 938 | 785 | 86 | 12 | 2 | 3 | 6 | 6 | 1 | 52 | 156 | 165 |
| Overall level of satisfaction with service received | 33% | 38% | 37% | 38% | 44% | 34% | 32% | 38% | 24% | 84% | 50% | 67% | 50% | 17% | - | 21% | 24% | 36% |
| Ease of completing application | 33% | 38% | 28% | 35% | 38% | 29% | 32% | 40% | 27% | 73% | - | 33% | 33% | - | 100% | 35% | 30% | 36% |
| Ease of submitting application | 33% | 39% | 31% | 40% | 39% | 28% | 32% | 41% | 27% | 73% | - | 33% | 67% | - | - | 29% | 28% | 40% |
| Clarity of information on [PROGRAM] website | 31% | 35% | 31% | 28% | 41% | 36% | 31% | 35% | 26% | 56% | - | 33% | 67% | 17% | - | 27% | 27% | 30% |
| Ease of getting assistance when needed | 27% | 32% | 25% | 25% | 39% | 30% | 26% | 32% | 28% | 75% | - | 33% | 33% | 33% | - | 19% | 25% | 34% |
| The amount of time it took from when I started gathering information to when I got a decision on my application | 24% | 28% | 27% | 18% | 35% | 26% | 24% | 29% | 23% | 56% | - | - | 33% | - | - | 17% | 20% | 25% |
Q44a. Comparing the service you received for [INSERT PROGRAM] in the past with your most recent experience, do you feel the quality of service has improved, declined, or stayed about the same?
Base: Repeat applicants (n=2240)
* small sample size
** very small sample size
Significantly higher / lower than total
Significantly higher / lower than Year 2
Detailed Qualitative Findings
Organizational Capacity To Complete The Application Process
How Well-Equipped Organizations Felt to Complete an Application
When asked to reflect on the entire application process, applicants in the qualitative research highlighted a number of aspects of the process which impressed them. However, they tended to be more vocal around what frustrated them.
Many applicants felt their organizations were well-equipped to complete applications.
- All applicants who took part in the research were the main writers of applications to Gs&Cs. For some, this was their sole responsibility while for others, in smaller organizations in particular, writing funding applications was just simply one of many roles they fulfilled.
- Many shared that they had past experiences of completing funding applications which meant that they were confident and comfortable in the process. Some even proactively collected information in advance of completing the application, anticipating what will be required.
- Thus, applicants tended to rely on their personal expertise, other internal resources such as program officers that know the programs well, or board members with past application experience. None of the applicants used an external grant writer. .
- Beyond the importance of experience, applicants described the need for someone to be detail-oriented in framing narratives based on the application objectives.
“We do our own applications in the office itself… They do have the expertise… That helps, definitely, if you applied before. You kind of have an idea, what they’re going to ask you for. And you can almost collect it earlier or pull it up from all the applications.”
"Chez nous, c'est moi qui fais les demandes, donc j'ai beaucoup plus d'expérience, mais je dois avouer que quand je ne suis pas dispo ou que je ne peux pas le faire, ça devient un peu plus compliqué pour les autres, parce qu'ils ne sont pas forcément habitués là-dedans."
“It rests on my shoulders… But, being a non-profit, I do have a board. So, there are people that can help out to review and do all that.”
“I am quite familiar with grant applications, because it’s a big part of my role. So, I didn’t find there was anything that I needed... I would say it took a couple of days to complete the application, mainly because I wanted to run it by my team and our Board of Directors, and make sure we were all onside with it.”
Some applicants felt that the application process favours larger organizations.
Interestingly, it was applicants from larger organizations who tended to point out that that they were at an advantage compared to smaller organizations due to:
- Their greater resources/staff which allows them to complete applications in a timely manner.
- Their expertise in completing such applications, due to factors such as past experiences in doing so, having team members who understand research/policy/capacity building/budgeting, etc.
Applicants from larger organizations empathized with smaller ones, recognizing that smaller organizations may have brilliant ideas but lack the time, staff and/or expertise to respond effectively and in a timely manner.
Some also sympathized with newer organizations that might lack the expertise and experience in completing funding applications and thus be in a disadvantaged position to respond to a Gs&Cs funding opportunity.
“Our organization is over 100 people… We have a good blend of the folks that understand research and policy well, and the folks that understand capacity building. That said, not every organization is structured that way. So, perhaps for smaller organizations… it can be a little bit more difficult…”
“On a de l'expérience, mais notre capacité est très limitée. Parce que si je peux l'appeler un petit organisme, même si c'est un organisme qui existe longtemps [le manque de personnel, de ressources] diminue notre chance de succès, ce qui nous empêche d'avoir les ressources nécessaires pour l'année suivante, etc.”
“It will be difficult without coaching. It takes a lot of time for mentoring and coaching to understand the questions and what they’re asking [in a Gs&Cs application]… So, that would make grassroots or smaller organizations difficult to navigate the applications, and even able to submit an application sometimes too.”
Perspectives of smaller organizations were more varied.
- On the one hand, some applicants from smaller organizations felt that the process of applying was “straightforward” and “simple”. They felt that they had the necessary resources and capacity to effectively complete the process.
- Moreover, there was a view that as applicants, it was their responsibility to “educate” themselves about the process and felt well-supported through information provided on program websites and webinar sessions.
- In contrast, other applicants from smaller organizations shared their lower confidence in their ability to complete the process which were driven by factors linked to their organizational capacity. This included:
- lack of funding application writing experience
- time constraints due to wearing “multiple hats”
- limited tech-savviness
- limited experience budgeting
- “succession” challenges i.e., knowledge of writing funding applications is lost when the person who holds all the expertise moves on
- These applicants therefore shared the view that the process tends to be easier for larger organizations.
“I really appreciate the webinars and the information sessions… They’re doing an excellent job with the information sessions and really trying to help us complete the application.”
“It’s very cumbersome… As a non-profit charitable organization… we only have so many employees… So, we have to make it more simplified. We have to get to the point… The template is onerous and really tough to fill out…”
"Je vous dirais, pour ma part, c'est la première fois que je faisais une demande de subvention. Je me suis enfargé un peu, beaucoup; j'ai trébuché beaucoup au début. Après des discussions avec quelqu'un du programme de Nouveaux Horizons, ça m'a permis d'avoir des éclaircissements."
Inclusivity of the Application Process
When asked about inclusivity and catering to the diverse backgrounds of applicants, applicants reported few inclusivity or accessibility barriers.
- The questions were generally perceived as fair, with no inherent bias (this view was shared by those who belonged to equity groups): the use of clear and plain language made it easy for applicants to understand the application questions.
- A feeling of inclusivity was also sensed by some applicants, driven by the presence of numerous questions about whether their organizations are equity-led.
- More webinars guiding applicants on funding application writing and having a person available for questions would enhance the inclusivity and accessibility of the application process. One-on-one mentoring for diverse groups, such as Indigenous organizations, was further suggested.
- A handful of francophone respondents working in language minority regions noted that they have had issues receiving quality service in French.
“From my experience, I would say it’s inclusive. I feel like the language is, it’s plain language.”
“I think it's very inclusive. I really like the way that it was set up. It asks lots of questions around whether we're an equity-led organization, which we are. We focus on our community. We are queer and trans seniors that work for queer and trans seniors. And I think that comes across well in the questions that are being asked of us. So I feel included in that space.”
"Donc, je vois qu'il y a une limite là-dessus. C'est bien quand ils nous répondent dans notre langue, ce qui n'est malheureusement pas toujours le cas, mais je dirais, c'est un peu ça, le défi."
Top Of Mind Associations With The Application Process
Top-of-Mind: What Impressed Applicants
When asked to reflect on the entire application process, applicants highlighted a number of aspects of the process which impressed them:

- Notifications: The email notifications sent to applicants regarding the availability and upcoming funding opportunities were appreciated for prompting applicants to apply and keeping them on schedule.
- Outreach from programs: A few applicants appreciated outreach from programs that invited them to complete an application, as it made them feel trusted and thus motivated to submit their application.
- Smooth, straightforward process: Applicants with past experiences of Gs&Cs tended to find the process smooth and predictable; in other words, the process aligned with their past experiences. The smoothness of the process was deemed a pleasant surprise as interactions with government are often expected to be drawn out with lots of back and forth.
- Existence of grants: There was broad appreciation for the existence of Gs&Cs from government. In addition, some smaller organizations who applied for the first time were pleasantly surprised to find out that the government had programs to support the types of communities and activities their organization focuses on.
- Shift to digital: The move to online forms and online portal was highlighted as a positive by several applicants.
- Shorter forms: A few applicants felt the forms were less repetitive, shorter and more streamlined compared with in the past.
- Help from Service Canada Agent: One applicant in QC was delighted with the support they received from an agent with their application.
In Their Own Words | What Impressed Applicants
“I think they do well at communicating that the grants available. I just got communication one week ago that the New Horizons grant will be available again on the 1st of August, which is today. And so that came very timely and allowed us to prepare, have a discussion as a board, “Are we going to apply it this year?” But it's not like, “Oh, here's the grant, it's open today.” They gave us at least a week or two to prepare, at least to think of what are we going to be applying for. And then it opens today. And then we have until September to make the application. So I think the timing of it and the communication of it is really good.”
“What impressed me is there was actually a program available. There was funding available to do something like that… And that they’re supporting the types of activities that your organization does. I was very impressed that it was there, New Horizon. And it also kind of gives you some of the framework as to what they wanted you to do with that money for the seniors.”
“I think that the ease of the online application, because I remember the old days of, you know, written out.”
“Avant [que ce soit entièrement en ligne], il fallait que je me déplace au bureau de poste pour envoyer sous scellé. Ça a beaucoup aidé. En général, je dirais que c'est très positif. Ça a apporté beaucoup de rapidité dans la demande....”
“Canada Summer Jobs was fairly straightforward. So, I didn’t have much interaction with anybody beyond just completing and submitting. For SIP, the process was quite good, and we had access to a person that worked at ESDC who could explain things if they were unclear. That said, because we had already previously applied to and received SIP funding, we were very familiar with the process, and already had those contacts in place as well. I did find them to be very responsive. If we ever did have questions, yeah, my experience with the application process was positive I would say.”
Top-of-Mind: What Frustrated Applicants
Consistent with past waves of the Gs&Cs CX research, applicants tended to be more vocal on the negative than the positive aspects of their experience. This was especially true among applicants who recorded lower overall satisfaction scores in the quantitative survey. Frustrations tended to be fairly common across applicants from different programs which included the following:

- Notification of funding decision timelines: The notification period emerged as a major and common source of frustration, with some reporting they waited for 6-12 months to receive an outcome. This placed organizations in limbo, unable to make planning and staffing decisions. While common across all programs, delays appeared to be a key source of dissatisfaction among Sectoral Initiative Program and the Skilled Trades Awareness and Readiness Program applicants.
- Unsuccessful in receiving funding: Not receiving funding was another key driver of negative impressions. A few applicants were very surprised that they were unsuccessful in receiving funding given their years of expertise in delivering programs. This was compounded by lack of details/reasons for non-funding and perceived lack of transparency on scoring criteria. This was especially underscored by a few Social Development Partnerships Program and Sectoral Initiative Program applicants.
- Level of detail required: Some felt the level of detail required in the applications was cumbersome and often repetitive, making the process time-consuming for resource-strapped smaller organizations. Some also felt frustrated by having to find different ways to make the same point. More negative feedback tended to be raised by applicants of Social Development Partnerships Program and Women's Employment Readiness Pilot Program, albeit not exclusively.
- Fast turnaround time following funding decision: The often-tight turnaround time after receiving a funding decision made it challenging for organizations to plan and initiate projects: it caused disruptions in their operations (including staffing and program planning) and hindered their ability to plan alternative activities or secure funds from other sources. Moreover, the lack of flexibility in revisiting costs was mentioned by one applicant in the context of inflation affecting original quotes for the project.
In Their Own Words | What Frustrated Applicants
“The timing is a little slow. From the time of application to notification of the decision is about six months. That’s a fairly long time. A lot can happen in that six months… Three months would be great… With the summer jobs in particular because obviously, we’re hiring young people. So, just it’s kind of challenging when we’re hoping to hire somebody starting in May, when we don’t actually find out at the decision until the very end of April.”
“Je vous dirais, la seule chose que j'ai trouvée frustrante au début, c'est de comprendre le formulaire. C'était un petit peu quand qu'on va en appel d'offres, il faut comprendre le devis. En fin de compte, c'est de comprendre le devis du programme, puis de s'y plier et d'être conforme au programme, tout simplement .”
“Being connected to a lot of not-for-profits that are very similar to our own in various sectors, there is a lot of frustration around the length of time that it’s taking to let us know whether or not we’ve made it through the process or not. For the last three that I submitted, the first one took over a year, and the last two took a year and a quarter. And it’s very hard for organizations like ourselves, as well as the consortiums and the partners that ESDC wants, and wants us to build, to fulfil these things. It’s hard to wait a year and a quarter to find out if your program is moving forward or not… The whole organization is on pause… Do we staff up? Do we lay people off? Can we plan going forward? Do we have to fold up our business?”
“Answering the similar questions like ten times in a different ways, that’s really frustrating. Some of the questions are not very clear. That also makes the experience not very positive in some way.”
“I think the transparency in the scoring is something that I became aware of, which I wasn’t clear in the application, was if you applied and received the funding previously, that wasn’t looked at favourably. I didn’t’ see that anywhere in the application. So, that came to as a surprise.”
“On n'avait jamais eu de réponse pourquoi on avait été refusés à deux reprises. Alors, en bout de ligne, j'ai dû essayer d'imaginer, avec la municipalité, un plan d'action qui nous permettrait d'avoir de meilleures chances.”
Detailed Findings On The Application Journey
Raising Awareness of Gs&Cs

Overall, ESDC was seen by many as doing an excellent job of raising awareness about the various funding programs that are available.
- Some applicants were of the opinion that obtaining Gs&Cs funding is very competitive and programs are often over-subscribed. These applicants thus concluded that there is good awareness of ESDC Gs&Cs funding opportunities.
- Once an applicant has applied for or received funding once, they received alerts about subsequent rounds of funding. This was a typical way in which applicants had learned about the latest program intakes. Word of mouth was another common way for applicants to learn about funding opportunities. A few others found out about them from their MPs office.
- Applicants with a Government of Canada Online Services (GCOS) account reported that they received notifications when new programs or applications become available. This feature was broadly appreciated, as it provided them with a reminder, and time to complete and submit their application.
- A small number of organizations – of various sizes, and both those that were funded as well as those that were not funded – found it more challenging to learn about new grants and applications. They felt the need to monitor GCOS, ESDC’s social media and/or the program websites frequently to stay informed, instead of receiving direct notifications.
- Further, some shared the belief that organizations need to be proactive in learning about funding opportunities that can benefit their community, and that it’s their responsibility to take actions to become aware of them. In their effort to be proactive, some occasionally did Google searches using key words, to see whether there were any new grants available that they were not yet aware of, others subscribed to lists that would notify them about relevant grant opportunities.
Raising Awareness: Program-specific Nuances
Subgroup analysis revealed nuances by applicants of some programs. These differences were not as pronounced for programs that are not highlighted.


POSITIVES:
- Canada Summer Jobs program especially was believed to be well-advertised and widely known, making it prominent and easily accessible.
NEGATIVES:
- Some applicants felt the following programs did a poor job of building awareness about the existence of the programs and notifying organizations about upcoming funding opportunities. Instead, applicants rely on their own research or word of mouth.
- Social Development Partnerships Program (Disability and Youth Streams)
- Apprenticeship Service
- Skilled Trades Awareness and Readiness Program
- Women's Employment Readiness Pilot Program
In Their Own Words | Raising Awareness
“We know they exist. Canada Summer Jobs is very well advertised. Pretty much everybody knows about it. So, there’s a knowledge mobilization component to that program is very well done. And it is very prominent and present. For the SIP we know that it exists because we’ve been applying to it and received funding from it for quite a while. So, we just have the alerts, we are notified and can apply… We just set an alert. They may also come from ESDC… I think they’re doing a good job. And they leave a lot of time to apply. So, once this is posted, and it’s advertised and people are alerted that it’s available, there is, I think several – I want to say at least a month if not two or more to kind of create your application.”
“It was difficult. I feel the department used to do a better job at releasing bulletins or sharing the information with service providers prior to the release of the SDPP. You know, letting us know that it would be coming so that we could prepare ourselves, and then get an email around that. The opposite has happened. So, therefore, we now need to go to GCOS… the calls for proposals are released there. So, instead of us waiting to be informed about it, we have to go and check everyday. We set up news events for ourselves. So, that if it is released in a press release or through the department’s website, we will get that… So, we would set a news alert on ESDC, calls for proposals, CFP, using different words.”
I just found about Women’s Employment Program by going online and just checking. That’s what I am doing all the time. And I wish there was some kind of an alert system, you know, that would let you know, like if you are interested in ESDC projects, as an organization, and you’re looking for funding for, you know, specific things, that you should be able to register so that you can just get regular mailings. Aside from – I mean I am not telling them to stop doing the other, you know, carry on. But I do think that would helpful if you could actually register. So, it would just be on a list. And you’d get the emails.”
Program Websites
Program websites were the main source of support used by applicants and the feedback on the websites and supporting documents was predominantly positive.
Website navigation was described as smooth and straightforward, and the information posted was easy to understand and fairly intuitive. This in part was attributed to familiarity with using the sites from past applications. Applicants found the websites comprehensive and informative, and the FAQ sections very helpful.
However, a handful of pain points emerged:
- Inaccurate or missing information – for example, one applicant had noticed contradicting information between the applicant guide, the CFP on the website, and the actual application form. This led to confusion and a tendency to check the information very carefully.
- Excessive use of acronyms on some program websites without an explanation. This led to added time in researching their meaning. Suggestions were made for clearly indicating the meaning of acronyms on the website and in the guidelines.
- A couple of applicants who required clarification after reviewing the website submitted their questions through the website. The answers they received were unhelpful as they were not specific to their question, rather they repeated the information contained on the website.
Program Information Sessions

Program information sessions were appreciated but opinions were mixed on their perceived value.
The main criticism of the sessions was that the sessions mainly shared information already listed on the website. This was one of the main reasons given for not taking part in these sessions. Finding about the sessions too late was the other key reason given for non-attendance.
Still, many applicants appreciated the opportunity to attend sessions especially when sessions include an interactive Q&A element. Some applicants took up the offer to ask clarifying questions while others used it as a “competitor-watching” opportunity. The latter hesitated to ask questions as they did not wish to disclose their bidding “strategy” to others.
Among those who attended the sessions, a couple of applicants shared negative experiences:
- An applicant did not receive an answer to a question posed during the Q&A within a timely manner and they were frustrated at the lack of opportunity to ask questions specific to their project idea.
- In another case, the organization did not include written partnership agreements in their application due to information shared in the session. They were subsequently informed that their application was scored lower due to lack of such agreements.
In Their Own Words | Program Websites and Information Sessions
“We definitely consulted the websites as well as the frequently asked questions. These resources I think are well done. The eligibility requirements, the concept of what they’re looking for, I haven’t found it unclear… I thought it was clearly put together and didn’t often require additional information. The FAQs are usually quite helpful too. And what I’ve seen them do in the past, is that they also host these Ask Me Anything sessions where people who are interested in applying can show up and pose questions to the ESDC staff that’s assigned to this.”
"Oui, pour le site web, c'est pas mal complet, puis il y a toujours un guide dans les deux langues.”
“Those pre-calls just walk through what’s available online. We stopped going to those, because you can’t ask any questions about your own project. You can’t even ask if they think it’s a good idea, what you’re coming with… Often at these sessions we’d say, there’s a bit of confusion here, what did you mean by this? They take ages to get back to you. And then, you only have 30 days."
"Moi, je pense que les sites sont quand même bien montés, même s'ils ne sont pas en appel de projets, l'information de base est quand même là, on sait ce que ça va demander, on sait quelle clientèle est visée. À ce niveau-là, il n'y a pas particulièrement d'enjeux.”
“I think that they are useful. I attend all of them. I don't know if they always highlight some of the important pieces… Say for example the Workforce Solutions program that we were invited to, I don’t ever remember them saying, you must send it by email. That never happened. So, that would have been nice. They don’t usually say anything that is different from the applicant guide. It’s usually very consistent… Now, sometimes, they put it out there for questions. It’s great that they do that. It’s very helpful that you’re able to ask questions. But as soon as you ask that question, everybody that you’re competing with knows your angle.”
The Application Form: The Positives

Past experiences with writing funding applications resulted in high levels of comfort with the application forms. The application forms were described as “standard” or “typical” to what applicants were used to filling out. Further, the clarity of instruction was appreciated.
Completing the application took applicants anywhere from half a day to several days, depending on factors such as past experiences in applying for that grant or contribution, the number of people the lead writer consulted with, the need for approvals within the organization and time required to obtain external quotes. In addition, applicants were aiming to differentiate their projects from those of other candidates, which added an extra level of consideration, and thus time, to formulating their answers.
Applicants who submitted applications for significant amounts of funding tended to believe that the length of the application was in proportion to the amount of funding being requested. They understood the application form in the context of public accountability and they wished to showcase the value that their work would bring, if they were to receive the funding. As such, they did not feel that the application was excessively long.
Several applicants felt that going through the detailed questions helped them think about how their program would come to life, which lead them to have better ideas and ultimately better programs. For example, completing the fields on tasks, responsibilities and skills on the Canada Summer Jobs application resulted in providing a more meaningful real world work experience.
“The biggest thing is it was very clear what needed to be done. And I really appreciated that for both of them, there was a very specific application form that needed to be filled out. And a very specific budget form that needed to be filled out.
I think it's understandable given the amounts of money that were being requested, that the applications for $10- or $20-million dollars would be much more in depth than those asking for a lot less.”
“Moi, je vous dirais que ça ne me pose pas particulièrement problème parce que, depuis plusieurs années, je vois les programmes, je suis habituée à le faire, et puis tout ça. Je m'excuse, mais c'est un peu ma job. .”
The Application Form: The Negatives
Repetitiveness of questions and complexity of filling out the budget forms were the main negative issues experienced by some applicants.
Some questions within the application were found to be very similar or repetitive, at times asking the same question in different ways. This created some ambiguity and left some applicants uncertain about what the similar questions were each trying to get at. A few applicants felt the applicant guide they referred to did not provide any additional clarity on the type of information required under each question.
Thus, some found it challenging to answer questions in the application without repeating the same points. Others repeated the same points in fear of not being successful if they missed stating points under one specific question. A small number felt irritated at the repetitive nature of some questions; the application felt longer as a result and therefore more time-consuming.
Budget forms were perceived as complex, cumbersome, extremely detailed, time-consuming and generally challenging for several applicants. Some applicants found that they included unfamiliar financial terms, complex calculations, unclear or vague definitions open to interpretation (for example “promotional outreach”, “materials and supplies”).
Character limits were a source of frustration in a small number of cases. It made it challenging for these applicants to capture the essence of what they were trying to say without losing any important details. A couple who did not receive funding felt they may have lost out because of this, as they assumed those evaluating the applications may not have gotten a complete picture of what the applicant was trying to communicate.
“The sections don’t always feel like mutually exclusive. You have a section that talks about deliverables, and then you'll have another one on evaluation, and one on results. I find even with the description and the applicant guide, there’s things that seem synonymous, like basically what are your outputs and outcomes, and then how are you going to evaluate this for example?”
“One of the things that trips me up is – so, there’s a question about your organization, or what’s the need for this particular program? And you put your argument in, and you hit all your points. The next question may ask you something, but there’s a couple points in this previous one that – you’re not sure, you’ve put your answer here. So, do you have to put it here too?... And then the next question… I don’t want to be excluded because I don’t know if it’s the same person looking at 1, 2, and 3...”
“It’s a lot of time for a small organization, and the budget is very complicated, the rates and criteria. We have to go to the different websites to find out what the rates of all those things are. I think that there is examples of simpler budgets. Arts councils have one that calculates all the material very easily.”
The Application Form: Program-specific Nuances
Subgroup analysis revealed nuances by applicants of some programs. These differences were not as pronounced for programs that are not highlighted.
Canada Summer Jobs
- The application was described as an improvement over previous years, in terms of clarity, length and complexity.
- List of job types with codes and job titles, in a drop-down menu, did not always fit with the applicant’s needs which posed challenges with advertising the position.
- Limited funding and timeframe of the program poses barriers for organizations wishing to hire persons with a disability.
New Horizons
- Application was described as simple, streamlined and straightforward by several, and shorter than in previous years
- Appreciation of examples provided in the guidance (e.g., letters of recommendation)
Social Development Partnerships Program
- Applications were challenging and time consuming to complete: the forms were complex and long, and some questions were described as ambiguous.
- One applicant also had to look up unfamiliar terminology they came across in the application.
Women's Employment Readiness Pilot Program
- The application was described as more cumbersome in terms of length and detail required compared with other ESDC grant applications.
- Challenges were attributed to the fact that it’s a larger grant, and that it’s a pilot program.
Completing the Application
The majority of applicants opted to fill out the applications online – via GCOS or program websites. The preference was to work on a draft copy of the application in a Word document, or a shared document if a team was involved, prior to submitting final answers.
Fillable PDFs were generally the least preferred mode of completing applications. They were seen as not user friendly: applicants had difficulties with fitting answers into boxes, attaching additional pages with responses and cross-referencing these to the main application was cumbersome or, they did not have the correct PDF reader. The transition from PDF applications to online modes was a welcome improvement.
That said, there were a few applicants who view PDFs as convenient due to their familiarity with them. Another advantage of PDFs highlighted was the ability to view all questions in advance of starting. This enabled applicants to better plan their responses and gather necessary documentation.
Using responses from past applications as a base for new ones was common. Word documents or shared Google documents were seen as more conducive to drafting and reviewing responses, collaboration too in the case of shared Google documents. These formats also overcome the inability to save progress on online forms that a small number of applicants experienced. Cutting and pasting answers into application forms was a common behaviour.
Word-count limits drew positive and negative comments. Some appreciated them as they provide guidance on length of response, while others find them frustrating as it can be challenging to condense all their points within the limit.
Completing the Application: GCOS Experiences
The research found that ESDC communication nudging applicants to GCOS is having the intended effect in some cases. Consistent with previous years of the Gs&Cs CX research, creating a GCOS account emerged as the main challenge encountered. Experiences of using GCOS were largely positive.
The cumbersome nature of fillable PDFs had motivated some applicants to sign up for GCOS. Others were under the impression that GCOS was their only option for submitting an application. Others received a letter or email that encouraged them to use GCOS, and they decided to try it.
Creating a GCOS account emerged as a common pain point, as it entailed many steps, was generally complicated and time consuming, and required applicants to obtain a number from the Canada Revenue Agency in advance. Some smaller organizations also described it as requiring a certain level of “tech savviness” which they did not necessarily possess.
A few applicants noted that logging into GCOS was also somewhat cumbersome, as it entailed multiple steps.
Some were discouraged by the fact that the organizational GCOS account was linked to them personally, rather being a separate account. This did not “make sense” for applicants as they wished to keep their personal accounts separate from a work account; partly driven by confidentiality concerns but also linking the two did not make intuitive sense to these applicants. Ultimately the potential benefits of GCOS were seen to outweigh this concern. A few applicants also voiced some concern around potential future challenges with succession planning given the GCOS account was tied to them personally, rather than to their organization.
Once using the GCOS portal, applicants highlighted mostly positives. The system:
- is user-friendly in terms of ease of navigation
- has the ability to save progress and review before submitting
- the large word-count limits provides flexibility
- conveniently hosts past, ongoing and upcoming applications in one place.
Only a handful experienced technical issues. Among the few who did, they were minor (for example, unable to attach a document, being timed out and answer not saved) and redressed when they reached out for help via email.
The lack of formatting within the text fields in GCOS was a minor pain point in the context of formulating answers or, if successful, revisiting their application for administration purposes at a later date. This was overcome by working in and saving a final Word copy of the application.
In Their Own Words | GCOS Experiences
“My personal and my business are two separate things, so the fact that GCOS links them together, I don’t appreciate it. Why would I need my personal information linked to a company I work for? That doesn't make any sense to me. It should just be based on my work credentials.”
“It saves me from having to download forms, find where I saved it, and those forms may or may not be fillable. And if it’s not fillable, then I have to print them out. And sometimes PDF writer doesn’t work, then I have to write it by hand and then scan it and then figure out where I saved where I scanned it. And then I have to email it, and make sure I have all the attachments. GCOS bypasses all of that.”
“ Depuis que le processus de demande est en ligne, je trouve que c’est beaucoup plus simple, parce qu’avant, c’était beaucoup plus complexe à comprendre, puis beaucoup plus complexe à utiliser.”
“I do feel that GCOS is a huge improvement from the paper forms. And it is quite easy to use for sure. GCOS is one of the things that I have some positive feedback about. It saves very well. It’s easy to log in. It’s quite clearly laid out.”
“Yes, I used GCOS. So basically, I create it in Word. Then I copy and paste it into GCOS because it can time out on you. But it’s also really helpful because the formatting is kind of bizarre in GCOS, once you save it it’s this big, long, no bullets, things like that. What often happens is, if we have been awarded a project, they then ask me for the project in Word. It’s good to have the backup, like, here this is really what it looks like, all nice and… you can see bullets.”
“We’ve been using GCOS since it came out. So, the paper application is a PDF form whereby when you fill a box that’s this big, you have to do supplementary papers, and then mail it off or scan it to email. So, it’s much easier to just go into GCOS and type away…. We’ve looked at doing a fillable PDF. However, the forms it seems to not have been updated. And therefore, once you’re at maximum number of words, you were told you have to submit, you have to attach another separate paper. It becomes cumbersome… So, at one stage, we did look, but we found GCOS is superior.”
“Avec le portail, on est sûrs et certains que téléverser des documents et puis valider chaque étape. On a une petite coche verte sur le site qui vous dit que vous avez bien répondu à la question, vous avez mis tout ce qu'il fallait. Donc, SELSC, moi, je n'utilise que ça.”
Completing the Application: Barriers to Using GCOS
Greater use of GCOS could be achieved through: raising awareness of GCOS, its potential benefits and simplifying the steps for creating an account and logging into the system.
Several applicants were simply not aware of GCOS, and so defaulted to other application methods.
There was a sizable portion of applicants who had either explored or started the process of creating an account but were either put off or became frustrated with the process.
Specifically, needing to obtain a number from the CRA beforehand added an extra step which amplified perceptions of the process being drawn-out and cumbersome. Questions were raised some questions around why their personal information (such as social insurance number) was required to set up an account for the purpose of applying for a grant for their organization. A few went on to wonder why it was necessary to have such a highly secure method in place for funding applications that, in past years, were simply mailed or emailed in. The prospect of having to create and remember yet another set of log-in credentials was highlighted by a few.
The barriers were more pronounced among some smaller organizations who did not feel they had adequate resources to dedicate to such task; those who identified as less tech-savvy lacked confidence in their ability to effectively set-up an account; and those newer to their organization or in a volunteer role, felt they didn’t have access to some of the organization-specific information that setting up a GCOS account required.
Moreover, these applicants had become familiar with other methods of submitting their application, express satisfaction with them, and thus felt no need to invest time and effort in creating a GCOS account. In other words, they were unclear of what added benefit a GCOS account provides. Some also made the assumption that using GCOS would be more work than their current method, especially at first since it was unfamiliar to them.
Interest in using GCOS in future was lukewarm at best, especially among smaller organizations and/or those less tech-savvy. These applicants would need to be persuaded of the benefits, and barriers to creating an account would need to be significantly reduced before they would entertain a switch.
"J’ai essayé de me connecter puis d’avoir un numéro, de faire authentifier et tout le processus, mais ça ne marche pas. Je n'ai jamais pu connecter. Le processus de connexion ne fonctionne pas dans mon cas. C'est peut-être moi qui fais une bêtise. Peut-être que le portail m’apporterait des avantages que je ne connais pas."
Supports for Completing the Application
Many were satisfied with the level of guidance offered in the applicant guide and did not have to turn to any additional resources. That said, there were some issues experienced by a minority of applicants.
A few applicants found the online guide to be unhelpful, as they felt it provided lengthy and complex explanations that were confusing, difficult to absorb, and at times ambiguous. This left some applicants feeling uncertain about whether they were interpreting the information correctly.
A small number reached out for support via email (for example, to obtain clarity about a specific question in the application or technical issues). Most felt the responses were timely, though not always helpful: a few found it difficult to explain their question in writing which resulted in numerous emails back and forth containing clarifications, and others felt it was challenging to follow written tech support guidance (though they were able to follow the instructions and ultimately fixed the issue).
Applicants were split on their channel preferences for how to best get their questions answers. Some were satisfied with, and preferred email as was easy, familiar and convenient for them. Others said they wished they had the option of speaking with a live person over the phone so they can avoid the back and forth and obtain their answer in real time. Some applicants suggested that it would be helpful for ESDC to make over-the-phone coaching and technical support available to applicants.
A handful of applicants looked up information about organizations that had been approved for the grant in the past, to get a sense for what their programs looked like and to see if there is anything they could learn from those organizations to help strengthen their own application.
“I find I am often consulting with the guide and with the criteria on the website, to make sure that I am following everything properly.”
“Je dirais que pour Emplois d'été Canada, ce qui est le fun parce qu'on peut aller consulter sur internet, ils nous offrent deux ou trois webinaires, puis là, il y a quelqu'un qui nous explique en direct les renseignements à répondre, comment les répondre, puis quel pointage ça vaut. Je trouve ça très positif et efficace.”
“If we could get somebody to talk to while we’re doing it, in terms of some of the questions. Just to say what does this service deliver mean? Or what does this particular question mean? A little bit of coaching.”
Timeliness of Receiving a Decision

Delays in receiving a funding decision were a common and major pain point among applicants, and a source of frustration to many.
Some reported they waited for 6-12 months, in some cases even longer, to receive a funding decision. While a few attributed the long wait times to COVID, many felt such drawn-out timelines were unreasonable and difficult to work with.
Having to wait for an extended period forced many organizations into limbo and created feelings of uncertainty. They were, at times, unable to plan budgets, programs or resources (including retaining of staff) until they knew whether they were going to receive funding or not, and if so, how much.
Delays in processing applications also had a direct impact on program delivery among those who received funding, as some noted that there was little flexibility for extending program timelines once the grant was received, leading to condensed programs. Applicants felt they required 4-12 weeks lead time from receipt of approval to program start time to effectively implement their programs.
The lack of communication on when decisions will be made and provision of very vague timelines exacerbated negative perceptions and further impeded applicants’ ability to do any planning. Some received notifications of a delay, but the revised target decision dates they were provided were also often unmet or vague. On GCOS, it was noted that current updates only mention that the application is "under assessment" without providing specific information about when they can expect a response.
Situations where the application was “still being considered” for an extended period created both hopefulness and frustration, leaving them in limbo. Few reached out proactively for an update as they assumed that they would not receive a satisfying response, or in a small number of cases they were concerned about negative implications for their application.
Among some who eventually learned they did not receive funding, a delayed decision also left them with challenges, at times scrambling to determine next steps. Some anticipated they would receive the grant and thus had resources dedicated to the program and did not plan for alternate funding sources.
In Their Own Words | Timeliness of Receiving a Decision
“I find sometimes with ESDC because of the delays that often the project end date is not pushed out, it still needs to stay within the same fiscal year. So often the project timelines are condensed and collapsed and there's usually not much flexibility within funding categories… So having that flexibility to have those conversations with the program officer and potentially having a bit of flex within the category. And still having it pre-approved and everything, but knowing that things can change can be really helpful.”
“ Dans mon cas, le délai n'a pas du tout été respecté. J'avais déposé ma demande le 4 décembre et j'ai reçu un courriel officiel d'Emplois d'été Canada en juillet. Pour des emplois étudiants qui débutent autour du 24 juin, juillet est vraiment irresponsable comme délai de réponse car je n’ai pas pu commencer le processus d’embauche au bon moment.”
“We didn’t receive word until the programs were about to start. So, it really impacted us operationally… A lot of leg work, and we had a whole committee that were working on the side. So, they were doing a lot of work to get prepped for things, and then receiving we weren’t successful in that year. […] A lot of resources were put aside in anticipation. So, knowing in advance would be much more efficient.”
“Les délais, oui. C'est très long d'avoir une réponse. Tu sais, quand on demande en septembre pour mars suivant, moi, à mon avis, c'est très long, puis le délai pour préparer, c'est trop court. Il y a une espèce de déséquilibre dans le temps. D'un côté c'est trop court, puis trop long de l'autre côté.”
“The answer took a long time… They gave me an update saying they couldn’t give me an update. There were a couple of emails. They sent one saying, ‘You will receive a response by such-and-such a date’, then one that said, ‘It’s taking longer than expected’… And then, it was still another month and a half after that… So, nine months… The impact on our organization is that… so, that type of program… grinds to a halt, because we’re not funded for it and we have to find things that do fit under our designated funding. So, it… limits our ability to provide that particular program and service to our community because we’re not funded for it.”
Timeliness of Receiving a Decision: Program-specific Nuances

Subgroup analysis revealed nuances by applicants of some programs. These differences were not as pronounced for programs that are not highlighted.
Some Canada Summer Jobs applicants who submitted applications in Jan-Feb only received their decision in July. This is at odds with the program’s objective of allowing organizations to hire students for the summer season.
Some applicants for the Sectoral Initiative Program and the Skilled Trades Awareness and Readiness Program had experienced extensively delayed decisions, with one applicant having to wait a year and half for a decision, and some still waiting.
Reporting Requirements for Funded Organizations
Using GCOS to submit their reports tended to be a positive experience for funded applicants, because the portal provided a centralized place to submit feedback, provide information and upload documents.
There was some minor apprehension with collecting race and sexual orientation information of clients. A small number of applicants felt that this information is awkward and intrusive to collect which results in estimates being submitted instead.
Lack of flexibility of program officers was noted in a small number of interviews. One applicant described funding as a “straightjacket” and difficult for funded organizations to diverge from set budgets or activities if the context changes. Examples of lack of flexibility shared included the increase in costs in light of inflationary pressures and desire to pivot to different materials based on what is found to work well during program implementation.
“ Dans le cadre d'Emplois d'été Canada, c'était assez simple. On avait un rapport par employé à fournir. Puis, encore une fois, avec les plateformes en ligne, ça se fait très bien.”

Future Improvements And The Ideal Experience
The Ideal Journey and Improvement Opportunities
Applicants were asked to describe what an ideal application journey would look like. They offered many suggestions on how they could be better supported as well as how the process could be streamlined and simplified.
 RAISING AWARENESS
- Continue sending out notifications to past applicants, including advance notification of upcoming dates.
- Offer an option to subscribe to funding opportunities based on topic or population served. Ideally, this should cover opportunities across federal departments and agencies.
- Social media can be leveraged to reach a wider number of organizations.
 APPLICATION SUPPORTS
- Maintain level of detail provided currently on program websites.
- Include countdown clock indicating when program will open and upcoming deadlines.
- Add more examples in the applicant guide of what an optimal response looks like.
- Provide multiple information sessions that touch on topics beyond technical aspects of the application – e.g., more on what the program is looking for, more depth and detail around key questions in the application.
- Include Q&A for all informational sessions, including the opportunity to ask sensitive questions in private.
- More transparency on the scoring process – e.g., include decision-tree.
- Offering coaching, mentors and providing one-on-one supports to organizations with lower capacity especially in relation to the budget forms.
- Offer a dedicated contact person applicants can reach out to over phone or email to answer any questions relating to the application.

 APPLICATION FORM
- Rationalize the number of questions and offer more clarity on what is expected under each field to minimize perceived repetitiveness and duplication of questions.
- Consider more closed ended questions with drop-down lists that make intuitive sense.
- Simplify budget forms, consider entering formulas that allow for automatic calculations and provide more support and guidance.
 APPLICATION PERIOD
- 4-6 week window for submitting application suffices; key is providing notice when the application period is open.
- No optimal time in the year for applications though summer vacations means resources in smaller organizations are stretched even thinner.
 CHANNELS FOR COMPLETING AND SUBMITTING AN APPLICATION
- Maintaining multiple options for submitting applications is important from an inclusivity perspective; seniors groups applying for New Horizons funding being a case in point.
- Create an option to download application in a Word document for editing.
- More awareness and education on the benefits of a GCOS account.
- Simplify process for creating a GCOS account.
- Creation of organizational GCOS accounts that are not liked to individuals’ personal affairs.
- Include formatting tools for those who opt to type in directly into GCOS.
- Pre-populating answers on GCOS based on organizational profile in the system or from past applications.
- Offer the option to upload completed application on GCOS as opposed to having to copy and paste answers.

 RECEIVING A DECISION
- 2 to 3 months is a reasonable timeframe for receiving a decision.
- For Canada Summer Jobs, applicants wished to have a decision by March to provide enough time to hire candidates for the season.
- Proactively notify applicants of delays and provide (and adhere to) clear updated timelines.
 REPORTING AND MANAGING FUNDED ORGANIZATIONS
- More education and support on collecting GBA+ data
- More flexibility in project timelines and adjusting activities and budget based on changing or new needs that arise.

Best Practices from Other Application Experiences

ESDC’s grants and contributions programs were generally seen as on par with what other funding bodies are doing.
When applicants were prompted to share best practice examples from other grant programs, a few shared examples:
- The Ontario Trillium Foundation was credited for providing coaching support and grant writing workshops which made their grants more accessible to diverse applicants outside of the legacy applicants who had a lot of experience in grant writing. They were also described as having straightforward applications, with succinct answer expectations and simple budget requirements.
- Upskill Canada run by Palette was described as having a ten-week turnaround time, multiple calls, an online forum, streamlined application process entailing answering a few questions in a user-friendly portal and uploading a project plan and simple budget in Excel.
- One Alberta Government program has incorporated talks with applicants one-on-one prior to them submitting their application. This process was described as a “neat experience”, and helpful for the applicant to get a sense for what they wanted to see in the application, and also helped set their expectations on outcomes.
- The BC Government has a program for small amounts of fundings that simply requires completing a short online questionnaire that consists of closed-ended questions entirely.
- Canadian Heritage was described as being flexible with their funding, providing some opportunity for recipients to make changes to project timelines and funding categories as deemed necessary.
In Their Own Words | Best Practices from Other Application Experiences
“Upskill Canada run by Palette is quite good. That ten-week turnaround, tell you that from the get-go that this how long it’s going to take. There is a shorter window to apply for that one. So, I think it was only a month, but they have multiple calls too. The online forum was really good and very user-friendly. Everything – you could complete it in the portal itself. And then you just needed to upload a project plan and budget that was a simple Excel as well. So, nothing too cumbersome there. They also have an interesting process to evaluate proposals. So, part of it is in Toronto with their team. But they have also developed an industry advisory committee for the different sectors that would also evaluate that. So, ensuring that it does resonate with actual real labour market needs versus just an organization that wants to be funding through this program. I am only referencing that one because it stands out to me as a little bit different from other grant applications which are similar to SIP.”
“There’s an interesting one that’s happening right now. And it’s with Alberta, they’ve got funding opportunities available. It’s not a straight up call for proposal. They said that it normally is a straight up call for proposal, but they’re trying things a little differently this year where they’re actually talking to people and about those projects before a submission. So, there’s a little bit more this – this – that’s not going to fly. We don’t want to see that. We want to see this. And that’s been a neat experience. I mean you’re not guaranteed funding, but you have a really good sense as to what to expect from your project. How much it’s going to be. And so, it’s – I don't know, you know, we’re just submitting. We don’t know what it looks like on the backend of that.”
“The Ontario Trillium Foundation. Their applications are very straightforward. “Here’s the question. You have 300 words.” Which makes you succinct. And if you can’t be succinct you call a coach and ask how you put your 300-page mission statement into 300 words. And they help you with that. Their budget, super simple. Very simple. They have direct personnel costs. Then they have direct non-personnel costs, which would be things like your consumables. So if you’re running groups and you want to feed them or give them gift cards. And then they have capital. And I think that’s it. It’s very straightforward.”
The Impact Of Funding
Impact of Receiving Funding
Overall, the most positive and most significant impact of receiving funding was on communities served by the organizations, as members of those communities were able to access services and supports they needed.
With the additional funding, organizations were able to improve or expand their activities, develop new programs, reach a larger audience, and make a more substantial difference in their field of work. It also allowed them to plan, budget and resource those initiatives effectively.
The funding also enabled organizations to address social issues, provide support, make a positive impact on the lives of individuals or groups, and fulfill their organizational mandates.
Receiving funding alleviated stress and anxiety about the applicants’ ability to resource, plan and activate programs, especially among small organizations where financial and human resources were most limited.
PROGRAM-SPECIFIC NUANCES
Subgroup analysis revealed nuances by applicants of some programs. These differences were not as pronounced for programs that are not highlighted.
- Women's Employment Readiness Pilot Program and Workplace Opportunities: Removing Barriers to Equity: Helped to change perceptions among the employer community about hiring from the communities these organizations serve.
- Canada Summer Jobs: For small organizations, the extra resource(s) of having one or more summer student on their team greatly increased their capacity to serve their communities. For some other organizations focused on youth, it enabled them to provide a continuity of employment.
In Their Own Words | Impact of Receiving Funding
“Oh, in a very, very positive way. So, we have been able to offer a lot of very positive programs to seniors... And it’s just been very heartening to see the positive impact that the program has had.”
“Receiving the funds always impacts the applicants… The impacts for the applicants is great because they’re getting the service and help that they need – that they require.”
“Ça l'a fait beaucoup, beaucoup de choses. On peut donner des cours gratuits en étant membre. Allez chercher un cours gratuit de tricot, moi, je n'en connais pas de bien, bien, des magasins qui vont offrir ça gratuitement, mais nous autres, c'est gratuit. Ça, ça l'a fait un gros, gros impact. .”
“We could run two programs at the same time. One is we provide the kids camp program for deaf and hard of hearing kids throughout the summer. But the other half of our program is hiring deaf and hard of hearing youth and training them to become employable.”
“Dans notre cas à nous, par exemple, ça permet de sortir les aînés de l'isolement, et ça leur permet aussi de créer des connexions. Par exemple, quand on allait au musée, il y a des aînés qui ont fait connaissance entre eux et qui ont gardé ces relations-là même après, et ils peuvent se rendre visite, prendre du thé ensemble, discuter..”
“I am a one-woman show. Being able to do all the things I do in a day… having that assistant in the summer to be able to take that on for me, it means volumes because I do like to keep my customer service level up. And so, yeah, there’s a lot of times when social workers or patients are asking questions via email or phone calls that they can find on our website, our book, our guidelines manual. So, just being able to give them that attention and that direction, I am allowed to do that having my summer student. I can hand that off to her and say, please respond. It takes it off my plate. Again, it’s a stress reliever, it’s just having that extra set of hands.”
Impact of Not Receiving Funding
In most cases, unfunded applications meant that programs or activities did not move forward or did so but in a reduced capacity. As a result, the communities served by these organizations were unable to receive the support they needed.
Some smaller organizations were unable to maintain everyone on their staff, which meant having to let some employees go and with that, lose the benefit of continuity and experience.
Several applicants explored alternative sources for funding the same activity, including applying for other grants, reaching out to international partners (if they had that access), and collaborating with the private sector. That said, applicants were always on the lookout for funding from a variety of organizations.
Among those were unsure whether they are going to receive funding, the impact of not knowing for an extended period of time was a sense of limbo and uncertainty. They were limited in their ability to plan hires, budgets and programs while they were in a holding pattern.
“It’s been a real challenge… It’s been a climb for the last two plus years to try and find ways to rebuild that funding and seek other funding. I would say for sure, it led to much more collaboration and partnership with the private sector, because the government didn’t have resources to support this particular work.”
“It’s been a challenge… We have members and clients and customers who are really looking to work on this program, and to take this program for some of their employees. And we haven’t been able to offer it yet, because we don’t have the funding for it, we’re still waiting.”
“Je vais manquer de staff cet été. Je devrai fermer 1 jour par semaine et fermer pendant 2 semaines pour les vacances. Ça a de très grosses répercussions, autant à court terme, qu'à moyen terme.”
Interest In Future ESDC Funding Opportunities
Interest in Future Funding Opportunities

Receiving funding was crucial for organizations as there was significant need for financial support to help them fulfill their missions.
Most organizations, whether they have been successful or unsuccessful with previous grants, shared that they would certainly be applying for ESDC grants and contributions again in the future. Receiving ESDC funding would help them better serve their communities and continue to develop and execute programs aligned with their organization’s mission and values. As one applicant said, “It’s never an option not to apply. That’s the nature of the business.”
The main consideration for determining whether to apply for funding in the future, emerged as identifying if there is a need for a program, and whether they have the capacity to execute it.
Among those who did not receive funding, some applicants planned to be more proactive in the future (i.e.; develop a relationship with their MP), be more selective with what funding they apply for (i.e.; focus on the one(s) they felt they had the best chance of getting) and manage their own/their organization’s expectations better by not counting on receiving the funding despite applying.
There were only a couple of applicants who were more put off from applying in future. In one case, an applicant who did not receive funding felt disrespected by the process and discouraged from applying in future. They felt upset by having to scramble and spend a lot of time in a relatively small window to complete a detailed application, only to then wait for over a year for a response.
Another applicant said their organization remains open to government funding but is moving away from actively pursuing it. They described it as “risky” and challenging because it requires a lot of energy to apply, is highly competitive, and is restrictive in terms of how the funds are used.
In Their Own Words | Interest in Future Funding Opportunities
“I’ll keep doing it. If it’s appropriate for my community I will do handstands to apply. Absolutely. I will not stop applying. We need to support our people and I’ll do whatever it takes.”
“Yes. Yes, absolutely we will apply in future. We’d certainly love to keep going with both the New Horizons and the summer student positions.”
“I plan on applying every year and crossing my fingers for funding.”
“So, I will apply in future years. But I will tell you next year, I will have a much closer relationship with the MP who is responsible for my area… Given my experience this year, I am not taking any chances. So, I am going to be more proactive next year… I take into account if I have a real – do I have real work? Right? And how much work is it going to be for me to supervise that person? And if I feel like, nope, I really – I really need the right person to get this job… because it takes effort on my part to do that too.”
“We’ve become disgruntled… We spend hours. I am up until midnight writing because of the short timeline. And we’re not going to stress ourselves out anymore. That’s a shame. They’re going to lose quality programs… It’s disrespectful. We have 30 days. They think that’s all we’re doing. You have to do your own work as well. And so detailed. You have to double check it. And there’s so many attachments. And your audited statements. And your annual report. And so, many pieces that you have together. You – we end up being exhausted… And then, to be so disrespected afterwards not to hear back for 13 months. It’s not worth it… We will do it by case-by-case basis.”
"Et je souhaite que ça continue, parce que c'est le meilleur moyen pour aider aux organismes sans but lucratif à sortir de l'isolement les personnes, à les sociabiliser et à leur faire connaître des beautés dans la vie "