Leger Marketing Inc. (Leger) is pleased to
present this report to Environment and Climate Change Canada (ECCC) on the
findings from a qualitative study and the second wave of the National
Adaptation Strategy quantitative survey, designed to learn about the
vulnerabilities that people living in Canada are facing from climate change.
More and more evidence is pointing to the
urgency for climate action, underscoring the need for communities to adapt to
the changing climate and prepare for the most challenging impacts of climate
change. A noticeable increase in extreme weather events across Canada, such as
wildfires, extreme heat and floods, have made the importance of adapting to a
changing climate top of mind for people living in Canada.
Under the strengthened climate plan,
released in December 2020, A Healthy Environment and a Healthy Economy,
the Government of Canada committed to develop a National Adaptation Strategy to
create a more ambitious, strategic, and collaborative approach to climate
adaptation. Released in June 2023, the Strategy outlines a shared vision for a
more climate-resilient Canada, identifies key priorities for increased
collaboration, and establishes a framework for measuring progress at the
national level to help communities and residents of Canada better adapt to and
prepare for the impacts of climate change.
A crucial part of determining what actions
are feasible or would be easily adopted by residents is to first understand
their opinions and perspectives on climate change.
A first survey was conducted in 2022. In
2023, a qualitative study was conducted through focus groups with individuals
living in at-risk communities and/or who have experienced extreme climate
events. The qualitative wave was followed by a second wave of the survey, after
the questionnaire was updated in light of the findings of the two studies.
The focus groups and the survey addressed
different objectives.
The focus groups were aimed at identifying
the public’s perceptions of adaptation terminology and actions, including:
·
Determining and evaluating
which adaptation terms, examples, and rationales resonate with people living in
Canada the most;
·
Hearing first-hand from
people living in Canada who have experienced a climate-related event (e.g.,
wildfire, floods, hurricanes, extreme heat) or face the slower onset impacts of
climate change every day (e.g., coastal erosion, permafrost thaw, degrading
water quality). Hearing their stories, examples, and solutions that they find
empowering and/or enabling will help ECCC further determine language that
resonates with people living in Canada and develop future communications on
climate change adaptation (e.g., toolkits, factsheets).
The survey was designed to provide ECCC
with insights on:
·
Whether people living in Canada understand the
impacts of climate change and its effects on health and safety, the
environment, the economy, and society;
·
Whether people living in
Canada are aware of governmental actions being taken to adapt to the impacts of
climate change;
·
What adaptation solutions people living in Canada are aware of in
their communities and beyond, and whether they would support increased
investments for these solutions;
·
What language and framing
resonates with people living in Canada in terms of adapting and building resilience to the impacts of
climate change and increasing literacy on this issue.
This report presents the results of the
qualitative study and the second survey wave.
The total estimated value of this contract
amounts to CAD $135,734.47 (including HST).
Intended use of the research
The findings of the survey will be used in
the development of policies, programs and initiatives, pertaining to the
National Adaptation Strategy to improve communications, to gain critical
insights on the opinions, issues, and challenges Canadians are facing, and to
better prepare communities for the impacts of climate change.
Leger conducted a series of ten focus group
sessions with French-speaking and English-speaking Canadians. Conducting the
groups online offered the opportunity to regroup people from all the regions in
Canada. All groups were conducted with individuals who have experienced
climate-related events and/or live in a community most affected by climate
change impacts. Five groups were conducted with Canadians living in urban
areas, and the remaining five were conducted with Canadians living in rural
areas. Overall, two focus groups were conducted in French (one of each
demographic), and the remaining eight were conducted in English.
For each online discussion session, ten
participants were recruited by Leger with the help of CRC Research professional
recruiters. A total of 91 recruits participated in the online discussion
sessions. All participants in each discussion session received an honorarium of
$125. All groups were held on August 8th, 9th, 16th and 17th, 2023.
Groups were held in the following regions
on the dates specified in Table 1.
Table 1.1. Detailed recruitment
|
GR
|
Region
|
Recruits
|
Participants
|
Target
|
Language
|
Date
|
Time
|
|
1
|
Quebec +
Atlantic
|
10
|
9
|
People
living in an urban area who have recently experienced a
climate-related disaster (general population, including Indigenous
representation)
|
English
|
August
8th
|
5pm
EST
|
|
2
|
Alberta +
Manitoba +
Saskatchewan+
NWT + Nunavut
|
10
|
9
|
People
living in an urban area who have recently experienced a
climate-related disaster (general population, including Indigenous
representation)
|
English
|
August
8th
|
7pm
EST
|
|
3
|
Ontario
|
10
|
9
|
People
living in an urban area who have recently experienced a
climate-related disaster (general population, including Indigenous
representation)
|
English
|
August
9th
|
5pm
EST
|
|
4
|
British
Columbia + Yukon
|
10
|
8
|
People
living in an urban area who have recently experienced a
climate-related disaster (general population, including Indigenous
representation)
|
English
|
August
9th
|
7pm
EST
|
|
5
|
Quebec +
Atlantic
|
10
|
9
|
People
living in an urban area who have recently experienced a
climate-related disaster (general population, including Indigenous
representation)
|
French
|
August
8th
|
5pm
EST
|
|
6
|
Quebec +
Atlantic
|
10
|
9
|
People
living in a rural area who have recently experienced a
climate-related disaster general population, including Indigenous
representation).
|
English
|
August
16th
|
5pm
EST
|
|
7
|
Alberta +
Manitoba +
Saskatchewan+
NWT + Nunavut
|
10
|
10
|
People
living in a rural area who have recently experienced a
climate-related disaster general population, including Indigenous
representation).
|
English
|
August
16th
|
7pm
EST
|
|
8
|
Ontario
|
10
|
9
|
People
living in a rural area who have recently experienced a
climate-related disaster general population, including Indigenous
representation).
|
English
|
August
17th
|
5pm
EST
|
|
9
|
British Columbia + Yukon
|
10
|
9
|
People
living in a rural area who have recently experienced a
climate-related disaster general population, including Indigenous
representation).
|
English
|
August
17th
|
7pm
EST
|
|
10
|
Quebec +
Atlantic
|
10
|
10
|
People
living in a rural area who have recently experienced a
climate-related disaster general population, including Indigenous
representation).
|
French
|
August
8th
|
7pm
EST
|
|
Total
|
|
100
|
91
|
|
|
|
|
Attitudes towards climate change and
level of worry
·
A large majority of the
participants said that they are currently worried about climate change. Most
participants were concerned since heat records have been broken around the
world recently. They were also worried because wildfires, hurricanes, floods,
and other extreme events related to climate change are happening more and more,
and the weather patterns seem to be changing as well (not the same amount of
snow in winter, hotter and longer summers, less-defined seasons). Some
participants also mentioned they were worried because more areas in Canada
started to flood, even if they were not prone to flooding.
·
A lot of participants
mentioned that they are very concerned with governments who are continuing to
prioritize the economy and are not doing enough to fight climate change. They
also expressed their concerns about big producers and other countries that continue
to damage the environment through actively harmful practices.
·
Participants were also
worried about the consequences of climate-related events on their daily lives.
Moreover, older participants mentioned that they were more worried for the
well-being and the sustainability of future generations than theirs.
·
A few participants said
that they were not concerned about climate change because they believe that the
planet has been experiencing these natural courses of changes for centuries.
·
A vast majority of the
participants agreed that climate-related events were more frequent nowadays.
Most of the participants stated that they have seen much more news on
environmental disasters happening in Canada and around the world. Besides, some
of them reported being significantly more affected by heatwaves, floods, wildfires,
tornadoes, or thunderstorms lately.
·
Older participants
mentioned that they have seen drastic changes in the weather (unusual summer
temperatures and precipitations, hotter temperatures overall) and noted that
the tornadoes or the heatwaves that are currently taking place in their areas
never occurred in the past.
·
Some participants were not
convinced that climate-related events are more frequent because they believed
that the climate-related events are over-mediatized on the Internet and on
social media, which can influence how people perceive the frequency of these
events.
Terminology testing
[…] means planning for and acting on
the anticipated impacts of climate change. It involves making changes to how we
live and what we do before climate change impacts happen in order to reduce
their impact, as well as being more ready to respond to increasingly likely and
frequent extreme events. It includes adjusting our decisions to account for the
changes to the climate that we know are still to come.
·
During the second part of
the discussion, participants were invited to evaluate different phrases and
terminologies pertaining to the subject in order to determine those that are
the most evocative. Participants were shown the definition presented above and
were asked about their opinion.
·
Across all groups, a vast
majority of participants mentioned that this definition refers to the needs for
preparation, adjustments, or adaptations to cope with the inevitable extreme
events related to climate change. A lot of participants also see this
definition as an urge to change their consumer habits and lifestyle to try to
stop climate change or, at least, to minimize its impacts.
·
Most of the participants
also agreed that environmental responsibility does not only apply to
individuals. Some participants expressed their frustration as they felt they
were doing their part but felt helpless when seeing the negative impacts of big
companies and governments on the environment. According to them, governments
and businesses must be held accountable, and be proactive in the support and
implementation of the required changes to protect the environment.
·
Many participants felt that
this definition was only a vague and general statement, as they felt it didn’t
provide concrete and specific solutions or explanations on how to be well
prepared. While some participants noted that this definition is good and exhaustive,
other participants thought that this definition is outdated because changes are
needed now, considering how severe the situation is.
·
Participants were asked to
come up with a term that fits the definition, and the terms “climate
preparedness” and “climate change adaptation” were among the most common.
·
Participants were also
invited to pick the term that fits the most among a pre-determined list. “Climate preparedness” was the term that fit the most with the
presented definition according to the English-speaking participants, except in
Quebec, British Columbia, and Yukon.
·
Among the French-speaking
participants, “Climate preparedness” (“Préparation aux changements climatiques”
in French) was the least popular term and ‘’Climate change adaptation’’
(“Adaptation aux changements climatiques” in French) was the most popular term.
·
Those who preferred
“Climate preparedness” felt the term was more active than “adaptation”, which was
seen as passive. On the other hand, those who preferred “Climate change
adaptation” felt that it was too late to talk about preparation considering the
advanced stage of climate change.
·
In a second polling
exercise, participants had to rate the terms on the feelings they evoked
(positive, neutral, or negative). “Climate
preparedness” evoked positive feelings for the participants who live in urban
areas while “Being climate-ready” evoked positive feelings for the participants
who live in rural areas.
·
Even though ‘’Climate
change adaptation’’ (“Adaptation aux changements climatiques” in French) was
the most popular term for the French-speaking participants, it still evoked
negative feelings for them.
·
All the terms usually
evoked neutral feelings to the participants who live in Alberta, Manitoba,
Saskatchewan, Nunavut and the Northwest Territories.
·
Generally, only a few
participants had heard of “Climate change adaptation”, and even fewer were
familiar with the National Adaptation Strategy. The participants who live in
urban areas had never heard of the two terms before. The participants who live
in rural areas, particularly those who live in rural areas of Quebec, were more
likely to have heard about “Climate change adaptation” or the National
Adaptation Strategy before.
Experiences with climate change impacts
·
Across all groups, a vast
majority of participants have lived through a climate-related event directly,
and all of them have faced some sort of climate-related impact, whether they
lived through the event or not. Participants living in rural areas were
significantly more impacted by climate change and its impacts.
·
Types of climate-related
events varied among provinces: in British Columbia and Yukon, participants were
more likely to have lived through wildfires, those in the Atlantic provinces
were more likely to mention floods and sea-level rise, while those in Quebec
and Ontario were more likely to have lived through tornadoes, snow, ice and
hailstorms, and high winds. Participants from the Prairies and Central Canada
reported a variety of climate events, namely droughts, floods, hailstorms, and
wildfires.
·
Participants suffered
different types of consequences in varying levels of severity: property losses
(personal vehicle or house), material damages to the property (mainly due to
floods and high winds), lost access to key infrastructure (road closures, damaged
roads, power outages lasting several days, cell service outages, compromised
water access), physical health impacts (asthma and respiratory complications
from poor air quality due to wildfires), mental health impacts (feelings of
helplessness, anxiety and stress over the observed losses and uncertainty of
the future).
·
Some participants mentioned
the economic impacts of the different climate-related events in their industry:
drowned or dried up crops, transportation and shipping delays, delayed flights,
decreasing levels of tourism in the affected areas, etc.
·
Participants highlighted
the importance of the community coming together and peers helping each other in
these difficult times. The importance of solidarity in the community was
two-fold: to help those affected materially through food, shelter, and manpower
to repair the damages caused by the event, and to provide emotional and mental
support in these difficult times.
·
Participants reiterated and
insisted on the importance of sticking together and having people to talk to
and help each other. They also mentioned monitoring social media usage as the
content was often deemed anxiety-inducing.
·
Preparation-wise,
participants mentioned the crucial aspect of having emergency kits and stocking
up on non-perishable goods and essential products for the events (floods,
wildfires, high winds…) that could cause them to be stranded or lose access to
necessities.
·
Some participants stated
they installed air conditioning units recently to face the frequent heatwaves,
and air purifiers to help with indoor air quality when wildfire smoke is
polluting the air in their area. Setting up the conditions to be alerted when
an event is about to occur, and making reinforcements to the house when
possible were also mentioned as key measures.
·
A few participants also
mentioned the work done by their municipality to better prepare for upcoming
floods, like dike systems and floodwater retention systems.
·
Some participants mentioned
their feeling of helplessness and felt like there was not much they could do
besides basic preparation.
· In terms of information, participants stated
that their main source for alerts was The Weather Network and the Government of
Canada and Environment and Climate Change Canada warnings (through the same
system as Amber alerts).
·
A few participants stated
the alerts were inefficient in some cases as they only received them after the
event started, but most appreciated the heads up as knowing even a few minutes
ahead can make a huge difference.
·
During and after the event,
participants used Facebook and other social media to stay in touch with their
community, organize, plan, and share resources.
·
Participants had varying
levels of expectations towards the government and how they could help, with
rural participants having the highest expectations overall and exhibiting the
highest levels of disappointment towards the government. But several participants (across all provinces) were somewhat unsure
as to what the government could do to help them prepare.
·
Participants often
mentioned they had no idea what the government was doing in terms of climate
preparedness and wished they had easier access to that information.
·
Some participants had a
perception that the different levels of government were “passing the buck” and
not being accountable for their own responsibility in the situation.
Participants felt that governments used the lack of funding as an excuse for
their perceived lack of action.
·
Some participants felt that
provincial and federal governments should play a role of support by providing
the necessary funds and resources to municipalities and let them manage their
preparedness.
·
Some participants believed
that a majority of the solutions came from the municipal level of government,
as cities had to manage the problems that they were facing in terms of
infrastructure resilience and climate event impacts. Several participants shared
municipal initiatives in their cities that helped climate preparedness efforts
(municipally managed information-sharing smartphone application, dike systems,
tree planting, etc.).
Detailed
qualitative results are provided in section 2.1.
This public opinion research was conducted via
a hybrid approach, using Computer Aided Telephone Interviewing (CATI)
technology and Computer Aided Web Interviewing (CAWI) technology. Fieldwork for
the survey was carried out from November 30, 2023, to January 24, 2024. A total
of 2,024 Canadians aged 18 or older were surveyed, with a focus on those who have
been most affected by climate change impacts. Detailed information on the
communities that were included in the sampling procedure is presented in Appendix
A.2.5. The survey targeted the general population and individuals who
have been most affected by climate change impacts, who were originally supposed
to be targeted via telephone. However, considering the response rate and the
numbers available, data collection maximized web respondents to help reach the objectives.
Ultimately, the sample included 877 respondents living in a community that is
impacted by climate change, making up 43% of the overall unweighted sample. The
average length of interview was 12 minutes and 48 seconds on the web, and 19
minutes on the phone.
Leger used their panel to target randomized
people for the general population and for the web portion and used their phone
lists for the telephone interviews for the populations most impacted by climate
change. The response rates for the web and phone portions of the survey were 9%
and 13% respectively, meaning for every 100 web survey invites, 9 people
completed the survey, and for every 100 phone calls, 13 completed the survey. Since
panel-based samples are not probabilistic in nature, no margin of error can be
calculated. However, for analysis purposes, statistically significant
differences are included in the report as a reference, comparable to those
obtained from a similar probability sample.
Weighting was done according to age,
gender, province, education, spoken language, presence of children in the
household, and belonging to a community that is most affected by climate change
or not, to help readjust the sample for minor imbalances.
Leger adheres to the most stringent
guidelines for quantitative research. The survey instrument was compliant with
the Standards of Conduct of Government of Canada Public Opinion Research.
A complete methodological description is
provided in the Appendices section of this document (please see Appendix A).
Attitudes towards climate change
·
Climate change is perceived
as an important issue by a vast majority of respondents (84%), with around half
of Canadians considering it very important (47%). And out of four Canadians,
three stated being concerned about its impacts on Canada (77%).
·
Two thirds of Canadians
agreed that climate change impacts have become more severe over the past year
(65%) and that they will become more severe in the next 5 to 10 years (68%).
·
Future generations (63%),
protecting agriculture and food production (62%), and conserving nature and
biodiversity (52%) were deemed the three most important reasons to adapt to
climate change.
·
While respondents were
afraid of climate change impacts on themselves, their friends, family and
community (68%), they remained motivated to do what they can to protect
themselves (83%) and confident that there will be solutions (62%).
·
Around a third of
respondents felt hopeless (36%), and a similar proportion felt they did not
have enough knowledge about it to form an opinion (37%).
·
Respondents from Quebec,
the Territories, and British Columbia were more pessimistic and had overall
more negative attitudes towards climate change, but Quebec residents were more
likely to stay motivated (89%) and be confident about solutions (68%).
·
Half of respondents said
that they are part of a community (48%), but one in five noted that they are
not close enough to people in their community to ask for a favour (20%).
Preparation measures
·
Around a fifth of
respondents felt like they did enough already to help themselves and their
family adapt to the future impacts of climate change (21%).
·
A third of respondents
(38%) have taken measures such as making their homes more resilient or adapting
their activities to counter climate change effects, with a significantly higher
proportion of Territories residents (65%) stating so.
·
When asked about the level
of familiarity they have with preparation and safety measures in case of
climate-related event, six out of ten respondents (59%) report being familiar
with how to prepare for climate change.
·
Rated on a 0-10 scale,
having an emergency kit (8.0), planting trees, gardens, vegetable gardens or
rain gardens (7.8), and installing a generator, solar panels, or power storage
(7.5) were the three measures considered the most helpful in reducing an individual's
risk to climate change impacts.
·
Regarding reducing a
community's risk to climate change impacts, wildfire management (7.8), general
emergency management planning (7.7), and stormwater, flood, or erosion
management (7.6) were deemed the most helpful.
Climate change impacts and extreme
climate-related event experiences
·
Heatwaves were the most
commonly experienced climate-related event (54%), followed by high
winds/hurricanes/tornadoes (36%) and flooding (34%). Around 23% of Canadians
experienced drought, and 22% experienced wildfire.
·
Those who experienced
climate-related events were impacted through physical health problems (18%),
losing access to a critical utility or essential supplies (14%), having house
or property damage (14%), having to spend money to address the impacts (13%),
and having mental health problems (12%).
·
For almost two-thirds of those
who experienced a climate-related event, it took less than a year for their
life to return to normal (62%)
·
Six-in-ten of them
considered that their municipality took sufficient action (59%), and little
over half of respondents agreed their community took sufficient action (56%).
This number fell to 49% for provincial or territorial governments, and to 42%
for the federal government.
·
Around a fifth of
respondents who have been most affected by climate change and experienced an
extreme climate event expected more support from their provincial or
territorial government (22%), their local government (20%), and the federal
government (20%).
Expectations towards governments and
National Adaptation Strategy
·
A little less than
three-in-ten respondents agreed that enough is being done by all orders of
government to minimize climate risks (29%) and to help Canadians prepare for
climate change (28%).
·
According to respondents,
the most helpful information to know in order to better prepare for
climate-related events are what to do when the event occurs (56%), where to go
if utilities are not available (47%), and how to protect property ahead of time
(46%).
·
The federal government
(29%) and the provincial or territorial governments (26%) were the main levels
of government held responsible for communicating this information.
·
Respondents were torn about
their communication preferences, but SMS alerts (20%), television (18%),
weather forecast app/website (16%), and the weather network website (15%) were
the most popular.
·
Awareness of the National
Adaptation Strategy increased to 8% in 2023 (from 5% in 2022), but
understanding remains low, as over two thirds could not provide an answer
(68%).
·
When talking about climate
change and impacts, English-speaking respondents generally preferred the term
“climate preparedness and adaptation” (31%), while French-speaking ones favored
the term "Se préparer aux changements climatiques" ("Preparing
for climate change") (35%).
Focus on
those who live in an at-risk community
·
Respondents who live in an
at-risk community were more likely to think that climate change issues have become
worse (73%), but they were more motivated to protect themselves (87%).
·
They were more likely to
have taken measures to prepare their household for climate change (47%), but
still feel like they could do more.
·
They were more likely to
report having experienced climate-related events, mainly high
winds/hurricanes/tornadoes (51%), flooding (33%) and coastal erosion (12%) and
to have experienced impacts due to these events, namely: losing access to a
critical utility or essential supplies (22%), house/property damage (20%), and
being physically stuck in a specific area for more than an hour (13%).
·
Regarding the handling of
the event, they were more likely to feel like their community took sufficient
action (62%), but that the federal government did not (42%). On the same note, they were also more likely to disagree that enough
is being done by all orders of government to help Canadians prepare for climate
change (67%).
·
In terms of communication
preferences, those living in at-risk communities were more likely to prefer
staying informed through the television (23%), The Weather Network website
(21%) and the radio (11%).
·
While they were not more
likely to know of the National Adaptation Strategy, those who did were more
likely to mention it includes solutions to reduce the environmental pollution
(19%).
·
Finally, they were more
likely to consider they were part of a community (45%).
Tracking evolution of survey results
Overall, results from the study remained
stable since 2022. When interpreting these evolutions, it is important to keep
in mind the difference in data collection questions and periods between the two
waves that might impact respondents’ attitudes and their recall of
climate-related events. The main tracking differences include:
·
A small decrease in the
proportion of respondents considering that climate change is a very important
issue for all Canadians (47% compared to 53%), and who are very concerned about
its impacts on Canada (35% compared to 40%).
·
A slight decrease in the
proportion of those who feel that climate change impacts have become more severe
(65% compared to 70% in 2022), and slight increase in the proportion of those
who feel that climate change impacts will stay the same in the next 5 to 10
years (22% compared to 18%).
·
An increase of the
proportion of those who consider they don’t have enough knowledge to form an
opinion (37% compared to 32%).
·
In terms of extreme climate
events experiences, there was a strong uptick in the proportion of those who
experienced wildfires or their impacts (36% compared to 19%), and a decrease in
the proportion of those who experienced heatwaves (54% compared to 59%),
flooding (23% compared to 34%), and coastal erosion (6% compared to 11%).
·
Regarding expectations
towards governments for support, there was a decrease in support expectations
from the provincial or territorial government (22% compared to 30% in 2022) and
the federal government (20% compared to 31%), and an increase in expectations
from the local government (20% compared to 15% in 2022).
·
A small increase in
awareness of the National Adaptation Strategy is also to be noted (8% compared
to 5% in 2022).
Detailed quantitative results can be found
in section 2.2.
The views and observations expressed in
this document do not reflect those of Environment and Climate Change Canada.
This report was compiled by Leger, based on the research conducted specifically
for this project.
I hereby certify as Senior Researcher at
Leger Marketing Inc. that the deliverables fully comply with the Government of
Canada political neutrality requirements outlined in the Policy on
Communications and Federal Identity and the Directive on the Management of
Communications. Specifically, the deliverables do not include information on
electoral voting intentions, political party preferences, standings with the
electorate, or ratings of the performance of a political party or its leaders.
Signed:
Christian Bourque
Senior Researcher, Léger
Date: March 28, 2024
Concerns about Climate Change
Most of the participants said that they
were worried about climate change. Most participants were worried because they
believed extreme events related to climate change were happening more and more often
in Canada and around the world. Many of them were concerned by the series of
wildfires in British Columbia, in Alberta and in Quebec, or the historic floods
in Nova Scotia in July 2023. Some participants expressed their concerns about
the worsening events related to climate change (heatwaves, hurricanes, sea
level rise) in several provinces across the country. Concerns were raised both
on the frequency but also on the severity of these climate change-related
events.
A lot of respondents, particularly among
the older age cohorts and those living in rural areas, were worried about the
massive changes they have seen in the weather patterns in the country. They
emphasized that the temperatures and humidity during the hot seasons were at
the highest they have ever seen in their lives. They also pointed out that the
summers were longer than before: “The hot months used to be in July and
August. Now, it’s hot in September and it was really hot in May and June” (participant
from rural Manitoba). Because of climate change, they stressed that there were
less defined seasons and less snow in winter than they were used to. Some
participants were worried because more areas in Canada that were not prone to
flooding or tornadoes were starting to experience these events. For rural
Canadians, concerns over crops and agriculture were mentioned spontaneously.
Participants who come from other countries
or those who have traveled frequently in the last few years underlined the
overwhelming heat, dysregulated seasons as well as deteriorating air and water
quality occurring in the world. They also pointed out the heat records that
have been broken recently around the world as a source of concern.
Across all provinces, participants were
worried about the consequences of climate-related events on their daily lives.
Besides the harmful impacts that they had to deal with (e.g., evacuation,
destruction of their homes, material losses, loss of key infrastructures,
flight delays), many participants, especially those living in rural areas and
that have already been hit by floods or wildfires, said they were anxious about
the uncertainties surrounding the extreme events: “The biggest concern with
the fires or tornadoes is that we don’t know when it’s coming. It can happen at
any time” (participant in rural Manitoba).
A couple of participants believed that due
to the massive damage that humanity has done to the planet, it was too late to
reverse some of the worst effects of climate change. Witnessing all the extreme
climate events, they shared that they were worried about the existence and the
future of human beings: “Are we going to be like the dinosaurs? Are we going
to die out any day now?” (participant from urban Quebec). A
participant living in a rural area expressed that she was anxious about
potential wildfires in her sector due to reduced mobility: “If a fire breaks
out in the forest behind my house, what do I do? What can I do to save my life?“
(participant from rural Quebec).
Participants were concerned that the
well-being and the sustainability of future generations were being threatened
by climate change. Older participants were not worried about themselves,
considering that any disaster related to climate change would not happen in
their lifetime. However, whether they have children or not, they mentioned that
they were scared for today’s children and future generations who were more
likely to be exposed and vulnerable to the extreme events related to climate
change. Some younger participants, who initially wanted to have children later,
were questioning this desire due to the extreme events that were not only
happening more and more, but also getting worse.
A few participants said that they were not
concerned about climate change because they believed that the planet has been
experiencing these natural courses of changes for centuries. One participant
raised some doubts about the validity and temporality of certain statistics: “I
saw something the other day where it said that temperatures are up like the
highest they’ve ever been in 100,000 years. But how do we know we’ve never seen
things like this before? I don’t even understand how. We weren’t collecting that
data that long ago” (participant from urban Quebec). Some participants
talked about the ability of human beings to adapt or to find solutions to
minimize the impacts of the disasters related to climate change.
Opinion on the Frequency of Climate-related Events
A vast majority of the participants agreed
that climate-related events were more frequent. In addition to the disasters
occurring in Canada, many participants talked about the environmental disasters
happening more and more around the world. For instance, they mentioned the
fires and intense heatwaves in Africa and Europe, or the tropical storms that
battered the Dominican Republic. Many participants underlined that the
environmental disasters were not only a more common topic of discussion in
their daily lives but were also more frequent on social media and in the news.
A participant pointed out that climate-related events were now part of the
trending news: “In 2013 or 2014, if you turned on the news, the first five
events would be national or international issues. Now, if you turn on the news
in 2023, the two or three out the first five events are going to be weather or
climate change related” (participant from rural Ontario).
Most of the participants across the
country, especially those living in rural areas, reported being more affected
by climate-related events lately. They mentioned that heatwaves, floods,
wildfires, tornadoes, or thunderstorms were happening a lot more in their areas
than in the previous years. They also pointed out that the impacts of those
extreme events were increasingly noticeable: evacuations, damaged
infrastructure, deaths, etc. In rural areas, the impacts of those events were
obvious according to the participants: “You don’t have to watch the news.
You just go out the door and you are seeing it” (participant living in
rural Ontario).
Across the country, older participants
mentioned that they saw drastic changes in the weather. They reported that the
scorching heat, which was quite rare or unusual in the past, became recurrent
in their area. A lot of participants talked about the inconsistency of the
weather. Most of them agreed that the summers were hotter than before: “I grew up down on the coast and when the temperatures hit 25, that
was the hottest day ever. Now, they're hitting 35" (participant living in rural British Columbia). Some participants expressed that the winter tends to start later
and that there were tremendous changes in the amount of snow that some regions
receive (much more snow in some places, much less in others). Participants
living in urban areas were more likely to note that certain extreme events that
were currently taking place in their areas never occurred in the past. They
mentioned that intense heat over long periods or violent tornadoes they
experienced recently were a new phenomenon in their area. Some of the
participants felt that the weather patterns and phenomena, that were more
common in the west, were moving east.
Several participants were not convinced
that climate-related events were more frequent than before. Many of them
reminded that there was no internet, no social media to view the weather issues
around the world back in the days. They also reminded everyone that no alerts
or messages were available on their phone from weather networks as a warning of
an upcoming extreme event before. With constant alerts on the phone, numerous
people on social media and on the internet, participants were convinced that climate-related
events were over-mediatized, which could influence how people perceive the
frequency of these events.
Meaning and Opinion on the Definition
During the second part of the discussion,
participants were invited to evaluate different sentences and terminologies
pertaining to the subject in order to determine
those that were the most evocative. Participants were shown the definition
presented below and were asked about their opinion.
|
[…] means
planning for and acting on the anticipated impacts of climate change. It
involves making changes to how we live and what we do before climate change
impacts happen in order to reduce their impact, as well as being more ready
to respond to increasingly likely and frequent extreme events. It includes
adjusting our decisions to account for the changes to the climate that we
know are still to come.
|
Across all groups, many participants mentioned that
this definition refers to the need for preparation. Many participants were
convinced that the effects of climate change were happening and that extreme
events related to climate change were going to happen more frequently at this
point. To cope with them, they believed that the best people can do is to be
prepared. For the participants, preparation could refer to measures such as
having a generator in case of power loss, supplies of water and non-perishable
food, spare batteries, or charger. Certain participants living in rural areas
often talked about emergency preparedness, which refers to having an emergency
kit ready and being able to evacuate when natural disasters occur.
A lot of participants, particularly those
living in urban areas of Quebec and the Atlantic provinces, saw this definition
as a call to action and an urge to change their consumer habits and lifestyle
to try to stop climate change or, at least, to minimize its impacts.
French-speaking participants mentioned that this definition means that people
need to be environmentally aware, to hold themselves accountable and become
actors of change.
Several participants, mostly those living
in Quebec or in the Atlantic provinces, had the impression that this definition
implied that the responsibility to make changes solely fell on the population.
Although many of them started composting or recycling and changed their
consumption and eating habits, participants mentioned that they had the
impression that more efforts and changes were expected from them: “We are
being asked to be more Catholic than the pope” (participant from rural
Quebec). They agreed that they needed to do their part, but they added that
environmental responsibility doesn’t only apply to individuals. They expressed
their frustration and felt helpless when seeing the negative impacts of big
companies and governments on the environment. Overall, participants frequently
mentioned that big companies caused more damage to the planet with their
harmful practices. Therefore, in terms of making changes and accountability,
they would put the focus on the big companies. They also said that the governments
were not doing enough to fight climate change and must be more proactive in the
support and the implementation of the required changes to protect the
environment.
However, a greater number of participants,
mostly from Quebec and the Atlantic provinces, were not satisfied with the
definition. In their opinion, the suggested definition seemed to insinuate that
climate change impacts haven’t happened yet. Considering how severe the
situation is, they all agreed that climate change impacts were already being
felt and that it’s too late to anticipate them. Their feeling was that this
definition is outdated and that changes were needed: “This definition is
completely outdated. The anticipated changes are already here. The point of no
return is already here. It would have been good ten years ago, but it’s
outdated today” (French-speaking participant from rural Quebec).
A few participants noted that this
definition was the most common, complete, and exhaustive because it applies to
everybody in every level: to individuals, communities, territories, and cities.
Other participants thought that the definition proves the government’s
intentions to be proactive, to take accountability and to make the appropriate
adjustments.
However, some participants felt that this
definition was only a vague and general statement, and it didn’t provide
concrete and specific solutions or explanations on how to be well prepared: “The way it is formulated shows a lack of standard procedure
of what are the solutions. It is very vague and doesn’t go into the specifics.
Here, it is just words” (participant from
rural Quebec). The way that this definition was formulated did not give, to
certain participants, the impression that the government intends to make
concrete changes to mitigate the consequences of climate change. They also
wanted more than just a definition, they would have liked a plan that explains
to them properly what changes to do and how do to them.
Most-fitting Term with the Definition
Participants were also invited to pick the
term that fits the definition best among a pre-determined list. For
participants living in Ontario, Alberta, Manitoba, Saskatchewan, British
Columbia, Nunavut, and the Northwest Territories, “Climate preparedness” was
the term that fits the most with the presented definition. Among the
French-speaking participants living in Quebec or in the Atlantic provinces,
“Climate preparedness” (“Préparation aux changements climatiques” in
French) was the least popular term.
Except in Ontario, the term “Preparing for
climate change” was the least popular for the English-speaking participants
living in rural areas. Among the French-speaking participants, the opinion
about the term “Preparing for climate change” (“Se préparer aux changements
climatiques” in French) varies according to the area. For the
French-speaking participants living in the urban areas of Quebec and the
Atlantic provinces, the term was among the least popular ones. As opposed to
the French-speaking participants living in the urban areas of Quebec and the
Atlantic provinces, the ones living in the rural areas of the same provinces
agreed that “Preparing for climate change” (“Se préparer aux changements
climatiques” in French) was the term that fits the most with the definition
presented.
Participants who picked
“Climate preparedness”
or “Preparing for climate change” felt those terms were more proactive than
“adaptation”, which was seen as too passive. Others chose one of those terms
because they believed that preparedness was the only way to deal with the
extreme events that we can’t avoid anymore. On the other hand, a couple of
participants were convinced that we can still prevent the climate-related
events from happening. Therefore, there was still room for preparedness
according to them. Moreover, a participant believed that the younger
generations were more conscious and aware of the dangers of climate change and
that’s why they were more inclined to prepare for climate change. For the
participants, especially the French-speaking ones, what tipped the scale
between “Climate preparedness” or “Preparing for climate change”
was a matter of syntax or wording.
The participants who did not choose the
terms “Climate preparedness” or “Preparing for climate change” believed
that preparedness would have been possible ten or twenty years ago. However,
knowing that climate change impacts were already being felt, it’s too late for
preparedness. Others mentioned that these terms were not specific enough. When
it came to preparedness, they expected a concrete plan that details the
measures to take and how to implement them.
“Climate change adaptation” was very
divisive among the participants. English-speaking participants living in the
urban areas, except those living in British Columbia and Yukon, did not pick it
as the term that fits the most with the definition. In contrast,
French-speaking participants, regardless of the area, agreed that “Climate
change adaptation” (“Adaptation aux changements
climatiques” in French) was the term that
fits the most with the definition. English-speaking participants living in the
rural and urban areas of British Columbia and Yukon also agreed that it’s the
term that fits the most.
“Adapting to
climate change” was also very divisive among the participants.
English-speaking participants living in all areas of British Columbia and Yukon
did not pick “Adapting to climate change” as the term that fits the most
with the definition. Participants living in the urban areas of Quebec and the
Atlantic provinces also indicated that it’s not the most-fitting term with the
definition. On the other hand, participants living in the rural areas of Quebec
and the Atlantic provinces agreed that “Adapting to climate change” (“S’adapter
aux changements climatiques” in French) fitted the most with the
definition.
Many participants who
picked “Climate change adaptation” or “Adapting to climate change”
believed that adaptation was the only alternative given that the effects of
climate change were irreversible. Participants who did not pick the terms
related to adaptation thought that adaptation was too passive and doesn’t
convey the sense of urgency. Furthermore, they considered that adaptation
sounded like rolling with the punches. A lot of them mentioned that they would
rather stop climate change than adapt to it. For other participants, the terms
related to adaptation were not familiar terms or were too wordy. One
participant also expressed his confusion and did not see a difference between
“Climate change adaptation” or “Adapting to climate change”.
“Being-climate ready”
(“Être prêt aux changements climatiques” in French) was not the term
that fits the most with the definition. Only the English-speaking participants
living in urban Quebec and the Atlantic provinces agreed that it fits the most
with the definition. Most of the participants who did not choose “Being-climate
ready” mentioned that they did not feel the urgency in the phrase.
Feelings Evoked by the Terms
In a second polling exercise, participants
had to rate the terms on the feelings they evoked (positive, neutral, or
negative). Even though “Climate change adaptation” (“Adaptation aux
changements climatiques” in French) was the term that fit the definition best for
the French-speaking participants, it still evoked negative feelings for them.
The term also brought up negative feelings for the participants living in
Quebec and the Atlantic provinces, whether they lived in a rural or urban area.
In the other provinces of the country, “Climate change adaptation” mostly
evoked neutral feelings to the participants.
Among the English-speaking participants, “Adapting
to climate change” (“S’adapter aux changements climatiques” in French) evoked
neutral feelings among the urban areas, except for the ones living in the urban
areas of Ontario, for whom the term mostly brought up positive feelings. In the
rural areas, the term conjured neutral feelings among the English-speaking
participants living in Alberta, Manitoba, Saskatchewan, Nunavut and the
Northwest Territories, and evoked negative feelings in the rural areas of Ontario,
British Columbia and Yukon.
“Climate preparedness” (“Préparation aux
changements climatiques” in French) also brought up neutral feelings in
Alberta, Manitoba, Saskatchewan, Nunavut and the Northwest Territories,
regardless of the areas. While, in other urban areas, it mainly evoked positive
feelings, the term was not associated with positive feelings in the first
place. It mostly conjured neutral feelings for the English-speaking participants
living in the rural areas and mainly evoked negative feelings to the
French-speaking participants living in the rural areas of Quebec and the
Atlantic provinces.
“Preparing for climate change” (“Se
préparer aux changements climatiques” in French) was not mainly associated with
negative feelings. It brought up positive feelings for the participants living
in the urban areas of Ontario, Quebec and the Atlantic provinces. In the rural
areas, it only evoked positive feelings for the English-speaking participants
living in Quebec and the Atlantic provinces. The term always recalled neutral
feelings for the participants living in Alberta, Manitoba, Saskatchewan, Nunavut,
and the Northwest Territories, regardless of the areas.
“Being climate ready” (“Être prêt aux
changements climatiques” in French) was generally more associated with positive
feelings. Except for those living in the urban areas of British Columbia and
Yukon, it mostly evoked positive feelings to the participants living in urban
areas of the country. The term brought up neutral feelings to the participants
living in the rural areas of Alberta, Manitoba, Saskatchewan, Nunavut, and the
Northwest Territories. In the rural areas of Quebec, the Atlantic provinces,
Ontario, British Columbia, and Yukon, it generally evoked positive feelings to
the English-speaking participants. It was also the only term that mainly
recalled positive feelings in the urban areas of Alberta, Manitoba,
Saskatchewan, Nunavut, and the Northwest Territories. In these provinces, the
other terms mainly evoked neutral feelings to the participants.
Knowledge of the Terms
“Climate Change Adaptation” and “National Adaptation Strategy”
Generally, only a few participants had
heard of “Climate change adaptation”, and even fewer were familiar with
the National Adaptation Strategy. The participants who live in urban areas had
never heard of the two terms before. The participants who live in rural
areas, particularly those who live in rural areas of Quebec, were more likely
to have heard about “Climate change adaptation” or the National
Adaptation Strategy before. Those who had heard of the terms mainly did
so through their work. Only one person mentioned having seen the terms on the
Government of Canada website. Even those who had heard of either of the two
terms had very limited knowledge on the topic.
Climate-related Events and Description
Almost all participants stated they have
lived through an extreme climate-related event, and all of them were impacted
by some sort of climate-event consequence. Participants mentioned different
climate events depending on their location in Canada. Respondents from the
Atlantic provinces, as well as those in British Columbia and Yukon, reported
more floods and wildfires, while those in Quebec and Ontario reported more
heatwaves and tornadoes. Those in Quebec also often mentioned harsher winters
and more frequent, more violent, freezing rain events that disrupt daily life.
Those in the Prairies were more prone to mention a variety of events
(hailstorms, droughts, wildfires, extreme cold and snowfalls, floods). Mentions
of specific events include:
·
The 1998 ice storm in
Quebec
·
2011 flood in Brandon,
Manitoba
·
December 2013 ice storm
·
2013 Calgary flood
·
Summer 2021 Heat Dome in
British Columbia
·
Derecho-related tornadoes
in May 2022
·
Hurricane Fiona in
September 2022
·
December 2022 storm
·
June 2023 forest fires
impacting air quality of a huge portion of North America
In addition to sporadic extreme weather
events, participants also noted substantial changes in terms of weather
throughout the years. For most of them, the multiplication of extreme climate
events, along with a perceived weather deregulation that manifests through less
defined seasons, colder/warmer temperatures than average throughout the year
were a clear sign of climate change. Some participants, mainly from Ontario,
deplored the milder winters compared to a few years ago, with less snowfall
overall but more intense climate events, while others considered winters to be
colder on average than they were used to. A few participants also felt that
climate change in Canada seemed worse than in other parts of the world, as they
noticed more extreme climate events and irregularities in terms of weather. The
following citations provide verbatim extracts of participants talking about
their experiences with climate change:
·
“We’ve been experiencing
a lot of concerning events. Now I’m thinking about it every year. Are we ready
for the next disaster?” (Participant from urban British Columbia)
·
“We had a hailstorm a
couple of years ago, it damaged our car and our house. It was chaos, there were
people coming to fix everything, it was a lot to happen all at once.” (Participant from urban Alberta)
·
“I’ve seen huge
differences in terms of weather. We used to have more snow; the seasons were
more defined. We didn’t have extreme events except some snowstorms that weren’t
that extreme. Now, the weather is cold without snow, sometimes unseasonably
warm temperatures, floods…” (participant from rural
Ontario).
·
Personally, I've seen a
lot since I arrived in Canada 9 years ago. On the first year, there was a
freezing rainstorm that brought practically the whole province of New Brunswick
to a standstill, poles fell down, and I personally lost electricity for 3 days.
The following year was a heat wave, and with the humidity it was practically
38-40 degrees every day. We didn't have a single drop of rain, so we had a lot
of fires. The following year, in October, we had violent winds, and we lost
electricity then too [...] We went outside, and we thought we were going to
blow away. We had another heatwave 2 years ago. This year we have a landslide
in the north of the province, people have died." (Participant from urban New Brunswick).
Person-level and Community-level Impacts
and Consequences
Overall, participants living in rural
areas, regardless of the province, seemed to be significantly more impacted by
climate-related events than those living in urban areas, as they suffered
through more consequences. While most participants did not suffer direct
consequences, most of them mentioned their neighbours or peers’ experiences and
the damages that the various climate events had caused. Most of the
consequences that these events caused were material. Several participants
reported damage to their personal vehicle for various reasons, mainly
hailstorms, water damage from floods (cars being washed away), and damage from
fallen tree branches or other infrastructure during or after high wind events
and/or freezing rain. Some participants also mentioned damage to their houses:
water damage from flash floods due to high precipitations or rising river
levels, torn roof tiles or doors because of high winds/tornadoes, and decimated
houses due to forest fires. A few participants mentioned some people in their community
lost their houses due to these events. These material impacts also led to
financial consequences, as participants had to repair their
cars/houses/belongings that were affected, with varying degrees of severity: “I
lost vehicles and property in 2011 during the great big flood here in Brandon,
Manitoba, and I never actually recovered from it financially” (participant
from urban Manitoba). Other participants also mentioned human victims of these
climate-related events, as some of them lost neighbours or acquaintances in
their community.
Access to key infrastructure was also
compromised in some cases: wildfires caused some roadblocks, storms caused
power outages that could last for days, and access to water was also
compromised during droughts or outages. Some participants even mentioned having
lost cell service, rendering them unable to contact any of their peers to check
in on them.
A few participants also mentioned the
psychological impacts of said events, mainly anxiety and stress (“I had a
total, like, total meltdown panic attack because you don't know what's going to
happen.” – British Columbian participant describing her mental state after
losing her home and living in a trailer following destructive floods in 2021).
Participants also mentioned having a feeling of helplessness as they could not
do much to help their peers who lost homes or suffered other types of severe
consequences from extreme climate-related events. Poor air quality also had a
negative impact on mental health as participants were hindered in their daily
activities and had to limit their time outside. This point was brought up
mainly by participants with kids or pets at home, as their kids were restless
and needed to get out, and daily obligations were delayed, adding to the
stress.
In terms of physical health consequences,
participants mentioned the poor air quality resulting from wildfire smoke that
led to respiratory complications in some cases, especially among those who
reported having preexisting conditions (e.g., asthma).
Participants also reported economic
consequences to the climate-related events: some of them mentioned that floods
and droughts had a significant impact on the region’s agriculture as crops were
drowned or severely lacked irrigation. Another participant mentioned the
transportation and shipping delays in his line of work, and another mentioned
the negative impact of climate events on the tourism industry. One participant
also touched upon on the increased number of patients needing medical attention
due climate-related events, causing a strain on the healthcare system and
having a negative impact on healthcare workers’ mental health.
Reactive and Preventive Measures Taken
Participants mentioned several measures
that they have put in place in the context of an extreme climate event. These
measures are categorized into reactive and preventive measures. Reactive
measures are those taken during or after the climate event to manage its
consequences on the community and the individuals. Preventive measures are
those taken in a climate preparedness perspective and aim at ensuring readiness
to face an extreme climate event.
In terms of reactive measures, participants
focused heavily on the community aspect of climate crisis management, as they
highlighted the importance of the community coming together and organizing to
find ways to help and improve the situation: “After the storm, we come
together, we come up with an action plan, and we clean up the debris. That’s
what feels good, communities coming together for a common goal” (Participant
from rural Quebec). Some participants
mentioned hosting their peers in the community that had to evacuate their
homes, others gave the example of removing fallen trees from the roads, helping
people evacuate, collaborating with neighbours to plan wellness checks and make
sure everyone in their community is safe and taken care of. A few participants
also mentioned their community created a Facebook group to make communications
easier and centralize information shared by community members in order to
better organize.
Aside from the aforementioned measures
aimed at dealing directly with material consequences of extreme climate events,
several participants highlighted the importance of the community and
socializing in general in such situations. Some participants mentioned the
importance of talking to your family, friends, and peers to get some emotional
and mental health support. Some other participants also recommended not
spending too much time on social media and following the news as it can be
emotionally draining and can take a toll on one’s mental health.
Regarding preventive measures, some
participants felt powerless and helpless as they felt they could not do much to
prepare for extreme climate events. However, several other participants touched
on measures that could help them prepare. A few participants mentioned they had
air conditioning units installed to face the more frequent heatwaves their
communities face. One participant mentioned purchasing an air purifier to
improve indoor air quality when the area is covered by wildfire smoke. Another
participant purchased flooding insurance and did some renovations to her house
to make it more resilient to floods. Among the most common measures, a few
participants mentioned the necessity to stock up on essentials (backup energy,
candles, canned food and non-perishables, water, toilet paper, essential
medicine). Another participant also mentioned the importance of knowing
beforehand what skills and information you need to have. Most participants also
stressed the value of staying informed by downloading apps or following the
main news and information outlets, including The Weather Network and the Government
of Canada.
Information Access
Sources of information that participants
turned to vary depending on the moment they needed it. Prior to the event and
in terms of warning, most of the participants stated they had received the
information through weather alerts on their phone. Participants also relied on
The Weather Network app and website, as well as Environment Canada warnings.
Some participants criticized the accuracy of some of the predictions as the
situation sometimes ends up being worse than expected, or because warnings
don’t come when needed.
Furthermore, a few participants stated they
had alert fatigue as they constantly receive them, which hinders their
efficiency. Participants were also torn regarding the issue of letting people
know early of a potential event that might not happen while not being too
alarmist and not wanting to make the population panic. Other participants also
expressed their shock as they faced severe floods or other extreme climate
events and were never notified or warned. A few participants in rural areas
mentioned they had large areas that did not get any cell service, making them
unable to receive any alerts on their phone. One participant also considered
reliance on technology to be a double-edged sword as while it is an efficient
way to disseminate the information, people would be lost if there was no access
to service or to technology. Finally, some participants thought that the
information provided by the alerts was incomplete as they would have liked more
details about when the event would end and what to do to stay safe.
Some participants also mentioned turning to
traditional media like television and radio to get reliable information. During
the event, most participants admitted they relied heavily on community-based
communication: their main source was word-of-mouth information shared either
in-person between neighbours and peers or through social media, either in
private groups or through publications. Participants specifically mentioned
Facebook as the social media they turned to the most. This type of
communication was mainly used for sharing information and community-organizing
during crises. A few participants, however, recognized it may not be the best
way to stay informed as the information is not easily verifiable. To stay
informed about the developments of long-lasting climate-events (e.g., distant
wildfires that impact air quality), they stayed informed through the continuous
coverage of the event in traditional media, mainly television. A few
participants also mentioned getting information through Twitter.
Communications originating directly from
the Government of Canada were deemed the most reliable type of information, and
some participants deplored lacking official communications during some of the
events they faced. Those in British Columbia specifically mentioned they
received no instructions or advice on what to do or what to expect during the
wildfires.
However, all participants said they trust
information coming from the Government of Canada. One participant mentioned
their main source of information was a municipally managed smartphone
application aimed at disseminating the information across the local population
in a fast and efficient manner. She stated the example of drinking water
alerts, as the droughts impacted the water quality. Participants living in
Quebec who went through power outages commended Hydro-Quebec’s website for the
live updates on the situation, while others criticized the lack of estimates
for power to come back.
Expectations Towards Government
When asked about their expectations towards
the government, participants were torn, and different issues and areas of
action came to mind. While some participants answered the questions in terms of
climate change adaptation, others tackled several measures that aimed at carbon
neutrality or at reducing Canadians’ impact on the environment in general.
Examples include composting, recycling, tree planting, developing public
transit and reducing car usage in favour of active mobility, and all measures
aiming at carbon neutrality at large.
Regarding climate preparedness
specifically, some participants spoke out about what they perceived to be
government inaction, as they lacked knowledge of specific measures that have
been put in place to build more resilient communities, even if they had heard
of climate change adaptation before. Participants in rural areas had higher
expectations and a higher degree of dissatisfaction with the government, and
most of them felt like governments were “passing the buck” to each other and
not taking accountability. Some participants felt like the government was
reactive at best, but not proactive in the matter. A
few participants brought up their experience in their area with the provincial
government to justify their opinion. One participant deplored the lack of
damage prevention in terms of floods (“Governments know that some
areas will flood almost every year, but they let people rebuild over the same
spots that were flooded […] A lot more prevention could be done.” –
participant from rural Alberta), and another one criticized the removal of
community-built dike systems (“When communities identified the issue and
knew they would lose land, they weren’t allowed to build dikes. Some still did
but the dikes got removed by the government. Governments are prosecuting people
for protecting their own community which is ridiculous.” – Participant in
the rural Northwest Territories). Another participant mentioned the poor
network coverage in his area even though the government promised to build cell
service towers in remote areas.
On the other hand, some participants
managed to recall government help initiatives, such as provincial and federal
financial help after the Calgary floods in 2013. Some participants agreed,
however, that most of the measures and solutions they have seen or heard of
came from the municipal level. Several initiatives aiming at improving climate
preparedness were brought up, including dike systems in Brandon, Calgary, and
Winnipeg, water retention basins, extended hours in some buildings for people
to have access to air conditioning, planting trees to reduce deforestation
risks, forest thinning to fight wildfire risks… Some participants, however,
wish that more was done, and mentioned examples such as growing deciduous trees
as a natural barrier against fires, opening more cooling centres during
heatwaves, reforming building code rules and increasing the distance between
houses and at-risk forests, etc. However, participants agreed that climate
change was a global issue that requires collaboration between countries.
While most
participants expressed their discontent towards the government, a few
participants shared the opinion that citizens now expect too much from their
governments, and that considering the limited resources and the number of
issues that they have to face, the responsibility for improving preparedness
falls on the community itself. These participants agreed that the government
should play a role of assistance and support community efforts to be more
resilient through financial support, providing resources, training and
education, and other types of initiatives: “The government should not need
to be involved in a person’s daily life but provide resources, provide services
and infrastructure, like cleaning roads, functioning public transit, make sure
that people aren’t missing heaters…” (participant from urban Ontario). The
importance of financial help, at least, was highlighted: “The municipalities
are funded by the provinces and the federal government. So, while the solutions
are often local, there has to be some trickle-down financial support from the
provinces and there has to be some federal standards” (participant from
rural Ontario). One participant also brought forward the specific challenges
faced by individuals living with disabilities, as they were particularly
vulnerable and should be considered so that they don’t end up being the first
victims of extreme climate events.
EXPLORING NEW TERMINOLOGY
The terms used to refer
to the concept of climate change adaptation that were tested were somewhat
divisive among the participants. While "climate preparedness" was
preferred by most English speakers for calling to action, "climate change adaptation"
felt too passive. On the other hand, the term was preferred by French-speaking
Canadians. There was no consensus between English and French-speaking
participants.
For the next steps of
the study, we recommend testing terminologies that combine both aspects, along
with new terms altogether. New terminology testing might help uncover more
efficient, less divisive phrasings. In the meantime, "climate
preparedness" had fewer negative evocations and was preferred.
SUPPORTING THE PREPARATION OF EXTREME
EVENTS
Many participants mentioned they were
powerless and helpless regarding preventive measures and felt that the federal
government was not proactive in the matter. More than definitions or weather
alerts, they mentioned several times that they need a concrete plan that
details the measures to take and how to implement them. We recommend that
Environment and Climate Change Canada focuses on informing the population on
the measures that should be taken to prepare for the upcoming extreme events.
CONSOLIDATING WEATHER ALERTS
Feeling helpless or lost as to how to
handle extreme climate events was a shared experience among participants. Some
participants mentioned their surprise at not receiving weather alerts prior to
some major events that they lived through, and most of them justified their
sense of helplessness by their lack of knowledge of measures and practices to
put in place before, during, or after the event.
Strengthening the weather alert system is
key to ensuring optimal preparation before climate disasters. In addition to
information about when and where the event will happen, alerts should include
(or direct to) relevant, exhaustive information about next steps, how to
protect yourself and stay safe. Adding information about local points of
interest and a helpline would also be helpful.
REINFORCING COMMUNICATION EFFORTS
Very few participants
had heard of climate change adaptation or of the National Adaptation Strategy
prior to the focus groups. Participants were unaware of concrete government
measures aiming at building resilient communities and preparing for extreme climate
events. We recommend that Environment and Climate Change Canada adopts a more
aggressive communication strategy and launches campaigns about how the
government is involved in climate preparedness, as it could help raise
awareness among the public and shift the negative perceptions towards the
government. Communicating about real initiatives, no matter how small, on a
local, provincial, and federal scale will help reduce asymmetry. Furthermore,
publicizing some key specific measures that are part of the National Adaptation
Strategy, including financial support to municipalities, could help improve
awareness around the initiative, provide a deeper understanding of the Strategy,
and positively change perceptions.
COLLABORATION AND FINANCIAL SUPPORT FOR
MUNICIPALITIES
Government inaction is a comment that came
up several times during the discussions and the participants had the impression
that the measures and the solutions came from the municipal level. The federal
government needs to make the measures that have been put in place as well as
the climate change targets met better known. The governments also have a bad
reputation of “passing the buck” to each other and not taking accountability.
Collaboration should be strengthened with municipalities and provincial governments
to better identify the population’s needs. Plus, the federal government should
also provide more financial support to municipalities, considering the limited
resources and the number of issues that the municipalities face.
ENCOURAGING COMMUNITY ORGANIZING
The main facilitator of crisis management
after an extreme climate event was community organizing. Many participants were
vocal about how their community came together, planned, and shared
responsibilities to ensure everyone was safe and taken care of and assist in
any task necessary. A few participants mentioned Facebook was their main source
of communication during such events, and one participant mentioned their
municipality released an app aimed at sharing relevant information during
climate-related events.
For these reasons, we recommend
centralizing information in a single government-supported app. Releasing a
government-owned smartphone application that is location-based and allows users
to chat, post, share helpful information, and that includes climate-specific
and government-verified information, would help centralize communications and
provide a reliable source of information for people in the same community,
increasing their resilience. Such an app could include various information that
could help during events, be it preventive measures or reactive ones: who to
call to report infrastructure damage, how to stock up on supplies and which
ones, what tools to have ready, how to plan and perform safety check-ins, how
to safely remove roadblocks, etc.
2.2
Detailed quantitative results
Environment and Climate
Change Canada conducted a survey in Canada on preparedness for the impacts of
climate change in light of Canada’s first National Adaptation Strategy. The
survey was designed to provide insight into the views of Canadians and those
who have been most affected by climate change impacts on how they are being
impacted by climate change and the efforts they have put in place to adapt. This
survey was based on a pilot conducted in 2022. The questionnaire was modified in light of the
pilot wave findings and the qualitative findings of the focus groups to better
answer research objectives. Whenever possible, results are compared to those
observed in 2022.
This public opinion research was conducted
via a hybrid approach, using both web and telephone survey technologies,
through Computer Aided Web Interviewing (CAWI) and Computer Aided Telephone
Interviewing (CATI) technology. The fieldwork for the survey was carried out
from November 30th, 2023 to January 24th, 2024. A total
of 2,024 Canadians aged 18 or older were surveyed, with a focus on those who
have been most affected by climate change impacts.
Z-Tests at a 95% confidence level have been
used to uncover significant differences between subgroups.
Note 1: Numbers were rounded to the nearest
percentage, as such, totals may not always equal 100%.
Note 2: In graphs, statements starting with
“Net…” correspond to variables calculated from the original response
modalities. For example, if the question asked respondents if something was
“very important” or “somewhat important”, the “Net important” statement
combines the value of both options (e.g., if 20% of respondents voted “very
important”, while 15% voted “somewhat important”, the “net important” value
would be 35%).
Note 3: Caution must be exercised when
interpreting the tracked evolution of indicators presented in this report as
data collection periods differed between the two years. 2022 data was collected
in the summer, while 2023 data was collected in winter. While extreme climate
events were more prevalent in 2023 than in 2022 (specifically in the summer
period), recency bias and other cognitive biases could impact respondents’
attitudes and beliefs about climate change.
Importance of the climate change issue
A vast majority of respondents consider
that climate change is an important issue for all Canadians (84%), with a
little less than half considering it a very important issue (47%), and a third
considering it somewhat important (36%). More than one in ten (15%) did not
consider climate change to be an important issue (somewhat not important: 9%;
not important at all: 7%).
Results remained stable overall since 2022,
except for the fact that a lower proportion of respondents (47%) considered
that climate change is very important compared to last year (53%).
Figure
1: Importance of the climate change issue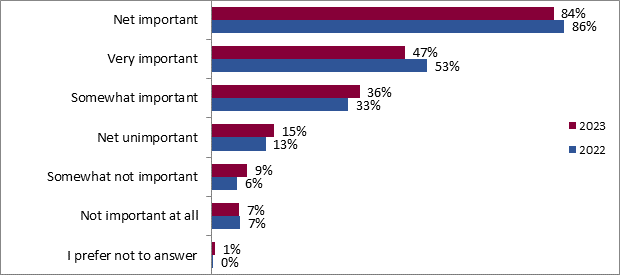 Q1. To what extent do you feel climate
change is an important issue for all Canadians? Base: All respondents (n=2,024)
Q1. To what extent do you feel climate
change is an important issue for all Canadians? Base: All respondents (n=2,024)
The following subgroups were significantly
more likely to consider that climate change is an important issue for all
Canadians:
·
Women (88%) compared to men
(79%).
·
Respondents aged 55 and
older (53%) compared to those who are 35-54 (42%).
·
Respondents from Quebec (89%)
and the Territories (93%).
·
Respondents with a
university education (88%) compared to those with a high school or less education
(80%).
·
Respondents who experienced
a climate-related event (90%) compared to those who did not (63%).
Level of concern about climate change and its impacts
A little more than three quarters of respondents
said they were personally concerned about climate change and its impacts on
Canada (77%), as around a third were very concerned (35%) and around
four-in-ten were somewhat concerned (42%) Only around one in ten (22%) not
being concerned (not very concerned: 14%; not concerned at all: 9%).
Most results remained stable since 2022,
aside from the fact that a smaller proportion of respondents stated being very
concerned in 2023 (35% compared to 40%).
Figure 2: Level of concern about climate
change and its impacts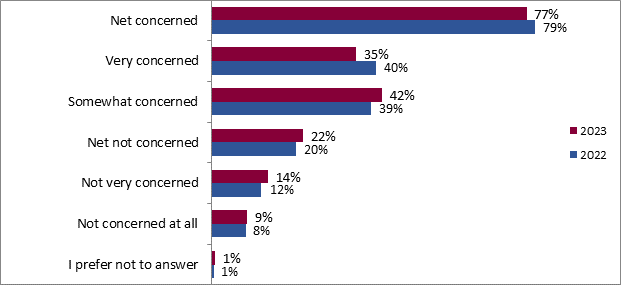 Q2. How concerned are you personally about climate change and its
impacts on Canada? Base: All respondents (n=2,024)
Q2. How concerned are you personally about climate change and its
impacts on Canada? Base: All respondents (n=2,024)
The following subgroups were significantly
more likely to be concerned about climate change and its impacts on Canada:
·
Women (81%) compared to men
(73%).
·
Respondents from Quebec (83%)
and the Territories (91%) compared to those from the Prairies (65%).
·
Respondents who experienced
a climate-related event recently (83%) compared to those who did not (56%).
Perceived past evolution of climate change impacts
Nearly two thirds of respondents (65%) felt
that climate change impacts have become more severe over the past year, while
around one in four (26%) felt they stayed the same. A very small minority (3%)
felt they had become less severe.
It is possible to observe a decrease in the
proportion of respondents that felt that climate change impacts have become more
severe over the past year compared to 2022 (65% versus 70% in 2022). On the
other hand, a greater proportion of respondents answered that they did not know
if climate change impacts have become more severe over the past year (5% versus
0% in 2022).
Figure 3: Perceived evolution of climate change impacts 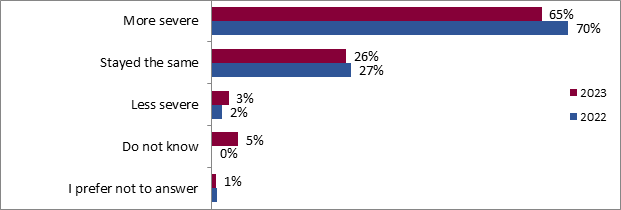
Q4. Over the past year, do you feel climate change impacts (e.g.,
extreme heat waves, storms, flooding, forest fires, sea level rise, etc.) have
become more severe, less severe or stayed the same? Base: All respondents (n=2,024)
The following subgroups were significantly
more likely to consider that climate change impacts have become more severe:
·
Women (69%) compared to men
(59%).
·
Respondents who are 55
years old and over (69%).
·
Respondents from Quebec (74%)
and the Territories (84%) compared to Ontario (60%).
·
Respondents who have experienced
a climate-related event (71%) compared to those who did not (43%).
·
Respondents who are part of
an at-risk community (73%) compared to those who are not (63%).
Perceived future evolution of climate change impacts
Over two in three (68%) respondents think
these hazards caused by climate change will become more serious in the next
five to ten years, and more than one in five (22% versus 18% in 2022) think
they will be staying the same.
In 2023, a smaller proportion of
respondents considered that climate change impacts would stay the same compared
to 2022 (18% compared to 22% in 2022).
Figure 4:
Evolution of climate change impacts in the next five to ten years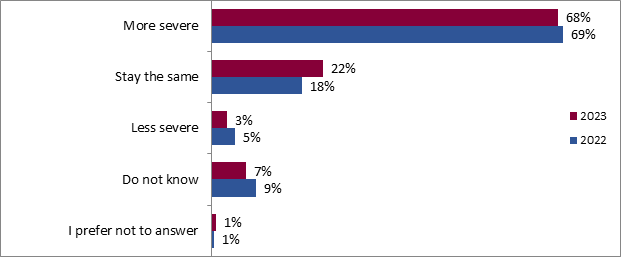 Q5. Do you feel climate change impacts
(e.g., extreme heat waves, storms, flooding, forest fires, sea level rise) will
become more severe, less severe or stay the same in the next 5 to 10 years? Base: All respondents (n=2,024)
Q5. Do you feel climate change impacts
(e.g., extreme heat waves, storms, flooding, forest fires, sea level rise) will
become more severe, less severe or stay the same in the next 5 to 10 years? Base: All respondents (n=2,024)
Women (71% versus 64%), respondents from
Quebec (81%), along with respondents who experienced an
extreme climate event (74% versus 43%) were all
significantly more likely to consider that these hazards would get more serious
within the next five to ten years.
Top three reasons to adapt to and prepare for climate
change
Respondents were asked about their topmost important reasons to adapt to climate change. Protecting future generations (63%) and protecting agriculture and
food production (62%) were the top two reasons to adapt to climate change,
followed by conserving nature and biodiversity (52%), preserving the health of Canadians
(33%) and protecting our critical infrastructures (26%). The safety of
communities was mentioned by less than one respondent out of five (17%), and
the protection of jobs (7%) and identity and culture (5%) were mentioned to a
lesser extent.
Some changes can be noted since the 2022
survey. In the 2023 survey, Canadian priorities for adapting and preparing to
climate change show a decreased emphasis on protecting agriculture and food
production (62% compared to 70% in 2022). There was also a significant decrease
in these three reasons since 2022: The importance of preserving Canadians'
health (33% compared to 40% in 2022), to protect our critical infrastructure
(26% in 2023 compared to 37% in 2022) and for the safety of communities while
the safety of communities (17% in 2023, compared to 31% in 2022).
Figure 5:
Top three reasons to adapt to and prepare for climate change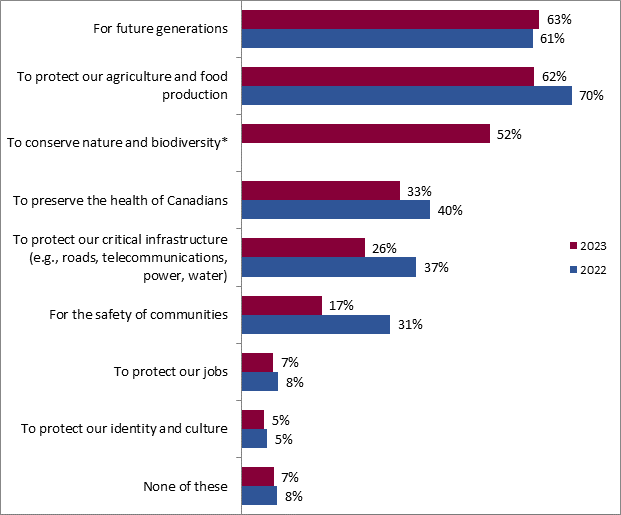 Q3. In your opinion, what are the three most
important reasons to adapt to and prepare for climate change? Base: All respondents (n=2,024)
Q3. In your opinion, what are the three most
important reasons to adapt to and prepare for climate change? Base: All respondents (n=2,024)
Note: The statement marked with a “*” was
added in 2023, no comparison available.
Significant differences regarding reasons
to adapt to climate change include:
·
Women were significantly
more likely to mention protecting future generations (67% compared to 58% among
men), and conserving nature and biodiversity (58% versus 46% among men).
·
Men were significantly more
likely to mention for the safety of our community (19% versus 15% among women)
and protecting our jobs (8% versus 5% among women).
·
Older respondents (55 years
or older) were more likely to mention protecting agriculture and food
production (67% versus 51% among younger respondents).
·
Respondents from the
Territories and the Atlantic provinces were more likely to mention the safety
of the community (42% and 26% respectively). Those from the Territories were
also more likely to mention protecting their identity and culture (17%) as the
most important reason to adapt to climate change.
·
Respondents from Quebec
were more likely to mention for future generations (70%) and conserving nature
and biodiversity (65%), while those from British Columbia were more likely to
mention critical infrastructure (38%).
·
Respondents who experienced
a climate-related event were significantly more likely to mention almost all of
the reasons but the last two.
Feelings towards climate change
In 2023, a strong majority of respondents
(83%) agreed that they are motivated to protect themselves, their families, their
communities and their houses from the impacts of climate change. Nearly seven
out of ten respondents (68%) were concerned about the impacts on themselves and
their friends, their family, and their community. Confidence in finding
solutions to climate issues is moderately high, with 62% of participants
expressing this sentiment. More than a third (36%) of respondents report
feeling hopeless about the situation. However, a similar proportion of
respondents (37%) feels that they don’t have enough knowledge to form an
opinion on the subject.
Comparing these figures to 2022, the
proportion of respondents who do not feel knowledgeable enough to form an
opinion about climate change has increased significantly (37% in 2023 versus
32% in 2022). The feeling of hopelessness has seen a significant decrease,
dropping from 52% in 2022 to 36% in 2023. This drop could be attributed to a
difference in data collection periods, as data for the first wave was collected
in June and July in 2022, and 2023 data was collected in December 2023-January
2024.
Figure 6:
Feelings towards climate change – Total Agree (Totally + Somewhat Agree)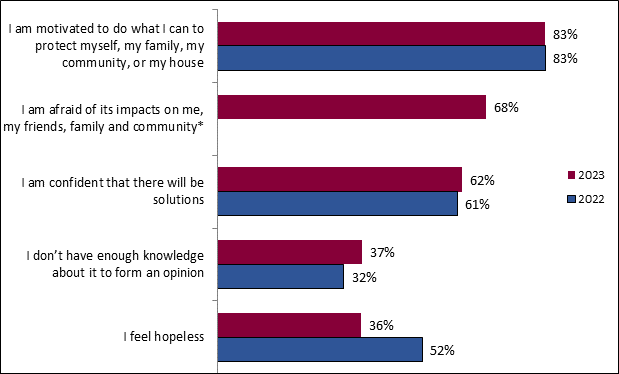
Q6. To what extent do you agree or disagree
with the following statements? In general, when it comes to preparing for the
impacts of climate change, ... Base: All web respondents (n=1,718)
Note: The statement marked with a “*” was
added in 2023, no comparison available.
Figure 7: A breakdown of the feelings towards climate change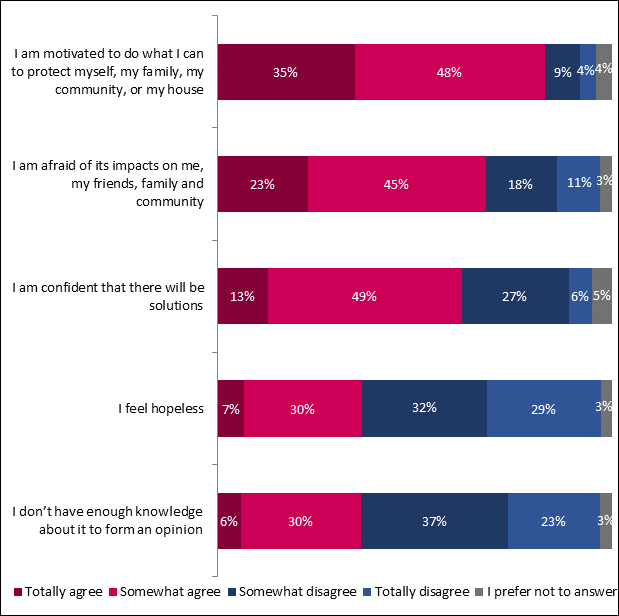
Q6. To what extent do you agree or disagree
with the following statements? In general, when it comes to preparing for the
impacts of climate change, ... Base: All web respondents (n=1,718).
Significant differences in terms of attitudes
towards climate change include:
·
Women were more likely to
feel motivated to do what they can to protect themselves, their family, their
community, or their house (88% compared to 78% among men), and to feel afraid
of its impacts on them, their friends, their family and their community (74%
compared to 62% among men).
·
Respondents aged 55 and
over were more likely to feel motivated about doing what they can (86%)
compared to younger respondents (76% among 18–34-year-olds).
·
Respondents from Quebec were
more likely to be motivated to do what they can do to protect themselves, their
family, their community, or their house (89%) and to be confident that there
will be solutions for preparing for the impacts of climate change (68%).
·
Respondents from British
Columbia were significantly more likely to be afraid of the impacts of climate
change on their community and on themselves (77%).
·
Respondents who experienced
an extreme climate related event were more likely to be motivated to do what
they can do to protect themselves, their family, their community, or their
house (87% compared to 73%), to be afraid of climate change impacts on
themselves, their friends, their family, and their community (74% compared to 49%)
and to feel helpless (41% compared to 18%).
Respondents were asked if they belonged to
a community (e.g., a school group, work group, exercise
group, large family, faith group, etc.) and if they felt like they could ask
members of their community for a favour in times of need (e.g., to sleep at
their house, to ask for food, to ask for a ride somewhere, etc.).
Results remained stable since 2022: around
half of respondents stated that they belonged to a community, but one in five
(20%) considered they weren’t close enough to ask their community for a favour.
On the other hand, a little less than half of respondents are not part of a
community (48%).
Figure 8: Belonging to a community
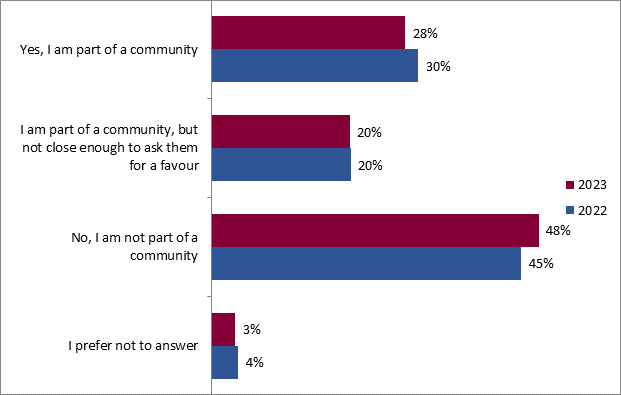 Q25: Are you a part of a community (e.g.,
school group, work group, exercise group, large family, faith group, etc.) that
you can rely on in times of need (e.g., people who would offer you somewhere to
stay in times of need, people who would deliver you food in times of need,
etc.)?
Q25: Are you a part of a community (e.g.,
school group, work group, exercise group, large family, faith group, etc.) that
you can rely on in times of need (e.g., people who would offer you somewhere to
stay in times of need, people who would deliver you food in times of need,
etc.)?
Base: All respondents (n=2,024)
Significant differences regarding
belongingness to a community include:
·
Men were more likely to
state not being part of a community (52% versus 44%), while the opposite held
true for women (31% stated being part of a community, compared to 26% among
men).
·
Quebec respondents were
more likely to not be part of a community (59%), while those from the
Territories (62%) were more likely to be part of one.
·
Respondents living in the
targeted at-risk communities were more likely to state being part of a
community (45%) than those who are not.
Doing enough to adapt to climate change
Around a fifth of respondents (21%) believe
they do enough already, while 18% think they do a lot but acknowledge they
could do more. Meanwhile, a quarter of respondents (25%) feel they do not do
enough to adapt to the future impacts of climate change. A slightly smaller
proportion, two out of ten respondents (22%), are unsure if their efforts are sufficient.
Finally, one out of ten respondents (11%) expresses that they could do a lot
more to adapt.
Because the answer options have changed in 2023, no comparison is possible
with the 2022 survey.
Figure 9:
Doing enough to adapt to climate change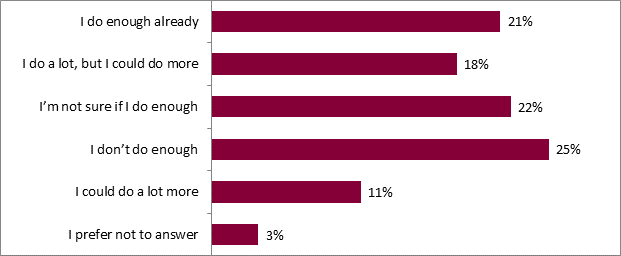 Q11. Do you think you are doing enough to help you and your family
to adapt to the future impacts of climate change, or could you do more? Base:
All respondents (n=2,024)
Q11. Do you think you are doing enough to help you and your family
to adapt to the future impacts of climate change, or could you do more? Base:
All respondents (n=2,024)
Men (27% compared to 16%) and respondents
from Ontario (24%) and the Prairies (32%) were more likely to state they do
enough already, while women (32% compared to 26%) and respondents from the
Territories (50%) were more likely to state that they could do more.
Individuals who experienced a climate-related event were significantly more
likely to state that they are not sure if they do enough (24% compared to 15%)
and that they do a lot but could do more (20% versus 10%).
Taking preparation measures
More than a third of respondents (38%) have
taken measures such as making their homes more resilient or adapting their
activities to counter climate change effects. In contrast, a larger proportion,
58%, have not taken such steps.
Because this question has been modified in 2023, no comparison is possible
with the 2022 survey.
Figure 10. Taking
preparation measures
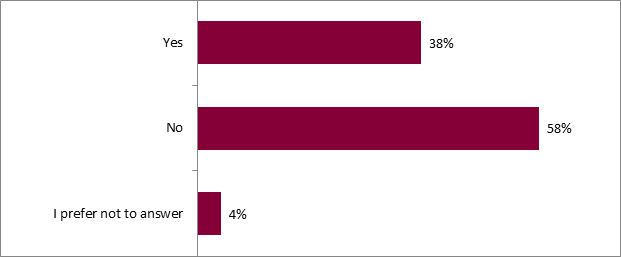 Q10. In the past 12 months, have you or other members of your
household taken any measures to prepare your household for climate change, such
as making your home more resilient or adapting your activities (e.g., improving
rainfall drainage, installing a cooling system, limiting time outside during
poor air quality or extreme heat events, seeking information about wildfire
risks, new diseases that may affect your family or pets or insurance coverage
for climate-related disasters)? Base: All respondents (n=2,024)
Q10. In the past 12 months, have you or other members of your
household taken any measures to prepare your household for climate change, such
as making your home more resilient or adapting your activities (e.g., improving
rainfall drainage, installing a cooling system, limiting time outside during
poor air quality or extreme heat events, seeking information about wildfire
risks, new diseases that may affect your family or pets or insurance coverage
for climate-related disasters)? Base: All respondents (n=2,024)
Those from the Territories were more likely
to have taken any measures (65% versus 32% for respondents from Quebec).
Respondents who are part of an at-risk community (47% compared to 36%) and
those who have experienced an extreme climate-related event (44% compared to
18%) are also more likely to have taken precautionary measures.
Familiarity with preparation and safety measures
When asked about
the level of familiarity they have with preparation and safety measures in case
of climate-related event, six out of ten respondents (59%) report being
familiar with how to prepare for climate change. The same percentage of
respondents also feels familiar with the measures needed to be safe in the face
of approaching climate-related events.
Distribution of answers for being familiar
with what to do to prepare for climate change and to be safe in the face of
approaching climate-related events were quasi-similar: one-in-ten were very
familiar (10% and 12% respectively), around half were somewhat familiar (49%
and 47% respectively) a third were not very familiar (33% for both statements),
and a small proportion were not familiar at all (5% for both statements).
Because this
question has changed in 2023, no comparison is possible with the 2022 survey.
Figure 11: Familiarity with preparation and
safety measures
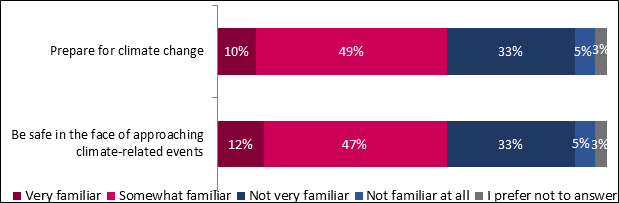
Q7. To what extent do you think you are
familiar with what you can do to… Base: All respondents (n=2,024)
Men were more likely to be familiar with
preparation (63% compared to 55%) and being safe in the face of approaching
climate-related events (65% compared to 54%). In addition, respondents from
British Columbia (71%) and the Territories (74%) were more likely to be
familiar with being safe in the face of approaching climate-related events.
Actions that reduce an individual’s risk to climate change
impacts
Respondents were asked to rate each item
depending on its contribution to reducing an individual’s risk to climate
change impacts on a scale from 0 to 10. Having an emergency kit (8.0), planting
trees, gardens, or rain gardens (7.8), and installing a generator, solar
panels, or power storage (7.5) were considered to be the most impactful actions
in terms of reducing an individual’s risk to climate change impacts as they
were rated over 7/10. Several elements were rated between 6 and 7 out of 10,
namely:
·
Rainwater harvesting (7.0)
·
Avoiding living in a
location with only one major exit (6.9)
·
Having access to a
floodplain map (6.7)
·
Creating a network within
the community (6.7)
·
Installing a sump pump
(6.6)
·
Installing additional shade
to one’s home (6.6)
·
Installing an air
conditioner (6.3)
·
Getting involved in the
community or apartment building board to raise awareness about climate change
impacts (6.0)
·
Finally, de-paving property
was considered the least helpful action with a rating of 5.5.
Because this question has been modified in 2023, no comparison is possible
with the 2022 survey.
Figure 12:
Actions that reduce an individual’s risk to climate change impacts (means out
of 10)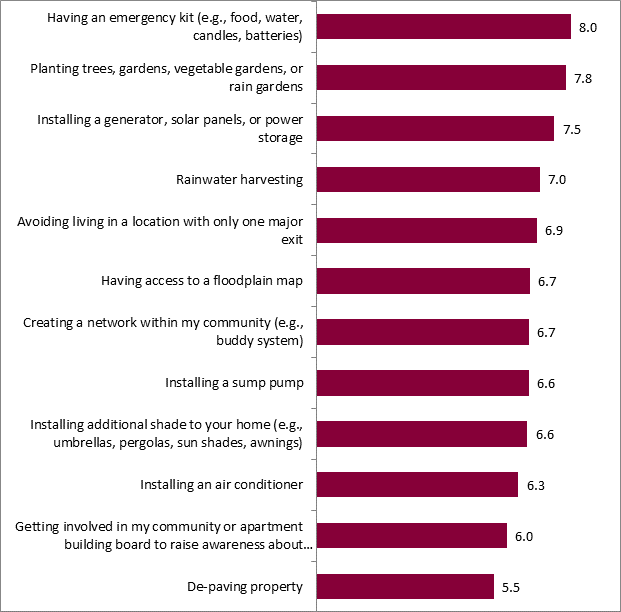 Q12. On a scale of 1 to 10, where 1 means "Does not help at
all" and 10 means "Helps a lot", how much do you think the
following actions help to reducing an individual's risk to climate change
impacts? Please note that if you are unable to undertake some of these actions,
that you can rate these actions for someone who can. Base: All web respondents
(n=1,718)
Q12. On a scale of 1 to 10, where 1 means "Does not help at
all" and 10 means "Helps a lot", how much do you think the
following actions help to reducing an individual's risk to climate change
impacts? Please note that if you are unable to undertake some of these actions,
that you can rate these actions for someone who can. Base: All web respondents
(n=1,718)
Significant differences include:
·
Women were more likely to
rate most of the actions higher than men.
·
Younger respondents (18 to
34 years old) were more likely to give a higher rating to having access to a
floodplain map (7.0), getting involved in my community or apartment building
board to raise awareness about climate change (6.3) and de-paving property
higher (6.1), while those aged 55 and over were more likely to rate higher
having an emergency toolkit (8.1)
·
Respondents from Ontario
were more likely to rate the following actions higher: planting trees, gardens,
vegetable gardens, or rain gardens (8.0), installing a generator, solar panels,
or power storage (7.7), rainwater harvesting (7.3), having access to a
floodplain map (7.0) and creating a network within my community (e.g., buddy
system) (7.0).
·
Respondents from the
Atlantic provinces were more likely to rate the following actions higher:
Having an emergency kit (e.g., food, water, candles, batteries) (8.4),
Installing a generator, solar panels, or power storage (8.0), having access to
a floodplain map (7.3), creating a network within my community (e.g., buddy
system) (7.1) or installing a sump pump (7.3).
·
Respondents from the
Prairies were more likely to give a higher rating to planting trees, gardens,
vegetable gardens, or rain gardens (8.3) and rainwater harvesting (7.6)
·
All actions were more
likely to be rated higher by those who expressed concern about climate change
and its impacts on Canada and those who experienced a climate-related event.
Actions that reduce a community’s risk to climate change
impacts
Respondents were asked to rate each item on
a scale of 0 to 10. Wildfire management (7.8), general emergency management
planning (7.7), and stormwater, flood, or erosion management (7.6) were seen as
the most effective actions to reduce a community’s risk to climate change
impacts. They were closely followed by drought management and heat management,
each with a score of 7.4, and protection of housing with a score of 7.2.
Installing community gardens to reduce food insecurity was also considered
beneficial with a score of 7.1. The action that respondents rated the lowest
was invasive species or pest management with a score of 6.9, just below
conducting a Community Risk Assessment using future climate projections at 7.0.
Because this question has been modified in 2023, no comparison is possible
with the 2022 survey.
Figure 13:
Actions that reduce a community’s risk to climate change impacts – Means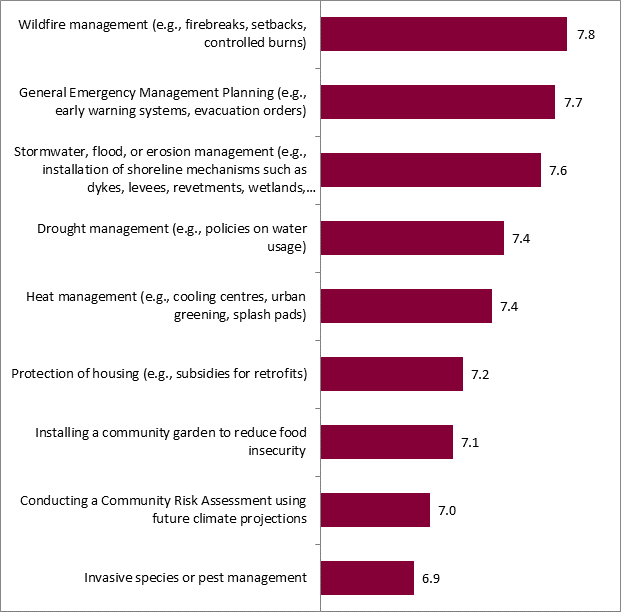 Q13. On a scale of 1 to 10, where 1 means "Does not help at
all" and 10 means "Helps a lot", how much do you think the
following actions help to reducing your community’s risk to climate change
impacts? Base: All web respondents (n=1,718)
Q13. On a scale of 1 to 10, where 1 means "Does not help at
all" and 10 means "Helps a lot", how much do you think the
following actions help to reducing your community’s risk to climate change
impacts? Base: All web respondents (n=1,718)
Significant differences among the subgroups
about the actions that contribute to reduce their community’s risk to climate
change impacts include:
·
Women were generally more
likely to rate any of the actions as more helpful compared to men.
·
Respondents from Ontario
were more likely to rate these actions as more helpful: General Emergency
Management Planning (e.g., early warning systems, evacuation orders) (8.0),
stormwater, flood, or erosion management (e.g., installation of shoreline mechanisms
such as dykes, levees, revetments, wetlands, stormwater ponds, policies of
development setbacks and zoning) (7.8), heat management (e.g., cooling centres,
urban greening, splash pads) (7.6), installing a community garden to reduce
food insecurity (7.5), invasive species or pest management (7.3).
·
All actions were more
likely to be rated higher by those who expressed concern about climate change
and its impacts on Canada and those who experienced a climate-related event.
Community adaptation solutions
Respondents were asked about any adaptation
solutions they were aware of that have been implemented in their community.
Around half of respondents were unsure about the implemented measures (52%),
and over one in ten stated none of the listed measures were implemented (15%).
The most implemented measure was urban
greening initiatives for heat and water management (16%), followed by climate
risk awareness (12%), established a network for emergencies (10%), flood maps
updated within the past 10 years (9%), and subsidies for home retrofits
specifically for protection against extreme heat, hail, flood, fires, wind
(9%).
Results remained mostly stable since 2022,
with the only significant difference being flood maps updated within the past
years 10 years being mentioned less than in 2022 (9% compared to 14%).
Figure 14: Implemented
adaptation solutions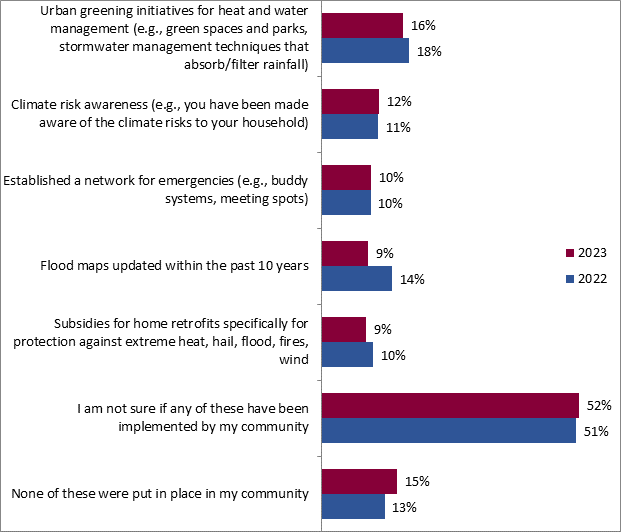 Q24.
To the best of your knowledge, which among the following
adaptation solutions have already been implemented by your community? Base: All web respondents (n=1,718)
Q24.
To the best of your knowledge, which among the following
adaptation solutions have already been implemented by your community? Base: All web respondents (n=1,718)
Significant differences regarding
adaptation solutions include:
·
Women were more likely to
be unsure of the implementation of any adaptation solutions compared to men
(56% compared to 47%)
·
Respondents from Quebec
were more likely to mention urban greening initiatives (26%)
·
Respondents from British
Columbia were significantly more likely to mention climate risk awareness (21%)
and establishing a network for emergencies (20%).
·
Respondents who experienced
a climate-related event were significantly more likely to mention all the
solutions.
Climate-related events experienced
Among all respondents, heatwaves were the most
experienced climate event, as they were mentioned by over half of respondents
(54%). While they remain the most common climate-related event, they were
mentioned significantly less compared to 2022 (59%).
Around a third of respondents experienced wildfires
or their impacts (36% compared to 19% in 2022), and high
winds/hurricanes/tornadoes (34%).
A little over one-fifth of respondents
mentioned having experienced flooding in 2023 (23%, down significantly from 34%
in 2022) and drought (22%).
Other climate-related events were mentioned
to a lesser extent, but there was also a significant decrease in the proportion
of those who experienced coastal erosion (6% compared to 11%).
 Figure 15: Climate-related events experienced
Q14. Within the past five years, which of
the following climate-related events have you experienced in your community? Base: All respondents (n=2,024)
Some notable significant differences
regarding experiences with climate-related events include:
·
Respondents aged 18-34 were
more likely to mention having experienced wildfires (43%) compared to those 55
and over (29%).
·
Respondents from Quebec
were more likely to mention heatwaves (60%).
·
Respondents from British
Columbia were more likely to mention heatwaves (72%), wildfires (57%), droughts
(44%), and landslides (12%).
·
Respondents from Alberta
were more likely to mention wildfires (61%) and droughts (37%).
·
Respondents from the
Prairies were more likely to mention droughts (38%)
·
Respondents from the
Atlantic region were more likely to mention high winds (57%), hurricanes (44%),
coastal erosion (24%), and sea level rise (18%).
·
Respondents from the
Territories were significantly more likely to mention wildfires (78%),
permafrost thaw (49%), flooding (43%), landslide (32%), and coastal erosion
(24%).
·
Respondents living in at-risk communities were more likely to mention high
winds/hurricanes/tornadoes (51%), flooding (33%) and coastal erosion (12%).
Impacts of the climate-related events on communities
Respondents were then asked about the
impacts of the climate-related event they experienced on themselves and their
household. Over half of respondents mentioned at least one impact (53%). The
most mentioned ones were having some physical health problems (18%), losing
access to critical utility or essential supplies (14%), house/property damage
(14%), having to spend money to address the impacts (13%), and having some
mental health problems (12%). Being physically stuck in a specific area for
more than an hour (9%), having to leave home temporarily (6%), feeling isolated
(6%), and having to leave home permanently (1%) were mentioned to a lesser
extent.
In 2023, a lower proportion of respondents
mentioned having to leave their home temporarily (6% compared to 9% in 2022)
and feeling isolated with no one to rely on (6% compared to 10% in 2022).
Figure 16:
Impacts of the climate-related events on the household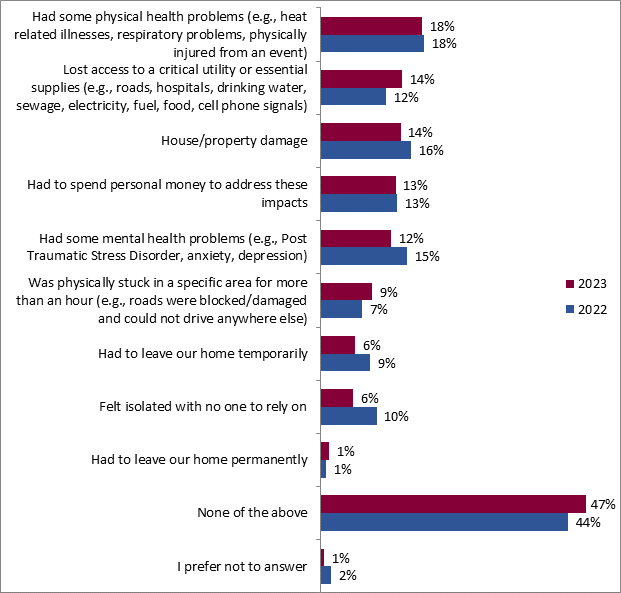 Q15. What were the direct impacts of the most
recent climate-related event that occurred in your community on you
and/or your household? Base:
Respondents who have experienced a climate-related event in their community
(n=1,664)
Q15. What were the direct impacts of the most
recent climate-related event that occurred in your community on you
and/or your household? Base:
Respondents who have experienced a climate-related event in their community
(n=1,664)
Some significant differences regarding
climate-related event impacts include:
·
Younger respondents were
significantly more likely to have experienced mental health issues (20%, making
it first on the list), being physically stuck in a specific area for more than
an hour (13%), and having to leave home temporarily (10%).
·
Respondents from Quebec and
those over 55 years old were significantly more likely to report not having
experienced any of the listed impacts (60% and 55% respectively).
·
Respondents from Ontario
were significantly more likely to mention house/property damage (18%) and
mental health problems (16%).
·
Respondents from the
Atlantic were more likely to mention having lost access to a critical utility
or essential service (37%) and house/property damage (27%).
·
Respondents from the
Territories were more likely to mention having faced almost all types of
impacts.
Length of time to return to normal after climate event
Respondents were asked about how much time
they felt it took to get “back to normal” (e.g., for
house to be repaired, for roads to be fixed, for physical health to return, for
mental health to return, for returning to job, etc.) after
experiencing the climate event. Almost two thirds of respondents declared that
their life returned to normal less than a year after the event (62%), and
around one in ten (10%) said it took one to two years. Smaller proportions have
declared that it took more than two years (6%), that it has not yet but will
(4%), or that it will never be the same (5%). Results remained stable since
2022.
Figure 17: Return to normal after climate
event
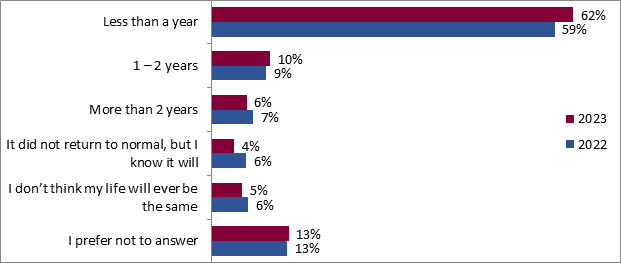 Q17. How long after the climate event would
you say it took for your life to return to normal (e.g., for your house to be
repaired, for the road to be fixed, for your physical health to return, for
your mental health to return, for you to return to your job)? Base: Respondents who have experienced a climate-related event in their
community (n=1,664)
Q17. How long after the climate event would
you say it took for your life to return to normal (e.g., for your house to be
repaired, for the road to be fixed, for your physical health to return, for
your mental health to return, for you to return to your job)? Base: Respondents who have experienced a climate-related event in their
community (n=1,664)
Handling of the situation
Respondents were asked to what extent they
considered that their community and different levels of government took
sufficient action to handle the climate-related event they have been through.
Around six-in-ten respondents who went
through a climate-related event agreed that their municipality took sufficient
action (59%). A little over half of respondents agreed their community took
sufficient action (56%). Around half agreed that their provincial or
territorial government took sufficient action (49%), and two-in-five
respondents agreed the federal government took sufficient action (42%).
Figure 18:
Handling of the situation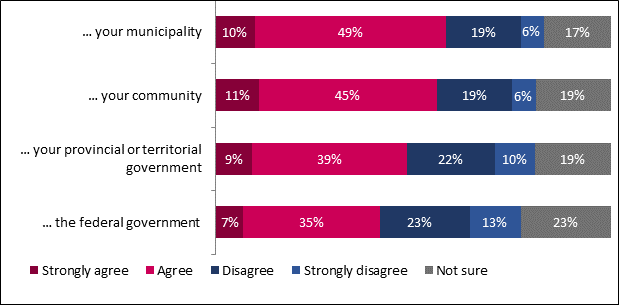 Q16. To what extent
do you agree or disagree that each of the following entities took sufficient
action when handling this climate-related event? Base:
Respondents who have experienced a climate-related event in their community
(n=1,664)
Q16. To what extent
do you agree or disagree that each of the following entities took sufficient
action when handling this climate-related event? Base:
Respondents who have experienced a climate-related event in their community
(n=1,664)
Note: Question and statements were changed
after the first wave (2022), no comparison available.
Significant differences include:
· Respondents living in an at-risk community were
more likely to consider that their community took sufficient action (62%)
compared to those who don’t (55%).
·
Those who had heard of the
National Adaptation Strategy were more likely to agree that the federal
government took sufficient action to handle the situation (55%).
·
Those who consider
themselves to be part of a community were significantly more likely to agree
with all statements.
· Respondents who live in British Columbia were
more likely to agree that their provincial government took sufficient action
(59%), while those from the Atlantic region and the Territories were more
likely to consider that their community took sufficient action (74% and 78%
respectively).
Actions that could have been taken for a better handling
of the situation
Respondents were then asked how the
situation could have been handled differently. Around two in three respondents
(63%) did not know what could have been done differently to better handle the
situation. Those who did gave different answers, including preparation /
prevention / being more prepared (8%) and more information / information
availability / communication (7%). Both of these statements were significantly
more mentioned than in 2022. Other statements were mentioned by 3% of
respondents or less.
Figure 19:
Actions that could have been taken for a better handling of the situation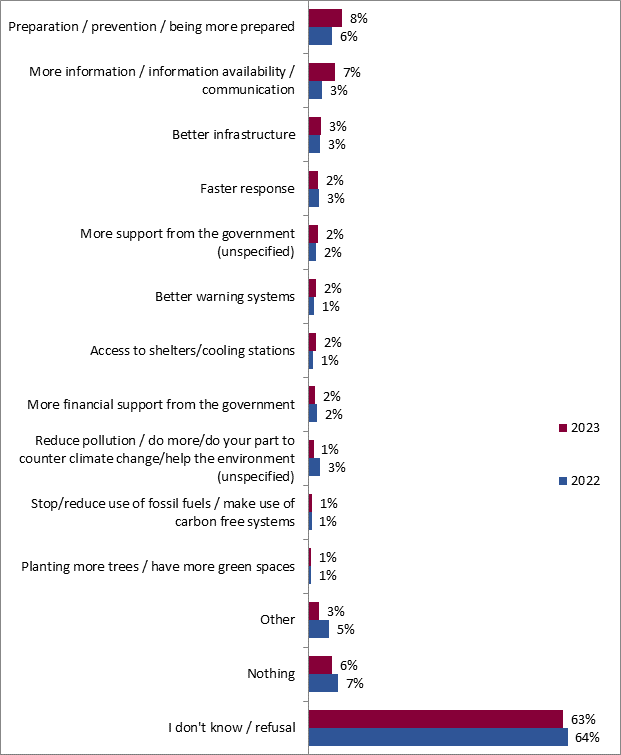 Q18. In your opinion, what could have been
done, or done differently, to better handle the situation? Base: All
respondents who went through a climate-related event (n=1,664)
Q18. In your opinion, what could have been
done, or done differently, to better handle the situation? Base: All
respondents who went through a climate-related event (n=1,664)
Note: Open-ended question. Total may exceed
100%.
Respondents from the Territories were more likely to know what could have
been done differently (66%). They were more likely to mention:
·
Preparation / prevention /
being more prepared (25%)
·
More information /
information availability / communication (25%)
·
Faster response (15%)
Support expectations towards various institutions
Respondents were asked who they expect to provide more support for managing climate-related events in the future.
Several significant differences are to be
noted between 2023 and 2022. The provincial or territorial government came
first in terms of support expectations (22%), but only by 2 percentage points.
They are closely followed by the local government (20%) and the federal
government (20%). One’s community is mentioned by less than one-in-ten
respondents who have been most affected by climate change impacts and have
experienced a climate-related event (7%).
Around one-in-four respondents were not
able to provide an answer (25%).
Figure 20: Support expectations towards
various institutions
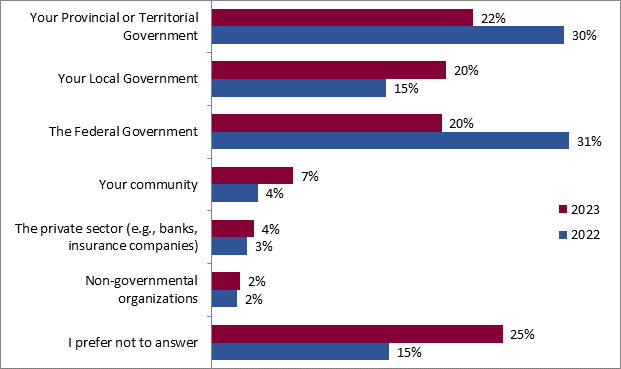 Q19. From which of the following would you
expect to provide more support to your community for managing climate-related
events? Base: Respondents who have been most affected
by climate change impacts and experienced a climate-related event (n=877)
Q19. From which of the following would you
expect to provide more support to your community for managing climate-related
events? Base: Respondents who have been most affected
by climate change impacts and experienced a climate-related event (n=877)
Respondents from British Columbia were
significantly more likely to expect more support from their provincial or
territorial government (45%), while those from the Prairies were more likely to
expect support from the federal government (30%).
Perception of government effort levels
Respondents were asked about their
perception of government efforts to minimize climate risks and to help
Canadians prepare for climate change. Less than three out of ten Canadians
agreed that enough is being done by all orders of governments to minimize
climate risks (29%) and to prepare for climate change (28%), with less than
one-tenth strongly agreeing with either statement (7%). Conversely,
three-in-five respondents disagreed with both statements, with over a third
disagreeing (38% for both) and a fifth strongly disagreeing (22% and 21%
respectively). Around one-in-ten respondents were unsure (12% and 13%
respectively).
Note: Statements were changed after the
first wave (2022), no comparison available.
Figure 21:
Perception of government effort levels – Detailed results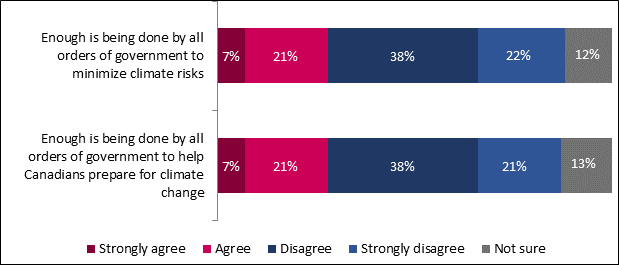 Q21. To what extent do you agree or disagree with the following
statements? Base: All respondents (n=2,024)
Q21. To what extent do you agree or disagree with the following
statements? Base: All respondents (n=2,024)
Significant differences regarding the
statement “enough is being done by all orders of government to minimize climate
risks” include:
·
Respondents who have not
experienced an extreme climate event were more likely to agree with the
statement (43%) compared to those who did (25%)
Significant differences regarding the statement “enough is being
done by all orders of government to help Canadians prepare for climate change”
include:
·
Respondents who have not
experienced an extreme climate event were more likely to agree with the
statement (38%) compared to those who did (26%)
4.2 Most helpful options in preparing for the next
climate-related event
More than half of respondents (56%) believe
that knowing what to do when the event occurs is the most helpful. Close
behind, 47% of respondents indicate that knowing where to go if utilities are
not available is important. Additionally, a similar proportion of participants
(46%) value information on how to protect their property ahead of time. Less
critical to respondents are community preparedness events (28%) and
opportunities to be involved in climate preparedness activities (22%). Finally,
one out of five respondents (19%) find knowing where to report incidents as a
helpful option.
Since this question
has changed in 2023, no comparison is possible with the 2022 survey.
Figure 22:
Most helpful options in preparing for the next climate-related event 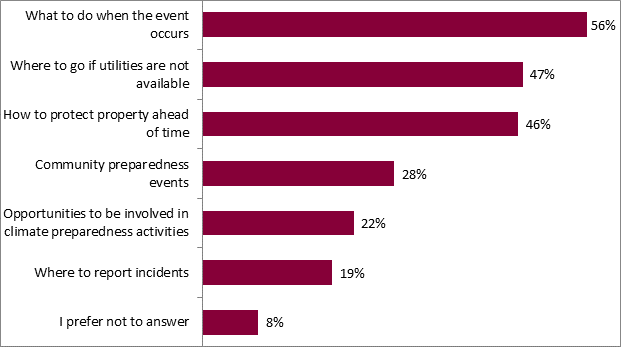 Q8. Among the following options, which one(s) would help you the
most in better preparing for the next climate-related event? Select up to
three answers. Base: All respondents (n=2,024)
Q8. Among the following options, which one(s) would help you the
most in better preparing for the next climate-related event? Select up to
three answers. Base: All respondents (n=2,024)
Significant differences regarding options
in preparing for the next climate-related event include:
·
Women were significantly
more likely to mention knowing what to do when the event occurs (60% compared
to 52%), knowing where to go if utilities are not available (52% compared to
42%) and knowing how to protect property ahead of time (50% compared to 43%).
·
Respondents from Quebec
(63%) and the Atlantic provinces (68%) were more likely to mention knowing what
to do when the event occurs.
·
Those from the territories
were more likely to mention community preparedness events (51%) as a helpful
option in preparing for the next climate-related event.
·
Respondents who experienced
a climate-related event were significantly more likely to mention all of the
elements.
Communications responsibility
Around three respondents out of ten (29%)
hold the federal government as the primary responsible for communicating the
information about how to prepare for climate-related events. A close second is
the provincial or territorial government, with 26% of respondents assigning
them responsibility. Fewer respondents see the municipal government (13%) and
emergency services like police and fire departments (10%) as the main
communicators. Weather forecast applications are deemed responsible by 6% of
the surveyed individuals, while community organizations are seen as the least
responsible, with only 2% of respondents thinking they should be responsible
for communicating the information.
Because this question has been modified in 2023, no comparison is possible
with the 2022 survey.
Figure 23: Communications responsibility
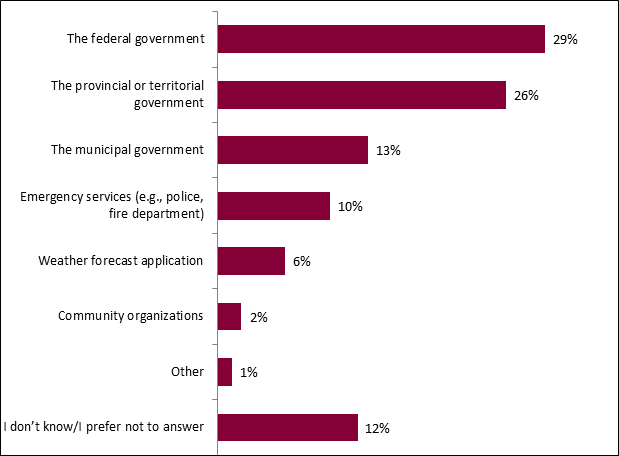
Q9. According to you, who should be
responsible for communicating this information? Base: All web respondents
(n=1,718)
Significant differences include:
·
Men (34% compared to 24%
for women) and respondents from Ontario (35%) were more likely to hold the
federal government responsible for communicating information.
·
Those from Quebec were more
likely to attribute this responsibility to the provincial or territorial
government (32%, making it first on the list) whereas those form the Atlantic
provinces put this responsibility on emergency services (e.g., police, fire
department) (21%).
·
Those who experienced an
extreme climate-related event were more likely to attribute the responsibility
of communicating information on the provincial or territorial government (27%)
and the municipal government (15% compared to 8%).
Communication preferences for extreme weather event
preparation
When
asked about communication preferences for extreme weather event preparation,
the preferred methods were SMS alerts, chosen by a fifth of respondents (20%),
television (18%), weather forecast apps and websites (16%) and The Weather
Network website (15%). Radio was chosen by 8% of respondents, while social
media platforms like Facebook, Instagram, and TikTok, as well as the
Environment and Climate Change Canada website, are each preferred by 7% of
respondents. Traditional newspapers are the least referred to for this
information, with only 1% relying on them.
Figure 24:
Communication preferences for extreme weather event preparation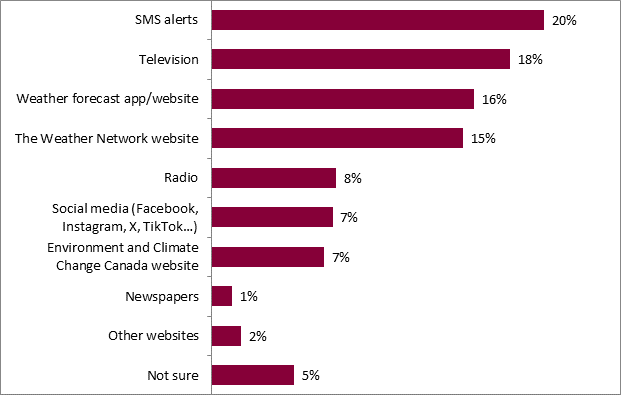 Q20. What is your preferred way to stay informed when an extreme
weather event is approaching (snowstorm, rainstorm, hurricane, heat wave,
etc.)? Base: All respondents (n=2,024)
Q20. What is your preferred way to stay informed when an extreme
weather event is approaching (snowstorm, rainstorm, hurricane, heat wave,
etc.)? Base: All respondents (n=2,024)
Significant differences in terms of
communication preferences in case of an approaching extreme weather event
include the following:
·
Respondents 55 years of age
and older were more likely to mention the television as their favorite way to
be informed (28%) compared to 18–34-year-olds (8%) and 35–54-year-olds (15%).
·
Albertan respondents were
more likely to prefer SMS alerts (31%) than respondents from other provinces.
·
Indigenous respondents were
more likely to prefer the radio as their favorite way to be informed (24%)
compared to non-Indigenous respondents (7%).
Note: This question having been added in
2023, no tracking comparison is possible.
Awareness of the National Adaptation Strategy
Awareness of the National Adaptation has
significantly increased since 2022 but remains low, as around 8% state being
aware of it (compared to 5% in 2022). On the other hand, nine out of ten
Canadians stated never having heard of it (91%).
Figure 25: Awareness of the National
Adaptation Strategy
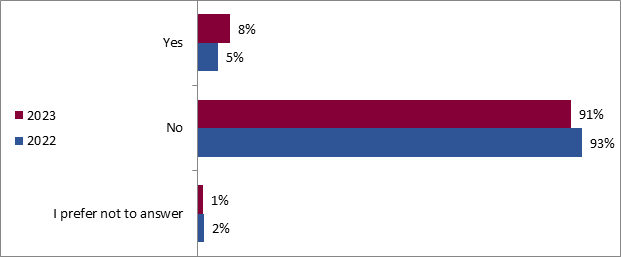 Q22. Before today, have you ever read or heard anything about
something called “The National Adaptation Strategy”? Base:
All respondents (n=2,024)
Q22. Before today, have you ever read or heard anything about
something called “The National Adaptation Strategy”? Base:
All respondents (n=2,024)
The following subgroups were more likely to
have read or heard about the National Adaptation Strategy:
·
Indigenous respondents (25%
versus 7%)
·
Respondents who have
experienced an extreme climate event (9% compared to 5% among those who did
not)
Understanding of the National Adaptation Strategy
For the respondents who had heard of the National
Adaptation Strategy, they were asked to explain what they thought it was. Over
two in three respondents who had heard of the Strategy were not able to explain
what it was (68%), and a little more than one out of ten (13%) mentioned that
it had to do with adapting to climate change.
Figure 26:
Understanding of the National Adaptation Strategy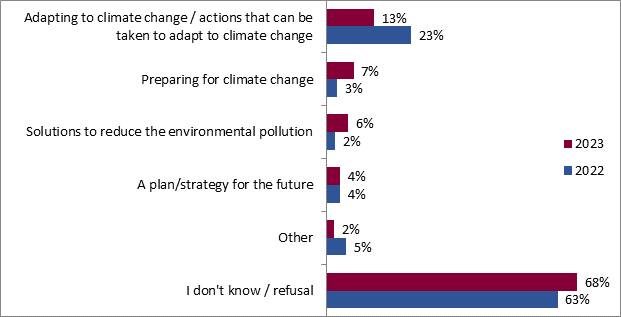 Q23. Please describe your understanding of
the National Adaptation Strategy. Base: Respondents who have heard of the
National Adaptation Strategy (n=172)Note: Open-ended. Total may exceed 100%.
Q23. Please describe your understanding of
the National Adaptation Strategy. Base: Respondents who have heard of the
National Adaptation Strategy (n=172)Note: Open-ended. Total may exceed 100%.
No relevant significant differences are to
be noted.
Preferred terminology
Respondents were asked which term among a
list best captures the efforts to make the impacts of climate change less
severe on people living in Canada, and results varied between francophones and
anglophones.
Anglophones preferred the term “Climate
preparedness and adaptation” above all others (31%), followed by “Preparing for
climate change” (20%). The terms “Adapting to climate change” and “Being
climate-ready” were preferred by less than one-fifth of respondents (16%), and
around the same proportion was unsure (17%).
On the other hand, a third of francophones
preferred the term “Se préparer aux changements climatiques” (Preparing for
climate change) (35%). Around one-fifth of them preferred the terms “Préparation
et adaptation au climat” (Climate preparedness and adaptation) (22%) and “S’adapter
aux changements climatiques” (Adapting to climate change) (20%). A little over
one-in-ten francophones preferred the term “Être préparé face au climat” (Being
climate-ready) (12%) or were unsure (11%).
Note: This question having been added in
2023, no tracking comparison is possible.
Figure
27: Preferred terminology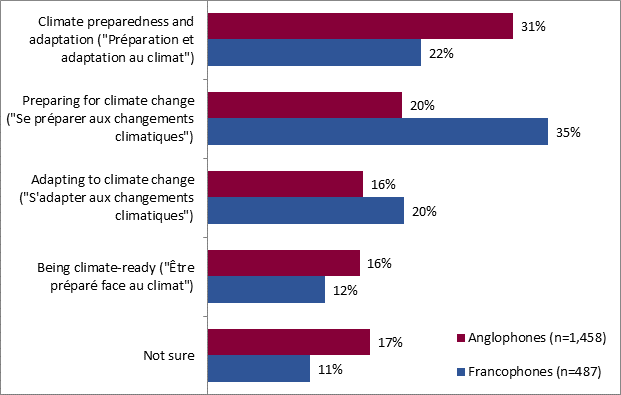 Q26. When you think about climate change and
the climate impacts we might feel in the future (e.g., more heat, flooding,
wildfires, sea level rise), which of the following terms do you think best
captures the efforts to make the impacts less severe on people living in
Canada? Base: All respondents (n=2,024)
Q26. When you think about climate change and
the climate impacts we might feel in the future (e.g., more heat, flooding,
wildfires, sea level rise), which of the following terms do you think best
captures the efforts to make the impacts less severe on people living in
Canada? Base: All respondents (n=2,024)
Overall, results from the quantitative study
remained stable since 2022, and main findings remain similar. While Canadians
acknowledge the importance of climate change and the increasing severity of its
impacts, a majority of them remained hopeful about solutions and motivated to
protect themselves.
A majority of respondents considered they
were familiar with what they can do to prepare in case of a climate-related
event, and a third have already taken measures to counter climate change
effects. A minority felt like they were doing enough already to adapt.
Heatwaves remain the most commonly
experienced climate-related event, but wildfires and their impacts have become
more prominent in 2023 and came in second. Most common impacts were physical
health problems and losing access to critical utility or essential supplies, having
house or property damage, having to spend money to address the impacts, and
having mental health impacts, but the situation returned to normal in less than
a year in most cases.
Regarding government expectations, most
considered that more needs to be done by all orders of government to minimize
climate risks. Communication wise, Canadians placed the responsibility on the
federal government first and foremost, followed closely by the provincial or
territorial government. Knowing what to do during the event, where to go in
case of utilities interruption, and how to protect property were the most
important information pieces that Canadians would like to have. Medium wise,
Canadians were torn, which points to the necessity to diversify communication
channels.
Awareness of the National Adaptation
Strategy was slightly higher in 2023 compared to 2022, but understanding
remains low.
Finally, English-speaking respondents
generally preferred the term “climate preparedness and adaptation”, while
French-speaking ones favored the term "Se préparer aux changements
climatiques" ("Preparing for climate change").
Based on the findings of the quantitative
study, we present the following recommendations to address the identified
challenges and leverage opportunities for improved outcomes in terms of climate
preparedness and adaptation:
EFFECTIVE
COMMUNICATION THEMES
The most compelling arguments for climate
adaptation involve future generations and agriculture and food production
protection. Therefore, incorporating these key themes into communication
strategies to motivate proactive preparation and adaptation efforts could prove
beneficial.
BRIDGING THE
KNOWLEDGE GAP
While most Canadians were motivated to do
what they can to protect themselves, their family, their community and house,
and are confident that there will be solutions, they remained afraid of its
impacts, and some didn't feel like they had enough knowledge to form an opinion
and felt hopeless. There is a clear necessity to develop, distribute and
publicize, on a large-scale, educational materials that empower and inform
individuals about resilience-building actions through concrete information and
actionable steps. Examples of communication and publicization initiatives
include: organizing events in schools, municipal libraries, utilizing internet
and social media platforms, and making use of parks, key moments, and locations
throughout the year to share information, such as participating in festivals, agricultural
fairs, with a physical presence, and sponsoring various events.
PROMOTING NATIONAL
ADAPTATION STRATEGY AWARENESS
The imperative for heightened public
awareness of the National Adaptation Strategy's objectives and benefits
suggests a need for focused communication efforts that clearly articulate the Strategy's
value and practical implications for individuals and communities.
Communications should focus on raising awareness levels
and understanding of the Strategy’s scope. In line with communication
recommendations mentioned above, it would be beneficial to utilize the same
channels to raise awareness of the National Adaptation Strategy among different
audiences.
AWARENESS OF FEDERAL GOVERNMENT ROLE AND
RESPONSIBILITIES
Mixed perceptions of government actions and
response in the wake of climate-related events indicate the importance of
enhancing and transparently communicating the effectiveness of federal actions
and responsibilities to strengthen public trust and clarify the role of the
federal government.
DIVERSIFYING
COMMUNICATION CHANNELS
To effectively disseminate information on
climate adaptation, employing a variety of communication methods is crucial to
ensure messages reach a broad audience and engage all community segments.
TERMINOLOGY
PREFERENCES IN COMMUNICATIONS
While terminology preferences were diffuse,
"climate preparedness and adaptation" was preferred by most English-speaking
respondents, and "se préparer aux changements climatiques" by French
speakers. Using these terms in communications will help improve understanding
of the topic among the target audience.
Leger conducted a series of ten focus group
sessions with French-speaking and English-speaking Canadians. Conducting the
groups online offered the opportunity to regroup people from all the regions in
Canada. All groups were conducted with individuals who have experienced
climate-related events and/or live in a community most affected by climate
change impacts. Five groups were conducted with Canadians living in urban
areas, and the remaining five were conducted with Canadians living in rural
areas. Overall, two focus groups were conducted in French (one of each
demographic), and the remaining eight were conducted in English.
For each online discussion session, ten
participants were recruited by our professional recruiters. A total of 91
recruits participated in the online discussion sessions (see table A1 for
details). All participants in each discussion session received an honorarium of
$125. Each group was 120 minutes long, to ensure the
participation of each participant. All sessions allowed for remote viewing by
Leger and Government of Canada observers. All groups
were scheduled to be held on August 8th, 9th, 16th
and 17th, 2023. Groups were held in the following regions on the
dates specified in Table A1.
The focus groups were conducted online
using Focus Vision’s CMNTY platform. This platform allowed for video
conferencing groups, observers in a separate virtual room, chat between
participants and the moderator, and chat between the observation room and the
moderator.
Table A1.1.
Details of the focus groups
|
GR
|
Region
|
Recruits
|
Participants
|
Target
|
Language
|
Date
|
Time
|
|
1
|
Quebec +
Atlantic
|
10
|
9
|
People
living in an urban area who have recently experienced a
climate-related disaster (general population, including Indigenous
representation)
|
English
|
August
8th
|
5pm
EST
|
|
2
|
Alberta +
Manitoba +
Saskatchewan+
NWT + Nunavut
|
10
|
9
|
People
living in an urban area who have recently experienced a
climate-related disaster (general population, including Indigenous
representation)
|
English
|
August
8th
|
7pm
EST
|
|
3
|
Ontario
|
10
|
9
|
People
living in an urban area who have recently experienced a
climate-related disaster (general population, including Indigenous
representation)
|
English
|
August
9th
|
5pm
EST
|
|
4
|
British
Columbia + Yukon
|
10
|
8
|
People
living in an urban area who have recently experienced a
climate-related disaster (general population, including Indigenous
representation)
|
English
|
August
9th
|
7pm
EST
|
|
5
|
Quebec +
Atlantic
|
10
|
9
|
People
living in an urban area who have recently experienced a
climate-related disaster (general population, including Indigenous
representation)
|
French
|
August
8th
|
5pm
EST
|
|
6
|
Quebec +
Atlantic
|
10
|
9
|
People
living in a rural area who have recently experienced a
climate-related disaster general population, including Indigenous
representation).
|
English
|
August
16th
|
5pm
EST
|
|
7
|
Alberta +
Manitoba +
Saskatchewan+
NWT + Nunavut
|
10
|
10
|
People
living in a rural area who have recently experienced a
climate-related disaster general population, including Indigenous
representation).
|
English
|
August
16th
|
7pm
EST
|
|
8
|
Ontario
|
10
|
9
|
People
living in a rural area who have recently experienced a climate-related
disaster general population, including Indigenous representation).
|
English
|
August
17th
|
5pm
EST
|
|
9
|
British Columbia + Yukon
|
10
|
9
|
People
living in a rural area who have recently experienced a
climate-related disaster general population, including Indigenous
representation).
|
English
|
August
17th
|
7pm
EST
|
|
10
|
Quebec +
Atlantic
|
10
|
10
|
People
living in a rural area who have recently experienced a
climate-related disaster general population, including Indigenous
representation).
|
French
|
August
8th
|
7pm
EST
|
|
Total
|
|
100
|
91
|
|
|
|
|
Recruitment was carried out by professional
recruiters. The recruitment guide (available in the appendix C) ensured that
the participants met the profiles sought for each session and that they were
equipped to participate in an online discussion session. To do so, they had to
confirm that they had a high-speed Internet connexion, a computer or laptop.
Moderation
All focus group sessions were moderated and
supervised by a Leger researcher assisted by a research analyst. One researcher
moderated the groups in French and one other moderated the groups in English.
The discussion guide (available in appendix B) consisted of a semi-structured
discussion guide. It allowed moderators to follow the thread of the discussion
and ensured that an array of themes was covered while leaving sufficient room
for the participants to express themselves and develop in detail their experiences,
ideas, opinions and perceptions.
This qualitative portion of the research
provides insight into the opinions of a population, rather than providing a
measure in percent of the opinions held, as would be measured in a quantitative
study. The results of this type of research should be viewed as directional
only. No inference to the general population can be done with the results of
this research.
Quality
Control
Leger recruited participants with the help
of CRC Research, our qualitative recruitment partner, using a hybrid method.
First, an online screening was used followed by a final recruitment screening
over the phone. The online recruitment enabled us to find many potential
candidates that fit the recruitment criteria across all regions of Canada.
Then, these potential candidates were contacted by phone by CRC’s professional
recruiters to confirm their eligibility and that they have access to a
computer, a high-speed online connection as well as a webcam to participate in
the online discussion session. After being adequately screened and recruited,
participants (as well as observers) received detailed instructions from CRC
Research on how to log in to the live session and other key information
regarding the procedure itself.
The recruitment screener informed
participants of all their rights under Canada’s Privacy legislation and the
Standards for the Conduct of Government of Canada Public Opinion Research.
Specifically, their confidentiality was guaranteed, and that participation is
voluntary.
After each group, a meeting was organized
with the researchers in order to get the general outlines and trends.
Limitation
Qualitative research is designed to reveal
a rich range of opinions and interpretations rather than to measure what
percentage of the target population holds a given opinion. These results must
not be used to estimate the numeric proportion or number of individuals in the
population who hold a particular opinion because they are not statistically
projectable.
Quantitative research was conducted through
a hybrid phone and web approach, using Computer Aided Telephone Interviewing
(CATI) and Computer Aided Web Interviewing (CAWI) technology.
As a Canadian Research Insights Council
Member, Leger adheres to the most stringent guidelines for quantitative
research. The survey was conducted in accordance with Government of Canada
requirements for quantitative research, including the Standards of the Conduct
of Government of Canada Public Opinion Research—Series D—Quantitative Research.
Respondents were assured of the voluntary,
confidential and anonymous nature of this research. As with all research
conducted by Leger, all information that could allow for the identification of
participants was removed from the data, in accordance with the Privacy Act.
The questionnaire is available in Appendix A.3.
Using data from the 2021 Statistics Canada
census, the weighting was done according to age, gender, province, education,
spoken language, presence of children in the household, and belonging to a
community that is most affected by climate change or not, to help readjust the
sample for minor imbalances. The weight of each region was adjusted to be
equivalent to its actual weight in relation to the distribution of the Canadian
population. The weighting factors are presented in detail in the A.1.4. section of this report.
A pre-test of 66 interviews was completed
before launching data collection to validate the programming of the
questionnaire in both English and French.
A.2.1 Sampling Procedure
Hybrid approach: Computer Aided Telephone
Interviewing (CATI) and Computer Aided Web Interviewing (CAWI)
A total of 306 respondents participated in
the phone survey. Participant selection was done randomly through telephone
number lists.
A total of 1,718 respondents participated
in the web survey. Participant selection was done through the Leger panel.
The exact distribution of respondents is
presented in the following section.
Considering that a hybrid approach was used
and that a majority of the sample comes from the panel, the sampling method
used is not probabilistic in nature, so no margin of error can be calculated. However,
for analysis purposes, statistically significant differences are included in
the report as a reference, comparable to those obtained from a similar
probability sample.
Details on the included people who have
been most affected by climate change impacts are presented in the appendix A.2.
A.2.2 Data Collection
Fieldwork for the survey was conducted from
November 30th, 2023, and January 24th, 2024. The
participation rate for the survey was 9% on the web and 13% on the phone. A
pre-test of 66 interviews was completed between December 1st and 6th,
2023. Two rounds of pretesting have been done overall, as the first pretest
uncovered a longer than anticipated length of interview for the phone portion. Average
length of interview for the last phone pretest was 20 minutes, and 8 minutes for
the web portion.
To achieve data reliability in all
subgroups, a total sample of 2,024 Canadians were surveyed, in all regions of
the country.
Respondents for this survey were selected
either randomly from a phone list, or through the Leger panel for the web
portion. The results of such a survey cannot be described as statistically
projectable to the target population. The data have been weighted to reflect
the demographic composition of the target population.
Based on data from Statistics Canada’s 2021
Census, Leger weighted the results of this survey according to age, gender, region,
education, first language, presence of children in the household, and belonging
to a community that is most affected by climate change or not, to help readjust
the sample for minor imbalances.
The following table details the regional
distribution of respondents. The sample attempted to replicate as closely as
possible the actual distribution of the Canadian population.
Table A.2.1
Regional Distribution of Respondents
|
Region
|
Number of respondents
|
|
Quebec
|
445
|
|
Ontario
|
596
|
|
British Columbia
|
152
|
|
Alberta
|
209
|
|
Prairies
|
244
|
|
Atlantic
|
300
|
|
Territories
|
78
|
|
Total
|
2,024
|
A.2.3 Participation Rate
The overall participation rate for this
study is 9% on the web and 13% on the phone. Below is the calculation of both
the web and the phone survey’s participation rate. The participation rate is
calculated using the following formula: Participation rate = R ÷ (U + IS + R).
The tables below provide details of the calculation for both the web and the
phone portions.
Table A.2.2
Participation Rate Calculation – Web portion
|
Invalid cases
|
|
|
Invitations mistakenly sent to
people who did not qualify for the study
|
2
|
|
Incomplete or missing email
addresses
|
0
|
|
Unresolved (U)
|
14,661
|
|
Email invitations bounce back
|
33
|
|
Email invitations unanswered
|
14,628
|
|
In-scope non-responding units
(IS)
|
15,860
|
|
Non-response from eligible respondents
|
15,725
|
|
Respondent refusals
|
0
|
|
Language problem
|
0
|
|
Selected respondent not available
(illness; leave of absence; vacation; other)
|
0
|
|
Early breakoffs
|
135
|
|
Responding units (R)
|
2,984
|
|
Surveys disqualified – quota filled
|
937
|
|
Completed surveys disqualified for
other reasons
|
23
|
|
COMPLETED INTERVIEWS
|
2,024
|
|
POTENTIALLY
ELIGIBLE (U+IS+R)
|
33,505
|
|
Participation rate= R/(U + IS + R)
|
9%
|
Table A.2.3 Participation Rate
Calculation – Phone portion
|
Base Sample
|
|
|
Invalid number
|
5,447
|
|
No service
|
5,277
|
|
Non-residential
|
40
|
|
Fax / modem / pager
|
130
|
|
Double
|
0
|
|
Unresolved (U)
|
6,946
|
|
No answer
|
2,752
|
|
Answering machine
|
3,978
|
|
Line busy
|
216
|
|
Effective sample
|
4,172
|
|
In-scope non-responding units
(IS)
|
2,770
|
|
Refusal
|
2,638
|
|
Language Barrier
|
132
|
|
Responding units (R)
|
1,402
|
|
Quota attained
|
94
|
|
Unqualified
|
231
|
|
Incomplete
|
32
|
|
Appointment
|
739
|
|
COMPLETED INTERVIEWS
|
306
|
|
POTENTIALLY
ELIGIBLE (U+IS+R)
|
11,118
|
|
Participation rate
|
13%
|
A.2.4 Unweighted and
Weighted Samples
A basic comparison of the unweighted and
weighted sample sizes was conducted to identify any potential non-response bias
that could be introduced by lower response rates among specific demographic
subgroups (see tables below).
The table below presents the geographic
distribution of respondents, before and after weighting. The weighting adjusted
for some discrepancies: the weights of the Prairies, the Atlantic, and
Territories were reduced in favor of Ontario and British Columbia in order to
have a sufficient subsample in these regions. Therefore, the weighting
minimized the weight of these regions that had been inflated and slightly
increased the weights of Ontario and British Columbia.
Table A.2.4
Unweighted and Weighted Sample Distribution by Region
|
Region
|
Unweighted
|
Weighted
|
|
Quebec
|
445
|
468
|
|
Ontario
|
596
|
785
|
|
British Columbia
|
152
|
276
|
|
Alberta
|
209
|
225
|
|
Prairies
|
244
|
129
|
|
Atlantic
|
300
|
136
|
|
Territories
|
78
|
6
|
|
Total
|
2,024
|
2,024
|
The following
tables present the distribution of Canadians by age and gender. The weighting slightly
decreased the weight of men and respondents 55 years old and over. The small differences
observed have not introduced a non-response bias for these sample subgroups.
Table A.2.5
Unweighted and Weighted Sample Distribution by Age
|
Age
|
Unweighted
|
Weighted
|
|
18-34
|
383
|
538
|
|
35-54
|
598
|
651
|
|
55+
|
1,043
|
836
|
|
Total
|
2,024
|
2,024
|
Table A.2.6
Unweighted and Weighted Sample Distribution by Gender
|
Gender
|
Unweighted
|
Weighted
|
|
Man
|
878
|
987
|
|
Woman
|
1,140
|
1,031
|
|
Another
gender identity
|
5
|
7
|
|
Total
|
2,024
|
2,024
|
The following tables present the
distribution of Canadians by level of education and the presence of children in
the household. Weighting decreased the weight of respondents who attended
university in favor of those with lower education levels. Regarding the
presence of children in the household, weighting slightly decreased the weight
of those who did not have any children in the household in favour of those who
did.
Table A.2.7
Unweighted and Weighted Sample Distribution by Education
|
Education
|
Unweighted
|
Weighted
|
|
High
school and less
|
500
|
621
|
|
College
|
661
|
831
|
|
University
|
853
|
559
|
|
Total
|
2,024
|
2,024
|
Table A.2.8
Unweighted and Weighted Sample Distribution by Presence of children in the
household
|
Presence of children in the household
|
Unweighted
|
Weighted
|
|
Yes
|
464
|
533
|
|
No
|
1538
|
1472
|
|
Total
|
2,024
|
2,024
|
The following tables present the
distribution of respondents by language spoken at home and belonging to a community
that is most affected by climate change or not. Slight adjustments have been
made to reduce the weight of respondents who have been most affected by climate
change impacts in favor of those who do not, in order to be representative of
their distribution in the population.
Table A.2.9
Unweighted and Weighted Sample Distribution by Language spoken at home
|
Language spoken at home
|
Unweighted
|
Weighted
|
|
French
|
441
|
487
|
|
English
|
1,492
|
1,458
|
|
Other
|
89
|
76
|
|
Total
|
2,024
|
2,024
|
Table A.2.10
Unweighted and Weighted Sample Distribution by Belonging to a community that is
most affected by climate change
|
Belonging to a community that is most affected by climate change
|
Unweighted
|
Weighted
|
|
Yes
|
877
|
347
|
|
No
|
1,147
|
1,677
|
|
Total
|
2,024
|
2,024
|
There is no evidence from the data that
having achieved a different distribution through the presented variables prior
to weighting would have significantly changed the results for this study. The
relatively small weight factors (see section below) and differences in
responses between various subgroups suggest that data quality was not affected.
The weight that was applied corrected the initial imbalance for data analysis
purposes and no further manipulations were necessary.
The following tables present the weighting
factors applied to the database according to the different respondent profiles.
Table A.2.11
Weight factors by Profile
|
Label
|
Weight
|
|
British Columbia Male
18-24
|
0.69
|
|
British Columbia Male
25-34
|
1.18
|
|
British Columbia Male
35-44
|
1.10
|
|
British Columbia Male
45-54
|
0.98
|
|
British Columbia Male
55-64
|
1.17
|
|
British Columbia Male
65+
|
1.61
|
|
British Columbia
Female 18-24
|
0.65
|
|
British Columbia
Female 25-34
|
1.07
|
|
British Columbia
Female 35-44
|
1.08
|
|
British Columbia
Female 45-54
|
1.12
|
|
British Columbia
Female 55-64
|
1.25
|
|
British Columbia
Female 65+
|
1.84
|
|
Alberta Male 18-24
|
0.00
|
|
Alberta Male 25-34
|
1.63
|
|
Alberta Male 35-44
|
1.10
|
|
Alberta Male 45-54
|
0.92
|
|
Alberta Male 55-64
|
0.91
|
|
Alberta Male 65+
|
1.00
|
|
Alberta Female 18-24
|
0.57
|
|
Alberta Female 25-34
|
1.02
|
|
Alberta Female 35-44
|
1.11
|
|
Alberta Female 45-54
|
0.92
|
|
Alberta Female 55-64
|
0.93
|
|
Alberta Female 65+
|
1.13
|
|
Manitoba/Saskatchewan
Male 18-24
|
0.31
|
|
Manitoba/Saskatchewan
Male 25-34
|
0.57
|
|
Manitoba/Saskatchewan
Male 35-44
|
0.56
|
|
Manitoba/Saskatchewan
Male 45-54
|
0.49
|
|
Manitoba/Saskatchewan
Male 55-64
|
0.54
|
|
Manitoba/Saskatchewan
Male 65+
|
0.66
|
|
Manitoba/Saskatchewan
Female 18-24
|
0.36
|
|
Manitoba/Saskatchewan
Female 25-34
|
0.56
|
|
Manitoba/Saskatchewan
Female 35-44
|
0.56
|
|
Manitoba/Saskatchewan
Female 45-54
|
0.49
|
|
Manitoba/Saskatchewan
Female 55-64
|
0.55
|
|
Manitoba/Saskatchewan
Female 65+
|
0.78
|
|
Ontario Male 18-24
|
2.13
|
|
Ontario Male 25-34
|
3.32
|
|
Ontario Male 35-44
|
3.01
|
|
Ontario Male 45-54
|
2.99
|
|
Ontario Male 55-64
|
3.29
|
|
Ontario Male 65+
|
4.04
|
|
Ontario Female 18-24
|
1.98
|
|
Ontario Female 25-34
|
3.28
|
|
Ontario Female 35-44
|
3.19
|
|
Ontario Female 45-54
|
3.20
|
|
Ontario Female 55-64
|
3.48
|
|
Ontario Female 65+
|
4.85
|
|
Quebec Male 18-24
|
1.08
|
|
Quebec Male 25-34
|
1.80
|
|
Quebec Male 35-44
|
1.89
|
|
Quebec Male 45-54
|
1.76
|
|
Quebec Male 55-64
|
2.07
|
|
Quebec Male 65+
|
2.70
|
|
Quebec Female 18-24
|
1.04
|
|
Quebec Female 25-34
|
1.78
|
|
Quebec Female 35-44
|
1.90
|
|
Quebec Female 45-54
|
1.74
|
|
Quebec Female 55-64
|
2.11
|
|
Quebec Female 65+
|
3.21
|
|
Atlantic Male 18-24
|
0.30
|
|
Atlantic Male 25-34
|
0.47
|
|
Atlantic Male 35-44
|
0.47
|
|
Atlantic Male 45-54
|
0.52
|
|
Atlantic Male 55-64
|
0.63
|
|
Atlantic Male 65+
|
0.85
|
|
Atlantic Female 18-24
|
0.30
|
|
Atlantic Female 25-34
|
0.47
|
|
Atlantic Female 35-44
|
0.50
|
|
Atlantic Female 45-54
|
0.55
|
|
Atlantic Female 55-64
|
0.67
|
|
Atlantic Female 65+
|
0.99
|
Table A.2.12 Weight
Factors by Region
|
Label
|
Weight
|
|
British Columbia
(Vancouver CMA)
|
7.10
|
|
British Columbia
(Other)
|
6.54
|
|
Alberta (Calgary CMA)
|
3.90
|
|
Alberta (Edmonton
CMA)
|
3.73
|
|
Alberta (Other)
|
3.50
|
|
Saskatchewan
|
2.93
|
|
Manitoba
|
3.43
|
|
Ontario (Toronto CMA)
|
16.95
|
|
Ontario (other)
|
21.82
|
|
Quebec (Mtl CMA)
|
11.58
|
|
Quebec (Qc CMA)
|
2.30
|
|
Quebec (Other)
|
9.23
|
|
New-Brunswick
|
2.16
|
|
Nova Scotia
|
2.69
|
|
Prince-Edward Island
|
0.42
|
|
Newfoundland
|
1.44
|
Table A.2.13 Weight
Factors by language and region
|
Label
|
Weight
|
|
French – Rest of
Canada
|
2.74
|
|
French- Quebec
|
17.82
|
|
Non-francophone –
Rest of Canada
|
74.16
|
|
Non-francophone -
Quebec
|
5.29
|
Table A.2.14 Weight
Factors by Education level
|
Label
|
Weight
|
|
College and less
|
72.36
|
|
University – Rest of
Canada
|
21.76
|
|
University - Quebec
|
5.88
|
Table A.2.15 Weight
Factors by Presence of children in the household
|
Label
|
Weight
|
|
Yes
|
27.28
|
|
Non
|
72.72
|
A.2.5 Detailed
information on those who have been most affected by climate change impacts
Respondents who have been most affected by
climate change impacts were identified by a number of characteristics. First,
two to three communities were identified for each province or territory that
had recently experienced a significant climate event in the past five years
(e.g., a wildfire, hurricane, flooding event, heat wave, etc.), or are
experiencing the onset impacts of climate change everyday (e.g., coastal
erosion, thawing permafrost, declining sea ice and glacier ice, etc.). By
identifying two to three communities per province or territory, this ensured
that a statistically significant number of people per community could be
interviewed (e.g., 30 people minimum per community to reach 1000 people in
total). Since participation rates for surveys are usually about 15%, each
community had to have at least 1,000 people in total population to ensure participation
rates were at least 30 people per community.
As rural and urban communities differ
significantly, there was an effort to choose one urban and one rural community
per province or territory. From here, specific neighbourhoods were identified
as more impacted, by using 2016 Statistics Canada Census Program data (e.g.,
median income, Indigenous populations, visible minorities, recent immigration,
low-income measure, and unemployment rates). Neighbourhoods that showed vast
differences in one of these areas compared to the rest of the town or city were
then identified as communities that are most impacted by climate change.
Please see the table below for a full list
of those who have been most affected by climate change impacts that were used
as part of this study.
Table A2: A
Complete list of those who have been most affected by climate change impacts
that were interviewed as part of this study.
|
Province / Territory
|
Community Name (and neighbourhood)
|
Forward Sortation Area (FSA) code
|
Urban or Rural Community
|
|
Yukon
|
Whitehorse
|
Y1A
|
Urban
|
|
Yukon
|
Dawson City
|
Y0B
|
Rural
|
|
Northwest Territories
|
Fort Smith
|
X0E
|
Rural
|
|
Northwest Territories
|
Yellowknife
|
X1A
|
Urban
|
|
Northwest Territories
|
Hay River
|
X0E
|
Rural
|
|
Nunavut
|
Iqaluit
|
X0A
|
Urban
|
|
Nunavut
|
Arviat
|
X0C
|
Rural
|
|
Nunavut
|
Cambridge Bay
|
X0B
|
Rural
|
|
British Columbia
|
Abbotsford
|
V3G
|
Urban
|
|
British Columbia
|
Central Okanagan (Peachland)
|
V0H
|
Rural
|
|
Alberta
|
Calgary (NE)
|
T3J
|
Urban
|
|
Alberta
|
Edson
|
T7E
|
Rural
|
|
Saskatchewan
|
Cypress Hills-Grasslands (Leader, Lancer)
|
S0N
|
Rural
|
|
Saskatchewan
|
Swift Current
|
S9H
|
Rural
|
|
Manitoba
|
Portage la Prairie (farms around city)
|
R0H
R1N
|
Rural
|
|
Manitoba
|
Winnipeg - Point
Douglas East Winnipeg
|
R2W
R3B
|
Urban
|
|
Ontario
|
Chatham-Kent
|
N0P
N7M
|
Rural
|
|
Ontario
|
Uxbridge
|
L9P
|
Rural
|
|
Quebec
|
Montreal - North
|
H1G
|
Urban
|
|
Quebec
|
Iles-de-la-Madeleine
|
G4T
|
Rural
|
|
Quebec
|
Joliette
|
J6E
|
Rural
|
|
New Brunswick
|
Charlotte County -
Grand Manan
|
E5G
|
Rural
|
|
New Brunswick
|
Moncton
|
E1C
|
Urban
|
|
Nova Scotia
|
South End - Halifax
|
B3H
|
Urban
|
|
Nova Scotia
|
Lunenburg
|
B0J
|
Rural
|
|
PEI
|
Charlottetown
|
C1A
|
Urban
|
|
PEI
|
Lennox Island
|
C0B
|
Rural/Indigenous
|
|
Newfoundland and
Labrador
|
Corner Brook
|
A2H
|
Urban
|
|
Newfoundland and
Labrador
|
Channel-Port aux
Basques
|
A0N
A0M
|
Rural
|
|
Nova Scotia
|
Upper Tantallon
|
B3Z
|
Urban
|
|
Nova Scotia
|
Hammond Plains
|
B4B
|
Urban
|
|
Alberta
|
Whitecourt
|
T7S
|
Urban
|
|
Ontario
|
Lindsay
|
K9V
|
Urban
|
|
Quebec
|
Sainte-Adèle
|
J8B
|
Urban
|
|
Alberta
|
South Edmonton
|
T6W
|
Urban
|
|
British Columbia
|
Saanich-Gulf Islands
|
V8L
|
Urban
|
|
New Brunswick
|
Lamèque Island
|
E8T
|
Urban
|
PROJECT DESCRIPTION
The groups will be held online via
CMNTY.
The objective is to have 8-10
participants per focus group.
|
|
DATE
/ TIME
|
PARTICIPANTS
|
LANGUAGE
|
REGION
|
|
GROUP 1
8-10
participants
|
august
8
5
pm (DST)
6
pm (ADT)
|
People living in an urban
area who have recently experienced a climate-related disaster (general
population, including Indigenous representation)
|
ENG
|
QUEBEC+
ATLANTIC
|
|
GROUP 2
8-10
participants
|
august
8
7
pm (DST)
7
PM (EDT)
5
pm (MDT)
6
PM (MDT)
|
People living in an urban
area who have recently experienced a climate-related disaster (general
population, including Indigenous representation)
|
ENG
|
Alberta+
Manitoba+
Saskatchewan+
NWT + Nunavut
|
|
GROUP 3
8-10
participants
|
august
9
5
pm (DST)
|
People living in an urban
area who have recently experienced a climate-related disaster (general
population, including Indigenous representation)
|
ENG
|
Ontario
|
|
GROUP
4
8-10
participants
|
august
9
7
pm (DST)
4
pm [(MST/PDT)]
|
People living in an urban
area who have recently experienced a climate-related disaster (general
population, including Indigenous representation)
|
ENG
|
BC + yukon
|
|
GROUP 5
8-10
participants
|
August
8
5
pm (DST)
6
pm (ADT)
|
People living in an urban
area who have recently experienced a climate-related disaster (general
population, including Indigenous representation)
|
FR
|
QUEBEC+
ATLANTIC
|
|
GROUP
6
8-10
participants
|
August
16
5
pm (DST)
6
pm (ADT)
|
People living in a rural
area who have recently experienced a climate-related disaster general
population, including Indigenous representation).
|
ENG
|
QUEBEC+
ATLANTIC+
|
|
GROUP 7
8-10
participants
|
August
16
7
pm (DST)
7
PM (EDT)
5
pm (MDT)
6
PM (MDT)
|
People living in a rural
area who have recently experienced a climate-related disaster general
population, including Indigenous representation).
|
ENG
|
Alberta+
Manitoba+
Saskatchewan+
NWT + Nunavut
|
|
GROUP
8
8-10
participants
|
August 17
5
pm (DST)
|
People living in a rural
area who have recently experienced a climate-related disaster general
population, including Indigenous representation).
|
ENG
|
Ontario
|
|
GROUP
9
8-10
participants
|
August
17
7
pm (DST)
4
pm [(MST/PDT)]
|
People living in a rural
area who have recently experienced a climate-related disaster general
population, including Indigenous representation).
|
ENG
|
BC + Yukon
|
|
GROUP
10
8-10
participants
|
August
8
7
pm (DST)
8
pm (ADT)
|
People living in a rural
area who have recently experienced a climate-related disaster general
population, including Indigenous representation).
|
FR
|
QUEBEC+
ATLANTIC
|
Recognizing challenges
with regards to recruitment, it would be best if we are able to also include
Indigenous participants in some groups. Would be nice to aim for at least two
Indigenous participants across the urban groups and two across the rural groups.
Regarding regions, it
would be ideal to have a good mix of all regions/provinces while being mindful
of time differences between provinces.
For each participant, collect the
following information:
|
Participant name:
|
|
Phone number at home:
|
|
Cell phone:
|
|
Email address:
|
|
Recruitment
date: Recruiter :
|
|
Group
#:
Confirmation (date):
|
INTRODUCTION
Hello/Bonjour,
I'm ___________ of Leger, a marketing research company. We are organizing a
research project on behalf of the Government of Canada. One of the objectives of
this project is to hear from people living in Canada who have recently gone
through a climate-related event (e.g., wildfire, floods, hurricanes, extreme
heat) or who are facing environmental changes every day (e.g., coastal erosion,
permafrost thaw, degrading water quality). The purpose of the research is to seek
opinions and perspectives from Canadians that will be used by the Government of
Canada to understand Canadians’ behaviours and attitudes with respect to
climate event impacts and how prepared we are to these climatic events in the
future.
Hearing
their stories - from what worked well, what didn’t work well, and what they
find empowering will help the Government of Canada develop tools for helping
Canadians and governments to prepare for climate change (e.g., by helping Canadians know how to protect their homes,
families, communities and businesses from the impacts of climate change).
You
do not have to be an expert on the subject, as we are interested in your own
lived experiences and attitudes towards the topic.
We
are preparing to hold a few research sessions with people like yourself.
Participation is completely voluntary. We are interested in your opinions. The
format is an "online" discussion led by a research professional with
up to ten participants. All opinions will remain anonymous and will be used for
research purposes only in accordance with laws designed to protect your
privacy. We don't have anything to sell, and we don't advertise and it's not an
opinion poll on current events or politics. We are organizing several of these
discussions. We would be interested in possibly having you participate.
Your
participation is voluntary. All information collected, used and/or disclosed
will be used for research purposes only and the research is entirely
confidential. We are also committed to protecting the privacy of all
participants. The names of the participants will not be provided to any third
party. May I continue?
[INTERVIEWER
NOTE: IF ASKED ABOUT PRIVACY LAWS, SAY: “The information collected through the
research is subject to the provisions of the Privacy Act, the legislation of
the Government of Canada, and to the provisions of relevant provincial privacy
legislation.]
The focus group would take place online on the (INSERT DATE/TIME) and will be a maximum of 1
hour and a half. You will be compensated $125 for your time.
I repeat that participation is entirely voluntary, and
all information you provide is completely confidential. The full names of
participants will not be provided to any third party.
A1. Are you interested in participating?
|
Yes
|
1
|
CONTINUE
|
|
No
|
2
|
THANK AND CONCLUDE
|
I
would now like to ask you a few questions to see if you meet our eligibility
criteria to participate.
When you conclude at A2-A3
-Intro 1, say: Thank you for your cooperation but unfortunately, we cannot
invite you in the groups we organize.
When you conclude on other
screening questions, say: Thank you for your collaboration. We have already
reached the number of participants with a profile similar to yours. Therefore,
we cannot invite you to participate.
A2. The group discussions we are organizing are going
to be held over the Internet. They are going to be "online focus
groups". Participants will need to have a computer, a high-speed
Internet connection, and a Webcam in order to participate in the
group. Would you be able to participate under these conditions?
|
Yes
|
1
|
CONTINUE
|
|
No
|
2
|
THANK AND CONCLUDE
|
ASK IF TARGETED THROUGH VULNERABLE
COMMUNITIES LIST
CP. Could you provide us with the first
three characters of your postal code?
IF prospect asks why, say: “We are currently
recruiting individuals living in communities that are considered vulnerable or communities impacted
by climate change, the first three characters of your postal code will help us
validate the information.”
RECORD Postal Code: ___
See “Vulnerable
communities” document for the list of postal codes to target.
A3. Within the past five years, have you experienced
any of the following climate-related events in your community?
IF
PROSPECT ASKS ABOUT ANY OF THE EVENTS, REFER TO THE ‘DEFINITION OF CLIMATE
TERMS” DOCUMENT
|
Coastal erosion
(defined as the landward movement of the shoreline as cliffs recede or as
beach and dune systems change location)
|
1
|
CONTINUE
|
|
Flooding
(defined as when the volume of water in a river, lake, or coastal shorelines overflows,
or when there is excess rainfall causing flash flooding)
|
2
|
CONTINUE
|
|
Wildfire
(defined as an uncontrolled fire that burns in the wildland vegetation)
|
3
|
CONTINUE
|
|
Sustained high
winds, hurricane or tornado, for which Environment Canada issued warnings or
alerts
|
4
|
CONTINUE
|
|
Permafrost thaw
(defined as the rapid thawing of ground, either soil or rock, that should remain
at 0°C or lower for at least two consecutive years)
|
5
|
CONTINUE
|
|
Drought
(defined as a shortage of precipitation over an extended period, resulting in
insufficient water availability that adversely impacts vegetation, animals
and people)
|
6
|
CONTINUE
|
|
Heatwave
(defined as an extended period of extreme heat for which Environment Canada
issues heat warnings)
|
7
|
CONTINUE
|
|
Sea level rise
(defined as when coastal areas experience differing levels of rising sea due
to meltwater volume added from glaciers, polar ice caps, ice sheets, or through
thermal expansion of warming ocean waters)
|
8
|
CONTINUE
|
|
None that I can
recall
|
97
|
IF NOT FROM MOST IMPACTED COMMUNITY AND NO
CLIMATE-RELATED EVENT, THANK AND CONCLUDE
|
In every group, we would
like a good mix of those who have experienced climate change impacts (max 2 per
group for heatwave), and those who live in a most impacted community but have
not experienced any climate change related event (max. 3-4 per group).
PROFILING
INTRO1.
Do you or anyone in your immediate family
work or have you ever worked in ...?
|
Marketing Research
|
1 THANK
AND CONCLUDE
|
|
Marketing and Advertising
|
2 THANK
AND CONCLUDE
|
|
Public relations, communications
|
3 THANK
AND CONCLUDE
|
|
Media (newspapers, television, radio,
etc.)
|
4 THANK
AND CONCLUDE
|
|
Telecommunications
|
5 THANK
AND CONCLUDE
|
|
Environment and/or climate change sector
|
6 THANK
AND CONCLUDE
|
|
None of the above
|
99
|
Gender
Please indicate your gender
|
Male or man
|
1
|
|
Female or woman
|
2
|
|
Non-binary/Two-spirit or another gender
identity
|
3
|
Gender: Ensure a good mix
during the recruitment, Another gender is not a screening criteria
Province
In which province or territory do you live?
|
British Columbia
|
1
|
|
Alberta
|
2
|
|
Saskatchewan
|
3
|
|
Manitoba
|
4
|
|
Ontario
|
5
|
|
Quebec
|
6
|
|
New Brunswick
|
7
|
|
Nova Scotia
|
8
|
|
Prince Edward Island
|
9
|
|
Newfoundland
|
10
|
|
Northwest Territories
|
11
|
|
Yukon
|
12
|
|
Nunavut
|
13
|
AREA
Which of the following best describes the
area in which you live?
Refer to “Vulnerable communities”
list if unsure
|
Urban area
|
1
|
|
Rural area
|
2
|
Aim for 5 groups urban and 5
groups rural – see grid on page 1.
Language
What is your first official language
spoken?
Note for recruiter if respondent asks: In
Canada, 'first official language spoken' is specified within the framework of
the Official Languages Act. It refers to the first official language (i.e.,
English or French) that is spoken by an individual.
AGE.
What age category do you fall into?
|
18 to 24
|
1
|
|
25 to 34
|
2
|
|
35 to 44
|
3
|
|
45 to 55
|
4
|
|
55 and over
|
5
|
Age: Ensure a good mix of age
during the recruitment
ETHN.
What is your ethnic origin?
|
Black - African, African
Canadian, Afro-Caribbean descent
|
1
|
|
East Asian - Chinese, Japanese, Korean,
Taiwanese, or other East
Asian descent
|
2
|
|
Indigenous - First Nations, Inuk/Inuit, Métis
descent
|
3
|
|
Latin American - Hispanic or Latin
American descent
|
4
|
|
Middle Eastern or North African - Arab,
Persian, West Asian descent (e.g., Afghan, Egyptian, Iranian, Kurdish,
Lebanese, Turkish)
|
5
|
|
South Asian - South Asian descent (e.g.,
Bangladeshi, Indian, Indo-Caribbean, Pakistani, Sri Lankan)
|
6
|
|
Southeast Asian - Cambodian, Filipino, Indonesian,
Thai, Vietnamese, or other Southeast Asian descent
|
7
|
|
White - European descent
|
8
|
|
Another category — please specify:
|
9
|
|
Includes values not described above
|
10
|
|
Do not know
|
11
|
|
Prefer not to answer/Not applicable
|
12
|
ETHN: There should be at least 2
Indigenous/First Nations/Inuk/Métis (code 3) per type of group (across all
rural groups and all urban groups).
EDUCATION.
What is the highest level of education you
completed?
|
Some high school or less
|
1
|
|
High school diploma or equivalent
|
2
|
|
Registered Apprenticeship or other trades
certificate or diploma
|
3
|
|
College, CEGEP or other non-university
certificate or diploma
|
4
|
|
University certificate or diploma below
bachelor's level
|
5
|
|
Bachelor's degree
|
6
|
|
Postgraduate degree above bachelor's
level
|
7
|
Ensure a good mix for all groups
if possible during the recruitment
OCCUP.
Which of the following categories best
describes your current employment status? Are you…
|
Working full-time (35 or more hours per
week)
|
1
|
|
Working part-time (less than 35 hours per
week)
|
2
|
|
Self-employed
|
3
|
|
Unemployed, but looking for work
|
4
|
|
A student attending school full-time
|
5
|
|
Retired
|
6
|
|
Not in the workforce (full-time homemaker,
full-time parent, or unemployed and not looking for work)
|
7
|
|
Other employment status. Please specify.
|
8
|
HH1. What best describes your housing
situation?
|
Homeowner
|
1
|
|
Renter
|
2
|
|
Social housing
|
3
|
|
Other housing situation:____
|
4
|
Try to get some of each in each
group (not a hard criteria)
HH2. Including yourself, how many
people live in your household, counting adults and children?
|
___ people
|
1
|
|
One person (myself)
|
2
|
Try to get at least 1 person that
lives alone in each group
GROUP ATTRIBUTION
Below is a detailed breakdown of the
ideal group distribution:
· Across
all groups, around 4 Indigenous/Métis/Inuit/First Nations participants (2 in
rural groups and 2 in urban groups).
In each group: a maximum of 3-4 participants who live
in a most impacted community but have not lived a climate-related event in the
past 5 years (See “Vulnerable communities” document for the list of
postal codes to target).
· In
each group: a good mix of climate-related events, ideally no more than 2 participants
who have only experienced heatwaves.
· In
each group and across all groups: a good mix of gender and age.
· Groups
can be organized by region/time zone for easier scheduling. No hard rules to
follow as long as we have even coverage of all regions/provinces/territories of
the country across all groups (e.g., two groups for rural West/center of Canada
and two groups for rural East of Canada + one group for francophones across all
provinces (as most of them will probably be in QC, NB, and ON).
· In
each group: a good mix of housing situations (not a hard criteria)
· In
each group: at least one person living alone
PSPC POR1
Have you ever attended a discussion group or taken
part in an interview on any topic that was arranged in advance and for which
you received money for participating?
|
Yes
|
1
|
|
No
|
2 GO TO PSPC POR
|
PSPC POR2
When did you last attend one of these discussion
groups or interviews?
|
Within the last 6 months
|
1 THANK
AND CONCLUDE
|
|
Over 6 months ago
|
2
|
PSPC POR 3
Thinking about the groups or interviews that you have
taken part in, what were the main topics discussed?
RECORD: _______________ THANK/TERMINATE IF RELATED
TO ENVIRONMENT OR CLIMATE CHANGE
PSPC POR4
How many discussion groups or interviews have you
attended in the past 5 years?
|
Fewer than 5
|
1
|
|
Five or more
|
2 THANK
AND CONCLUDE
|
CONCLUSION
INVITATION
Thank you. We'd like to invite you to
participate in this focus group.
We are thrilled to have you as
one of our participants in this study; your profile perfectly fits the target
respondent we are looking for. We would like to invite you to participate in an
online focus group that will be facilitated by an experienced professional
moderator and will last approximately 90 minutes. The session will take place
at [XX], on____XX____ (date/time) __XX__.
For your participation, you
will receive a financial incentive of $125.
Please note that the session
will be recorded. Your interview may also be observed by people who are
directly working on the research study.
Just
a quick reminder that the
groups of discussion are going to be held over the Internet. They are going to
be "online focus groups". You will need a computer, a high-speed
Internet connection, and a WebCam in order to participate in the group.
INV1.
Are you still interested in
participating in this research study?
|
Yes
|
1
|
|
No
|
2 THANK
AND CONCLUDE
|
The information provided by you
will be kept confidential and will only be disclosed to those who are directly
working on the research that is relevant to the topic of discussion.
INV2.
Representatives from
Environment and Climate Change Canada may observe the discussion, but will not
have access to any of your private information. You will be asked to sign a
consent form in order to participate in this research. Would you be willing
to do this?
|
Yes
|
1
|
|
No
|
2 THANK
AND CONCLUDE
|
PRIVACY SECTION
Now I have a few questions that relate to privacy,
your personal information and the research process. We will need your consent
on a few issues that enable us to conduct our research. As I run through these
questions, please feel free to ask me any questions you would like clarified.
P1) First, we will provide the online
platform and session
moderator with a list of
respondents’ names and profiles (screener responses) so that they can sign you
into the group. Do we have your permission to do this? I assure you it will be
kept strictly confidential.
|
Yes
|
1 GO TO P2
|
|
No
|
2 Read
information below and P1A
|
We
need to provide the online
platform and session
moderator with the names and background of the people attending the focus
group because only the individuals invited are allowed in the session and the
facility and moderator must have this information for verification purposes.
Please be assured that this information will be kept strictly confidential. GO
TO P1A
P1a) Now that I’ve explained this, do I have
your permission to provide your name and profiles to the online platform and
moderator?
|
Yes
|
1 GO TO P2
|
|
No
|
2 THANK
AND CONCLUDE
|
P2) A recording of the group session will be
produced for research purposes. The recording will only be used by the
team of researchers at Léger to assist in preparing a report on the
research findings.
Do you agree to be recorded for research
purposes only?
|
Yes
|
1 GO TO INVITATION
|
|
No
|
2 Read
information below and P2A
|
It
is necessary for the research process for us to record the session as the
researcher needs this material to complete the report.
P2a) Now that I’ve explained this, do I have
your permission for recording?
|
Yes
|
1 GO TO INVITATION
|
|
No
|
2 THANK
AND CONCLUDE
|
As we are only inviting a small number of
people to take part, your participation is very important to us. If for some
reason you are unable to participate, please call so that we can get someone to
replace you. You can reach us at our office at____ . Please ask for ____.
To ensure that the focus groups run
smoothly, we remind you:
·
To
make sure you are connected to the Internet and logged on 15 minutes in advance
of the group
·
To
turn off your cellular phones – to avoid disruptions during the group.
·
Make
sure your WebCam is ON and functional
·
To
bring reading glasses, if necessary, to be able to go over the material.
·
To
make sure you will be located in a clear room (luminous)
·
That
the session will be recorded for analysis purposes only.
Email address :
__________________________________________________________________
Thank you very much for your assistance!
CONTACT INFORMATION
Someone from our company will contact you to confirm
the group. Could you leave me a phone number where we can reach you in the
evening as well as during the day?
Name :
Phone number: Cell
phone:
Recruited
by:
Confirmed by:
|
SECTION 1
|
INTRODUCTION AND EXPLANATION
|
|
Length
|
5 MINUTES
|
|
|
|
WELCOME AND PRESENTATION
- Reception of participants
- Introduction of the moderator
- Presentation of Leger
PRIMARY AIM
- The research is being conducted by Léger Marketing on behalf of
Environment and Climate Change Canada. The objective of the meeting is to learn
about your experience with during a climate-related event and your attitudes
and perceptions towards preparing for climate change.
RULES OF DISCUSSION
- Dynamics of the discussion (90 minutes, discussion, round table)
- No wrong answers
- Importance of giving personal, spontaneous and honest opinions
- Importance of reacting respectfully to the opinions of others
- Importance of speaking one person at a time
PRESENTATION OF THE GROUP ROOM
- Audio and video recording for subsequent analysis
- Presence of observers from the federal government
- Presence of analysts to take notes
RESULTS CONFIDENTIALITY
The discussions we will have this evening will remain confidential
at all times.
- Your name will never be mentioned in the report
- Information collected for study purposes only
- The information collected will help Environment and Climate Change
Canada get a better understanding of Canadians’ lived experiences with climate
change and their opinions towards various issues relating to the topic.
Do you have any questions before we get started?
INTRODUCTION OF PARTICIPANTS
- What's your first name?
- Your place of residence (province and city)?
- What is your main occupation?
NOTE TO MODERATORS
- Please divert the conversation from a discussion of whether
climate change exists or not, if it comes up
- A reminder to move on to the next
question or a different participant if at any point a participant’s climate
experience triggers strong emotions (e.g., if they lost someone or a pet, if
their stress was too much, etc.)
|
SECTION 2
|
familiarity
and opinion on climate change adaptation and rationales
|
|
LENGTH
|
15 MINUTES
|
Are you worried about climate change?
· Do you think
climate-related events (heatwaves, floods, erosion) are more or less frequent
than before?
· What worries you the
most about climate change and its impacts?
|
SECTION
3
|
TERMINOLOGY
TESTING
|
|
length
|
30 MINUTES
|
This section aims at evaluating different
phrases and terminologies pertaining to the subject in order to determine those
that are the most evocative.
Share screen and present the following
definition:
[…] means planning
for and acting on the anticipated impacts of climate change. It involves making
changes to how we live and what we do before climate change impacts happen in
order to reduce their impact, as well as being more ready to respond to
increasingly likely and frequent extreme events. It includes adjusting our
decisions to account for the changes to the climate that we know are still to
come.
· What does this
definition mean to you? What do you think about it?
· Probe for specific
phrases of the definition: making changes, reducing
impact, being ready to respond, adjusting decisions
CHAT ACTIVITY [INDIVIDUAL EXERCISE]
According to you, which would be the one to
two terms that best fit the presented definition?
It can be a term you have already heard or
known of, or a completely new term you create.
You can write and send your answers in the
chat on the right side of the screen.
POLLING EXERCISE
You should now see a pop-up survey appear
on your screen. Which of the following terms do you think most clearly fits
the presented definition?
· Climate change adaptation (or
Adaptation)
· Adapting to climate
change
· Climate preparedness
· Preparing for climate
change
· Being climate-ready
Why isn’t [TERM] the term you chose? (Repeat
for each term)
Probe about preferred term in the poll vs
terms that come up in the first exercise.
· [FIRST POLL TERM] came out first, do you think
[TERM THAT CAME UP IN THE CHAT ACTIVITY] fits the definition better? Why/why
not?
POLLING EXERCISE
You should now see another pop-up survey
appear on your screen. For each of the following terms, indicate whether they
evoke negative, neutral, or positive feelings.
· Climate change adaptation (or
Adaptation)
· Adapting to climate
change
· Climate preparedness
· Preparing for climate
change
· Being climate-ready
[ANSWERS]
· Negative
· Neutral
· Positive
Why does [TERM] evoke [negative/neutral/positive]
feelings?
· What about [CHAT
TERM]? Does it evoke negative/neutral/positive feelings?
· Probe if necessary:
Are these terms clear? Why/why not?
Have you ever heard of the term “climate change
adaptation” before today? What about the National Adaptation Strategy? What
have you heard?
|
SECTION
4
|
EXPERIENCES
WITH CLIMATE CHANGE IMPACTS
|
|
LENGTH
|
40 MINUTES
|
Roundtable: You have been recruited because you live
in a community that is considered to be more prone to climate change impacts or
because you have reported having experienced one or several climate-related
events or impacts (e.g., flooding, coastal erosion, heatwave, wildfire,
sustained high winds/hurricane/tornado, permafrost thaw, drought, sea level
rise). And we would like to hear more about your experiences.
In turns, I would like you all to tell me a little bit
more about your experience:
· Can you describe the
event or impact: when and where did it occur?
· How did/does it impact
your family/home/life/community?
· Was there something
you did that helped you during the event?
· Is there anything you
would have done differently?
Have you or your community taken any measures to
mitigate the impacts of potential future climate-related events or impacts?
Do you think your community is ready to
face another similar event, in terms of infrastructure and preparation?
Thinking of the most recent extreme climate-related
event or impact that you experienced, did you have all the information you
needed prior to the event? In other words, did you know it was coming, what to
do, and how to react in the situation? If you face continuous impacts, do you
feel that you are well-informed on the situation and how you can prepare for
any consequences that may affect you?
· How did you get this
information in the first place?
· IF NOT: What kind of
information would you have liked to have in order to be better prepared?
· How would you like to
receive this information? (Probe for formats, way to receive, from who)
How
was the situation handled by your community?
Do you think federal/provincial/municipal governments
are doing enough to protect your community?
· What do you expect
from your government to help future adaptation efforts? Is there anything they
should do differently?
|
BLOC
5
|
CONCLUSION
|
|
DURÉE
|
5 MINUTES
|
As I mentioned in the beginning of this
discussion, the objective was to help Environment and Climate Change Canada get
a better understanding of Canadians’ lived experiences with climate change
impacts. The Government of Canada has released a National Adaptation Strategy
that aims at building resilient communities and a strong economy to be better
prepared against climate change impacts. If you’re curious and interested to
learn about it, I invite you to click on the link in the chat.
Link: https://www.canada.ca/en/services/environment/weather/climatechange/climate-plan/national-adaptation-strategy.html
That was all I wanted to discuss with you
today. Before I let you go, do you have any final comments you would like to
add on the topics we just discussed?
[ASK LANG TO ALL]
[SINGLE MENTION]
LANG
Préféreriez-vous répondre à ce
questionnaire en anglais ou en français
Would you prefer to complete the survey in English or French?
|
Label
|
Value
|
Attribute
|
Termination
|
|
English
|
EN
|
|
|
|
Français
|
FR
|
|
|
QFLT1
[ASK PROV TO ALL]
[SINGLE MENTION]
PROV
In which province
or territory do you live?
|
Label
|
Value
|
Attribute
|
Termination
|
|
British
Columbia
|
British
Columbia
|
|
|
|
Alberta
|
AB
|
|
|
|
Saskatchewan
|
SK
|
|
|
|
Manitoba
|
MB
|
|
|
|
Ontario
|
ON
|
|
|
|
Quebec
|
QC
|
|
|
|
New Brunswick
|
NB
|
|
|
|
Nova Scotia
|
NS
|
|
|
|
Prince Edward
Island
|
PE
|
|
|
|
Newfoundland
|
NF
|
|
|
|
Northwest
Territories
|
NT
|
|
|
|
Yukon
|
YK
|
|
|
|
Nunavut
|
NU
|
|
|
[ASK POSTAL6 TO
ALL]
[OPEN TEXT:
VALIDATION – FORCE THE TEXT FORMAT TO BE A9A9A9]
POSTAL6
Please indicate
the 6 characters of your postal code.
If you would
rather not provide it, please select [I don’t know/I prefer not to answer
|
INTERVIEWER
INSTRUCTIONS:
|
(RECORD THE
POSTAL CODE IN THE FORMAT A9A9A9)
|
|
Label
|
Value
|
Attribute
|
|
(DO NOT READ) I don’t know/I prefer not to answer
|
A9A9A9
|
|
[ASK POSTAL3 TO
ALL]
[OPEN TEXT:
VALIDATION – FORCE THE TEXT FORMAT TO BE A9A]
POSTAL3
Please indicate
the first 3 characters of your postal code.
If you would
rather not provide it, please select I don’t know/I prefer not to answer
|
INTERVIEWER
INSTRUCTIONS:
|
(RECORD THE
POSTAL CODE IN THE FORMAT A9A)
|
|
Label
|
Value
|
Attribute
|
|
(DO NOT
READ) I don’t know/I prefer not to answer
|
A9A
|
|
[ASK SEXE TO ALL]
[SINGLE MENTION]
SEXE
You are…?
|
Label
|
Value
|
Attribute
|
Termination
|
|
... A man
|
1
|
|
|
|
... A woman
|
2
|
|
|
|
… Another
identity
|
3
|
|
|
|
I prefer not to
answer
|
3
|
|
|
[ASK AGE TO ALL]
[SINGLE MENTION]
AGE
How old are you?
|
INTERVIEWER
INSTRUCTIONS:
|
(READ LIST)
|
|
Label
|
Value
|
Attribute
|
Termination
|
|
Under 18
|
0
|
|
TERMINATE
|
|
Between 18 and
24
|
1
|
|
|
|
Between 25 and
34
|
2
|
|
|
|
Between 35 and
44
|
3
|
|
|
|
Between 45 and
54
|
4
|
|
|
|
Between 55 and
64
|
5
|
|
|
|
Between 65 and
74
|
6
|
|
|
|
75 or older
|
7
|
|
|
|
(DO NOT
READ) I prefer not to answer
|
9
|
|
TERMINATE
|
[ASK LANGU TO
ALL]
[SINGLE MENTION]
LANGU
What is the
language you first learned at home in your childhood and that you still
understand?
|
Label
|
Value
|
Attribute
|
Termination
|
|
French
|
1
|
|
|
|
English
|
2
|
|
|
|
Other
|
3
|
|
|
|
English and
French
|
7
|
|
|
|
French and
other
|
4
|
|
|
|
English and
other
|
5
|
|
|
|
Other and other
|
6
|
|
|
|
I prefer not to
answer
|
9
|
|
|
[ASK LANGU TO
ALL]
[SINGLE MENTION]
LANGU2
What is the
language you speak the most at home?
|
Label
|
Value
|
Attribute
|
Termination
|
|
French
|
1
|
|
|
|
English
|
2
|
|
|
|
Other (please
specify)
|
3
|
|
|
|
I prefer not to
answer
|
9
|
|
|
[ASK FOY1 TO ALL]
[NUMERIC: RANGE
Min=1, Max=20]
[DECIMALS: 0]
[TYPE OF SYMBOL:
people]
[POSITION OF SYMBOL: After]
FOY1
Including
yourself, how many people live in your household, counting adults and children?
|
INTERVIEWER INSTRUCTIONS:
|
(RECORD
NUMBER OF PEOPLE)
|
___ people
|
Label
|
Value
|
Attribute
|
Termination
|
|
One person
(myself)
|
1
|
|
|
|
(DO NOT
READ) I prefer not to answer
|
99
|
|
|
[ASK FOY2 IF
FOY1>1 AND FOY1<99]
[NUMERIC: RANGE
Min=1, Max=20]
[DECIMALS: 0]
[TYPE OF SYMBOL:
children]
[POSITION OF SYMBOL: After]
FOY2
Of these (’FOY1’)
people who live in your household, how many are children under the age of 18?
|
INTERVIEWER
INSTRUCTIONS:
|
(RECORD
NUMBER OF CHILDREN)
|
___ children
|
Label
|
Value
|
Attribute
|
Termination
|
|
No children
under the age of 18
|
0
|
|
|
|
(DO NOT
READ) I prefer not to answer
|
99
|
|
|
SCT SENSIBILITY AND HABITS
[ASK ALL]
[SINGLE MENTION]
[LIST ORDER: In order]
Q1
To what extent do
you feel climate change is an important issue for all Canadians?
|
RESPONDENT/INTERVIEWER
INSTRUCTION:
|
(READ LIST.
ONLY ONE MENTION POSSIBLE)
Please
select one answer.
|
|
Label
|
Value
|
Notes
|
|
Very important
|
1
|
|
|
Somewhat
important
|
2
|
|
|
Somewhat not
important
|
3
|
|
|
Not important
at all
|
4
|
|
|
(DO NOT
READ) I prefer not to answer
|
99
|
|
[ASK ALL]
[SINGLE MENTION]
[LIST ORDER: In order]
Q2
How concerned are
you personally about climate change and its impacts on Canada?
|
RESPONDENT/INTERVIEWER
INSTRUCTION:
|
(READ LIST.
ONLY ONE MENTION POSSIBLE)
Please select
one answer.
|
|
Label
|
Value
|
Notes
|
|
Very concerned
|
1
|
|
|
Somewhat
concerned
|
2
|
|
|
Not very
concerned
|
3
|
|
|
Not concerned
at all
|
4
|
|
|
(DO NOT
READ) I prefer not to answer
|
99
|
|
[ASK ALL]
[MULTIPLE
MENTIONS]
[LIST ORDER: Randomized]
Q3
In your opinion,
what are the 3 most important reasons to adapt to and prepare for climate
change?
|
RESPONDENT/INTERVIEWER
INSTRUCTION:
|
(READ LIST.)
|
|
Label
|
Value
|
Notes
|
|
To preserve the
health of Canadians
|
1
|
|
|
For the safety
of communities
|
2
|
|
|
To protect our
critical infrastructure (e.g., roads, telecommunications, power, water)
|
3
|
|
|
To protect our
identity and culture
|
4
|
|
|
To protect our
agriculture and food production
|
5
|
|
|
For future
generations
|
6
|
|
|
To protect our
jobs
|
7
|
|
|
To conserve nature
and biodiversity
|
|
|
|
(DO NOT
READ) None of these
|
97
|
F/X
|
[ASK ALL]
[SINGLE MENTION]
[LIST ORDER: In order]
Q4
Over the past
year, do you feel climate change impacts (e.g., extreme heat waves, storms,
flooding, forest fires, sea level rise) have become more severe, less severe or
stayed the same?
|
RESPONDENT/INTERVIEWER
INSTRUCTION:
|
(READ LIST.
ONLY ONE MENTION POSSIBLE)
Please
select one answer.
|
|
Label
|
Value
|
Notes
|
|
More severe
|
1
|
|
|
Stayed the same
|
2
|
|
|
Less severe
|
3
|
|
|
I don’t know
|
4
|
|
|
(DO NOT
READ) I prefer not to answer
|
99
|
|
[ASK ALL]
[SINGLE MENTION]
[LIST ORDER: In order]
Q5
Do you feel
climate change impacts (e.g., extreme heat waves, storms, flooding, forest
fires, sea level rise) will become more severe, less severe or stay the same in
the next 5 to 10 years?
|
RESPONDENT/INTERVIEWER
INSTRUCTION:
|
(READ LIST.
ONLY ONE MENTION POSSIBLE)
Please
select one answer.
|
|
Label
|
Value
|
Notes
|
|
More severe
|
1
|
|
|
Stay the same
|
2
|
|
|
Less severe
|
3
|
|
|
Do not know
|
4
|
|
|
(DO NOT
READ) I prefer not to answer
|
99
|
|
[WEB ONLY]
[SINGLE MENTION]
[LIST ORDER: Randomized]
[STATEMENT LIST
ORDER: Randomized]
Q6
To what extent do
you agree or disagree with the following statements?
"In general,
when it comes to preparing for the impacts of climate change, ______"
|
RESPONDENT/INTERVIEWER
INSTRUCTION:
|
(READ LIST.)
Check all
that apply.
|
[STATEMENT LIST]
|
Label
|
Value
|
Notes
|
|
"... I am
motivated to do what I can to protect myself, my family, my community, or my
house
|
2
|
|
|
"... I don’t
have enough knowledge about it to form an opinion.
|
3
|
|
|
"... I am
afraid of its impact on me, my friends, family and community.
|
4
|
|
|
"... I am
confident that there will be solutions."
|
6
|
|
|
"... I
feel hopeless.
|
7
|
|
[RESPONSE LIST
(Scale):]
|
Label
|
Value
|
Notes
|
|
Totally agree
|
1
|
|
|
Somewhat agree
|
2
|
|
|
Somewhat
disagree
|
3
|
|
|
Totally
disagree
|
4
|
|
|
(DO NOT
READ) I prefer not to answer
|
99
|
|
[ASK ALL]
[SINGLE MENTION]
[LIST ORDER: In order]
Q7
To what extent do you think you are familiar with what you can do
to…
|
Label
|
Value
|
Notes
|
|
Prepare for climate change
|
1
|
|
|
Be safe in the face of approaching climate-related events
|
2
|
|
|
Label
|
Value
|
Notes
|
|
Very familiar
|
1
|
|
|
Somewhat
familiar
|
2
|
|
|
Not very
familiar
|
3
|
|
|
Not familiar at
all
|
4
|
|
|
(DO NOT
READ) I prefer not to answer
|
99
|
|
[ASK ALL]
[MULTIPLE
MENTIONS]
[LIST ORDER: Randomized]
Q8
Among the following options, which one(s) would help you the most in
better preparing for the next climate-related event?
Select up to three answers.
|
Label
|
Value
|
Notes
|
|
How to protect
property ahead of time
|
1
|
|
|
What to do when
the event occurs
|
2
|
|
|
Where to go if
utilities not available
|
3
|
|
|
Where to report
incidents
|
4
|
|
|
Community
preparedness events
|
5
|
|
|
Opportunities
to be involved in climate preparedness activities
|
6
|
|
|
Other, please
specify
|
96
|
|
|
(DO NOT
READ) I don’t know / I prefer not to answer
|
99
|
|
[WEB ONLY]
[SINGLE MENTION]
[LIST ORDER: In order]
Q9
According to you, who should be responsible for communicating this information?
|
Label
|
Value
|
Notes
|
|
The federal
government
|
1
|
|
|
The provincial
or territorial government
|
2
|
|
|
The municipal
government
|
3
|
|
|
Community
organizations
|
4
|
|
|
Emergency
services (e.g., police, fire department)
|
5
|
|
|
Weather
forecast application
|
6
|
|
|
Other
|
7
|
|
|
(DO NOT
READ) I don’t know/I
prefer not to answer
|
99
|
|
[ASK ALL]
[SINGLE MENTION]
[LIST ORDER: In order]
Q10
In the past 12
months, have you or other members of your household taken any measures to
prepare your household for climate change, such as making your home more
resilient or adapting your activities (e.g., improving rainfall drainage,
installing a cooling system, limiting time outside during poor air quality or
extreme heat events, seeking information about wildfire risks, new diseases
that may affect your family or pets or insurance coverage for climate-related
disasters)?
|
Label
|
Value
|
Notes
|
|
Yes
|
1
|
|
|
No
|
2
|
|
|
(DO NOT
READ) I prefer not to answer
|
99
|
|
[ASK ALL]
[SINGLE MENTION]
[LIST ORDER: In order]
Q11
Do you think you
are doing enough to help you and your family to adapt to the future impacts of
climate change, or could you do more?
|
RESPONDENT/INTERVIEWER
INSTRUCTION:
|
(READ LIST.
ONLY ONE MENTION POSSIBLE)
Please
select one answer.
|
|
Label
|
Value
|
Notes
|
|
I’m not sure if
I do enough
|
1
|
|
|
I don’t do
enough
|
2
|
|
|
I do enough
already
|
3
|
|
|
I do a lot, but
I could do more
|
4
|
|
|
I could do a
lot more
|
5
|
|
|
(DO NOT
READ) I prefer not to answer
|
99
|
|
[WEB ONLY]
[Select an item MENTION
GRID]
[LIST ORDER: In order]
[STATEMENT LIST
ORDER: Randomized]
[PROGRAMMER
NOTES:]
Q12
On a scale of 1
to 10, where 1 means "Does not help at all" and 10 means "Helps
a lot", how much do you think the following actions help to reducing an
individual's risk to climate change impacts? Please note that if you are unable
to undertake some of these actions, that you can rate these actions for someone
who can.
|
|
|
1 (1)
|
2 (2)
|
3 (3)
|
4 (4)
|
5 (5)
|
6 (6)
|
7 (7)
|
8 (8)
|
9 (9)
|
10 - (10)
|
NSP / Refus
(99)
|
|
Having access
to a floodplain map
|
|
|
|
|
|
|
|
|
|
|
|
|
|
Avoiding living
in a location with only one major exit
|
|
|
|
|
|
|
|
|
|
|
|
|
|
Installing
additional shade to your home (e.g., umbrellas, pergolas, sunshades, awnings)
|
|
|
|
|
|
|
|
|
|
|
|
|
|
Planting trees,
gardens, vegetable gardens, or rain gardens
|
|
|
|
|
|
|
|
|
|
|
|
|
|
Rainwater
harvesting
|
|
|
|
|
|
|
|
|
|
|
|
|
|
Installing a
sump pump
|
|
|
|
|
|
|
|
|
|
|
|
|
|
De-paving
property
|
|
|
|
|
|
|
|
|
|
|
|
|
|
Having an
emergency kit (e.g., food, water, candles, batteries)
|
|
|
|
|
|
|
|
|
|
|
|
|
|
Installing a
generator, solar panels, or power storage
|
|
|
|
|
|
|
|
|
|
|
|
|
|
Installing an
air conditioner
|
|
|
|
|
|
|
|
|
|
|
|
|
|
Creating a
network within my community (e.g., buddy system)
|
|
|
|
|
|
|
|
|
|
|
|
|
|
Getting
involved in my community or apartment building board to raise awareness about
climate change
|
|
|
|
|
|
|
|
|
|
|
|
|
SCT IMPACT
[WEB ONLY]
[MULTIPLES
MENTIONS]
[LIST ORDER: Randomized]
[PROGRAMMER
NOTES: max 14]
Q13
On a scale of 1
to 10, where 1 means "Does not help at all" and 10 means "Helps
a lot", how much do you think the following actions help to reducing your
community’s risk to climate change impacts?
|
|
|
1 (1)
|
2 (2)
|
3 (3)
|
4 (4)
|
5 (5)
|
6 (6)
|
7 (7)
|
8 (8)
|
9 (9)
|
10 – (10)
|
NSP / Refus
(99)
|
|
Conducting a
Community Risk Assessment using future climate projections
|
|
|
|
|
|
|
|
|
|
|
|
|
|
General
Emergency Management Planning (e.g., early warning systems, evacuation
orders)
|
|
|
|
|
|
|
|
|
|
|
|
|
|
Installing a
community garden to reduce food insecurity
|
|
|
|
|
|
|
|
|
|
|
|
|
|
Protection of
housing (e.g., subsidies for retrofits)
|
|
|
|
|
|
|
|
|
|
|
|
|
|
Stormwater,
flood, or erosion management (e.g., installation of shoreline mechanisms such
as dykes, levees, revetments, wetlands, stormwater ponds, policies of
development setbacks and zoning)
|
|
|
|
|
|
|
|
|
|
|
|
|
|
Heat management
(e.g., cooling centres, urban greening, splash pads)
|
|
|
|
|
|
|
|
|
|
|
|
|
|
Drought
management (e.g., policies on water usage)
|
|
|
|
|
|
|
|
|
|
|
|
|
|
Wildfire
management (e.g., firebreaks, setbacks, controlled burns)
|
|
|
|
|
|
|
|
|
|
|
|
|
|
Invasive
species or pest management
|
|
|
|
|
|
|
|
|
|
|
|
|
QFLT2:
Responsibility
SCT MOST AFFECTED BY CLIMATE
CHANGE IMPACTS
[ASK ALL]
[MULTIPLES
MENTIONS]
[LIST ORDER: Randomized]
[PROGRAMMER
NOTES: max 14]
Q14
Within the past
five years, which of the following climate-related events have you experienced
in your community?
|
RESPONDENT/INTERVIEWER
INSTRUCTION:
|
(READ LIST.
SEVERAL MENTIONS POSSIBLE)
Please
select all that apply.
|
|
Label
|
Value
|
Notes
|
|
Coastal erosion
|
1
|
|
|
Flooding
|
2
|
|
|
Landslide
|
3
|
|
|
Wildfire (or
impacts of nearby wildfire, e.g., smoke)
|
4
|
|
|
High
wind/hurricane/tornado
|
5
|
|
|
Heatwave
|
6
|
|
|
Drought
|
7
|
|
|
Permafrost thaw
|
8
|
|
|
Sea level rise
|
9
|
|
|
Other, please
specify
|
96
|
|
|
(DO NOT
READ) None that I can recall
|
97
|
F/X
SKIP TO NEXT
SECTION
|
|
(DO NOT
READ) Don’t know
|
98
|
F/X
SKIP TO NEXT
SECTION
|
[ASK ALL] [ASK IF Q14=1 to 96]
[MULTIPLE
MENTIONS]
[LIST ORDER: Randomized]
[PHONE ONLY: READ
LIST AND RECORD ALL THAT APPLY]
Q15
What were the
direct impacts of the most recent climate-related event that
occurred in your community on you and/or your household?
|
RESPONDENT/INTERVIEWER
INSTRUCTION:
|
(READ LIST.)
Please
select all that apply.
|
|
Label
|
Value
|
Notes
|
|
Felt isolated
with no one to rely on
|
1
|
|
|
Had to leave
our home temporarily
|
2
|
|
|
Had some
physical health problems (e.g., heat related illnesses, respiratory problems,
physically injured from an event)
|
3
|
|
|
Had some mental
health problems (e.g., Post Traumatic Stress Disorder, anxiety, depression)
|
4
|
|
|
House/property
damage
|
5
|
|
|
Lost access to
a critical utility or essential supplies (e.g., roads, hospitals, drinking
water, sewage, electricity, fuel, food, cell phone signals)
|
6
|
|
|
Had to spend
personal money to address these impacts
|
7
|
|
|
Had to leave
our home permanently
|
8
|
|
|
|
|
|
|
Was physically
stuck in a specific area for more than an hour (e.g., roads were
blocked/damaged and could not drive anywhere else)
|
10
|
|
|
(DO NOT
READ) None of the above
|
98
|
|
|
(DO NOT
READ) I prefer not to answer
|
99
|
|
[ASK ALL] [ASK IF Q14=1 to 96]
[SINGLE MENTION]
[LIST ORDER: In order]
Q16
To what extent do
you agree or disagree that each of the following entities took sufficient
action when handling this climate-related event?
|
RESPONDENT/INTERVIEWER
INSTRUCTION:
|
(READ LIST.
ONLY ONE MENTION POSSIBLE)
Please
select one answer.
|
|
Label
|
Value
|
Notes
|
|
Strongly
disagree
|
1
|
|
|
Disagree
|
2
|
|
|
Agree
|
3
|
|
|
Strongly agree
|
4
|
|
|
(DO NOT
READ) Not sure
|
99
|
|
|
Label
|
Value
|
Notes
|
|
… your
community
|
2
|
|
|
… your
municipal government
|
3
|
|
|
… your provincial
or territorial government
|
4
|
|
|
… the federal
government
|
5
|
|
[ASK IF Q14=1 to
96]
[SINGLE MENTION]
[LIST ORDER: In order]
Q17
How long after
the climate event would you say it took for your life to return to normal
(e.g., for your house to be repaired, for the road to be fixed, for your
physical health to return, for your mental health to return, for you to return
to your job)?
|
Label
|
Value
|
Notes
|
|
Less than a
year
|
1
|
|
|
1 – 2 years
|
2
|
|
|
More than 2
years
|
3
|
|
|
It did not
return to normal, but I know it will
|
4
|
|
|
I don’t think
my life will ever be the same
|
5
|
|
|
(DO NOT
READ) I prefer not to answer
|
99
|
|
[ASK IF Q14=1 to
96]
Q18
In your opinion,
what could have been done, or done differently, to better handle the situation?
|
RESPONDENT/INTERVIEWER
INSTRUCTION:
|
(PROBE FOR A
SINGLE SPECIFIC ANSWER)
Please enter your answer in the box below.
|
|
Label
|
Value
|
Notes
|
|
Please specify
|
96
|
|
|
(DO NOT
READ) I prefer not to answer
|
99
|
|
[ASK IF FROM MOST AFFECTED BY CLIMATE CHANGE IMPACTS]
[SINGLE MENTION]
[LIST ORDER: In order]
Q19
From which of the
following would you expect to provide more support to your community for
managing climate-related events?
|
RESPONDENT/INTERVIEWER
INSTRUCTION:
|
(READ LIST.
ONLY ONE MENTION POSSIBLE)
Please all
that apply.
|
|
Label
|
Value
|
Notes
|
|
Your Local
Government
|
3
|
|
|
Your Provincial
or Territorial Government
|
2
|
|
|
The Federal
Government
|
1
|
|
|
The private
sector (e.g., banks, insurance companies)
|
4
|
|
|
Your community
|
5
|
|
|
Non-governmental
organizations
|
6
|
|
|
Don’t know
|
|
|
|
Don’t have
enough information to say
|
|
|
|
(DO NOT
READ) I prefer not to answer
|
99
|
|
QFLT3:
Responsibility
SCT AWARENESS OF ACTIONS
[ASK ALL]
[SINGLE MENTION]
[LIST ORDER: Randomized]
Q20
What is your preferred way to stay informed
when an extreme weather event is approaching (snowstorm, rainstorm, hurricane,
heat wave, etc.)?
|
Label
|
Value
|
Notes
|
|
Social media
(Facebook, Instagram, X, TikTok…)
|
1
|
|
|
Radio
|
2
|
|
|
Newspapers
|
3
|
|
|
Television
|
4
|
|
|
SMS alerts
|
5
|
|
|
Weather
forecast app/website
|
6
|
|
|
Environment and
Climate Change Canada website
|
7
|
|
|
The Weather
Network website
|
8
|
|
|
Other websites
|
9
|
|
|
Other, please
specify
|
96
|
|
|
(DO NOT
READ) Not sure
|
99
|
|
[ASK ALL]
[SINGLE MENTION]
[LIST ORDER: In
order]
Q21. To what extent do you agree or
disagree with the following statements:
a)
Enough is being done by all
orders of government to minimize climate risks.
b)
Enough is being done by all
orders of government to help Canadians prepare for climate change.
|
RESPONDENT/INTERVIEWER
INSTRUCTION:
|
(READ LIST.
ONLY ONE MENTION POSSIBLE)
Please
select one answer.
|
|
Label
|
Value
|
Notes
|
|
Strongly
disagree
|
1
|
|
|
Disagree
|
2
|
|
|
Agree
|
3
|
|
|
Strongly agree
|
4
|
|
|
(DO NOT
READ) Not sure
|
99
|
|
[ASK ALL]
[SINGLE MENTION]
[LIST ORDER: In order]
Q22
Before today,
have you ever read or heard anything about “Canada’s National Adaptation
Strategy”?
|
RESPONDENT/INTERVIEWER
INSTRUCTION:
|
(READ LIST.
ONLY ONE MENTION POSSIBLE)
Please
select one answer.
|
|
Label
|
Value
|
Notes
|
|
Yes
|
1
|
|
|
No
|
2
|
|
|
(DO NOT
READ) I prefer not to answer
|
99
|
|
[ASK IF Q22=1]
[OPEN-END MULTIPLE
MENTION]
[PROGRAMMER
NOTES:]
Q23
If you can,
please describe your understanding of Canada’s National Adaptation Strategy.
|
RESPONDENT/INTERVIEWER
INSTRUCTION:
|
(PROBE FOR A
SINGLE SPECIFIC ANSWER)
Please enter your answer in the box below.
|
|
Label
|
Value
|
Notes
|
|
Please specify
|
96
|
|
|
(DO NOT
READ) I prefer not to answer
|
99
|
|
[WEB ONLY]
[MULTIPLE
MENTIONS]
[LIST ORDER: Randomized]
Q24
To the best of
your knowledge, which of the following have already been implemented by your
community?
|
RESPONDENT/INTERVIEWER
INSTRUCTION:
|
[INTERVIEWER
NOTE: Read list. Check all that apply.]
Please
select all that apply.
|
|
Label
|
Value
|
Notes
|
|
Flood maps
updated within the past 10 years
|
1
|
|
|
Climate risk
awareness (e.g., you have been made aware of the climate risks to your
household)
|
2
|
|
|
Urban greening
initiatives for heat and water management (e.g., green spaces and parks,
stormwater management techniques that absorbs/filter rainfall)
|
3
|
|
|
Subsidies for
home retrofits specifically for protection against extreme heat, hail, flood,
fires, wind
|
4
|
|
|
Established a
network for emergencies (e.g., buddy systems, meeting spots)
|
6
|
|
|
I am not sure
if any of these have been implemented by my community
|
96
|
|
|
(DO NOT
READ) None of these were put in place in my
community
|
97
|
F/X
|
[ASK ALL]
[SINGLE MENTION]
[LIST ORDER: In order]
CMNTY
Q25
Are you a part of
a community (e.g., school group, work group, exercise group, large family,
faith group) that you can rely on in times of need (e.g., people who would
offer you somewhere to stay in times of need, people who would deliver you food
in times of need)?
|
RESPONDENT/INTERVIEWER
INSTRUCTION:
|
(READ LIST.
ONLY ONE MENTION POSSIBLE)
Please
select one answer.
|
|
Label
|
Value
|
Notes
|
|
Yes, I am part
of a community
|
1
|
|
|
I am part of a
community, but not close enough to ask them for a favour
|
2
|
|
|
No, I am not
part of a community
|
3
|
|
|
(DO NOT
READ) I prefer not to answer
|
99
|
|
SCT LANGUAGE – ASK ALL
Q26
When you think
about climate change and the climate impacts we might feel in the future (e.g.,
more heat, flooding, wildfires, sea level rise), which of the following terms
do you think best captures the efforts to make the impacts less severe on
people living in Canada?
|
Label
|
Value
|
Notes
|
|
Adapting to
climate change
|
1
|
|
|
Being
climate-ready
|
2
|
|
|
Preparing for
climate change
|
3
|
|
|
Climate
preparedness and adaptation
|
4
|
|
|
Other: Please
specify
|
6
|
O
|
|
(DO NOT
READ) Don’t know
|
|
F/X
|
SCT SOCIO
[ASK STATU TO
ALL]
[SINGLE MENTION]
STATU
You are...?
|
INTERVIEWER
INSTRUCTIONS:
|
(READ LIST.
SINGLE MENTION ONLY)
|
|
Label
|
Value
|
Attribute
|
Termination
|
|
Married
(including living common law)
|
1
|
|
|
|
Never married
(including living common law)
|
2
|
|
|
|
Separated
(including living common law)
|
3
|
|
|
|
Divorced
(including living common law)
|
4
|
|
|
|
Widowed
(including living common law)
|
5
|
|
|
|
(DO NOT
READ) I prefer not to answer
|
9
|
|
|
[ASK IND TO ALL]
[SINGLE MENTION]
IND
Do you consider
yourself to be an Indigenous person, that is, First Nations (North American
Indian), Métis or Inuk (Inuit)?
|
Label
|
Value
|
|
No, not an
Indigenous person
|
01
|
|
Yes, First
Nations (North American Indian)
|
02
|
|
Yes, Métis
|
03
|
|
Yes, Inuk
(Inuit)
|
04
|
|
Prefer not to
say (VOLUNTEERED)
|
09
|
[ASK ALL]
[SINGLE MENTION]
MINO
Do you consider
yourself to be a visible minority?
According to the
Employment Equity Act, visible minority refers to persons, other than
Indigenous persons, who are non-Caucasian in race or non-white in colour.
|
|
(UNE SEULE
MENTION POSSIBLE)
|
|
Label
|
Value
|
Attribute
|
Termination
|
|
Yes
|
1
|
|
|
|
No
|
2
|
|
|
|
I prefer not to
answer
|
99
|
|
|
[ASK ALL]
[SINGLE MENTION]
IMMI
Were you born in
Canada?
|
Label
|
Value
|
Attribute
|
Termination
|
|
Yes
|
1
|
|
|
|
No
|
2
|
|
|
[ASK IF IMMI=2]
[SINGLE MENTION]
[ORDRE DE LA LISTE : In order]
IMMI2
Are you currently
a:
|
Label
|
Value
|
Attribute
|
Termination
|
|
Canadian
citizen
|
1
|
|
|
|
Permanent
resident
|
2
|
|
|
|
Non-permanent
resident
|
3
|
|
|
[ASK SCOL TO ALL]
[SINGLE MENTION]
SCOL
What is the last
year of education that you have completed?
|
INTERVIEWER
INSTRUCTIONS:
|
(READ LIST.
SINGLE MENTION ONLY)
|
|
Label
|
Value
|
Attribute
|
Termination
|
|
Elementary (7
years or less)
|
1
|
|
|
|
High school,
general or vocational (8 to 12 years)
|
2
|
|
|
|
College
(pre-university, technical training, certificate, accreditation or advanced
diploma (13-15 years))
|
3
|
|
|
|
University
certificate or diploma
|
4
|
|
|
|
University
Bachelor (including classical studies)
|
5
|
|
|
|
University
Master's degree
|
6
|
|
|
|
University
Doctorate (PhD)
|
7
|
|
|
|
(DO NOT
READ) I prefer not to answer
|
9
|
|
|
[ASK EMPLO TO
ALL]
[SINGLE MENTION]
EMPLO
What is your
current employment status?
|
INTERVIEWER
INSTRUCTIONS:
|
(READ LIST.
SINGLE MENTION ONLY)
|
|
Label
|
Value
|
Attribute
|
Termination
|
|
Working full
time
|
1
|
|
|
|
Working part
time
|
2
|
|
|
|
Unemployed
|
3
|
|
|
|
Student
|
4
|
|
|
|
Not in labour
force
|
5
|
|
|
|
I prefer not to
answer
|
9
|
|
|
[ASK PROP TO ALL]
[SINGLE MENTION]
PROP
Do you OWN or
RENT your current main residence?
|
Label
|
Value
|
Attribute
|
Termination
|
|
Own
|
1
|
|
|
|
Rent
|
2
|
|
|
|
(DO NOT
READ) I prefer not to answer
|
9
|
|
|
[ASK DWELL TO
ALL]
[SINGLE MENTION]
DWELL
Is your primary
place of residence a...?
|
Label
|
Value
|
Attribute
|
Termination
|
|
Townhouse
|
1
|
|
|
|
Single family
home
|
2
|
|
|
|
Duplex
|
3
|
|
|
|
Triplex
|
4
|
|
|
|
Fourplex
|
5
|
|
|
|
Residential
building of 3 floors or less
|
6
|
|
|
|
Residential
building of 4 floors or more
|
7
|
|
|
|
(DO NOT
READ) I prefer not to answer
|
9
|
|
|
[ASK REVEN TO
ALL]
[SINGLE MENTION]
REVEN
Among the
following categories, which one best reflects the total INCOME, before taxes,
of all the members of your household in 2022?
|
INTERVIEWER
INSTRUCTIONS:
|
(READ LIST.
SINGLE MENTION ONLY)
|
|
Label
|
Value
|
Attribute
|
Termination
|
|
Less than
$20,000
|
1
|
|
|
|
$20,000 to
$39,999
|
2
|
|
|
|
$40,000 to
$59,999
|
3
|
|
|
|
$60,000 to
$79,999
|
4
|
|
|
|
$80,000 to
$99,999
|
5
|
|
|
|
$100,000 to
$149,999
|
6
|
|
|
|
$150,000 and
more
|
7
|
|
|
|
(DO NOT
READ) I prefer not to answer
|
9
|
|
|