INTRODUCTION
The
Financial Consumer Agency of Canada (FCAC) is an agency of the Government of
Canada that ensures federally regulated financial entities comply with consumer
protection measures, promotes financial education, and raises consumers’
awareness of their rights and responsibilities. It was established in 2001 by
the federal government to strengthen oversight of consumer issues and expand
consumer education in the financial sector. FCAC provides information and
resources to consumers, merchants, and the industry and is focused on
strengthening financial literacy in Canada.
The
Bank of Canada is the nation's central bank. Its principal role is to promote
the economic and financial welfare of Canada. This is done primarily through
conducting monetary policy to keep inflation low and stable. Another important
core function is to promote safe, sound and efficient financial systems in
Canada and internationally. The Bank also designs, issues and distributes
Canada’s bank notes and acts as the “fiscal agent” for the Government of
Canada, managing its public debt program and foreign exchange reserves.
Mortgage
loans with terms longer than 5 years (longer-term mortgages) are available to
Canadian consumers. However, take-up rates are very low compared to mortgages
with term lengths of 5 years or less (shorter-term mortgages). Just 2% of all
mortgages issued in 2018 were fixed-rate loans with a term longer than five
years. Given that interest rates have been at historically low levels for an
extended period of time, borrowers may be exposed to financial risks should
interest rates rise. For example, some borrowers could be at risk of experiencing
additional financial stresses due to the rising cost of servicing a mortgage at
a higher interest rate (interest rate risk). Other borrowers may be at risk of not
being able to obtain a new mortgage to finance the remaining principal at the time
of renewal (rollover risk). This current research seeks to understand the level
of consumer awareness about available mortgage options as well as to understand
the factors associated with consumer mortgage choices.
Ipsos was
commissioned by the Financial Consumer Agency of Canada (FCAC) in collaboration
with the Bank of Canada (BoC) to conduct research to provide a baseline on
Canadian consumers level of awareness and interest in longer-term mortgages.
The research also sought to explore consumers rationale, behavioural biases
and other factors that motivate decisions to obtain, or not, a longer-term
mortgage.
The
research was conducted in two phases. Phase 1 involved qualitative research designed
to help initiate the study and discover the depth and breadth of awareness,
misconceptions and opportunities related to mortgage decision-making. The
results of Phase 1 are provided under separate cover. Building upon the
learning gained from the qualitative phase, Phase 2 involved a quantitative
survey to validate and further refine the learnings from the qualitative study.
The quantitative
study leveraged previous research to help build an understanding of factors
that may impact borrowers decision to choose longer-term mortgages. Results
from an omnibus survey conducted by the Privy Council Office in September 2018
suggest that demand side factors may in part explain the lack of take-up of
such mortgages. For example, more than half of the Canadian adult population
may not know that longer-term mortgages are available. This lack of awareness
is greatest among Canadians with lower levels of education and those with lower
levels of income.
The
research conducted in September 2018 found that motivating factors to taking up
a longer-term mortgage include:
Additionally,
the research found there are factors that may lead borrowers to avoid choosing
longer-term mortgages, such as:
-
unwillingness to
commit for a longer term (e.g., employment insecurity, possible need to move
houses in a few years, possible changes in family situation, etc.);
-
perception that
interest rates are significantly higher for longer-term mortgages.
Very
few participants mentioned prepayment penalties as their motivating factors for
taking up or avoiding longer-term mortgage. None of the participants mentioned
that the penalty calculation using the interest rate differential (IRD) is not
applicable after 5 years.
The
relatively short survey produced interesting and important first-round results,
although certain questions that are relevant from a policy perspective remain
unanswered. For example, are consumers aware of their prepayment right and associated
costs on various products? Does consumer attitude towards longer-term mortgages
vary with their financial well-being (e.g., indebtedness)? How much will the
relative price of a longer-term mortgage need to decline to generate a greater
interest?
The
current research set out to address these questions.
The
quantitative phase was conducted via an online survey. The survey was conducted
in English and French between June 18 and June 30, 2019. Respondents to the
survey were drawn from Ipsos panel sample sources making it a non-probability
sample. Online panels are considered non-probability samples because
respondents have been pre-recruited to participate in research, and therefore,
respondents are not randomly selected from the broad universe of Canadian
population. Due to the non-probabilistic nature of the research, a known
sampling limitation is that the results cannot be extrapolated to the rest of
the Canadian population. However, online panel surveys like the one conducted,
are commonly used in the public opinion and market research industry and
provide useful insights on the preferences of the Canadian population as the samples
are designed to be representative of the population, regionally,
demographically and socio-economically. Moreover, the large sample size on
which the current survey is based (greater than n=2,500 per sample) ensures the
insights are highly reliable. For these reasons, consumers and respondents
are used interchangeably when discussing results throughout the report.
The survey
was conducted with two separate samples. Sample 1, which is referred to as the
target
audience
, included those Canadians who currently own a home with a mortgage,
or those likely to purchase a home with a mortgage in the next 5 years. This
group has a greater propensity to have previous experience making borrowing
decisions, or to do so in the future, than the general population.
Sample 2 represents
the
general population
, which will naturally include some overlap with
the type of individuals represented in Sample 1: a sub-set of homeowners with a
mortgage or those likely to purchase a home in the future. However, the two
samples were mutually exclusive; no respondent falls into both samples.
A total of
n=5036 Canadians age 18 and older were surveyed -- split roughly 50% between
the target audience (n=2511) and 50% general population (n=2525).
The target audience quotas were set by region (based
on the 10 provinces, those living in the territories were excluded) based on
the 2016 Census and were achieved, thus no weighting was applied.
Gender and age were not weighted because the sample was not intended to be representative
of the general population and demographic composition figures for this audience
are not available.
Figure
1
: Target Audience Sample Composition
|
|
Unweighted
Sample Size
|
Sample Proportions
|
|
Canada
|
2,511
|
100%
|
|
Region
|
|
|
|
British
Columbia
|
334
|
13%
|
|
Alberta
|
288
|
11%
|
|
Manitoba/Saskatchewan
|
171
|
7%
|
|
Ontario
|
941
|
38%
|
|
Quebec
|
604
|
24%
|
|
Atlantic
Canada
|
173
|
7%
|
|
Gender
|
|
|
|
Male
|
1156
|
46%
|
|
Female
|
1350
|
54%
|
|
Other/Prefer
not to say
|
5
|
<1%
|
|
Age
|
|
|
|
18-24
|
97
|
4%
|
|
25-34
|
607
|
24%
|
|
35-44
|
485
|
19%
|
|
45-54
|
430
|
17%
|
|
55-64
|
472
|
19%
|
|
65+
|
420
|
17%
|
The
general population data were weighted by region, age, gender and household
income to ensure that the survey samples composition reflects that of the
adult population according to 2016 Census data. Household income targets were
calculated at an individual level. The percentages represent the number of
individuals in Canada aged 18 or older, who are part of a household with the
respective household income. Additionally, the decision was made to offer
respondents a prefer to not say option when reporting household income. In
total 9% of the sample took this option. Given that household income was a
weighting variable, the target percentages were re-based to reflect the
allowance of this 9% to remain in the data the data was not imputed or
re-assigned to other income categories.
Figure
2
:
General Population Sample Composition
|
|
Unweighted
Sample Size
|
Sample Proportions
|
Weighted
Sample Size
|
Sample Proportions
|
|
Canada Canada
|
2,525
|
100%
|
2,525
|
100%
|
|
Region
|
|
|
|
|
|
British Columbia
|
336
|
13%
|
283
|
14%
|
|
Alberta
|
280
|
11%
|
343
|
11%
|
|
Prairies (SK/MB)
|
165
|
7%
|
165
|
7%
|
|
Ontario
|
968
|
38%
|
970
|
38%
|
|
Quebec
|
610
|
24%
|
593
|
24%
|
|
Atlantic Canada
|
166
|
7%
|
172
|
7%
|
|
Gender
|
|
|
|
|
|
Male
|
1,204
|
48%
|
1237
|
49%
|
|
Female
|
1,302
|
52%
|
1237
|
49%
|
|
Other/Prefer not
to say
|
19
|
<1%
|
50
|
1%
|
|
Age
|
|
|
|
|
|
18-24
|
179
|
7%
|
286
|
11%
|
|
25-34
|
482
|
19%
|
425
|
17%
|
|
35-44
|
446
|
18%
|
412
|
16%
|
|
45-54
|
416
|
17%
|
461
|
18%
|
|
55-64
|
492
|
19%
|
450
|
18%
|
|
65+
|
510
|
20%
|
492
|
20%
|
|
Net household income
|
|
|
|
|
|
<$20,000
|
227
|
9%
|
138
|
6%
|
|
$20,000 -<$40,000
|
392
|
16%
|
282
|
11%
|
|
$40,000-<$60,000
|
478
|
19%
|
332
|
13%
|
|
$60,000-<$80,000
|
380
|
15%
|
320
|
13%
|
|
$80,000-<$100,000
|
338
|
13%
|
276
|
11%
|
|
$100,000-<$150,000
|
346
|
14%
|
680
|
27%
|
|
$150,000+
|
138
|
5%
|
270
|
11%
|
|
Prefer not to say
|
226
|
9%
|
227
|
9%
|
Since both the target audience and
general population samples were based on those who initially self-selected for
participation in the panel, no formal margin of error has been calculated. However,
throughout the report,
descriptive statistics have been reported and tests of significance have been
conducted to establish the extent of the relationship among variables. The
survey instrument was an average of 14.2 minutes in length and the median
length was 10 minutes. It included a series of closed-ended and open-ended
questions and explored the following:
-
awareness of
mortgage terminology;
-
awareness and
knowledge of longer-term mortgages;
-
level of interest
in longer-term mortgages absent specific interest rate considerations;
-
likelihood of
considering a longer-term mortgage given specific interest rate scenarios;
-
attitudes towards
factors found to influence appetite in longer-term mortgages (based on the
findings of the Phase 1 qualitative and 2018 Privy Council Office omnibus
survey);
-
the
influence of providing additional information about mortgage options and
features that respondents may not have known before entering the survey on the
probability of considering a longer-term mortgage.
The survey also employed a conjoint
exercise designed to estimate the likelihood of a consumer choosing a longer-term
mortgage over a shorter-term mortgage with a fixed or variable interest rate. Conjoint
analysis is a statistical technique to determine what combination of a limited
number of attributes is most influential on respondents choice or decision
making. In this circumstance, the attributes under evaluation were variable
vs. fixed terms; the length of the term (e.g., 5 years vs. 10 years); and the
interest rate at which each option is offered. While all scenarios were
evaluated, the primary goal was to understand the attributes that are most
influential in choosing a 10-year fixed mortgage.
The exercise required respondents to assume
a scenario where they need to borrow $300,000 (initial principal amount) and
were asked to assume the following conditions:
-
The
loan needs to be paid off within 25 years. So, you need to re-negotiate a new
contract in 5 years (if you choose the 5-year variable or fixed rate mortgage),
or in 10 years (if you choose the 10-year fixed rate mortgage);
-
You
know that you qualify for any of the mortgages presented in the scenarios.
Each respondent was shown 4 screens,
each showing a different set of choices (4 choice sets in total per respondent).
Each choice set contained 3 options: a 5-year variable, 5-year fixed and 10-year
fixed terms with various interest rates. The respondent was required to choose
one of the options none and dont know options were not permitted. The design
of choice sets was built using interest rate levels ranging from 4.00% to 6.75%
with the following conditions:
-
The
5-year variable term was always offered at a 4.00% interest rate;
-
The
5-year fixed term interest rate could not be lower than variable rate (4.00%);
-
The
10-year fixed term interest rate was at least 0.25% higher than the 5-year
fixed term.
The
results of the conjoint analysis measure the percentage of respondents that
will choose the 10-year fixed interest rate option over a 5-year fixed interest
rate or 5-year variable interest rate option when offered at specific interest
rates. Although respondents answered only four scenarios, the scenarios were
designed and rotated such that the probability of choosing the 10-year interest
rate option can be modelled based on interest rate differentials covered in the
survey, as well as those not covered in the survey if they are within the
bounds of minimum and maximum interest rate levels.
In order to understand the potential impact
of providing respondents with more information about variable and fixed rate
options that could influence their decision-making on which option to choose, within
each sample group, target audience and general population, respondents were
randomly assigned into one of three sub-groups:
Group
1 respondents were provided with no additional information about each option
this was referred to as the
no disclosure
group or control group;
Group
2 respondents were provided with limited additional information this was
referred to as the
partial disclosure
group; and,
Group
3 respondents were provided with more information as the
full disclosure
group.
The partial and full disclosure information
provided to respondents is shown in the table below.
Figure
3
: Disclosure Information
|
|
5-year
variable
|
5-year
fixed rate
|
10-year
fixed rate
|
|
[Group 2 & Group 3] Can the interest
rate change during the term?
|
Yes - But you can
switch to a fixed rate at any time without paying a penalty
|
No
|
No
|
|
[Group 2 & Group 3] Will my payment
amount
change during the term?
|
No
|
No
|
No
|
|
[Group 2, Group 3] Can I know how much
will be left to pay on my house at the end of the term?
|
No - If the interest
rate goes up, a larger portion of your payment will go towards paying the
interest.
|
Yes
|
Yes
|
|
[Group 3] Can I break my mortgage
contract?
|
Yes with a
penalty fee
|
Yes with a
penalty fee
|
Yes with a
penalty fee
|
|
[Group 3] Approximate penalty fee if I
break the mortgage contract after 3 years (e.g. sell the home).
|
If interest rates go up by 1%
|
$3,600
|
$4,000
|
$4,400
|
|
If interest rates go down by 1%
|
$3,600
|
$6,000
|
$21,000
|
|
[Group 3] Approximate penalty if I break
the mortgage contract after 5 years.
Note:
The penalty
calculation changes after 5 years have passed.
|
n/a
|
n/a
|
$4,400
|
-
The
terms target audience and homeowners and likely homeowners are used
interchangeably throughout the report to denote the target audience.
-
All
results in the report are expressed as a percentage, unless otherwise noted.
-
Throughout
the report, percentages may not always add to 100% due to rounding or if
respondents were permitted to give more than one response.
-
Due
to rounding, some percentages in the report may not match those presented in
the tabulated data (available under separate cover).
-
When
reporting sub-group variations, only differences that are significant at the
95% confidence level, indicative of a pattern and pertaining to a sub-group
sample size of more than n=30 are discussed.
-
Throughout
the report arrows can be seen, which indicate statistically significant
differences between the target audience and the general population:
-
 A green up arrow indicates a
significantly larger percentage within the designated population.
A green up arrow indicates a
significantly larger percentage within the designated population.
-
 A red down arrow indicates a
significantly lower percentage within the designated population.
A red down arrow indicates a
significantly lower percentage within the designated population.
-
Appended
to the report is a copy of the questionnaire.
KEY FINDINGS
Many consumers do not have a good
understanding of mortgage-related terminology half of consumers are confused
about what mortgage term means providing incorrect or vague descriptions or
indicating they simply do not know (51% of the general population, 42% of the target
audience). The amortization period is even more commonly misunderstood with
most respondents offering a description that is incorrect. Correct
understanding of this terminology is higher among the target audience than the
general population, but still represents less than half of consumers. Only 26%
of the target audience and 18% of the general population sample provide correct
answers for both phrases.
Less than half of consumers (40% general
population, 37% target audience) claim to be aware that longer-term mortgages
are available in Canada. Only one-quarter believe fixed mortgage terms of 10
years are available in Canada. This is consistent across the target and general
populations.
However, as noted above, many consumers do
not have a correct understanding of mortgage terminology. Therefore, the true
level of awareness of longer-term mortgages in Canada is likely significantly
lower. The survey found that only 7% of the target audience and 6% of the
general population have a correct understanding of the relevant terminology (a
correct understanding of both mortgage term and amortization period) and indicate
that 10-year fixed terms are available in Canada. In total, only 10% of the target
audience and 7% among the general population have a correct understanding of
terminology of both term and amortization and believe any terms greater than 5
years are available in Canada. Notably, among consumers generally (including
those with incorrect or vague understanding of mortgage terminology), more
consumers believe that 10-year fixed mortgages are not available compared to those
who indicate being unsure or dont know. Consistent with previous research conducted
on the topic, awareness is lower among consumers with less education.
In many
cases, consumers misunderstanding of mortgage terms and the differences
between shorter and longer-term mortgages creates a barrier to their openness
to considering longer-term mortgages. For example, a large minority of
consumers (43% of the target audience and 40% of the general population)
believe that the longer the mortgage term the more expensive it is to break
the mortgage contract, This is correct if the respondent is thinking about the
cost of breaking a contract during the first 5 years, but not the later 5 years
which is an important feature of a 10-year fixed mortgage. Further, among both
the target and general population, almost three quarters (70% respectively)
stated they do not know whether the rules regarding penalty fees change after 5
years in longer-term mortgages, indicating a low knowledge base and a high
degree of uncertainty among Canadians on the features of longer-term mortgages.
This misinformation about the costs of breaking a longer-term mortgage and lack
of knowledge of how penalty fees work become even more relevant to the nearly
half of consumers (44% of the target audience and 42% of the general
population) who say they would be afraid of missing out on a potential
decrease in interest rates if [they] locked into a mortgage longer than 5 years.
It is possible that with a better understanding of the changes in mortgage
penalties after 5 years consumers would be more open to considering longer-term
mortgages. In fact, the survey found that those who are aware that the rules
around longer-term mortgage penalties change after 5 years are significantly
more likely to consider a longer-term mortgage.
The survey
found that consumers are more than twice as likely to say they would lean
toward a fixed interest mortgage than a variable interest mortgage (46% vs 19%
respectively among the target audience and 42% vs. 16% respectively among the
general population). Interestingly, these responses do not vary based upon
whether the respondents feel that their life stage makes them more suited to a
shorter or longer-term mortgage.
A
reasonably large percentage of consumers (29% of the target audience and 41% of
the general population) indicated that the next time they need to renew [their]
mortgage / if they were to purchase a home and finance it with a mortgage, a
mortgage term longer than 5 years would suit them. This is given their life
plans and circumstances and applies in the absence of being provided an
interest rate to consider. Even among those consumers who have a correct
understanding of mortgage terminology (mortgage term and amortization
period), as many as 16% of the target audience and 31% of the general
population say a mortgage term longer than 5 years would suit their life
plans. If we consider this question a proxy for preference, then there is a
reasonably large pool of consumers who (again absent an interest rate
comparison) would lean toward longer-term mortgages.
One in ten
consumers (11% target audience and 14% general population) indicate that they
would
almost certainly
consider a longer-term mortgage the next time
they need to renew their mortgage or when they buy a home. Likelihood is
significantly lower among homeowners with a mortgage (6%) compared to others
(21%). More consumers indicate being
likely
to consider (not
almost
certain
) a longer-term mortgage (15% among the target audience and 18%
among the general population).
There is a
correlation between life plans and an appetite in longer-term mortgages. Sixty
percent of the general population that indicates that a mortgage term of more
than 5 years is suited to their life plans (e.g., expected time to own the home,
etc.) are
almost certain
or
likely
to consider a longer-term mortgage
compared to only 12% of those who do not believe their life stage suits a term
longer than 5 years.
A
conjoint exercise was conducted to supplement consumers stated likelihood of
choosing a longer-term mortgage. The exercise asked consumers to make a choice
between 3 options: 5-year variable, 5-year fixed and 10-year fixed mortgage offered
at various interest rate levels. This exercise was intended to validate the
qualitative finding that consumers are primarily open to considering a
longer-term mortgage if the interest rate differential between the 5-year fixed
option and 10-year fixed option is 1% or less. The results are generally
consistent with this finding. However, the survey found a significant drop off
in probability to choose a 10-year fixed term at a lower interest rate
differential compared to a 5-year fixed: 0.75% or greater, rather than a 1.0%
differential. In the choice exercise, the probability of choosing the 10-year
fixed option dropped significantly when the differential interest rate was
0.75% higher than the 5-year fixed.
Share
of preference in choosing the 10-year fixed mortgage is highest in the
following scenario: 4.00% for 5-year variable, 4.00% for 5-year fixed and
4.25% for 10-year fixed 17% among non-mortgage holders and 9% among current
mortgage holders (it was consistently found in the choice exercise that
non-mortgage holders are more open to considering a 10-year fixed term than
mortgage holders). Share of preference falls to only 8% among non-mortgage
holders and 3% among mortgage holders in a steep interest rate scenario (4.00%
for 5-year variable, 5.50% for 5-year fixed and 6.50% for 10-year fixed).
In
addition to the size of interest rate differential between mortgage options,
the research found household income, financial stress
and risk aversion
influence consideration of a longer-term mortgage. Other secondary factors were
found to influence this choice as well. These include: the perception that
there is greater consistency of mortgage payments with fixed terms, interest
rate risk (feeling more comfortable having interest rate fixed for as long as
possible to avoid the risk of increasing), and the appeal of avoiding the
hassle of renewing.
A partial
least squares regression analysis of the probabilities of choosing a 10-year
fixed mortgage over a 5-year fixed or 5-year variable reveals that
both low income and
higher income individuals could choose the 10-year mortgage, but for different
reasons. More specifically:
-
Financially
stressed consumers who place more weight on minimizing the risk of interest
rates rising;
-
Higher
income consumers who are willing to tolerate the risk of losing out on a
potential financial benefit from choosing a shorter-term mortgage if interest
rates decline over time.
Financially
stressed
consumers tend to have lower household income and believe
there is greater consistency of
mortgage payments with fixed terms (compared to variable interest rate terms).
They also have greater concerns about interest rates rising (feeling more
comfortable having interest rate fixed for as long as possible to avoid the
risk of increasing), and the appeal of avoiding the hassle of renewing. C
onsumers under medium
and high financial stress skew younger, more strongly toward women than men,
and those who do not yet own a home yet would like to own one.
By virtue
of being concerned about the risk of rising interest rates, these consumers appear
to be most aligned with the benefit of longer-term mortgages such that
borrowers are less
frequently
exposed to the risk that the interest rate will increase significantly upon
renewal. However, there is no evidence that the motivations are this clean cut.
Being assured of the consistency of payments for budgeting purposes and
avoiding the hassle and stress of renewing are attitudes that are also found
among consumers that place greater importance on guaranteed interest rate
stability.
In contrast, higher
income consumers who are willing
to tolerate more risk
appear
to be less concerned about potentially making a wrong decision by locking
themselves into a 10-year fixed mortgage potential cost of this error
should interest rates go down is not something that they would pay attention to
now. These consumers may not care much if they can win some money if interest
rates decline. Their approach to a 10-year fixed mortgage might be
characterized as shoot-and-forget meaning they are making a choice because
they believe negative consequences will be small/not a cause of major concern.
Taking into consideration the relatively low mortgage amount being simulated in
the hypothetical exercise for some respondents (for example compared to housing
prices in Toronto and Vancouver), this perspective could be inflated.
Figure
4: Patterns of Factors Associated with Choice
of 10-Year Fixed Term
|
Lower
income, higher financial stress
|
Higher income, lower financial stress
|
|
Interest Rate Risk Avoidance
& Avoiding Hassle of
Renewing
|
Shoot
and Forget
|
|
Higher
risk aversion
|
Medium risk aversion
|
|
Lower
education level
|
Higher education level
|
|
Lower
household income
|
Higher household income
|
|
Higher
financial stress
|
Lower financial stress
|
|
Life
plan is suited to a term greater than 5 years
|
Life plan is suited to a term of 10 years
or longer
|
|
Less
likely to have a mortgage now (e.g. renters)
|
More likely to have a mortgage
|
|
Feel
more comfortable having interest rate fixed for as long as possible to avoid
the risk of increasing
|
Not afraid of missing out on a potential
decreased in interest rates if locked into a term longer than 5 years
|
|
Place
importance on consistency of mortgage payments over the term
|
No
strong opinion on the consistency of mortgage payments
|
|
Find
avoiding the hassle of having to renew their mortgage often appealing
|
Would
NOT feel anxious to be locked into a term longer than 5 years
|
The
research explored the extent to which providing additional information to
consumers influences their probability of choosing 10-year fixed terms (see
Figure 3). Among the target audience and general population, the survey found
no significant difference, regardless of what information was provided. This
suggests that consumers are more likely to default to their predisposed views
or understanding and/or place significant weight on the interest rate
differential, when making choices rather than consider information that may
positively or negatively influence their choice of a 10-year fixed term.
DETAILED FINDINGS
This
section details the level of awareness and knowledge of longer-term mortgages
among both the target audience and the general population.
In order
to assess the baseline knowledge of both the target audience and the general
population, survey respondents were asked to provide their understanding of the
phrases mortgage term and amortization period by answering open-ended
questions asking them what they believe these phrases mean.
The responses
indicate that there is a significant lack of knowledge about mortgage terms
among both the general population and the target audience. Only half of the
general population (49%) provided a strictly correct description of the phrase
mortgage term. Correct answers included: years you have a mortgage/contract
term, the length of time you are committed to a mortgage rate, or the
length of time before renewal. The target audience was only slightly more
knowledgeable with 58% offering a strictly correct answer. Notably, very few
respondents offered strictly incorrect responses (3% of target audience and 2%
of general population) a much larger share of respondents (49% among the
general population and 40% among the target audience) either provided a mix of correct
and incorrect answers, chose do not know or most commonly, offered what would
be characterized as a vague response such as specific number/term or
property/house financing. Additionally, 20% of the target audience state
that they dont know what the phrase mortgage term means, demonstrating that
there is potential for discrepancies between the understanding of what a
mortgage term is, what respondents believe is available in Canada, and their
knowledge of what their own mortgage term is.
Figure 5: Understanding of the Phrase Mortgage Term
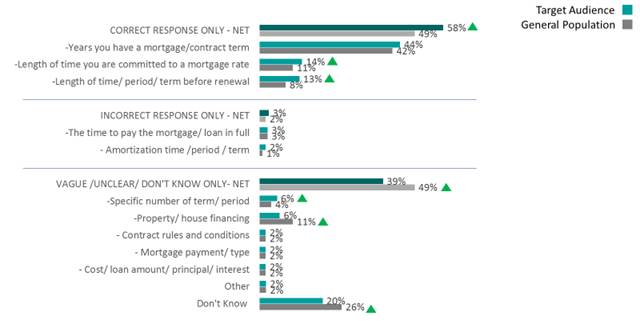
Q7. What does the phrase mortgage term mean?
Base: All respondents - Target audience (n=2511); General population
(n=2525)
Within
both the target and general populations, consumers with higher levels of
education (e.g., university degree) (high 50s 60 percentage) and higher household
income ($100,000 or greater) (mid 50s- 60% range) are more likely to have a
correct understanding of mortgage term. Amid the target audience, awareness is
higher among those with a fixed term mortgage (63%), lower financial stress
(64%), and among men compared to women (60% vs 56%).
Understanding
of amortization among both the target audience and general population is considerably
weaker than the understanding of mortgage term. In fact, less than 1% of
respondents gave a strictly correct response by saying only that it means the
time to pay the mortgage in full. While approximately a third (35%) of the target
audience and 28% of the general population correctly defined
amortization
period
as the time to pay off a mortgage or loan in full, these
respondents also indicated something that would be characterized as incorrect
or vague. Thus, these individuals might be considered partially correct.
Nearly as
many respondents offered responses that would be characterized as strictly
incorrect. One quarter of the target audience (25%) and 23% of the general
population provided incorrect responses ranging from mortgage payment type (6%)
to the length of time you are committed to a fixed rate (5%), indicating
confusion between the meaning of mortgage term and amortization period. Importantly,
three in ten (30%) in the target audience and almost four in ten (38%) in the
general population do not know what the phrase amortization period means.
Figure
6
: Understanding of the Phrase Amortization
Period
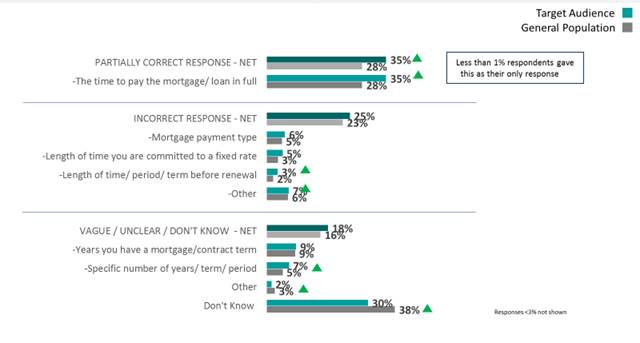
Q11. What does the phrase amortization period mean?
Base: All respondents - Target audience (n=2511); General population
(n=2525)
The above
evidence indicates an important finding: that there is not a strong
understanding of what a mortgage term or an amortization period is among
Canadians. Indeed, there is some confusion between the two within both the target
audience and the general population. This is important context as uptake of a
longer-term mortgage may be predicated on a misunderstanding of mortgage term
and amortization period.
To
mitigate any bias or misunderstanding within the survey, the following
definitions were provided to respondents following their responses to these
unaided awareness questions:
The mortgage term is the length of time a mortgage contract will be in effect. This includes everything the mortgage contract outlines, including the interest rate.
The amortization period is the total length of time it takes to pay off a home in full.
Only four
in ten of the target audience indicate that mortgage terms of greater than 5
years are available in Canada (37%). However, as noted above, many consumers do
not have a correct understanding of mortgage terminology. Therefore, the true
level of awareness of longer-term mortgages in Canada is likely significantly
lower. The survey found that only 7% of the target audience and 6% of the
general population have a correct understanding of the relevant terminology (a
correct understanding of both mortgage term and amortization period) and
indicate that 10-year fixed terms are available in Canada. In total, only 10%
of target audience and 7% among the general population have a correct
understanding of terminology of both term and amortization and believe any
terms greater than 5 years are available in Canada.
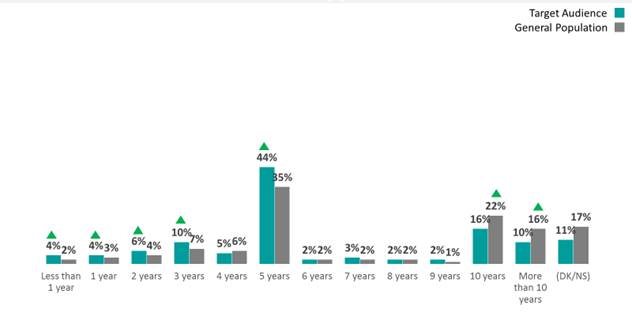
Canadians
are most familiar with 5-year mortgage terms. When asked to indicate the
various mortgage terms they believe are available in Canada, more than half
(64%) of the target audience answered that they are aware of a 5-year mortgage
term. Mortgage terms less than 5 years had much lower recognition with a third
of respondents being aware of 4-year terms (28%), 3-year terms (37%), 2-year
terms (29%) and 1-year term (29%). Knowledge is even less strong for mortgage
terms more than 5 years. Only one in ten respondents are aware of a 6-year (10%),
7-year (13%), 8-year (7%), or 9-year (7%) mortgage. There is a greater
recognition of the 10-year mortgage (25%) and mortgage terms greater than 10
years (15%). However, awareness is still low with 75% indicating either a 10-year
mortgage term is not available (58%) or they dont know if it is available (17%).
General
population awareness of terms longer than 5 years is generally consistent with
the target audience (40% vs. 37%), while awareness of 5-year mortgage terms is
lower than the general population (53% vs. 64%). Between a quarter and a third
of the general population are aware of the 4-year (22%), 3-year (29%), 2-year
(23%) and 1-year (22%) mortgage terms. Awareness of the 10-year mortgage fixed
term is 26% among the general population and 19% claim to know mortgage terms
of longer than 10 years are available.
Figure
7
: Aware longer-term fixed mortgage terms are
available
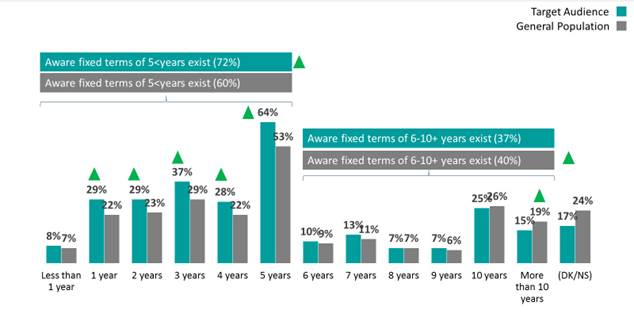
Q8. As far as
you know which of following mortgage terms are available in Canada for
mortgages with a fixed interest rate?
Base: All respondents - Target audience (n=2511); General population
(n=2525)
Knowledge of penalties for mortgage terms longer than 5 years is low, with only two in ten in the target audience and the general population respectively answering correctly that the rules regarding penalty fees change after 5 years. Among both the target and general population, 70% stated they do not know whether the rules regarding penalty fees change after 5 years in longer-term mortgages, indicating a low knowledge base and a high degree of uncertainty among Canadians on longer-term mortgages.
Figure
8
: Knowledge of Penalties on Longer-term
Mortgages
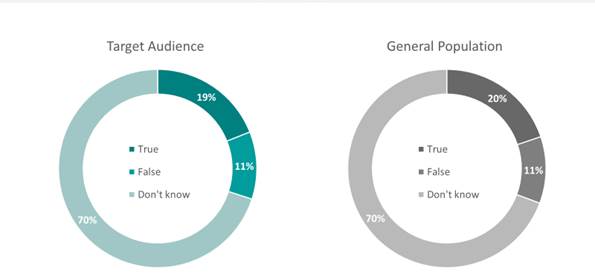
Q13. Please
answer True or False based on your knowledge. If you dont know select dont
know. Do not guess. For mortgage terms longer than 5 years, the rules regarding
penalty fees change after 5 years.
Base:
All respondents - Target audience (n=2511); General population (n=2525)
When asked
more directly about mortgage penalties, a large minority of consumers believe
that the longer the mortgage term the more expensive it is to break the
mortgage contract. A total of 43% of the target audience
agreed
with
this statement, with only 7%
disagreeing
. Within the general population,
39%
agreed
that longer mortgage terms are more expensive to break,
while, like the target audience, 7%
disagreed
. In both the target and
general population, a third of respondents stated that they did not know (32% target
audience, 35% general population). This becomes important to decision-making given
that the penalty to break a longer-term mortgage after 5 years is in fact often
consistent with breaking at a 5-year term.
A closer
examination of consumers understanding of mortgage terms provides further
confirmation that consumers know little about the details of longer-term
mortgages and many misunderstand several details. This could create a barrier
to their openness to considering longer-term mortgages.
Among the target
audience, almost half (44%)
agreed
that they would be afraid of missing
out on a potential decrease in interest rates if [they] locked into a mortgage
longer than 5 years, while 18%
disagreed
. Among the general population
41%
agreed
that they feared missing out on rate decreases, while, in the
target audience, 17%
disagreed
.
Figure
9
: Knowledge of Mortgage Terms
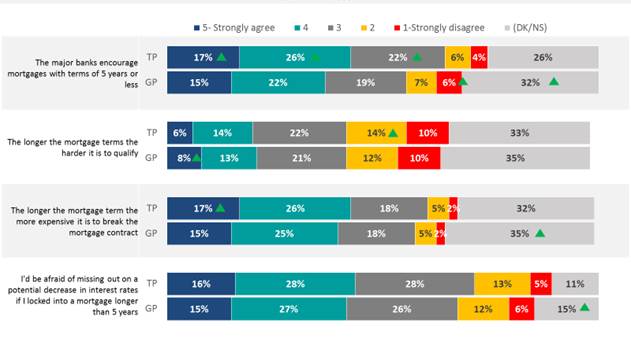
Q16. Based on your current understanding of mortgages, do you agree
or disagree with the following?
Base: All respondents - Target audience (n=2511); General population
(n=2525)
Nearly
half of the target audience (42%)
agrees
(rating of 4 or 5) that the
major banks encourage mortgages with terms of 5 years or less, while a quarter
(26%) state that they dont know. Similarly, 36% of the general population
agree
that the major banks encourage mortgages with terms of 5 years or less while
13%
disagree
and a third (32%) do not know.
Notably,
two in ten (21%) in the target audience
agree
that the longer the
mortgage terms the harder it is to qualify. While only slightly more
consumers, one-quarter of the target audience (24%),
disagrees
with this
statement, 33% are unsure. Similarly, two in ten (21%) in the general
population
agree
that longer mortgage terms are harder to qualify for,
while 22%
disagree
. As in the target audience, a third of respondents
are unsure.
There are notable
differences within the population pertaining to these knowledge related
measures. For example, homeowners with a mortgage are more likely to agree that
the major banks encourage mortgages with terms of 5 years or less (45% vs. 36%
in the general population and 30% among those likely to purchase a home in the next
5 years). Younger consumers (under age 45 in both the target and general
population) are more likely to agree that the longer the mortgage terms the
harder it is to qualify (26% vs 16% 45 years+). For both measures as well as
others, men are more likely to agree than women (47% vs 38% women on perception
of banks and 25% vs. 17% women on qualification).
This
section details common sources of mortgage information used by both the target
audience and the general population. Understanding where consumers look for
information will be useful when determining how best to reach consumers with
education about longer-term mortgages and related relevant information about
borrowing decisions.
All
respondents were asked where they would obtain information about getting a new
mortgage or renewing an existing mortgage. More than three quarters of the target
audience (76%) say they would seek information from their bank or financial
institution. This was followed by just under half (41%) who say they would ask
a mortgage broker, and a third (30%) who would search online. Among the general
population, three quarters (74%) would look for information from their bank or
financial institution and a third would inquire with their mortgage broker
(32%) or online (29%).
Figure
10
: Obtaining Mortgage Information
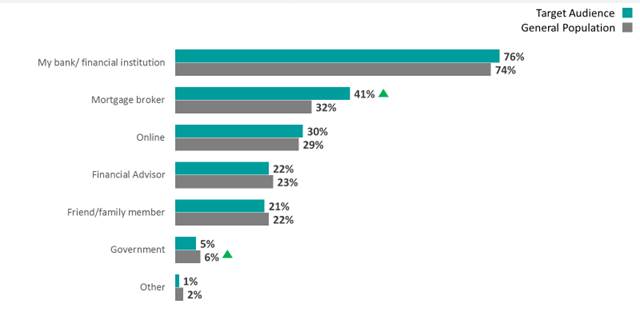
Q1. If you
were looking to get a mortgage or renew an existing mortgage, where would you
get your information?
Base:
All respondents - Target audience (n=2511); General population (n=2525)
Those who said
that they would seek information online were asked where online they would look
for information. Within the target audience more than three quarters (77%)
would look through their financial institutions website, while three quarters
of the target audience (75%) would look through a search engine like Google or
Bing. Approximately half (51%) would look at their mortgage brokers website.
Among the general population, approximately three quarters (76%) would utilize
a search engine while 73% prefer to go through their financial institutions
website. Consistent with the target audience, half of the general population
(50%) would get information from their mortgage brokers website.
Figure
11
: Obtaining Mortgage Information Online
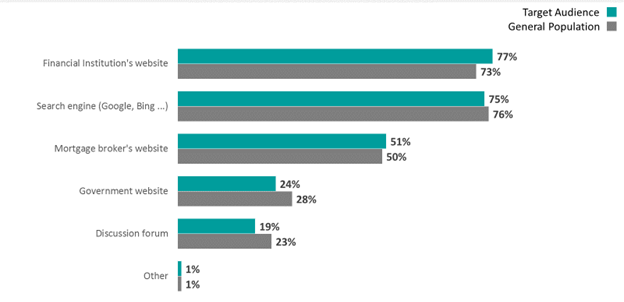
Q2. Which websites would you go to? Base: Looking for mortgage info
online
Target audience (n=756); General population (n=713)
There are
notable differences within the population groups pertaining to the way consumers
seek out information. When asked how they would get information pertaining to
mortgages, members of the target audience aged 55+ are more likely to contact
their bank or financial institution (83% vs. 76% 45-54, 72% 35-44, 68% 18-34)
while younger target respondents (aged 18-34) are significantly more likely to
seek information from a financial advisor (33% vs. 23% 35-44, 18% 45-54, 15%
55+), friend or family member (34% vs. 22% 35-54, 19% 45-54, 11% 55+), or
through the government (9% vs. 5% 35-54, 2% 45-54, 2% 55+). Within the target
audience, men are significantly more likely to seek information online (33% vs.
28% women), while women are significantly more likely to consult a friend or
family member (23% vs. 19% men).
Within the
general population, Canadians aged 55+ are significantly more likely to consult
a bank or financial institution for information (85% vs. 75% 45-54, 70%
35-54, 63% 18-34). Younger
respondents (18-34) in the general population are more likely to seek
information from a friend or family member (37% vs. 25% 35-44, 17% 45-54, 11%
55+) while respondents under the age of 44 are significantly more likely to
consult a financial advisor (30% 18-34, 25% 35-44 vs. 19% 45-54, 18% 55+). Men
in the general population are more likely to look online for mortgage
information (33% vs. 24% women), while women are more likely to speak with a
financial advisor (26% vs. 20% men), or a friend or family member (24% vs. 19%
men).
This
section details the financial profile of respondents, including their current
mortgage type and term, their remaining loan and amortization, and the amount
of financial stress they are under. This information was captured in the
survey primarily for understanding the extent to which these attributes impact
mortgage term choices.
Among those who currently have mortgages in
the target audience, almost three quarters (72%) report having a fixed interest
rate mortgage while two in ten (19%) hold a variable interest rate mortgage. A
much smaller proportion (5%) holds a combination fixed and variable interest
rates. These proportions are similar among the general population of homeowners
as more than six in ten (65%) hold a fixed interest rate mortgage while two in
ten (21%) hold a variable interest rate mortgage. Approximately one in ten (9%)
respondents in the general population claim to hold a combination of fixed and
variable interest rate mortgage.
Figure
12
: Uptake of Fixed vs. Variable Interest
Rate Mortgages
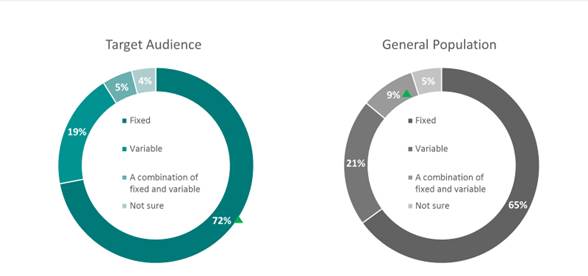
Q3. Does your existing mortgage on your home have
a fixed interest rate or variable interest rate?
Base: Mortgage holders - Target
1 - Target audience (n=2088); General population (n=892)
Within the target audience, older
respondents (aged 55+) are significantly more likely to have a fixed interest
rate mortgage (76% vs. 71% 35-44, 68% 45-54, 68% 18-34) while younger
respondents (aged 18-34) are significantly more likely to have a combination of
fixed and variable (8% vs. 6% 45-54, 4% 35-44, 4% 55+). Respondents within the target
audience who live in the hot housing markets of Vancouver and Toronto are more
likely to have a variable interest rate mortgage (29% vs. 17% other locations).
Within the general population, older respondents (aged 55+) are significantly
more likely to have a fixed interest rate mortgage (74% vs.63% 45-54, 59%
35-54).
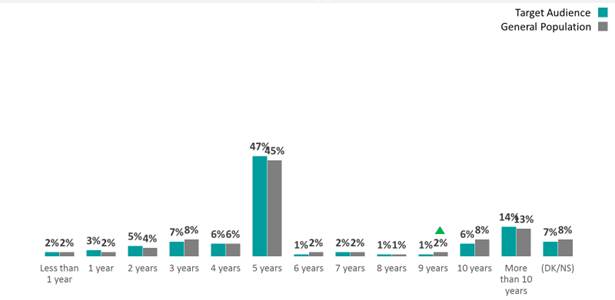
Among mortgage holders in the target
audience, half (47%) currently hold a 5-year mortgage. Just over one in ten
(14%) currently hold a mortgage term of more than 10 years while 22% of
homeowners in the target audience have 4 years or less on their current
mortgage. Among the general population, less than half (45%) hold a 5-year mortgage.
One in ten (13%) currently have a mortgage term of more than 10 years, while a
cumulative 21% have 4 years or less on their mortgage.
It is significant to note that the
respondents who answered they currently hold a mortgage term of more than 10
years (14%) is much higher than the data previously collected (outside of this
report) which indicates a number closer to 2%
. This discrepancy can be traced back to the lack of understanding of what amortization and mortgage term means. As noted, 43% of the target audience provided a vague or incorrect answer when asked to define the meaning of mortgage term, while half (51%) of the general population defined mortgage term incorrectly or with a vague response. Furthermore, when asked to define an amortization period, 25% of the target audience defined it incorrectly, with 35% of the target audience providing a definition that while partially correct, was clouded by responses that were vague, indicating the high degree of confusion of the difference between mortgage term and amortization period. Additionally, 20% of the target audience state that they dont know what the phrase mortgage term means, demonstrating that there is potential for discrepancies between the understanding of what a mortgage term is, what respondents believe is available in Canada, and their knowledge of what their own mortgage term is.
Figure
13
: Current Mortgage Term
Info screen before question: Most lenders offer
[mortgage] terms up to 10 years. Q9. What is the total mortgage term on your
current mortgage? By this we mean, the total length of your contract. Your
contract includes the interest rate and the details of the financing for your
home.
Base: Target audience (n=2088); General population
(n=892)
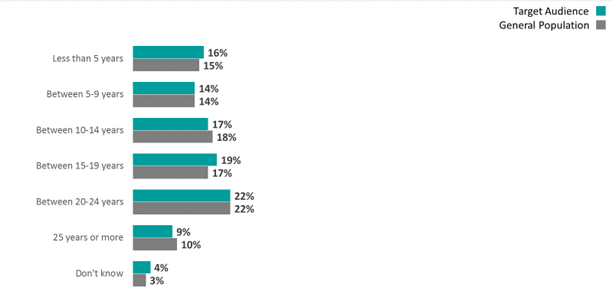
When asked about their remaining
amortization period, the target audience was most likely to say that it will
take between 15-19 years or between 20-24 years to pay off their home in full
(22% and 19% respectively). Nearly as many quote 10-14 years to pay off their
home (17%). The results are very similar among homeowners in the general
population.
Figure
14
: Remaining Amortization
Q12. What is the remaining amortization period on
your current mortgage? In other words, how many years will it take you to pay
off your home in full?
Base: Have a
mortgage - Target audience (n=2088); General population (n=892)
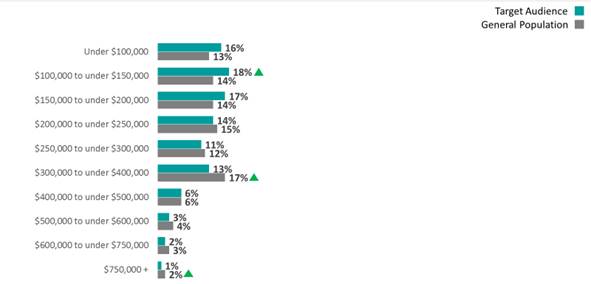
Within the
target audience, two in ten homeowners (18%) stated that their original
mortgage value was between $100,000 to under $150,000 or $150,000 to $200,000
(17%). A smaller portion (12%) had an original mortgage value of $400,000 or
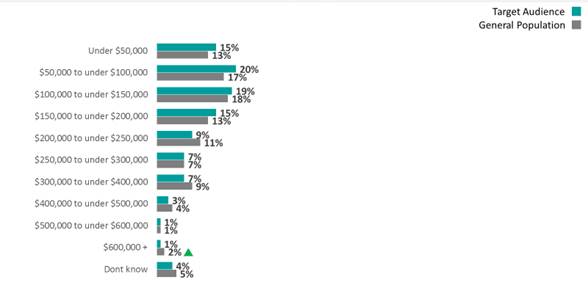
more. When asked what their remaining mortgage loan is, two in ten in the target
audience said there was $50,000 to under $100,000 remaining on their loan (20%)
or $100,000 to under $150,000 remaining on their loan (19%).
Figure
15
: Original Mortgage Value
D5. What was the original value of the mortgage loan on your
home? That is, when you first bought your current home, how much money
did you need to borrow?
Base: Have a mortgage - Target
audience (n=2088); General population (n=892)
Figure
16
: Remaining Mortgage
D6. And what is the approximate amount of money you have left on
your mortgage? Base: Have a mortgage - Target audience (n=2088); General population
(n=892)
In order
to better understand the financial stress that Canadians are under, and how
these stressors impact their mortgage decision-making, including their choice
of mortgage terms, a financial stress variable was created. The variable was
constructed as an aggregate of two variables: one that measures the extent to
which respondents are currently able to cover all their monthly household
expenses, and another measuring their ability to cover an unexpected expense
equal to a months income. The mean or average of the respondents rating
across the variables (dont know responses excluded) was then split into three
categories representing: low financial stress, medium financial stress, high
financial stress.
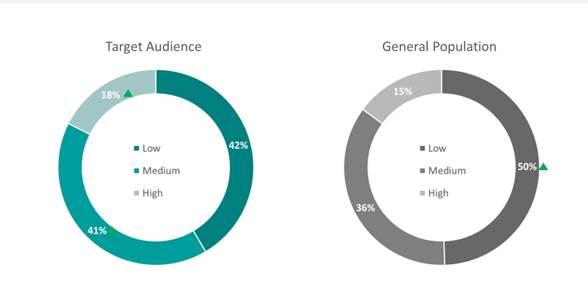
Within the
target audience, there is an even divide as 42% of respondents qualify as low
financial stress while 41% of respondents are medium financial stress. The
remaining 18% of respondents qualify as high financial stress. Contrastingly,
half (50%) of the general population falls under the low financial stress
heading, followed by 36% of the general population who are medium financial
stress. The remaining 15% of the general population are high financial
stress individuals.
Figure
17
: Financial Stress
Financial Stress Variable. Base: Those who
responded to D2 and D3 Target audience (n=2216), General population (n=2085).
There are significant differences within
each group that correlate to their level of financial stress. Within the target
audience, homeowners and likely homeowners under age 45 are significantly more
likely to have medium and high financial stress, and women are more likely than
men to experience financial stress. Respondents who are
likely
to purchase a home with a mortgage (23% vs. 17% current homeowners with
mortgages) are significantly more likely to be under high financial stress.
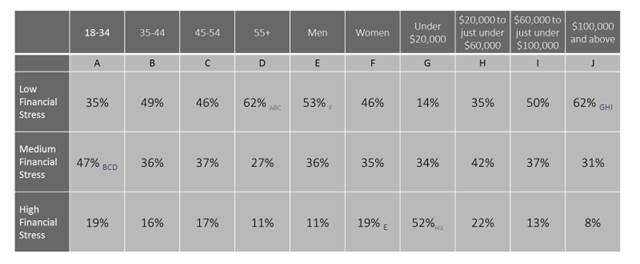
Figure
18
: Financial Stress in the Target audience
by Demography
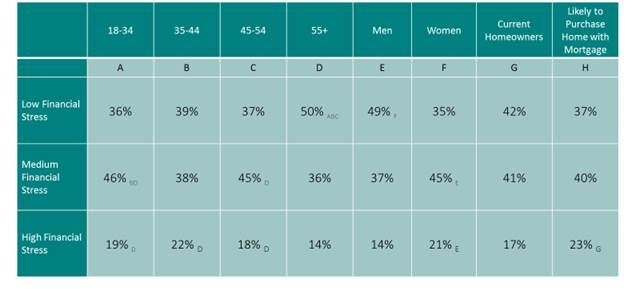
Financial Stress Variable.
Base:
Those who responded to D2 and D3 Target audience (n=2216)
Subscript letters reflect which sub-groups
the shown percentage is statistically significantly higher than.
Additionally, the type of mortgage
correlates to financial stress. Respondents in the target audience who have a
fixed or variable mortgage were significantly more likely to have low financial
stress than those who have a combination fixed/variable (42% fixed, 47%
variable vs. 31% combination). Furthermore, those in the target audience who
have a combination fixed/variable mortgage were more likely to have medium
financial stress (49% combination vs. 41% fixed, 38% variable).
The demographic trends among the general
population are the same as that noted for the target audience (younger, women,
those who want to buy a home). Household income is also a predictably strong
indication of financial stress with those making $100,000 and above more likely
to be low financial stress (62% vs. 50% $60,000 to <$100,000, 35% $20,000 to
<$60,000, 14% <$20,000) and those making less than $20,000 more likely to
be under high financial stress (52% vs 22% $20,000 to <$60,000, 13% $60,000
to <$100,000, 8% $100,000 and above).
Figure
19
: Financial Stress in the General
Population by Demography/Household Income
Financial Stress Variable Base
: Those
who responded to D2 and D3, General population (n=2085).
Subscript letters reflect which sub-groups
the shown percentage is statistically significantly higher than.
A survey
question was used to assess a respondents propensity to take risks
. This question asked the
respondent whether they would take the risk of losing a portion of their
income, if there was an equal chance of doubling their income. The question was
structured so that the probability of doubling your income or losing a portion
of your income remained constant, and the amount of income you could lose increased.
Therefore, respondents who were more willing to take the chance of losing a
greater portion of their income were deemed risk takers, while those who
selected a constant and fixed wage were deemed risk averse. Respondents were
asked to indicate all the options they would definitely consider
(multi-select).
Among the target
audience, four in ten (37%) indicate that the risk averse job description would
definitely be a consideration, selecting that they would choose a constant wage
with no chance to increase their income, but also no risk of losing income. A majority
of homeowners and likely homeowners (65%) indicate they would definitely
consider the low risk job description, as they would take the chance to double
their income, while risking a small amount (10%) of their yearly income. Only
one in ten (13%) in the target audience displayed propensity to risk their
income (risking 20% or more) for the chance to double their income. Please
note: the totals will not add to 100% because respondents were able to indicate
if they would definitely consider more than one job description.
Results
were similar among the general population with four in ten (37%) being risk
averse and six in ten (63%) being low risk. The general population is
significantly more likely than the target audience to take large risks (the
chance to double their income, or lose 50% of their income), however, both
groups have a very small percentage of their population willing to take this
large risk (4% general population vs. 2% target audience).
Figure
20
: Estimate of Risk Aversion
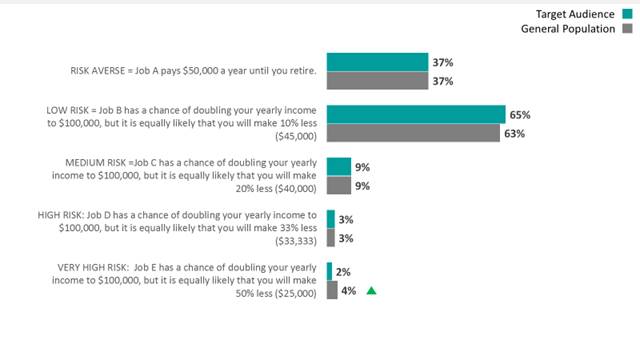
Q18. Please suppose that you currently make $50,000 a year. Next
month you are re-locating and your company is offering 5 jobs to employees like
you. Your new salary will start on your first day and remain the same until you
retire. Please tell us which of these job(s) you will definitely consider.
Base: All respondents - Target audience (n=2511); General population
(n=2525)
In
reviewing the multi-select responses to this question, some potential
inconsistencies were observed (e.g. selecting Job B and D, but not A, C or E).
To manage any potential impact this may have on the use of the variable in
advanced analysis examining the impact of risk aversion on mortgage choice, a
new variable was created that recoded the variable from a multiple select to a
single select. The single selection applied reflects the greatest risk option
the respondent selected. Both the original multi-select and single select
versions were used in analysis. The result was that both versions performed
similarly.
Figure
21
: Risk Aversion (% representing riskiest
option chosen)
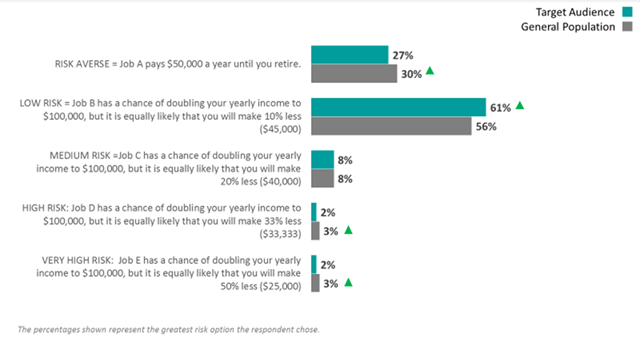
Q18. Please suppose that you currently make $50,000 a year. Next
month you are re-locating and your company is offering 5 jobs to employees like
you. Your new salary will start on your first day and remain the same until you
retire. Please tell us which of these job(s) you will definitely consider.
Respondents are allocated to their highest risk option selected. Base: All
respondents - Target audience (n=2511); General population (n=2525)
There are demographic differences
within the population pertaining to risk aversion as measured in the survey.
Perhaps not surprisingly, lower income consumers show more aversion to
risk-taking than those with higher incomes (52% of the general population with
household income under $20,000 demonstrate the lowest risk taking Job A among
their choices, 47% of those with household incomes between $20,000-<$60,000
vs. 33% or fewer among those with household incomes of $60,000 or higher). The
pattern is similar when looking at education levels lower educated consumers
lean toward strong risk aversion. While there is no significant difference
between men and women when it comes to highest level of risk (Jobs E), at each
of the lower risk levels, men demonstrate more openness to risk than women.
For example, 42% of women chose Job A among their choices vs. 32% of men).
There were some slight differences by age, but not a consistent pattern.
This
section investigates the attitudes and opinions Canadians have towards the
future of interest rates and comfort with factors related to longer-term
mortgages.
When asked
about the future of interest rates, more than half (57%) of the target audience
stated that they
agree
(responded 4, 5) that interest rates will be
higher in 5 years than they are today. More than two thirds (67%)
agree
that they would be more comfortable having a fixed interest rate for as long as
possible to avoid risks of increases. Among the general population agreement
was similarly strong with half (54%) stating they believe interest rates will
increase and 61% stating that they would prefer a longer fixed rate.
When
considering the consistency of mortgage payments three quarters of the target
audience (73%)
agree
that it was important [to them] that [their]
mortgage payments are consistent over the term and do not change. Two thirds
(66%) of the general population agreed with this same statement. Despite being
sure of their mortgage term preferences and predictions, only a quarter (28%)
of the target audience state that they are knowledgeable about mortgages, while
a third (30%) of the general audience agree that they are knowledgeable.
Figure
22
:
Attitudes
Toward
Factors Relevant to Longer-term Mortgages
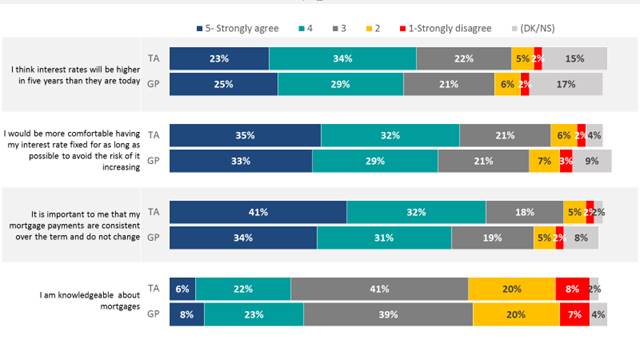
Q16. Based on your current understanding of mortgages, do you agree
or disagree with the following?
Base: All respondents - Target
audience (n=2511); General population (n=2525)
There are
significant demographic differences that influence attitudes towards the future
of interest rates. Within the target audience, younger respondents (18-44) are
significantly more likely to
agree
that interest rates will be higher in
5 years (62% 35-44, 60% 18-34 vs. 52% 55+) while older respondents (55+) are
significantly more likely to
agree
they would feel more comfortable
having their interest rates fixed for as long as possible to avoid the risk of
it increasing (72% 55+ vs. 64% 35-44, 64% 45-54, 64% 18-34). Male homeowners or
likely homeowners are more likely to
agree
that interest rates will be
higher in 5 years (61% vs. 53% women), and that they are knowledgeable about
mortgages (36% vs. 21% women) while they are more likely to
disagree
that they would be more comfortable having a fixed interest rate for as long as
possible (10% vs. 8% women) and that it is important to them that their
mortgage payments are consistent over the term (9% vs. 6% women).
Among the
general population, older respondents (45+) are more likely to agree that they
would be comfortable having their interest rate fixed for as long as possible
(69% 55+, 64% 45-54 vs. 54% 35-44, 53% 18-34). Women in the general population
are significantly more likely to feel comfortable if their interest rate were
fixed for as long as possible (64% vs. 59% men), and to
agree
that it is
important that their mortgage payment stay consistent over time (68% vs. 63%
men) while they are more likely to
disagree
that they are knowledgeable
about mortgages (35% vs. 20% men).
Looking
towards the future brought varying degrees of certainty for Canadians. Half of
the target audience (55%) and the general population (54%)
agree
that
avoiding the hassle of having to renew [their] mortgage often is appealing.
However, half of the target audience and the general population (47%
respectively)
agree
that they have a hard time imagining what life will
be like in 10 years. Consensus is much more divided on longer-term mortgages
as three in ten (31%) homeowners and likely homeowners
agree
that they
would feel anxious to be locked into a mortgage term longer than 5 years, even
with the flexibility to break the contract, while 30% disagree.
Figure
23
: Attitudes Toward Factors Relevant to
Longer-term Mortgages (continued)
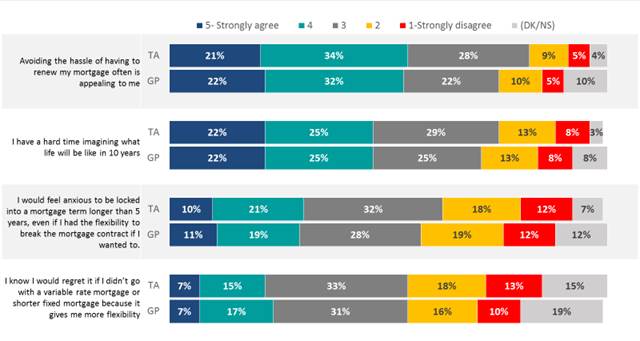
Q16. Based on your current understanding of mortgages, do you agree
or disagree with the following?
Base: All respondents - Target audience (n=2511); General population
(n=2525)
Similarly,
30% of the general population agree that they would feel anxious being locked
into a longer-term mortgage, while 31%
disagree
. Further division is
indicated as 22% of the target audience
agrees
that they would regret it
if they didnt go with a variable rate mortgage or a shorter fixed mortgage, as
they give more flexibility, however a third of the target audience disagrees
with this same statement. Among the general population, a quarter (24%),
believe they would regret not choosing a variable rate or shorter fixed
mortgage, while a quarter (26%)
disagree
.
There are
demographic differences within the population pertaining to their attitudes and
opinions. Within the target audience, younger respondents (18-34) are more
likely to
agree
that they would feel anxious being locked into a
mortgage term longer than 5 years (36% vs. 29% 45-54, 28% 55+) and that they
would regret it if they didnt go with a variable mortgage, or a shorter fixed
mortgage, as those options provide flexibility (25% vs. 19% 45-54, 19% 55+). Older
respondents (aged 55+) are significantly more likely to state that avoiding the
hassle of having to renew a mortgage is appealing (58% vs. 53% 18-34, 51%
45-54). Financial stress is also a contributing factor, as those under high
financial stress are more likely to have difficulty imagining what life will be
like in 10 years (55% vs. 48% medium, 43% low).
Within the
general population, younger respondents (18-34) are similarly more likely to
agree
that they would feel anxious being locked into a mortgage term longer than 5
years (35%, 34% 35-54 vs. 25% 55+) and that they would regret it if they didnt
go with a variable mortgage, or a shorter fixed mortgage, as those options
provide flexibility (30% vs. 21% 45-54, 21% 55+). Similar to the target
audience, older respondents (aged 55+) highlighted their interest in avoiding
the hassle of frequently renewing their mortgage (58% vs. 51% 18-34, 49%
35-44).
This
section discusses consumers propensity to consider fixed rate mortgage terms
of 5 years or longer, and the motivations and barriers in such a choice.
When asked
what type of mortgage they would lean towards when considering either renewing
or applying for a mortgage, almost half (46%) of the target audience would lean
towards a fixed rate mortgage, while 19% lean towards a variable. A further
third (30%) say that it would depend on the interest rate at the time.
Similarly, within the general population 42% lean towards a fixed interest rate
while 16% lean towards a variable interest rate. Notably, the general
population is significantly more likely (13% vs. 6% target audience) to say
that they dont know what type of mortgage they would lean towards.
Figure
24
: Preferences for Fixed or Variable
Mortgage
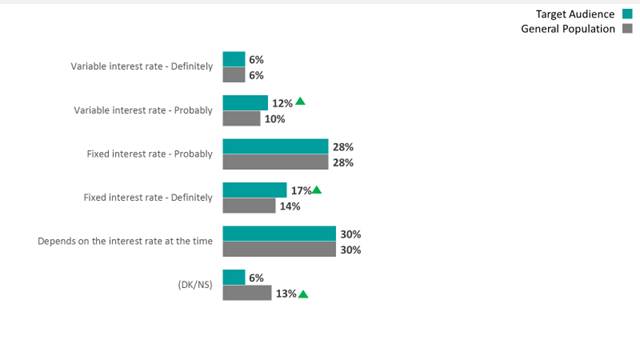
Q14. [The next time you need to renew your mortgage / If you were
to purchase a home with a mortgage loan] would you lean toward looking at
options for a mortgage with a variable interest rate or a fixed interest rate?
Base: All respondents - Target audience (n=2511); General population (n=2525)
Within the
target audience, a large minority (44%) of homeowners and likely homeowners
would prefer a 5-year mortgage. This is followed by 16% who would prefer a 10-year
mortgage term. Within the general population, a third (35%) of consumers would
prefer a 5-year mortgage term, while two in ten (22%) would prefer a 10-year
mortgage term. Interestingly, homeowners and likely homeowners are
significantly more likely to prefer terms of 5 years or less, while members of
the general population are significantly more likely to prefer mortgage terms
of 10 years or more.
Figure
25
: Life Stage Suitability
Q10. [The next time you need to renew your mortgage / If you were
to purchase a home and finance it with a mortgage] what mortgage terms would
ideally suit you best, given your life plans and circumstances? Please assume
the same interest rate would apply to any mortgage term.
Base: All respondents - Target audience (n=2511); General population
(n=2525)
Homeowners
with a mortgage were asked how likely they would be to consider a mortgage term
longer than 5 years the next time they need to renew their mortgage. Those who
do not own a home were asked about their consideration of a mortgage term
longer than 5 years if they were to purchase a home that they would finance with
a mortgage. As shown in the chart below, only one in ten indicated that they
would
almost certainly
consider mortgage terms longer than 5 years (11%
among the target audience and 14% among the general population). Slightly more
say they would be
likely
to consider a longer-term mortgage (15% target
audience and 18% general population). Current homeowners with a mortgage
indicate much lower level of interest in longer-term mortgage (6% almost
certain, 12% likely) than others (21% almost certain, 22% likely).
Figure
26
: Stated Likelihood to Consider Longer-Term
Mortgages
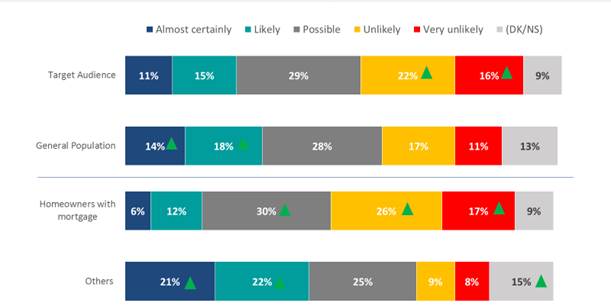
Q15. [The next
time you need to renew your mortgage / If you were to purchase a home that you
finance with a mortgage] how likely are you to consider a mortgage term longer
than 5 years?
Base: All respondents - Target
audience (n=2511); General population (n=2525) Homeowners with a mortgage
(n=3093); Others (n=1943)
While the target
and general populations obtain their information about mortgages from similar
sources, homeowners and likely homeowners indicate slightly stronger knowledge
of longer-term mortgages, however, they are unsure of penalty fees associated
with these mortgages and are not strongly interested in them. Within the
general population, despite having slightly less knowledge of longer-term
mortgages and a low understanding of penalty fees, they indicate a stronger
interest in longer-term mortgages, indicating that the general population shows
more receptivity to the potential consideration of a longer-term mortgage. Notably,
these responses do not vary based upon whether the respondents feel that their
life stage makes them more suited to a shorter or longer-term mortgage.
A
conjoint exercise was conducted to supplement consumers stated likelihood in
the question above, by asking consumers to make choices from 3 options offered
at various interest rate levels. This exercise was intended to validate the
qualitative finding that consumers are primarily open to considering a
longer-term mortgage if the interest rate differential between the 5-year fixed
option and 10-year fixed option is 1% or less.
The data
shows that among non-mortgage holders the probability of choosing the 10-year
fixed option dropped significantly when the interest rate was 0.75% higher than
the interest rate offered with 5-year fixed option. When the differential was
0.5% the drop was within the threshold of the statistical error, but at 0.75% the
drop was outside the error margin.
The exercise was also designed to look at the share of
preference or probability of considering the 10-year fixed term option in four
specific interest rates scenarios flat, normal, steep, inverted.
The four scenarios were constructed
to mimic mortgage rate differentials that can be observed under different
economic conditions:
-
In the flat scenario, the mortgage interest rate changes by a small amount as the term
length increases;
-
In the normal
scenario, the mortgage interest rate increases steadily as the term length
increases;
-
In the steep
scenario, the mortgage interest rate increases at an accelerated pace as the
term length increases;
-
In the inverted
scenario, the mortgage interest rate remains largely unchanged as the term
length increases.
Among mortgage holders the
results of the
conjoint exercise revealed similar average probabilities of choosing the
10-year fixed term option across all scenarios as the percentage selecting
almost
certain
to consider a fixed mortgage term greater than 5 years in the
stated likelihood question (7% and 6% respectively). However, the percentage
who state being
almost certain
is higher than the average probabilities
of choosing 10-year fixed term
among
all others (e.g. non-mortgage holders) at 21% and 15% respectively.
Naturally,
the level of interest in a 10-year fixed interest is highest when the interest
rate offered with each of the 3 options 5-year variable, 5-year fixed and
10-year fixed are equal. Given this unique (and unlikely) scenario, 20% of
non-mortgage holders and 11% of mortgage holders indicate a preference for the
10-year fixed. If the 5-year variable and 5-year fixed options remain at 4%
interest rate and 10-year fixed is offered at 0.25% higher (4.25%) inverted
scenario the likelihood of choosing a 10-year fixed term falls to 17% among
non-mortgage holders and 9% among mortgage holders.
The table below demonstrates the
share of preference for each option at various interest rate simulations.
Note: The design of the conjoint held the 5-year variable interest rate at 4%
for all scenarios.
Figure
27
: Share of Preference Probability among
Mortgage Holders
|
Scenario
|
5 year- variable
|
5-year fixed
|
10-year fixed
|
|
Interest rate
|
Share of
preference
|
Interest rate
|
Share of
preference
|
Interest rate
|
Share of
preference
|
|
*
|
4.00%
|
26%
|
4.00%
|
63%
|
4.00%
|
11%
|
|
Inverted
|
4.00%
|
26%
|
4.00%
|
65%
|
4.25%
|
9%
|
|
*
|
4.00%
|
36%
|
4.25%
|
55%
|
4.50%
|
9%
|
|
Flat
|
4.00%
|
46%
|
4.50%
|
47%
|
5.00%
|
7%
|
|
*
|
4.00%
|
54%
|
4.75%
|
37%
|
5.00%
|
9%
|
|
*
|
4.00%
|
62%
|
5.00%
|
30%
|
5.25%
|
8%
|
|
*
|
4.00%
|
62%
|
5.00%
|
31%
|
5.50%
|
6%
|
|
Normal
|
4.00%
|
63%
|
5.00%
|
32%
|
5.75%
|
5%
|
|
*
|
4.00%
|
68%
|
5.25%
|
24%
|
5.50%
|
8%
|
|
*
|
4.00%
|
74%
|
5.50%
|
20%
|
5.75%
|
7%
|
|
*
|
4.00%
|
74%
|
5.50%
|
20%
|
6.00%
|
5%
|
|
Steep
|
4.00%
|
75%
|
5.50%
|
22%
|
6.50%
|
3%
|
*These scenarios have been interpolated using the scenario simulator.
Figure
28
: Share of Preference Probability among Non-Mortgage
Holders
|
Scenario
|
5-year variable
|
5-year fixed
|
10-year fixed
|
|
Interest rate
|
Share of preference
|
Interest rate
|
Share of
preference
|
Interest rate
|
Share of
preference
|
|
*
|
4.00%
|
28%
|
4.00%
|
53%
|
4.00%
|
20%
|
|
Inverted
|
4.00%
|
28%
|
4.00%
|
55%
|
4.25%
|
17%
|
|
*
|
4.00%
|
36%
|
4.25%
|
47%
|
4.50%
|
17%
|
|
Flat
|
4.00%
|
44%
|
4.50%
|
41%
|
5.00%
|
15%
|
|
*
|
4.00%
|
51%
|
4.75%
|
32%
|
5.00%
|
17%
|
|
*
|
4.00%
|
57%
|
5.00%
|
27%
|
5.25%
|
16%
|
|
*
|
4.00%
|
58%
|
5.00%
|
29%
|
5.50%
|
14%
|
|
Normal
|
4.00%
|
59%
|
5.00%
|
30%
|
5.75%
|
11%
|
|
*
|
4.00%
|
62%
|
5.25%
|
23%
|
5.50%
|
15%
|
|
*
|
4.00%
|
67%
|
5.50%
|
19%
|
5.75%
|
14%
|
|
*
|
4.00%
|
68%
|
5.50%
|
20%
|
6.00%
|
12%
|
|
Steep
|
4.00%
|
70%
|
5.50%
|
22%
|
6.50%
|
8%
|
*These
scenarios have been interpolated using the scenario simulator.
Partial Least Squares analysis
(PLS) was conducted to explore latent factors that motivate or act as a barrier
to choosing 10-year fixed terms. As noted earlier, a main barrier to uptake is
lack of understanding or misunderstanding of penalties. However, this lack of
understanding was not easy to include in the model because of the high
percentage of dont know responses, and thus it will be referenced below.
Despite this, the lack of understanding should be considered a barrier.
The probability of choosing the
10-year option was used as a dependent variable in four separate runs each
where the probability represents the flat, normal, steep and inverted
scenarios.
Each
of the four runs were repeated twice once on the total sample and one
filtered by mortgage holders.
The results are
generally consistent between the total sample and mortgage holders and
generally consistent regardless of which of the 4 scenarios (normal, steep,
flat inverted) is used as the dependent variable. The results are provided in
the Appendix.
Results show the key
factors having some role in choice, aside from the actual interest rate, are:
Other secondary factors:
Both low income and
higher income individuals could choose the 10-year mortgage, but for different
reasons. Lower income individuals have more immediate higher financial stress that
seems to contribute to the individual being in a protective mode of thinking.
The resulting attitudes could be summarized as follows: 10 years offers
guaranteed stability and allows them to avoid the hassle of renewal. For them,
a 10-year fixed mortgage is more of a security umbrella rather than active savings
decision.
In contrast, higher income
individuals appear to be less concerned about potentially making a wrong
decision by locking themselves into 10-year fixed potential cost of error is
not something that they would pay attention to now. Their lower financial
stress suggests that they may not care much if they might win some money should
interest rates drop. For them 10-year fixed mortgage is shoot-and-forget
decision meaning they are making a choice because they believe the potential negative
consequences will be small/not a cause of major concern. Taking into
consideration the relatively low mortgage amount being simulated in the
hypothetical exercise for some respondents (for example compared to housing
prices in Toronto and Vancouver), this perspective could be inflated.
A conjoint analysis was
conducted where scenarios with varying interest rates and interest type (fixed
vs. variable) were presented to the respondent. An interesting finding is that
there is a relatively low correlation between predicted probabilities and the
stated likelihood to consider. It is acknowledged that the two measures are
quite different specifically that the conjoint published interest rate differentials
for respondents to evaluate in their decision-making and stated question did
not. This may explain the low correlation. However, one other interpretation
of this disconnect is that the loan value and interest rates proposed in the conjoint
analysis may have been more realistic for some respondents and less real for
others who take mortgages in much higher amounts and at lower interest rates (4-6.75%
was the range used in the survey vs 2.99% in the current marketplace at the
time of the survey). Also supporting this interpretation is that the
disconnect is higher among mortgage holders than non-mortgage holders.
The disconnect is also
higher among more knowledgeable respondents. In the absence of giving these
knowledgeable people an interest rate differential in Q15 it is possible to
over-estimate their consideration of a 10-year fixed option. When they see the
rate is greater than 0.75 of a point higher for 10-year fixed (per exercise) some
shy away from the 10-year option. Individuals who dont know as much (less
knowledgeable) are more willing to accept 0.75 higher rates, or even higher,
for a 10-year fixed. This would be generally consistent with the focus group
learning.
Further, there is the potential
for the 10-year option to be more associated with less logical choices. We
observe that acceptance of the 10-year mortgage is coupled with a decrease of the
conjoint fit score, which is the average modelled probability of choice based
on actual choices made. One interpretation of this is that individuals who
make less logical choices are more likely to accept the 10-year option. It is
unclear if this is a consequence of perceived value and risks of the 10-year
mortgage or a result of the unattractive interest rates rotated in the exercise
(e.g. the 10-year option was always shown with an extra bump in the interest
rate).
To further validate the
findings of the PLS are correct, an additional step was undertaken. A
randomly-generated series of choices was created and modelled against the
sample to identify what may potentially be respondents who made random
choices. Identifying random choices is quite difficult because the conjoint
was conducted on only 4-choice sets not enough to reliably identify
randomness. That said, once respondents with a pattern of choice showing a
potentially random pattern were removed and the PLS was re-run, the factors
held steady and the interpretation of the two latent factors found remain
consistent.
The
results demonstrate that providing disclosure information, regardless of
amount, did not have a significant impact on overall likelihood of choosing a
10-year mortgage among mortgage holders or among non-mortgage holders. Further
analysis on sub-groups (e.g. renters or mortgage-free homeowners) is required
to determine if the information has an impact on those consumers.
Figure
29
: Impact of Disclosure Information Among
Mortgage Holders
|
No Disclosure
|
5-year variable
|
5-year fixed
|
10-year fixed
|
|
Interest rate
|
Share of
preference
|
Interest rate
|
Share of
preference
|
Interest rate
|
Share of
preference
|
|
Inverted
|
4.00%
|
27%
|
4.00%
|
64%
|
4.25%
|
9%
|
|
Flat
|
4.00%
|
47%
|
4.50%
|
47%
|
5.00%
|
7%
|
|
Normal
|
4.00%
|
64%
|
5.00%
|
32%
|
5.75%
|
4%
|
|
Steep
|
4.00%
|
75%
|
5.50%
|
22%
|
6.50%
|
3%
|
|
Partial Disclosure
|
5-year variable
|
5-year fixed
|
10-year fixed
|
|
Interest rate
|
Share of
preference
|
Interest rate
|
Share of
preference
|
Interest rate
|
Share of
preference
|
|
Inverted
|
4.00%
|
24%
|
4.00%
|
66%
|
4.25%
|
10%
|
|
Flat
|
4.00%
|
44%
|
4.50%
|
48%
|
5.00%
|
8%
|
|
Normal
|
4.00%
|
62%
|
5.00%
|
33%
|
5.75%
|
5%
|
|
Steep
|
4.00%
|
75%
|
5.50%
|
22%
|
6.50%
|
3%
|
|
Full
Disclosure
|
5-year variable
|
5-year fixed
|
10-year fixed
|
|
Interest rate
|
Share of
preference
|
Interest rate
|
Share of
preference
|
Interest rate
|
Share of
preference
|
|
Inverted
|
4.00%
|
28%
|
4.00%
|
64%
|
4.25%
|
8%
|
|
Flat
|
4.00%
|
47%
|
4.50%
|
46%
|
5.00%
|
7%
|
|
Normal
|
4.00%
|
63%
|
5.00%
|
32%
|
5.75%
|
5%
|
|
Steep
|
4.00%
|
75%
|
5.50%
|
22%
|
6.50%
|
4%
|
Figure
30
: Impact of Disclosure Information Among
Non-Mortgage Holders
|
No
Disclosure
|
5-year variable
|
5-year fixed
|
10-year fixed
|
|
Interest rate
|
Share of
preference
|
Interest rate
|
Share of
preference
|
Interest rate
|
Share of
preference
|
|
Inverted
|
4.00%
|
28%
|
4.00%
|
54%
|
4.25%
|
18%
|
|
Flat
|
4.00%
|
43%
|
4.50%
|
42%
|
5.00%
|
15%
|
|
Normal
|
4.00%
|
57%
|
5.00%
|
31%
|
5.75%
|
12%
|
|
Steep
|
4.00%
|
68%
|
5.50%
|
24%
|
6.50%
|
9%
|
|
Partial
Disclosure
|
5-year variable
|
5-year fixed
|
10-year fixed
|
|
Interest rate
|
Share of
preference
|
Interest rate
|
Share of
preference
|
Interest rate
|
Share of
preference
|
|
Inverted
|
4.00%
|
28%
|
4.00%
|
60%
|
4.25%
|
17%
|
|
Flat
|
4.00%
|
45%
|
4.50%
|
42%
|
5.00%
|
14%
|
|
Normal
|
4.00%
|
60%
|
5.00%
|
30%
|
5.75%
|
10%
|
|
Steep
|
4.00%
|
71%
|
5.50%
|
22%
|
6.50%
|
7%
|
|
Full
Disclosure
|
5-year variable
|
5-year fixed
|
10-year fixed
|
|
Interest rate
|
Share of
preference
|
Interest rate
|
Share of
preference
|
Interest rate
|
Share of
preference
|
|
Inverted
|
4.00%
|
29%
|
4.00%
|
54%
|
4.25%
|
17%
|
|
Flat
|
4.00%
|
45%
|
4.50%
|
40%
|
5.00%
|
15%
|
|
Normal
|
4.00%
|
59%
|
5.00%
|
29%
|
5.75%
|
12%
|
|
Steep
|
4.00%
|
69%
|
5.50%
|
21%
|
6.50%
|
10%
|
APPENDIX
The
following table presents the screening, demographic and other relevant
information gathered on respondents. Note: demographic variables that were
used for sample weighting are not shown below as they are detailed in the
Methodology section of the report. The percentages shown below are weighted.
Figure
31
: Profile of Respondents
|
|
Target
Audience
|
General
Population
|
|
Home ownership
|
|
Own
|
83%
|
66%
|
|
Rent
|
16%
|
29%
|
|
Other
|
1%
|
5%
|
|
Mortgage on home
|
|
Yes
|
100%
|
60%
|
|
No
|
-
|
40%
|
|
Within the next 5 years, likelihood to
buy a home that you will finance with a mortgage
|
|
Almost certainly
|
53%
|
16%
|
|
Likely
|
47%
|
15%
|
|
Possible
|
-
|
26%
|
|
Unlikely
|
-
|
14%
|
|
Very unlikely
|
-
|
30%
|
|
Length of time planning to stay in the
home (own/ rent)
|
|
|
|
1 year
|
6%
|
7%
|
|
2 years
|
9%
|
8%
|
|
3 years
|
8%
|
7%
|
|
4 years
|
4%
|
5%
|
|
5 years
|
13%
|
13%
|
|
6-10 years
|
18%
|
17%
|
|
10+ years
|
42%
|
43%
|
|
Original value of mortgage loan on home
(at time of purchase)
|
|
Under $100,000
|
16%
|
13%
|
|
$100,000 < $150,000
|
18%
|
14%
|
|
$150,000 < $200,000
|
17%
|
14%
|
|
$200,000 < $250,000
|
14%
|
15%
|
|
$250,000 < $300,000
|
11%
|
12%
|
|
$300,000 < $400,000
|
13%
|
17%
|
|
$400,000 < $500,000
|
6%
|
6%
|
|
$500,000 < $600,000
|
3%
|
4%
|
|
$600,000 < $750,000
|
2%
|
3%
|
|
$750,000 +
|
1%
|
2%
|
|
|
Target
Audience
|
General
Population
|
|
Approximate
amount of money you have left on your mortgage
|
|
Under $50,000
|
15%
|
13%
|
|
$50,000 < $100,000
|
20%
|
17%
|
|
$100,000 < $150,000
|
19%
|
18%
|
|
$150,000 <
$200,000
|
15%
|
13%
|
|
$200,000 <
$250,000
|
9%
|
11%
|
|
$250,000 < $300,000
|
7%
|
7%
|
|
$300,000 < $400,000
|
7%
|
9%
|
|
$400,000 < $500,000
|
3%
|
4%
|
|
$500,000 < $600,000
|
1%
|
1%
|
|
$600,000 +
|
1%
|
2%
|
|
Dont know
|
4%
|
5%
|
|
Education
|
|
|
|
Some high school
|
3%
|
3%
|
|
High school diploma or
equivalent
|
18%
|
20%
|
|
Registered Apprenticeship or
other trades certificate or diploma
|
7%
|
7%
|
|
College, CEGEP or other non-university
certificate or diploma
|
27%
|
25%
|
|
University certificate of
diploma below bachelors level
|
6%
|
6%
|
|
Bachelors degree
|
27%
|
25%
|
|
Post graduate degree above
bachelors level
|
11%
|
11%
|
|
Prefer not to answer
|
1%
|
3%
|
|
Number of household members (including
self)
|
|
Adults
|
|
|
|
1
|
19%
|
22%
|
|
2
|
60%
|
53%
|
|
3
|
13%
|
14%
|
|
4
|
6%
|
9%
|
|
5+
|
2%
|
4%
|
|
Children (under the age of 18)
|
|
|
|
0
|
65%
|
72%
|
|
1
|
17%
|
14%
|
|
2
|
13%
|
9%
|
|
3+
|
5%
|
4%
|
The Financial Consumer Agency of
Canada is conducting this survey on Mortgages. Ipsos has been hired to
administer the survey. The survey takes about 15 minutes to complete and is
voluntary and completely confidential. Your answers will remain anonymous. To
view our privacy policy, click here.
|
ID
|
Audience
|
Question
|
Answers
|
|
S1
|
All
|
Do you own or rent your home?
(select one)
|
Own
|
|
Rent
|
|
Other
|
|
ASK S2 ONLY IF S1 =OWN
|
|
S2
|
Homeowners
|
Do you currently have a mortgage on your home? (select one)
|
Yes
|
|
No
|
|
IF YES: DEFINE AS TARGET 1. ASK S3 IF S1 = RENT OR OTHER OTHERWISE
SKIP TO S5
|
|
S3
|
Non-homeowners
|
Within the next 5 years, how likely are you to buy a home that
you will finance with a mortgage? (select one)
|
Almost certainly
|
|
Likely
|
|
Possible
|
|
Unlikely
|
|
Very unlikely
|
|
S5
|
All
|
Please select your gender. (select one)
|
Male
|
|
Female
|
|
Other
|
|
Prefer not to say
|
|
S6
|
All
|
Province
|
Alberta
|
|
British Columbia
|
|
Manitoba
|
|
New Brunswick
|
|
Newfoundland and Labrador
|
|
Nova Scotia
|
|
Ontario
|
|
Prince Edward Island
|
|
Quebec
|
|
Saskatchewan
|
|
S7
|
All
|
FSA
(first 3 characters of your postal code)
|
[text]
|
|
Q1
|
All
|
If you were looking to get a mortgage or renew an existing
mortgage, where would you get your information? (select all that apply)
|
Online
|
|
Friend/family member
|
|
My bank/ financial institution
|
|
Financial Advisor
|
|
Mortgage broker
|
|
Government
|
|
Other (specify) [text box]
|
|
IF ONLINE ASK Q2 OTHERWISE SKIP TO Q3
|
|
Q2
|
Looking for mortgage info online
|
Which websites would you go to? (select all that apply)
|
Search engine (Google, Bing)
|
|
Financial Institutions website
|
|
Discussion forum
|
|
Mortgage brokers website
|
|
Government website
|
|
Other (specify) [text box]
|
|
ASK Q3 IF S2=1, OTHERWISE SKIP TO Q7
|
|
Q3
|
Target 1
|
Does your existing mortgage on your home have a fixed interest
rate or variable interest rate? (select one)
|
Fixed
|
|
Variable
|
|
A combination of fixed and variable
|
|
Not sure
|
|
Q7
|
All
|
What does the phrase
mortgage term
mean?
|
[text box]
|
|
Dont know
|
|
Q11
|
All
|
What does the phrase
amortization
period mean?
|
[text box]
|
|
Dont know
|
|
INFO SCREEN.
SHOW THE FOLLOWING ON SCREEN AFTER ANSWERING Q11. SHOW TO ALL
RESPONDENTS
The amortization period is the total length of time it takes to
pay off a home in full.
The mortgage term is the length of time a mortgage contract will
be in effect. This includes everything the mortgage contract outlines,
including the interest rate.
|
|
ASK Q12 IF S2=1, OTHERWISE SKIP TO Q8
|
|
Q12
|
Target 1
|
What is the remaining
amortization period
on your current
mortgage? In other words, how many years will it take you to pay off your
home in full? (select one)
|
Less than 5 years
|
|
Between 5-9 years
|
|
Between 10-14 years
|
|
Between 15-19 years
|
|
Between 20-24 years
|
|
25 years or more
|
|
Dont know
|
|
INFO SCREEN. SHOW THE FOLLOWING ON SCREEN AFTER THEY ANSWER Q8.
SHOW TO ALL RESPONDENTS Most lenders offer terms up to 10 years.
|
|
Q8
|
All
|
As far as you know which of the following mortgage terms are
available in Canada for mortgages with a fixed interest rate? (select all
that apply)
|
Less than 1 year
|
|
1 year
|
|
2 years
|
|
3 years
|
|
4 years
|
|
5 years
|
|
6 years
|
|
7 years
|
|
8 years
|
|
9 years
|
|
10 years
|
|
More than 10 years
|
|
Dont know
|
|
ASK Q9 IF S2=1, OTHERWISE SKIP TO Q10
|
|
Q9
|
Target 1
|
What is the total mortgage term on your current mortgage?
By this we mean, the total length of your contract. Your
contract includes the interest rate and the details of the financing for your
home. (select one)
|
Less than 1 year
|
|
1 year
|
|
2 years
|
|
3 years
|
|
4 years
|
|
5 years
|
|
6 years
|
|
7 years
|
|
8 years
|
|
9 years
|
|
10 years
|
|
Q10
|
All
|
[IF TARGET 1 (S1 =1) PIPE IN The next time you need to renew
your mortgage] [ALL OTHERS If you were to purchase a home and finance it
with a mortgage]
what mortgage terms would ideally suit you best, given your
life plans and circumstances? Please assume the same interest rate would
apply to any mortgage term. (select all that apply)
|
Less than 1 year
|
|
1 year
|
|
2 years
|
|
3 years
|
|
4 years
|
|
5 years
|
|
6 years
|
|
7 years
|
|
8 years
|
|
9 years
|
|
10 years
|
|
More than 10 years
|
|
Dont know
|
|
|
|
|
|
|
Q13
|
All
|
|
True
|
|
False
|
|
Dont know
|
|
Q14
|
All
|
[IF TARGET 1 (S1 =1) PIPE IN The next time you need to renew
your mortgage] [ALL OTHERS If you were to purchase a home with a mortgage
loan] would you lean toward looking at options for a mortgage with a variable
interest rate or a fixed interest rate? (select one)
|
Variable interest rate - Definitely
|
|
Variable interest rate Probably
|
|
Fixed interest rate Probably
|
|
Fixed interest rate - Definitely
|
|
Depends on the interest rate at the time
|
|
Dont know
|
|
Q15
|
All
|
[IF TARGET 1(S1 =1) PIPE IN The next time you need to renew
your mortgage] [ALL OTHERS If you were to purchase a home that you finance
with a mortgage] how likely are you to consider a mortgage term longer than 5
years?
|
5- Strongly agree
|
|
4
|
|
3
|
|
2
|
|
1-Strongly disagree
|
|
Dont know
|
|
RANDOMIZE ORDER OF Q16 STATEMENTS
|
|
|
Q16.1
|
All
|
I think interest rates will be higher in 5 years than they are
today.
|
5- Strongly agree
|
|
4
|
|
3
|
|
2
|
|
1-Strongly disagree
|
|
Dont know
|
|
Q16.2
|
All
|
I would be more comfortable having my interest rate fixed for as
long as possible to avoid the risk of it increasing.
|
5- Strongly agree
|
|
4
|
|
3
|
|
2
|
|
1-Strongly disagree
|
|
Dont know
|
|
Q16.3
|
All
|
It important to me that my mortgage payments are consistent over
the term and do not change.
|
5- Strongly agree
|
|
4
|
|
3
|
|
2
|
|
1-Strongly disagree
|
|
Dont know
|
|
1-Strongly disagree
|
|
Dont know
|
|
Q16.4
|
T
arget
1
|
I am knowledgeable about mortgages.
|
5- Strongly agree
|
|
4
|
|
3
|
|
2
|
|
1-Strongly disagree
|
|
Dont know
|
|
Q16.5
|
All
|
The
major banks encourage mortgages with terms of 5 years or less.
|
5- Strongly agree
|
|
4
|
|
3
|
|
2
|
|
1-Strongly disagree
|
|
Dont know
|
|
Q16.6
|
All
|
The longer the mortgage terms the harder it is to qualify.
|
5- Strongly agree
|
|
4
|
|
3
|
|
2
|
|
1-Strongly disagree
|
|
Dont know
|
|
Q16.7
|
All
|
The longer the mortgage term the more expensive it is to break
the mortgage contract.
|
5- Strongly agree
|
|
4
|
|
3
|
|
2
|
|
1-Strongly disagree
|
|
Dont know
|
|
Q16.8
|
All
|
Id be afraid of missing out on a potential decrease in interest
rates if I locked into a mortgage longer than 5 years.
|
5- Strongly agree
|
|
4
|
|
3
|
|
2
|
|
1-Strongly disagree
|
|
Dont know
|
|
Q16.9
|
All
|
Avoiding the hassle of having to renew my mortgage often is
appealing to me.
|
5- Strongly agree
|
|
4
|
|
3
|
|
2
|
|
1-Strongly disagree
|
|
Dont know
|
|
Q16.10
|
All
|
I have a hard time imagining what life will be like in 10 years.
|
5- Strongly agree
|
|
4
|
|
3
|
|
2
|
|
1-Strongly disagree
|
|
Dont know
|
|
Q16.11
|
All
|
I would feel anxious to be locked into a mortgage term longer
than 5 years, even if I had the flexibility to break the mortgage contract if
I wanted to.
|
5- Strongly agree
|
|
4
|
|
3
|
|
2
|
|
1-Strongly disagree
|
|
Dont know
|
|
Q16.12
|
All
|
I know I would regret it if I didnt go with a variable rate
mortgage or shorter fixed mortgage because it gives me more flexibility.
|
5- Strongly agree
|
|
4
|
|
3
|
|
2
|
|
1-Strongly disagree
|
|
Dont know
|
|
Q17
|
Scenarios
|
On the next few screens you
will see mortgage scenarios. For each scenario please select the option you
would be most likely to pick.
Assume that:
-
You need to borrow $300,000 (the initial principal amount).
-
The loan needs to be paid off within 25 years. So, you need to re-negotiate a new contract in 5 years (if you choose the 5-year variable or fixed rate mortgage), or in 10 years (if you choose the 10-year fixed rate mortgage).
-
You know that you qualify for any of the mortgages presented in the scenarios.
Here is some additional information that can help you make the
best decision based on your situation:
[Group 2 and 3]
Note: The information has been simplified for the purpose of
this exercise
|
|
5-Year Variable
|
5-Year Fixed Rate
|
10-Year Fixed Rate
|
|
[Group
2, Group 3] Can the interest rate change during the term?
|
Yes
- But you can switch to a fixed rate at any time without paying a penalty.
|
No
|
No
|
|
[Group
2, Group 3] Will my payment amount change during the term?
|
No
|
No
|
No
|
|
[Group
2, Group 3] Can I know how much will be left to pay on my house at the end
of the term?
|
No
- If the interest rate goes up, a larger portion of your payment will go
towards paying the interest.
|
Yes
|
Yes
|
|
[Group
3] Can I break my mortgage contract?
|
Yes
with a penalty fee
|
Yes
with a penalty fee
|
Yes
with a penalty fee
|
|
[Group
3] Approximate penalty fee if I break the mortgage contract after 3 years
(e.g. sell the home).
|
If interest rates go up by 1%
|
$3,600
|
$4,000
|
$4,400
|
|
If
interest rates go down by 1%
|
$3,600
|
$6,000
|
$21,000
|
|
[Group
3] Approximate penalty if I break the mortgage contract after 5 years.
Note:
The penalty
calculation changes after 5 years have passed.
|
n/a
|
n/a
|
$4,400
|
Which of the following options would you select?
Matrix to be programmed.
|
|
OPTION
1
|
OPTION
2
|
OPTION
3
|
|
Screen
1 (version A)
|
5-year
variable:
4.00%
($1,578/month)
|
5-year
fixed:
4.50%
($1,660/month)
|
10-year
fixed
5.00%
($1,745/month)
|
|
Screen
2 (version A)
|
5-year
variable:
4.00%
($1,578/month)
|
5-year
fixed:
5.50%
($1,831/month)
|
10-year
fixed
6.75%
($2,055/month)
|
|
Screen
3 (version A)
|
5-year
variable:
4.00%
($1,578/month)
|
5-year
fixed:
5.00%
($1,745/month)
|
10-year
fixed
5.25%
($1,788/month)
|
|
Screen
4 (version A)
|
5-year
variable:
4.00%
($1,578/month)
|
5-year
fixed:
4.00%
($1,578/month)
|
10-year
fixed
4.75%
($1,702/month)
|
|
Screen
1 (version B)
|
5-year
variable:
4.00%
($1,578/month)
|
5-year
fixed:
5.00%
($1,745/month)
|
10-year
fixed
5.50%
($1,831/month)
|
|
Screen
2 (version B)
|
5-year
variable:
4.00%
($1,578/month)
|
5-year
fixed:
4.50%
($1,660/month)
|
10-year
fixed
5.25%
($1,788/month)
|
|
Screen
3 (version B)
|
5-year
variable:
4.00%
($1,578/month)
|
5-year
fixed:
4.00%
($1,578/month)
|
10-year
fixed
5.25%
($1,788/month)
|
|
Screen
4 (version B)
|
5-year
variable:
4.00%
($1,578/month)
|
5-year
fixed:
5.50%
($1,831/month)
|
10-year
fixed
5.75%
($1,875/month)
|
|
Screen
1 (version C)
|
5-year
variable:
4.00%
($1,578/month)
|
5-year
fixed:
4.00%
($1,578/month)
|
10-year
fixed
5.25%
($1,788/month)
|
|
Screen
2 (version C)
|
5-year
variable:
4.00%
($1,578/month)
|
5-year
fixed:
4.50%
($1,660/month)
|
10-year
fixed
5.00%
($1,745/month)
|
|
Screen
3 (version C)
|
5-year
variable:
4.00%
($1,578/month)
|
5-year
fixed:
5.50%
($1,831/month)
|
10-year
fixed
5.75%
($1,875/month)
|
|
Screen
4 (version C)
|
5-year
variable:
4.00%
($1,578/month)
|
5-year
fixed:
5.00%
($1,745/month)
|
10-year
fixed
5.75%
($1,875/month)
|
|
|
Q18
|
All
|
Please suppose that you currently make $50,000 a year. Next
month you are re-locating and your company is offering 5 jobs to employees
like you. Your new salary will start on your first day and remain the same
until you retire. Please tell us which of these job(s) you will definitely
consider. (select all that apply)
|
Job A pays $50,000 a year
until you retire.
|
|
Job B has a chance of
doubling your yearly income to $100,000; but it is equally likely that you
will make 10% less ($45,000).
|
|
Job C has a chance of
doubling your yearly income to $100,000; but it is equally likely that you
will make 20% less ($40,000).
|
|
Job D has a chance of
doubling your yearly income to $100,000; but it is equally likely that you
will make 33% less ($33,333).
|
|
Job E has a chance of doubling
your yearly income to $100,000; but it is equally likely that you will make
50% less ($25,000).
|
|
D1
|
All
|
How
long do you plan to stay in the home you own/ rent? (select one)
|
1 year
|
|
2 years
|
|
3 years
|
|
4 years
|
|
5 years
|
|
6-10 years
|
|
More than 10 years
|
|
D2
|
All
|
With your current monthly household income, can you pay for all
of your monthly expenses? (select one)
|
Yes, and I have more than $200 left to spend
|
|
Yes, and I have less than $200 left to spend
|
|
No, but $200 more would cover all my expenses
|
|
No, and I would need more than $200 to cover all my expenses
|
|
Dont know
|
|
Prefer not to say
|
|
D3
|
All
|
If tomorrow, you had to meet an unexpected expense that is
equivalent to a months income, how much of it would you be able to cover
from money you have readily available either in cash or in an account?
(select one)
|
All of it
|
|
Some of it
|
|
None of it
|
|
Dont know
|
|
D4
|
All
|
If you were to face an unexpected expense that is equivalent to
a months income, how would you cover the costs? (select one)
|
Credit card
|
|
Loan or line of credit
|
|
Emergency savings
|
|
Friends or family
|
|
Other [text box]
|
|
Dont know
|
|
ASK D5 IF (S2=1) TARGET ,1 OTHERWISE SKIP TO D7
|
|
D5
|
Target 1
|
What was the original value of the mortgage loan on your home?
That is, when you first bought your current home, how much money did you need
to borrow? (select one)
|
Under $100,000
|
|
$100,000 to under $150,000
|
|
$150,000 to under $200,000
|
|
$200,000 to under $250,000
|
|
$250,000 to under $300,000
|
|
$300,000 to under $400,000
|
|
$400,000 to under $500,000
|
|
$500,000 to under $600,000
|
|
$600,000 to under $750,000
|
|
$750,000 +
|
|
ASK D6 IF (S2=1) TARGET 1 OTHERWISE SKIP TO D7
|
|
D6
|
Target 1
|
And what is the approximate amount of money you have left on
your mortgage? (select one)
|
Under $50,000
|
|
$50,000 to under $100,000
|
|
$100,000 to under $150,000
|
|
$150,000 to under $200,000
|
|
$200,000 to under $250,000
|
|
$250,000 to under $300,000
|
|
$300,000 to under $400,000
|
|
$400,000 to under $500,000
|
|
$500,000 to under $600,000
|
|
$600,000 +
|
|
Dont know
|
|
D7
|
All
|
What is the highest level of education that you have completed?
(select one)
|
Grade 8 or less
|
|
Some high school
|
|
High school diploma or equivalent
|
|
Registered Apprenticeship or other trades certificate or diploma
|
|
College, CEGEP or other non-university certificate or diploma
|
|
University certificate of diploma below bachelors level
|
|
Bachelors degree
|
|
Post graduate degree above bachelors level
|
|
Prefer not to answer
|
|
D8
|
All
|
Which of the following categories best describes your total
household income? That is, the total income of all persons in your household
combined, before taxes. (select one)
|
Under $20,000
|
|
$20,000 to just under $40,000
|
|
$40,000 to just under $60,000
|
|
$60,000 to just under $80,000
|
|
$80,000 to just under $100,000
|
|
$100,000 to just under $150,000
|
|
$150,000 and above
|
|
Prefer not to answer
|
|
D10
|
All
|
Number of adult household members (including yourself)
|
1
2
3
4
5+
|
|
D11
|
All
|
Number of children (under 18) in household
|
0
1
2
3
4
5+
|
Thank you for your time.
Partial
least squares (PLS) is a well-known predictive regression technique. It
is a technique that reduces the predictors to a smaller set of components and
performs least squares regression on these components, instead of on the
original data. PLS was chosen primarily as a mean of locating latent
variables or factors that explain variance both in the predictors and
responses. It is often a preferred technique for analysis because it can handle
many independent variables, instances where predictors display strong
multicollinearity, and when there are more predictors than observations. These
properties come from its ability to reduce dimension in data and to project
input variables into latent factors or dimensions.
While PLS
is a good exploratory and predictive technique, thresholds and cut-offs on PLS
results should be applied because of its low power to filter out variables of
minor causal importance.
The other
advantages of PLS include: the ability to model multiple dependents (via projecting
them to latent factors); robustness in the face of data noise and missing data;
and creating independent latent factors directly on the basis of cross-products
involving the response variable(s), making for stronger predictions.
Disadvantages of PLS include: greater difficulty of interpreting the loadings
of the independent latent variables (which are based on cross-product relations
with the response variables, not based on covariances among the manifest
independents as in common factor analysis); and because the distributional
properties of estimates are not known, significance cannot be assessed.
Overall,
the mix of advantages and disadvantages means PLS is favoured as a predictive
technique or as an exploratory analysis in providing an overall understanding
of the structure of relationships in the data.
It is good
at detecting weak signals even when much stronger signals and noise are present
in the data. The technique is helpful in informing researchers about all of the
possible ways respondents arrived at their ratings or responses given for all
the dependent variables in the analysis. It lists the most important patterns
of responses given for independent variables each resulting in its own pattern
of responses given for dependent variable(s). Therefore, where the goal is to
understand the nature of relationships in the data overall or verify if any
specific predictor(s) could be more important in any combination with other
predictors even for a portion of sample, then PLS regression is an excellent
choice.
In this
study, PLS was run on each of the four main interest rate scenarios:
normal, flat, steep, inverted. Each model was run 3 times: among the
total sample, among mortgage holders, and among all others (non-mortgage
holders).
The following
variables were included in the model.
-
Level
of risk aversion
-
Suitable
mortgage length
-
Household
income
-
Financial
stress
-
Length
of time planning to stay in the home your current own or rent
-
Relative
mortgage value
-
Disclosure
-
Current
Mortgage Term
-
Current
Mortgage Type
-
Likelihood
to consider a mortgage term longer than 5 years
-
Agree/Disagree
[I think interest rates will be higher in 5 years than they are today.]
-
Agree/Disagree
[I would be more comfortable having my interest rate fixed for as long as
possible to avoid the risk of it increasing.]
-
Agree/Disagree
[It important to me that my mortgage payments are consistent over the term and
do not change.]
-
Agree/Disagree
[I am knowledgeable about mortgages.]
-
Agree/Disagree
[The major banks encourage mortgages with terms of 5 years or less.]
-
Agree/Disagree
[The longer the mortgage terms the harder it is to qualify.]
-
Agree/Disagree
[The longer the mortgage term the more expensive it is to break the mortgage
contract.]
-
Agree/Disagree
[Id be afraid of missing out on a potential decrease in interest rates if I
locked into a mortgage longer than 5 years.]
-
Agree/Disagree
[Avoiding the hassle of having to renew my mortgage often is appealing to me.]
-
Agree/Disagree
[I have a hard time imagining what life will be like in 10 years.]
-
Agree/Disagree
[I would feel anxious to be locked into a mortgage term longer than 5 years,
even if I had the flexibility to break the contract.]
-
Agree/Disagree
[I know I would regret it if I didnt go with a variable rate mortgage or
shorter fixed mortgage because it gives me more flexibility.]
-
Age
-
Education
-
Toronto
or Vancouver compared with other locations
The
results showed a similar outcome or picture of the latent factors that
positively influence the probability of choosing the 10-year fixed rate option
across each of the 4 runs: normal, flat, steep, inverted and across each sample
group: total, mortgage holders and non-mortgage holders.
After
applying cut-off thresholds on PLS results, two latent factors emerged as shown
in the table below. The first creates a picture of lower household
income, higher financial stress and higher risk aversion. The second is
of higher household income and lower financial stress with lower risk aversion.
The table below
depicts two latent factors most linked to the probability of choosing the
10-year fixed mortgage option among the total sample using the normal
scenario. However, the same latent factors emerged for mortgage holders
and all others and across scenarios.
The
figures shown reflect values from -1.00 to +1.00. The closer the figure
is to either end of the range, the stronger the relationship to choosing the
10-year fixed option. The indication of a positive or negative indicates
the direction of the relationship. For example, for financial
stress: Factor 1 is positive (0.196) indicating increased or higher
financial stress and Factor 2 is negative (-0.402) indicating lower financial
stress.
Figure
32
: Partial Least Squares Loadings
|
PLS Loadings
|
|
Variables
|
Latent Factors
|
|
|
FACTOR 1: Lower household income
and higher financial stress
|
FACTOR 2: Higher household income
and lower financial stress
|
|
Financial
stress (computed)
|
0.196
|
-0.402
|
|
Household
income
|
|
Household
income (recoded)
|
-0.328
|
0.233
|
|
Under
$20,000
|
0.233
|
-0.094
|
|
$20,000
to just under $40,000
|
0.166
|
-0.130
|
|
$40,000
to just under $60,000
|
0.079
|
-0.061
|
|
$60,000
to just under $80,000
|
-0.012
|
-0.003
|
|
$80,000
to just under $100,000
|
-0.068
|
0.033
|
|
$100,000
to just under $150,000
|
-0.164
|
0.080
|
|
$150,000
and above
|
-0.145
|
0.161
|
|
Risk aversion
|
|
Risk
averse
|
0.104
|
-0.039
|
|
Low
risk
|
-0.129
|
0.014
|
|
Medium
risk
|
0.004
|
0.001
|
|
High
risk
|
0.038
|
0.041
|
|
Very
high risk
|
0.047
|
0.053
|
|
Suitable
mortgage length
|
|
Less
than 1 year
|
-0.034
|
0.040
|
|
1
year
|
-0.079
|
-0.019
|
|
2
years
|
-0.106
|
-0.041
|
|
3
years
|
-0.132
|
-0.004
|
|
4
years
|
-0.089
|
-0.014
|
|
5
years
|
-0.213
|
-0.042
|
|
6
years
|
0.008
|
-0.016
|
|
7
years
|
0.017
|
-0.007
|
|
8
years
|
0.042
|
0.004
|
|
9
years
|
0.043
|
-0.004
|
|
10
years
|
0.189
|
0.053
|
|
More
than 10 years
|
0.213
|
0.078
|
|
Number of years
planning to stay in home
|
|
1
year
|
0.070
|
-0.035
|
|
2
years
|
0.072
|
-0.017
|
|
3
years
|
0.029
|
-0.036
|
|
4
years
|
0.015
|
-0.026
|
|
5
years
|
-0.033
|
-0.020
|
|
6-10
years
|
-0.065
|
0.008
|
|
Age
|
|
Age=18-24
|
0.107
|
-0.014
|
|
Age=25-34
|
0.007
|
-0.060
|
|
Age=35-44
|
-0.064
|
-0.002
|
|
Age=45-54
|
-0.044
|
-0.031
|
|
Age=55-64+
|
0.009
|
0.049
|
|
Education
|
|
[Highest
education =Grade 8 or less]
|
0.022
|
0.020
|
|
[Highest
education=Some high school]
|
0.076
|
-0.006
|
|
[Highest
education=High school diploma or equivalent]
|
0.105
|
-0.048
|
|
[Highest
education=Registered Apprenticeship or other trades certificate or dip]
|
-0.002
|
-0.053
|
|
[Highest
education=College, CEGEP or other non-university certificate or diploma]
|
0.045
|
-0.011
|
|
[Highest
education=University certificate of diploma below bachelors level]
|
0.006
|
-0.008
|
|
[Highest
education=Bachelors degree]
|
-0.125
|
0.039
|
|
[Highest
education=Post graduate degree above bachelors level]
|
-0.070
|
0.071
|
|
Key Locations
|
|
Toronto
|
0.026
|
0.074
|
|
Vancouver
|
-0.037
|
-0.013
|
|
Disclosure
|
|
No
disclosure
|
-0.005
|
-0.004
|
|
Disclosure
|
0.006
|
-0.024
|
|
Current Expenses
|
|
Can
pay for monthly expenses =Yes, and I have more than $200 left to spend
|
-0.165
|
0.367
|
|
Can
pay for monthly expenses =Yes, and I have less than $200 left to spend
|
0.061
|
-0.232
|
|
Can
pay for monthly expenses =No, but $200 more would cover all my expenses
|
0.085
|
-0.135
|
|
Unexpected
Expenses
|
|
If
you had an unexpected expense equivalent to a month's income, how much can
you cover =All of it
|
-0.126
|
0.391
|
|
If
you had an unexpected expense equivalent to a month's income, how much can
you cover =Some of it
|
0.029
|
-0.273
|
|
Likelihood to
Consider Mortgage Term Longer than 5 Years (absent interest rate)
|
|
Stated
likelihood to consider mortgage term longer than 5 years =Almost certainly
|
0.231
|
0.121
|
|
Stated
likelihood to consider mortgage term longer than 5 years =Likely
|
0.132
|
-0.034
|
|
Stated
likelihood to consider mortgage term longer than 5 years =Possible
|
-0.038
|
-0.054
|
|
Stated
likelihood to consider mortgage term longer than 5 years =Unlikely
|
-0.199
|
-0.012
|
|
Stated
likelihood to consider mortgage term longer than 5 years =Very Unlikely
|
-0.126
|
0.033
|
|
Knowledge and
Attitudes of Longer-Term Mortgages
|
|
I
think interest rates will be higher in 5 years than they are today.
|
0.127
|
0.067
|
|
I
would be more comfortable having my interest rate fixed for as long as
possible to avoid the risk of it increasing.
|
0.233
|
0.077
|
|
It
important to me that my mortgage payments are consistent over the term and do
not change.
|
0.179
|
0.032
|
|
The
major banks encourage mortgages with terms of 5 years or less.
|
-0.050
|
-0.035
|
|
The
longer the mortgage terms the harder it is to qualify.
|
0.071
|
-0.047
|
|
The
longer the mortgage term the more expensive it is to break the mortgage
contract.
|
-0.021
|
-0.024
|
|
Id
be afraid of missing out on a potential decrease in interest rates if I
locked into a mortgage longer than 5 years.
|
-0.066
|
-0.145
|
|
Avoiding
the hassle of having to renew my mortgage often is appealing to me.
|
0.177
|
0.037
|
|
I
have a hard time imagining what life will be like in 10 years.
|
0.044
|
-0.130
|
|
I
would feel anxious to be locked into a mortgage term longer than 5 years,
even if I had the flexibility to break the contract.
|
-0.037
|
-0.119
|
|
I
know I would regret it if I didnt go with a variable rate mortgage or
shorter fixed mortgage because it gives me more flexibility.
|
-0.023
|
-0.111
|
Figure 33: The
response rate and how it was calculated
|
Response
rate Calculation
|
Number of respondents
|
Percentage
|
|
Invalid
cases
|
85
|
|
|
Unresolved
(U)
|
24794
|
|
|
In-scope
non-responding units (IS)
|
983
|
|
|
Responding
units (R )
|
6059
|
|
|
Participation
rate / response rate = R / (U + IS + R)
|
|
19%
|
INTRODUCTION [10 MINUTES]
Explain to participants:
-
The role of
moderator is to ask questions, timekeeper, objective/no special interest
-
The length of
the session (1 and 2 hours)
-
Taping of the
discussion, one-way mirror and colleagues viewing in back room
-
Results are
confidential and reported all together/individuals are not
identified/participation is voluntary
-
Role of
participants: not expected to be experts, no need to agree with each
other, speak openly and frankly about opinions and remember that there are
no wrong answers
-
Get
participants to introduce themselves and their occupation/hobbies etc...
WARM UP: Information needs and sources [20 MINUTES]
-
Id like us
to start off by talking about real estate purchases and specifically
purchasing a home.
-
What are some
of the things you consider when thinking of purchasing a home? [ MODERATOR
LISTEN FOR REFERENCES TO MORTAGES/LENDERS/INTEREST RATES ETC if not
mentioned prompt with What about financing considerations/mortgages etc?
-
How much do
you know about mortgages and the various options you as a borrower have
when it comes to deciding on a specific type of mortgage? Lets assume
for a second that I know very little if anything about them what would
you tell me? What do I need to know about them?
HANDOUT #1
OK Im going to have you complete a short exercise. I would
like you to answer the following questions to the best of your ability please
dont worry about using technical language here I want you to provide me with
your understanding of each of these terms using your OWN words.
-
What does it
mean for a mortgage to have a fixed interest rate?
-
What does it
mean for a mortgage to have a variable interest rate?
-
When I say
the word AMORTIZATION what comes to mind? What does that mean?
-
When I say
the word TERM what comes to mind? What does that mean?
OK now Id like you to share your answers with me? Lets do
a quick once around again no one expects you to be subject matter experts
here so please dont feel intimidated about sharing your answers.
Definitions:
-
Amortization
:
The amortization period is the length of time it takes to pay off a
mortgage in full. Amortization can range from just a few months to 25
years or longer.
-
Term
:
The mortgage term is the length of time your mortgage contract will be in
effect. This includes everything your mortgage contract outlines,
including the interest rate. Terms can range from just a few months to five
years or longer.
INFORMATION SOURCES
-
And what
sources of information do you consider/trust when looking for mortgage
related information OR which mortgage option would work best for
you? Where do you go to get answers to your questions?
-
Why this source
rather than others?
-
Are there any
difficulties getting the most up to date mortgage related information? /
Are there any difficulties finding mortgage related information you
understand and trust? Why?
-
Lets talk a
bit more about online information what sources specifically, if any,
would you consult online and why would you be more confident of this
source than others?
-
Are you aware
of the different term options offered by lenders? How did you get
information on multiple term options?
FACTORS THAT MOTIVATE BORROWERS TO CHOOSE LONGER-TERM
MORTGAGES. [60 MINUTES]
[ASSUMING THEY HAVE MENTIONED MORTAGES SHORT TERM VS.
LONGER TERM]
Many of you mentioned the term of the mortgage you apply
for. Why is this a consideration? What mortgage terms are offered by financial
institutions?
HANDOUT #2 [RED/GREEN EXERCISE]
Id like you to take a few minutes to read the document Im
currently handing out As you read it with your red pen Id like you to
underline anything and everything that you dont understand could be
words/terminology, or ideas or otherwise. With the green pen please underline
words, terminology, ideas that are clear and easy for you to understand/ not
confusing.
For the next few questions, we will be asking you
questions regarding mortgage terms. The mortgage term can vary between a few
months and longer, like 5 years, 10 years and maybe even longer. We have
classified the mortgage term in 2 categories:
1.
Short
term mortgage: 5 years or less
2.
Long
term mortgages: more than 5 years
-
Did you learn
anything new here? What specifically did you learn?
[IN THEIR OWN WORDS]
-
If you had to
describe to me what the major differences/advantages and drawbacks are
between short-term (a mortgage term of 5 years or less) and long-term (a mortgage
term of more than 5 years) what would you say?
BENEFITS OF LTMs
IM GOING TO PRESENT 3 POSSIBLE SCENARIOS and Id like to
hear your thoughts on each:
SCENARIO #1:
You are shopping for a mortgage In this case you have two
options:
Option #1 you can opt for a 5-year fixed rate mortgage at
an interest rate of 5.24% OR
Option #2 you could decide to go with a 10-year fixed rate
mortgage at an interest rate of 6.60%.
Which of the two options would you opt for? What makes you
say that? What factors influence your decision to go one way or the other?
SCENARIO #2,
You are shopping for a mortgage In this case you have two
options:
Option #1 you can opt for a 5-year fixed rate mortgage at
an interest rate of 5.24% OR
Option #2 you could decide to go with a 7-year fixed rate
mortgage at an interest rate of 5.68%.
Which of the two options would you opt for? What makes you
say that? What factors influence your decision to go one way or the other?
SCENARIO #3
You are shopping for a mortgage In this case you have two
options:
Option #1 you can opt for a 5-year variable rate mortgage
at an interest rate of 4.1% OR
Option #2 you could decide to go with a 5 year fixed rate
mortgage at an interest rate of 5.24%
Which of the two options would you opt for? What makes you
say that? What factors influence your decision to go one way or the other?
MODERATOR - PROMPT WITH FOLLOWING AS APPROPRIATE
Predictable interest rates:
-
What about
cost certainty
that is the idea that you can choose to lock in
your interest rates for a longer period of time? Do you see this as a
benefit or a drawback? What are the advantages that come with this type of
approach? What are some of the drawbacks? [PROBE ON GUARDING AGAINST
POTENTIAL INTEREST RATE HIKES.]
Costs associated with longer-term mortgages:
-
What are some
of the
cost considerations
that might affect your decision to opt
for a longer-term mortgage (more than 5 years) vs. a shorter-term (5 years
or less) mortgage? Are LTMs more expensive for you the borrower than STMs?
What makes you say that? Do you think financial institutions would rather
you opt for an LTM or a STM? Why is that?
Threshold for risk:
-
Does locking
in a mortgage interest rate for a longer term, justify a higher interest
rate? Why is that? How much higher could the interest rate be for you to
be comfortable paying for the additional security?
Are there any additional benefits that come with long-term
mortgages beyond what has been mentioned thus far?
DRAWBACKS OF LTMs
OK Id like us to spend the next little while focusing on
some of the factors that might prevent you from considering a mortgage term
longer than 5 years. Lets start by generating a list here:
[MODERATOR FLIP-CHART AS NEEDED AND DISCUSS FULLY AS
NEEDED]
IF NOT SPECIFICALLY MENTIONED PROMPT AS NEEDED WITH:
Financial commitment
-
Possible
uncertainty with personal situation (job, marital status, children,
sickness, move etc.) is this something you had considered? How important
of a consideration is this for you and why do you say that?
Difference in interest rates
from STMS TO
LTMS
-
When it comes
to mortgage interest rates if you must choose between a shorter-term
mortgage with a marginally better interest rate rather than a longer-term
mortgage (say 10-year term) with a slightly higher interest rate - which
would you opt for and what makes you say that?
Fluctuations in interest rates
to the
benefit of STMs vs. LTMs
i.e. the fear of locking-in.
Difficulty in obtaining LTMS
-
Do you think
it is difficult to get a longer-term mortgage with a financial
institution? What makes you say that?
INFORMATION DISCLOSURE [10 MINUTES]
-
Do you feel
like you have sufficient information/knowledge in order to decide on the
best mortgage term for your needs?
-
IF YES,
what are the key things you need to keep in mind when deciding?
IF NO,
what specifically should Banks or financial institutions be telling
you/sharing with you to help make an informed decision?
[MODERATOR LISTEN FOR REFERENCES TO PENALTIES]
MORTGAGE PENALTIES [20 MINUTES]
Id like us to spend our last few minutes together talking
about some specific information you might be interested in when it comes to
mortgages.
When I say mortgage penalties what specifically are we
talking about here? When would you as a borrower incur mortgage penalties?
Under what scenario would this apply?
[MODERATOR LISTEN SPECIFICALLY FOR
REFERENCES TO SELLING HOME BEFORE END OF MORTGAGE TERM]
PENALTIES SCENARIO #1
-
IF NOT
MENTIONED ASK: Ok, so lets assume for a second that Ive purchased a home
and that as part of this purchase I applied for and been approved for a
10-year mortgage. My wife and I then decide we want to purchase a bigger
home. What are some of the options available to me with regards to the
mortgage I have on my existing home?
[MODERATOR LISTEN FOR TRANSFER
MORTAGE TO NEW HOME, PURCHASER TO TAKE OVER MORTAGE, PAY PENALTY]
PENALTIES SCENARIO #2
-
And what
about if we were looking to downsize and simply wanted to sell our home
before the end of the term in order to become renters what options would
we have under this scenario?
CONCLUSION [5 MINUTES]
We have covered a lot of topics today and really appreciate
you taking the time and energy to come down here and give your opinion. Your
input is very important and insightful! Do you have any last thoughts that you
want to share?