Prepared for the Department of Fisheries and Oceans
Supplier: Ekos Research Associates Inc.
Contract Number: FP996-180011/001/CY
Contract Value: $99,934.26
Award Date: November 29, 2018
Delivery Date: March 31, 2019
Registration Number: POR 082-18
For more information on this report, please email AquacultureConsultations.XMAR@dfo-mpo.gc.ca
Ce rapport est aussi disponible en français
Aquaculture in Canada 2019
Final Report
Prepared for the Department of Fisheries and Oceans
Supplier name: Ekos Research Associates Inc.
Date: March 31, 2019
This public opinion research report presents the results of an online survey conducted by Ekos Research Associates Inc. on behalf of Fisheries and Oceans Canada. The research study was conducted with 1665 Canadians between January and February 2019.
Cette publication est aussi disponible en français sous le titre : L’aquaculture au Canada en 2019
This publication may be reproduced for non-commercial purposes only. Prior written permission must be obtained from Public Services and Procurement Canada. For more information on this report, please contact Public Services and Procurement Canada at: tpsgc.questions-questions.pwgsc@tpsgc-pwgsc.gc.ca or at:
Communications Branch
Public Services and Procurement Canada
Portage III Tower A
16A1-11 Laurier Street
Gatineau QC K1A 0S5
Catalogue Number:
Fs23-622/2019E-PDF
International Standard Book Number (ISBN):
978-0-660-32225-4
Related publications (registration number: POR 082-18):
Catalogue Number Fs23-622/2019F-PDF (Final Report, French)
ISBN 978-0-660-08694-1
© Her Majesty the Queen in Right of Canada, as represented by the Minister of Public Works and Government Services, 2019
Ekos Research Associates
Contact: Will Daley
Ottawa Office
359 Kent Street, Suite 300
Ottawa, Ontario
K2P 0R6
Tel: (613) 235 7215
Fax: (613) 235 8498
E-mail: pobox@ekos.com
To fulfill the research objectives, Ekos Research Associates conducted n=2,015 surveys among three distinct samples drawn from the Canadian public, as outlined in the table below according to the method of sample selection, sample size and margins of error associated with each sample.[1]
| Audience | Method | Sample Size |
|---|---|---|
| General Public | Online panel | n=1,665 |
| Coastal Communities | Online panel/RDD | n=961 |
| Indigenous Peoples | RDD | n=412 |
The key findings following from the research are summarized below.
Just over half of the general public (52%) say they’ve heard, seen or read something about aquaculture in the past year.
When asked if what they recall hearing, reading or seeing about aquaculture recall was positive or negative, two in three general public respondents (66%) say what they recall was negative.
Despite the fact that most respondents exposed to information about aquaculture recall negative information, support for aquaculture outpaces opposition to it by a significant margin among all three audiences.
When those who support aquaculture were asked, unprompted, why they do so, members of all three audiences most often say it is because aquaculture offers affordable access to seafood for consumers who might otherwise lack access to it. Those opposing aquaculture most often point to two main reasons: because of perceived irresponsible practices by the industry or because of perceived negative effects that aquaculture has on wild fish populations.
Nine in ten Canadians (89%) say it is important for the federal government to inform Canadian consumers about the fish farming and how it is regulated.
When asked what type of information about aquaculture would be most helpful to have to make informed choices when purchasing aquaculture products, the general public say information about the location of the aquaculture site where the product was grown would be most helpful (28%). While one in ten (11%) felt it important to know if the product was produced using sustainable practices and the same number (11%) want information specific to the conditions and practices at fish farm operations where the product was grown.
When asked if they feel they have enough information to make informed choices regarding their consumption of fish, most Canadians say either that they do not have enough information (42%) or don’t know whether or not they have enough information (14%). Fewer than half of the general public (44%) say they do have enough information.
Most Canadians (42%) trust a scientist employed by a university to provide accurate, reliable and unbiased information about aquaculture. In comparison, 10% of Canadians trust a scientist with the Government of Canada to provide that information. Fourteen per cent of Canadians felt that a partnership between the Government of Canada and the aquaculture industry would provide accurate, reliable, unbiased information compared to 3% of Canadians who responded that a representative from the industry could provide this information.
When asked which of several considerations are most important for the government to manage aquaculture in a responsible way, the general public most often say protecting biodiversity and the sustainability of wild fish populations is the most important, followed closely by protecting the environment as the second most important consideration (42%).
When asked what would best demonstrate that the government is managing aquaculture or fish farming in a responsible way, general public respondents were split between publicly sharing health data on farmed fish (51%) and government investment in minimizing the environmental impacts of aquaculture/fish farming (50%).
Over two thirds of Canadians (67%) feel the largest impact of aquaculture is on the economy in communities where the practice occurs. Just under two thirds of Canadians (61%) think there is a large impact on the health of wild fish populations and a similar number (59%) see an impact on the availability of affordable product for consumers.
When asked unprompted what information they look for when buying fish, 16% of the general public say they look for whether fish or shellfish they might buy is wild-caught or farmed. This consideration comes in third place behind freshness (31%) and the origin of the product (22%).
Although just 16% of Canadians say they look for information on whether fish is wild caught or farmed when asked the question without prompting, when asked directly if this is a consideration, nearly two thirds of general public and coastal Canadians (62% each) say it is.
When asked whether they prefer wild-caught or farmed fish, most Canadians say they prefer wild-caught fish (54%), while 37% say they have no preference between the two. Just 5% say they prefer farmed fish to wild-caught fish.
General public respondents who say they prefer wild-caught fish most often say it is because it is more environmentally friendly (27%), healthier (26%), because it has a better flavour (22%) or because it is seen as being higher quality (19%).
When asked which of two terms is more familiar to them, two in three Canadians (68%) say that “fish farming” is more familiar to them than “aquaculture,” which just fewer than one in four (23%) said was the more familiar term. When asked to choose which term they prefer, the general public are divided between the two options with “fish farming” (42%) slightly edging out “aquaculture” (38%) as the preferred term.
The contract value for the POR project is $99,934.26 (including HST).
Supplier Name: Ekos Research Associates
PWGSC Contract Number: FP996-180011/001/CY
Contract Award Date: November 29, 2018
To obtain more information on this study, please e-mail AquacultureConsultations.XMAR@dfo-mpo.gc.ca
This certification is to be submitted with the final report submitted to the Project Authority.
I hereby certify as Senior Officer of Ekos Research Associates Inc. that the deliverables fully comply with the Government of Canada political neutrality requirements outlined in the Communications Policy of the Government of Canada and Procedures for Planning and Contracting Public Opinion Research.
Specifically, the deliverables do not include information on electoral voting intentions, political party preferences, standings with the electorate, or ratings of the performance of a political party or its leaders.
Signed by:
Will Daley
Vice President, Ekos Research Associates
The Department of Fisheries and Oceans is the lead federal regulator for aquaculture in a complex federal-provincial environment, with three distinct regulatory frameworks across Canada. Federal regulatory activities in aquaculture span 7 federal organizations and 12 different pieces of legislation.
Alongside other federal regulators, DFO is participating in the Treasury Board Secretariat’s Regulatory Review, and is exploring options to improve aquaculture’s regulatory framework, as well as other program enhancements. In 2018, the Minister of Fisheries, Oceans and the Canadian Coast Guard announced that the Government of Canada asked Canada’s Chief Science Advisor to lead an Independent Expert Panel on Aquaculture Science to evaluate the department’s use of science in decision making, as well as federal communications concerning aquaculture.
DFO commissioned Ekos Research Associates to conduct public opinion research (POR) to gain insight into how Canadians perceive and what they know about the aquaculture sector in order to inform policy development in this area.
To fulfill the research objectives, EKOS Research Associates conducted survey research among three distinct samples:
The general public interviews were conducted online among a sample drawn from EKOS’ ProbIt panel, a probability-based panel. The samples of coastal and indigenous Canadians were conducted via telephone interviews using targeted RDD sample frames designed to focus on coastal areas (for the coastal communities sample) and on areas with high concentrations of indigenous Canadians.
Fieldwork was conducted between January 16 and February 12, 2019.
A detailed methodology is provided at Appendix A below.
Throughout this report efforts have been made to distinguish which among the three samples are associated with each finding. Within the narrative report, each audience is described as follows:
Instances may occur where the data associated with a given question total to greater (or occasionally less) than 100%. This is typically explained by either rounding or because the question allowed individual respondents to provide multiple answers (as with a question asking them to one or more items on a list).
Percentages are reported in whole numbers for the sake of simplicity; within the underlying data percentages ending with a decimal of .5% have been rounded up to the next whole percent, while decimals of .4% or lower have been rounded down. This occasionally results in reported totals that tally to slightly over or under 100% when using the whole percentages reported.
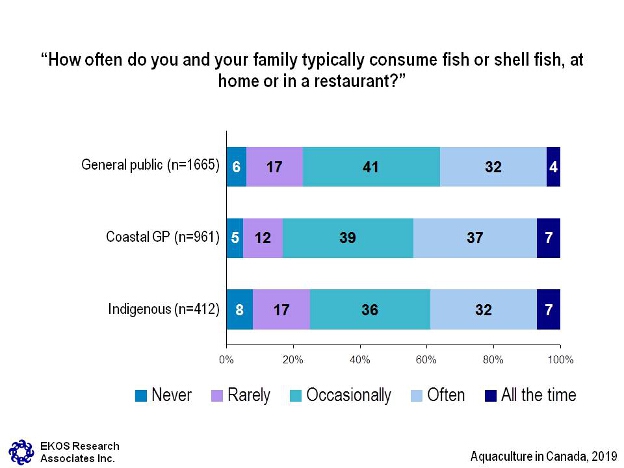
One in three Canadians (32%) say they consume fish often, while four percent say they eat fish all the time. Four in ten Canadians (41%) say they occasionally consume fish or shellfish. Nearly one in five respondents (17%) say they rarely consume fish, and fewer than one in ten (6%) say they never eat it.
Respondents living in coastal communities were slightly more likely to consume fish often (37%) or all the time (7%). Indigenous Peoples report similar consumption patterns. Over one third of Indigenous respondents (39%) report eating fish occasionally, while nearly the same the number (37%) say they consume it often. Similar to those in coastal communities, 7% say they eat fish all the time. Nearly one fifth of respondents eat fish rarely and less than one in ten say they never do.
This chart has three horizontal stacked bars for never, rarely, occasionally, often, and all the time.
Respondents were asked: How often do you and your family typically consume fish or shell fish, at home or in a restaurant? Respondents selected:
Aquaculture in Canada, 2019
When asked what information they look for when buying fish, 16% of the general public say they look for whether fish or shellfish they might buy is wild-caught or farmed. This consideration comes in third place behind freshness (31%) and the origin of the product (22%). This order of priorities is consistent among both coastal and Indigenous Peoples.
| Col1 | General Public | Coastal GP | Indigenous |
|---|---|---|---|
| n= | 1579 | 917 | 377 |
| Freshness | 31% | 34% | 37% |
| Origin, where it comes from, the source (general) | 22% | 16% | 19% |
| Wild vs. farmed, not farmed | 16% | 15% | 13% |
| Type of fish or shellfish, certain fish they do not eat | 12% | 10% | 12% |
| Sustainably harvested/sourced, conservation/environmentally responsible | 12% | 7% | 5% |
| Price, cost | 11% | 10% | 11% |
| Local/regional/Canadian | 10% | 15% | 10% |
| Production/process of fish or shellfish (GMO's, not overly processed/type of process used, use of sulphates, contaminates/mercury levels, mechanical deboning process, nutrition levels/ingredients used, inspection standards...) | 7% | 6% | 4% |
| Does not come from China/Japan/South East Asia (specific) | 2% | 2% | 1% |
| Reputation of company, trust in the brand/supplier | 2% | 3% | 3% |
| Only catch their own/fish themselves | 1% | 2% | 8% |
| Don't know/Not sure | 26% | 22% | 19% |
Only responses with more than 2% across each segment are shown in table
Sixteen percent of Canadians say they look for information on whether fish is wild caught or farmed when asked the question without prompting. However, when asked directly, nearly two thirds of Canadians (62%) say they consider this as a factor compared with 34% who do not. Similar proportions of coastal (62%) and Indigenous Peoples (56%) say they also look for information about whether a product is wild-caught or farmed.
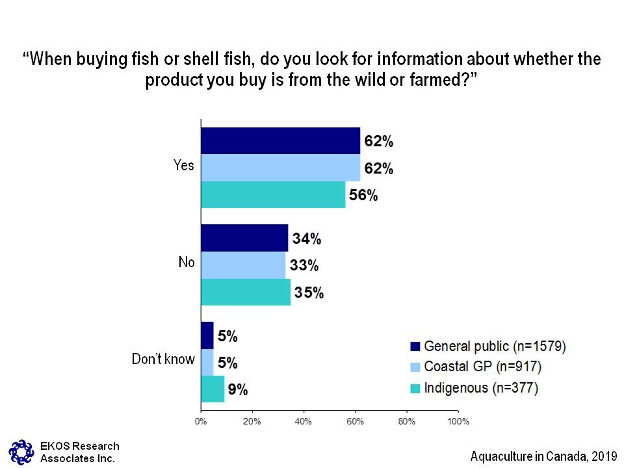
This chart has nine horizontal bars for yes, no, and don’t know, with three bars representing the General public (n=1579), three bars representing Coastal GP (n=917), and three bars representing Indigenous (n=377).
Respondents were asked: When buying fish or shell fish, do you look for information about whether the product you buy is from the wild or farmed? Respondents selected:
Aquaculture in Canada, 2019
When asked whether they prefer wild-caught or farmed fish, most Canadians say they prefer wild-caught fish (54%), while 37% say they have no preference between the two. Just 5% say they prefer farmed fish to wild-caught fish.
Both coastal (65%) and Indigenous respondents (67%) are more likely than the general public to say they prefer wild-caught fish over farmed fish.
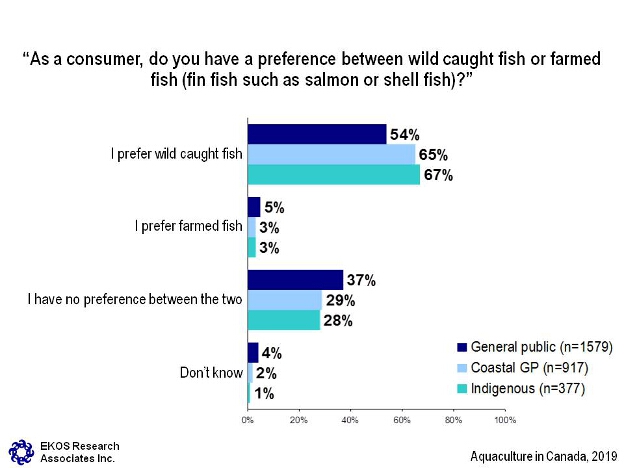
This chart has twelve horizontal bars with four bars representing the General public (n=1579), four bars representing Coastal GP (n=917), and four bars representing Indigenous (n=377).
Respondents were asked: As a consumer, do you have a preference between wild caught fish or farmed fish (fin fish such as salmon or shell fish)? Respondents selected:
Aquaculture in Canada, 2019
Those who stated a preference for either wild-caught or farmed fish were asked which of several possible reasons best explained why they felt this way.
General public respondents who say they prefer wild-caught fish most often say it is because it is more environmentally friendly (27%), healthier (26%), because it has a better flavour (22%) or because it is seen as being higher quality (19%). Both coastal and Indigenous Peoples who prefer wild-caught fish prefer it for the same reasons and in the same order importance as the general public respondents
The few respondents who say they prefer farmed over wild-caught fish tend to say it is because it is more environmentally friendly (general public: 58%; coastal respondents: 51%). Indigenous respondents who prefer farmed fish (only n=11 respondents) were more balanced, citing the environment, health and better flavour as factors.
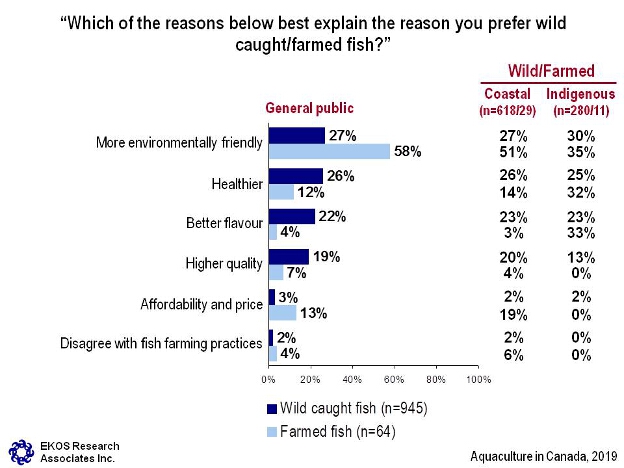
This chart has twelve horizontal bars for wild caught fish (n=945) and farmed fish (n=64), with two columns for Coastal (n=618/29) and Indigenous (n=280/11) for both categories: wild and farmed.
Respondents were asked: Which of the reasons below best explain the reason you prefer wild caught/farmed fish? Respondents selected:
Wild/Farmed: Coastal: wild caught fish (27 per cent); farmed fish (51 per cent);
Indigenous: wild caught fish (30 per cent); farmed fish (35 per cent);
Wild/Farmed: Coastal: wild caught fish (26 per cent); farmed fish (14 per cent);
Indigenous: wild caught fish (25 per cent); farmed fish (32 per cent);
Wild/Farmed: Coastal: wild caught fish (23 per cent); farmed fish (3 per cent);
Indigenous: wild caught fish (23 per cent); farmed fish (33 per cent);
Wild/Farmed: Coastal: wild caught fish (20 per cent); farmed fish (4 per cent);
Indigenous: wild caught fish (13 per cent); farmed fish (0 per cent);
Wild/Farmed: Coastal: wild caught fish (2 per cent); farmed fish (19 per cent);
Indigenous: wild caught fish (2 per cent); farmed fish (0 per cent);
Wild/Farmed: Coastal: wild caught fish (2 per cent); farmed fish (6 per cent);
Indigenous: wild caught fish (0 per cent); farmed fish (0 per cent).
Aquaculture in Canada, 2019
When asked which of two terms is more familiar to them, two in three Canadians (68%) say that “fish farming” is more familiar to them than “aquaculture,” which just fewer than one in four (23%) said was the more familiar term.
Those living in coastal communities (63%) as well as Indigenous respondents (66%) are likewise far more familiar with “fish farming” than with “aquaculture.”
Fewer than one in ten respondents within the general public (6%), coastal (4%) or Indigenous populations (8%) say they are unfamiliar with either term.
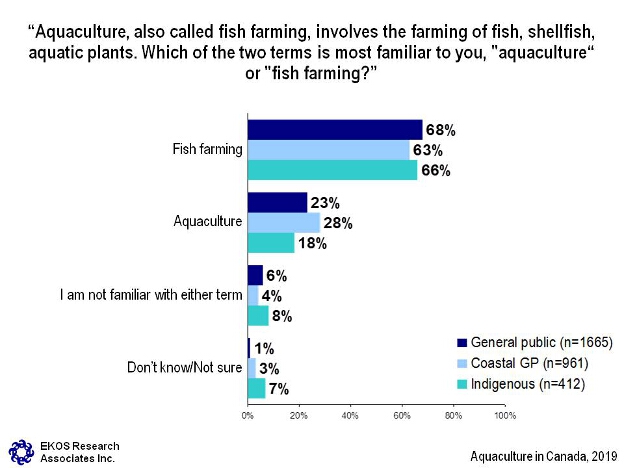
This chart has twelve horizontal bars with four bars representing the General public (n=1665), four bars representing Coastal GP (n=961), and four bars representing Indigenous (n=412).
Respondents were asked: Aquaculture, also called fish farming, involves the farming of fish, shellfish, aquatic plants. Which of the two terms is most familiar to you, "aquaculture"
or "fish farming? Respondents selected:
Aquaculture in Canada, 2019
When asked to choose which term they prefer, Canadians are divided between the two options with “fish farming” (42%) slightly edging out “aquaculture” (38%) as the preferred term.
This split was also reflected among coastal Canadians (42% fish farming vs. 39% aquaculture), while Indigenous Peoples are somewhat more likely to favour “aquaculture” (42%) over fish farming (36%).
About one in five in the general public said they either had no preference (13%) or didn’t know which one they preferred (seven%). Likewise, 19% of coastal Canadians and 22% among Indigenous Peoples also expressed no preference.
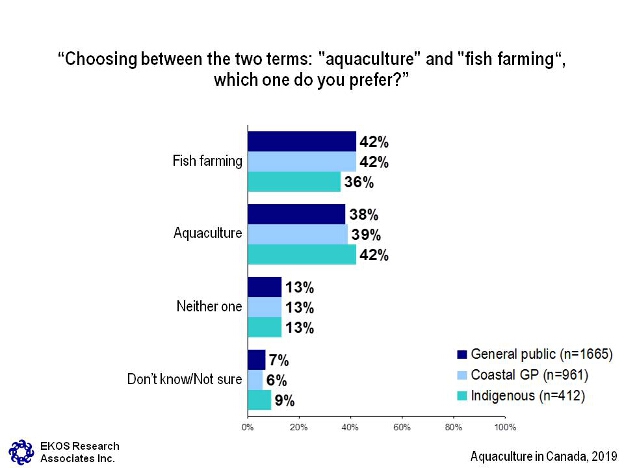
This chart has twelve horizontal bars with four bars representing the General public (n=1665), four bars representing Coastal GP (n=961), and four bars representing Indigenous (n=412).
Respondents were asked: Choosing between the two terms: "aquaculture" and "fish farming",
which one do you prefer? Respondents selected:
Aquaculture in Canada, 2019
Respondents were then asked about their awareness of aquaculture or fish farming in the media. A slim majority of Canadians were aware of aquaculture in the news with 52% of the population indicating they have heard, seen, or read something about it in the past year, while 43% said they did not recall.
Unsurprisingly, those living in coastal communities were far more likely to recall seeing, hearing, or reading something about aquaculture in the past year with 60% indicating they have and only 37% indicating they have not.
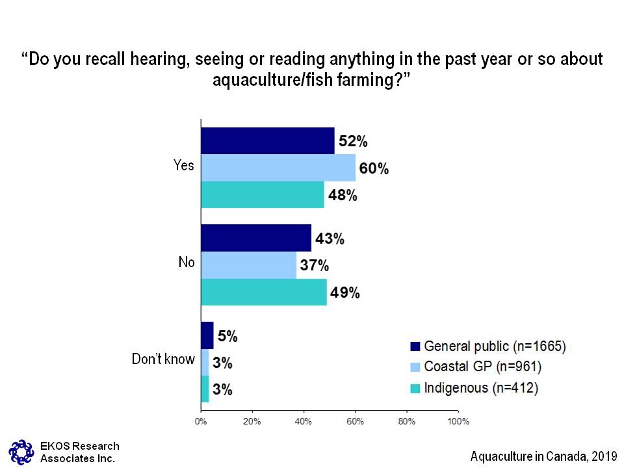
This chart has nine horizontal bars for yes, no, and don’t know, with three bars representing the General public (n=1665), three bars representing Coastal GP (n=961), and three bars representing Indigenous (n=412).
Respondents were asked: Do you recall hearing, seeing or reading anything in the past year or so about aquaculture/fish farming? Respondents selected:
Aquaculture in Canada, 2019
Those who did recall hearing, seeing, or reading something about aquaculture or fish farming were asked whether what they heard, saw, or read was either positive or negative. Most say what they heard was negative. Sixty-six percent of the general public recall hearing, reading or seeing something negative with only 23% saying it was positive.
Likewise, 63% of coastal Canadians say they heard, saw, or read something negative over the past year, while 25% recall something positive.
Indigenous Peoples are no more likely to say they have been exposed to positive information about aquaculture (23%), but they are less likely than others to say what they heard was negative (53%).
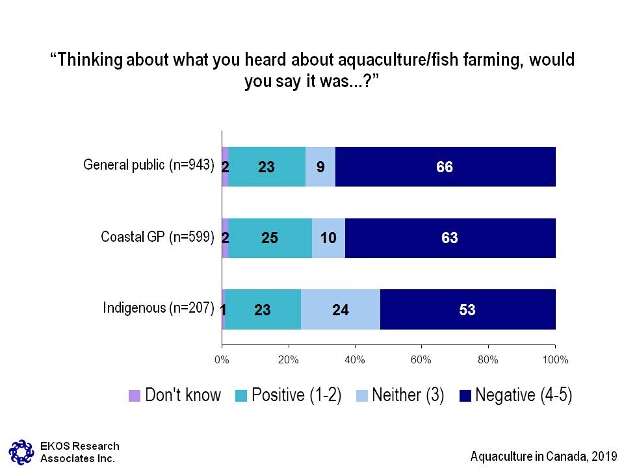
This chart has three horizontal stacked bars, based on a 5-point scale: don’t know, positive (1-2), neither (3), and negative (4-5).
Respondents were asked: Thinking about what you heard about aquaculture/fish farming, would you say it was...? Respondents selected:
Aquaculture in Canada, 2019
When asked, unprompted, to describe the first thing that comes to mind when thinking about aquaculture and fish farming, respondents offer a wide range of responses. Most often, they say simply that aquaculture refers to fish being gown in either open water or in a tank in order to produce food (11%).
| Col1 | General Public | Coastal GP | Indigenous |
|---|---|---|---|
| n= | 1665 | 961 | 412 |
| Fish being grown in a water/ a tank/produced for food | 11% | 11% | 11% |
| Fish farming, aquaculture/pisciculture, farming fish, salmon/mussel farming, cultured seafood | 7% | 7% | 5% |
| Negative effects on wild populations of fish, escape/breeding with wild salmon, transferring disease, invasive species being introduced | 7% | 7% | 6% |
| Diseased/sick fish, sea lice/deformed | 7% | 7% | 4% |
| Irresponsible practices (mismanaged, negative effects on the environment/water ways, pollution) | 7% | 7% | 5% |
| Poor living conditions for fish, dirty water/overcrowded conditions | 6% | 6% | 3% |
| Specific types of fish named (salmon, mussels, oysters...) | 4% | 5% | 4% |
| GMO's used, hormones, fed poison/chemicals | 4% | 4% | 2% |
| Responsible practices, environmentally safe/managed, good for sustainable practices | 4% | 2% | 1% |
| Positive effects on wild populations, repopulating the resource, be released into waters to increase numbers | 3% | 2% | 1% |
| Access to product/variety, meeting supply and demand, access for those without/remote/in land areas | 2% | 3% | 2% |
| Fish (general mention) | 1% | 2% | 3% |
| First nation concerns/conflicts/disagreements, lack of consultation | 1% | 0% | 3% |
| Unnatural, man made, not wild, should be natural/better if freshly caught | 1% | 2% | 3% |
| Fishing outfitters, recreational tourism, camping and fishing at locations | 0% | 0% | 3% |
| Other | 2% | 3% | 9% |
| DK/NR | 17% | 12% | 17% |
Only responses with more than 2% across each segment are shown in table
Respondents were also asked about the extent to which they support or oppose aquaculture or fish farming. Despite the fact that most respondents exposed to information about aquaculture recall negative information, support for aquaculture outpaces opposition to it by a significant margin among all three audiences. The general public (45%) and coastal Canadians (46%) are most likely to express support, followed by Indigenous Peoples (39%).
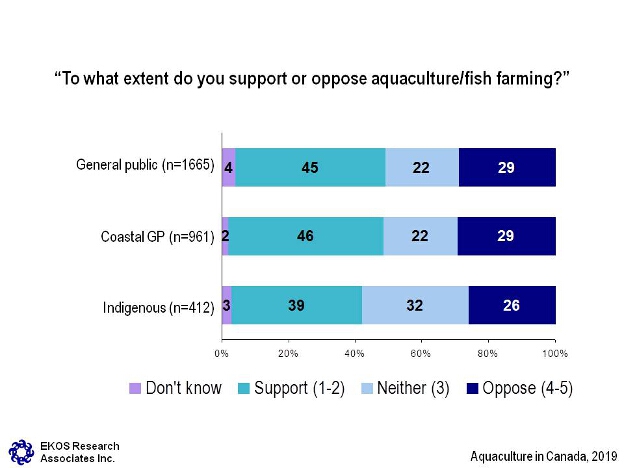
This chart has three horizontal stacked bars, based on a 5-point scale: don’t know, support (1-2), neither (3), and oppose (4-5).
Respondents were asked: To what extent do you support or oppose aquaculture/fish farming? Respondents selected:
Aquaculture in Canada, 2019
When those who support aquaculture were asked, unprompted, why they do so, members of all three audiences most often say it is because aquaculture offers affordable access to seafood for consumers who might otherwise lack access to it. Supporters within the general public also commonly mention positive impacts of aquaculture on wild fish populations (16%).
Those opposing aquaculture most often indicate two main reasons: because of irresponsible practices by the industry or because of negative effects that aquaculture has on wild fish populations. Indigenous Peoples opposing aquaculture also mentioned diseased or sick fish as a reason for opposing aquaculture.
| Why do you support farmed fish? | General Public | Coastal GP | Indigenous |
|---|---|---|---|
| n= | 1239 | 725 | 290 |
| Access to product/variety, meeting supply and demand, affordable access, access for those without/remote/in land areas | 20% | 22% | 18% |
| Positive effects on wild populations, repopulating the resource, be released into waters to increase numbers | 16% | 13% | 6% |
| Responsible practices, environmentally safe/managed, good for sustainable practices | 10% | 7% | 3% |
| When/if properly and effectively, fine with good practices | 8% | 6% | 10% |
| Economy/employment benefits, local jobs | 6% | 6% | 10% |
| Well managed fish production, controlled environment, qualified personnel | 5% | 5% | 4% |
| Good product, healthy/fresh, good taste | 3% | 4% | 4% |
| Why do you oppose farmed fish? | General Public | Coastal GP | Indigenous |
|---|---|---|---|
| n= |
1239 |
725 |
290 |
| Irresponsible practices (mismanaged, negative effects on the environment/water ways, pollution) |
16% | 14% |
14% |
| Negative effects on wild populations of fish, escape/breeding with wild salmon, transferring disease, invasive species being introduced | 13% |
14% |
11% |
| GMO's used, hormones, fed poison/chemicals | 5% |
5% |
3% |
| Unnatural, manmade, not wild, better if natural/caught fresh | 4% |
4% |
3% |
| Should have stricter monitoring/enforcement, need better standards and regulations | 4% |
3% |
2% |
| Unhealthy, bad for your health/not good for you (general mention) | 4% |
4% |
3% |
| Diseased/sick fish, sea lice/deformed |
4% |
5% |
12% |
| Poor living conditions for fish, dirty water/overcrowded conditions | 4% |
3% |
2% |
| Question, practices, how safe to eat/how healthy is it, what are the effects on the environment, conflicting views | 3% |
1% |
1% |
| Land vs. Water infrastructure, preference of land based | 3% | 3% |
1% |
| Would need more information, more info should be available | 3% | 3% | 2% |
| Other | 1% |
2% |
4% |
| DK/NS | 8% | 6% |
10% |
Only responses with more than 2% across each segment are shown in table
Respondents were asked about the impact of aquaculture/fish farming on various areas of concern. They were presented with six statements and asked to rate each on a scale of one to seven where one represents little impact and seven represents a large impact.
Over two thirds of Canadians (67%) feel the largest impact of aquaculture is on the economy in communities where the practice occurs. Just under two thirds of Canadians (61%) think there is a large impact on the health of wild fish populations and a similar number (59%) see an impact on the availability of affordable product for consumers.
These results were largely consistent among those living in coastal communities and Indigenous Peoples. Coastal respondents however, were somewhat less likely to note in impact on affordability (53% compared with 59% in the general population) and Indigenous respondents were less likely to think of economic impacts in communities where fish farming occurs (55% compared with 67% in the general population).
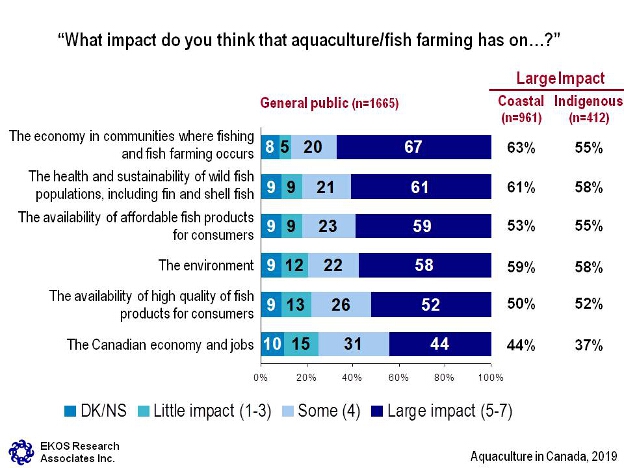
This chart has six horizontal stacked bars for general public (n=1665), based on a 7-point scale: DK/NS, little impact (1-3), some (4), and large impact (5-7), and two columns for large impact: Coastal (n=961) and Indigenous (n=412).
Respondents were asked to: What impact do you think that aquaculture/fish farming has on…? Respondents selected:
Coastal: large impact (63 per cent); Indigenous: large impact (55 per cent);
Coastal: large impact (61 per cent); Indigenous: large impact (58 per cent);
Coastal: large impact (53 per cent); Indigenous: large impact (55 per cent);
Coastal: large impact (59 per cent); Indigenous: large impact (58 per cent);
Coastal: large impact (50 per cent); Indigenous: large impact (52 per cent);
Coastal: large impact (44 per cent); Indigenous: large impact (37 per cent).
Aquaculture in Canada, 2019
When asked about their most and second-most important considerations for the government to manage aquaculture or fish farming in a responsible way, Canadians (50%) selected “Protecting biodiversity and sustainability of wild fish populations” as the most important, followed closely by “Protecting the environment” (42%) as the second-most important consideration.
Similarly, 45% of those living in coastal communities believe protecting biodiversity is the most important consideration, while 40% selected protecting the environment as the second-most important consideration.
Indigenous Peoples also consider protecting biodiversity to be most important factor (35%), while they are more likely than others to say that ensuring the health and quality of food for consumers is the second-most important consideration (40%).
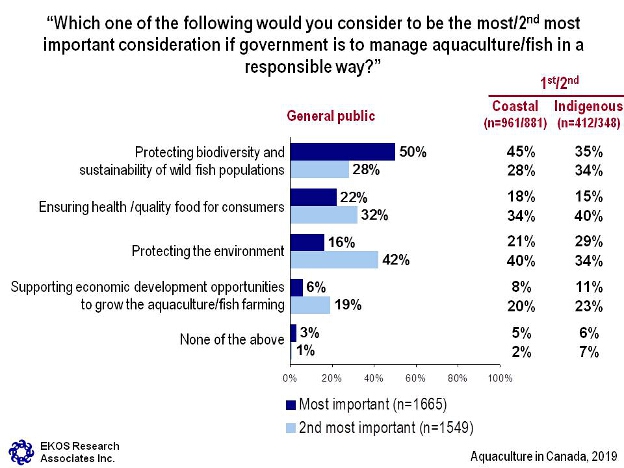
This chart has ten horizontal bars for most important (n=1665) and second most important (n=1549), with two columns for Coastal (n=961/881) and Indigenous (n=412/348) for both categories: first and second most important.
Respondents were asked: Which one of the following would you consider to be the most/2nd most important consideration if government is to manage aquaculture/fish in a responsible way? Respondents selected:
Coastal: most important (45 per cent); second most important (28 per cent);
Indigenous: most important (35 per cent); second most important (34 per cent);
Coastal: most important (18 per cent); second most important (34 per cent);
Indigenous: most important (15 per cent); second most important (40 per cent);
Coastal: most important (21 per cent); second most important (40 per cent);
Indigenous: most important (29 per cent); second most important (34 per cent);
Coastal: most important (8 per cent); second most important (20 per cent);
Indigenous: most important (11 per cent); second most important (23 per cent);
Coastal: most important (5 per cent); second most important (2 per cent);
Indigenous: most important (6 per cent); second most important (7 per cent).
Aquaculture in Canada, 2019
When asked what would best demonstrate that the government is managing aquaculture or fish farming in a responsible way, Canadians are split between publicly sharing health data on farmed fish (51%) and government investment in minimizing the environmental impacts of aquaculture/fish farming (50%) with 17% selecting the former as their first choice and 19% selecting the latter as their first choice. Results are nearly identical among those living in coastal communities as well as for the Indigenous population.
| - | General public | Coastal GP | Indigenous | |||
|---|---|---|---|---|---|---|
| - | Total | First | Total | First | Total | First |
| n= | 1665 | 1665 | 961 | 961 | 412 | 412 |
| Publicly sharing health data on farmed fish | 51% | 17% | 51% | 19% | 50% | 18% |
| Government investment in minimizing the environmental impacts of aquaculture/fish farming | 50% | 19% | 50% | 19% | 53% | 18% |
| New regulations from the Government of Canada to govern aquaculture/fish farming | 47% | 19% | 43% | 17% | 31% | 7% |
| Government investment in innovative practices in aquaculture/fish farming | 37% | 13% | 37% | 13% | 37% | 14% |
| Limiting the number of commercial aquaculture/fish farming licenses | 30% | 9% | 35% | 11% | 31% | 11% |
| Government investment in land-based aquaculture/fish farming | 25% | 9% | 28% | 11% | 39% | 15% |
| Don't know/ Not sure | 10% | 10% | 9% | 9% | 13% | 13% |
Only responses with more than 2% across each segment are shown in table
Respondents were asked where they would expect to find credible information and news related to aquaculture and provided a list of nine options including traditional and online media sources, organizational and government sources, and more personal sources of information such as family or friends. They were encouraged to select as many sources as were applicable.
Of the media sources listed, the majority of Canadians (57%) show a preference for television news. Nearly half of respondents (46%) look to print media and almost one in three (32%) expect to find such information from online news.
From an organizational perspective, the majority of Canadians (55%) expect credible information to come from the federal government. Four in ten (41%) find the provincial government credible for this type of information and a similar number (43%) look to environmental organizations.
Those living in coastal communities have similar expectations of television and online news sources, rating them at 54 and 31% respectively. They were however, somewhat less likely to consider print media as credible (41%) and more likely to look to social media sources (19%).
Coastal residents rate organizational and government credibility on this matter lower than the general population. Less than half of coastal respondents (46%) consider the federal government to be a credible source, and just over one third (36%) feel their provincial governments have credibility for news on this subject. They also rate the credibility of information coming from environmental organizations lower (37% compared with an overall 43%). Coastal Canadians are however more likely to rely on their family and friends for this type of credible information (16% compared with 10% of the general population).
There is also significant variance in the responses from Indigenous Peoples in this area particularly regarding their view on social media and online news. Nearly one in three (30%) of Indigenous respondents consider it a credible source of information on aquaculture compared with only 13% of Canadians at large. Four in ten (42%) respondents consider online news to be credible sources on this issue.
Indigenous respondents also expect less credibility from the federal government as compared with the Canadian public (45% compared with 55%), and more from their family and friends (26% compared with 10%).
| Col1 | General Public | Coastal GP | Indigenous |
|---|---|---|---|
| n= | 1665 | 961 | 412 |
| Television (CBC, Global News, CTV, etc.) | 57% | 54% | 45% |
| Print news sources (Globe and Mail, Maclean's, etc.) | 46% | 41% | 40% |
| Radio news outlets | 28% | 27% | 30% |
| Social media (Facebook, Twitter, Instagram, etc.) | 13% | 19% | 30% |
| Online news sources | 32% | 31% | 42% |
| Environmental organizations | 43% | 37% | 39% |
| The Government of Canada | 55% | 46% | 45% |
| Your provincial/territorial government | 41% | 36% | 41% |
| Friends or family members | 10% | 16% | 26% |
| Other | 7% | 8% | 16% |
| Don't know/ Not sure | 5% | 4% | 5% |
When asked if they feel they have enough information to make informed choices regarding their consumption of fish, Canadians are almost evenly split with four in ten (44%) Canadians saying they do, another 42% saying they do not. One sixth (14%) of Canadians aren’t certain either way.
The majority of those living in coastal communities (54%) are confident they have adequate information compared with 36% who do not. Results are similar among Indigenous Peoples though they are somewhat more certain (58%) they have enough information to make decisions around buying and consuming fish. Under one third (30%) of Indigenous participants do not feel they have adequate information.
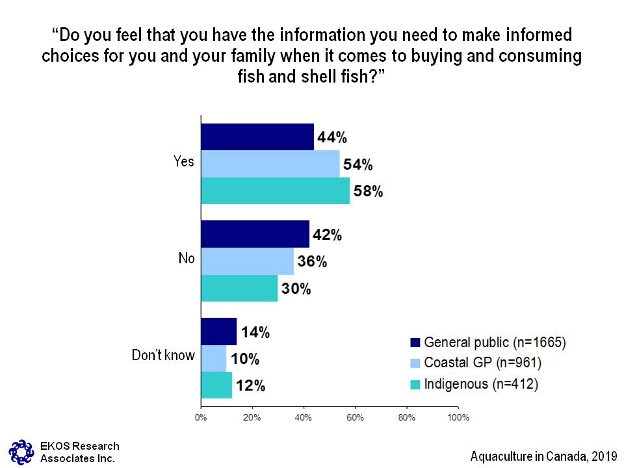
This chart has nine horizontal bars for yes, no, and don’t know, with three bars representing the General public (n=1665), three bars representing Coastal GP (n=961), and three bars representing Indigenous (n=412).
Respondents were asked: Do you feel that you have the information you need to make informed choices for you and your family when it comes to buying and consuming fish and shell fish? Respondents selected:
Aquaculture in Canada, 2019
After assessing the adequacy of the information respondents already have, respondents were asked what type of information would be most helpful to have. No prompts were provided and responses varied greatly. Over one quarter (28%) of Canadians are interested in knowing the origin or source of the fish. One in ten (11%) want to know whether or not the fish was caught or produced using sustainable practices generally and the same number (11%) want information specific to the conditions and practices at fish farm operations. One quarter (25%) of Canadians don’t know what information they may need. Responses were consistent within a few percentage points among Canadians living in coastal communities.
There was more variance among Indigenous respondents. One quarter (24%) are interested to know the origin or source of their fish, similar to Canadians at large. Fewer than one in ten (3%) however are interested in information on environmental sustainability practices and a similar number (5%) interested in conditions and practices of fish farm operations. They show somewhat higher levels of interest in information on whether the fish is wild or farmed (10% compared with 7% of general population), the freshness of the fish (9% compared with 5% of the general population) and information on other safety or health related concerns (8% compared with 5% in the general population).
| Col1 | General Public | Coastal GP | Indigenous |
|---|---|---|---|
| n= | 643 | 324 | 148 |
| Where the fish came from, source/origin | 28% | 27% | 24% |
| Environmental information, whether sustainably produced/caught (general mention) | 11% | 11% | 3% |
| Conditions/practices of fish farms, what methods they use | 11% | 12% | 5% |
| Contamination levels, disease that effects the fish/shellfish, toxicity levels in product, what is considered safe levels | 9% | 9% | 10% |
| Whether it is wild or farmed | 7% | 8% | 10% |
| Reliable/unbiased source of information available, proven/scientific information without bias, accuracy/truth/honesty | 9% | 10% | 8% |
| More/clear information and labelling, more publicity/knowledge relayed | 6% | 7% | 7% |
| Practices/process/methods used (unspecified whether farmed or wild) | 6% | 5% | 7% |
| Fish farms impact on the environment, fish farms impact on sustainability | 6% | 3% | 7% |
| Differences/comparisons between wild and fish farmed products | 5% | 3% | 3% |
| Freshness, when it was caught/packaged | 5% | 6% | 9% |
| Standards/regulations in place, national certification labelling, clear inspection standards enforced | 5% | 5% | 1% |
| Safety information, health impacts, dangers | 5% | 3% | 8% |
| What the fish are fed | 4% | 3% | 1% |
| If GMO's/growth hormones/antibiotics are used | 4% | 5% | 1% |
| Nutrition information | 3% | 5% | 3% |
| Fish farming effects on wild population/fish stocks | 3% | 2% | 3% |
| What type of fish it is, accuracy in labelling, frequently type of fish is mislabelled | 3% | 2% | 2% |
| Quality (general mention) | 1% | 1% | 3% |
| Other | 1% | 1% | 3% |
| DK/NR | 25% | 20% | 27% |
Only responses with more than 2% across each segment are shown in table
Respondents were then asked how important it is for the federal government to inform Canadian consumers about the fish farming industry and its regulations. They were asked to respond on a five-point scale where one is not at all important and five is very important. A strong majority of Canadians (89%) feel this is important information to be shared with the public. Under one in ten (5%) feel it is unimportant and the same number feel it is neither. These results were consistent among coastal and Indigenous Peoples.
This chart has three horizontal stacked bars, based on a 5-point scale: not important (1-2), neither (3), and important (4-5).
Respondents were asked: How important is it for the Government of Canada to tell Canadian consumers about how aquaculture/fish farming is regulated in Canada? Respondents selected:
Aquaculture in Canada, 2019
Respondents were then asked if they are aware of a fish or shellfish farming operation in their area. Unsurprisingly, those living in coastal communities are more likely to be aware one. Thirty-four percent of the coastal population indicated they are aware of a fish farming operation in their area compared to only 18% of the overall Canadian population who said they are.
A majority of Canadians (78%) are not aware of a fish farming operation in their area, while 62% of those living in coastal communities are also unaware.
Similarly, only 32% of the Indigenous sample are aware of a fish farming operation in their area, compared to 65% who indicated they are not.
This chart has nine horizontal bars for yes, no, and don’t know, with three bars representing the General public (n=1665), three bars representing Coastal GP (n=961), and three bars representing Indigenous (n=412).
Respondents were asked: Are you aware of a fish or shell fish farming operation in your area? Respondents selected:
Aquaculture in Canada, 2019
Appendix A: Methodology and Sample Characteristics
To fulfill the research objectives, Ekos Research Associates conducted n=2,015 surveys among three distinct samples drawn from the Canadian public, as outlined in the table below according to the method of sample selection, sample size and margins of error associated with each sample.
| Audience | Method | Sample Size |
|---|---|---|
| General Public | Online panel | n=1,665 |
| Coastal Communities | Online panel/RDD | n=961 |
| Indigenous Peoples | RDD | n=412 |
The fieldwork was conducted between January 18 and February 11, 2019. The margins of error reported above are associated with both online and RDD samples as Ekos’ online panel, ProbIt, is recruited via probability methods.
The response rates associated with both the online and RDD portions of the study are provided below.
| ID | Total |
|---|---|
| Total Numbers Attempted |
21854 |
| Invalid |
10106 |
| NIS, fax/modem, business/non-res. |
236 |
| Unresolved (U) |
8606 |
| Busy, no answer, answering machine |
8606 |
| In-scope - non-responding (IS) |
1818 |
| Language problem |
323 |
| Refusal |
1104 |
| Qualified respondent break-off |
391 |
| In-scope - Responding units (R) |
1088 |
| Completed interviews |
914 |
| Inelligible |
174 |
| Response Rate = R/(U+IS+R) |
9.5% |
The following pages provide a detailed review of the demographic characteristics of respondents to the survey.
| Col1 | General Public | Coastal GP | Indigenous |
|---|---|---|---|
| n= | 1665 | 961 | 412 |
| Male | 48% | 49% | 47% |
| Women | 52% | 51% | 53% |
| Col1 | General Public | Coastal GP | Indigenous |
|---|---|---|---|
| n= | 1665 | 961 | 412 |
| First Nations | 2% | 3% | 58% |
| Métis | 1% | 2% | 39% |
| Inuit | 0% | 1% | 4% |
| None of the above | 95% | 94% | 0% |
| Don't know/Not sure | 2% | 1% | 0% |
| Col1 | General Public | Coastal GP | Indigenous |
|---|---|---|---|
| n= | 1665 | 961 | 412 |
| Yes | 36% | 100% | 61% |
| No | 64% | 0% | 38% |
| Col1 | General Public | Coastal GP | Indigenous |
|---|---|---|---|
| n= | 1665 | 961 | 412 |
| Yes, in a related industry | 1% | 1% | 2% |
| Yes, in the aquaculture/fish farming industry | 0% | 1% | 1% |
| No | 99% | 98% | 97% |
| Col1 | General Public | Coastal GP | Indigenous |
|---|---|---|---|
| n= | 1665 | 961 | 412 |
| Yes, in the aquaculture/fish farming industry | 5% | 11% | 13% |
| Yes, in a related industry | 5% | 10% | 11% |
| No | 89% | 78% | 75% |
| Don't know/ Not sure | 1% | 1% | 1% |
| Col1 | General Public | Coastal GP | Indigenous |
|---|---|---|---|
| n= | 1665 | 961 | 412 |
| English | 81% | 74% | 87% |
| French | 22% | 27% | 6% |
| Another language | 3% | 3% | 19% |
| Col1 | General Public | Coastal GP | Indigenous |
|---|---|---|---|
| n= | 1665 | 961 | 412 |
| One person, living alone | 23% | 22% | 16% |
| Single, with child/children under 18 | 3% | 3% | 7% |
| Single, without children, living with roommate(s) | 3% | 2% | 5% |
| Single, without children, living with family/ parents | 3% | 3% | 9% |
| A married or common-law couple, without children | 33% | 37% | 19% |
| A married or common-law couple, with children <18 | 22% | 20% | 29% |
| A married or common-law couple, with other family (i.e., parents, adult children) | 8% | 9% | 7% |
| Single with adult children | 2% | 1% | 4% |
| Col1 | General Public | Coastal GP | Indigenous |
|---|---|---|---|
| n= | 1665 | 961 | 412 |
| Some high school or less | 5% | 8% | 23% |
| High school graduate | 15% | 19% | 14% |
| Some college | 8% | 6% | 4% |
| Community/Technical college or CEGEP graduate | 21% | 24% | 23% |
| Private college graduate | 3% | 3% | 2% |
| Some university | 10% | 8% | 4% |
| Bachelor's degree | 22% | 18% | 24% |
| Graduate degree | 15% | 12% | 6% |
| Don't know/No response | 1% | 1% | 0% |
| Col1 | General Public | Coastal GP | Indigenous |
|---|---|---|---|
| n= | 1665 | 961 | 412 |
| Self-employed | 11% | 13% | 6% |
| Employed full-time | 40% | 31% | 33% |
| Employed part-time | 6% | 5% | 8% |
| Seasonally employed | 2% | 2% | 8% |
| Term/casual employed | 1% | 0% | 7% |
| Unemployed | 3% | 3% | 8% |
| Student/Attending school full-time | 3% | 2% | 3% |
| Retired | 26% | 37% | 13% |
| Not in work force/Full-time homemaker | 4% | 3% | 5% |
| Disability / sick leave | 4% | 3% | 9% |
| Col1 | General Public | Coastal GP | Indigenous |
|---|---|---|---|
| n= | 1665 | 961 | 412 |
| <$30,000 | 11% | 13% | 24% |
| $30,000-$39,999 | 6% | 9% | 13% |
| $40,000-$49,999 | 7% | 8% | 11% |
| $50,000-$59,999 | 7% | 7% | 4% |
| $60,000-$79,999 | 14% | 12% | 6% |
| $80,000-$99,999 | 12% | 10% | 7% |
| $100,000-$119,999 | 11% | 8% | 7% |
| $120,000 or more | 19% | 15% | 12% |
| Don't know/No response | 13% | 19% | 16% |
| Col1 | General Public | Coastal GP | Indigenous |
|---|---|---|---|
| n= | 1665 | 961 | 412 |
| Under 25 | 3% | 2% | 5% |
| 25-34 years | 25% | 11% | 32% |
| 35-44 years | 16% | 12% | 18% |
| 45-54 years | 18% | 20% | 19% |
| 55-64 years | 17% | 22% | 15% |
| 65-74 years | 14% | 21% | 8% |
| 75 years or older | 7% | 9% | 3% |
| Don't know/No response | 1% | 2% | 1% |
| Col1 | General Public | Coastal GP | Indigenous |
|---|---|---|---|
| n= | 1665 | 961 | 412 |
| Canada | 90% | 90% | 97% |
| United Kingdom, Ireland, Wales, Scotland | 2% | 3% | 0% |
| Other Western Europe (France, Germany, Belgium...) | 1% | 1% | 0% |
| Eastern/Central Europe (Poland, Romania....) | 1% | 1% | 0% |
| Southeast Asia (China, Hong Kong...) | 1% | 1% | 0% |
| Africa (South Africa, Zimbabwe, Nigeria...) | 1% | 0% | 0% |
| Western/Central Asia (Lebanon, Iran, Israel...) | 1% | 0% | 0% |
| U.S.A | 1% | 2% | 1% |
| Northern Europe, Scandinavia (Netherlands, Holland...) | 0% | 1% | 0% |
| DK/NR | 1% | 1% | 1% |
| Col1 | General Public | Coastal GP | Indigenous |
|---|---|---|---|
| n= | 1665 | 961 | 412 |
| A member of a visible minority | 8% | 6% | 37% |
| A person with a disability | 9% | 10% | 19% |
| None | 81% | 82% | 49% |
| Don't know/No response | 3% | 2% | 2% |
Appendix B: English Questionnaire
WINTRO
Thank you for taking the time to complete this survey dealing with current issues of interest to Canadians.
Si vous préférez répondre au sondage en français, veuillez cliquer sur « Français » dans le coin supérieur droit.
Your participation is voluntary and your responses will be kept entirely confidential and anonymous. The survey takes about 15 minutes to complete. This survey is being directed by Ekos Research, and is being administered according to the requirements of the Privacy Act.
To view our privacy policy, click here.
If you require any technical assistance, please contact online@ekos.com.
Your decision on whether or not to participate will not affect any dealings you may have with the Government of Canada.
QGENDR
Are you ...
Male 1
Female 2
QINDIG [1,3]
Do you identify yourself as any of the following?
First Nations 1
Inuit 2
Métis 3
None of the above 98
Don't know/Not sure 99
QCOMM
Do you live in a rural area that is within an hour drive of the ocean or another large body of water (for example the Saint Lawrence Seaway or one of the Great Lakes)?
Yes 1
No 2
Don't know 9
QA1
How often do you and your family typically consume fish or shellfish, at home or in a restaurant?
Never 1
Rarely 2
Occasionally 3
Often 4
All the time 5
Don't know/ Not sure 9
QA2
What information do you look for when buying fish or shellfish?
77 77
Don't know/ Not sure 99
QA3
When buying fish or shellfish, do you look for information about whether the product you buy is from the wild or farmed?
Yes 1
No 2
Don't know 9
QA4
As a consumer, do you have a preference between wild caught fish or farmed fish (fin fish such as salmon or shellfish)?
I prefer wild caught fish 1
I prefer farmed fish 2
I have no preference between the two 3
Don't know 9
QA5
Which of the reasons below best explain the reason you prefer [QA4 = 1]wild caught[QA4 = 2]farmed[Else]wild caught/farmed fish?
Affordability and price 1
Higher quality 2
Better flavour 3
Healthier 4
More environmentally friendly 5
Other (specify) 77
Don't know 99
QB1NEW
Aquaculture, also called fish farming, involves the farming of fish, shellfish, aquatic plants. Which of the two terms is most familiar to you, "aquaculture" or "fish farming?"
Aquaculture 1
Fish farming 2
I'm not familiar with either term 3
I'm more familiar with a different term (please specify) 77
Don't know/ Not sure 99
QB2NEW
Choosing between the two terms - "aquaculture" and "fish farming" – which one do you prefer?
Aquaculture 1
Fish farming 2
Neither one 3
Don't know/ Not sure 99
QB1
For the purposes of this survey, we will use the term [QB2NEW = 1]aquaculture[QB2NEW = 2]fish farming[QB2NEW = 3,99 and half sample]aquaculture[QB2NEW = 3,99 and half sample]fish farming from this point forward.
Do you recall hearing, seeing or reading anything in the past year or so about [QB2NEW = 1]aquaculture[QB2NEW = 2]fish farming[QB2NEW = 3,99 and half sample]aquaculture[QB2NEW = 3,99 and half sample]fish farming?
Yes 1
No 2
Don't know 9
QB2
Thinking about what you heard about [QB2NEW = 1]aquaculture[QB2NEW = 2]fish farming[QB2NEW = 3,99 and half sample]aquaculture[QB2NEW = 3,99 and half sample]fish farming, would you say it was...
Very positive 1
Somewhat positive 2
Somewhat negative 3
Very negative 4
Neither positive nor negative 5
Don't know 9
QB3
When you think about [QB2NEW = 1]aquaculture[QB2NEW = 2]fish farming[QB2NEW = 3,99 and half sample]aquaculture[QB2NEW = 3,99 and half sample]fish farming, what is the first thing that comes to mind?
77 77
Don't know/ Not sure 99
QB4
To what extent do you support or oppose [QB2NEW = 1]aquaculture[QB2NEW = 2]fish farming[QB2NEW = 3,99 and half sample]aquaculture[QB2NEW = 3,99 and half sample]fish farming?
Strongly support 1
Somewhat support 2
Somewhat oppose 3
Strongly oppose 4
No opinion either way 5
Don't know 9
QB5
Support or oppose
Why do you RB5: [QB4 = 1]strongly support?[QB4 = 2]somewhat support?[QB4 = 3]somewhat oppose?[QB4 = 4]strongly oppose?
77 77
Don't know/ Not sure 99
PQC1
What impact do you think that [QB2NEW = 1]aquaculture[QB2NEW = 2]fish farming[QB2NEW = 3,99 and half sample]aquaculture[QB2NEW = 3,99 and half sample]fish farming has on each of the following? Please answer using a scale of 1 to 7, where 1 means "no impact," 4 means "some impact" and 7 means "a major impact."
QC1A
[Mobile devices only]What impact do you think that [QB2NEW = 1]aquaculture[QB2NEW = 2]fish farming[QB2NEW = 3,99 and half sample]aquaculture[QB2NEW = 3,99 and half sample]fish farming has on...
The Canadian economy and jobs
No impact 1 1
2 2
3 3
Some impact 4 4
5 5
6 6
A major impact 7 7
Don't know/ Not sure 99
QC1B
[Mobile devices only]What impact do you think that [QB2NEW = 1]aquaculture[QB2NEW = 2]fish farming[QB2NEW = 3,99 and half sample]aquaculture[QB2NEW = 3,99 and half sample]fish farming has on...
The economy in communities where fishing and fish farming occurs
No impact 1 1
2 2
3 3
Some impact 4 4
5 5
6 6
A major impact 7 7
Don't know/ Not sure 99
QC1C
[Mobile devices only]What impact do you think that [QB2NEW = 1]aquaculture[QB2NEW = 2]fish farming[QB2NEW = 3,99 and half sample]aquaculture[QB2NEW = 3,99 and half sample]fish farming has on...
The availability of affordable fish products for consumers
No impact 1 1
2 2
3 3
Some impact 4 4
5 5
6 6
A major impact 7 7
Don't know/ Not sure 99
QC1D
[Mobile devices only]What impact do you think that [QB2NEW = 1]aquaculture[QB2NEW = 2]fish farming[QB2NEW = 3,99 and half sample]aquaculture[QB2NEW = 3,99 and half sample]fish farming has on...
The availability of high quality of fish products for consumers
No impact 1 1
2 2
3 3
Some impact 4 4
5 5
6 6
A major impact 7 7
Don't know/ Not sure 99
QC1E
[Mobile devices only]What impact do you think that [QB2NEW = 1]aquaculture[QB2NEW = 2]fish farming[QB2NEW = 3,99 and half sample]aquaculture[QB2NEW = 3,99 and half sample]fish farming has on...
The environment
No impact 1 1
2 2
3 3
Some impact 4 4
5 5
6 6
A major impact 7 7
Don't know/ Not sure 99
QC1F
[Mobile devices only]What impact do you think that [QB2NEW = 1]aquaculture[QB2NEW = 2]fish farming[QB2NEW = 3,99 and half sample]aquaculture[QB2NEW = 3,99 and half sample]fish farming has on...
The health and sustainability of wild fish populations, including fin and shellfish
No impact 1 1
2 2
3 3
Some impact 4 4
5 5
6 6
A major impact 7 7
Don't know/ Not sure 99
QD1
Which one of the following would you consider to be the most important consideration if government is to manage [QB2NEW = 1]aquaculture[QB2NEW = 2]fish farming[QB2NEW = 3,99 and half sample]aquaculture[QB2NEW = 3,99 and half sample]fish farming in a responsible way?
Protecting the environment 1
Protecting biodiversity and sustainability of wild fish populations 2
Ensuring health /quality food for consumers 3
Supporting economic development opportunities to grow the [QB2NEW = 1]aquaculture[QB2NEW = 2]fish farming[QB2NEW = 3,99 and half sample]aquaculture[QB2NEW = 3,99 and half sample]fish farming industry 4
None of the above 5
Don't know 9
QD2 [1,3]
Did not chose none or DK
And what would you consider to be the second-most important consideration if government is to manage [QB2NEW = 1]aquaculture[QB2NEW = 2]fish farming[QB2NEW = 3,99 and half sample]aquaculture[QB2NEW = 3,99 and half sample]fish farming in a responsible way?
Please choose all that apply
QD1 not = 1
Protecting the environment 1
QD1 not = 2
Protecting biodiversity and sustainability of wild fish populations 2
QD1 not = 3
Ensuring health /quality food for consumers 3
QD1 not = 4
Supporting economic development opportunities to grow the [QB2NEW = 1]aquaculture[QB2NEW = 2]fish farming[QB2NEW = 3,99 and half sample]aquaculture[QB2NEW = 3,99 and half sample]fish farming industry 4
None of the above 5
Don't know 9
QD3
Which one of the following would best demonstrate to you that the government is managing [QB2NEW = 1]aquaculture[QB2NEW = 2]fish farming[QB2NEW = 3,99 and half sample]aquaculture[QB2NEW = 3,99 and half sample]fish farming in a responsible way?
Government investment in innovative practices in [QB2NEW = 1]aquaculture[QB2NEW = 2]fish farming[QB2NEW = 3,99 and half sample]aquaculture[QB2NEW = 3,99 and half sample]fish farming 1
Government investment in land-based [QB2NEW = 1]aquaculture[QB2NEW = 2]fish farming[QB2NEW = 3,99 and half sample]aquaculture[QB2NEW = 3,99 and half sample]fish farming 2
Government investment in minimizing the environmental impacts of [QB2NEW = 1]aquaculture[QB2NEW = 2]fish farming[QB2NEW = 3,99 and half sample]aquaculture[QB2NEW = 3,99 and half sample]fish farming 3
New regulations from the Government of Canada to govern [QB2NEW = 1]aquaculture[QB2NEW = 2]fish farming[QB2NEW = 3,99 and half sample]aquaculture[QB2NEW = 3,99 and half sample]fish farming 4
Limiting the number of commercial [QB2NEW = 1]aquaculture[QB2NEW = 2]fish farming[QB2NEW = 3,99 and half sample]aquaculture[QB2NEW = 3,99 and half sample]fish farming licenses 5
Publicly sharing health data on farmed fish 6
Other (specify) 77
Don't know/ Not sure 99
QD4 [1,7]
And would any of the other steps be important in demonstrating to you that the government is managing [QB2NEW = 1]aquaculture[QB2NEW = 2]fish farming[QB2NEW = 3,99 and half sample]aquaculture[QB2NEW = 3,99 and half sample]fish farming in a responsible way?
Please choose all that apply
QD3 not = 1
Government investment in innovative practices in [QB2NEW = 1]aquaculture[QB2NEW = 2]fish farming[QB2NEW = 3,99 and half sample]aquaculture[QB2NEW = 3,99 and half sample]fish farming 1
QD3 not = 2
Government investment in land-based [QB2NEW = 1]aquaculture[QB2NEW = 2]fish farming[QB2NEW = 3,99 and half sample]aquaculture[QB2NEW = 3,99 and half sample]fish farming 2
QD3 not = 3
Government investment in minimizing the environmental impacts of [QB2NEW = 1]aquaculture[QB2NEW = 2]fish farming[QB2NEW = 3,99 and half sample]aquaculture[QB2NEW = 3,99 and half sample]fish farming 3
QD3 not = 4
New regulations from the Government of Canada to govern [QB2NEW = 1]aquaculture[QB2NEW = 2]fish farming[QB2NEW = 3,99 and half sample]aquaculture[QB2NEW = 3,99 and half sample]fish farming 4
QD3 not = 5
Limiting the number of commercial [QB2NEW = 1]aquaculture[QB2NEW = 2]fish farming[QB2NEW = 3,99 and half sample]aquaculture[QB2NEW = 3,99 and half sample]fish farming licenses 5
QD3 not = 6
Publicly sharing health data on farmed fish 6
Other (specify) 77
Don't know/ Not sure 99
QE1 [1,10]
Where would you expect to find credible news and information about issues related to [QB2NEW = 1]aquaculture[QB2NEW = 2]fish farming[QB2NEW = 3,99 and half sample]aquaculture[QB2NEW = 3,99 and half sample]fish farming?
Please choose all that apply.
Television (CBC, Global News, CTV, etc.) 1
Print news sources (Globe and Mail, Maclean's, etc.) 2
Radio news outlets 3
Social media (Facebook, Twitter, Instagram, etc.) 4
Online news sources 5
Environmental organizations 6
The Government of Canada 7
Your provincial/territorial government 8
Friends or family members 9
Other 10
Don't know/ Not sure 99
QE2
Which one of the following would you trust the most to give you accurate, reliable and unbiased information about [QB2NEW = 1]aquaculture[QB2NEW = 2]fish farming[QB2NEW = 3,99 and half sample]aquaculture[QB2NEW = 3,99 and half sample]fish farming in Canada?
A scientist with a university 1
A scientist with the Government of Canada 2
A scientist in the [QB2NEW = 1]aquaculture[QB2NEW = 2]fish farming[QB2NEW = 3,99 and half sample]aquaculture[QB2NEW = 3,99 and half sample]fish farming industry 3
Indigenous leader or representative 4
A representative of an environmental organization 5
A representative in the [QB2NEW = 1]aquaculture[QB2NEW = 2]fish farming[QB2NEW = 3,99 and half sample]aquaculture[QB2NEW = 3,99 and half sample]fish farming industry 6
A representative of your provincial/territorial government 7
A partnership between the Government of Canada and the [QB2NEW = 1]aquaculture[QB2NEW = 2]fish farming[QB2NEW = 3,99 and half sample]aquaculture[QB2NEW = 3,99 and half sample]fish farming industry 8
None 9
Don't know 99
QE3 [1,7]
Are there any others whom you would trust to give you accurate, reliable and unbiased information about [QB2NEW = 1]aquaculture[QB2NEW = 2]fish farming[QB2NEW = 3,99 and half sample]aquaculture[QB2NEW = 3,99 and half sample]fish farming in Canada?
Please choose all that apply.
QE2 not = 1
A scientist with a university 1
QE2 not = 2
A scientist with the Government of Canada 2
QE2 not = 3
A scientist in the [QB2NEW = 1]aquaculture[QB2NEW = 2]fish farming[QB2NEW = 3,99 and half sample]aquaculture[QB2NEW = 3,99 and half sample]fish farming industry 3
QE2 not = 4
Indigenous leader or representative 4
QE2 not = 5
A representative of an environmental organization 5
QE2 not = 6
A representative in the [QB2NEW = 1]aquaculture[QB2NEW = 2]fish farming[QB2NEW = 3,99 and half sample]aquaculture[QB2NEW = 3,99 and half sample]fish farming industry 6
QE2 not = 7
A representative of your provincial/territorial government 7
QE2 not = 8
A partnership between the Government of Canada and the [QB2NEW = 1]aquaculture[QB2NEW = 2]fish farming[QB2NEW = 3,99 and half sample]aquaculture[QB2NEW = 3,99 and half sample]fish farming industry 8
None 98
Don't know 99
QE4
Do you feel that you have the information you need to make informed choices for you and your family when it comes to buying and consuming fish and shellfish?
Yes 1
No 2
Don't know 9
QE5
NO
What type of information would be most helpful for you to know?
77 77
Don't know/ Not sure 99
QE6
How important is it for the Government of Canada to tell Canadian consumers about how [QB2NEW = 1]aquaculture[QB2NEW = 2]fish farming[QB2NEW = 3,99 and half sample]aquaculture[QB2NEW = 3,99 and half sample]fish farming is regulated in Canada?
Very important 1
Somewhat important 2
Not very important 3
Not at all important 4
Neither important nor unimportant 5
Don't know/ Not sure 9
QF1
Are you aware of a fish or shellfish farming operation in your area?
Yes 1
No 2
Don't know 9
QF2
Do you work in the [QB2NEW = 1]aquaculture[QB2NEW = 2]fish farming[QB2NEW = 3,99 and half sample]aquaculture[QB2NEW = 3,99 and half sample]fish farming industry or in a related industry?
Yes, in the [QB2NEW = 1]aquaculture[QB2NEW = 2]fish farming[QB2NEW = 3,99 and half sample]aquaculture[QB2NEW = 3,99 and half sample]fish farming industry 1
Yes, in a related industry 2
No 3
Don't know/ Not sure 99
QF3
Do you know of anyone else (a friend or family member) who works in the [QB2NEW = 1]aquaculture[QB2NEW = 2]fish farming[QB2NEW = 3,99 and half sample]aquaculture[QB2NEW = 3,99 and half sample]fish farming industry or in a related industry?
Yes, in the [QB2NEW = 1]aquaculture[QB2NEW = 2]fish farming[QB2NEW = 3,99 and half sample]aquaculture[QB2NEW = 3,99 and half sample]fish farming industry 1
Yes, in a related industry 2
No 3
Don't know/ Not sure 99
QLANG [1,3]
We have a few more questions to be used for statistical purposes only. As a reminder, your responses are confidential.
What language do you regularly use at home?
Please choose all that apply
English 1
French 2
Another language 3
Don't know 9
QHOUS
Which of the following types best describes you and your current household?
One person, living alone 1
Single, with child/children under 18 2
Single, without children, living with roommate(s) 3
Single, without children, living with family/ parents 4
A married or common-law couple, without children 5
A married or common-law couple, with children <18 6
A married or common-law couple, with other family (i.e., parents, adult children) 7
Other (specify) 77
Don't know/No response 99
QEDUC
What is the highest level of schooling that you have completed?
Some high school or less 1
High school graduate 2
Some college 3
Community/Technical college or CEGEP graduate 4
Private college graduate 5
Some university 6
Bachelor's degree 7
Graduate degree 8
Don't know/No response 99
QEMP
Which of the following categories best describes your current employment status?
Self-employed 1
Employed full-time 2
Employed part-time 3
Seasonally employed 4
Term/casual employed 5
Unemployed 6
Student/Attending school full-time 7
Retired 8
Not in work force/Full-time homemaker 9
Disability / sick leave 10
Other (please specify) 77
Don't know/No response 99
QINC
What is your annual household income from all sources before taxes?
<$30,000 1
$30,000-$39,999 2
$40,000-$49,999 3
$50,000-$59,999 4
$60,000-$79,999 5
$80,000-$99,999 6
$100,000-$119,999 7
$120,000 or more 8
Don't know/No response 99
QAGE
In what year were you born?
Note: answer the full year, i.e. 1977 As "1977"
Year 1
No answer 99
QAGE2
No answer
Could we place your age into one of the following general age categories?
Under 25 1
25-34 years 2
35-44 years 3
45-54 years 4
55-64 years 5
65-74 years 6
75 years or older 7
Don't know/No response 99
QBORN
In what country were you born?
Canada 1
Other (Specify) 2
Don't know/Refuse 99
QVISMIN [1,2]
Do you consider yourself to belong to any of the following groups?
Choose all that apply
A member of a visible minority 1
A person with a disability 2
None 98
Don't know/No response 99
THNK
Thank you for your cooperation and time!
Appendix C: French Questionnaire
WINTRO
Nous vous remercions de prendre le temps de répondre au présent sondage portant sur des enjeux qui intéressent actuellement les Canadiens.
If you wish to complete the survey in English, please click 'English' at the top right corner.
Votre participation est volontaire et toutes vos réponses demeureront entièrement confidentielles et anonymes. Il faut environ 15 minutes pour répondre au sondage.
Cliquez ici pour lire notre politique de confidentialité.
Veuillez communiquer avec online@ekos.com pour obtenir de l'aide d'ordre technique.
Votre décision d'y prendre part ou non n'aura aucune répercussion sur les démarches que vous pourriez entreprendre auprès du gouvernement du Canada.
QGENDR
Êtes-vous ...
Homme 1
Femme 2
QINDIG [1,3]
Est-ce que vous estimez faire partie de l'un de groupes suivants?
Premières nations 1
Inuits 2
Métis 3
Aucune de ces réponses 98
Ne sais pas / Incertain(e) 99
QCOMM
Est-ce que vous habitez dans une région rurale qui se trouve dans un rayon d'une heure de l'océan ou d'une autre grande étendue d'eau (par exemple, la voie maritime du Saint-Laurent ou l'un des Grands Lacs)?
Oui 1
Non 2
Ne sais pas 9
QA1
À quelle fréquence votre famille et vous-même consommez-vous habituellement du poisson ou des crustacés, à la maison ou au restaurant?
Jamais 1
Rarement 2
À l'occasion 3
Souvent 4
Tout le temps 5
Ne sais pas / Incertain(e) 9
QA2
Lorsque vous achetez du poisson ou des crustacés, quels sont les renseignements que vous cherchez à obtenir?
77 77
Ne sais pas / Incertain(e) 99
QA3
Lorsque vous achetez du poisson ou des crustacés, est-ce que vous cherchez à obtenir des renseignements pour découvrir si le produit que vous achetez est un poisson sauvage ou un poisson d'élevage?
Oui 1
Non 2
Ne sais pas 9
QA4
Comme consommateur, avez-vous une préférence entre le poisson sauvage et le poisson d'élevage (qu'il s'agisse d'un poisson à nageoires, comme le saumon, ou de crustacés)?
Je préfère le poisson sauvage 1
Je préfère le poisson d'élevage 2
Je n'ai pas de préférence 3
Ne sais pas 9
QA5
Parmi les suivantes, quelle est la raison qui reflète le mieux les motifs pour lesquels vous préférez le [QA4 = 1]poisson sauvage[QA4 = 2]poisson d'élevage[Else]poisson sauvage/poisson d'élevage?
Caractère abordable et prix 1
Qualité supérieure 2
Meilleur goût 3
Plus sain 4
Plus respectueux de l'environnement 5
Autre (préciser) 77
Ne sais pas 99
QB1NEW
L'aquaculture, que l'on appelle aussi élevage de poissons, englobe l'élevage de poissons et de crustacés et la culture de plantes aquatiques. Quelle expression vous est la plus familière, « aquaculture » ou « élevage de poissons »?
Aquaculture 1
Élevage de poissons 2
Je ne connais pas ces expressions 3
Je connais mieux une autre expression (veuillez préciser) 77
Ne sais pas / Incertain(e) 99
QB2NEW
Entre les deux expressions – « aquaculture » et « élevage de poissons » – laquelle préférez-vous?
Aquaculture 1
Élevage de poissons 2
Ni l'une ni l'autre 3
Ne sais pas / Incertain(e) 99
QB1
Dans le cadre du présent sondage, nous utiliserons l'expression [QB2NEW = 1]aquaculture[QB2NEW = 2]élevage de poissons[QB2NEW = 3,99 and half sample]aquaculture[QB2NEW = 3,99 and half sample]élevage de poissons à partir de maintenant.
Est-ce que vous vous souvenez d'avoir entendu, vu ou lu quoi que ce soit, au cours de l'année qui vient de s'écouler, au sujet de l'[QB2NEW = 1]aquaculture[QB2NEW = 2]élevage de poissons[QB2NEW = 3,99 and half sample]aquaculture[QB2NEW = 3,99 and half sample]élevage de poissons?
Oui 1
Non 2
Ne sais pas 9
QB2
En songeant à ce que vous avez entendu au sujet de l'[QB2NEW = 1]aquaculture[QB2NEW = 2]élevage de poissons[QB2NEW = 3,99 and half sample]aquaculture[QB2NEW = 3,99 and half sample]élevage de poissons, diriez-vous que c'était...
Très positif 1
Plutôt positif 2
Plutôt négatif 3
Très négatif 4
Ni positif ni négatif 5
Ne sais pas 9
QB3
Lorsque vous songez à l'[QB2NEW = 1]aquaculture[QB2NEW = 2]élevage de poissons[QB2NEW = 3,99 and half sample]aquaculture[QB2NEW = 3,99 and half sample]élevage de poissons, quelle est la première idée qui vous vient à l'esprit?
77 77
Ne sais pas / Incertain(e) 99
QB4
Dans quelle mesure est-ce que vous appuyez l'[QB2NEW = 1]aquaculture[QB2NEW = 2]élevage de poissons[QB2NEW = 3,99 and half sample]aquaculture[QB2NEW = 3,99 and half sample]élevage de poissons ou vous y opposez?
Vous l'appuyez fortement 1
Vous l'appuyez quelque peu 2
Vous vous y opposez quelque peu 3
Vous vous y opposez fortement 4
Sans opinion à cet égard 5
Ne sais pas 9
QB5
SUPPORT OR OPPOSE
Pourquoi [QB4 = 1]vous l'appuyez fortement?[QB4 = 2]vous l'appuyez quelque peu?[QB4 = 3]vous vous y opposez quelque peu?[QB4 = 4]vous vous y opposez fortement?
77 77
Ne sais pas / Incertain(e) 99
PQC1
Selon vous, quels sont les effets de l'[QB2NEW = 1]aquaculture[QB2NEW = 2]élevage de poissons[QB2NEW = 3,99 and half sample]aquaculture[QB2NEW = 3,99 and half sample]élevage de poissons sur chacun des éléments suivants? Veuillez répondre selon une échelle de sept points, où 1 signifie « aucun effet », 4, « un certain effet » et 7, « un effet majeur ».
QC1A
[Mobile devices only]Selon vous, quels sont les effets de l'[QB2NEW = 1]aquaculture[QB2NEW = 2]élevage de poissons[QB2NEW = 3,99 and half sample]aquaculture[QB2NEW = 3,99 and half sample]élevage de poissons sur...
L'économie et l'emploi au Canada
Aucun effet 1 1
2 2
3 3
Un certain effet 4 4
5 5
6 6
Un effet majeur 7 7
Ne sais pas / Incertain(e) 99
QC1B
[Mobile devices only]Selon vous, quels sont les effets de l'[QB2NEW = 1]aquaculture[QB2NEW = 2]élevage de poissons[QB2NEW = 3,99 and half sample]aquaculture[QB2NEW = 3,99 and half sample]élevage de poissons sur...
L'économie des communautés dans lesquelles des activités de pêche ou d'élevage de poissons se déroulent
Aucun effet 1 1
2 2
3 3
Un certain effet 4 4
5 5
6 6
Un effet majeur 7 7
Ne sais pas / Incertain(e) 99
QC1C
[Mobile devices only]Selon vous, quels sont les effets de l'[QB2NEW = 1]aquaculture[QB2NEW = 2]élevage de poissons[QB2NEW = 3,99 and half sample]aquaculture[QB2NEW = 3,99 and half sample]élevage de poissons sur...
La disponibilité des produits de poissons abordables pour les consommateurs
Aucun effet 1 1
2 2
3 3
Un certain effet 4 4
5 5
6 6
Un effet majeur 7 7
Ne sais pas / Incertain(e) 99
QC1D
[Mobile devices only]Selon vous, quels sont les effets de l'[QB2NEW = 1]aquaculture[QB2NEW = 2]élevage de poissons[QB2NEW = 3,99 and half sample]aquaculture[QB2NEW = 3,99 and half sample]élevage de poissons sur...
La disponibilité des produits de poissons de grande qualité pour les consommateurs
Aucun effet 1 1
2 2
3 3
Un certain effet 4 4
5 5
6 6
Un effet majeur 7 7
Ne sais pas / Incertain(e) 99
QC1E
[Mobile devices only]Selon vous, quels sont les effets de l'[QB2NEW = 1]aquaculture[QB2NEW = 2]élevage de poissons[QB2NEW = 3,99 and half sample]aquaculture[QB2NEW = 3,99 and half sample]élevage de poissons sur...
L'environnement
Aucun effet 1 1
2 2
3 3
Un certain effet 4 4
5 5
6 6
Un effet majeur 7 7
Ne sais pas / Incertain(e) 99
QC1F
[Mobile devices only]Selon vous, quels sont les effets de l'[QB2NEW = 1]aquaculture[QB2NEW = 2]élevage de poissons[QB2NEW = 3,99 and half sample]aquaculture[QB2NEW = 3,99 and half sample]élevage de poissons sur...
La santé et la viabilité des populations de poissons sauvages, y compris les poissons à nageoires et les crustacés
Aucun effet 1 1
2 2
3 3
Un certain effet 4 4
5 5
6 6
Un effet majeur 7 7
Ne sais pas / Incertain(e) 99
QD1
Parmi les aspects suivants, à votre avis, quelle est la question la plus importante à envisager si le gouvernement souhaite gérer l'[QB2NEW = 1]aquaculture[QB2NEW = 2]élevage de poissons[QB2NEW = 3,99 and half sample]aquaculture[QB2NEW = 3,99 and half sample]élevage de poissons de façon responsable?
Protéger l'environnement 1
Protéger la biodiversité et la viabilité des populations de poissons sauvages 2
Veiller à la disponibilité d'aliments sains / de qualité pour les consommateurs 3
Soutenir des occasions de développement économique pour favoriser la croissance de l'industrie 4
Aucune de ces réponses 5
Ne sais pas 9
QD2 [1,3]
Did not chose none or DK
Et selon vous, quelle serait la deuxième question la plus importante pour la gestion responsable de l'[QB2NEW = 1]aquaculture[QB2NEW = 2]élevage de poissons[QB2NEW = 3,99 and half sample]aquaculture[QB2NEW = 3,99 and half sample]élevage de poissons par le gouvernement?
Veuillez choisir toutes les réponses pertinentes
QD1 not = 1
Protéger l'environnement 1
QD1 not = 2
Protéger la biodiversité et la viabilité des populations de poissons sauvages 2
QD1 not = 3
Veiller à la disponibilité d'aliments sains / de qualité pour les consommateurs 3
QD1 not = 4
Soutenir des occasions de développement économique pour favoriser la croissance de l'industrie 4
Aucune de ces réponses 5
Ne sais pas 9
QD3
Parmi les mesures suivantes, quelle est la mesure qui parviendrait le mieux à démontrer que le gouvernement fait une gestion responsable de l'[QB2NEW = 1]aquaculture[QB2NEW = 2]élevage de poissons[QB2NEW = 3,99 and half sample]aquaculture[QB2NEW = 3,99 and half sample]élevage de poissons?
Des investissements gouvernementaux dans des pratiques novatrices d'[QB2NEW = 1]aquaculture[QB2NEW = 2]élevage de poissons[QB2NEW = 3,99 and half sample]aquaculture[QB2NEW = 3,99 and half sample]élevage de poissons 1
Des investissements gouvernementaux pour l'[QB2NEW = 1]aquaculture[QB2NEW = 2]élevage de poissons[QB2NEW = 3,99 and half sample]aquaculture[QB2NEW = 3,99 and half sample]élevage de poissons terrestre 2
Des investissements gouvernementaux pour réduire autant que possible les effets de l'[QB2NEW = 1]aquaculture[QB2NEW = 2]élevage de poissons[QB2NEW = 3,99 and half sample]aquaculture[QB2NEW = 3,99 and half sample]élevage de poissons dans l'environnement 3
Une nouvelle réglementation du gouvernement du Canada pour régir l'[QB2NEW = 1]aquaculture[QB2NEW = 2]élevage de poissons[QB2NEW = 3,99 and half sample]aquaculture[QB2NEW = 3,99 and half sample]élevage de poissons 4
L'établissement de limites de permis d'[QB2NEW = 1]aquaculture[QB2NEW = 2]élevage de poissons[QB2NEW = 3,99 and half sample]aquaculture[QB2NEW = 3,99 and half sample]élevage de poissons commerciale 5
La diffusion publique de données sur la santé liées aux poissons d'élevage 6
Autre (préciser) 77
Ne sais pas / Incertain(e) 99
QD4 [1,7]
Et selon vous, est-ce que l'une ou plusieurs des autres mesures auraient aussi de l'importance pour démontrer que le gouvernement fait une gestion responsable de l'[QB2NEW = 1]aquaculture[QB2NEW = 2]élevage de poissons[QB2NEW = 3,99 and half sample]aquaculture[QB2NEW = 3,99 and half sample]élevage de poissons?
Veuillez choisir toutes les réponses pertinentes
QD3 not = 1
Des investissements gouvernementaux dans des pratiques novatrices d'[QB2NEW = 1]aquaculture[QB2NEW = 2]élevage de poissons[QB2NEW = 3,99 and half sample]aquaculture[QB2NEW = 3,99 and half sample]élevage de poissons 1
QD3 not = 2
Des investissements gouvernementaux pour l'[QB2NEW = 1]aquaculture[QB2NEW = 2]élevage de poissons[QB2NEW = 3,99 and half sample]aquaculture[QB2NEW = 3,99 and half sample]élevage de poissons terrestre 2
QD3 not = 3
Des investissements gouvernementaux pour réduire autant que possible les effets de l'[QB2NEW = 1]aquaculture[QB2NEW = 2]élevage de poissons[QB2NEW = 3,99 and half sample]aquaculture[QB2NEW = 3,99 and half sample]élevage de poissons dans l'environnement 3
QD3 not = 4
Une nouvelle réglementation du gouvernement du Canada pour régir l'[QB2NEW = 1]aquaculture[QB2NEW = 2]élevage de poissons[QB2NEW = 3,99 and half sample]aquaculture[QB2NEW = 3,99 and half sample]élevage de poissons 4
QD3 not = 5
L'établissement de limites de permis d'[QB2NEW = 1]aquaculture[QB2NEW = 2]élevage de poissons[QB2NEW = 3,99 and half sample]aquaculture[QB2NEW = 3,99 and half sample]élevage de poissons commerciale 5
QD3 not = 6
La diffusion publique de données sur la santé liées aux poissons d'élevage 6
Autre (préciser) 77
Ne sais pas / Incertain(e) 99
QE1 [1,10]
Où vous attendriez-vous à trouver des nouvelles et de l'information crédibles au sujet des enjeux liés à l'[QB2NEW = 1]aquaculture[QB2NEW = 2]élevage de poissons[QB2NEW = 3,99 and half sample]aquaculture[QB2NEW = 3,99 and half sample]élevage de poissons?
Veuillez choisir toutes les réponses pertinentes.
Télévision (Radio-Canada, Global News, CTV, etc.) 1
Sources de nouvelles imprimées (Globe and Mail, Maclean's, etc.) 2
Chaînes d'information à la radio 3
Médias sociaux (Facebook, Twitter, Instagram, etc.) 4
Sources de nouvelles en ligne 5
Organismes environnementaux 6
Le gouvernement du Canada 7
Votre gouvernement provincial/territorial 8
Amis ou proches 9
Autre 10
Ne sais pas / Incertain(e) 99
QE2
Parmi les personnes-ressources suivantes, quelle est la personne qui vous inspirerait le plus confiance pour ce qui est de sa capacité à communiquer de l'information exacte, fiable et impartiale au sujet de l'[QB2NEW = 1]aquaculture[QB2NEW = 2]élevage de poissons[QB2NEW = 3,99 and half sample]aquaculture[QB2NEW = 3,99 and half sample]élevage de poissons au Canada?
Un(e) scientifique d'une université 1
Un(e) scientifique du gouvernement du Canada 2
Un(e) scientifique du secteur de l'[QB2NEW = 1]aquaculture[QB2NEW = 2]élevage de poissons[QB2NEW = 3,99 and half sample]aquaculture[QB2NEW = 3,99 and half sample]élevage de poissons 3
Un(e) représentant(e) ou chef de file d'origine autochtone 4
Un(e) représentant(e) d'un organisme environnemental 5
Un(e) représentant(e) du secteur de l'[QB2NEW = 1]aquaculture[QB2NEW = 2]élevage de poissons[QB2NEW = 3,99 and half sample]aquaculture[QB2NEW = 3,99 and half sample]élevage de poissons 6
Un(e) représentant(e) de votre gouvernement provincial/territorial 7
Un partenariat entre le gouvernement du Canada et le secteur de l'[QB2NEW = 1]aquaculture[QB2NEW = 2]élevage de poissons[QB2NEW = 3,99 and half sample]aquaculture[QB2NEW = 3,99 and half sample]élevage de poissons 8
Aucune 9
Ne sais pas 99
QE3 [1,7]
Est-ce qu'il y a d'autres personnes-ressources qui vous inspireraient confiance pour ce qui est de leur capacité à communiquer de l'information exacte, fiable et impartiale au sujet de l'[QB2NEW = 1]aquaculture[QB2NEW = 2]élevage de poissons[QB2NEW = 3,99 and half sample]aquaculture[QB2NEW = 3,99 and half sample]élevage de poissons au Canada?
Veuillez choisir toutes les réponses pertinentes.
QE2 not = 1
Un(e) scientifique d'une université 1
QE2 not = 2
Un(e) scientifique du gouvernement du Canada 2
QE2 not = 3
Un(e) scientifique du secteur de l'[QB2NEW = 1]aquaculture[QB2NEW = 2]élevage de poissons[QB2NEW = 3,99 and half sample]aquaculture[QB2NEW = 3,99 and half sample]élevage de poissons 3
QE2 not = 4
Un(e) représentant(e) ou chef de file d'origine autochtone 4
QE2 not = 5
Un(e) représentant(e) d'un organisme environnemental 5
QE2 not = 6
Un(e) représentant(e) du secteur de l'[QB2NEW = 1]aquaculture[QB2NEW = 2]élevage de poissons[QB2NEW = 3,99 and half sample]aquaculture[QB2NEW = 3,99 and half sample]élevage de poissons 6
QE2 not = 7
Un(e) représentant(e) de votre gouvernement provincial/territorial 7
QE2 not = 8
Un partenariat entre le gouvernement du Canada et le secteur de l'[QB2NEW = 1]aquaculture[QB2NEW = 2]élevage de poissons[QB2NEW = 3,99 and half sample]aquaculture[QB2NEW = 3,99 and half sample]élevage de poissons 8
Aucune 98
Ne sais pas 99
QE4
Selon vous, est-ce que vous avez toute l'information dont vous avez besoin pour faire des choix éclairés, au sujet de l'achat et de la consommation de poissons et de crustacés, pour vous et pour votre famille?
Oui 1
Non 2
Ne sais pas 9
QE5
NO
Quel genre d'information vous serait le plus utile?
77 77
Ne sais pas / Incertain(e) 99
QE6
Dans quelle mesure est-il important que le gouvernement du Canada communique de l'information aux consommateurs canadiens au sujet de la façon dont l'[QB2NEW = 1]aquaculture[QB2NEW = 2]élevage de poissons[QB2NEW = 3,99 and half sample]aquaculture[QB2NEW = 3,99 and half sample]élevage de poissons est réglementée au Canada?
Très important 1
Plutôt important 2
Pas très important 3
Pas du tout important 4
Ni important, ni sans importance 5
Ne sais pas / Incertain(e) 9
QF1
Est-ce que vous connaissez une exploitation d'élevage de poissons ou de crustacés dans votre région?
Oui 1
Non 2
Ne sais pas 9
QF2
Est-ce que vous travaillez dans le secteur de l'[QB2NEW = 1]aquaculture[QB2NEW = 2]élevage de poissons[QB2NEW = 3,99 and half sample]aquaculture[QB2NEW = 3,99 and half sample]élevage de poissons ou dans un secteur d'activité connexe?
Oui, dans le secteur de l'[QB2NEW = 1]aquaculture[QB2NEW = 2]élevage de poissons[QB2NEW = 3,99 and half sample]aquaculture[QB2NEW = 3,99 and half sample]élevage de poissons 1
Oui, dans un secteur connexe 2
Non 3
Ne sais pas / Incertain(e) 99
QF3
Est-ce que vous connaissez quelqu'un (un(e) ami(e), un(e) membre de votre famille) qui travaille dans le secteur de l'[QB2NEW = 1]aquaculture[QB2NEW = 2]élevage de poissons[QB2NEW = 3,99 and half sample]aquaculture[QB2NEW = 3,99 and half sample]élevage de poissons ou dans un secteur d'activité connexe?
Oui, dans le secteur de l'[QB2NEW = 1]aquaculture[QB2NEW = 2]élevage de poissons[QB2NEW = 3,99 and half sample]aquaculture[QB2NEW = 3,99 and half sample]élevage de poissons 1
Oui, dans un secteur connexe 2
Non 3
Ne sais pas / Incertain(e) 99
QLANG [1,3]
Nous aimerons vous poser quelques questions supplémentaires pour les besoins de la compilation de statistiques. N'oubliez pas, vos réponses sont confidentielles.
Quelle est votre principale langue de communication à la maison?
Veuillez choisir toutes les réponses pertinentes
Anglais 1
Français 2
Autre langue 3
Ne sais pas 9
QHOUS
Parmi les énoncés suivants, lequel décrit le mieux votre situation et votre ménage actuellement?
Une personne célibataire vivant seule 1
Une personne célibataire vivant avec un ou des enfants de moins de 18 ans 2
Une personne célibataire sans enfants vivant avec un ou des colocataires 3
Une personne célibataire sans enfants vivant avec des proches ou ses parents 4
Un couple marié ou en union libre sans enfants 5
Un couple marié ou en union libre avec des enfants de moins de 18 ans 6
Un couple marié ou en union libre vivant avec d'autres membres de la famille (p. ex., parents, enfants d'âge adulte) 7
Autre (veuillez préciser) 77
Ne sais pas/Pas de réponse 99
QEDUC
Quel est le plus haut niveau de scolarité que vous ayez achevé?
Études secondaires partielles ou moins 1
Diplôme d'études secondaires 2
Études collégiales partielles 3
Diplôme d'un collège communautaire/technique ou d'un cégep 4
Diplôme d'un collège privé 5
Études universitaires partielles 6
Baccalauréat 7
Diplôme d'études supérieures 8
Ne sais pas/Pas de réponse 99
QEMP
Parmi les catégories suivantes, laquelle représente le mieux votre situation d'emploi ACTUELLE?
Travailleur/travailleuse autonome 1
Employé(e) à temps plein 2
Employé(e) à temps partiel 3
Emploi saisonnier 4
Employé(e) occasionnel(le) ou pour une durée déterminée 5
Sans emploi 6
Étudiant(e)/aux études à plein temps 7
À la retraite 8
En dehors de la population active/personne au foyer à plein temps 9
Congé de maladie ou d'invalidité 10
Autre (veuillez préciser) 77
Ne sais pas/Pas de réponse 99
QINC
Quel est votre revenu annuel FAMILIAL, toutes sources confondues, avant impôt?
< 30 000 $ 1
30 000 $-39 999 $ 2
40 000 $-49 999 $ 3
50 000 $-59 999 $ 4
60 000 $-79 999 $ 5
80 000 $-99 999 $ 6
100 000 $-119 999 $ 7
120 000 $ ou plus 8
Ne sais pas/Pas de réponse 99
QAGE
En quelle année êtes-vous né(e)?
Note : Inscrire l'année au complet (p. ex., pour 1977, indiquer « 1977 »
Année 1
Aucune réponse 99
QAGE2
No answer
Pouvez-vous me dire de laquelle des grandes catégories d'âge suivantes vous faites partie? Avez-vous...
Moins de 25 ans 1
Entre 25 et 34 ans 2
Entre 35 et 44 ans 3
Entre 45 et 54 ans 4
Entre 55 et 64 ans 5
Entre 65 et 74 ans 6
75 ans ou plus 7
Ne sais pas/Pas de réponse 99
QBORN
Dans quel pays êtes-vous né(e)?
Canada 1
Autre (Préciser) 2
Ne sais pas/Refus 99
QVISMIN [1,2]
Est-ce que vous estimez faire partie de l'un des groupes suivants?
Choisir toutes les réponses pertinentes
Membre des minorités visibles 1
Personne ayant une incapacité 2
Aucune 98
Ne sais pas/Pas de réponse 99
THNK
Merci de votre collaboration et du temps que vous nous avez consacré!