Prepared for Global Affairs Canada
Supplier: Ekos Research Associates Inc.
Contract Number: 08170-180411/001/CY
Contract Value: $91,329.71 (including HST)
Award Date: December 28, 2018
Delivery Date: March 30, 2019
Registration Number: POR 092-18
For more information on this report, please contact Public Services and Procurement Canada at tpsgc.questions-questions.pwgsc@tpsgc-pwgsc.gc.ca
Ce rapport est aussi disponible en français
2019 Trade Commissioner Service Client Satisfaction Research
Final Report
Prepared for Global Affairs Canada
Supplier name: Ekos Research Associates Inc.
Date: March 30, 2019
This public opinion research report presents the results of an online survey and one-on one interviews conducted by Ekos Research Associates Inc. on behalf of Global Affairs Canada. The research study was conducted with 2,965 clients of TCS in March 2019.
Cette publication est aussi disponible en français sous le titre . Étude sur la satisfaction de la clientèle du Service des délégués commerciaux du Canada 2019.
This publication may be reproduced for non-commercial purposes only. Prior written permission must be obtained from Public Services and Procurement Canada. For more information on this report, please contact Public Services and Procurement Canada at: tpsgc.questions-questions.pwgsc@tpsgc-pwgsc.gc.ca or at:
Communications Branch
Public Services and Procurement Canada
Portage III Tower A
16A1-11 Laurier Street
Gatineau QC K1A 0S5
Catalogue Number:
FR5-160/2019E-PDF
International Standard Book Number (ISBN):
978-0-660-30926-2
Related publications (registration number: 092-18)
Catalogue Number FR5-160/2019F-PDF- (Final Report, French)
ISBN 978-0-660-30927-9
© Her Majesty the Queen in Right of Canada, as represented by the Minister of Public Works and Government Services, 2019
Ekos Research Associates
Contact: Will Daley
Ottawa Office
359 Kent Street, Suite 300
Ottawa, Ontario
K2P 0R6
Tel: (613) 235 7215
Fax: (613) 235 8498
E-mail: pobox@ekos.com
Consistent with the 2013 research, the findings of this year’s survey research show that a very high proportion of TCS clients are happy with the service and information they have received. Specifically, the results find that at least four in five clients…
Only five percent of respondents or fewer describe themselves as dissatisfied or say they are unlikely to recommend TCS or use its services in the future.
The core aspects of service which clients most often associate with TCS include the belief that staff understands clients’ business (80%), that TCS provides a consistent quality of service (76%) and that they obtained useful intelligence on market conditions from TCS (76%).
Seven in ten respondents say it took a reasonable amount of time to get what they needed from TCS (69%), although timeliness did not emerge as a particularly important or commonly mentioned aspect of TCS service. Few participants pointed to examples of time-sensitive issues compelling them to reach out to TCS. This is reflected in the survey result showing that most participants approach TCS for basic information about doing business in a market (61%) or for support on sales and marketing efforts (48%), but fewer clients say they bring time-sensitive issues to TCS (25%). A similar proportion says that TCS staff provided appropriate contacts when they could not provide direct assistance (66%), and, more generally, that TCS provided contacts to the right people with whom to do business (70%).
Two in three clients say TCS provided them with useful intelligence on local companies and organizations (69%), while just over three in five say they were provided with intelligence that helped solve problems (62%) or intelligence on opportunities and potential difficulties they could encounter (62%).
About four in five clients say they need a great deal or at least some assistance with market intelligence (83%), referrals to international business opportunities or sales leads (79%) and information on local companies or organizations of note (79%).
Other areas where most clients say they need assistance include: getting recommendations on trade fairs or trade missions (72%); getting help with understanding responsible business practices abroad (66%); and, getting referrals to relevant programs and services available to their business (62%).
Half of clients or fewer say they need a great deal or some assistance with advice on planning a trip (51%), referrals to professional service providers (50%), support on intellectual property (IP) rights and dealings with local governments (48%), referrals to technology or R&D-related partnerships (47%) or information on locating financial assistance (45%).
In nearly all of the areas tested, significantly greater proportions of clients this year say they need assistance than in 2013 or 2009. In only two areas tested do similar proportions of clients express a need for assistance as they had in 2013: obtaining information on local companies or organizations (79% vs. 74% in 2013) and support on IP rights and government affairs (48% vs. 46% in 2013). In every other area tested, clients are at least 10 percentage points more likely to say they need assistance this year than in the earlier years’ research.
A sizeable proportion of clients say TCS made a substantial contribution to their efforts in the markets where they requested assistance. In particular, clients say that TCS made important or essential contributions by helping to remove market barriers (44%), helping clients establish revenue-generating partnerships (41%) and with sales through foreign affiliates (39%) as well as the export of goods and services (32% each). In each of the same areas, between half and two in three clients say the activities would have taken longer, cost more money to realize or never would have happened at all without the assistance of the TCS.
Clients were also asked about financial outcomes from activities in markets where they received assistance from TCS. Just over one in four clients who were assisted with new direct investments in their organization say that the assistance TCS provided was worth $500,000 or more in annual revenue (27%). Just over one in five clients who were helped by the removal of a market barrier (22%) or who secured revenue-generating investments from abroad (21%) say that TCS’ assistance was worth at least $500,000 annually.
When asked whether TCS helped them by providing several different types of service, three in five say that TCS helped by providing intelligence and information they could not have received elsewhere (62%). Similar proportions say that TCS helped provide contacts they wouldn’t have otherwise found (58%), explore or expand in a foreign market (58%), improve their organizations’ profile and credibility (58%) and improve their knowledge about the competitive environment in a market (56%).
However, while fewer clients say that TCS helped them in several areas, this does not necessarily mean the assistance TCS provides in the area is not valuable. Indeed, clients were less likely to say that TCS helped them overcome a market barrier (44%). However, we also find that clients who received assistance with the removal of a market barrier were most likely to say that TCS made a major contribution and had a meaningful impact on their efforts, and that the removal of a barrier led to $500,000 or more in annual revenue.
Of a similar nature, we find that clients less often say that TCS helped them address regulatory challenges (35%) or helped on matters related to corporate social responsibility (25%). However, when asked about obstacles to trade their organizations face, a majority of clients say uncertain regulatory requirements pose significant obstacles (54%).
Three in five clients (60%) say they export goods and services to the United States and to other foreign markets. An additional one in five (19%) say they export goods and services to foreign markets other than the United States.
Most participants (60%) identify the United States as one of their three largest export markets. China follows distantly, with 26% mentioning it as a top three market. The United Kingdom ranks in third place, with 16% naming it as one of their top three markets. When asked which markets they expect to grow the fastest in the three years ahead, participants again mention the United States most often (43%), followed distantly by China (26%); meanwhile, India (13%), the United Kingdom (13%) and Mexico (12%) trail further behind.
On a regional basis, the United States again comes out as the largest export market for the greatest number of clients (60%), followed by East and Southeast Asia (40%) and Western Europe. With respect to the fastest growing regions, the United States and East/Southeast Asia are tied, with 43% of respondents mentioning each market among the ones they expect to grow the fastest. Only the United States and Western Europe (with the oldest and best established trading relationships with Canada) are more often identified as large export markets than as markets expected to grow quickly over the next three years.
When asked which of several other trade promotion organizations provided their organizations with support in the past two years, respondents most often said they received support from provincial government bodies (36%) or from the EDC (35%). The Business Development Bank of Canada (BDC) comes in a distant third place (16%), followed by the Canadian Commercial Corporation (CCC) at six percent. Overall, more than two in three clients (68%) say they have received support from trade promotion organizations other than TCS in the past two years.
When asked to rate the effectiveness of TCS services in comparison to other organizations they have received support from, clients are more likely to say that TCS was more effective in terms of the services provided overall (45%) and also in terms of the timeliness of the service provided (45%) than to say the impact of service on their organizations was “neutral” or roughly the same as the services received from other organizations. Few respondents (4% in each case) say that TCS provided services that were less effective than another organization.
From interview participants the TCS is seen in generally positive terms, with the majority of clients describing it as an important, even essential, resource when addressing issues in foreign markets, obtaining assistance in the formative stages of an international foray, and accessing programs and services offered by the Government of Canada and other multi-national government organizations, such as the United Nations and the World Bank Group. In particular, TCS was described as providing helpful information to clients new to international trade who wish to expand their business into the United States. Satisfaction is particularly high among participants who are in the planning or early implementation phase of an international expansion.
Satisfaction varies significantly depending on the degree of specialization of each participant. Those most satisfied with the usefulness of the information they received often export packaged or agricultural goods, while this is less likely among highly specialized firms. Most participants working in specialized markets – particularly those with more experience – expressed understanding, however, that TCS may not be well-acquainted with the specific players or circumstances in their industry. Nonetheless, some held higher expectations, suggesting that TCS should provide more extensive assistance and should have greater expertise with the operations of governments in their markets, particularly on matters related to government contracting and procurement.
TCS staff was generally viewed in positive terms and participants frequently used adjectives like “helpful,” “engaged,” “attentive,” and “genial” or “friendly” in their descriptions. Some participants suggested that the quality of service can vary depending on the experience of individual staff members and emphasized the need for more follow-up.
In general, participants described TCS as offering them credibility in the marketplace (if not necessarily influence), particularly in dealings with foreign governments. In most cases, participants said this was a key benefit for them.
The contract value for the POR project is $91,329.71 (including HST).
Supplier Name: Ekos Research Associates
PWGSC Contract Number: 08170-180411/001/CY
Contract Award Date: December 28, 2018
To obtain more information on this study, please e-mail tpsgc.questions-questions.pwgsc@tpsgc-pwgsc.gc.ca
I hereby certify as Senior Officer of Ekos Research Associates Inc. that the deliverables fully comply with the Government of Canada political neutrality requirements outlined in the Communications Policy of the Government of Canada and Procedures for Planning and Contracting Public Opinion Research.
Specifically, the deliverables do not include information on electoral voting intentions, political party preferences, standings with the electorate, or ratings of the performance of a political party or its leaders.
Signed:
Will Daley
Vice President
Ekos Research Associates, Inc.
The Trade Commissioner Service (TCS) is a service offered by Global Affairs Canada (GAC) which provides expert advice and support to Canadian businesses on matters related to exploring and growing opportunities in foreign markets, improving access to foreign markets, attracting foreign investment, Canadian Direct Investment Abroad, and innovation. With offices across Canada and its presence in more than 150 cities worldwide, TCS helps thousands of businesses each year. The Trade Commissioner Service also works with partner organizations such as provincial or municipal governments or industry associations that deliver programs and services to Canadian businesses.
TCS commissioned Ekos Research Associates to conduct quantitative and qualitative research among its clients. The research was designed to gauge the client satisfaction and more clearly understand the sorts of TCS service and information that clients' value.
Two phases of research were conducted to deliver on the objectives: an initial phase of survey research, followed by key informant interviews with 40 clients who answered the survey.
The survey research was conducted among a sample of n=2965 clients of the TCS who were identified through a contact list maintained by TCS. The survey required 15 minutes to complete (on average) and was conducted between March 5 and March 27, 2019. A response rate of 11.1% was obtained from the initial sample of 26,718 initial samples (see Appendix A for details related to methodology, response rate calculation and potential for response bias). The sample of n=2965 obtains a +/-1.8 percentage point margin of error (calculated at a 95% confidence interval).
The qualitative research consisted of one-on-one interviews conducted by telephone among 40 survey respondents. Each interview took between a half hour and 45 minutes to complete. The questions included in the interview guide were primarily open-ended in nature in order to have the participants clarify key study issues in their own words and drawing on their experiences with TCS. The interview participants were selected from the sample of respondents to reflect a lower level of satisfaction with TCS than was realized in the aggregate results among all respondents.
Please note that while the quantitative data provide a statistically representative means of reporting on the satisfaction and attitudes of TCS clients, the qualitative interviews are a non-random exercise that focusing on discourse and anecdotal experiences which – by design – are not reflective of the entire population.
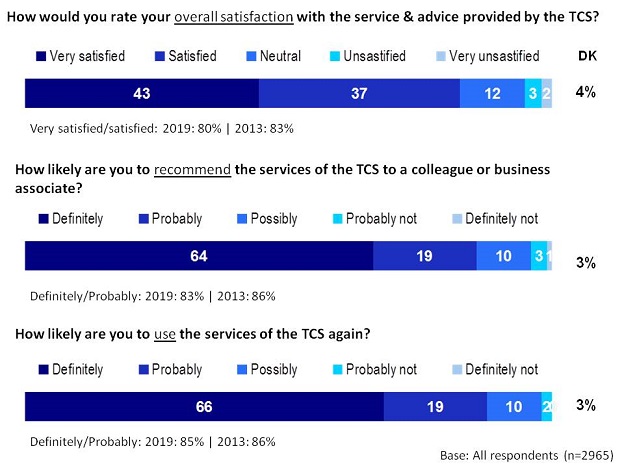
Four in five clients describe themselves as very satisfied or satisfied with the service and advice provided by TCS (80%). Similarly, over four in five say they would definitely or probably recommend TCS to a colleague (83%) and they would definitely or probably use the services of TCS in the future (86%). In each case, just five percent of respondents or fewer describe themselves as dissatisfied or say they are unlikely to recommend TCS or use its services in the future[1]. These findings have changed little in comparison to 2013.
This chart has three horizontal stacked bars for three different questions.
First question: Respondents were asked: How would you rate your overall satisfaction with the service & advice provided by the TCS?
On a scale of very satisfied, satisfied, neutral, unsatisfied, very unsatisfied and on the side DK (Don't know), respondents selected:
Second question: Respondents were asked: How likely are you to recommend the services of the TCS to a colleague or business associate?
On a scale of definitely, probably, possibly, probably not, definitely not, and on the side DK (Don't know), respondents selected:
Third question: Respondents were asked: How likely are you to use the services of the TCS again?
On a scale of definitely, probably, possibly, probably not, definitely not, and on the side DK (Don't know), respondents selected:
Base: All respondents (n=2965)
Those more likely than average to be satisfied ("very satisfied" or "satisfied") with TCS include:
| Col1 | n= | Dissatisfied (1-2) | Satisfied (4-5) |
|---|---|---|---|
| Total 2019 | 2965 | 4% | 80% |
| Total 2013 | 1222 | 6% | 83% |
| Total 2009 | 1449 | 13% | 66% |
| Col1 | n= | Dissatisfied (1-2) | Satisfied (4-5) |
|---|---|---|---|
| Problem solving | 150 | 4% | 83% |
| Qualified contacts | 1121 | 5% | 81% |
| Market potential | 627 | 5% | 81% |
| Preparing for international markets | 392 | 5% | 78% |
| Additional service | 199 | 4% | 84% |
| Referral | 474 | 3% | 79% |
| Col1 | n= | Dissatisfied (1-2) | Satisfied (4-5) |
|---|---|---|---|
| International Business Development | 2714 | 5% | 80% |
| Science, Tech & Information | 206 | 4% | 83% |
| Foreign Direct Investment | 43 | 2% | 88% |
| Col1 | n= | Dissatisfied (1-2) | Satisfied (4-5) |
|---|---|---|---|
| BC | 514 | 4% | 81% |
| Alberta | 334 | 4% | 80% |
| Manitoba/Saskatchewan | 134 | 7% | 79% |
| Ontario | 1014 | 6% | 79% |
| Quebec | 531 | 4% | 79% |
| Atlantic | 256 | 4% | 84% |
| Outside of Canada | 180 | 3% | 86% |
| Col1 | n= | Dissatisfied (1-2) | Satisfied (4-5) |
|---|---|---|---|
| SME | 514 | 5% | 79% |
| Large | 334 | 2% | 87% |
| Partner | 134 | 3% | 86% |
| Col1 | n= | Dissatisfied (1-2) | Satisfied (4-5) |
|---|---|---|---|
| North America | 1404 | 5% | 79% |
| Latin American & Caribbean | 578 | 4% | 83% |
| Western & Eastern Europe | 957 | 5% | 80% |
| African & Middle East | 749 | 5% | 80% |
| South & East Asia | 1049 | 5% | 82% |
| Oceania | 259 | 5% | 78% |
Those more likely than average to say they would recommend TCS to a colleague or business associate include:
Organizations with sales of one billion or more (77%) are less likely to say they would recommend TCS to a colleague or business associate.
| Col1 | n= | Definitely/Probably Not (1-2) | Definitely/Probably (4-5) |
|---|---|---|---|
| Total 2019 | 2965 | 4% | 82% |
| Total 2013 | 1222 | 5% | 86% |
| Total 2009 | 1449 | 8% | 76% |
| Col1 | n= | Definitely/Probably Not (1-2) | Definitely/Probably (4-5) |
|---|---|---|---|
| Problem solving | 150 | 6% | 86% |
| Qualified contacts | 1121 | 4% | 83% |
| Market potential | 627 | 4% | 83% |
| Preparing for international markets | 392 | 5% | 80% |
| Additional service | 199 | 5% | 85% |
| Referral | 474 | 3% | 81% |
| Col1 | n= | Definitely/Probably Not (1-2) | Definitely/Probably (4-5) |
|---|---|---|---|
| International Business Development | 2714 | 4% | 82% |
| Science, Tech & Information | 206 | 3% | 86% |
| Foreign Direct Investment | 43 | 2% | 91% |
| Col1 | n= | Definitely/Probably Not (1-2) | Definitely/Probably (4-5) |
|---|---|---|---|
| BC | 514 | 3% | 83% |
| Alberta | 334 | 2% | 87% |
| Manitoba/Saskatchewan | 134 | 4% | 76% |
| Ontario | 1014 | 6% | 79% |
| Quebec | 531 | 3% | 82% |
| Atlantic | 256 | 4% | 88% |
| Outside of Canada | 180 | 4% | 89% |
| Col1 | n= | Definitely/Probably Not (1-2) | Definitely/Probably (4-5) |
|---|---|---|---|
| SME | 2222 | 5% | 80% |
| Large | 435 | 1% | 88% |
| Partner | 232 | 3% | 91% |
| Col1 | n= | Definitely/Probably Not (1-2) | Definitely/Probably (4-5) |
|---|---|---|---|
| North America | 1404 | 4% | 81% |
| Latin American & Caribbean | 578 | 3% | 85% |
| Western & Eastern Europe | 957 | 5% | 80% |
| African & Middle East | 749 | 4% | 82% |
| South & East Asia | 1049 | 3% | 84% |
| Oceania | 259 | 3% | 78% |
Partner (92%) and large organizations (89%) are more likely than average to say they would use the services of TCS again in the future. This is also true of organizations based in Alberta (89%). Results are otherwise very similar across sub-groups as shown in the following tables.
| Col1 | n= | Definitely/Probably Not (1-2) | Definitely/Probably (4-5) |
|---|---|---|---|
| Total 2019 | 2965 | 2% | 85% |
| Total 2013 | 1222 | 3% | 86% |
| Total 2009 | 1449 | 5% | 81% |
| Col1 | n= | Definitely/Probably Not (1-2) | Definitely/Probably (4-5) |
|---|---|---|---|
| Problem solving | 150 | 3% | 87% |
| Qualified contacts | 1121 | 3% | 85% |
| Market potential | 627 | 2% | 86% |
| Preparing for international markets | 392 | 2% | 83% |
| Additional service | 199 | 3% | 86% |
| Referral | 474 | 2% | 82% |
| Col1 | n= | Definitely/Probably Not (1-2) | Definitely/Probably (4-5) |
|---|---|---|---|
| International Business Development | 2714 | 2% | 84% |
| Science, Tech & Information | 206 | 3% | 86% |
| Foreign Direct Investment | 43 | 2% | 88% |
| Col1 | n= | Definitely/Probably Not (1-2) | Definitely/Probably (4-5) |
|---|---|---|---|
| BC | 514 | 2% | 86% |
| Alberta | 334 | 3% | 89% |
| Manitoba/Saskatchewan | 134 | 1% | 80% |
| Ontario | 1014 | 2% | 83% |
| Quebec | 531 | 3% | 83% |
| Atlantic | 256 | 2% | 87% |
| Outside of Canada | 180 | 3% | 88% |
| Col1 | n= | Definitely/Probably Not (1-2) | Definitely/Probably (4-5) |
|---|---|---|---|
| SME | 2222 | 3% | 83% |
| Large | 435 | 0% | 89% |
| Partner | 232 | 2% | 92% |
| Col1 | n= | Definitely/Probably Not (1-2) | Definitely/Probably (4-5) |
|---|---|---|---|
| North America | 1404 | 2% | 83% |
| Latin American & Caribbean | 578 | 2% | 88% |
| Western & Eastern Europe | 957 | 4% | 83% |
| African & Middle East | 749 | 2% | 84% |
| South & East Asia | 1049 | 2% | 87% |
| Oceania | 259 | 1% | 78% |
Clients were asked whether they agree or disagree with several statements about various aspects of the service provided by TCS. Among these, respondents most often agree that TCS staff demonstrated an understanding of clients' business (80%), that TCS provided a consistent quality of service (76%) and that they obtained useful intelligence on market conditions from TCS (76%). In each case between 9% and 11% provided a neutral response (not shown in chart). Only a small proportion disagreed in terms of staff understanding the business and providing useful intelligence (5%-6%), although 11% disagreed about receiving consistent quality of service. Staff understanding of clients' business is also on par with 2013 results.
Seven in ten respondents say TCS provided contacts to the right people with whom to do business (70%) and it took a reasonable amount of time to get what they needed from TCS (69%). The same proportion say TCS staff provided them with useful intelligence on local companies and organizations (69%). One in ten disagreed that the service took a reasonable amount of time, although only 6% to 7% said the same about staff providing contacts and useful intelligence about local organizations. The turnaround time is also less positive than in 2013 when 77% agreed the time to get service was reasonable.
Two in three clients say TCS provided them with appropriate contacts when unable to provide assistance (66%), while just over three in five say they were provided with intelligence that helped solve problems (62%) or intelligence on opportunities and potential difficulties they could encounter (62%). In each case few disagreed (6% to 7%) although 13% to 18% were neutral in their response.
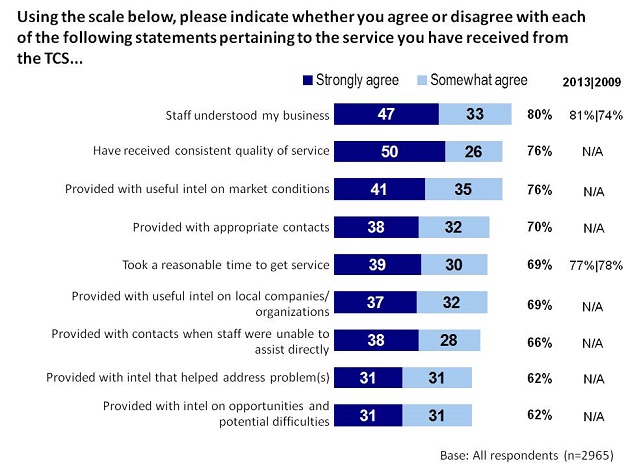
This chart has nine horizontal stacked bars for strongly agree and somewhat agree, with a column for the total of strongly/somewhat agree for 2019 and a second column for the total of strongly/ somewhat agree for 2013/2009.
Respondents were asked to: Using the scale below, please indicate whether you agree or disagree with each of the following statements pertaining to the service you have received from the TCS...? Respondents selected:
Base: All respondents (n=2965)
The following tables outline the significant differences found among the major demographic subgroups. Large businesses (500 employees or more), partner organizations and women-owned businesses are more likely than others to say their experience positively reflected each attribute. Although organizations that employ 500 people or more are often more positive, those with sales of $1 billion or more annually are often less positive.
| More likely than average | Less likely than average |
|---|---|
| Target Market - East/S.E. Asia (74 %) | -- |
Base: All respondents (n=2965) / % Strongly/Somewhat Agree
| More likely than average | Less likely than average |
|---|---|
| Large Organizations (82%) | Canadian Subsidiary Abroad (70%) |
| Woman-owned Businesses (82%) | Sales: $1b+ (64%) |
| --- | TCS Service – Prepare for international markets (71%) |
Base: All respondents (n=2965) / % Strongly/Somewhat Agree
| More likely than average | Less likely than average |
|---|---|
| Business line - Science, Tech. & Innovation (87%) | Sales: $1b+ (70%) |
| Target Market - South Asia (86%) | Partner Institutions (70%) |
| Woman-owned Businesses (85%) | Based in Saskatchewan/Manitoba (68%) |
| Canadian Subsidiary Abroad (82%) | Target Market - East/ S.E. Asia (68%) |
Base: All respondents (n=2965) / % Strongly/Somewhat Agree
| More likely than average | Less likely than average |
|---|---|
| Partner Institutions (77%) | Sales: $1b+ (62%) |
| Business line - Science, Tech. & Innovation (77%) | -- |
| Large Organizations (76%) | -- |
| Target Market - Middle East/N. Africa (76%) | -- |
| Foreign Subsidiary in Canada (76%) | -- |
Base: All respondents (n=2965) / % Strongly/Somewhat Agree
| More likely than average | Less likely than average |
|---|---|
| Partner Institutions (77%) | Target Market - Eastern Europe (64%) |
| -- | TCS service - Prepare for international markets (63%) |
Base: All respondents (n=2965) / % Strongly/Somewhat Agree
| More likely than average | Less likely than average |
|---|---|
| Woman-owned Businesses (78%) | Based in Saskatchewan/Manitoba. (60%) |
| Partner Institutions (77%) | Sales: $1b+ (57%) |
| Based in Atlantic Canada (75%) | -- |
Base: All respondents (n=2965) / % Strongly/Somewhat Agree
| More likely than average | Less likely than average |
|---|---|
| Partner Institutions (70%) | Sales: $5-$25m (57%) |
Base: All respondents (n=2965) / % Strongly/Somewhat Agree
| More likely than average | Less likely than average |
|---|---|
| TCS service - Problem Solving (73%) | TCS service - Prepare for international markets (56%) |
| Woman-owned Businesses (73%) | -- |
| TCS service - Additional service (71%) | -- |
Base: All respondents (n=2965) / % Strongly/Somewhat Agree
| More likely than average | Less likely than average |
|---|---|
| Woman-owned Businesses (73%) | Foreign Subsidiary in Canada (60%) |
| Target Market - South Asia (73%) | Sales: $1b+ (58%) |
Base: All respondents (n=2965) / % Strongly/Somewhat Agree
Clients were asked to describe how much assistance they need in several areas. About four in five clients indicated their need for a great deal or at least some assistance with market intelligence (83%), referrals to international business opportunities or sales leads (79%) and information on local companies or organizations of note (79%).
A second tier of priorities identified by at least three in five clients as areas where they need a great deal or at least some assistance include: recommendations on trade fairs or trade missions (72%); help with understanding responsible business practices abroad (66%); and, referrals to relevant programs and services available to their business (62%).
In a third tier, half to just under half of clients say they need a great deal or some assistance with advice on planning a trip (51%), referrals to professional service providers (50%), support on intellectual property (IP) rights and dealings with local governments (48%), information on locating financial assistance (47%), or referrals to technology or R&D-related partnerships (45%).
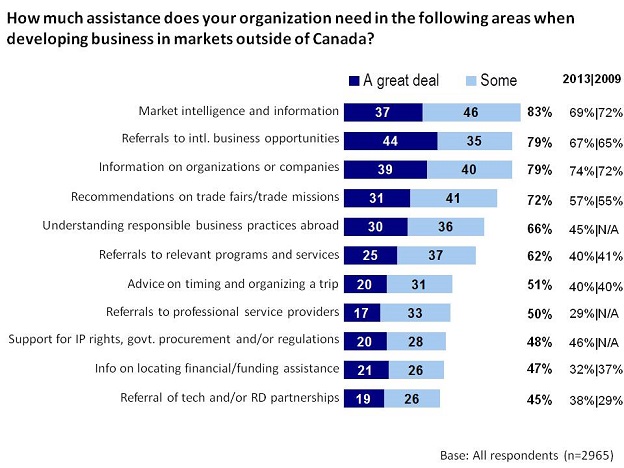
This chart has eleven horizontal stacked bars for a great deal and some, with a column for the total of a great deal/some for 2019 and a second column for the total of a great deal/some for 2013/2009.
Respondents were asked to: How much assistance does your organization need in the following areas when developing business in markets outside of Canada? Respondents selected:
Base: All respondents (n=2965)
In nearly all of the areas tested, significantly greater proportions of clients this year say they need assistance than in 2013 or 2009. There are two exceptions where similar proportions of clients express a need for assistance compared with 2013: obtaining information on local companies or organizations (79% vs. 74% in 2013) and support on IP rights and government affairs (48% vs. 46% in 2013). In every other area tested, clients are at least 10 percentage points more likely to say they need assistance this year than in the previous research.
When asked what compelled them to contact TCS in the past, respondents most often say they contacted TCS to get basic information about doing business in a market (61%). More specifically, about half of respondents say they have approached TCS in the past for assistance with sales and marketing (48%). About three in ten clients say they have approached TCS for information about distribution channels (34%), how to export goods to a market (32%) or for information on services available to companies exporting goods or services (30%). One in four respondents say they have contacted TCS in the past for help with specific, time-sensitive problems they have encountered. Fewer than one in five respondents contacted TCS to promote educational opportunities in Canada (17%), for information on establishing bricks and mortar operations in a market (11%), or for information on licensing or franchising technology (8%)
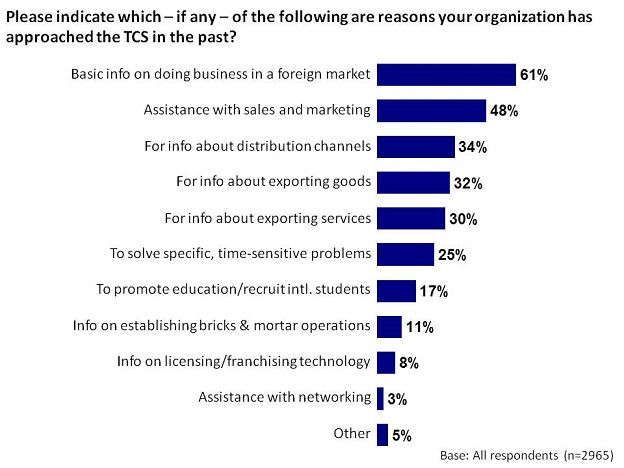
This chart has 11 single horizontal bars.
Respondents were asked: Please indicate which – if any – of the following are reasons your organization has approached the TCS in the past? Respondents selected:
Base: All respondents (n=2965)
Clients most often report that TCS provided assistance in markets where they export goods (34%) or services (31%), or in markets where they maintain a revenue-generating partnership or joint venture (22%). Beyond these three major activities, fewer than one in ten clients say they engaged in several other activities in markets where TCS helped them. One in five respondents say they are not pursuing any activities (at least none of those tested) in markets where they received assistance (21%), or do not know whether they are (5%).
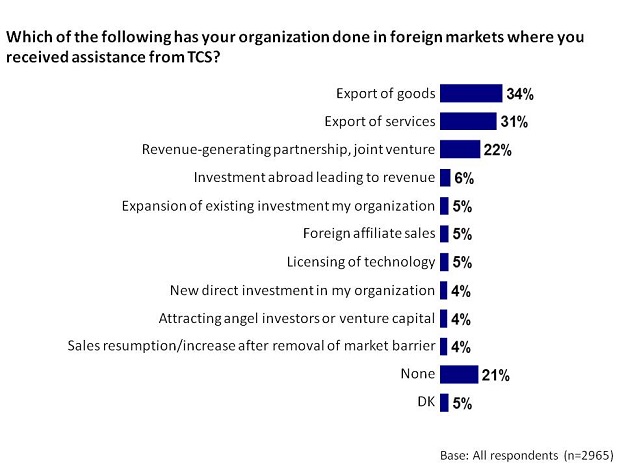
This chart has 12 single horizontal bars.
Respondents were asked: Which of the following has your organization done in foreign markets where you received assistance from TCS? Respondents selected:
Base: All respondents (n=2965)
The tables below highlight the demographic subgroups significantly more or less likely to say they need a great deal or at least some assistance.
| More likely to need assistance | Less likely to need assistance |
|---|---|
| Consultant/Sole Proprietor (89%) | TCS service - Problem Solving (73%) |
| Woman-owned Businesses (88%) | Canadian Subsidiary Abroad (71%) |
Base: All respondents (n=2965) / % who need a “Great deal” or “Some” assistance in each area
| More likely to need assistance | Less likely to need assistance |
|---|---|
| Woman-owned Businesses (90%) | Based in Saskatchewan/Manitoba (71%) |
| Sales - <$1m (87%) | Sales - $1b+ (70%) |
| Consultant/Sole Proprietor (86%) | Target Market - Middle East/N. Africa (68%) |
| Micro-business (less than 10 employees) (85%) | Large Organizations (500 employees+) (65%) |
| -- | TCS service - Problem Solving (62%) |
Base: All respondents (n=2965) / % who need a “Great deal” or “Some” assistance in each area
| More likely to need assistance | Less likely to need assistance |
|---|---|
| Based in Alberta (85%) | Large Organizations (500 employees+) (74%) |
| Consultant/Sole Proprietor (86%) | Target Market - East/ S.E. Asia (73%) |
| Sales - <$1m (85%) | -- |
| -- | TCS service - Problem Solving (70%) |
| -- | Canadian Subsidiary Abroad (63%) |
Base: All respondents (n=2965) / % who need a “Great deal” or “Some” assistance in each area
| More likely to need assistance | Less likely to need assistance |
|---|---|
| Consultant/Sole Proprietor (81%) | Large Organizations (500 employees+) (67%) |
| Based in Atlantic Canada (78%) or Alberta (77%) | Sales - $1b+ (66%) |
| Sales - <$1m (78%) | Target Market - East/ S.E. Asia (66%) |
| -- | TCS business line - Science, Tech. & Innovation (65%) |
| -- | Canadian Subsidiary Abroad (61%) |
| -- | Foreign Subsidiary in Canada (59%) |
| -- | TCS service - Problem Solving (53%) |
Base: All respondents (n=2965) / % who need a “Great deal” or “Some” assistance in each area
| More likely to need assistance | Less likely to need assistance |
|---|---|
| Based in Alberta (74%) | Target Market - Middle East/N. Africa (59%) |
| Sales - <$1m (72%) | Large Organizations (500 employees+) (60%) |
| Target Market - Eastern Europe (72%) | Target Market - East/ S.E. Asia (59%) |
| -- | Sales - $1b+ (58%) |
| -- | TCS service - Problem Solving (57%) |
| -- | Foreign Subsidiary in Canada (57%) |
| -- | Canadian Subsidiary Abroad (55%) |
Base: All respondents (n=2965) / % who need a “Great deal” or “Some” assistance in each area
| More likely to need assistance | Less likely to need assistance |
|---|---|
| Micro-business (less than 10 employees) (70%) | Sales - $25m-$1b (54%) |
| TCS business line - Science, Tech. & Innovation (69%) | Target Market - East/ S.E. Asia (54%) |
| TCS service - Prep for international markets (68%) | -- |
| Based in Quebec (68%) | TCS service - Problem Solving (51%) |
| -- | -- |
| -- | Foreign Subsidiary in Canada (49%) |
| -- | Large Organizations (500 employees+) (48%) |
Base: All respondents (n=2965) / % who need a “Great deal” or “Some” assistance in each area
| More likely to need assistance | Less likely to need assistance |
|---|---|
| Partner Institutions (67%) | Sales - $25m-$1b (44%) |
| Consultant/Sole Proprietor (60%) | Foreign Subsidiary in Canada (40%) |
| Based in Alberta (59%) | TCS service - Problem Solving (34%) |
| Based in Saskatchewan/Manitoba (59%) | Sales - $1b+ (34%) |
| TCS service - Prep for international markets (57%) | Canadian Subsidiary Abroad (31%) |
| Sales - <$1m (57%) | -- |
Base: All respondents (n=2965) / % who need a “Great deal” or “Some” assistance in each area
| More likely to need assistance | Less likely to need assistance |
|---|---|
| Sales - $1b+ (58%) | -- |
| Sales - <$1m (57%) | Foreign Subsidiary in Canada (44%) |
| Based in Alberta (57%) | Target Market - Middle East/N. Africa (44%) |
| Micro-business (less than 10 employees) (56%) | -- |
| Based in Saskatchewan/Manitoba (56%) | Large Organizations (500 employees+) (41%) |
| -- | Canadian Subsidiary Abroad (38%) |
Base: All respondents (n=2965) / % who need a “Great deal” or “Some” assistance in each area
| More likely to need assistance | Less likely to need assistance |
|---|---|
| Sales - <$1m (56%) | Large Organizations (500 employees+) (39%) |
| TCS business line - Science, Tech. & Innovation (56%) | Sales - $1b+ (39%) |
| -- | Large Organizations (500 employees+) (38%) |
Base: All respondents (n=2965) / % who need a “Great deal” or “Some” assistance in each area
| More likely to need assistance | Less likely to need assistance |
|---|---|
| TCS business line - Science, Tech. & Innovation (62%) | Target Market - Eastern Europe (40%) |
| Sales - <$1m (63%) | Target Market - Middle East/N. Africa (39%) |
| Micro-business (less than 10 employees) (59%) | Based in Saskatchewan/Manitoba (38%) |
| Based in Atlantic Canada (57%) | TCS business line - Problem Solving (37%) |
| TCS service - Prep for international markets (54%) | -- |
| Target Market - W. Europe (54%) | -- |
| Executive (54%) | Large Organizations (500 employees+) (36%) |
| -- | Sales - $25m-$1b (34%) |
| -- | Foreign Subsidiary in Canada (32%) |
Base: All respondents (n=2965) / % who need a “Great deal” or “Some” assistance in each area
| More likely to need assistance | Less likely to need assistance |
|---|---|
| TCS business line - Science, Tech. & Innovation (77%) | Key Responsive Sectors / All Other Sectors (39%) |
| Partner Institutions (54%) | Target Market - Middle East/N. Africa (34%) |
| Key Proactive Sectors (53%) | Sales - $25m-$1b (33%) |
| Sales - <$1m (52%) | Foreign Subsidiary in Canada (32%) |
| TCS service - Prep for international markets (51%) | TCS service - Problem Solving (29%) |
| Target Market - W. Europe (51%) | -- |
Base: All respondents (n=2965) / % who need a “Great deal” or “Some” assistance in each area
The following table summarizes responses to three follow-up questions asking clients to rate the contribution, impact and financial outcomes of activities pursued in markets where they obtained service or advice from TCS.
The results indicate that between one in four and four in ten clients say TCS made a substantial contribution to all of the tested activities happening in markets where they requested assistance. In particular, clients say that TCS made important or essential contributions by helping to remove market barriers (44%), helping clients establish revenue-generating partnerships (41%) and with sales through foreign affiliates (39%) as well as the export of goods and services (32% each).
In each of the same areas, at least two in three clients say that TCS had a meaningful impact on the outcome (describing that an activity would have taken longer, cost more money to realize or never would have happened at all). In particular, four in five clients (82%) said that TCS had an impact on removing a market barrier. Seven in ten, meanwhile, said that TCS had a meaningful impact on revenue generating partnerships in foreign markets (69%) and on foreign affiliate sales (70%).
Clients were asked to estimate the range of annual revenue their organization had realized by pursuing activities in markets where they received assistance from TCS. Just over one in four clients who were assisted with new direct investments in their organization say that the assistance TCS provided was worth $500,000 or more in annual revenue (27%). Just over one in five clients who were helped by the removal of a market barrier (22%) or who secured revenue-generating investments from abroad (21%) say that TCS' assistance was worth at least $500,000 annually.
| Activities in Markets where TCS Provided Assistance | Contribution | Impact | $ Outcome |
|---|---|---|---|
| Sales resumption/increase after removal of market barrier (n=126) | 44% | 82% | 22% |
| Revenue-generating partnership, joint venture (n=643) | 41% | 69% | 10% |
| Foreign affiliate sales (n=144) | 39% | 70% | 17% |
| Export of goods (n=1018) | 32% | 64% | 19% |
| Export of services (n=920) | 32% | 65% | 13% |
| Expansion of existing investment in my organization (n=156) | 31% | 63% | 19% |
| Attracting angel investors or venture capital (n=125) | 30% | 62% | 18% |
| New direct investment in my organization (n=126) | 29% | 58% | 27% |
| Licensing of technology (n=160) | 28% | 53% | 11% |
| Investment abroad leading to revenue (n=174) | 27% | 57% | 21% |
Base sizes report the number of respondents saying TCS provided assistance in each area.
Contribution reports the percentage rating TCS' contribution to each activity as important or essential (4 or 5 on the scale provided).
Impact reports the percentage of respondents saying an activity would have taken longer, cost more money or not have been possible without assistance from TCS.
$ Outcome reports the percentage of respondents who say an activity TCS assisted with contributed to $500,000 or more in revenue over the past two years.
When asked whether TCS helped them by providing several different types of service, three in five say that TCS helped by providing intelligence and information they could not have received elsewhere (62%). Similar proportions say that TCS helped provide contacts they would not have otherwise found (58%), explore or expand in a foreign market (58%), improve their organizations' profile and credibility (58%) and improve their knowledge about the competitive environment in a market (56%).
It is important to note that while fewer clients may say that TCS helped them in a given area, this does not necessarily mean the assistance TCS provides in the area is not valuable. Indeed, clients were less likely to say that TCS helped to overcome a market barrier (44%). However, in the previous section of the report, results illustrated that clients who received assistance with the removal of a market barriers were most likely to say that TCS made a major contribution and had a meaningful impact on their efforts, and that the removal of a barrier led to $500,000 or more in annual revenue.
Fewer respondents say that TCS helped by providing market or industry information needed for decision-making purposes (52%) or that TCS helped improve their marketing strategy (45%). Also, of a more operational nature, clients less often say that TCS helped clients avoid mistakes, delays or additional costs (42%).
In areas related to public affairs and interactions with foreign governments, clients less often say that TCS helped them address regulatory challenges (35%) or helped on matters related to corporate social responsibility (25%). In addition, clients are also less likely to say that TCS helped them diversify their exports or business lines (29%).
In each of these areas results are similar to those measures in 2013 with the exception of perhaps avoiding mistakes, delays and additional costs where results are slightly more positive (42% compared with 36% in 2013).
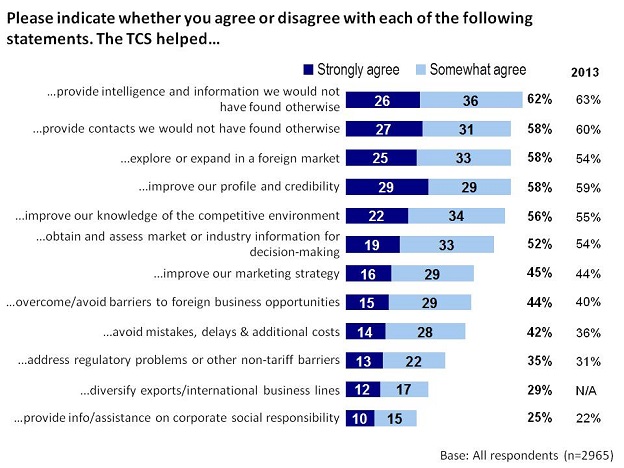
This chart has 12 horizontal stacked bars for strongly agree and somewhat agree, with a column for the total of strongly/somewhat agree for 2019 and a second column for the total of strongly/somewhat agree for 2013.
Respondents were asked to: Please indicate whether you agree or disagree with each of the following statements. The TCS helped… Respondents selected:
"…provide intelligence and information we would not have found otherwise": strongly agree (26 per cent), somewhat agree (36 per cent); total strongly/somewhat agree 2019 (62 per cent); total strongly/somewhat agree 2013 (63 per cent);
Base: All respondents (n=2965)
A number of obstacles to activities in international markets were indicated with uncertainty about foreign regulatory requirements (54%) and lack of market contacts (52%) at the top of the list, cited by about half of clients, as was also the case in 2013. Lack of information (46%), lack of access to financing (44%) and foreign tariffs or trade barriers (43%) were also commonly identified as obstacles. Lack of funding is an issue for a slightly higher proportions of clients than identified in 2013 when it was 39%. About one in three, pointed to patents and intellectual property rights (36%), corruption (35%), language or cultural differences (32%), and the value of the Canadian dollar (31%) as obstacles, where fewer identifying other areas as a concern. The value of the Canadian dollar is also significantly less of an issue compared with 2013 when it was noted by 40%.
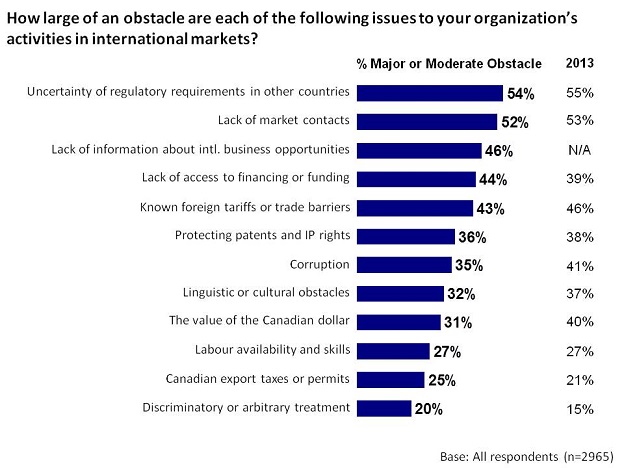
This chart has 12 single horizontal bars representing the % of major or moderate obstacle for 2019 and a column for 2013.
Respondents were asked: How large of an obstacle are each of the following issues to your organization's activities in international markets? Respondents selected:
Base: All respondents (n=2965)
Three in five clients (60%) say they export goods and services to the United States and to other foreign markets. An additional one in five (19%) say they export goods and services to foreign markets but not to the United States. The remainder says they either export solely to the United States (6%) or did not know how to answer the question (15%).
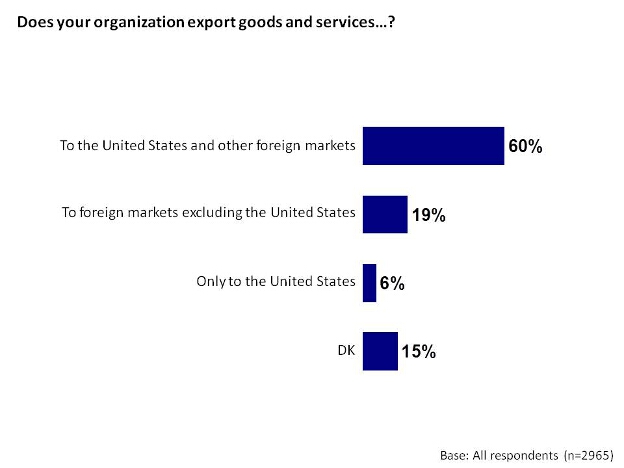
This chart has four single horizontal bars.
Respondents were asked: Does your organization export goods and services…? Respondents selected:
Base: All respondents (n=2965)
Asked to name their organizations' three largest export markets, respondents most often identified the United States (60%), followed at a distance by China (26%). In third place, 16% of clients identified the United Kingdom as a top market for their organization.
Asked to name the three markets for their organizations' exports which they expect to grow the fastest over the next three years, the United States (43%) is, again, the top market identified followed by China (26%). India (13%) and the United Kingdom (13%) are tied in third place, followed closely by Mexico (12%).
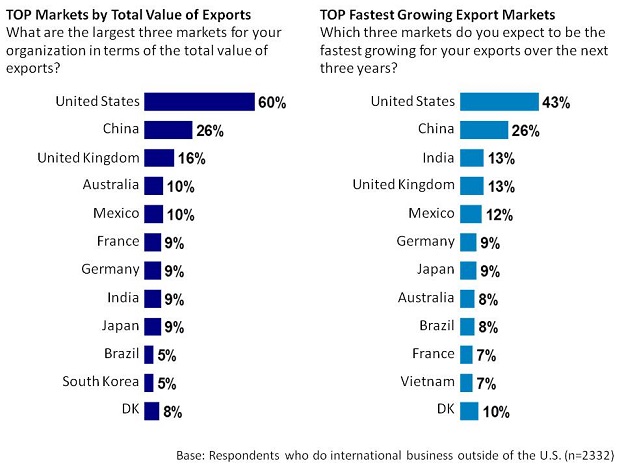
These two charts have 12 single horizontal bars each.
Left chart: Respondents were asked: Top Markets by Total Value of Exports. What are the largest three markets for your organization in terms of the total value of exports? Respondents selected:
Right chart: Respondents were asked: Top Fastest Growing Export Markets. Which three markets do you expect to be the fastest growing for your exports over the next three years? Respondents selected:
Base: Respondents who do international business outside of the U.S. (n=2332)
The following chart provides a regional summary of results for the largest current markets and the ones expected to grow the fastest in the next three years. Since Mexico has been summarized as part of Latin America, the North America result consists only of the United States.[2] As such, North America (the United States) is the largest region for current exports. North America is tied with East/Southeast Asia (including China) as the region where exports are expected to grow the fastest over the next three years. North America and Western Europe, with the oldest and best established trading relationships with Canada, are the only regional markets where the proportion that expect these to be the fastest growing markets is lower than the proportion that identify them as top current markets.
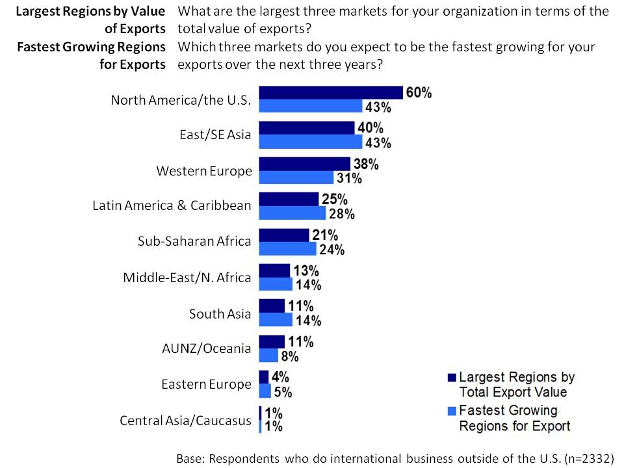
This chart has 10 double horizontal bars, with a bar representing the largest regions by total export value, and a bar representing the fastest growing regions for export.
Respondents were asked these two questions: Largest Regions by Value of Exports. What are the largest three markets for your organization in terms of the total value of exports?
Fastest Growing Regions for Exports. Which three markets do you expect to be the fastest growing for your exports over the next three years? Respondents selected:
Base: Respondents who do international business outside of the U.S. (n=2332)
When asked which of several other trade promotion organizations provided their organizations with support in the past two years, respondents most often say they received support from provincial government bodies (36%) or from the EDC (35%). The Business Development Bank of Canada (BDC) comes in a distant third place (16%), followed by the Canadian Commercial Corporation (CCC) at six percent. Overall, more than two in three clients (68%) say they have received support from trade promotion organizations other than TCS in the past two years.
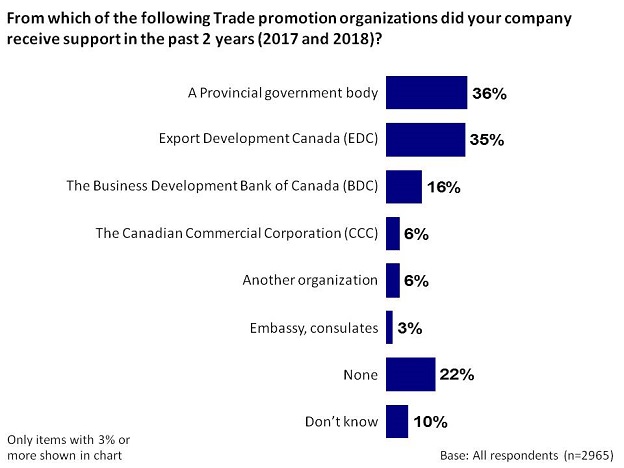
This chart has eight single horizontal bars.
Respondents were asked: From which of the following Trade promotion organizations did your company receive support in the past 2 years (2017 and 2018)? Respondents selected:
Only items with 3% or more shown in chart
Base: All respondents (n=2965)
Respondents were asked to rate the effectiveness of TCS services in comparison with other organizations they have received support from. Clients are more likely to say that TCS was more effective in terms of the overall services provided (45%), as well as in terms of the timeliness of the service provided (45%), than to say the impact of service on their organizations was "neutral" or roughly the same as services from other organizations. Few respondents (4% in each case) say that TCS provided services that were less effective than another organization.
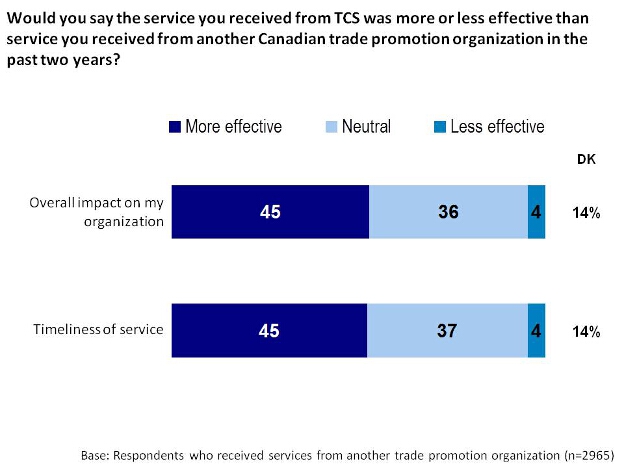
This chart has two horizontal stacked bars for more effective, neutral, less effective and on the side DK.
Respondents were asked to: Would you say the service you received from TCS was more or less effective than service you received from another Canadian trade promotion organization in the past two years? Respondents selected:
Base: Respondents who received services from another trade promotion organization (n=2965)
When asked how they initially learned about TCS, respondents most often say they were referred to TCS by another federal government body (15%). Referrals from EDC (12%) or from a provincial government body (11%) follow closely.
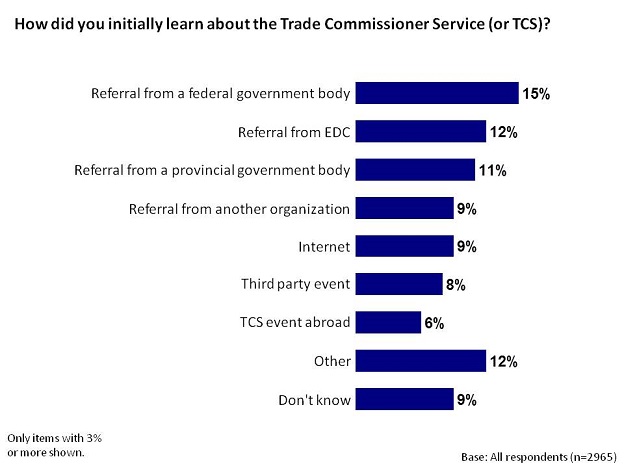
This chart has nine single horizontal bars.
Respondents were asked: How did you initially learn about the Trade Commissioner Service (or TCS)? Respondents selected:
Only items with 3% or more shown.
Base: All respondents (n=2965)
The majority of clients (79%) say they have dealt with more than one TCS office or agent in the past.
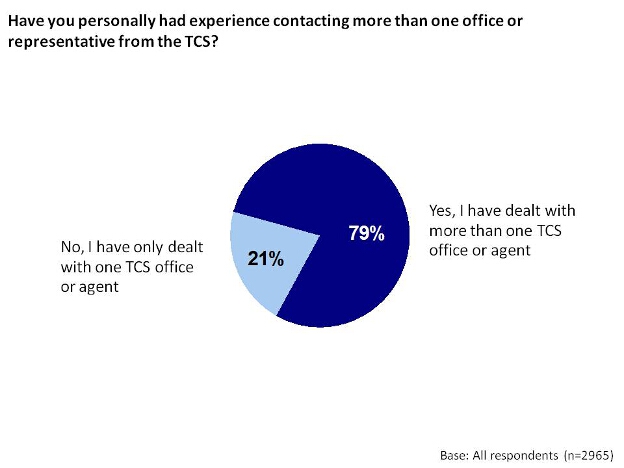
This chart shows a pie.
Respondents were asked: Have you personally had experience contacting more than one office or representative from the TCS? Respondents selected:
Base: All respondents (n=2965)
Two in three clients say they their organization has done business abroad for over a year (66%). An additional 14% say they have only sporadically done business abroad. Fewer than one in five respondents overall (17%) describe their organization as relatively inexperienced with international trade, saying either that they plan to do business abroad within a year (10%), that they are considering doing so within five years (4%) or that they have been doing business abroad for less than one year (3%).
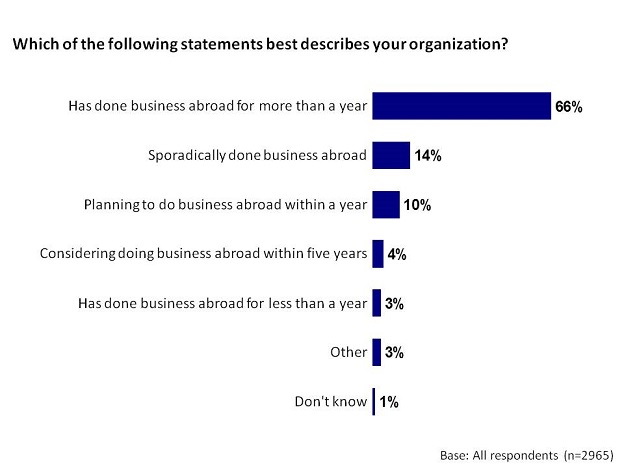
This chart has seven single horizontal bars.
Respondents were asked: Which of the following statements best describes your organization? Respondents selected:
Base: All respondents (n=2965)
When asked what activities they are currently engaged in abroad, clients most often say they are exporting goods (52%) or services (45%) to foreign markets. Others say they are engaged in partnerships with foreign organizations (37%) or are seeking R&D or other technology partnerships (33%). About one in four (23%) say they are seeking project financing or venture capital, while fewer than one in five say they are licensing a product, brand or technology from a foreign organization (19%) or that they are soliciting foreign investments (15%).
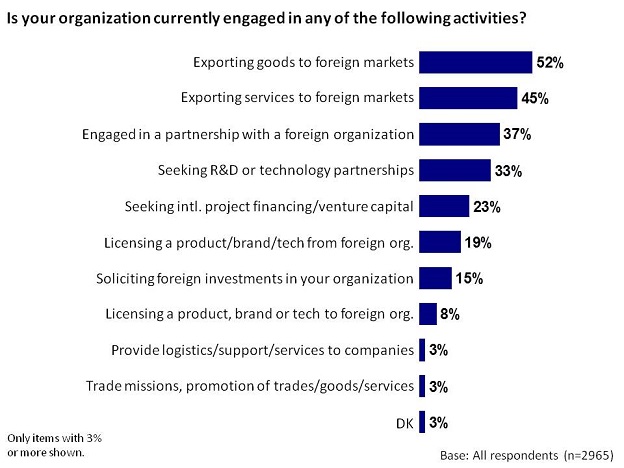
This chart has eleven single horizontal bars.
Respondents were asked: Is your organization currently engaged in any of the following activities? Respondents selected:
Only items with 3% or more shown.
Base: All respondents (n=2965)
A factor analysis was conducted to identify areas with response patterns that closely correlate with each other and which account for a significant amount of variance within the dataset overall. The outcome of the analysis is a summary perspective consolidating the various issues addressed in the survey into a few major themes, or factors, influencing responses. In the analysis, four factors were identified, accounting for 55% of the variance in responses. This suggests that there are other factors at work in the relationship TCS has with clients that are not encompassed by these four factors, however these four factors go a considerable distance to explaining responses encompassed in the survey.
While these factors do not comprehensively explain or account for all the important aspects of TCS' client relationships, they likely represent the most important influences. The top factors are:
The level of importance of each of these factors will likely vary at different points in the service relationship. In order to address the extended question about how these factors and other issues work within the client population, these factors have been combined to better understand and describe distinguishable segments of clients.
A segmentation analysis was created using the four factors identified in combination with key demographic variables, including the type of organization, nature of services sought, number of employees, sales and key markets (by total exports).
This analysis identifies four key segments of interest, summarized below. Appendix D provides more detailed results for each of the four segments.
Segment #1: Small Businesses Grateful for the Help (Percentage of sample: 31%)
Overall Satisfaction, Likelihood to Recommend & Use Again
Again, it is of little surprise that Segment #1 is much more likely to agree that they have achieved several positive outcomes as a result of the service or information received from TCS. In particular, they are most likely to strongly agree that TCS helped them:
Segment #1 is more likely than average to:
Overall Satisfaction, Likelihood to Recommend & Use Again
Segment #2 is above average in their satisfaction with TCS:
Segment #2 is more likely than average to:
Overall Satisfaction, Likelihood to Recommend & Use Again
Segment #3 is average in the satisfaction they express with TCS:
Overall Satisfaction, Likelihood to Recommend & Use Again
Segment #4 expresses the lowest level of satisfaction with TCS:
Segment #4 are more likely to:
The qualitative research involved 40 interviews with survey respondents. The interview participants were selected from amongst the n=1,138 respondents (41% of the sample) who agreed to participate in follow-up research.
The selection criteria were based on responses provided during the survey, particularly on the level of overall satisfaction expressed with TCS and on the willingness of participants to recommend TCS to colleagues. A review of the n=1,138 respondents who agreed to participate in follow-up research identified three basic groups emerging from these two fundamental questions:
The selection criteria focused on the "Neutrals" who expressed an ambivalent perspective towards TCS, neither wholly positive nor wholly negative. Thirty of the 40 interviews were conducted among these more neutral participants. The remaining 10 interviews were conducted amongst the more positive participants.
The segmentation of "Neutral" and "Positive" participants was designed to elicit different forms of feedback. In conversations with the "Neutral" participants, we sought to learn about their less-than-positive experiences with TCS in order to better contextualize suggested areas for improvement in the service or information TCS provides. The conversations with the "Positive" participants were designed to focus on the positive aspects of the service and information received in order to better understand which aspects of service deliver the greatest value to clients.
The following pages summarize the major themes and comments emerging from the discussions.
TCS is commonly described as unique in the service and information it provides. While other organizations such as Export Development Canada and the Canadian Commercial Corporation are mentioned, these are understood as wholly different in their focus on financing and contract indemnification, rather than the front-end marketing and sales activities that compel most participants to contact TCS.
The unique nature of services provided by TCS can be a double-edged sword. On one hand, clients see TCS as unique in providing an important, even essential, service. On the other, clients largely agree that third-party service providers are not sufficiently specialized to provide the uniquely tailored advice and guidance required to be useful, leaving many participants pursuing solutions on their own.
This prompted discussions in the interviews about the role and scope of services TCS can be expected to provide. Although a minority perspective, a few participants were hard pressed to define an area where TCS could assist them, or way in which they could interact with TCS to greater advantage. The majority, however, have a clear understanding of the services and information TCS provides, gained from either the representatives they had dealt with or from years of experience working in international trade.
"I got very clear information from the TCS representative about what kinds of information and services."
--
"TCS is extremely opaque. They get back to you but there are layers of screening to go through and no clear organizational structure."
Although several participants said that TCS is not always able to provide them with the highly specific support they feel they need, the majority believe that no government service provided by Canada or any other country can reasonably be expected to have the specific answers they need.
"I would say we have gotten basic – minimally helpful – contacts to people in other countries. We have tempered our expectations, though. There's only so much we can expect TCS to help us with given the specific nature of our business and our industry."
While most participants working in specialized markets – particularly those with more experience – expressed the view that TCS had reasonable limitations to the assistance it can offer, others expressed far higher expectations, with TCS providing more extensive assistance and advice, ranging from detailed market research to specific contacts with buyers in their industry, to the provision of office space to host meetings with prospective clients.
"We did get some good information, but we didn't really get good service. We were interested in the ground level information and overall dynamics of NGOs and companies... and there was helpful information about events within mining industry. But we were looking to TCS to help us directly connect with individuals in the market and provide support in, maybe, hosting meetings and providing contact information. But they didn't have the budget and it was outside their mandate. They were great at sharing information, but not really able to move us forward."
--
"The product I sell is huge with young people in my target markets ... But the people at TCS don't know anything about it... They don't have any useful market research on distribution channels or partners... They can't do anything that would actually help me sell my products."
--
"It would be nice if they could give me inside info on how I'm doing and how I'm perceived in (City). They should be more proactive and engaged with their clients when they give information."
In several conversations, participants described TCS as an organization adept at providing essential – if general – information for businesses entering a given market. The utility of this information varied widely from participant to participant, depending on the nature of their business and their experience. Those most satisfied with the usefulness of information were often exporting packaged or agricultural goods to the general consumer market; participants selling highly specialized products or services within a B2B environment seemed less impressed with the value of what – to their view – represented "basic" information (e.g., information not targeted to their specific needs).
Participants confronting highly specific issues and problems generally understand that TCS may not be well acquainted with the specific players or circumstances at work; however, many of these participants identify areas where they feel TCS could play a more helpful role than it has played in their experience. In particular, these participants say that TCS should – as a government program operating in a diplomatic capacity in foreign markets – have a natural affinity for and expertise with the operations of governments in their markets, particularly on matters related to government contracting and procurement in the markets they cover.
"Ironically, TCS is not very well geared towards helping us sell to government authorities... They just don't know who - or even where - the specific contacts are and they have no helpful strategies or specific information about how to sell to governments."
--
"They had no helpful information for us on the application process... They did make a connection for us to a local government relations firm who was able to help us, but I would think they would be more knowledgeable about government procurement practices since they work in government and work with the governments in the market on diplomatic issues."
--
"Our issue is permits, health certificates and other regulatory barriers... We also run into issues with corruption once in a while, which always discourages us. We'd appreciate knowing what the regulatory requirements are up front so we have the option of not engaging."
For a few participants, problems or issues in a market touched on areas where engagement at the political level became necessary to clear market barriers or to obtain faster or more favourable outcomes from regulatory processes (e.g., permit applications). In these discussions, participants routinely said that TCS is not equipped to deliver this sort of intervention. That said, several participants also said they appreciate the (apparently) limited influence the Government of Canada has, from within either bureaucratic or political spheres.
"Our situation [in a natural resource industry] became very political and our application was ultimately unsuccessful... We don't expect TCS to understand our business, but they should understand how the government in their market works and – ideally – they should have important contacts in the market on whom they can prevail on our behalf. But you aren't going to get that sort of capability with TCS... You have to bring it to the Ambassadorial level and even to the Ministerial level, which we did. But, ultimately, Canada didn't have the influence needed to get a favourable outcome."
--
"As a Canadian firm we can't compete with the French because they are backed by their representatives in Africa, and their representatives have influence ours don't. So, we get left alone to find our way. I wish we had more support from our government to open doors but that didn't happen. Canada in Africa is a very large opportunity. The way Canada is viewed in Africa should allow us to get more contacts because we have a very good reputation in Africa."
--
"For TCS staff stationed abroad, their connections with local governments in the other countries would be helpful. But we haven't seen too much of that yet.
Among the comments on the limitations of the Government of Canada's influence in foreign markets, there were positive comments from participants about the performance of the Government in securing favourable multilateral trade agreements and also in clearing broad obstacles preventing access to specific markets."
"Canada is very good when it comes to securing and negotiating multi-national agreements. They've done a fair job dealing with Trump, for example. But they break down when it comes to influence in specific markets."
Although many participants described instances where the Government of Canada does not appear to have a full or nuanced understanding of market conditions or the political influence required to solve problems, TCS was described in particularly positive terms in the area of assistance in accessing other Government of Canada programs and services, and also in providing important connections to programs, services and conferences offered by multinational government organizations, including the United Nations and the World Bank Group.
"They gave me lots of information! It is a fantastic service! I applied under Canada's Feminist International Assistance Policy... [was sent by the Government of Canada to a conference run by the U.N.] ... I received interesting proposals from countries in different regions.... I followed up with my (TCS) contact in Atlantic Canada who referred me to a colleague to help find a different program, but there wasn't one that fit. He was really helpful, though, and I could tell he really wanted to help, but it didn't go anywhere."
--
"I have gotten information related to government funding programs... TCS was informative and helpful connecting us to exports programs and remained informative and helpful during the application process."
When asked to identify the major challenges they face when doing business abroad, some participants described a broad range of issues, while others focused on one or two key issues. Generally, participants with less experience pointed to a wider scope of issues, while more experienced participants pointed to a few specific areas of concern, highlighting the varied nature of expectations with regard to TCS support.
"L'approvisionnement, les régulations des jouets venant de la Chine, l'exportation, les coûts de transportation, la logistique, et les paperasses de la douane."
--
"Being able to enter different markets the way we want to. We (are) now doing it through our films and tools. Be able to choose the markets we want and capitalize on the trends. We need guidance on these. General guidance would be appreciated and overall international strategy would be helpful."
As reflected in the quantitative results, participants commonly said they needed access to contact information in the market, often focusing on contacts for prospective clients or to companies that can provide distribution in the case of retail exports.
"The lack of information about international business opportunities is a problem. If they could offer some kind of online platform with information, that could be of assistance. We have a lack of contacts with potential buyers and partners, technology sources, distribution agents... It's a struggle."
A few participants pointed to larger issues, such as the value of the Canadian dollar, as areas that may be outside of the TCS arena, but which nevertheless have an impact on clients' future international business prospects.
"The value of the Canadian dollar- Yes that has a huge bearing on it. Because a lot of the countries that would participate in these shows do business in U.S. dollars. When I go to Africa it is usually in U.S dollars but you have to be a little careful."
Interview participants with significant experience conducting business abroad were not likely to describe information from TCS about expanding to new or different markets as either novel ideas they had not already considered or as practical issues suited to their particular business model. However, participants with less experience expressed more enthusiasm for this type of information.
"In our case, we know where our market is because it's a very specific one. The reason we don't go to the United States is simply that we don't have a market for our product there."
--
"My product is (.....) that's become popular in a few Southeast Asian markets. I've got enough to deal with to get myself established in those markets. I don't really see expanding to different markets as a top priority."
The central theme across these comments is an issue of timing. When clients approach TCS, they typically do so for help on issues encountered while in the process of expanding to a particular market. They are no longer in the early planning stage when information helpful in choosing new markets is useful; and, similarly, they are often too preoccupied with solving issues in markets where they currently operate to view information about new markets as particularly helpful.
Participants typically described their interactions with TCS staff in positive terms. Participants described TCS staff using adjectives like "helpful," "engaged," "attentive," and "genial" or "friendly." Even in instances where the TCS representative could not provide a specific answer or solution, participants usually said they were left with a positive impression of the person or people they dealt with. While positive impressions like these were typical of participants' interactions with TCS staff, some suggested that there can be some variation in the quality of interaction from staff member to staff member and office to office. On the other hand, others commented on the consistency of service delivery, as always helpful. While many participants described examples of TCS staff offering eager and diligent service and attention, in other instances some were described as less experienced, compromising the value of the service. A few emphasized the need for more proactive follow-up on the part of TCS staff. These results emphasize the important role that staff interactions play in the experience clients take away from their interactions.
Generally, participants describe TCS as offering them credibility in the market place (if not necessarily influence), particularly in dealings with foreign governments. In most cases, participants said this was a key benefit for them.
"....we found her to be absolutely wonderful. She was very helpful in finding potential partners. We looked at the list she sent to see if it makes sense for us, we whittled it down and she contacted them - made introductions, gave them a high level profile of what we do and connected us with them and we took it from there. That's how we found our partner. It's been a very good collaboration."
--
"He was really helpful and I could tell he really wanted to help but it didn't go anywhere."
--
"I think we need more individually tailored service, a more proactive service to interact with our representative."
--
"It has always been the same, I have never have a negative experience with them. They are not experts in my field, but they are always quite positive, show an interest in what I am doing."
The majority of participants – including those who offered criticisms – typically described the program overall in positive terms, saying it is a helpful resource for their business to turn to when addressing issues or problems in a foreign market, and in providing assistance in the formative stages of an international foray.
In particular, TCS was said to provide very helpful information to clients new to international trade who wish to expand their business into the United States (typically by exporting goods or services, but sometimes looking for assistance with connections to investors or R&D partners). In these discussions, particularly with respect to expanding to the United States, TCS was seen as providing helpful information in general, as well as in addressing specific issues and challenges encountered in specific regions and states.
"I was looking for detailed help on how to enter the U.S. market and they were incredibly helpful. They put me in touch with contacts that helped me grow my business in different states. It's crucial to have a resource like TCS since even shipping can be different from one state to the next."
--
"The information was helpful. The TCS person in the regional office referred me to the correct regional person in the U.S.. "
--
"The TCS people, like (name of TCS staffer) from, is very responsive and there's a person in who is also very responsive and knowledgeable."
In markets outside of the United States, examples of TCS providing specific help or guidance in solving a problem appear less common. Nevertheless, many of these said they were generally provided with very helpful information. The most enthusiastic responses often seemed to come from participants who are in the planning stages or early implementation phase of an international expansion.
"They helped us with networking – finding the right person, the right referral to talk with. They also provided business intelligence on the region. The nice thing is knowing what's happening and issues within the local industry and with the regional companies. They understand the problems and future business opportunities at the regional level, which is information that cannot be gained anywhere else. These two things are very important to an organization like ours that doesn't have the resources to hire consultants or the knowledge about where to look for opportunities."
--
"In the first 2 or 3 encounters, I wanted to know who the major international investors in Mexico are, where they are, what partners they have, etc. We also wanted to know more about other Canadian or Quebec-based investors and how they were able to set up in Mexico. TCS provided information that was very helpful for us."
Many participants said TCS either hosted or provided information about conferences and trade shows in a foreign market. Clients typically said these opportunities were useful for them and resulted in well-targeted connections with potential foreign business partners and clients.
It was a match making event by players in the gaming industry and studio and we overlap in that industry and we met a lot of people from the U.S. and one person from China.
--
I would say that invitations that I get, primarily from (name of TCS staffer), are great. I really appreciate the outreach. They aren't always relevant to me, but I still appreciate getting the invitations and opportunities from them as things to consider doing.
That said, many participants said that trade shows and conferences could be more narrowly targeted to deliver interesting opportunities. This was most often the case among participants who work in highly specialized areas, often selling to business clients who have very narrow and specific needs.
"It was less than a year ago. There was a trade delegation going to (Europe). It didn't come to anything, though, as there wasn't anyone from our industry represented on the European side. We didn't make any useful contacts."
In some cases, these comments led to discussions about the role of TCS, what it can and cannot do, and alignment or misalignment with what participants think it should do.
Appendix A: Methodology
Appendix A - Detailed Methodology
Two phases of research were conducted to deliver on the objectives: an initial phase of survey research, followed by key informant interviews with 40 clients who answered the survey.
The survey research was conducted among a sample of n=2965 clients of the TCS who were identified through a contact list maintained by TCS. The surveys required 15 minutes to complete (on average) and were conducted between March 5 and March 27, 2019. The sample of n=2965 obtains a +/-1.8 percentage point margin of error (calculated at a 95% confidence interval).
The following table calculates the survey response rate using an approach derived from the empirical calculation published by the Market Research and Intelligence Association (MRIA).
| Col1 | Col2 |
|---|---|
| Total contacts in sample | 26718 |
| Invalid address/No email available/Undeliverable | 555 |
| Unresolved (U) | 22675 |
| No response/Out of office response | 22675 |
| In-scope – non-responding (IS) |
1078 |
| Qualified respondent break-off | 1078 |
| In-scope – Responding units (R) | 2965 |
| Completed interviews | 2965 |
| Ineligible | 0 |
| Response Rate = R/(U+IS+R) | 11.1% |
The following tables provide a comparison between the characteristics of the entire population of TCS clients (the "universe," as represented through the client contact database maintained by TCS). Given that the final survey sample very closely approximates the characteristics of the total population, no weights were applied to the data.
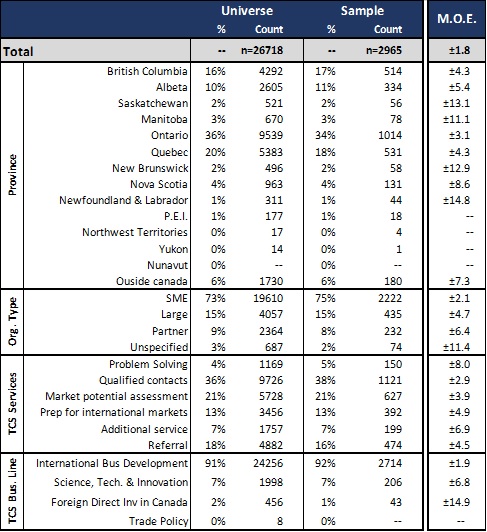
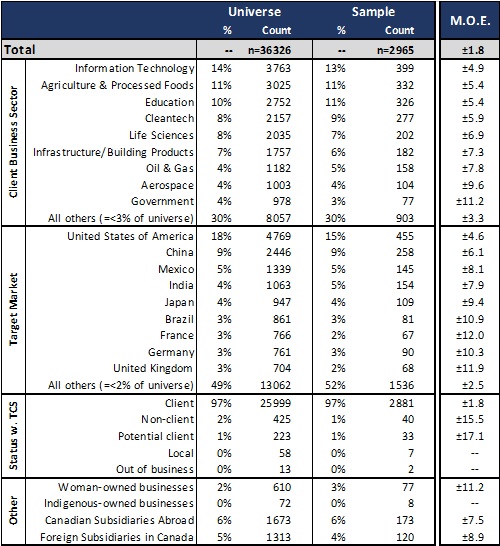
These two tables show six different columns for a total by category (Province, Organization Type, TCS Services, TCS Business Line, Client Business Sector, Target Market, Client Business Sector, Target Market, Status with TCS, and other). Two columns for: Total Universe (% and Count n=26718); two columns for: Total Sample (% and Count n=2965); and one column for Total M.O.E. (+/- 1.8).
For the province category:
British Columbia Universe: %: (16%); Count (4292);
Sample: %: (17%); Count (514);
M.O.E. (+/- 4.3)
Alberta Universe: %: (10%); Count (2605);
Sample: %: (11%); Count (334);
M.O.E. (+/- 5.4)
Saskatchewan Universe: %: (2%); Count (521);
Sample: %: (2%); Count (56);
M.O.E. (+/- 13.1)
Manitoba Universe: %: (3%); Count (670);
Sample: %: (3%); Count (78);
M.O.E. (+/- 11.1)
Ontario Universe: %: (36%); Count (9539);
Sample: %: (34%); Count (1014);
M.O.E. (+/- 3.1)
Quebec Universe: %: (20%); Count (5383);
Sample: %: (18%); Count (531);
M.O.E. (+/- 4.3)
New Brunswick Universe: %: (2%); Count (496);
Sample: %: (2%); Count (58);
M.O.E. (+/- 12.9)
Nova Scotia Universe: %: (4%); Count (963);
Sample: %: (4%); Count (131);
M.O.E. (+/- 8.6)
Newfoundland & Labrador Universe: %: (1%); Count (311);
Sample: %: (1%); Count (44);
M.O.E. (+/- 14.8)
P.E.I. Universe: %: (1%); Count (177);
Sample: %: (1%); Count (18);
M.O.E. (+/- )
Northwest Territories Universe: %: (0%); Count (17);
Sample: %: (0%); Count (4);
M.O.E. (+/- )
Yukon Universe: %: (0%); Count (14);
Sample: %: (0%); Count (1);
M.O.E. (+/- )
Nunavut Universe: %: (0%); Count (--);
Sample: %: (0%); Count (--);
M.O.E. (+/- )
Outside Canada Universe: %: (6%); Count (1730);
Sample: %: (6%); Count (180);
M.O.E. (+/- 7.3)
For the organization type category:
SME Universe: %: (73%); Count (19610);
Sample: %: (75%); Count (2222);
M.O.E. (+/- 2.1)
Large Universe: %: (15%); Count (4057);
Sample: %: (15%); Count (435);
M.O.E. (+/- 4.7)
Partner Universe: %: (9%); Count (2364);
Sample: %: (8%); Count (232);
M.O.E. (+/- 6.4)
Unspecified Universe: %: (3%); Count (687);
Sample: %: (2%); Count (74);
M.O.E. (+/- 11.4)
For the TCS services type category:
Problem Solving Universe: %: (4%); Count (1169);
Sample: %: (5%); Count (150);
M.O.E. (+/- 8.0)
Qualified Contacts Universe: %: (36%); Count (9726);
Sample: %: (38%); Count (1121);
M.O.E. (+/- 2.9)
Market Potential Assessment Universe: %: (21%); Count (5728);
Sample: %: (21%); Count (627);
M.O.E. (+/- 3.9)
Prep for International Markets Universe: %: (13%); Count (3456);
Sample: %: (13%); Count (392);
M.O.E. (+/- 4.9)
Additional Service Universe: %: (7%); Count (1757);
Sample: %: (7%); Count (199);
M.O.E. (+/- 6.9)
Referral Universe: %: (18%); Count (4882);
Sample: %: (16%); Count (474);
M.O.E. (+/- 4.5)
For the TCS business line category:
International Bus Development Universe: %: (91%); Count (24256);
Sample: %: (92%); Count (2714);
M.O.E. (+/- 1.9)
Science, Tech & Innovation Universe: %: (7%); Count (1998);
Sample: %: (7%); Count (206);
M.O.E. (+/- 6.8)
Foreign Direct inv in Canada Universe: %: (2%); Count (456);
Sample: %: (1%); Count (43);
M.O.E. (+/- 14.9)
Trade Policy Universe: %: (0%); Count (8);
Sample: %: (0%); Count (--);
M.O.E. (+/- )
For Client Business Sector category:
Information Technology Universe: %: (14%); Count (3763);
Sample: %: (13%); Count (399);
M.O.E. (+/- 4.9)
Agriculture & Processed Foods Universe: %: (11%); Count (3025);
Sample: %: (11%); Count (332);
M.O.E. (+/- 5.4)
Education Universe: %: (10%); Count (2752);
Sample: %: (11%); Count (326);
M.O.E. (+/- 5.4)
Cleantech Universe: %: (8%); Count (2157);
Sample: %: (9%); Count (277);
M.O.E. (+/- 5.9)
Life Sciences Universe: %: (8%); Count (2035);
Sample: %: (7%); Count (202);
M.O.E. (+/- 6.9)
Infrastructure/Building Products Universe: %: (7%); Count (1757);
Sample: %: (6%); Count (182);
M.O.E. (+/- 7.3)
Oil & Gas Universe: %: (4%); Count (1182);
Sample: %: (5%); Count (158);
M.O.E. (+/- 7.8)
Aerospace Universe: %: (4%); Count (1003);
Sample: %: (4%); Count (104);
M.O.E. (+/- 9.6)
Government Universe: %: (4%); Count (978);
Sample: %: (3%); Count (77);
M.O.E. (+/- 11.2)
All others (=<3% of universe) Universe: %: (30%); Count (8057);
Sample: %: (30%); Count (903);
M.O.E. (+/- 3.3)
For Target Market category:
United States of America Universe: %: (18%); Count (4769);
Sample: %: (15%); Count (455);
M.O.E. (+/- 4.6)
China Universe: %: (9%); Count (2446);
Sample: %: (9%); Count (258);
M.O.E. (+/- 6.1)
Mexico Universe: %: (5%); Count (1339);
Sample: %: (5%); Count (145);
M.O.E. (+/- 8.1)
India Universe: %: (4%); Count (1063);
Sample: %: (5%); Count (154);
M.O.E. (+/- 7.9)
Japan Universe: %: (4%); Count (947);
Sample: %: (4%); Count (109);
M.O.E. (+/- 9.4)
Brazil Universe: %: (3%); Count (861);
Sample: %: (3%); Count (81);
M.O.E. (+/- 10.9)
France Universe: %: (3%); Count (766);
Sample: %: (2%); Count (67);
M.O.E. (+/- 12.0)
Germany Universe: %: (3%); Count (761);
Sample: %: (3%); Count (90);
M.O.E. (+/- 10.3)
United Kingdom Universe: %: (3%); Count (704);
Sample: %: (2%); Count (68);
M.O.E. (+/- 11.9)
All others (=<2% of universe) Universe: %: (49%); Count (13062);
Sample: %: (52%); Count (1536);
M.O.E. (+/- 2.5)
For Status with TCS category:
Client Universe: %: (97%); Count (25999);
Sample: %: (97%); Count (2881);
M.O.E. (+/- 1.8)
Non-client Universe: %: (2%); Count (425);
Sample: %: (1%); Count (40);
M.O.E. (+/- 15.5)
Potential client Universe: %: (1%); Count (223);
Sample: %: (1%); Count (33);
M.O.E. (+/- 17.1)
Local Universe: %: (0%); Count (58);
Sample: %: (0%); Count (7);
M.O.E. (+/- )
Out of business Universe: %: (0%); Count (13);
Sample: %: (0%); Count (2);
M.O.E. (+/- )
For Other category:
Women-owned businesses Universe: %: (2%); Count (610);
Sample: %: (3%); Count (77);
M.O.E. (+/- 11.2)
Indigenous-owned businesses Universe: %: (0%); Count (72);
Sample: %: (0%); Count (8);
M.O.E. (+/- )
Canadian Subsidiaries Abroad Universe: %: (6%); Count (1673);
Sample: %: (6%); Count (173);
M.O.E. (+/- 7.5)
Foreign Subsidiaries in Canada Universe: %: (5%); Count (1313);
Sample: %: (4%); Count (120);
M.O.E. (+/- 8.9)
The qualitative research consisted of one-on-one interviews conducted by telephone among 40 survey respondents. Each interview took between a half hour and 45 minutes to complete. The questions included in the interview guide were primarily open-ended in nature in order to have the participants clarify key study issues in their own words and drawing on their experiences with TCS. The interview participants were selected from the sample of respondents to reflect a lower level of satisfaction with TCS than was realized in the aggregate results among all respondents.
Please note that while the quantitative data provide a statistically representative means of reporting on the satisfaction and attitudes of TCS clients, the qualitative interviews are a non-random exercise that focusing on discourse and anecdotal experiences which – by design – are not reflective of the entire population.
Appendix B: Survey Questionnaire
INTRO
Thank you for your interest in completing this survey.
The survey should take approximately 15 minutes to complete. If you begin the survey and find you need to come back later to complete it, you may re-open the link provided below at a later time and pick the survey up where you left off.
Si vous préférez répondre au sondage en Français, veuillez cliquer sur Français.
Note: Once all the responses have been tabulated, you will be able to review the aggregate results of the survey at the following website:
www.tradecommissioner.gc.ca/clientsurvey2019.
QA1
How did you initially learn about the Trade Commissioner Service (or TCS)?
Please choose one response
Referral from Export Development Canada (EDC) 1
Referral from the Business Development Bank of Canada (BDC) 2
Referral from the Canadian Commercial Corporation (CCC) 3
Referral from a federal government body 4
Referral from a provincial government body 5
Referral from another organization 6
Internet 7
Third party event 8
TCS event in Canada (please provide details) 9
TCS event abroad (please provide details) 10
Other (please specify) 77
Don't know 99
QA2
Which of the following statements best describes your organization?
Please choose one response
My organization has regularly done business in foreign markets for more than
a year 1
My organization has been doing business in foreign markets for less than a year 2
My organization has sporadically done business in foreign markets over the
course of several years 3
My organization is actively planning to do business in foreign markets within the
next 12 months 4
My organization may pursue foreign business opportunities within the next
five years 5
None of the above 98
Don't know/Not sure 99
QA3
For how many years has your organization done business internationally on a regular basis?
Less than two years 1
Between two and five years 2
Between 6 and 10 years 3
More than 10 years 4
Don't know/Not sure 99
QA4 [1,9]
Is your organization currently engaged in any of the following activities?
Please select all that apply
Exporting goods to foreign market(s) 1
Exporting services to foreign market(s) 2
Soliciting foreign investments in your organization 3
Engaged in a partnership or joint venture with a foreign organization 4
Licensing a product, brand or technology from a foreign organization 5
Licensing a product, brand or technology to a foreign organization 6
Seeking international sources of project financing or venture capital 7
Seeking research and development and/or technology partnership opportunities 8
Other (please specify) 77
Don't know / Not sure 99
QA5 [1,10]
Please indicate which – if any – of the following are reasons your organization has approached the TCS in the past.
Please select all that apply
To solve specific, time-sensitive problems my organization encountered in a foreign market 1
To get basic information about doing business in a foreign market (e.g., information
about a foreign business culture) 2
To get information about establishing or expanding bricks and mortar operations
in a foreign market 3
To get information about exporting goods to a foreign market 4
To get information about distribution channels in a foreign market 5
To get information about exporting services to a foreign market 6
To get assistance with licensing or franchising my organization's technology in a
foreign market 7
To get assistance with ongoing sales and marketing efforts in a foreign market 8
To promote educational opportunities or partnerships in a foreign market or to
recruit international students 9
Other (please specify) 77
Don't know / Not sure 99
PB1
Using the scale below, please indicate whether you agree or disagree with each of the following statements pertaining to the service you have received from the TCS.
If you have received multiple services, please provide the answer that best reflects your view of the service you have received from TCS overall.
B1A
TCS Staff understood enough about the dynamics of the specific business or sector involved to add value to our business development effort
Strongly agree 1
Somewhat agree 2
Neutral 3
Somewhat disagree 4
Strongly disagree 5
Don't know/ Not applicable 99
B1B
It took a reasonable amount of time to obtain what I needed
Strongly agree 1
Somewhat agree 2
Neutral 3
Somewhat disagree 4
Strongly disagree 5
Don't know/ Not applicable 99
B1C
The information I received was helpful to understand overall market conditions
Strongly agree 1
Somewhat agree 2
Neutral 3
Somewhat disagree 4
Strongly disagree 5
Don't know/ Not applicable 99
B1D
The contacts I received were the right people with which to do business
Strongly agree 1
Somewhat agree 2
Neutral 3
Somewhat disagree 4
Strongly disagree 5
Don't know/ Not applicable 99
B1E
The market intelligence/information about local companies and organizations was useful
Strongly agree 1
Somewhat agree 2
Neutral 3
Somewhat disagree 4
Strongly disagree 5
Don't know/ Not applicable 99
B1F
The intelligence provided identified both opportunities and potential difficulties
Strongly agree 1
Somewhat agree 2
Neutral 3
Somewhat disagree 4
Strongly disagree 5
Don't know/ Not applicable 99
B1G
The information and advice I received helped me address the problem(s)
Strongly agree 1
Somewhat agree 2
Neutral 3
Somewhat disagree 4
Strongly disagree 5
Don't know/ Not applicable 99
B1H
Staff referred me to the right contacts if they could not help me directly
Strongly agree 1
Somewhat agree 2
Neutral 3
Somewhat disagree 4
Strongly disagree 5
Don't know/ Not applicable 99
PC1
How much assistance does your organization need in the following areas when developing business in markets outside of Canada?
C1A
Market intelligence and information
A great deal 1
Some assistance 2
Very little assistance 3
No assistance at all 4
Don't know/ Not applicable 99
C1B
Referrals to legal professionals, human resource professionals, translators and other professional service providers
A great deal 1
Some assistance 2
Very little assistance 3
No assistance at all 4
Don't know/ Not applicable 99
C1C
Support for the protection of intellectual property rights, government procurement and/or regulatory matters
A great deal 1
Some assistance 2
Very little assistance 3
No assistance at all 4
Don't know/ Not applicable 99
C1D
Referrals to international business opportunities/sales leads
A great deal 1
Some assistance 2
Very little assistance 3
No assistance at all 4
Don't know/ Not applicable 99
C1E
Referral of technology and/or R&D partnership opportunities
A great deal 1
Some assistance 2
Very little assistance 3
No assistance at all 4
Don't know/ Not applicable 99
C1F
Referrals to other relevant commercial programs and services
A great deal 1
Some assistance 2
Very little assistance 3
No assistance at all 4
Don't know/ Not applicable 99
C1G
Information or advice on locating financial/funding assistance
A great deal 1
Some assistance 2
Very little assistance 3
No assistance at all 4
Don't know/ Not applicable 99
C1H
Recommendations on trade fairs/ trade missions to attend
A great deal 1
Some assistance 2
Very little assistance 3
No assistance at all 4
Don't know/ Not applicable 99
C1I
Practical advice on timing and organizing your business trip
A great deal 1
Some assistance 2
Very little assistance 3
No assistance at all 4
Don't know/ Not applicable 99
C1J
Information about organizations or companies in foreign markets
A great deal 1
Some assistance 2
Very little assistance 3
No assistance at all 4
Don't know/ Not applicable 99
C1K
Understanding responsible business practices in foreign markets
A great deal 1
Some assistance 2
Very little assistance 3
No assistance at all 4
Don't know/ Not applicable 99
PC2
How large of an obstacle are each of the following issues to your organization's activities in international markets?
C2A
The value of the Canadian dollar
No obstacle at all 1
Minor obstacle 2
Moderate obstacle 3
Major obstacle 4
Don't know/ Not applicable 99
C2B
Canadian export taxes or permits
No obstacle at all 1
Minor obstacle 2
Moderate obstacle 3
Major obstacle 4
Don't know/ Not applicable 99
C2C
Uncertainty of regulatory requirements in other countries
No obstacle at all 1
Minor obstacle 2
Moderate obstacle 3
Major obstacle 4
Don't know/ Not applicable 99
C2D
Foreign tariffs or trade barriers
No obstacle at all 1
Minor obstacle 2
Moderate obstacle 3
Major obstacle 4
Don't know/ Not applicable 99
C2E
Discriminatory or arbitrary treatment toward Canadian investors or their investments
No obstacle at all 1
Minor obstacle 2
Moderate obstacle 3
Major obstacle 4
Don't know/ Not applicable 99
C2F
Lack of access to financing or funding
No obstacle at all 1
Minor obstacle 2
Moderate obstacle 3
Major obstacle 4
Don't know/ Not applicable 99
C2G
Concern of violation of your patents and/or intellectual property rights
No obstacle at all 1
Minor obstacle 2
Moderate obstacle 3
Major obstacle 4
Don't know/ Not applicable 99
C2I
Linguistic or cultural obstacles
No obstacle at all 1
Minor obstacle 2
Moderate obstacle 3
Major obstacle 4
Don't know/ Not applicable 99
C2J
Labour availability and skills
No obstacle at all 1
Minor obstacle 2
Moderate obstacle 3
Major obstacle 4
Don't know/ Not applicable 99
C2K
Corruption
No obstacle at all 1
Minor obstacle 2
Moderate obstacle 3
Major obstacle 4
Don't know/ Not applicable 99
C2L
Lack of information about international business opportunities (i.e. export sales leads)
No obstacle at all 1
Minor obstacle 2
Moderate obstacle 3
Major obstacle 4
Don't know/ Not applicable 99
C2M
Lack of market contacts such as potential buyers and partners, technology sources, agents, etc.
No obstacle at all 1
Minor obstacle 2
Moderate obstacle 3
Major obstacle 4
Don't know/ Not applicable 99
C2N [0,1]
Other obstacles or challenges (specify nature of obstacle or challenge):
No obstacle at all 1
Minor obstacle 2
Moderate obstacle 3
Major obstacle 4
Don't know/ Not applicable 99
D1
How would you rate your overall satisfaction with the service and advice provided by the TCS across all of your interactions with the Trade Commissioner Service (TCS)?
Very satisfied 1
Satisfied 2
Neutral 3
Unsatisfied 4
Very unsatisfied 5
Don't know 99
D2
How likely are you to recommend the services of the TCS to a colleague or business associate?
Definitely 1
Probably 2
Possibly 3
Probably not 4
Definitely not 5
Don't know 99
D3
How likely are you to use the services of the TCS again?
Definitely 1
Probably 2
Possibly 3
Probably not 4
Definitely not 5
Don't know 99
D4
Which of the following best describes why you are unlikely to use the services of TCS in the future?
Please choose one response
Your organization has developed to a point where the services provided by the TCS are no longer needed 1
Your organization has not engaged in any new international business endeavours since
its last interaction with the TCS 2
Your organization did not gain sufficient value from previous interaction(s) 3
You were not satisfied with the quality of service previously provided by the TCS 4
You do not know how to get in touch with the right contact in the TCS 5
Other (please specify) 77
Don't know 99
D5 [1,5]
From which of the following trade promotion organizations did your company receive support in the past 2 years (2017 and 2018)?
Please select all that apply
Export Development Canada (EDC) 1
The Business Development Bank of Canada (BDC) 2
The Canadian Commercial Corporation (CCC) 3
A Provincial government body 4
Another organization (please specify) 5
None 6
Don't know 99
PD6
In each of the following areas, would you say the service you received from TCS was more or less effective than service you have received from another Canadian trade promotion organization in the past two years?
D6A
Timeliness of service
Much more effective 1
Somewhat more effective 2
Neutral 3
Somewhat worse 4
Much worse 5
Don't know 99
D6B
Overall impact of service on your organization
Much more effective 1
Somewhat more effective 2
Neutral 3
Somewhat worse 4
Much worse 5
Don't know 99
D6C
Overall satisfaction with service
Much more effective 1
Somewhat more effective 2
Neutral 3
Somewhat worse 4
Much worse 5
Don't know 99
PE1
Please indicate whether you agree or disagree with each of the following statements.
The TCS helped my organization...
E1A
Gain confidence to explore or expand in a foreign market
Strongly agree 1
Somewhat agree 2
Neutral 3
Somewhat disagree 4
Strongly disagree 5
Don't know/ Not applicable 99
E1B
Gain access to customers and partners that would have been difficult to obtain without the support of the TCS
Strongly agree 1
Somewhat agree 2
Neutral 3
Somewhat disagree 4
Strongly disagree 5
Don't know/ Not applicable 99
E1C
Gain access to intelligence and information that would have been difficult to obtain without the support of the TCS
Strongly agree 1
Somewhat agree 2
Neutral 3
Somewhat disagree 4
Strongly disagree 5
Don't know/ Not applicable 99
E1D
Overcome or avoid barriers to new foreign business opportunities
Strongly agree 1
Somewhat agree 2
Neutral 3
Somewhat disagree 4
Strongly disagree 5
Don't know/ Not applicable 99
E1E
Improve our profile and credibility in foreign markets
Strongly agree 1
Somewhat agree 2
Neutral 3
Somewhat disagree 4
Strongly disagree 5
Don't know/ Not applicable 99
E1F
Improve our knowledge of the competitive environment in foreign market(s)
Strongly agree 1
Somewhat agree 2
Neutral 3
Somewhat disagree 4
Strongly disagree 5
Don't know/ Not applicable 99
E1G
Improve our marketing strategy in foreign market(s)
Strongly agree 1
Somewhat agree 2
Neutral 3
Somewhat disagree 4
Strongly disagree 5
Don't know/ Not applicable 99
E1H
Avoid mistakes, delays or incurring additional costs in pursuing an opportunity
Strongly agree 1
Somewhat agree 2
Neutral 3
Somewhat disagree 4
Strongly disagree 5
Don't know/ Not applicable 99
E1I
Obtain and assess market or industry information which helped us decide whether or not to pursue an opportunity
Strongly agree 1
Somewhat agree 2
Neutral 3
Somewhat disagree 4
Strongly disagree 5
Don't know/ Not applicable 99
E1J
Improve our ability to address regulatory problems or other non-tariff barriers encountered in foreign market
Strongly agree 1
Somewhat agree 2
Neutral 3
Somewhat disagree 4
Strongly disagree 5
Don't know/ Not applicable 99
E1K
Obtain information and assistance on corporate social responsibility
Strongly agree 1
Somewhat agree 2
Neutral 3
Somewhat disagree 4
Strongly disagree 5
Don't know/ Not applicable 99
E1L
Gain confidence to diversify product lines exported or business lines pursued in foreign markets
Strongly agree 1
Somewhat agree 2
Neutral 3
Somewhat disagree 4
Strongly disagree 5
Don't know/ Not applicable 99
E2 [1,11]
Which of the following has your organization done in foreign markets where you received assistance from TCS?
Please select all that apply
Export of goods 1
Export of services 2
New direct investment in my organization 3
Expansion of existing investment in my organization 4
Investment abroad leading to revenue 5
Partnership, joint venture or other alliance leading to revenue 6
Foreign affiliate sales 7
Licensing of technology 8
Attracting angel investors or venture capital 9
Resumption/increase in sales after removal of barrier to market access 10
None 11
Other (please specify) 77
Don't know 99
PE3
What was the extent of the contribution made by the TCS in achieving these results?
E3A
Export of goods
No contribution 1 1
2 2
Moderate or partial contribution 3 3
4 4
Essential contribution 5 5
Don't know 99
E3B
Export of services
No contribution 1 1
2 2
Moderate or partial contribution 3 3
4 4
Essential contribution 5 5
Don't know 99
E3C
New direct investment in my organization
No contribution 1 1
2 2
Moderate or partial contribution 3 3
4 4
Essential contribution 5 5
Don't know 99
E3D
Expansion of existing investment in my organization
No contribution 1 1
2 2
Moderate or partial contribution 3 3
4 4
Essential contribution 5 5
Don't know 99
E3E
Investment abroad leading to revenue
No contribution 1 1
2 2
Moderate or partial contribution 3 3
4 4
Essential contribution 5 5
Don't know 99
E3F
Partnership, joint venture or other alliance leading to revenue
No contribution 1 1
2 2
Moderate or partial contribution 3 3
4 4
Essential contribution 5 5
Don't know 99
E3G
Foreign affiliate sales
No contribution 1 1
2 2
Moderate or partial contribution 3 3
4 4
Essential contribution 5 5
Don't know 99
E3H
Licensing of technology
No contribution 1 1
2 2
Moderate or partial contribution 3 3
4 4
Essential contribution 5 5
Don't know 99
E3I
Attracting angel investors or venture capital
No contribution 1 1
2 2
Moderate or partial contribution 3 3
4 4
Essential contribution 5 5
Don't know 99
E3J
Resumption/increase in sales after removal of barrier to market access
No contribution 1 1
2 2
Moderate or partial contribution 3 3
4 4
Essential contribution 5 5
Don't know 99
E3K
Other (please specify)
No contribution 1 1
2 2
Moderate or partial contribution 3 3
4 4
Essential contribution 5 5
Don't know 99
PE4
Would you have achieved these results without assistance from the TCS?
E4A
Export of goods
Yes, we would have achieved the result without assistance from TCS 1
Yes, but it would have taken longer and/or the financial results would have been lower 2
No, we would not have achieved the result without the TCS 3
Don't know 99
E4B
Export of services
Yes, we would have achieved the result without assistance from TCS 1
Yes, but it would have taken longer and/or the financial results would have been lower 2
No, we would not have achieved the result without the TCS 3
Don't know 99
E4C
New direct investment in my organization
Yes, we would have achieved the result without assistance from TCS 1
Yes, but it would have taken longer and/or the financial results would have been lower 2
No, we would not have achieved the result without the TCS 3
Don't know 99
E4D
Expansion of existing investment in my organization
Yes, we would have achieved the result without assistance from TCS 1
Yes, but it would have taken longer and/or the financial results would have been lower 2
No, we would not have achieved the result without the TCS 3
Don't know 99
E4E
Investment abroad leading to revenue
Yes, we would have achieved the result without assistance from TCS 1
Yes, but it would have taken longer and/or the financial results would have been lower 2
No, we would not have achieved the result without the TCS 3
Don't know 99
E4F
Partnership, joint venture or other alliance leading to revenue
Yes, we would have achieved the result without assistance from TCS 1
Yes, but it would have taken longer and/or the financial results would have been lower 2
No, we would not have achieved the result without the TCS 3
Don't know 99
E4G
Foreign affiliate sales
Yes, we would have achieved the result without assistance from TCS 1
Yes, but it would have taken longer and/or the financial results would have been lower 2
No, we would not have achieved the result without the TCS 3
Don't know 99
E4H
Licensing of technology
Yes, we would have achieved the result without assistance from TCS 1
Yes, but it would have taken longer and/or the financial results would have been lower 2
No, we would not have achieved the result without the TCS 3
Don't know 99
E4I
Attracting angel investors or venture capital
Yes, we would have achieved the result without assistance from TCS 1
Yes, but it would have taken longer and/or the financial results would have been lower 2
No, we would not have achieved the result without the TCS 3
Don't know 99
E4J
Resumption/increase in sales after removal of barrier to market access
Yes, we would have achieved the result without assistance from TCS 1
Yes, but it would have taken longer and/or the financial results would have been lower 2
No, we would not have achieved the result without the TCS 3
Don't know 99
E4K
Other (please specify)
Yes, we would have achieved the result without assistance from TCS 1
Yes, but it would have taken longer and/or the financial results would have been lower 2
No, we would not have achieved the result without the TCS 3
Don't know 99
PE5
Again considering outcomes that TCS information or service helped your organization achieve over the past two years, please provide your best estimate of the financial value each outcome delivered to your organization over the course of 2017 and 2018.
Please remember that your responses are confidential. If you are unsure what financial value was achieved, please answer "don't know."
E5A
Export of goods
Please specify 98
Less than $10,000 1
Between $10,000 and $50,000 2
Between $50,000 and $100,000 3
Between $100,000 and $250,000 4
Between $250,000 and $500,000 5
Between $500,000 and $1 million 6
Between $1 million and $5 million 7
Over $ 5 million 8
Don't know/Not sure 99
E5B
Export of services
Please specify 98
Less than $10,000 1
Between $10,000 and $50,000 2
Between $50,000 and $100,000 3
Between $100,000 and $250,000 4
Between $250,000 and $500,000 5
Between $500,000 and $1 million 6
Between $1 million and $5 million 7
Over $ 5 million 8
Don't know/Not sure 99
E5C
New direct investment in my organization
Please specify 98
Less than $10,000 1
Between $10,000 and $50,000 2
Between $50,000 and $100,000 3
Between $100,000 and $250,000 4
Between $250,000 and $500,000 5
Between $500,000 and $1 million 6
Between $1 million and $5 million 7
Over $ 5 million 8
Don't know/Not sure 99
E5D
Expansion of existing investment in my organization
Please specify 98
Less than $10,000 1
Between $10,000 and $50,000 2
Between $50,000 and $100,000 3
Between $100,000 and $250,000 4
Between $250,000 and $500,000 5
Between $500,000 and $1 million 6
Between $1 million and $5 million 7
Over $ 5 million 8
Don't know/Not sure 99
E5E
Investment abroad leading to revenue
Please specify 98
Less than $10,000 1
Between $10,000 and $50,000 2
Between $50,000 and $100,000 3
Between $100,000 and $250,000 4
Between $250,000 and $500,000 5
Between $500,000 and $1 million 6
Between $1 million and $5 million 7
Over $ 5 million 8
Don't know/Not sure 99
E5F
Partnership, joint venture or other alliance leading to revenue
Please specify 98
Less than $10,000 1
Between $10,000 and $50,000 2
Between $50,000 and $100,000 3
Between $100,000 and $250,000 4
Between $250,000 and $500,000 5
Between $500,000 and $1 million 6
Between $1 million and $5 million 7
Over $ 5 million 8
Don't know/Not sure 99
E5G
Foreign affiliate sales
Please specify 98
Less than $10,000 1
Between $10,000 and $50,000 2
Between $50,000 and $100,000 3
Between $100,000 and $250,000 4
Between $250,000 and $500,000 5
Between $500,000 and $1 million 6
Between $1 million and $5 million 7
Over $ 5 million 8
Don't know/Not sure 99
E5H
Licensing of technology
Please specify 98
Less than $10,000 1
Between $10,000 and $50,000 2
Between $50,000 and $100,000 3
Between $100,000 and $250,000 4
Between $250,000 and $500,000 5
Between $500,000 and $1 million 6
Between $1 million and $5 million 7
Over $ 5 million 8
Don't know/Not sure 99
E5I
Attracting angel investors or venture capital
Please specify 98
Less than $10,000 1
Between $10,000 and $50,000 2
Between $50,000 and $100,000 3
Between $100,000 and $250,000 4
Between $250,000 and $500,000 5
Between $500,000 and $1 million 6
Between $1 million and $5 million 7
Over $ 5 million 8
Don't know/Not sure 99
E5J
Resumption/increase in sales after removal of barrier to market access
Please specify 98
Less than $10,000 1
Between $10,000 and $50,000 2
Between $50,000 and $100,000 3
Between $100,000 and $250,000 4
Between $250,000 and $500,000 5
Between $500,000 and $1 million 6
Between $1 million and $5 million 7
Over $ 5 million 8
Don't know/Not sure 99
E5K
Other (Please specify)
Please specify 98
Less than $10,000 1
Between $10,000 and $50,000 2
Between $50,000 and $100,000 3
Between $100,000 and $250,000 4
Between $250,000 and $500,000 5
Between $500,000 and $1 million 6
Between $1 million and $5 million 7
Over $ 5 million 8
Don't know/Not sure 99
F1
How long has your organization exported goods or services to one or more foreign markets?
Less than one year 1
Between one and two years 2
Between two and five years 3
Between five and 10 years 4
More than 10 years 5
My organization does not currently export goods or services 6
Don't know/Not sure 99
F2
On an annual basis, please provide an estimate of the total value of goods and services your organization exports.
Please specify 98
Less than $1 million 1
$1 million to less than $5 million 2
$5 million to less than $25 million 3
$25 million to less than $100 million 4
$100 million to less than $500 million 5
$500 million to less than $1 billion 6
More than $1 billion 7
Not applicable 96
Decline 97
Don't know 99
F3
Does your organization export goods and services...
Only to the United States 1
To the United States and other foreign markets 2
To foreign markets excluding the United States 3
Don't know/Not sure 99
F4
What are the largest three markets for your organization in terms of the total value of exports?
Please select up to three.
Please specify 998
Afghanistan 1
Albania 2
Algeria 3
American Samoa 4
Andorra 5
Angola 6
Anguilla 7
Antigua and Barbuda 8
Argentina 9
Armenia 10
Aruba 11
Australia 12
Austria 13
Azerbaijan 14
Bahamas 15
Bahrain 16
Bangladesh 17
Barbados 18
Belarus 19
Belgium 20
Belize 21
Benin 22
Bermuda 23
Bhutan 24
Bolivia 25
Bosnia and Herzegovina 26
Botswana 27
Bouvet Island 28
Brazil 29
Brunei Darussalam 30
Bulgaria 31
Burkina Faso 32
Burundi 33
Cambodia 34
Cameroon 35
Cape Verde 36
Cayman Islands 37
Central African Republic 38
Chad 39
Chile 40
China 41
Christmas Island 42
Cocos (Keeling) Islands 43
Colombia 44
Comoros 45
Congo 46
Cook Islands 47
Costa Rica 48
Côte D'Ivoire 49
Croatia 50
Cuba 51
Curaçao 52
Cyprus 53
Czech Republic 54
Denmark 55
Djibouti 56
Dominica 57
Dominican Republic 58
Ecuador 59
Egypt 60
El Salvador 61
Eritrea 62
Estonia 63
Ethiopia 64
Equatorial Guinea 65
Faroe Islands 66
Fiji 67
Finland 68
France 69
French Guiana 70
French Polynesia 71
Gabon 72
Gambia 73
Georgia 74
Germany 75
Ghana 76
Gibraltar 77
Greece 78
Greenland 79
Grenada 80
Guadeloupe 81
Guam 82
Guatemala 83
Guinea 84
Guinea-Bissau 85
Guyana 86
Haiti 87
Heard Island and McDonald Islands 88
Honduras 89
Hong Kong 90
Hungary 91
Iceland 92
India 93
Indonesia 94
Iran 95
Iraq 96
Ireland 97
Israel 98
Italy 99
Jamaica 100
Japan 101
Jordan 102
Kazakhstan 103
Kenya 104
Kiribati 105
Kuwait 106
Kyrgyzstan 107
Laos 108
Latvia 109
Lebanon 110
Lesotho 111
Liberia 112
Libya 113
Liechtenstein 114
Lithuania 115
Luxembourg 116
Macau 117
Macedonia 118
Madagascar 119
Malawi 120
Malaysia 121
Maldives 122
Mali 123
Malta 124
Marshall Islands 125
Martinique 126
Mauritania 127
Mauritius 128
Mayotte 129
Mexico 130
Micronesia, Federated States of 131
Moldova 132
Monaco 133
Mongolia 134
Montenegro 135
Montserrat 136
Morocco 137
Mozambique 138
Myanmar 139
Namibia 140
Nauru 141
Nepal 142
Netherlands 143
Netherlands Antilles 144
New Caledonia 145
New Zealand 146
Nicaragua 147
Niger 148
Nigeria 149
Niue 150
Norfolk Island 151
Northern Mariana Islands 152
North Korea 153
Norway 154
Oman 155
Pakistan 156
Palau 157
Palestinian Territory 158
Panama 159
Papua New Guinea 160
Paraguay 161
Peru 162
Philippines 163
Pitcairn Islands 164
Poland 165
Portugal 166
Qatar 167
Reunion 168
Romania 169
Russian Federation 170
Rwanda 171
Saint Vincent and the Grenadines 172
Saint Barthelemy 173
Saint Kitts and Nevis 174
Saint Lucia 175
Saint Martin 176
Samoa 177
San Marino 178
Sao Tome and Principe 179
Saudi Arabia 180
Senegal 181
Serbia 182
Seychelles 183
Sierra Leone 184
Singapore 185
Saint Maarten (Dutch part) 186
Slovakia 187
Slovenia 188
Solomon Islands 189
Somalia 190
South Africa 191
South Korea 192
South Sudan 193
Spain 194
Sri Lanka 195
Sudan 196
Suriname 197
Swaziland 198
Sweden 199
Switzerland 200
Syria 201
Taiwan 202
Tajikistan 203
Tanzania 204
Thailand 205
Timor-Leste 206
Togo 207
Tokelau 208
Tonga 209
Trinidad and Tobago 210
Tunisia 211
Turkey 212
Turkmenistan 213
Turks and Caicos Islands 214
Tuvalu 215
Uganda 216
Ukraine 217
United Arab Emirates 218
United Kingdom 219
United States 220
United States Minor Outlying Islands 221
Uruguay 222
Uzbekistan 223
Vanuatu 224
Venezuela 225
Vietnam 226
Wallis and Futuna 227
Western Sahara 228
Yemen 229
Zambia 230
Zimbabwe 231
Don't know / No response 9999
F5
Which three markets do you expect to be the fastest growing markets for your exports over the next three years?
Please select up to three.
PF6
How challenging do you consider each of the following issues to be? Please rate your view using the scale provided.
F6A
Administrative obstacles in Canada (e.g., rules, regulations and legal requirements)
No challenge at all 1
Minor challenge 2
Moderate challenge 3
Major challenge 4
Don't know/ Not applicable 99
F6B
Administrative obstacles outside of Canada (e.g., foreign customer requirements, product standards, technology requirements)
No challenge at all 1
Minor challenge 2
Moderate challenge 3
Major challenge 4
Don't know/ Not applicable 99
F6C
Border obstacles (e.g., tariffs, non-tariff barriers, import quotas, customs duties, and border security issues)
No challenge at all 1
Minor challenge 2
Moderate challenge 3
Major challenge 4
Don't know/ Not applicable 99
F6D
Logistical obstacles (e.g., transportation costs, and brokerage fees)
No challenge at all 1
Minor challenge 2
Moderate challenge 3
Major challenge 4
Don't know/ Not applicable 99
F6E
Market knowledge issues (e.g., lack of knowledge of local language and culture, unaware of potential export markets)
No challenge at all 1
Minor challenge 2
Moderate challenge 3
Major challenge 4
Don't know/ Not applicable 99
F6F
Intellectual property issues (e.g., concerns of violation of IP rights)
No challenge at all 1
Minor challenge 2
Moderate challenge 3
Major challenge 4
Don't know/ Not applicable 99
F6G
Lack of financing/inadequate cash-flow
No challenge at all 1
Minor challenge 2
Moderate challenge 3
Major challenge 4
Don't know/ Not applicable 99
F6H
Financial risk (e.g., longer payment terms or risk of non-payment from customers)
No challenge at all 1
Minor challenge 2
Moderate challenge 3
Major challenge 4
Don't know/ Not applicable 99
G1 [1,5]
To the best of your knowledge, does your organisation identify to one or more of the following type of businesses?
Women owned 1
Indigenous owned 2
LBGTQ2 owned 3
Visible minority owned 4
Persons with a disability owned 5
None of the above 98
Don't know/Not sure 99
QH1
The following questions about your organization will help with the analysis of survey results. Please note that all information collected in the survey will be reported in aggregate form only. Information that could identify individual organizations or businesses will remain confidential.
Which of the following best describe your role at your company?
Executive 1
Middle Management 2
Employee 3
Consultant/Sole Proprietor 4
Other (please specify) 77
Decline 98
QH2
Using your best estimate, how many employees do you have in your organization? (Please include employees from all locations in your organization, within and outside of Canada.)
Self-employed 1
1 to 9 2
10 to 49 3
50 to 99 4
100 to 249 5
250 to 499 6
500 or more 7
Don't know 99
Decline 98
QH3
What were your organization's total worldwide sales (including domestic sales) in Canadian dollars for your organization's most recent annual financial reporting period?
Less than $1 million 1
$1 million to less than $5 million 2
$5 million to less than $25 million 3
$25 million to less than $100 million 4
$100 million to less than $500 million 5
$500 million to less than $1 billion 6
More than $1 billion 7
Not applicable 97
Decline 98
Don't know 99
I1
As part of this research, we are interviewing a few randomly selected respondents. The interviews would be conducted by telephone, would take about a half hour to complete and we would provide an incentive of $100 in thanks for your participation.
Would you be willing to participate in an interview?
Yes, you can contact me at the same email address 1
Yes, use phone as preferred means. 2
Yes, contact me at the following email address 3
No thanks 99
I2
Great! We'll be in touch with you if you are selected to participate. Please kindly provide the best telephone number to use in order to schedule the interview.
Please provide your telephone number with area code and no spaces.
Telephone: 77
THNK
Thank you for taking the time to complete this survey. Your input is valuable as we seek to enhance the services we offer to Canadian exporters. If you have any further questions regarding this survey, please contact TCSsurvey-sondageSDC@international.gc.ca.
Visit ekos.com
Appendix C: Interview Guide
Ekos plans to conduct 40 one-on-one, in-depth interviews among a selection of survey respondents willing to participate in an interview.
The screening criteria for the interviews will be based on the responses that potential recruits gave during the survey. Ultimately, the nature of the segmentation will depend on how many participants agree to do a follow up and how they responded in the survey.
As a practical matter, we suggest segmentation approaches that separate participants based on important dichotomies, such as:
Using dichotomies like the above, we would establish minimum numbers of participants fitting each of the criteria above. For example, we could look to complete a minimum of 10 interviews with participants fitting each criteria (i.e., more satisfied, less satisfied, time-sensitive needs, non-time-sensitive needs, experienced, less experienced, larger and smaller companies). Some participants may match several criteria; others only one. The objective would be to reach the minimum targets within the 40 interviews, resulting in recruits who represent a diverse array of views with respect to TCS.
Thank you for agreeing to complete this interview. Before we begin, it is important to note the following things:
Let's start by getting to know you a bit better...
Can you please describe the last interaction you had with TCS?
Is there some information or service that TCS provides which you have found to be particularly helpful to your business?
In what areas do you think TCS could do a better job providing information or service to businesspeople like you?
When you approach TCS, is it typically to solve an immediate or pressing problem you're having or is it to get information and service that may be important, but isn't necessarily to solve an immediate issue you're having?
Thinking about your interactions with TCS in the past, can you please describe your experience with TCS staff...
Looking ahead, what would you describe as the major challenges you face in doing business internationally?
You indicated in the survey that you export... [only to the US/ only to countries other than the US/ to the US and other countries].
If you had to describe the TCS using a single word or phrase, what would it be, and why?
Are there other organizations or professionals who offer information or service comparable to what you can get from TCS?
Are there any final comments? Any essential piece of advice you would offer to the people working on making TCS more responsive to your needs?
Appendix D: Detailed Segmentation Tables
| -- | -- | -- | SME Executives | SME Globalists | Big - Luke Warm | Big - Ecstatic |
|---|---|---|---|---|---|---|
| -- | -- | All respondents | 1 | 2 | 3 | 4 |
| Base | -- | 2965 | 270 | 447 | 1030 | 895 |
| Region | B.C. | 24% | 18% | 27% | 24% | 23% |
| - | Alberta | 11% | 10% | 12% | 11% | 13% |
| - | Sask./Man. | 5% | 5% | 4% | 5% | 5% |
| - | Ontario | 34% | 40% | 35% | 33% | 33% |
| - | Quebec | 18% | 22% | 15% | 18% | 16% |
| - | Atlantic | 8% | 5% | 7% | 9% | 10% |
| Organization | SME | 75% | 84% | 72% | 76% | 74% |
| Type | Large | 15% | 8% | 14% | 16% | 16% |
| - | Partner | 8% | 5% | 10% | 7% | 9% |
| - | Unspecified | 2% | 3% | 4% | 2% | 2% |
| TCS | Qualified contacts | 38% | 41% | 40% | 36% | 37% |
| Services | Market potential assessment | 21% | 19% | 21% | 21% | 23% |
| - | Referral | 16% | 12% | 15% | 18% | 15% |
| - | Prep for international markets | 13% | 17% | 11% | 14% | 12% |
| - | Additional service | 7% | 5% | 7% | 7% | 7% |
| - | Problem Solving | 5% | 6% | 6% | 4% | 5% |
| TCS | International Bus Development | 92% | 95% | 93% | 91% | 91% |
| Business | Science, Tech. & Innovation | 7% | 4% | 5% | 7% | 8% |
| Line | Foreign Direct Inv in Canada | 1% | 1% | 2% | 2% | 1% |
| - | Trade Policy | 0% | 0% | 0% | 0% | 0% |
| Role at | Executive | 61% | 72% | 62% | 62% | 59% |
| Company | Middle Management | 21% | 15% | 20% | 21% | 24% |
| - | Employee | 10% | 6% | 9% | 9% | 9% |
| - | Consultant/Sole Proprietor | 8% | 7% | 9% | 8% | 8% |
| # of | <10 | 28% | 30% | 30% | 27% | 27% |
| Employees | 10-99 | 40% | 41% | 38% | 42% | 39% |
| - | 100-499 | 14% | 15% | 13% | 14% | 14% |
| - | 500+ | 18% | 13% | 19% | 18% | 20% |
| Sales | <$1m | 31% | 30% | 35% | 28% | 31% |
| - | $1-$5m | 24% | 29% | 21% | 25% | 23% |
| - | $5-$25m | 23% | 18% | 21% | 25% | 22% |
| - | $25m-$1b | 19% | 20% | 19% | 20% | 22% |
| - | $1b+ | 2% | 3% | 3% | 2% | 2% |
| Markets | Only to the United States | 7% | 10% | 7% | 6% | 7% |
| - | To the United States and other foreign markets | 70% | 67% | 67% | 72% | 70% |
| - | To foreign markets excluding the United States | 23% | 22% | 26% | 22% | 23% |
| Summary of | Key Proactive Sectors | 40% | 39% | 39% | 44% | 38% |
| Sectors | Key Responsive Sectors / All Other Sectors | 39% | 39% | 44% | 36% | 40% |
| - | Ongoing Proactive Sectors | 20% | 22% | 17% | 21% | 23% |
| Experience | Less than one year | 4% | 5% | 4% | 4% | 4% |
| as Exporter | Between one and two years | 8% | 7% | 8% | 9% | 8% |
| - | Between two and five years | 16% | 17% | 17% | 16% | 17% |
| - | Between five and 10 years | 15% | 16% | 18% | 15% | 15% |
| - | More than 10 years | 52% | 52% | 48% | 53% | 52% |
| - | My organization does not currently export goods or services | 3% | 3% | 4% | 3% | 2% |
| -- | -- | SME Executives | SME Globalists | Big - Luke Warm | Big - Ecstatic |
|---|---|---|---|---|---|
| -- | All respondents | 1 | 2 | 3 | 4 |
| Base | 2779 | 256 | 438 | 1002 | 884 |
| Staff understood my business | 85% | 43% | 97% | 83% | 95% |
| Provided with useful intel on market conditions | 82% | 39% | 98% | 78% | 93% |
| Provided with appropriate contacts | 78% | 34% | 97% | 72% | 89% |
| Took a reasonable amount of time to get service | 78% | 32% | 96% | 72% | 89% |
| Was provided intelligence that identified opportunities and potential difficulties | 78% | 36% | 95% | 71% | 88% |
| Provided with intel that helped address problem(s) | 77% | 31% | 97% | 71% | 89% |
| Have received consistent quality of service | 75% | 47% | 89% | 70% | 83% |
| Provided useful intel on local companies/organizations | 72% | 26% | 94% | 62% | 86% |
| Provided with contacts when staff could not assist directly | 71% | 21% | 96% | 61% | 86% |
| Gain confidence to explore or expand in a foreign market | 68% | 16% | 98% | 53% | 85% |
| Gain access to customers and partners that would have been difficult to obtain without the support of the TCS | 66% | 14% | 97% | 53% | 82% |
| Gain access to intelligence and information that would have been difficult to obtain without the support of the TCS | 70% | 18% | 98% | 55% | 89% |
| Overcome or avoid barriers to new foreign business opportunities | 54% | 2% | 99% | 23% | 84% |
| Improve our profile and credibility in foreign markets | 67% | 15% | 97% | 51% | 84% |
| Improve our knowledge of the competitive environment in foreign market(s) | 65% | 10% | 98% | 47% | 87% |
| Improve our marketing strategy in foreign market(s) | 55% | 1% | 99% | 24% | 86% |
| Avoid mistakes, delays or incurring additional costs in pursuing an opportunity | 53% | 0% | 99% | 18% | 85% |
| Obtain and assess market or industry information which helped us decide whether or not to pursue an opportunity | 63% | 8% | 98% | 42% | 85% |
| Improve our ability to address regulatory problems or other non-tariff barriers encountered in foreign market | 49% | 1% | 98% | 14% | 77% |
| Obtain information and assistance on corporate social responsibility | 38% | 2% | 92% | 9% | 53% |
| Gain confidence to diversify product lines exported or business lines pursued in foreign markets | 43% | 1% | 99% | 11% | 64% |
| -- | -- | -- | SME Executives | SME Globalists | Big - Luke Warm | Big - Ecstatic |
|---|---|---|---|---|---|---|
| -- | -- | All respondents | 1 | 2 | 3 | 4 |
| Overall Satisfaction | Very Satisfied/Satisfied | 83% | 32% | 99% | 81% | 96% |
| - | Neutral | 12% | 31% | 1% | 17% | 4% |
| - | Very Dissatisfied/ Dissatisfied | 5% | 38% | 0% | 2% | 0% |
| - | Total | 2871 | 262 | 446 | 1024 | 893 |
| Likelihood to | Definitely/Probably | 85% | 38% | 99% | 83% | 96% |
| Recommend | Possibly | 11% | 30% | 1% | 15% | 3% |
| - | Definitely/Probably Not | 4% | 32% | 0% | 3% | 0% |
| - | Total | 2873 | 256 | 446 | 1021 | 894 |
| Likelihood to Use Again | Definitely/Probably | 87% | 49% | 98% | 86% | 98% |
| - | Possibly | 10% | 32% | 2% | 13% | 2% |
| - | Definitely/Probably Not | 2% | 20% | 0% | 1% | 0% |
| - | Total | 2554 | 251 | 416 | 983 | 845 |
| -- | -- | -- | SME Executives | SME Globalists | Big - Luke Warm | Big - Ecstatic |
|---|---|---|---|---|---|---|
| -- | -- | All respondents | 1 | 2 | 3 | 4 |
| Market intelligence and Information | Great deal/Some Assistance | 87% | 79% | 96% | 85% | 90% |
| - | Moderate Assistance | 0% | 0% | 0% | 0% | 0% |
| - | Little/No Assistance | 13% | 21% | 4% | 15% | 10% |
| - | Total | 2596 | 245 | 394 | 948 | 807 |
| Referrals to professional service | Great deal/Some Assistance | 57% | 49% | 75% | 48% | 65% |
| providers | Moderate Assistance | 0% | 0% | 0% | 0% | 0% |
| - | Little/No Assistance | 43% | 51% | 25% | 52% | 35% |
| - | Total | 2462 | 225 | 376 | 911 | 760 |
| Support for IP rights, govt. procurement | Great deal/Some Assistance | 57% | 46% | 73% | 49% | 63% |
| and/or regulations | Moderate Assistance | 0% | 0% | 0% | 0% | 0% |
| - | Little/No Assistance | 43% | 54% | 27% | 51% | 38% |
| - | Total | 2741 | 259 | 415 | 993 | 844 |
| Referrals to intl. opportunities/sales | Great deal/Some Assistance | 85% | 78% | 93% | 82% | 88% |
| leads | Moderate Assistance | 0% | 0% | 0% | 0% | 0% |
| - | Little/No Assistance | 15% | 22% | 7% | 18% | 12% |
| - | Total | 2391 | 224 | 365 | 871 | 743 |
| Referral to tech and/or RD partnerships | Great deal/Some Assistance | 56% | 46% | 76% | 48% | 58% |
| - | Moderate Assistance | 0% | 0% | 0% | 0% | 0% |
| - | Little/No Assistance | 44% | 54% | 24% | 52% | 42% |
| - | Total | 2533 | 242 | 396 | 897 | 799 |
| Referrals to relevant programs and services | Great deal/Some Assistance | 73% | 67% | 87% | 66% | 76% |
| - | Moderate Assistance | 0% | 0% | 0% | 0% | 0% |
| - | Little/No Assistance | 27% | 33% | 13% | 34% | 24% |
| - | Total | 2446 | 227 | 377 | 898 | 750 |
| Info on locating financial/funding | Great deal/Some Assistance | 58% | 48% | 67% | 52% | 62% |
| assistance | Moderate Assistance | 0% | 0% | 0% | 0% | 0% |
| - | Little/No Assistance | 42% | 52% | 33% | 48% | 38% |
| - | Total | 2775 | 257 | 426 | 997 | 860 |
| Recommendations on trade fairs/ trade | Great deal/Some Assistance | 77% | 63% | 92% | 71% | 83% |
| missions | Moderate Assistance | 0% | 0% | 0% | 0% | 0% |
| - | Little/No Assistance | 23% | 37% | 8% | 29% | 17% |
| - | Total | 2669 | 248 | 417 | 966 | 826 |
| Advice on timing and organizing a trip | Great deal/Some Assistance | 57% | 42% | 79% | 48% | 66% |
| - | Moderate Assistance | 0% | 0% | 0% | 0% | 0% |
| - | Little/No Assistance | 43% | 58% | 21% | 52% | 34% |
| - | Total | 2778 | 255 | 433 | 998 | 859 |
| Info on organizations or companies | Great deal/Some Assistance | 84% | 76% | 94% | 80% | 90% |
| - | Moderate Assistance | 0% | 0% | 0% | 0% | 0% |
| - | Little/No Assistance | 16% | 24% | 6% | 20% | 10% |
| - | Total | 2705 | 251 | 426 | 973 | 837 |
| Understanding responsible business | Great deal/Some Assistance | 73% | 56% | 89% | 66% | 81% |
| practices abroad | Moderate Assistance | 0% | 0% | 0% | 0% | 0% |
| - | Little/No Assistance | 27% | 44% | 11% | 34% | 19% |
| - | Total | 2689 | 251 | 410 | 977 | 822 |
| The value of the Canadian dollar | Great deal/Some Assistance | 66% | 66% | 68% | 68% | 64% |
| - | Moderate Assistance | 0% | 0% | 0% | 0% | 0% |
| - | Little/No Assistance | 34% | 34% | 32% | 32% | 36% |
| - | Total | 2336 | 231 | 361 | 867 | 695 |
| Canadian export taxes or permits | Great deal/Some Assistance | 69% | 71% | 70% | 70% | 68% |
| - | Moderate Assistance | 0% | 0% | 0% | 0% | 0% |
| - | Little/No Assistance | 31% | 29% | 30% | 30% | 32% |
| - | Total | 2602 | 251 | 400 | 951 | 781 |
| Uncertainty of regulatory requirements | Great deal/Some Assistance | 38% | 39% | 43% | 42% | 32% |
| in other countries | Moderate Assistance | 0% | 0% | 0% | 0% | 0% |
| - | Little/No Assistance | 62% | 61% | 57% | 58% | 68% |
| - | Total | 2456 | 242 | 382 | 907 | 724 |
| Foreign tariffs or trade barriers | Great deal/Some Assistance | 48% | 50% | 47% | 50% | 45% |
| - | Moderate Assistance | 0% | 0% | 0% | 0% | 0% |
| - | Little/No Assistance | 52% | 50% | 53% | 50% | 55% |
| - | Total | 2075 | 203 | 327 | 785 | 622 |
| Discriminatory or arbitrary treatment | Great deal/Some Assistance | 71% | 69% | 72% | 73% | 70% |
| toward Canadian | Moderate Assistance | 0% | 0% | 0% | 0% | 0% |
| investors or their investments | Little/No Assistance | 29% | 31% | 28% | 27% | 30% |
| - | Total | 2432 | 236 | 371 | 902 | 728 |
| Lack of access to | Great deal/Some Assistance | 47% | 46% | 48% | 50% | 45% |
| financing or funding | Moderate Assistance | 0% | 0% | 0% | 0% | 0% |
| - | Little/No Assistance | 53% | 54% | 52% | 50% | 55% |
| - | Total | 2284 | 226 | 357 | 846 | 669 |
| Concern of violation of | Great deal/Some Assistance | 53% | 53% | 54% | 55% | 52% |
| your patents and/or | Moderate Assistance | 0% | 0% | 0% | 0% | 0% |
| intellectual property rights | Little/No Assistance | 47% | 47% | 46% | 45% | 48% |
| - | Total | 2773 | 263 | 425 | 994 | 849 |
| Linguistic or cultural Obstacles | Great deal/Some Assistance | 66% | 66% | 66% | 67% | 63% |
| - | Moderate Assistance | 0% | 0% | 0% | 0% | 0% |
| - | Little/No Assistance | 34% | 34% | 34% | 33% | 37% |
| - | Total | 2420 | 236 | 372 | 905 | 728 |
| Labour availability and skills | Great deal/Some Assistance | 67% | 66% | 68% | 70% | 66% |
| - | Moderate Assistance | 0% | 0% | 0% | 0% | 0% |
| - | Little/No Assistance | 33% | 34% | 32% | 30% | 34% |
| - | Total | 2344 | 228 | 357 | 864 | 716 |
| Corruption | Great deal/Some Assistance | 56% | 62% | 57% | 56% | 53% |
| - | Moderate Assistance | 0% | 0% | 0% | 0% | 0% |
| - | Little/No Assistance | 44% | 38% | 43% | 44% | 47% |
| - | Total | 2598 | 255 | 396 | 951 | 788 |
| Lack of information about international | Great deal/Some Assistance | 47% | 34% | 50% | 50% | 47% |
| business opportunities | Moderate Assistance | 0% | 0% | 0% | 0% | 0% |
| (i.e. export sales leads) | Little/No Assistance | 53% | 66% | 50% | 50% | 53% |
| - | Total | 2634 | 258 | 405 | 964 | 799 |
| Lack of market contacts such as potential | Great deal/Some Assistance | 42% | 30% | 44% | 43% | 42% |
| buyers and partners, | Moderate Assistance | 0% | 0% | 0% | 0% | 0% |
| technology sources, agents, etc. | Little/No Assistance | 58% | 70% | 56% | 57% | 58% |
| - | Total | 2861 | 265 | 445 | 1020 | 891 |
| -- | -- | -- | SME Executives | SME Globalists | Big - Luke Warm | Big - Ecstatic |
|---|---|---|---|---|---|---|
| -- | -- | All respondents | 1 | 2 | 3 | 4 |
| Export of goods | Major/Moderate | 70% | 35% | 88% | 62% | 81% |
| - | Minimal | 25% | 61% | 9% | 35% | 15% |
| - | DK | 5% | 4% | 3% | 4% | 5% |
| - | Total | 920 | 62 | 179 | 326 | 319 |
| Export of services | Major/Moderate | 70% | 26% | 87% | 61% | 81% |
| - | Minimal | 24% | 71% | 9% | 33% | 14% |
| - | DK | 6% | 3% | 4% | 6% | 5% |
| - | Total | 126 | 9 | 33 | 35 | 47 |
| New direct investment | Major/Moderate | 62% | 33% | 76% | 54% | 64% |
| in my organization | Minimal | 29% | 44% | 21% | 40% | 26% |
| - | DK | 9% | 22% | 3% | 6% | 11% |
| - | Total | 156 | 6 | 47 | 35 | 62 |
| Expansion of existing | Major/Moderate | 67% | 50% | 81% | 54% | 68% |
| investment in my | Minimal | 23% | 50% | 11% | 37% | 23% |
| organization | DK | 10% | 0% | 9% | 9% | 10% |
| - | Total | 174 | 11 | 41 | 50 | 68 |
| Investment abroad | Major/Moderate | 60% | 27% | 85% | 44% | 65% |
| leading to revenue | Minimal | 34% | 64% | 12% | 52% | 26% |
| - | DK | 6% | 9% | 2% | 4% | 9% |
| - | Total | 643 | 25 | 135 | 220 | 247 |
| Partnership, joint | Major/Moderate | 74% | 28% | 84% | 66% | 81% |
| venture or other alliance | Minimal | 22% | 68% | 15% | 30% | 15% |
| leading to revenue | DK | 4% | 4% | 1% | 4% | 4% |
| - | Total | 144 | 5 | 35 | 39 | 64 |
| Foreign affiliate sales | Major/Moderate | 71% | 20% | 86% | 56% | 77% |
| - | Minimal | 25% | 80% | 9% | 41% | 19% |
| - | DK | 4% | 0% | 6% | 3% | 5% |
| - | Total | 160 | 9 | 37 | 49 | 63 |
| Licensing of technology | Major/Moderate | 57% | 11% | 78% | 43% | 63% |
| - | Minimal | 31% | 67% | 16% | 45% | 24% |
| - | DK | 12% | 22% | 5% | 12% | 13% |
| - | Total | 125 | 2 | 23 | 49 | 48 |
| Attracting angel | Major/Moderate | 62% | 50% | 96% | 41% | 69% |
| investors or venture | Minimal | 29% | 50% | 4% | 47% | 23% |
| capital | DK | 9% | 0% | 0% | 12% | 8% |
| - | Total | 126 | 5 | 43 | 29 | 49 |
| Resumption/increase in | Major/Moderate | 76% | 20% | 81% | 79% | 76% |
| sales after removal of | Minimal | 19% | 60% | 19% | 21% | 14% |
| barrier to market access | DK | 5% | 20% | 0% | 0% | 10% |
| - | Total | 1018 | 72 | 182 | 370 | 351 |
| Export of goods | More time, less money or would not have happened | 64% | 21% | 86% | 51% | 79% |
| - | Would have achieved without TCS | 26% | 69% | 8% | 34% | 15% |
| - | DK | 10% | 10% | 6% | 15% | 6% |
| - | Total | 920 | 62 | 179 | 326 | 319 |
| Export of services | More time, less money or would not have happened | 65% | 18% | 83% | 53% | 78% |
| - | Would have achieved without TCS | 25% | 77% | 12% | 35% | 12% |
| - | DK | 10% | 5% | 6% | 12% | 10% |
| - | Total | 126 | 9 | 33 | 35 | 47 |
| New direct investment in my organization | More time, less money or would not have happened | 58% | 11% | 79% | 54% | 57% |
| - | Would have achieved without TCS | 26% | 78% | 15% | 23% | 26% |
| - | DK | 16% | 11% | 6% | 23% | 17% |
| - | Total | 156 | 6 | 47 | 35 | 62 |
| Expansion of existing investment in my organization | More time, less money or would not have happened | 63% | 0% | 77% | 63% | 61% |
| - | Would have achieved without TCS | 25% | 100% | 11% | 29% | 26% |
| - | DK | 12% | 0% | 13% | 9% | 13% |
| - | Total | 174 | 11 | 41 | 50 | 68 |
| Investment abroad leading to revenue | More time, less money or would not have happened | 57% | 9% | 78% | 46% | 62% |
| - | Would have achieved without TCS | 33% | 91% | 20% | 46% | 22% |
| - | DK | 10% | 0% | 2% | 8% | 16% |
| - | Total | 643 | 25 | 135 | 220 | 247 |
| Partnership, joint venture or other alliance leading to revenue | More time, less money or would not have happened | 69% | 20% | 84% | 60% | 74% |
| - | Would have achieved without TCS | 21% | 72% | 10% | 27% | 15% |
| - | DK | 11% | 8% | 7% | 12% | 11% |
| - | Total | 144 | 5 | 35 | 39 | 64 |
| Foreign affiliate sales | More time, less money or would not have happened | 70% | 40% | 86% | 59% | 72% |
| - | Would have achieved without TCS | 19% | 60% | 6% | 28% | 17% |
| - | DK | 10% | 0% | 9% | 13% | 11% |
| - | Total | 160 | 9 | 37 | 49 | 63 |
| Licensing of technology | More time, less money or would not have happened | 53% | 11% | 76% | 43% | 56% |
| - | Would have achieved without TCS | 31% | 78% | 14% | 41% | 25% |
| - | DK | 16% | 11% | 11% | 16% | 19% |
| - | Total | 125 | 2 | 23 | 49 | 48 |
| Attracting angel investors or venture capital | More time, less money or would not have happened | 62% | 0% | 87% | 53% | 60% |
| - | Would have achieved without TCS | 23% | 50% | 4% | 29% | 27% |
| - | DK | 15% | 50% | 9% | 18% | 13% |
| - | Total | 126 | 4 | 44 | 29 | 49 |
| Resumption/increase in sales after removal of barrier to market access | More time, less money or would not have happened | 82% | 50% | 91% | 72% | 82% |
| - | Would have achieved without TCS | 8% | 50% | 2% | 21% | 2% |
| - | DK | 10% | 0% | 7% | 7% | 16% |
| - | Total | 1018 | 72 | 182 | 370 | 351 |
| Export of goods | $500k+ | 19% | 17% | 28% | 15% | 19% |
| - | $100k to $500k | 14% | 13% | 15% | 14% | 16% |
| - | $100k or less | 31% | 39% | 29% | 32% | 28% |
| - | Other/DK | 36% | 32% | 27% | 39% | 37% |
| - | Total | 920 | 62 | 179 | 326 | 319 |
| Export of services | $500k+ | 13% | 16% | 18% | 13% | 12% |
| - | $100k to $500k | 13% | 10% | 19% | 10% | 14% |
| - | $100k or less | 34% | 44% | 26% | 35% | 35% |
| - | Other/DK | 40% | 31% | 37% | 42% | 39% |
| - | Total | 126 | 9 | 33 | 35 | 47 |
| New direct investment | $500k+ | 27% | 11% | 39% | 26% | 23% |
| in my organization | $100k to $500k | 11% | 0% | 3% | 14% | 15% |
| - | $100k or less | 21% | 56% | 12% | 29% | 17% |
| - | Other/DK | 40% | 33% | 45% | 31% | 45% |
| - | Total | 156 | 6 | 47 | 35 | 62 |
| Expansion of existing | $500k+ | 19% | 33% | 30% | 11% | 16% |
| investment in my | $100k to $500k | 15% | 0% | 9% | 17% | 23% |
| organization | $100k or less | 19% | 67% | 13% | 23% | 16% |
| - | Other/DK | 47% | 0% | 49% | 49% | 45% |
| - | Total | 174 | 11 | 41 | 50 | 68 |
| Investment abroad | $500k+ | 21% | 9% | 34% | 18% | 19% |
| leading to revenue | $100k to $500k | 11% | 9% | 10% | 12% | 13% |
| - | $100k or less | 24% | 55% | 20% | 26% | 21% |
| - | Other/DK | 44% | 27% | 37% | 44% | 47% |
| - | Total | 643 | 25 | 135 | 220 | 247 |
| Partnership, joint | $500k+ | 10% | 0% | 15% | 9% | 11% |
| venture or other alliance | $100k to $500k | 11% | 8% | 13% | 10% | 12% |
| leading to revenue | $100k or less | 28% | 44% | 30% | 28% | 25% |
| - | Other/DK | 51% | 48% | 43% | 53% | 53% |
| - | Total | 144 | 5 | 35 | 39 | 64 |
| Foreign affiliate sales | $500k+ | 17% | 0% | 14% | 13% | 20% |
| - | $100k to $500k | 12% | 0% | 11% | 18% | 9% |
| - | $100k or less | 34% | 40% | 34% | 44% | 28% |
| - | Other/DK | 38% | 60% | 40% | 26% | 42% |
| - | Total | 160 | 9 | 37 | 49 | 63 |
| Licensing of technology | $500k+ | 11% | 11% | 19% | 8% | 8% |
| - | $100k to $500k | 11% | 0% | 14% | 10% | 13% |
| - | $100k or less | 29% | 22% | 27% | 29% | 32% |
| - | Other/DK | 49% | 67% | 41% | 53% | 48% |
| - | Total | 125 | 2 | 23 | 49 | 48 |
| Attracting angel | $500k+ | 18% | 0% | 22% | 16% | 19% |
| investors or venture | $100k to $500k | 14% | 50% | 22% | 8% | 15% |
| capital | $100k or less | 17% | 50% | 13% | 22% | 13% |
| - | Other/DK | 51% | 0% | 43% | 53% | 54% |
| - | Total | 126 | 5 | 43 | 29 | 49 |
| Resumption/increase in | $500k+ | 22% | 20% | 28% | 17% | 20% |
| sales after removal of | $100k to $500k | 17% | 20% | 14% | 28% | 14% |
| barrier to market access | $100k or less | 19% | 40% | 21% | 14% | 18% |
| - | Other/DK | 41% | 20% | 37% | 41% | 47% |
| - | Total | 2332 | 226 | 355 | 843 | 705 |