This report summarizes results from a survey of 2,043 Canadians.
Cette publication est aussi disponible en français sous le titre : Attitudes des Canadiens à l'égard du commerce international
This publication may be reproduced for non-commercial purposes only. Prior written permission must be obtained from Global Affairs Canada. For more information on this report, please contact Global Affairs Canada at: POR-ROP@international.gc.ca
Catalogue number: 978-0-660-38198-5
International Standard Book Number (ISBN): FR5-174/2021E-PDF
In alignment with the Trade Diversification Strategy, Global Affairs Canada (GAC) is pursuing efforts to help Canada diversify its trade abroad. This strategy includes efforts to advance an inclusive approach to trade that seeks to ensure that the benefits and opportunities from trade are more widely shared among all Canadians. In support of these efforts, a baseline survey of Canadians was conducted in February 2020 to provide trade communicators with a clear view of public attitudes toward trade, to help inform messaging and communications (including products such as speeches, interview briefs, news releases, and social media).
Recognizing that efforts to mitigate the spread of COVID-19 – including border restrictions and global supply chain disruptions for medical equipment and supplies – could have affected public attitudes toward trade, a follow-up study was conducted in February 2021.
The research objectives of the study were as follows:
To determine Canadians' level of understanding and interest of general trade issues;
To determine the level of understanding of the benefits of trade, including foreign direct investment;
To determine Canadians' views on trade with various countries and sectors;
To determine the level of understanding of inclusive trade elements (women, indigenous, LGBTQ2) and sustainable development (labour, environmental protections);
To determine Canadians' awareness of Canada's free trade agreements;
To determine Canadians' awareness of government programs, services and agencies; and
To determine how Canadians feel directly impacted by international trade.
The results from this study will be used to help GAC with future communication efforts with the public.
The 2021 research involved a survey of 2,043 Canadians 18 years of age and older. Fieldwork took place from February 8-25, 2021. The survey was conducted primarily online using Probit, Ekos' probability-based online panel, which contains a pool of roughly 90,000 Canadian households. However, to help with coverage of Canadians who do not have internet access, some interviews were conducted by telephone. In total, 1,538 cases were collected online and 505 were collected by telephone. Survey results were weighted based on Statistics Canada data according to age, gender, and region to ensure the sample is representative of the Canadian general public aged 18 years and over. The margin of error associated with the total sample is +/- 2.2 percentage points, 19 times out of 20.
Survey Findings
Outlined below are key findings from this study. The remainder of this report describes survey results in more detail. Results are tracked back to the February 2020 survey where possible.
General Trade Issues
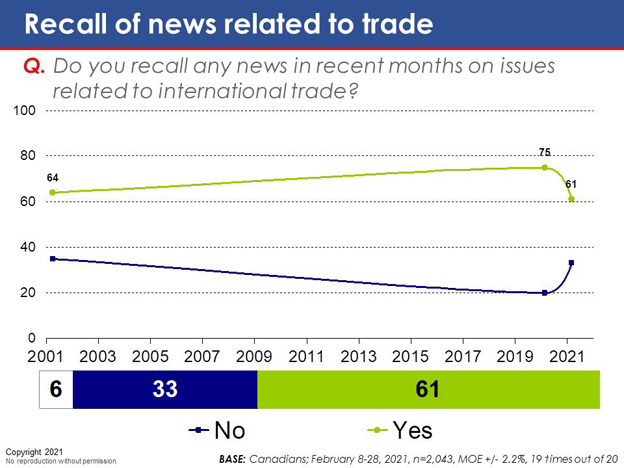
International trade remains a popular topic in the media. When asked if they could recall hearing any news about international trade, six in ten respondents (61 per cent) indicated yes, while one in three (33 per cent) said no. However, tracking reveals a 14-point drop in recall of news related to international trade since 2020. Among other possibilities, this is possibly due to the focus on the COVID-19 pandemic over the past year, as well as the decline in coverage of the Canada-United States-Mexico Agreement (CUSMA) now that it is in force.
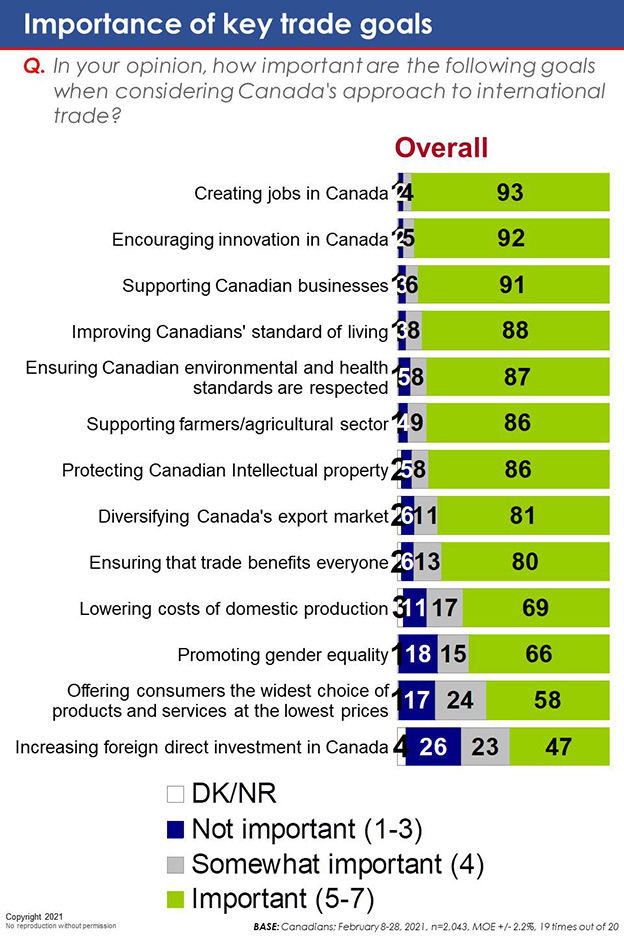
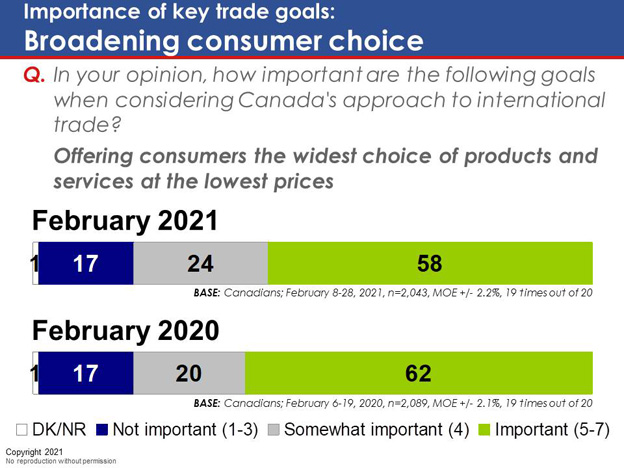
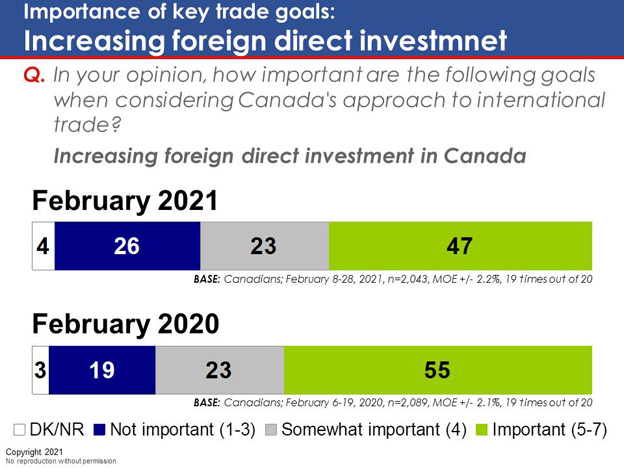
Consistent with 2020 results, when asked to rate the importance of various goals for Canada's approach to international trade, economic issues top the list, with nine in ten respondents rating job creation (93 per cent), encouraging innovation in Canada (92 per cent), and support for Canadian businesses (91 per cent) as key priorities. More than eight in ten also assign a high degree of importance to improving Canadians' standard of living (88 per cent), ensuring that Canada's environmental and health standards are respected (87 per cent), supporting Canada's agricultural sector (86 per cent), protecting Canadian intellectual property (86 per cent), diversifying Canada's export markets (81 per cent), and ensuring that everyone benefits from trade (80 per cent). Canadians attach comparatively less importance to lowering costs of domestic production (69 per cent), promoting gender equality (66 per cent), and offering consumers the widest possible choice of products and services at the lowest prices (58 per cent). Just 47 per cent feel that increasing foreign direct investment in Canada should be a top-tier priority, an eight-point drop from 2020. Women are more likely to place importance on enforcing health and environmental standards and promoting gender equality.
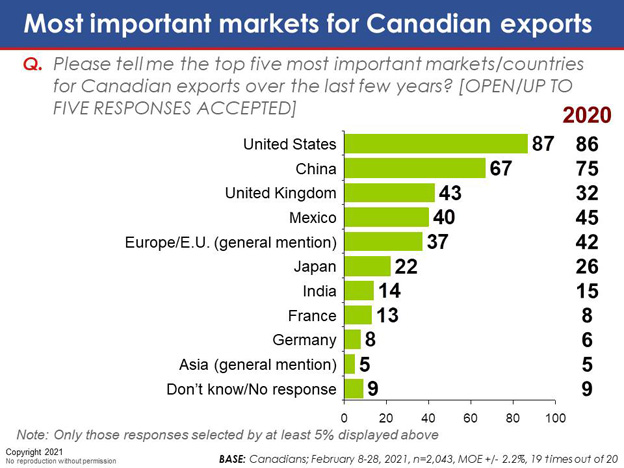
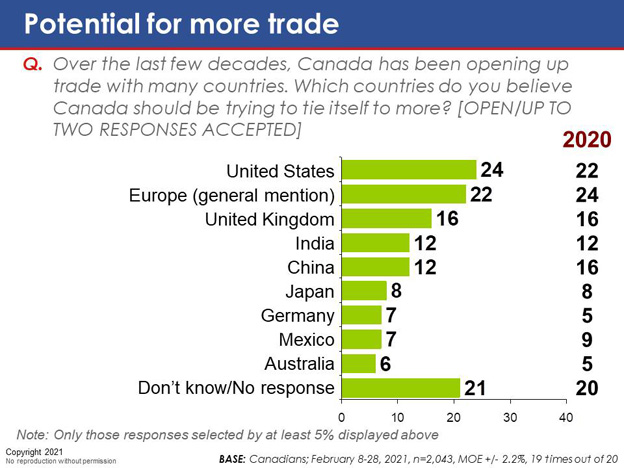
When asked to identify the five leading markets for Canadian exports, the vast majority of respondents (87 per cent) recognize the United States as Canada's largest export market, while two-thirds (67 per cent) see China as an important market. Roughly four in ten cite the United Kingdom (43 per cent), Mexico (40 per cent) and Europe (37 per cent) as key markets for Canadian exports.
Results reveal that eight in ten Canadians (80 per cent) believe that ensuring Canada is a major player in the health technology industry should be a top priority when drafting future trade policies, while slightly fewer (76 per cent) say green technologies should be a major consideration. Artificial intelligence ranks comparatively lower, with six in ten (63 per cent) saying trade policies should ensure Canada is globally competitive in this area.
Results also indicate that Canadians widely believe pandemic planning should be a key consideration when it comes to drafting international trade and investment policies About eight in ten (83 per cent) believe trade policies should ensure pandemic preparedness to a great extent, while one in ten (nine per cent) believe they should do so to a moderate extent. Just six per cent believe matters related to pandemics should, for the most part, be left out of trade and investment policies.
Benefits of International Trade
Results suggest Canadians feel that trade has become more important over the past ten years. Consistent with previous survey results, eight in ten (81 per cent) say trade has grown in importance over the last ten years, while just four per cent believe it is becoming less important.
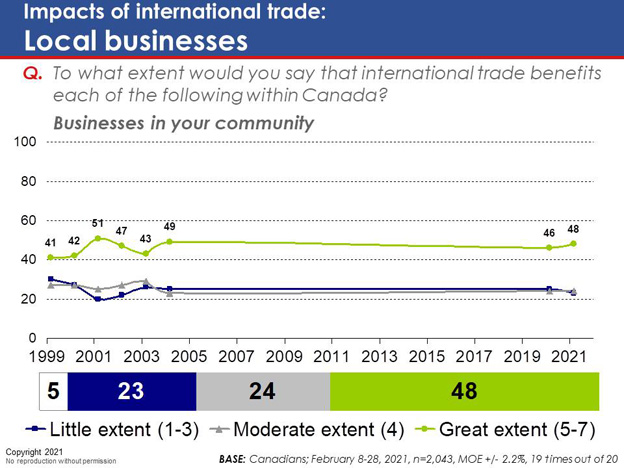
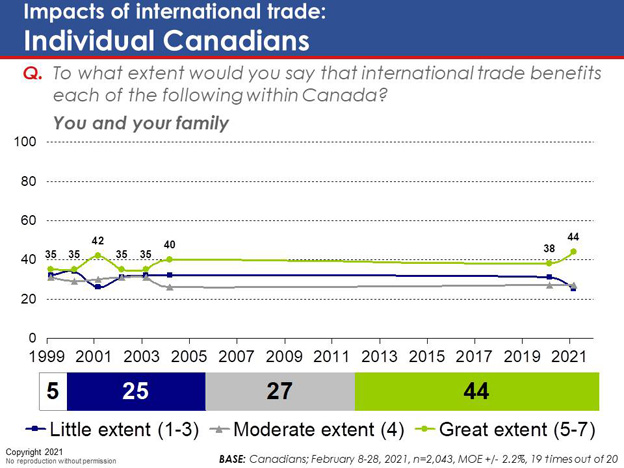
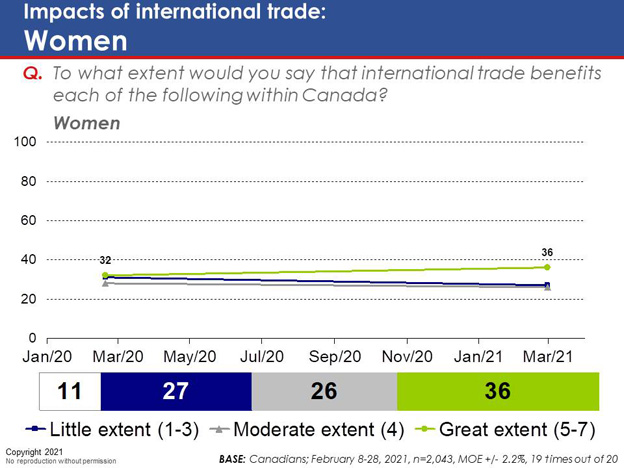
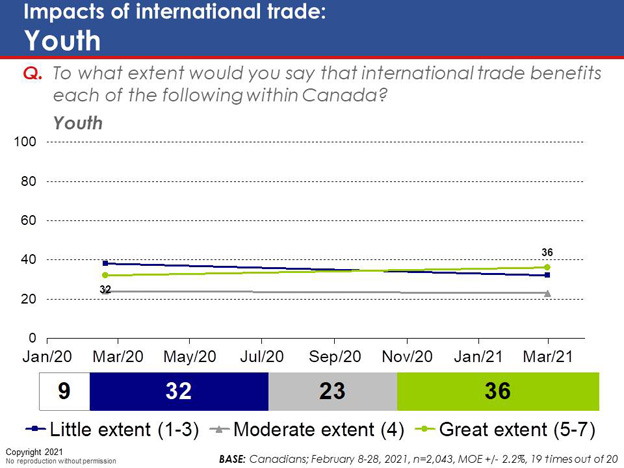
However, results also suggest Canadians continue to feel that trade benefits large corporations, offering fewer benefits to Canada's more marginalized communities. When asked to rate the extent to which various groups benefit from international trade, nine in ten Canadians (88 per cent) say large businesses benefit to a great extent from international trade, whereas just half feel that small- to medium-sized enterprises (SMEs) and community businesses benefit to the same extent (50 per cent and 48 per cent, respectively). Just over four in ten (44 per cent) feel they personally benefit from international trade, while a similar proportion (42 per cent) see immigrants as beneficiaries. Only just over one-third believe women or youth have benefited from international trade (36 per cent each) and few feel racialized groups (26 per cent), Indigenous people (23 per cent), or LGBTQ2 communities (21 per cent) have benefitted from trade. These results have remained largely stable over the past year.
Canada's Brand
When asked to identify the qualities for which they feel Canadian products are best known internationally, two-thirds of respondents (65 per cent) say our products are best known for their high quality. Just over half (55 per cent) say Canadian goods are defined by Canada's fair labour practices, while just over four in ten (45 per cent) say the country's environmental standards underlie Canada's reputation. Only one in eight (13 per cent) believe that Canadian products have a reputation for low prices.
Sustainable and Inclusive Trade Opportunities
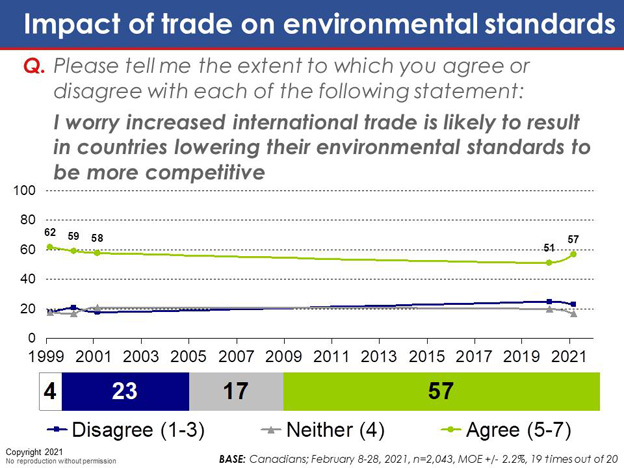
Results suggest Canadians are moderately worried about the impact of trade on international environmental standards. When asked whether they agree or disagree that increased international trade is likely to result in countries lowering their environmental standards to be more competitive, roughly six in ten (57 per cent) agree this is the case, while one-quarter (23 per cent) disagree. Tracking reveals a six-point rise in agreement with this statement since 2020.
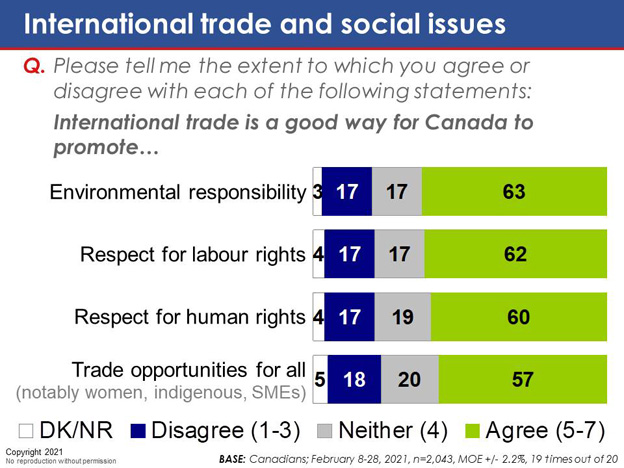
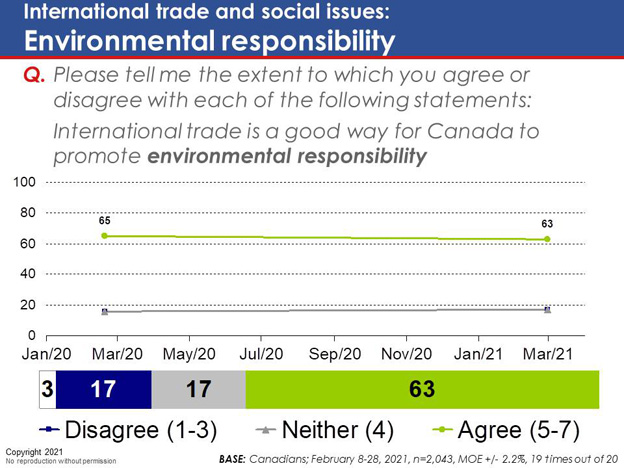
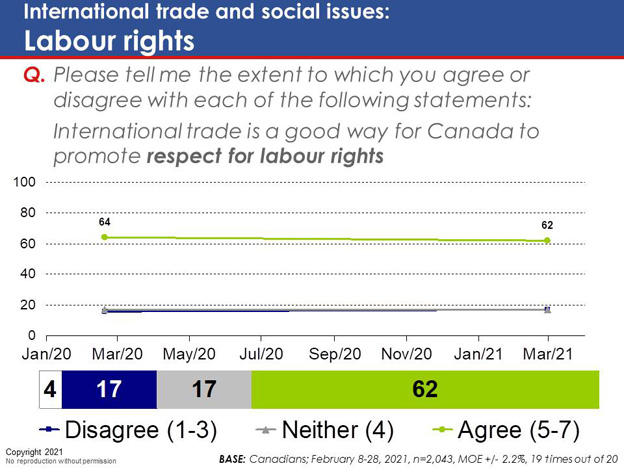
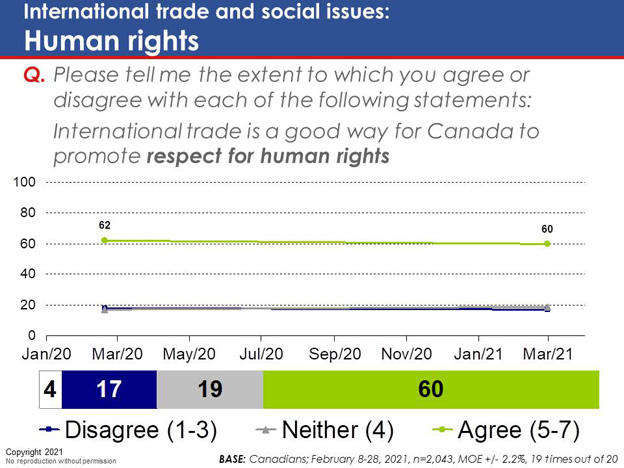
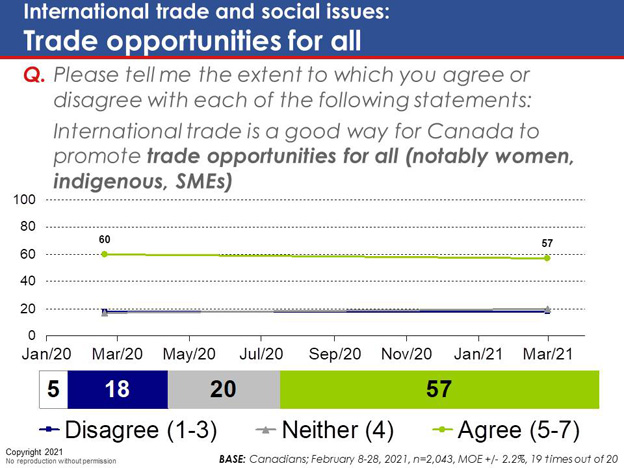
However, results also suggest that international trade is widely seen as an opportunity for Canada to promote a number of social goals. About six in ten Canadians see trade as a good way to promote environmental responsibility (63 per cent), respect for labour rights (62 per cent), and respect for human rights (60 per cent). Slightly fewer (57 per cent) say trade is an effective means to foster trade opportunities for all. These results are largely unchanged from 2020.
Knowledge of Trade and Canada's Trade Agreements
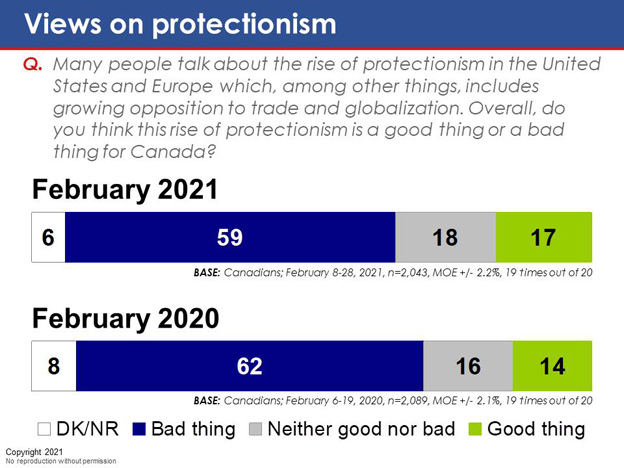
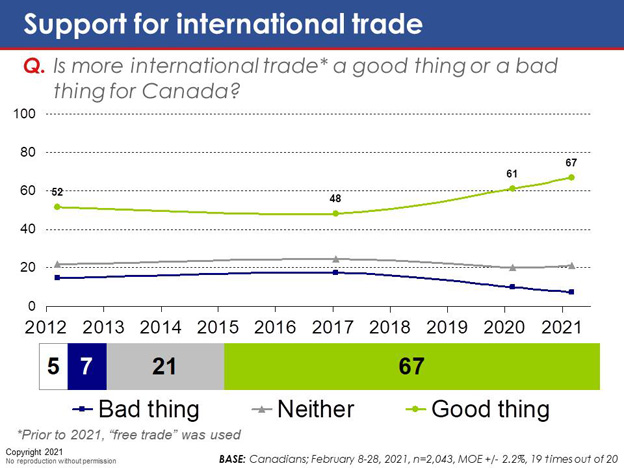
When asked whether more international trade is a good thing or a bad thing for Canada, two-thirds (67 per cent) say it is a good thing, and just seven per cent think it is a bad thing. Tracking suggests a steady rise in support for international trade over the past four years (from 48 per cent in 2017 to 67 per cent today).
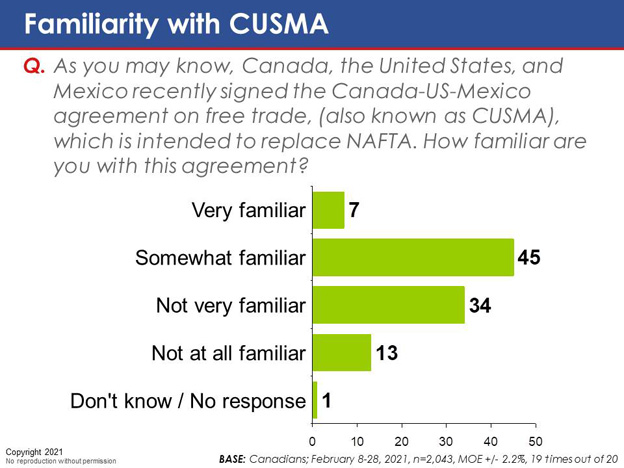
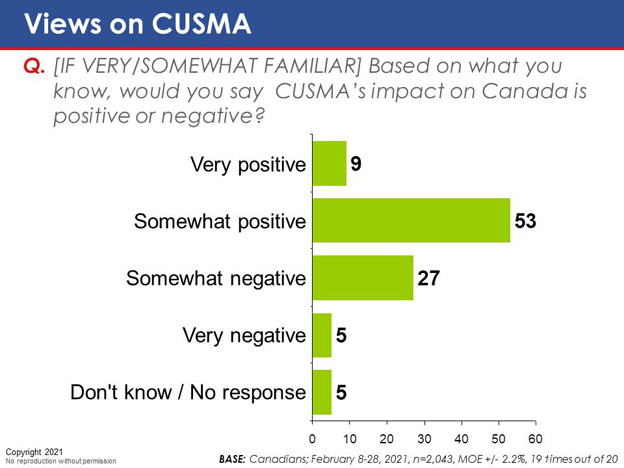
Survey results reveal limited public awareness of trade agreements. Canadians express a general lack of familiarity with the Comprehensive and Progressive Agreement for Trans-Pacific Partnership (CPTPP) and the Comprehensive Economic and Trade Agreement (CETA), and only moderate familiarity with CUSMA. However, positive views were expressed about the agreements among those familiar with them. About half of Canadians say they are either very familiar (seven per cent) or somewhat familiar (45 per cent) with CUSMA. Among those who are at least somewhat familiar with the agreement, most hold either a very positive (nine per cent) or somewhat positive (53 per cent) view of the deal.
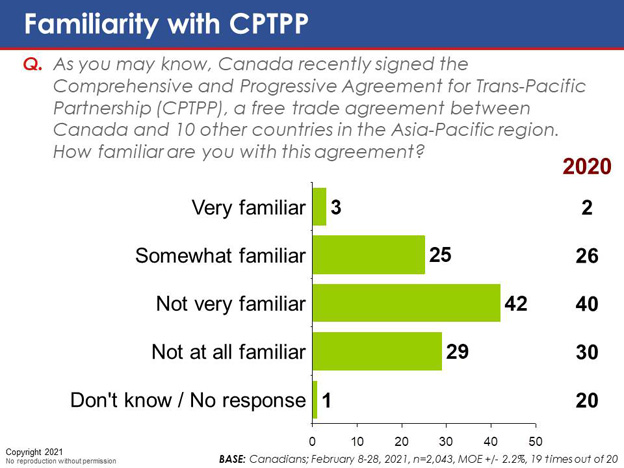
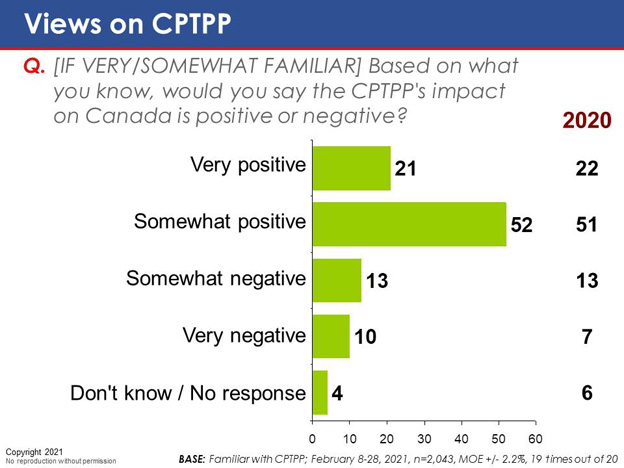
When asked to rate how familiar they are with the CPTPP, most indicate they are either not very (42 per cent) or not at all (29 per cent) familiar with the agreement. Just one-quarter (25 per cent) say they are somewhat familiar with the agreement, and an even smaller proportion (three per cent) say they are very familiar with it. Among those who are familiar, however, half (52 per cent) believe it has had a somewhat positive impact on Canada, and one in five (21 per cent) believe it has had a very positive impact.
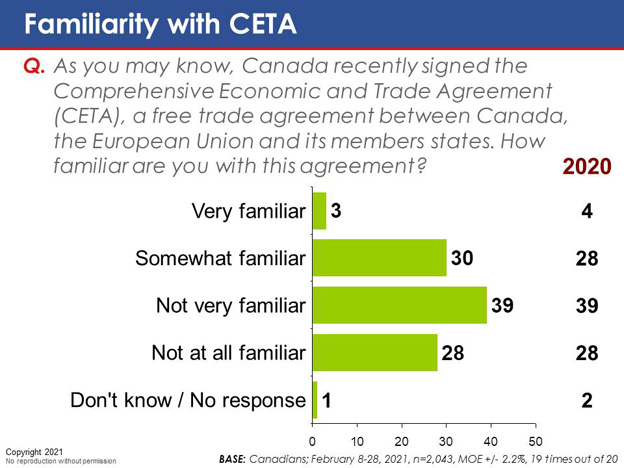
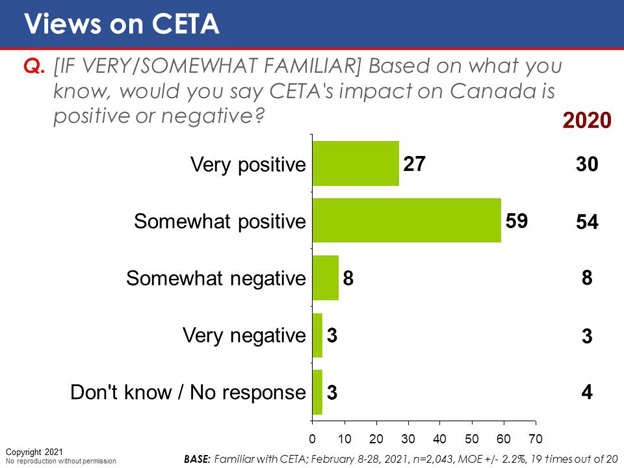
Similarly, most Canadians are either not very familiar (39 per cent) or not at all familiar (28 per cent) with CETA. About three in ten (30 per cent) say they are somewhat familiar with the agreement, and just three per cent are very familiar with it. However, among those familiar with the agreement, over half (59 per cent) say CETA's impact on Canada has been somewhat positive, and one-quarter (27 per cent) say its impacts have been very positive.
Awareness of Government Programs
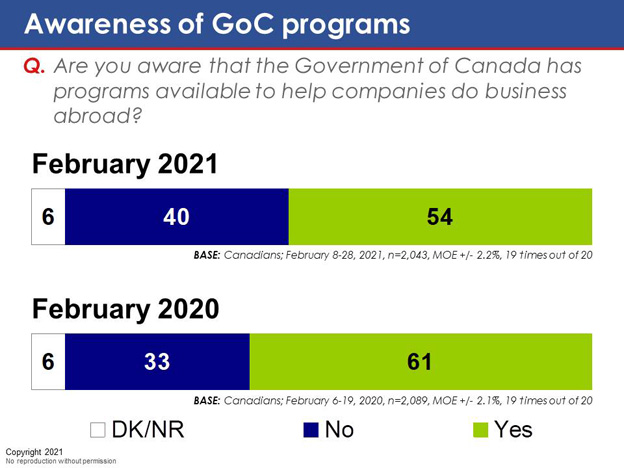
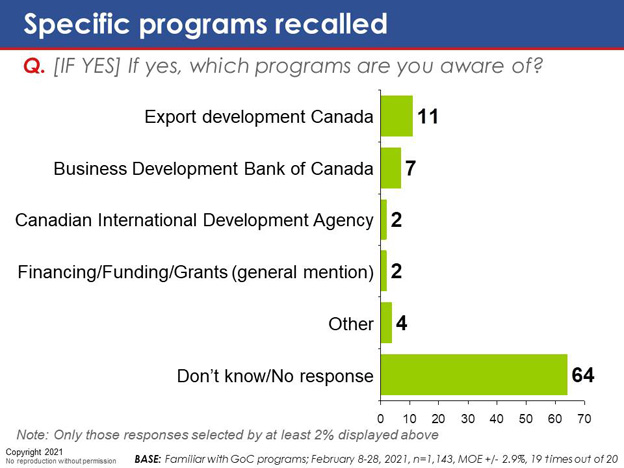
Just over half of respondents (54 per cent) say they are aware of programs offered by the federal government intended to help companies do business abroad, and four in ten (40 per cent) say they are not. When asked to elaborate on their response, the majority of respondents who say they are familiar with these programs (64 per cent) were unable to name a specific program.
Direct Impact on Canadians
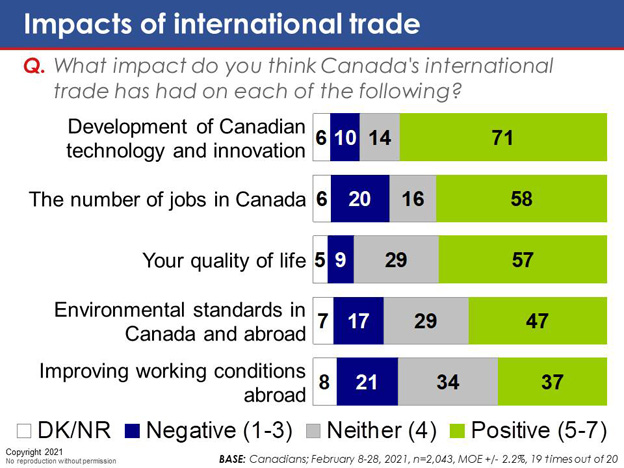
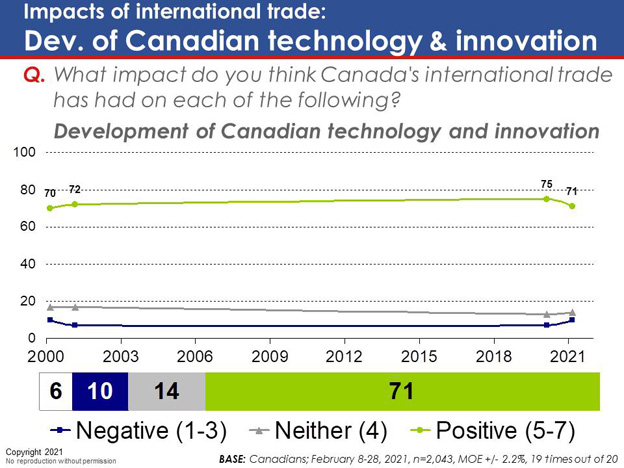
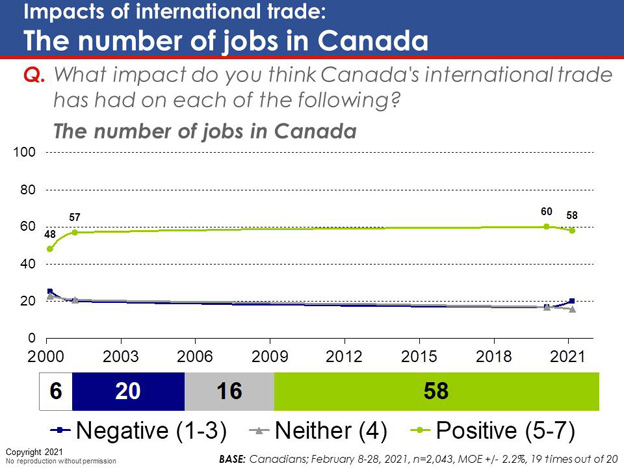
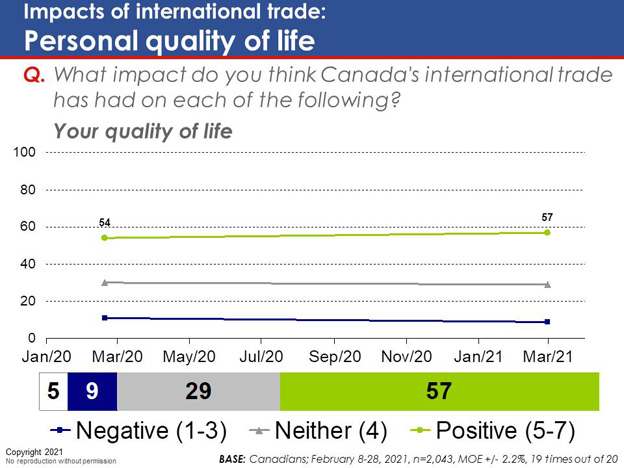
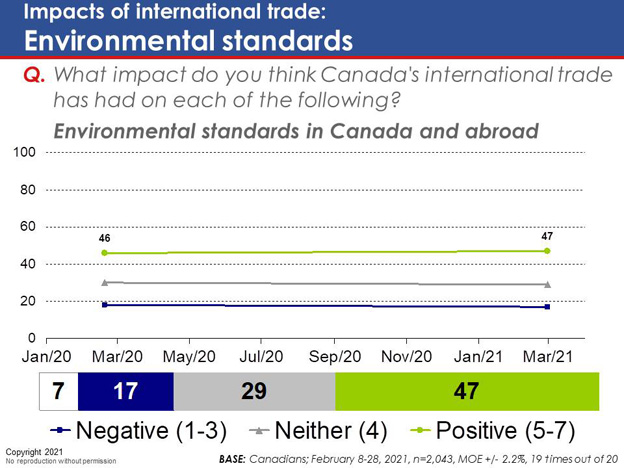
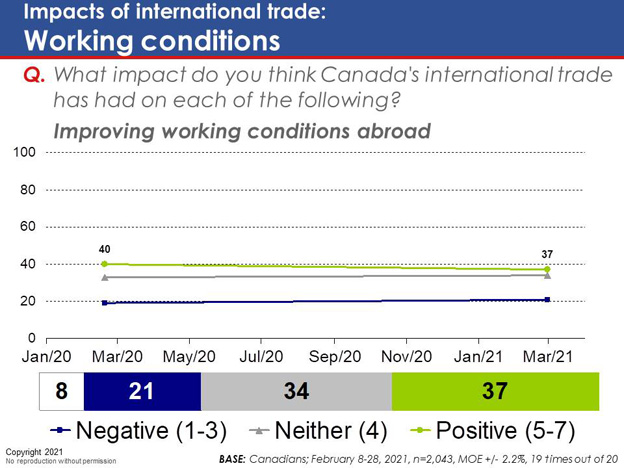
Consistent with 2020 results, Canadians express generally positive impressions of the impacts of international trade, both within Canada and abroad. Seven in ten (71 per cent) believe Canada's international trade has had a positive impact on the development of Canadian technology and innovation. Roughly six in ten say it has had a positive impact on the number of jobs in Canada (58 per cent) and that their quality of life has improved as a result of international trade (57 per cent). About half (47 per cent) feel the same about environmental standards in Canada and abroad. Four in ten (37 per cent) believe Canada's international trade has had a positive impact on improving working conditions abroad. No more than one in five respondents say international trade has had a negative impact in any of these areas.
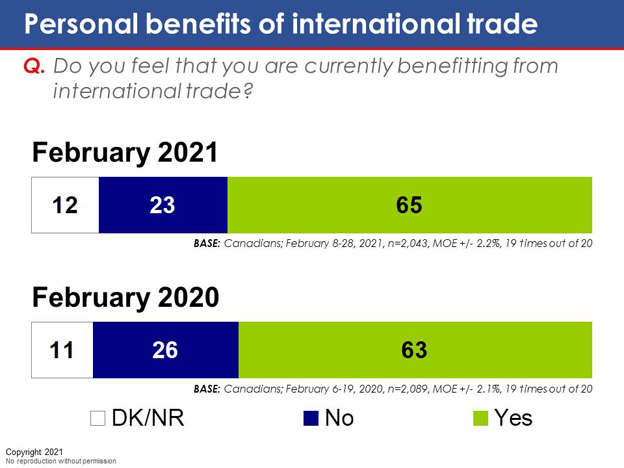
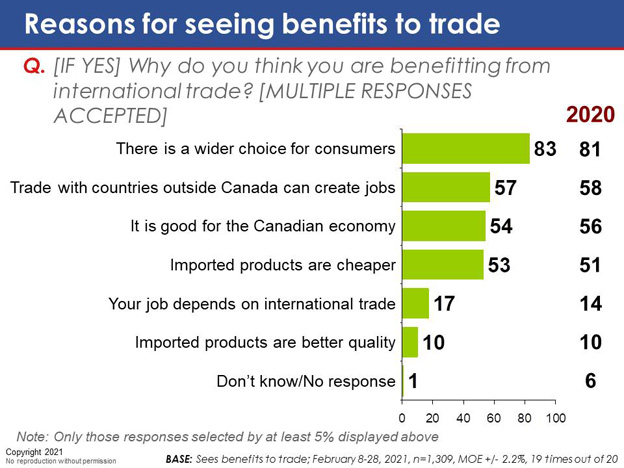
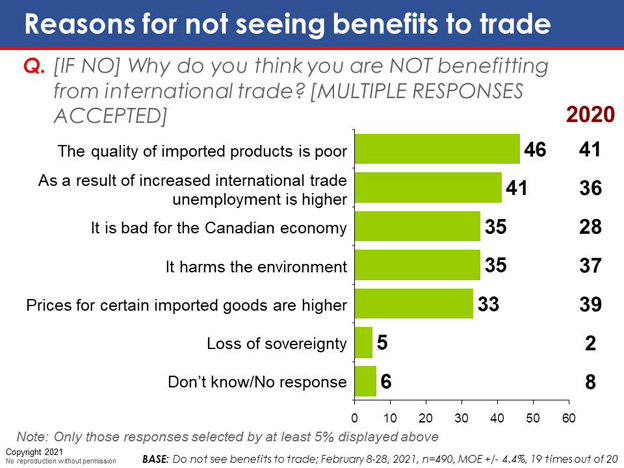
When asked whether they feel they currently benefit from trade, about two-thirds of Canadians (65 per cent) say yes, while only one-quarter (23 per cent) say no (these results are largely unchanged from last year). Among those who feel they are benefitting from trade, about eight in ten (83 per cent) say they enjoy a broader selection of goods and services, and more than half cite job creation (57 per cent), economic benefits (54 per cent), and lower prices (53 per cent) as personal benefits from international trade. Among those who do not feel they have benefited from international trade, just under half (46 per cent) cite the inferior quality of foreign-made products, while slightly fewer (41 per cent) attribute their disapproval to fears of job losses with Canada. One-third expressed concerns over impacts on the Canadian economy (35 per cent), impacts on the environment (35 per cent), and comparatively higher prices for imported products (33 per cent).
Conclusions and Implications
The COVID-19 pandemic appears to have done little to dampen Canadians' enthusiasm for international trade. Consistent with results from 2020, respondents see trade as beneficial to Canada on most of the indicators tested, particularly when it comes to fostering innovation and stimulating job growth. Furthermore, the vast majority of Canadians believe that trade has become more important in recent years, and are open to further expanding trade. Most Canadians feel they personally benefit from trade, with the perceived benefits centred on improved choice, lower prices, and better job opportunities.
One potential problem area, however, is the continuing perception that the benefits of international trade are enjoyed to a much greater degree by large corporations. Respondents express serious doubts as to whether Canada's more marginalized communities – particularly racialized, Indigenous, and LGBTQ2 Canadians – are benefitting from trade. Nevertheless, most Canadians see trade as an avenue to promote trade opportunities for these groups, as well as other social goals.
When it comes to considering Canada's approach to trade, respondents put forward a number of important considerations, particularly economic issues such job creation, support for Canadian businesses, and innovation. However, improving standards of living, protections for health and environmental standards, protecting intellectual property, diversifying Canada's markets, and ensuring a more equitable division of the benefits of trade are also top-tier priorities. The vast majority of Canadians also believe pandemic preparedness should be a key consideration in future trade policies.
Self-rated familiarity with CUSMA is moderately high and Canadians are generally enthusiastic regarding its benefits. Familiarity with Canada's other recently signed trade agreements – CETA, and CPTPP – is relatively low; however, among those who are familiar with the agreements, clear majorities are optimistic about their impacts.
Implications
Canadians remain optimistic about international trade, and the COVID-19 pandemic has done little to lessen their enthusiasm: there is remarkable stability in positive attitudes to trade and globalization.
Canadians like international trade mainly because of the economic benefits it brings. They also recognize other benefits, and there are a number of goals that they would like to see linked to trade, such as the environment, labour, and women's issues. However, these objectives are ultimately subordinate to economic issues.
As was found last year, fluency on international trade is mixed. Canadians recognize the role of the United States, but seem to overestimate the demand for Canadian exports in China relative to markets such as Europe and the United Kingdom.
Consistent with 2020 results, Canadians see trade as primarily benefitting big business (indeed, when respondents were asked about the benefits of trade, there was a huge drop-off when the scope of the question shifted to small businesses). However, Canadians do not appear too bothered by this apparent lack of equity; they seem to acknowledge that economic growth in this country is inextricably linked to the performance of our larger companies, although they continue to express some concerns that the benefits of international trade are not being shared by all Canadians.
Summary of Changes Since 2020
Tracking from 2020 suggests that public attitudes toward trade have shifted somewhat over the past year on some of the issues we examined. Below is a summary of the most significant changes that have occurred since the 2020 survey.
There has been a 14-point drop in recall of news related to international trade since 2020 (likely due to focus on the COVID-19 pandemic over the past year, as well as CUSMA now being in effect).
Tracking from 2020 reveals a decrease in the proportion of Canadians who see China as a key trading partner (67 per cent, compared to 75 per cent in 2020). Conversely, those who see the United Kingdom as one of Canada's most important export markets has risen from 32 per cent to 43 per cent.
There has been a six-point increase in the proportion of Canadians who believe they have personally benefited from international trade, and a similar rise in support for international trade in general over the past year (from 61 per cent in 2020 to 67 per cent today).
However, we also find an increase in concern about some of the impacts of international trade: there has been a six-point rise in agreement that international trade is likely to result in countries lowering their environmental standards to be more competitive.
Tracking also reveals that self-rated familiarity with programs offered by the federal government intended to help companies do business abroad has declined seven points since 2020.
Contract Value and Statement of Political Neutrality
Contract Value: $74,788.09 (including HST)
Statement of Political Neutrality: I hereby certify as a Senior Officer of Ekos Research Associates that the deliverables fully comply with the Government of Canada political neutrality requirements outlined in the Communications Policy of the Government of Canada and Procedures for Planning and Contracting Public Opinion Research. Specifically, the deliverables do not contain any reference to electoral voting intentions, political party preferences, standings with the electorate, or ratings of the performance of a political party or its leader.
Derek Jansen
Vice President
Ekos Research Associates Inc.
1. Background and Methodology
1.1 Background and Objectives
In alignment with the Trade Diversification Strategy, Global Affairs Canada (GAC) is pursuing efforts to help Canada diversify its trade abroad. This strategy includes efforts to advance an inclusive approach to trade that seeks to ensure that the benefits and opportunities from trade are more widely shared among all Canadians. In support of these efforts, a baseline survey of Canadians was conducted in February 2020 to provide trade communicators with a clear view of public attitudes toward trade, to help inform messaging and communications (including products such as speeches, interview briefs, news releases, and social media).
Recognizing that Canada's efforts to mitigate the spread of COVID-19 – including travel restrictions and border restrictions – could have affected public attitudes toward trade, a follow-up study was conducted in February 2021.
As with the 2020 research, this study was conducted to provide trade communicators with a clear view of Canadians' understanding and attitudes toward trade, to help inform messaging and communications (including products such as speeches, interview briefs, news releases, and social media).
The research objectives were as follows:
To determine Canadians' level of understanding and interest of general trade issues;
To determine the level of understanding of the benefits of trade, including foreign direct investment;
To determine Canadians' views on trade with various countries and sectors;
To determine the level of understanding of inclusive trade elements (women, indigenous, LGBTQ2) and sustainable development (labour, environmental protections);
To determine Canadians' awareness of Canada's free trade agreements;
To determine Canadians' awareness of government programs, services and agencies; and
To determine how Canadians feel directly impacted by international trade.
The results from this survey will be used to help GAC with future communication efforts with the public.
1.2 Methodology
This research involved a survey of 2,043 Canadians 18 years of age and older. Fieldwork took place from February 8-25, 2021. The survey was conducted primarily online using our probability-based online panel, Probit. However, to help with coverage of Canadians who do not have internet access, some interviews were conducted by telephone. In total, 1,538 cases were collected online and 505 were collected by telephone. Survey results were weighted based on Statistics Canada data according to age, gender, and region to ensure the sample is representative of the Canadian general public aged 18 years and over. The margin of error associated with the total sample is +/- 2.2 percentage points, 19 times out of 20.
Below we provide more detail on the methodology associated with both the online and telephone components of the research.
Probit Panel (Online Sample)
We used our probability-based online panel, Probit, for the online completions. Probit is an online research panel that has been designed by Ekos to provide statistically representative data. Our panel offers complete coverage of the Canadian population (Internet, phone, cell phone), random recruitment (participants are recruited randomly, they do not opt themselves into our panel), and equal probability sampling. All respondents to our panel are recruited by telephone using random digit dialling, and their demographic information is confirmed by live interviewers.
The distribution of the recruitment process for our panel mirrors the actual population in Canada (as defined by Statistics Canada). As such, our panel can be considered representative of the general public (survey results from our online panel support confidence intervals and margin of error estimates, which is unique in Canada). The overall panel size is roughly 90,000 Canadian households. Random stratified samples are drawn from the panel database for individual research assignments.
Telephone Sample
Ekos relies on Survey Sample for the sample requirements of our telephone surveys. The software uses the most up-to-date directories as they become available and is updated quarterly. It samples by Random Digit Dial (RDD) methodology and checks its samples against published phone lists to divide the sample into "Directory Listed" (DL) and "Directory Not Listed" (DNL) RDD components. The flexibility of this software allows one to sample within specific regions or cities. One can sample according to population representativeness or stipulate stratification parameters, as required. Once the sample is determined for a specific survey, the numbers are imported into our Computer Assisted Telephone Interview (CATI) system and quotas are set for individual characteristics.
We completed 505 telephone interviews, and 1,538 cases were collected online. Results were weighted by region, gender, and age to ensure that the sample is representative of the Canadian population 18 years of age and older. Outlined below is the sample breakdown and margin of error (MOE) across province/territory, age, gender, income, educational attainment, and minority group.
Margin of Error by Province/Territory
Province/Territory
Sample size
Margin of error (+/-, 19 times out of 20)
Overall
2,043
2.2%
British Columbia
269
6.0%
Alberta
231
6.5%
Saskatchewan
56
13.1%
Manitoba
85
10.6%
Ontario
769
3.5%
Quebec
465
4.5%
New Brunswick
44
14.8%
Nova Scotia
62
12.5%
Prince Edward Island
11
29.6%
Newfoundland
29
18.2%
Territories
16
24.5%
Margin of Error by Age
Age
Sample size
Margin of error (+/-, 19 times out of 20)
Overall
2,043
2.2%
18-34 years
382
5.0%
35-49 years
517
4.3%
50-64 years
606
4.0%
65 years or older
504
4.4%
Margin of Error by Gender
Gender
Sample size
Margin of error (+/-, 19 times out of 20)
Overall
2,043
2.2%
Male
1,010
3.1%
Female
996
3.1%
Gender diverse
19
22.5%
Margin of Error by Income
Income
Sample size
Margin of error (+/-, 19 times out of 20)
Overall
2,043
2.2%
Under $20,000
83
10.8%
Between $20,000 and $39,999
199
7.0%
Between $40,000 and $59,999
245
6.3%
Between $60,000 and $79,999
252
6.2%
Between $80,000 and $99,999
241
6.3%
Between $100,000 and $149,999
357
5.2%
Margin of Error by Educational Attainment
Educational attainment
Sample size
Margin of error (+/-, 19 times out of 20)
Overall
2,043
2.2%
Less than high school diploma or equivalent
45
14.6%
High School diploma or equivalent
334
5.4%
Registered Apprenticeship or other trades certificate or diploma
103
9.7%
College, CEGEP or other non-university certificate or diploma
414
4.8%
University certificate or diploma below Bachelor's level
154
7.9%
Bachelor's degree
564
4.1%
Post graduate degree above bachelor's level
404
4.9%
Margin of Error by Minority Group
Minority group
Sample size
Margin of error (+/-, 19 times out of 20)
Overall
2,043
2.2%
A person with a disability
195
7.0%
A member of a visible minority group
208
6.8%
An Indigenous person
37
16.1%
A member of the LGBTQ2 community
126
8.7%
None of the above
1,506
2.5%
Response Rate
The telephone response rate for this survey was 7.8 per cent. The response rate is calculated by dividing the in-scope responding 711 by the total (functional) sample 9,067 – see table below.
Response Rate
Description
Result
Total
Total Numbers Attempted
11,687
Invalid numbers
2,620
Blocked
125
Business
178
Duplicate
7
Invalid
2,310
Unresolved (U)
4,812
No answer
0
Callbacks
4,812
In-scope - Not responding (IS)
3,544
Household refusal
0
Respondent refusal
3,544
Selected respondent not available
0
Qualified respondent break-off
0
In-scope - Responding (R)
711
Language problem
126
Quota filled
72
Other disqualify
8
Completed interviews
505
Total (U + IS + R)
9,067
Response Rate (R divided by Total)
7.8%
The online response rate for this survey was 13.7 per cent. The online response rate is calculated as follows: a total of 11,282 email invitations were sent out, and 52 bounced back, for a total of 11,230 valid emails. A total of 1,538 cases were completed, so dividing 1,538 by 11,230 results in a response rate of 13.7 per cent.
2. General Trade Issues
2.1 Recall of News Related to International Trade
Results suggest that international trade is a popular topic in the media. When asked if they could recall hearing any news about international trade, six in ten respondents (61 per cent) indicated yes, while one in three (33 per cent) said no. However, tracking reveals a 14-point drop in recall of news related to international trade since 2020. Among other possibilities, this is possibly due to the focus on the COVID-19 pandemic over the past year, as well as the decline in coverage of the Canada-United States-Mexico Agreement (CUSMA) now that it is in force. However, results are consistent with those found in 2001.
Men are more likely to remember hearing news pertaining to international trade (67 per cent, compared to 55 per cent of women).
Recall rises progressively with educational attainment (68 per cent among university graduates, compared to 47 per cent among high school educated).
Regionally, recall is comparatively lower in Quebec and Atlantic Canada (51 per cent and 54 per cent, respectively, compared to 61 per cent nationally).
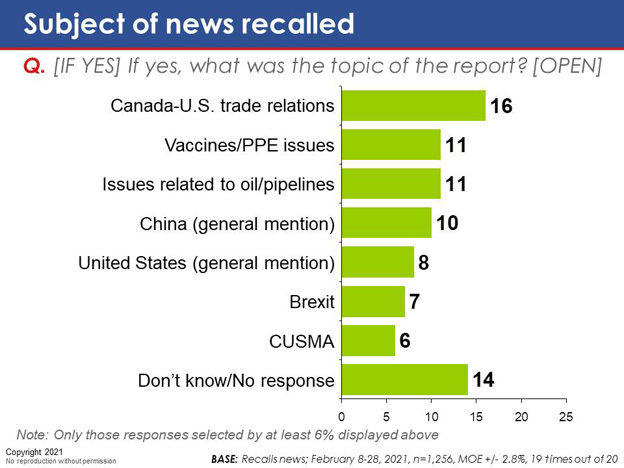
Those who remember hearing about international trade in the news were asked to elaborate on what they had heard. Responses varied heavily and did not centre on any one theme. One in six (16 per cent) explicitly recall news about trade relations between Canada and the United States, such as the impacts of the 2020 presidential election. One in ten cited issues related to vaccines and personal protective equipment (PPE) (11 per cent) or issues related to oil and pipelines (11 per cent), while slightly fewer made a general reference to China (10 per cent) or the United States (eight per cent). Other common responses include Brexit (seven per cent) and CUSMA (six per cent).
Chart 1: Recall of news related to trade
Chart 1: Recall of news related to trade - Text Version
This chart shows a line graph for results for the period between 2001 and 2021 (blue line: no – green line: yes), and a horizontal stacked bar based on the same scale: no and yes.
Respondents were asked: "Do you recall any news in recent months on issues related to international trade?"
Respondents selected:
No: 2001 (35 per cent); 2020 (20 per cent); and 2021 (33 per cent);
Yes: 2001 (64 per cent); 2020 (75 per cent); and 2021 (61 per cent);
Stacked bar: DK/NR (6 per cent); no (33 per cent); and yes (61 per cent);
Base: Canadians; February 8-28, 2021, n=2,043, MOE +/- 2.2%, 19 times out of 20
Chart 2: Subject of news recalled
Chart 2: Subject of news recalled - Text Version
This chart shows eight single bars.
Respondents were asked: "[If yes] If yes, what was the topic of the report? [Open]"
Respondents selected:
Canada-U.S. trade relations (16 per cent);
Vaccines/PPE issues (11 per cent);
Issues related to oil/pipelines (11 per cent);
China (general mention) (10 per cent);
United States (general mention) (8 per cent);
Brexit (7 per cent);
CUSMA (6 per cent);
Don't know/No response (14 per cent).
Note: Only those responses selected by at least 6% displayed above
Base: Recalls news; February 8-28, 2021, n=1,256, MOE +/- 2.8%, 19 times out of 20
2.2 Importance of Key International Trade Goals
Respondents were presented with a list of potential goals for Canada's approach to international trade and asked to rate the importance of each once. These results are largely similar to those found last year. Economic issues top the list, with nine in ten respondents rating job creation (93 per cent), encouraging innovation in Canada (92 per cent), and support for Canadian businesses (91 per cent) as key priorities. More than eight in ten also assign a high degree of importance to improving Canadians' standard of living (88 per cent), ensuring that Canada's environmental and health standards are respected (87 per cent), supporting Canada's agricultural sector (86 per cent), protecting Canadian intellectual property (86 per cent), diversifying Canada's export markets (81 per cent), and ensuring that everyone benefits from trade (80 per cent),
Canadians attach comparatively less importance to lowering costs of domestic production (69 per cent), promoting gender equality (66 per cent), and offering consumers the widest possible choice of products and services at the lowest prices (58 per cent). Just 47 per cent feel that increasing foreign direct investment in Canada should be a top-tier priority, an eight-point drop from 2020.
Women are more likely to place importance on enforcing health and environmental standards (92 per cent versus 81 per cent of men), supporting farmers (91 per cent, compared to 81 per cent of men), and promoting gender equality (74 per cent versus 57 per cent).
Propensity to prioritize protections for Canada's agricultural industry rises with age (from 80 per cent among those under 35 to 93 per cent among those 65 and over), as does the degree of importance placed on diversifying Canada's export markets (74 per cent versus 89 per cent), ensuring that trade benefits everyone (74 per cent versus 87 per cent), offering consumers the widest possible choice of products (52 per cent versus 65 per cent), and increasing foreign direct investment in Canada (42 per cent versus 52 per cent).
University graduates put comparatively less importance on driving down costs of domestic production (65 per cent, compared to 76 per cent of high school educated and 74 per cent of college graduates).
Regionally, residents of Quebec are more concerned with promoting gender equality (76 per cent rate it as important, compared to 66 per cent nationally) and increasing foreign direct investment in Canada (57 per cent versus 47 per cent). Residents of Atlantic Canada and Quebec are more likely to assign a high degree of importance to broadening consumer choice (72 per cent and 64 per cent, respectively, versus 58 per cent nationally).
Chart 3: Importance of key trade goals
Chart 3: Importance of key trade goals - Text Version
This chart shows thirteen horizontal stacked bars for overall results based on a seven-point scale where 1-3 means not important, 4 means somewhat important, and 5-7 means important, with an additional point for DK/NR.
Respondents were asked: "In your opinion, how important are the following goals when considering Canada's approach to international trade?"
Respondents selected:
Creating jobs in Canada: DK/NR (4 per cent); not important (26 per cent); somewhat important (23 per cent); and important (47 per cent);
Encouraging innovation in Canada: DK/NR (1 per cent); not important (17 per cent); somewhat important (24 per cent); and important (58 per cent);
Supporting Canadian businesses: DK/NR (1 per cent); not important (18 per cent); somewhat important (15 per cent); and important (66 per cent);
Improving Canadians' standard of living: DK/NR (3 per cent); not important (11 per cent); somewhat important (17 per cent); and important (69 per cent);
Ensuring Canadian environmental and health standards are respected DK/NR (2 per cent); not important (6 per cent); somewhat important (13 per cent); and important (80 per cent);
Supporting farmers/agricultural sector: DK/NR (2 per cent); not important (6 per cent); somewhat important (11 per cent); and important (81 per cent);
Protecting Canadian Intellectual property: DK/NR (2 per cent); not important (5 per cent); somewhat important (8 per cent); and important (86 per cent).
Diversifying Canada's export market: DK/NR (1 per cent); not important (4 per cent); somewhat important (9 per cent); and important (86 per cent).
Ensuring that trade benefits everyone: DK/NR (1 per cent); not important (5 per cent); somewhat important (8 per cent); and important (87 per cent).
Lowering costs of domestic production: DK/NR (1 per cent); not important (3 per cent); somewhat important (8 per cent); and important (88 per cent).
Promoting gender equality: DK/NR (1 per cent); not important (3 per cent); somewhat important (6 per cent); and important (91 per cent).
Offering consumers the widest choice of products and services at the lowest prices: DK/NR (1 per cent); not important (2 per cent); somewhat important (5 per cent); and important (92 per cent).
Increasing foreign direct investment in Canada: DK/NR (1 per cent); not important (2 per cent); somewhat important (5 per cent); and important (93 per cent).
Base: Canadians; February 8-28, 2021, n=2,043, MOE +/- 2.2%, 19 times out of 20
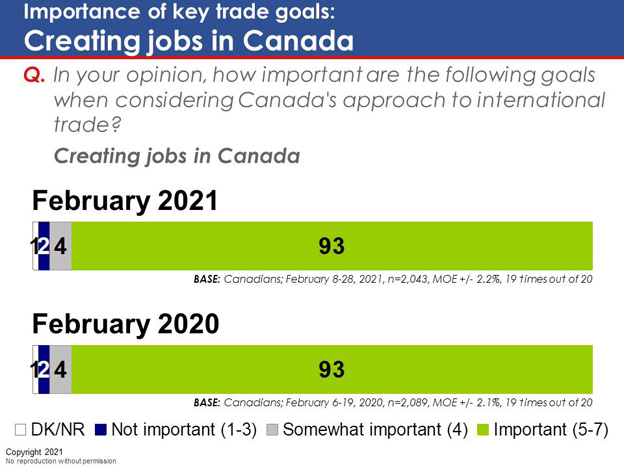
Chart 4: Importance of key trade goals: Creating jobs in Canada
Chart 4: Importance of key trade goals: Creating jobs in Canada - Text Version
This chart shows two horizontal stacked bars with results for February 2021 and February 2020, based on a seven-point scale where 1-3 means not important, 4 means somewhat important, and 5-7 means important, with an additional point for DK/NR.
Respondents were asked: "In your opinion, how important are the following goals when considering Canada's approach to international trade? Creating jobs in Canada"
Respondents selected:
February 2021: DK/NR (1 per cent); not important (2 per cent); somewhat important (4 per cent); and important (93 per cent);
Base: Canadians; February 8-28, 2021, n=2,043, MOE +/- 2.2%, 19 times out of 20
February 2020: DK/NR (1 per cent); not important (2 per cent); somewhat important (4 per cent); and important (93 per cent);
Base: Canadians; February 6-19, 2020, n=2,089, MOE +/- 2.1%, 19 times out of 20
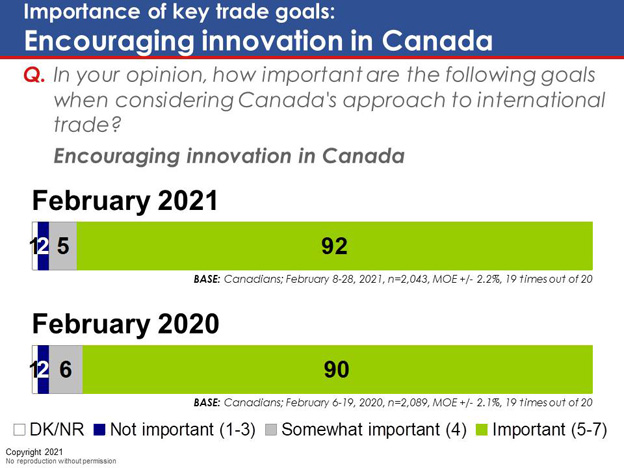
Chart 5: Importance of key trade goals: Encouraging innovation in Canada
Chart 5: Importance of key trade goals: Encouraging innovation in Canada - Text Version
This chart shows two horizontal stacked bars with results for February 2021 and February 2020, based on a seven-point scale where 1-3 means not important, 4 means somewhat important, and 5-7 means important, with an additional point for DK/NR.
Respondents were asked: "In your opinion, how important are the following goals when considering Canada's approach to international trade? Encouraging innovation in Canada"
Respondents selected:
February 2021: DK/NR (1 per cent); not important (2 per cent); somewhat important (5 per cent); and important (92 per cent);
Base: Canadians; February 8-28, 2021, n=2,043, MOE +/- 2.2%, 19 times out of 20
February 2020: DK/NR (1 per cent); not important (2 per cent); somewhat important (6 per cent); and important (90 per cent);
Base: Canadians; February 6-19, 2020, n=2,089, MOE +/- 2.1%, 19 times out of 20
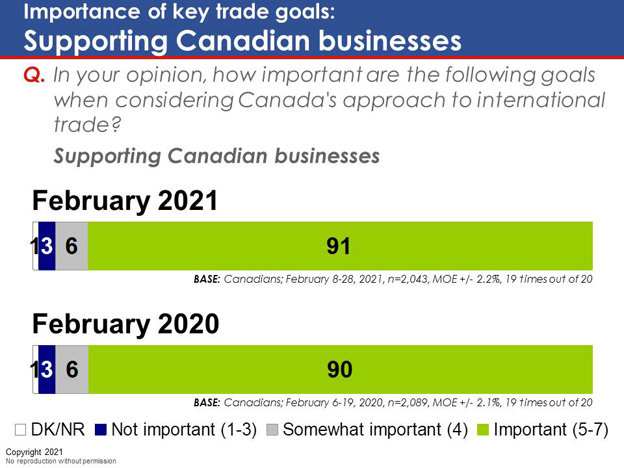
Chart 6: Importance of key trade goals: Supporting Canadian businesses
Chart 6: Importance of key trade goals: Supporting Canadian businesses - Text Version
This chart shows two horizontal stacked bars with results for February 2021 and February 2020, based on a seven-point scale where 1-3 means not important, 4 means somewhat important, and 5-7 means important, with an additional point for DK/NR.
Respondents were asked: "In your opinion, how important are the following goals when considering Canada's approach to international trade? Supporting Canadian businesses"
Respondents selected:
February 2021: DK/NR (1 per cent); not important (3 per cent); somewhat important (6 per cent); and important (91 per cent);
Base: Canadians; February 8-28, 2021, n=2,043, MOE +/- 2.2%, 19 times out of 20
February 2020: DK/NR (1 per cent); not important (3 per cent); somewhat important (6 per cent); and important (90 per cent);
Base: Canadians; February 6-19, 2020, n=2,089, MOE +/- 2.1%, 19 times out of 20
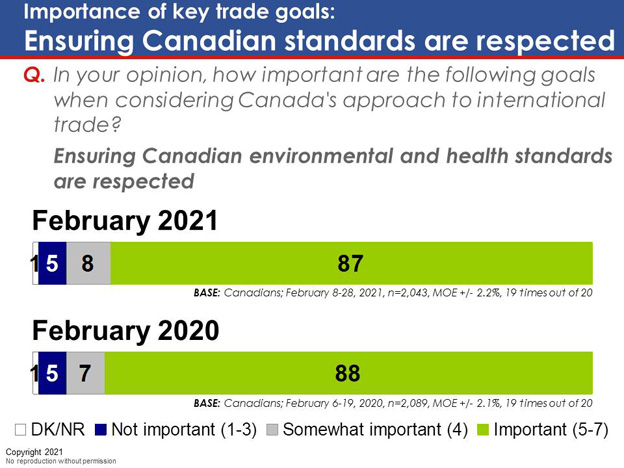
Chart 7: Importance of key trade goals: Ensuring Canadian standards are respected
Chart 7: Importance of key trade goals: Ensuring Canadian standards are respected - Text Version
This chart shows two horizontal stacked bars with results for February 2021 and February 2020, based on a seven-point scale where 1-3 means not important, 4 means somewhat important, and 5-7 means important, with an additional point for DK/NR.
Respondents were asked: "In your opinion, how important are the following goals when considering Canada's approach to international trade? Ensuring Canadian environmental and health standards are respected"
Respondents selected:
February 2021: DK/NR (1 per cent); not important (5 per cent); somewhat important (8 per cent); and important (87 per cent);
Base: Canadians; February 8-28, 2021, n=2,043, MOE +/- 2.2%, 19 times out of 20
February 2020: DK/NR (1 per cent); not important (5 per cent); somewhat important (7 per cent); and important (88 per cent);
Base: Canadians; February 6-19, 2020, n=2,089, MOE +/- 2.1%, 19 times out of 20
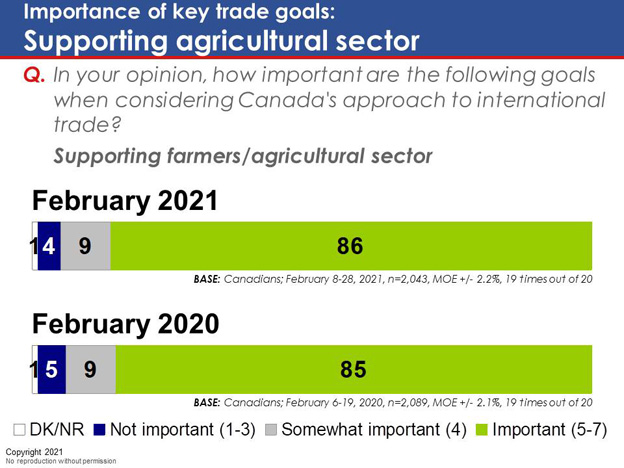
Chart 8: Importance of key trade goals: Supporting agricultural sector
Chart 8: Importance of key trade goals: Supporting agricultural sector - Text Version
This chart shows two horizontal stacked bars with results for February 2021 and February 2020, based on a seven-point scale where 1-3 means not important, 4 means somewhat important, and 5-7 means important, with an additional point for DK/NR.
Respondents were asked: "In your opinion, how important are the following goals when considering Canada's approach to international trade? Supporting farmers/agricultural sector"
Respondents selected:
February 2021: DK/NR (1 per cent); not important (4 per cent); somewhat important (9 per cent); and important (86 per cent);
Base: Canadians; February 8-28, 2021, n=2,043, MOE +/- 2.2%, 19 times out of 20
February 2020: DK/NR (1 per cent); not important (5 per cent); somewhat important (9 per cent); and important (85 per cent);
Base: Canadians; February 6-19, 2020, n=2,089, MOE +/- 2.1%, 19 times out of 20
Chart 9: Importance of key trade goals: Protecting Canadian intellectual property
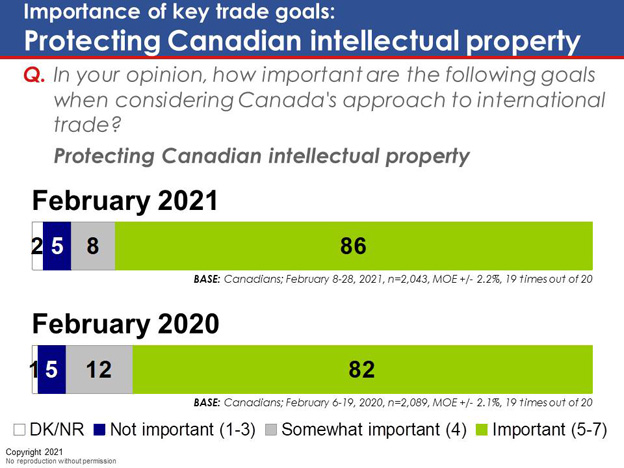
Chart 9: Importance of key trade goals: Protecting Canadian intellectual property - Text Version
This chart shows two horizontal stacked bars with results for February 2021 and February 2020, based on a seven-point scale where 1-3 means not important, 4 means somewhat important, and 5-7 means important, with an additional point for DK/NR.
Respondents were asked: "In your opinion, how important are the following goals when considering Canada's approach to international trade? Protecting Canadian intellectual property"
Respondents selected:
February 2021: DK/NR (2 per cent); not important (5 per cent); somewhat important (8 per cent); and important (86 per cent);
Base: Canadians; February 8-28, 2021, n=2,043, MOE +/- 2.2%, 19 times out of 20
February 2020: DK/NR (1 per cent); not important (5 per cent); somewhat important (12 per cent); and important (82 per cent);
Base: Canadians; February 6-19, 2020, n=2,089, MOE +/- 2.1%, 19 times out of 20
Chart 10: Importance of key trade goals: Diversifying Canada's export market - Text Version
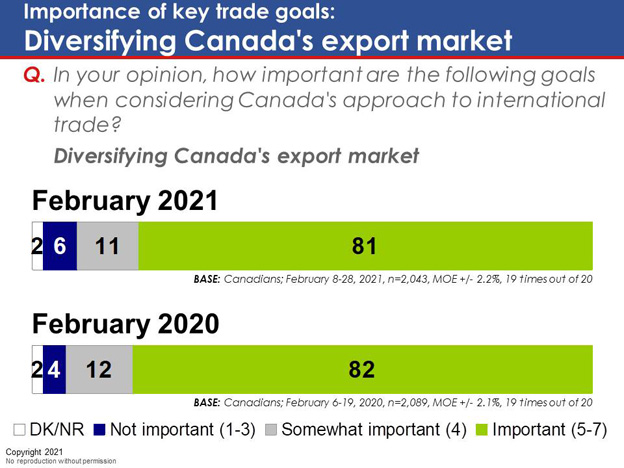
This chart shows two horizontal stacked bars with results for February 2021 and February 2020, based on a seven-point scale where 1-3 means not important, 4 means somewhat important, and 5-7 means important, with an additional point for DK/NR.
Respondents were asked: "In your opinion, how important are the following goals when considering Canada's approach to international trade? Diversifying Canada's export market"
Respondents selected:
February 2021: DK/NR (2 per cent); not important (6 per cent); somewhat important (11 per cent); and important (81 per cent);
Base: Canadians; February 8-28, 2021, n=2,043, MOE +/- 2.2%, 19 times out of 20
February 2020: DK/NR (2 per cent); not important (4 per cent); somewhat important (12 per cent); and important (82 per cent);
Base: Canadians; February 6-19, 2020, n=2,089, MOE +/- 2.1%, 19 times out of 20
Chart 11: Importance of key trade goals: Ensuring that trade benefits everyone
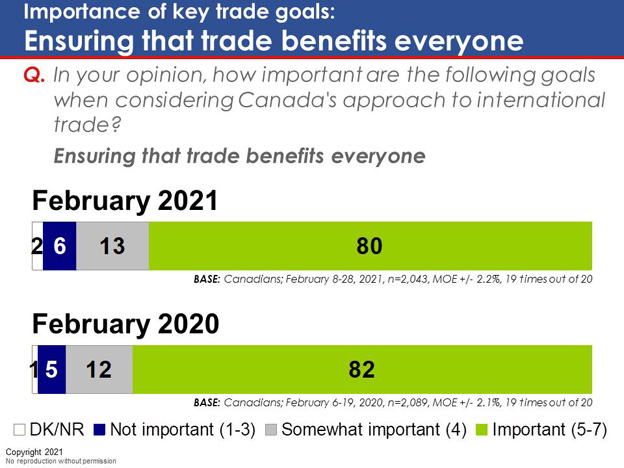
Chart 11: Importance of key trade goals: Ensuring that trade benefits everyone - Text Version
This chart shows two horizontal stacked bars with results for February 2021 and February 2020, based on a seven-point scale where 1-3 means not important, 4 means somewhat important, and 5-7 means important, with an additional point for DK/NR.
Respondents were asked: "In your opinion, how important are the following goals when considering Canada's approach to international trade? Ensuring that trade benefits everyone"
Respondents selected:
February 2021: DK/NR (2 per cent); not important (6 per cent); somewhat important (13 per cent); and important (80 per cent);
Base: Canadians; February 8-28, 2021, n=2,043, MOE +/- 2.2%, 19 times out of 20
February 2020: DK/NR (1 per cent); not important (5 per cent); somewhat important (12 per cent); and important (82 per cent);
Base: Canadians; February 6-19, 2020, n=2,089, MOE +/- 2.1%, 19 times out of 20
Chart 12: Importance of key trade goals: Promoting gender equality
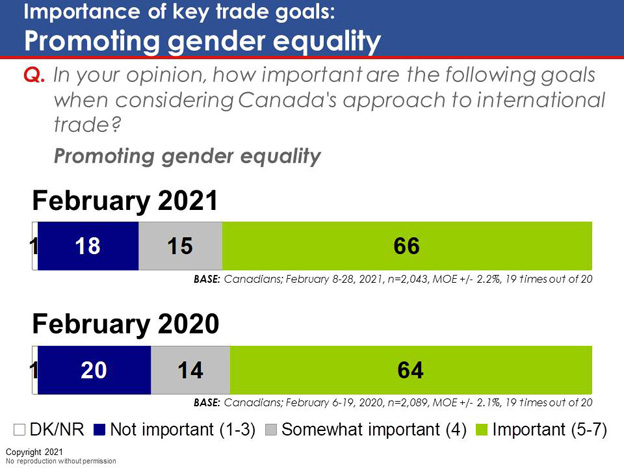
Chart 12: Importance of key trade goals: Promoting gender equality - Text Version
This chart shows two horizontal stacked bars with results for February 2021 and February 2020, based on a seven-point scale where 1-3 means not important, 4 means somewhat important, and 5-7 means important, with an additional point for DK/NR.
Respondents were asked: "In your opinion, how important are the following goals when considering Canada's approach to international trade? Promoting gender equality"
Respondents selected:
February 2021: DK/NR (1 per cent); not important (18 per cent); somewhat important (15 per cent); and important (66 per cent);
Base: Canadians; February 8-28, 2021, n=2,043, MOE +/- 2.2%, 19 times out of 20
February 2020: DK/NR (1 per cent); not important (20 per cent); somewhat important (14 per cent); and important (64 per cent);
Base: Canadians; February 6-19, 2020, n=2,089, MOE +/- 2.1%, 19 times out of 20
Chart 13: Importance of key trade goals: Broadening consumer choice
Chart 13: Importance of key trade goals: Broadening consumer choice - Text Version
This chart shows two horizontal stacked bars with results for February 2021 and February 2020, based on a seven-point scale where 1-3 means not important, 4 means somewhat important, and 5-7 means important, with an additional point for DK/NR.
Respondents were asked: "In your opinion, how important are the following goals when considering Canada's approach to international trade? Offering consumers the widest choice of products and services at the lowest prices"
Respondents selected:
February 2021: DK/NR (1 per cent); not important (17 per cent); somewhat important (24 per cent); and important (58 per cent);
Base: Canadians; February 8-28, 2021, n=2,043, MOE +/- 2.2%, 19 times out of 20
February 2020: DK/NR (1 per cent); not important (17 per cent); somewhat important (20 per cent); and important (62 per cent);
Base: Canadians; February 6-19, 2020, n=2,089, MOE +/- 2.1%, 19 times out of 20
Chart 14: Importance of key trade goals: Increasing foreign direct investment
Chart 14: Importance of key trade goals: Increasing foreign direct investment - Text Version
This chart shows two horizontal stacked bars with results for February 2021 and February 2020, based on a seven-point scale where 1-3 means not important, 4 means somewhat important, and 5-7 means important, with an additional point for DK/NR.
Respondents were asked: "In your opinion, how important are the following goals when considering Canada's approach to international trade? Increasing foreign direct investment in Canada"
Respondents selected:
February 2021: DK/NR (4 per cent); not important (26 per cent); somewhat important (23 per cent); and important (47 per cent);
Base: Canadians; February 8-28, 2021, n=2,043, MOE +/- 2.2%, 19 times out of 20
February 2020: DK/NR (3 per cent); not important (19 per cent); somewhat important (23 per cent); and important (55 per cent);
Base: Canadians; February 6-19, 2020, n=2,089, MOE +/- 2.1%, 19 times out of 20
2.3 Most Important Markets for Canadian Exports
Results suggest Canadians are generally familiar with Canada's key trading partners. When asked to identify the five leading markets for Canadian exports, the vast majority of respondents (87 per cent) recognize the United States as Canada's largest export market, while two-thirds (67 per cent) see China as an important market. Roughly four in ten cited the United Kingdom (43 per cent), Mexico (40 per cent) and Europe (37 per cent) as key markets for Canadian exports. One-fifth (22 per cent) mentioned Japan, while roughly one in ten cited India (14 per cent), France (13 per cent), and Germany (eight per cent).
Tracking from 2020 reveals a modest decrease in the proportion of Canadians who see China as a key trading partner (67 per cent, compared to 75 per cent in 2020). In contrast, the proportion who place the United Kingdom as one of Canada's five most important export markets has risen from 32 per cent to 43 per cent.
The likelihood of mentioning Europe rises progressively with age (from 26 per cent among those under 35 to 48 per cent among those 65 and over).
Residents of Quebec are more likely to see France as a key export market (31 per cent, compared to 13 per cent nationally).
Chart 15: Most important markets for Canadian exports
Chart 15: Most important markets for Canadian exports - Text Version
This chart shows eleven single bars with a column on the side for the 2020 results.
Respondents were asked: "Please tell me the top five most important markets/countries for Canadian exports over the last few years? [Open/up to five responses accepted]?"
Respondents selected:
United States (87 per cent); 2020 (86 per cent);
China (67 per cent); 2020 (75 per cent);
United Kingdom (43 per cent); 2020 (32 per cent);
Mexico (40 per cent); 2020 (45 per cent);
Europe/E.U. (general mention) (37 per cent); 2020 (42 per cent);
Japan (22 per cent); 2020 (26 per cent);
India (14 per cent); 2020 (15 per cent);
France (13 per cent); 2020 (8 per cent);
Germany (8 per cent); 2020 (6 per cent);
Asia (general mention) (5 per cent); 2020 (5 per cent);
Don't know/No response (9 per cent); 2020 (9 per cent).
Note: Only those responses selected by at least 5% displayed above
Base: Canadians; February 8-28, 2021, n=2,043, MOE +/- 2.2%, 19 times out of 20
2.4 Canada's Largest Export Sectors
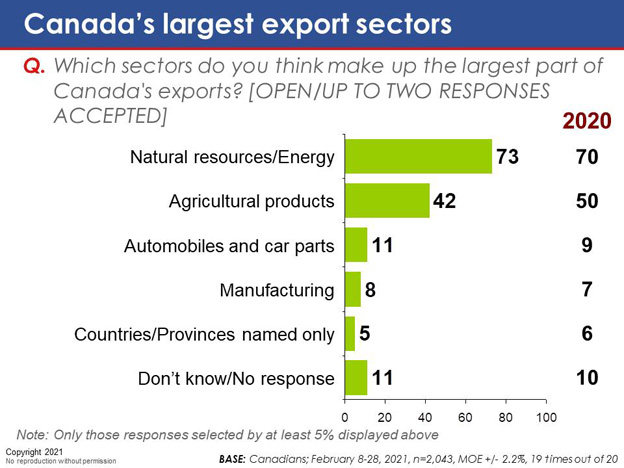
Respondents were further asked to identify Canada's two largest export sectors. Fully 73 per cent of respondents selected natural resources/energy, while four in ten (42 per cent) mentioned agricultural products. Other common responses include the automobile industry (11 per cent) and manufacturing (five per cent). Tracking from 2020 reveals an eight-point drop in the proportion of Canadians who believe agriculture to be one of Canada's largest export sectors.
Compared to women, men are more likely to mention natural resources and energy (78 per cent, compared to 69 per cent of women).
The likelihood of identifying Canada's agricultural sector rises with age (from 36 per cent among those under the age 35 to 48 per cent among those ages 65 and over).
Propensity to cite natural resources and energy rises with educational attainment (from 59 per cent among high school educated to 80 per cent among university graduates).
Regionally, Albertans are more likely to mention natural resources and energy (86 per cent, compared to 73 per cent nationally). Residents of Saskatchewan and Manitoba are more apt to cite agricultural products (59 per cent, compared to 42 per cent nationally).
Chart 16: Canada's largest export sectors
Chart 16: Canada's largest export sectors - Text Version
This chart shows six single bars with a column on the side for the 2020 results.
Respondents were asked: "Which sectors do you think make up the largest part of Canada's exports? [Open/up to two responses accepted]?"
Respondents selected:
Natural resources/Energy (73 per cent); 2020 (70 per cent);
Agricultural products (42 per cent); 2020 (50 per cent);
Automobiles and car parts (11 per cent); 2020 (9 per cent);
Manufacturing (8 per cent); 2020 (7 per cent);
Countries/Provinces named only (5 per cent); 2020 (6 per cent);
Don't know/No response (11 per cent); 2020 (10 per cent).
Note: Only those responses selected by at least 5% displayed above
Base: Canadians; February 8-28, 2021, n=2,043, MOE +/- 2.2%, 19 times out of 20
2.5 Relative Proportion of Services to Products
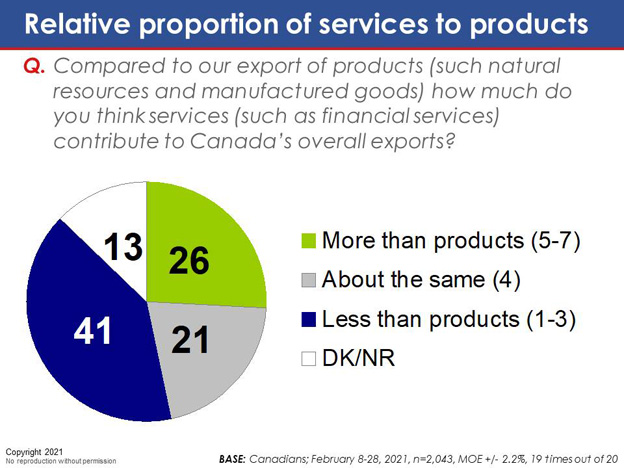
Respondents were asked whether they believe services make up a greater or lesser share of Canada's exports when compared to products such as natural resources and manufactured goods. The plurality of respondents – 41 per cent – believe services make a up comparatively smaller share of Canada's exports, while just one-quarter (26 per cent) say services constitute a larger share. One in five (21 per cent) believe that goods and services contribute equally to Canada's overall exports, while one in eight (13 per cent) are unsure.
University graduates are more likely to say services make up a smaller share of Canada's exports (48 per cent, compared to 31 per cent of college graduates and 30 per cent of high school educated).
Quebec residents are more apt to believe services make up a larger portion of Canada's exports (34 per cent, compared to 26 per cent nationally).
Chart 17: Relative proportion of services to products
Chart 17: Relative proportion of services to products - Text Version
This chart shows a pie with the scale: more than products (5-7), about the same (4), and less than products (1-3), with an additional point for DK/NR.
Respondents were asked: "Compared to our export of products (such natural resources and manufactured goods) how much do you think services (such as financial services) contribute to Canada's overall exports??"
Respondents selected:
More than products (26 per cent);
About the same (21 per cent);
Less than products (41 per cent);
Don't know/No response (13 per cent).
Base: Canadians; February 8-28, 2021, n=2,043, MOE +/- 2.2%, 19 times out of 20
2.6 Importance of Ensuring Global Competitiveness in Key Industries
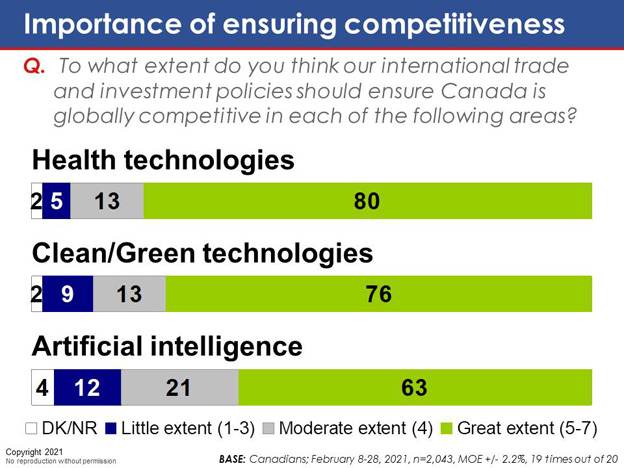
Respondents were presented with a list of industries and asked to rate the extent to which they believe future trade and investment policies should ensure Canada's competitiveness in each of these areas. Eight in ten (80 per cent) say ensuring Canada is a major player in the health technology industry should be a top priority, while slightly fewer (76 per cent) say green technologies should be a major consideration. Artificial intelligence ranks comparatively lower, with six in ten (63 per cent) saying trade policies should ensure Canada is globally competitive in this area.
Green technology is a comparatively higher priority among university graduates (82 per cent, compared to 69 per cent of college graduates and 66 per cent of high school educated).
Regionally, Quebeckers are more likely to say artificial intelligence should be a key priority (73 per cent, compared to 63 per cent nationally). Residents of Alberta and Saskatchewan/Manitoba are less likely to rate Canada's green technology sector as a priority (66 per cent and 69 per cent, respectively, compared to 76 per cent nationally).
Chart 18: Importance of ensuring competitiveness
Chart 18: Importance of ensuring competitiveness - Text Version
This chart shows three horizontal stacked bars based on a seven-point scale where 1-3 means little extent, 4 means moderate extent, and 5-7 means great extent, with an additional point for DK/NR.
Respondents were asked: "To what extent do you think our international trade and investment policies should ensure Canada is globally competitive in each of the following areas??"
Respondents selected:
Health technologies: DK/NR (2 per cent); little extent (5 per cent); moderate extent (13 per cent); and great extent (80 per cent);
Clean/Green technologies: DK/NR (2 per cent); little extent (9 per cent); moderate extent (13 per cent); and great extent (76 per cent);
Artificial intelligence: DK/NR (4 per cent); little extent (12 per cent); moderate extent (21 per cent); and great extent (63 per cent).
Base: Canadians; February 8-28, 2021, n=2,043, MOE +/- 2.2%, 19 times out of 20
2.7 Trade as a Means of Preparing for Pandemics
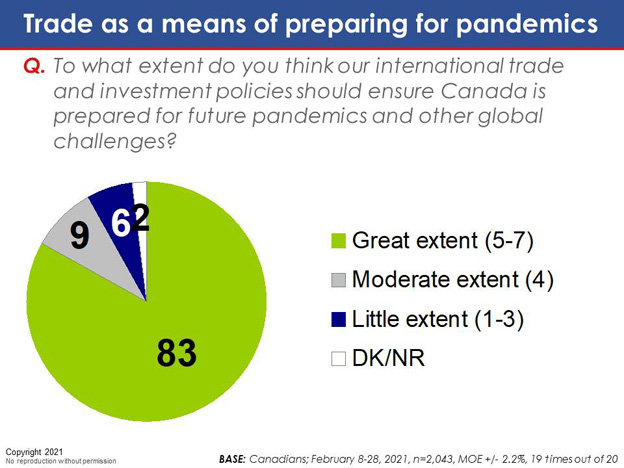
Results also reveal Canadians widely believe pandemic planning should be a key consideration when it comes to drafting international trade and investment policies. About eight in ten (83 per cent) believe trade policies should ensure pandemic preparedness to a great extent, while one in ten (nine per cent) believe they should do so to a moderate extent. Just six per cent believe matters related to pandemics should, for the most part, be left out of trade and investment policies.
The preferred degree of consideration given to pandemic planning rises progressively with age (from 80 per cent among those under 35 to 90 per cent among those 65 and over).
Chart 19: Trade as a means of preparing for pandemics
Chart 19: Trade as a means of preparing for pandemics - Text Version
This chart shows a pie with the scale: great extent (5-7), moderate extent (4), and little extent (1-3), with an additional point for DK/NR.
Respondents were asked: "To what extent do you think our international trade and investment policies should ensure Canada is prepared for future pandemics and other global challenges??"
Respondents selected:
Great extent (83 per cent);
Moderate extent (9 per cent);
Little extent (6 per cent);
Don't know/No response (2 per cent).
Base: Canadians; February 8-28, 2021, n=2,043, MOE +/- 2.2%, 19 times out of 20
3. Benefits of International Trade
3.1 Importance of International Trade
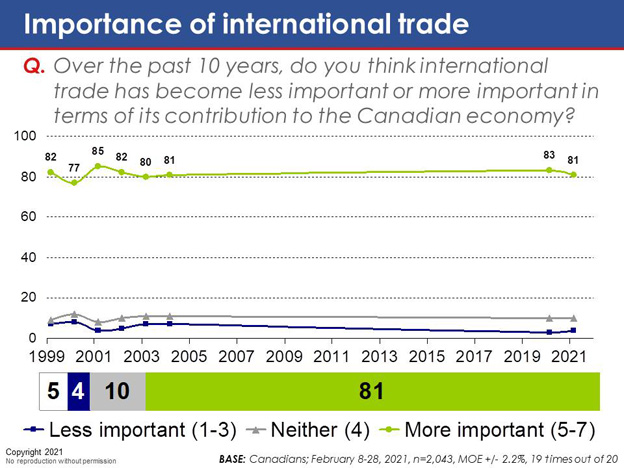
Results suggest Canadians feel that international trade has become more important over the past ten years. Fully eight in ten respondents (81 per cent) say trade has grown in importance, while just four per cent believe it is becoming less important. Ten per cent say trade is neither more nor less important than it was a decade ago. These results have remained largely stable over the past 20 years.
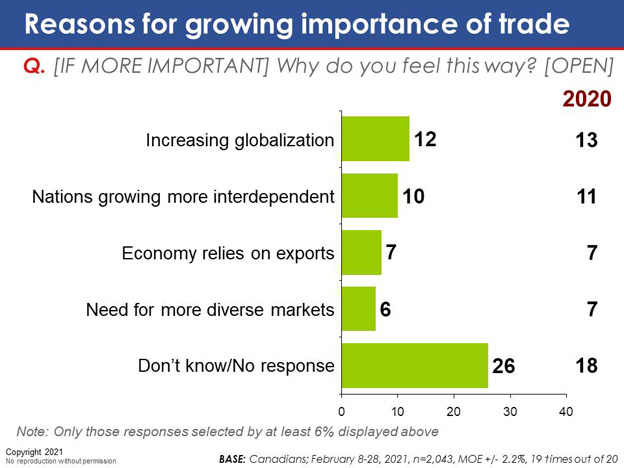
Those who believe trade has become more important over the past 10 years were asked, unprompted, to elaborate on their answer. These respondents offered a variety of reasons, including increased globalization (12 per cent), growing interdependence between countries (10 per cent), the economic benefits of trade (seven per cent), and the need for more diverse markets (six per cent). These results are generally unchanged from 2020.
Chart 20: Importance of international trade
Chart 20: Importance of international trade - Text Version
This chart shows a line graph for results for the period between 1999 and 2021 (blue line: less important (1-3) – grey line: neither (4), and green line: more important (5-7)), and a horizontal stacked bar based on the same scale: less important, neither, and more important.
Respondents were asked: "Over the past 10 years, do you think international trade has become less important or more important in terms of its contribution to the Canadian economy?"
Respondents selected:
Less important: 1999 (7 per cent); 2000 (8 per cent), 2001 (4 per cent); 2002 (5 per cent); 2003 (7 per cent); 2004 (7 per cent); 2020 (3 per cent); and 2021 (4 per cent);
Neither: 1999 (9 per cent); 2000 (12 per cent), 2001 (8 per cent); 2002 (10 per cent); 2003 (11 per cent); 2004 (11 per cent); 2020 (10 per cent); and 2021 (10 per cent);
More important: 1999 (82 per cent); 2000 (77 per cent), 2001 (85 per cent); 2002 (82 per cent); 2003 (80 per cent); 2004 (81 per cent); 2020 (83 per cent); and 2021 (81 per cent).
Stacked bar: DK/NR (5 per cent); less important (4 per cent); neither (10 per cent); and more important (81 per cent).
Base: Canadians; February 8-28, 2021, n=2,043, MOE +/- 2.2%, 19 times out of 20
Chart 21: Reasons for growing importance of trade
Chart 21: Reasons for growing importance of trade - Text Version
This chart shows five single bars with a column on the side for the 2020 results.
Respondents were asked: "[If more important] Why do you feel this way? [Open]"
Respondents selected:
Increasing globalization (12 per cent); 2020 (13 per cent);
Nations growing more interdependent (10 per cent); 2020 (11 per cent);
Economy relies on exports (7 per cent); 2020 (7 per cent);
Need for more diverse markets (6 per cent); 2020 (7 per cent);
Don't know/No response (26 per cent) 2020 (18 per cent).
Note: Only those responses selected by at least 6% displayed above
Base: Canadians; February 8-28, 2021, n=2,043, MOE +/- 2.2%, 19 times out of 20
3.2 Impacts of International Trade
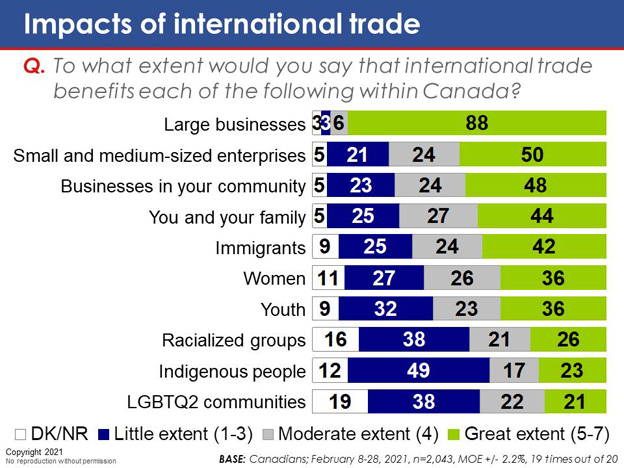
Results further suggest Canadians feel that trade benefits large corporations, offering fewer benefits to Canada's more marginalized communities. When asked to rate the extent to which various groups benefit from international trade, nine in ten Canadians (88 per cent) say large businesses benefit to a great extent from international trade. Just half feel that small- to medium-sized enterprises (SMEs) and community businesses benefit to the same extent (50 per cent and 48 per cent, respectively). Just over four in ten (44 per cent) feel they personally benefit from international trade, while a similar proportion (42 per cent) see immigrants as beneficiaries. Only one-third believe women or youth have benefited from international trade (36 per cent each) and few feel racialized groups (26 per cent), Indigenous people (23 per cent), or LGBTQ2 communities (21 per cent) have benefitted from trade.
These results have remained largely stable over the past year, although there has been a six-point increase in the proportion of Canadians who believe they have personally benefited from international trade.
Men are consistently more likely to say that all groups benefit from international trade. For example, 40 per cent say women enjoy substantial benefits from trade, compared to 32 per cent of women.
The likelihood of believing Indigenous people are helped from trade declines with educational attainment (from 31 per cent among high school educated to 18 per cent among those with a university degree).
With the exception of large businesses, Quebec residents are consistently more likely to say each of these groups benefit from international trade. For instance, 63 per cent say SMEs profit from trade, compared to 50 per cent nationally.
Chart 22: Impacts of international trade
Chart 22: Impacts of international trade - Text Version
This chart shows ten horizontal stacked bars based on a seven-point scale where 1-3 means little extent, 4 means moderate extent, and 5-7 means great extent, with an additional point for DK/NR.
Respondents were asked: "To what extent would you say that international trade benefits each of the following within Canada?"
Respondents selected:
Large businesses: DK/NR (3 per cent); little extent (3 per cent); moderate extent (6 per cent); and great extent (88 per cent);
Small and medium-sized enterprises: DK/NR (5 per cent); little extent (21 per cent); moderate extent (24 per cent); and great extent (50 per cent);
Businesses in your community: DK/NR (5 per cent); little extent (23 per cent); moderate extent (24 per cent); and great extent (48 per cent);
You and your family: DK/NR (5 per cent); little extent (25 per cent); moderate extent (27 per cent); and great extent (44 per cent);
Immigrants: DK/NR (9 per cent); little extent (25 per cent); moderate extent (24 per cent); and great extent (42 per cent);
Women: DK/NR (11 per cent); little extent (27 per cent); moderate extent (26 per cent); and great extent (36 per cent);
Youth: DK/NR (9 per cent); little extent (32 per cent); moderate extent (23 per cent); and great extent (36 per cent);
Racialized groups: DK/NR (16 per cent); little extent (38 per cent); moderate extent (21 per cent); and great extent (26 per cent);
Indigenous people: DK/NR (12 per cent); little extent (49 per cent); moderate extent (17 per cent); and great extent (23 per cent);
LGBTQ2 communities: DK/NR (19 per cent); little extent (38 per cent); moderate extent (22 per cent); and great extent (21 per cent);
Base: Canadians; February 8-28, 2021, n=2,043, MOE +/- 2.2%, 19 times out of 20
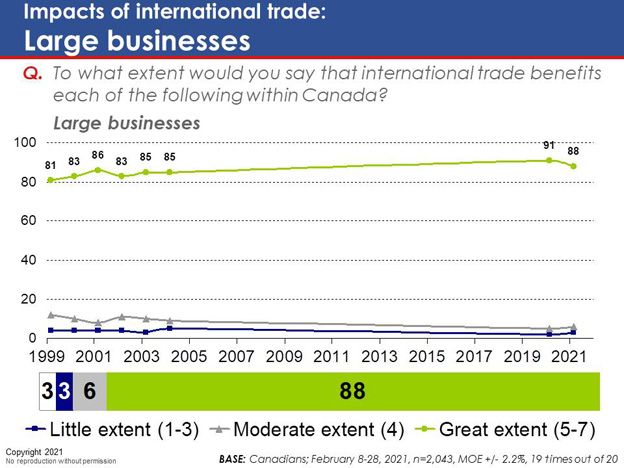
Chart 23: Impacts of international trade: large businesses
Chart 23: Impacts of international trade: large businesses - Text Version
This chart shows a line graph for results for the period between 1999 and 2021 (blue line: little extent (1-3), grey line: moderate extent (4), and: green line: great extent (5-7)), and a horizontal stacked bar based on the same scale: little extent, moderate extent, and great extent.
Respondents were asked: "To what extent would you say that international trade benefits each of the following within Canada? Large businesses"
Respondents selected:
Little extent: 1999 (4 per cent); 2000 (4 per cent), 2001 (4 per cent); 2002 (4 per cent); 2003 (3 per cent); 2004 (5 per cent); 2020 (2 per cent); and 2021 (3 per cent);
Moderate extent: 1999 (12 per cent); 2000 (10 per cent), 2001 (8 per cent); 2002 (11 per cent); 2003 (10 per cent); 2004 (9 per cent); 2020 (5 per cent); and 2021 (6 per cent);
Great extent: 1999 (81 per cent); 2000 (83 per cent), 2001 (86 per cent); 2002 (83 per cent); 2003 (85 per cent); 2004 (85 per cent); 2020 (91 per cent); and 2021 (88 per cent).
Stacked bar: DK/NR (3 per cent); little extent (3 per cent); moderate extent (6 per cent); and great extent (88 per cent).
Base: Canadians; February 8-28, 2021, n=2,043, MOE +/- 2.2%, 19 times out of 20
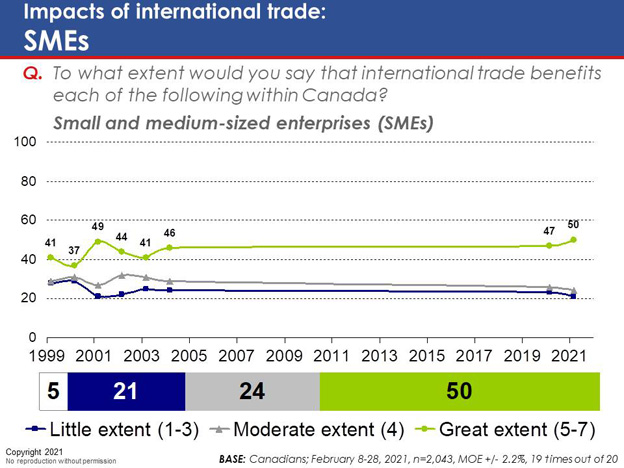
Chart 24: Impacts of international trade: SMEs
Chart 24: Impacts of international trade: SMEs - Text Version
This chart shows a line graph for results for the period between 1999 and 2021 (blue line: little extent (1-3), grey line: moderate extent (4), and: green line: great extent (5-7)), and a horizontal stacked bar based on the same scale: little extent, moderate extent, and great extent.
Respondents were asked: "To what extent would you say that international trade benefits each of the following within Canada? Small and medium-sized enterprises (SMEs)"
Respondents selected:
Little extent: 1999 (28 per cent); 2000 (29 per cent), 2001 (21 per cent); 2002 (22 per cent); 2003 (25 per cent); 2004 (24 per cent); 2020 (23 per cent); and 2021 (21 per cent);
Moderate extent: 1999 (29 per cent); 2000 (31 per cent), 2001 (27 per cent); 2002 (32 per cent); 2003 (31 per cent); 2004 (29 per cent); 2020 (26 per cent); and 2021 (24 per cent);
Great extent: 1999 (41 per cent); 2000 (37 per cent), 2001 (49 per cent); 2002 (44 per cent); 2003 (41 per cent); 2004 (46 per cent); 2020 (47 per cent); and 2021 (50 per cent).
Stacked bar: DK/NR (5 per cent); little extent (21 per cent); moderate extent (24 per cent); and great extent (50 per cent).
Base: Canadians; February 8-28, 2021, n=2,043, MOE +/- 2.2%, 19 times out of 20
Chart 25: Impacts of international trade: Local businesses
Chart 25: Impacts of international trade: Local businesses - Text Version
This chart shows a line graph for results for the period between 1999 and 2021 (blue line: little extent (1-3), grey line: moderate extent (4), and: green line: great extent (5-7)), and a horizontal stacked bar based on the same scale: little extent, moderate extent, and great extent.
Respondents were asked: "To what extent would you say that international trade benefits each of the following within Canada? Businesses in your community"
Respondents selected:
Little extent: 1999 (30 per cent); 2000 (27 per cent), 2001 (20 per cent); 2002 (22 per cent); 2003 (26 per cent); 2004 (25 per cent); 2020 (25 per cent); and 2021 (23 per cent);
Moderate extent: 1999 (27 per cent); 2000 (27 per cent), 2001 (25 per cent); 2002 (27 per cent); 2003 (29 per cent); 2004 (23 per cent); 2020 (24 per cent); and 2021 (24 per cent);
Great extent: 1999 (41 per cent); 2000 (42 per cent), 2001 (51 per cent); 2002 (47 per cent); 2003 (43 per cent); 2004 (49 per cent); 2020 (46 per cent); and 2021 (48 per cent).
Stacked bar: DK/NR (5 per cent); little extent (23 per cent); moderate extent (24 per cent); and great extent (48 per cent).
Base: Canadians; February 8-28, 2021, n=2,043, MOE +/- 2.2%, 19 times out of 20
Chart 26: Impacts of international trade: Individual Canadians
Chart 26: Impacts of international trade: Individual Canadians - Text Version
This chart shows a line graph for results for the period between 1999 and 2021 (blue line: little extent (1-3), grey line: moderate extent (4), and: green line: great extent (5-7)), and a horizontal stacked bar based on the same scale: little extent, moderate extent, and great extent.
Respondents were asked: "To what extent would you say that international trade benefits each of the following within Canada? You and your family"
Respondents selected:
Little extent: 1999 (32 per cent); 2000 (34 per cent), 2001 (26 per cent); 2002 (31 per cent); 2003 (32 per cent); 2004 (32 per cent); 2020 (31 per cent); and 2021 (25 per cent);
Moderate extent: 1999 (31 per cent); 2000 (29 per cent), 2001 (30 per cent); 2002 (31 per cent); 2003 (31 per cent); 2004 (26 per cent); 2020 (27 per cent); and 2021 (27 per cent);
Great extent: 1999 (35 per cent); 2000 (35 per cent), 2001 (42 per cent); 2002 (35 per cent); 2003 (35 per cent); 2004 (40 per cent); 2020 (38 per cent); and 2021 (44 per cent).
Stacked bar: DK/NR (5 per cent); little extent (25 per cent); moderate extent (27 per cent); and great extent (44 per cent).
Base: Canadians; February 8-28, 2021, n=2,043, MOE +/- 2.2%, 19 times out of 20
Chart 27: Impacts of international trade: Women
Chart 27: Impacts of international trade: Women - Text Version
This chart shows a line graph for results for the period between February 2020 and February 2021 (blue line: little extent (1-3), grey line: moderate extent (4), and: green line: great extent (5-7)), and a horizontal stacked bar based on the same scale: little extent, moderate extent, and great extent.
Respondents were asked: "To what extent would you say that international trade benefits each of the following within Canada? Women"
Respondents selected:
Little extent: February 2020 (31 per cent); and February 2021 (27 per cent);
Moderate extent: February 2020 (28 per cent); and February 2021 (26 per cent);
Great extent: February 2020 (32 per cent); and February 2021 (36 per cent).
Stacked bar: DK/NR (11 per cent); little extent (27 per cent); moderate extent (26 per cent); and great extent (36 per cent).
Base: Canadians; February 8-28, 2021, n=2,043, MOE +/- 2.2%, 19 times out of 20
Chart 28: Impacts of international trade: Youth
Chart 28: Impacts of international trade: Youth - Text Version
This chart shows a line graph for results for the period between February 2020 and February 2021 (blue line: little extent (1-3), grey line: moderate extent (4), and: green line: great extent (5-7)), and a horizontal stacked bar based on the same scale: little extent, moderate extent, and great extent.
Respondents were asked: "To what extent would you say that international trade benefits each of the following within Canada? Youth"
Respondents selected:
Little extent: February 2020 (38 per cent); and February 2021 (32 per cent);
Moderate extent: February 2020 (24 per cent); and February 2021 (23 per cent);
Great extent: February 2020 (32 per cent); and February 2021 (36 per cent).
Stacked bar: DK/NR (9 per cent); little extent (32 per cent); moderate extent (23 per cent); and great extent (36 per cent).
Base: Canadians; February 8-28, 2021, n=2,043, MOE +/- 2.2%, 19 times out of 20
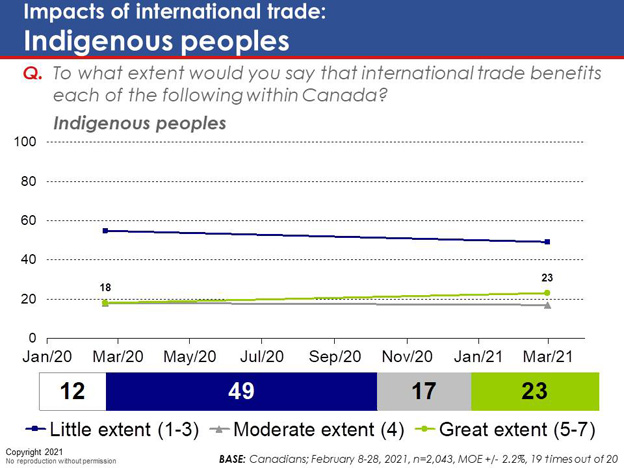
Chart 29: Impacts of international trade: Indigenous peoples
Chart 29: Impacts of international trade: Indigenous peoples - Text Version
This chart shows a line graph for results for the period between February 2020 and February 2021 (blue line: little extent (1-3), grey line: moderate extent (4), and: green line: great extent (5-7)), and a horizontal stacked bar based on the same scale: little extent, moderate extent, and great extent.
Respondents were asked: "To what extent would you say that international trade benefits each of the following within Canada? Indigenous peoples"
Respondents selected:
Little extent: February 2020 (55 per cent); and February 2021 (49 per cent);
Moderate extent: February 2020 (18 per cent); and February 2021 (17 per cent);
Great extent: February 2020 (18 per cent); and February 2021 (23 per cent).
Stacked bar: DK/NR (12 per cent); little extent (49 per cent); moderate extent (17 per cent); and great extent (23 per cent).
Base: Canadians; February 8-28, 2021, n=2,043, MOE +/- 2.2%, 19 times out of 20
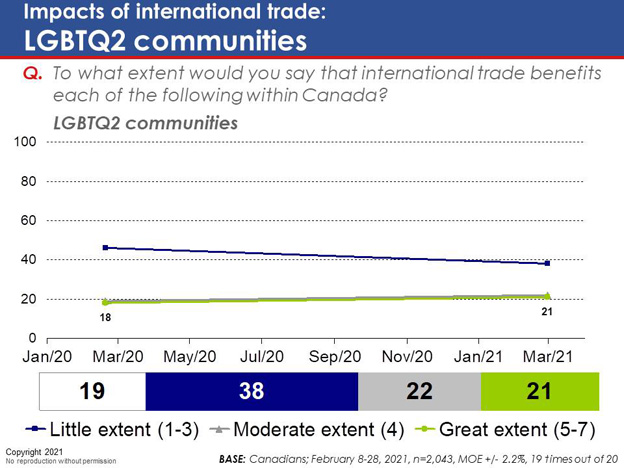
Chart 30: Impacts of international trade: LGBTQ2 communities
Chart 30: Impacts of international trade: LGBTQ2 communities - Text Version
This chart shows a line graph for results for the period between February 2020 and February 2021 (blue line: little extent (1-3), grey line: moderate extent (4), and: green line: great extent (5-7)), and a horizontal stacked bar based on the same scale: little extent, moderate extent, and great extent.
Respondents were asked: "To what extent would you say that international trade benefits each of the following within Canada? LGBTQ2 communities"
Respondents selected:
Little extent: February 2020 (46 per cent); and February 2021 (38 per cent);
Moderate extent: February 2020 (19 per cent); and February 2021 (22 per cent);
Great extent: February 2020 (18 per cent); and February 2021 (21 per cent).
Stacked bar: DK/NR (19 per cent); little extent (38 per cent); moderate extent (22 per cent); and great extent (21 per cent).
Base: Canadians; February 8-28, 2021, n=2,043, MOE +/- 2.2%, 19 times out of 20
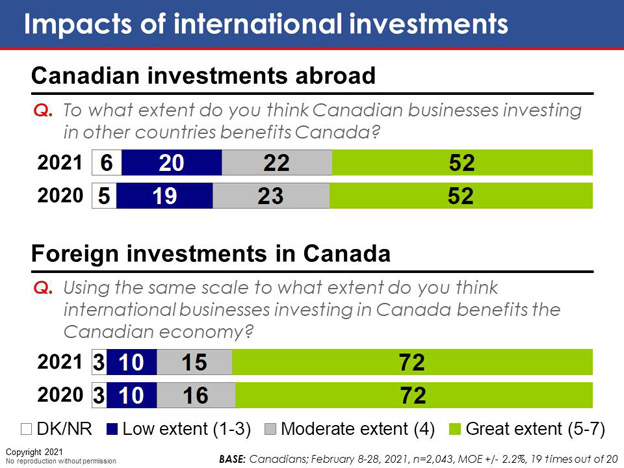
3.3 Impacts of International Investments
Respondents were asked about the perceived benefits of Canadian investments in other countries and about the impacts of foreign investment in Canada. Half (52 per cent) say Canadians benefit significantly from investments abroad, while 22 per cent say the country benefits to a moderate extent. One in five (20 per cent) say Canadians enjoy few – if any – benefits from Canadian businesses investing in other countries.
Those 65 and over are more likely to say Canadian investments in other countries benefit Canada (60 per cent, compared to 52 per cent on average).
Foreign investments within Canada elicit even more favourable reactions. Seven in ten (72 per cent) feel the country benefits greatly from these investments, and only ten per cent say the benefits of foreign investments are of little to no consequence.
Results are largely unchanged from 2020.
Chart 31: Impacts of international investments
Chart 31: Impacts of international investments - Text Version
This chart shows four horizontal stacked bars with results for 2021 and 2020 for two different statements, based on a seven-point scale where 1-3 means low extent, 4 means moderate extent, and 5-7 means great extent, with an additional point for DK/NR.
Respondents were asked two questions: "To what extent do you think Canadian businesses investing in other countries benefits Canada?" and "Using the same scale to what extent do you think international businesses investing in Canada benefits the Canadian economy?"
Respondents selected:
Canadian investments abroad: 2021: DK/NR (6 per cent); low extent (20 per cent); moderate extent (22 per cent); and great extent (52 per cent);
2020: DK/NR (5 per cent); low extent (19 per cent); moderate extent (23 per cent); and great extent (52 per cent);
Foreign investments in Canada: 2021: DK/NR (3 per cent); low extent (10 per cent); moderate extent (15 per cent); and great extent (72 per cent);
2020: DK/NR (3 per cent); low extent (10 per cent); moderate extent (16 per cent); and great extent (72 per cent);
Base: Canadians; February 8-28, 2021, n=2,043, MOE +/- 2.2%, 19 times out of 20
4. Canada's Brand
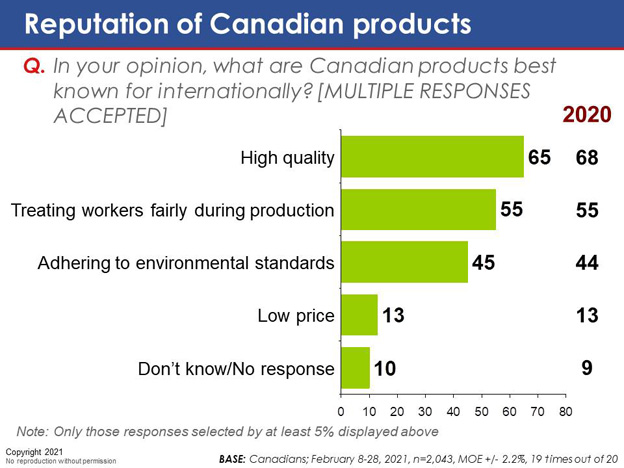
4.1 Reputation of Canadian Products
Respondents were asked to identify the qualities for which they feel Canadian products are best known internationally. Two-thirds (65 per cent) say they are best known for their high quality. Just over half (55 per cent) say Canadian goods are defined by Canada's fair labour practices, while just over four in ten (45 per cent) say the country's environmental standards underlie Canada's reputation. Only one in eight (13 per cent) believe that Canadian products have a reputation for low prices. Nine per cent offered no response. These results are largely unchanged from 2020.
The perception that Canadian products are best known for the equitable treatment of the workers involved in their production is more prevalent in Alberta (64 per cent, compared to 55 per cent nationally).
Chart 32: Reputation of Canadian products
Chart 32: Reputation of Canadian products - Text Version
This chart shows five single bars with a column on the side for the 2020 results.
Respondents were asked: "In your opinion, what are Canadian products best known for internationally? [Multiple responses accepted]"
Respondents selected:
High quality (65 per cent); 2020 (68 per cent);
Treating workers fairly during production (55 per cent); 2020 (55 per cent);
Adhering to environmental standards (45 per cent); 2020 (44 per cent);
Low price (13 per cent); 2020 (13 per cent);
Don't know/No response (10 per cent); 2020 (9 per cent).
Note: Only those responses selected by at least 5% displayed above
Base: Canadians; February 8-28, 2021, n=2,043, MOE +/- 2.2%, 19 times out of 20
4.2 Views on Protectionism
Respondents were presented with a brief description of protectionism and asked whether they considered growing protectionist sentiments to be a good thing or a bad thing for Canada. Results reveal that most Canadians (59 per cent) feel protectionism is a bad thing. Just one in five (18 per cent) believe protectionism to be a good thing, and roughly the same proportion (17 per cent) hold neither a positive nor negative view on the matter. These results are similar to those found in 2020.
Men are comparatively more likely to say protectionism is harmful to Canada`s economy (65 per cent, compared to 53 per cent of women).
Disapproval of growing protectionist sentiments rises with age (from 54 per cent among those under the age of 35 to 69 per cent among those 65 and over).
The view that protectionism is detrimental is more common among university graduates (66 per cent, compared to 51 per cent of college and high school educated).
Chart 33: Views on protectionism
Chart 33: Views on protectionism - Text Version
This chart shows two horizontal stacked bars with results for February 2021 and February 2020, based on the scale bad thing, neither good nor bad, and good thing, with an additional point for DK/NR.
Respondents were asked: "Many people talk about the rise of protectionism in the United States and Europe which, among other things, includes growing opposition to trade and globalization. Overall, do you think this rise of protectionism is a good thing or a bad thing for Canada?"
Respondents selected:
February 2021: DK/NR (6 per cent); bad thing (59 per cent); neither good nor bad (18 per cent); and good thing (17 per cent);
Base: Canadians; February 8-28, 2021, n=2,043, MOE +/- 2.2%, 19 times out of 20
February 2020: DK/NR (8 per cent); bad thing (62 per cent); neither good nor bad (16 per cent); and good thing (14 per cent);
Base: Canadians; February 6-19, 2020, n=2,089, MOE +/- 2.1%, 19 times out of 20
5. Sustainable and Inclusive Trade Opportunities
5.1 Impact of Trade on Environmental Standards
Results suggest Canadians are moderately worried about the impact of trade on international environmental standards. When asked whether they agree or disagree that increased international trade is likely to result in countries lowering their environmental standards to be more competitive, roughly six in ten (57 per cent) agree this is the case, while one-quarter (23 per cent) disagree. Tracking reveals a six-point increase in agreement with this statement since 2020.
Respondents who identify as LGBTQ2 are significantly more likely to worry about the likelihood of increased international trade resulting in countries lowering their environmental standards to be more competitive (73 per cent, compared to 57 per cent on average).
Chart 34: Impact of trade on environmental standards
Chart 34: Impact of trade on environmental standards - Text Version
This chart shows a line graph for results for the period between 1999 and 2021 (blue line: disagree (1-3), grey line: neither (4), and: green line: agree (5-7)), and a horizontal stacked bar based on the same scale: disagree, neither, and agree.
Respondents were asked: "Please tell me the extent to which you agree or disagree with each of the following statement: I worry increased international trade is likely to result in countries lowering their environmental standards to be more competitive?"
Respondents selected:
Disagree: 1999 (18 per cent); 2000 (21 per cent), 2001 (18 per cent); 2020 (25 per cent); and 2021 (23 per cent);
Neither: 1999 (18 per cent); 2000 (17 per cent), 2001 (21 per cent); 2020 (20 per cent); and 2021 (17 per cent);
Agree: 1999 (62 per cent); 2000 (59 per cent), 2001 (58 per cent); 2020 (51 per cent); and 2021 (57 per cent).
Stacked bar: DK/NR (4 per cent); disagree (23 per cent); neither (17 per cent); and agree (57 per cent).
Base: Canadians; February 8-28, 2021, n=2,043, MOE +/- 2.2%, 19 times out of 20
5.2 International Trade and Social Issues
Results suggest that international trade is widely seen as an opportunity for Canada to promote a number of social goals. About six in ten Canadians see trade as a good way to promote environmental responsibility (63 per cent), respect for labour rights (62 per cent), and respect for human rights (60 per cent). Slightly fewer (57 per cent) say trade is an effective means to foster trade opportunities for all. These results are largely unchanged from 2020.
Women are more likely to say that trade offers an opportunity to advance labour rights (69 per cent, compared to 59 per cent of men), as well as human rights (67 per cent versus 57 per cent). Interestingly, women are no more likely than their male counterparts to see trade as a means of promoting trade opportunities for all.
Residents of Saskatchewan and Manitoba are more apt to view international trade as a means for creating trade opportunities that benefits everyone (68 per cent, compared to 57 per cent nationally). Residents of Atlantic Canada are more likely to see trade as an opportunity to advance human rights (71 per cent, compared to 60 per cent nationally).
Chart 35: International trade and social issues
Chart 35: International trade and social issues - Text Version
This chart shows four horizontal stacked bars based on a seven-point scale where 1-3 means disagree, 4 means neither, and 5-7 means agree, with an additional point for DK/NR.
Respondents were asked: "Please tell me the extent to which you agree or disagree with each of the following statements: International trade is a good way for Canada to promote…?"
Respondents selected:
Environmental responsibility: DK/NR (3 per cent); disagree (17 per cent); neither (17 per cent); and agree (63 per cent);
Respect for labour rights: DK/NR (4 per cent); disagree (17 per cent); neither (17 per cent); and agree (62 per cent);
Respect for human rights: DK/NR (4 per cent); disagree (17 per cent); neither (19 per cent); and agree (60 per cent);
Trade opportunities for all (notably women, indigenous, SMEs): DK/NR (5 per cent); disagree (18 per cent); neither (20 per cent); and agree (57 per cent);
Base: Canadians; February 8-28, 2021, n=2,043, MOE +/- 2.2%, 19 times out of 20
Chart 36: International trade and social issues: Environmental responsibility
Chart 36: International trade and social issues: Environmental responsibility - Text Version
This chart shows a line graph for results for the period between February 2020 and February 2021 (blue line: disagree (1-3), grey line: neither (4), and: green line: agree (5-7)), and a horizontal stacked bar based on the same scale: disagree, neither, and agree.
Respondents were asked: "Please tell me the extent to which you agree or disagree with each of the following statements: International trade is a good way for Canada to promote environmental responsibility?"
Respondents selected:
Disagree: February 2020 (16 per cent); and February 2021 (17 per cent);
Neither: February 2020 (16 per cent); and February 2021 (17 per cent);
Agree: February 2020 (65 per cent); and February 2021 (63 per cent);.
Stacked bar: DK/NR (3 per cent); disagree (17 per cent); neither (17 per cent); and agree (63 per cent).
Base: Canadians; February 8-28, 2021, n=2,043, MOE +/- 2.2%, 19 times out of 20
Chart 37: International trade and social issues: Labour rights
Chart 37: International trade and social issues: Labour rights - Text Version
This chart shows a line graph for results for the period between February 2020 and February2021 (blue line: disagree (1-3), grey line: neither (4), and: green line: agree (5-7)), and a horizontal stacked bar based on the same scale: disagree, neither, and agree.
Respondents were asked: "Please tell me the extent to which you agree or disagree with each of the following statements: International trade is a good way for Canada to promote respect for labour rights?"
Respondents selected:
Disagree: February 2020 (16 per cent); and February 2021 (17 per cent);
Neither: February 2020 (17 per cent); and February 2021 (17 per cent);
Agree: February 2020 (64 per cent); and February 2021 (62 per cent);.
Stacked bar: DK/NR (4 per cent); disagree (17 per cent); neither (17 per cent); and agree (62 per cent).
Base: Canadians; February 8-28, 2021, n=2,043, MOE +/- 2.2%, 19 times out of 20
Chart 38: International trade and social issues: Human rights
Chart 38: International trade and social issues: Human rights - Text Version
This chart shows a line graph for results for the period between February 2020 and February2021 (blue line: disagree (1-3), grey line: neither (4), and: green line: agree (5-7)), and a horizontal stacked bar based on the same scale: disagree, neither, and agree.
Respondents were asked: "Please tell me the extent to which you agree or disagree with each of the following statements: International trade is a good way for Canada to promote respect for human rights?"
Respondents selected:
Disagree: February 2020 (18 per cent); and February 2021 (17 per cent);
Neither: February 2020 (17 per cent); and February 2021 (19 per cent);
Agree: February 2020 (62 per cent); and February 2021 (60 per cent);.
Stacked bar: DK/NR (4 per cent); disagree (17 per cent); neither (19 per cent); and agree (60 per cent).
Base: Canadians; February 8-28, 2021, n=2,043, MOE +/- 2.2%, 19 times out of 20
Chart 39: International trade and social issues: Trade opportunities for all
Chart 39: International trade and social issues: Trade opportunities for all - Text Version
This chart shows a line graph for results for the period between February 2020 and February 2021 (blue line: disagree (1-3), grey line: neither (4), and: green line: agree (5-7)), and a horizontal stacked bar based on the same scale: disagree, neither, and agree.
Respondents were asked: "Please tell me the extent to which you agree or disagree with each of the following statements: International trade is a good way for Canada to promote trade opportunities for all (notably women, indigenous, SMEs)?"
Respondents selected:
Disagree: February 2020 (18 per cent); and February 2021 (18 per cent);
Neither: February 2020 (17 per cent); and February 2021 (20 per cent);
Agree: February 2020 (60 per cent); and February 2021 (57 per cent);.
Stacked bar: DK/NR (5 per cent); disagree (18 per cent); neither (20 per cent); and agree (57 per cent).
Base: Canadians; February 8-28, 2021, n=2,043, MOE +/- 2.2%, 19 times out of 20
6. Knowledge of Trade and Canada's Free Trade Agreements
6.1 Support for International Trade
Results suggest Canadians are generally supportive of international trade. When asked whether more international trade is a good thing or a bad thing for Canada, two-thirds (67 per cent) say it is a good thing, and just seven per cent think it is a bad thing. Tracking suggests a steady rise in support for international trade over the past four years (from 48 per cent in 2017 to 67 per cent today).
Men are more apt to see international trade as a good thing (74 per cent, compared to 60 per cent of women).
Positive perceptions of international trade rise progressively with age (from 61 per cent among those under 35 to 78 per cent among those 65 and over).
Chart 40: Support for international trade
Chart 40: Support for international trade - Text Version
This chart shows a line graph for results for the period between 2012 and 2021 (blue line: bad thing, grey line: neither, and green line: good thing), and a horizontal stacked bar based on the same scale: bad thing, neither, good thing.
Respondents were asked: "Is more international trade* a good thing or a bad thing for Canada?"
Respondents selected:
Bad thing: 2012 (15 per cent); 2017 (17 per cent); 2020 (10 per cent); and 2021 (7 per cent);
Neither: 2012 (22 per cent); 2017 (25 per cent); 2020 (20 per cent); and 2021 (21 per cent);
Good thing: 2012 (52 per cent); 2017 (48 per cent); 2020 (61 per cent); and 2021 (67 per cent).
Stacked bar: DK/NR (5 per cent); bad thing (7 per cent); neither (21 per cent); and good thing (67 per cent).
Base: Canadians; February 8-28, 2021, n=2,043, MOE +/- 2.2%, 19 times out of 20
6.2 Potential for More Trade
When asked, unprompted, which countries they believe Canada should be trying to tie itself to more in terms of trade, one-quarter of respondents (24 per cent) believe Canada should tie itself more to the United States, and slightly fewer (22 per cent) say Europe. About one in six (16 per cent) believe Canada should increase trade with the United Kingdom, and slightly fewer say India (12 per cent) or China (12 per cent). Other common responses include Japan (eight per cent), Germany (seven per cent), Mexico (seven per cent), and Australia (six per cent). Tracking reveals these results are largely unchanged from 2020.
The likelihood of identifying Europe as a trading partner with more potential rises with age (from 15 per cent among those under 35 to 28 per cent among those 65 and over).
Residents of Quebec are more likely to say Canada should tie itself more to the United States (33 per cent, compared to 24 per cent nationally), and are less likely to say Canada should be aiming to form stronger ties with Europe (13 per cent versus 22 per cent).
Chart 41: Potential for more trade
Chart 41: Potential for more trade - Text Version
This chart shows ten single bars with a column on the side for the 2020 results.
Respondents were asked: "Over the last few decades, Canada has been opening up trade with many countries. Which countries do you believe Canada should be trying to tie itself to more? [Open/up to two responses accepted]"
Respondents selected:
United States (24 per cent); 2020 (22 per cent);
Europe (general mention) (22 per cent); 2020 (24 per cent);
United Kingdom (16 per cent); 2020 (16 per cent);
India (12 per cent); 2020 (12 per cent);
China (12 per cent); 2020 (16 per cent);
Japan (8 per cent); 2020 (8 per cent);
Germany (7 per cent); 2020 (5 per cent);
Mexico (7 per cent); 2020 (9 per cent);
Australia (6 per cent); 2020 (5 per cent);
Don't know/No response (21 per cent) 2020; (20 per cent.
Note: Only those responses selected by at least 5% displayed above
Base: Canadians; February 8-28, 2021, n=2,043, MOE +/- 2.2%, 19 times out of 20
6.3 Awareness and Attitudes to CUSMA, CPTPP and CETA
Canadians were also asked for their awareness and views on three recently signed trade agreements: the Canada-United States-Mexico Agreement (CUSMA), the Comprehensive and Progressive Agreement for Trans-Pacific Partnership (CPTPP), and the Comprehensive Economic and Trade Agreement (CETA).
Results reveal a general lack of familiarity with the CPTPP and CETA and only moderate public familiarity with CUSMA, but positive views were expressed about the agreements among those familiar with them.
6.3.1 Awareness and attitudes to CUSMA
Results suggest a moderate degree of familiarity with CUSMA. About half of Canadians say they are either very familiar (seven per cent) or somewhat familiar (45 per cent) with the agreement. One in three (34 per cent) are not very familiar and one in eight (13 per cent) would rate their familiarity as non-existent.
Self-rated familiarity with CUSMA is considerably higher among men (62 per cent say they are at least somewhat familiar the agreement, compared to 42 per cent of women).
University graduates are significantly more likely to say they at least somewhat familiar with the treaty (58 per cent, compared to 45 per cent of college graduates and 41 per cent of high school educated).
Among those who are at least somewhat familiar with the agreement, impressions of CUSMA are generally favourable. Most of these respondents hold either a very positive (nine per cent) or somewhat positive (53 per cent) view of the deal. One-quarter (27 per cent) view CUSMA in a somewhat negative light, and just five per cent hold a very negative view.
Chart 42: Familiarity with CUSMA
Chart 42: Familiarity with CUSMA - Text Version
This chart shows five single bars.
Respondents were asked: "As you may know, Canada, the United States, and Mexico recently signed the Canada-US-Mexico agreement on free trade, (also known as CUSMA), which is intended to replace NAFTA. How familiar are you with this agreement?"
Respondents selected:
Very familiar (7 per cent);
Somewhat familiar (45 per cent);
Not very familiar (34 per cent);
Not at all familiar (13 per cent);
Don't know/No response (1 per cent).
Base: Canadians; February 8-28, 2021, n=2,043, MOE +/- 2.2%, 19 times out of 20
Chart 43: Views on CUSMA
Chart 43: Views on CUSMA - Text Version
This chart shows five single bars.
Respondents were asked: "[If very/somewhat familiar] Based on what you know, would you say CUSMA's impact on Canada is positive or negative?"
Respondents selected:
Very positive (9 per cent);
Somewhat positive (53 per cent);
Somewhat negative (27 per cent);
Very negative (5 per cent);
Don't know/No response (5 per cent).
Base: Canadians; February 8-28, 2021, n=2,043, MOE +/- 2.2%, 19 times out of 20
6.3.2 Awareness and attitudes to CPTPP
When asked to rate how familiar they are with the CPTPP, most Canadians indicate they are either not very (42 per cent) or not at all (29 per cent) familiar with it. Just one-quarter (25 per cent) say they are somewhat familiar with the agreement, and an even smaller proportion (three per cent) say they are very familiar with it.
As with CUSMA, self-rated familiarity with the CPTPP is higher among men (39 per cent say they are somewhat or very familiar with the agreement, compared to 18 per cent of women).
University graduates are significantly more likely to say they are familiar with the CPTPP (35 per cent, compared to 20 per cent of college graduates and 19 per cent of high school educated).
Residents of Quebec are least likely to be familiar with CPTPP (15 per cent, compared to 28 per cent on average).
Despite limited awareness of the CPTPP, those who are familiar with the agreement express favourable views: over half (52 per cent) believe it has had a somewhat positive impact on Canada, and one in five (21 per cent) believe it has had a very positive impact.
Views of the CPTPP are more positive among those 65 and over (87 per cent hold a very or somewhat positive view, compared to 73 per cent on average).
Results are largely unchanged from 2020.
Chart 44: Familiarity with CPTPP
Chart 44: Familiarity with CPTPP - Text Version
This chart shows five single bars with a column with the 2020 results.
Respondents were asked: "As you may know, Canada recently signed the Comprehensive and Progressive Agreement for Trans-Pacific Partnership (CPTPP), a free trade agreement between Canada and 10 other countries in the Asia-Pacific region. How familiar are you with this agreement?"
Respondents selected:
Very familiar (3 per cent); 2020 (2 per cent);
Somewhat familiar (25 per cent); 2020 (26 per cent);
Not very familiar (42 per cent); 2020 (40 per cent);
Not at all familiar (29 per cent); 2020 (30 per cent);
Don't know/No response (1 per cent); 2020 (20 per cent;.
Base: Canadians; February 8-28, 2021, n=2,043, MOE +/- 2.2%, 19 times out of 20
Chart 45: Views on CPTPP
Chart 45: Views on CPTPP - Text Version
This chart shows five single bars with a column with the 2020 results.
Respondents were asked: "[If very/somewhat familiar] Based on what you know, would you say the CPTPP's impact on Canada is positive or negative?"
Respondents selected:
Very positive (21 per cent); 2020 (22 per cent);
Somewhat positive (52 per cent); 2020 (51 per cent);
Somewhat negative (13 per cent); 2020 (13 per cent);
Very negative (10 per cent); 2020 (7 per cent);
Don't know/No response (4 per cent); 2020 (6 per cent).
Base: Familiar with CPTPP; February 8-28, 2021, n=2,043, MOE +/- 2.2%, 19 times out of 20
6.3.3 Awareness and attitudes to CETA
Results reveal that awareness of CETA is also fairly limited. Most Canadians are either not very familiar (39 per cent) or not at all familiar (28 per cent) with this agreement. About three in ten (30 per cent) say they are somewhat familiar with the agreement, and just three per cent are very familiar with it.
Once again, men are much more likely to say they are familiar with CETA (42 per cent say they are somewhat or very familiar, compared to 24 per cent of women).
Familiarity with CETA increases with respondents' level of education (from 22 per cent among high school educated to 39 per cent among university graduates).
Regionally, familiarity with the agreement is lowest in Quebec (24 per cent, compared to 33 per cent nationally).
As with the CPTTP, despite low awareness, those familiar with the agreement express favourable views about it: over half of those who express familiarity with the agreement (59 per cent) say CETA's impact on Canada has been somewhat positive, and one-quarter (27 per cent) say its impacts have been very positive. Just one in ten of these respondents (11 per cent) say the impacts have been negative.
Results are consistent with those found in 2020.
Chart 46: Familiarity with CETA
Chart 46: Familiarity with CETA - Text Version
This chart shows five single bars with a column with the 2020 results.
Respondents were asked: "As you may know, Canada recently signed the Comprehensive Economic and Trade Agreement (CETA), a free trade agreement between Canada, the European Union and its members states. How familiar are you with this agreement?"
Respondents selected:
Very familiar (3 per cent); 2020 (4 per cent);
Somewhat familiar (30 per cent); 2020 (28 per cent);
Not very familiar (39 per cent); 2020 (39 per cent);
Not at all familiar (28 per cent); 2020 (28 per cent);
Don't know/No response (1 per cent); 2020 (2 per cent).
Base: Canadians; February 8-28, 2021, n=2,043, MOE +/- 2.2%, 19 times out of 20
Chart 47: Views on CETA
Chart 47: Views on CETA - Text Version
This chart shows five single bars with a column with the 2020 results.
Respondents were asked: "[If very/somewhat familiar] Based on what you know, would you say CETA's impact on Canada is positive or negative?"
Respondents selected:
Very positive (27 per cent); 2020 (30 per cent);
Somewhat positive (59 per cent); 2020 (54 per cent);
Somewhat negative (8 per cent); 2020 (8 per cent);
Very negative (3 per cent); 2020 (3 per cent);
Don't know/No response (3 per cent); 2020 (4 per cent);.
Base: Familiar with CETA; February 8-28, 2021, n=2,043, MOE +/- 2.2%, 19 times out of 20
7. Awareness of Government Programs
7.1 Awareness of GoC Programs
Results reveal that Canadians have a moderately high level of familiarity with programs offered by the federal government intended to help companies do business abroad. Just over half of respondents (54 per cent) say they are aware of these programs, and four in ten (40 per cent) say they are not. Tracking reveals that self-rated familiarity with these programs has declined seven points since 2020.
Men are much more likely than women to say they are aware of these programs (64 per cent, compared to 45 per cent of women).
Self-rated awareness of these programs rises progressively with age (from 41 per cent among those under 35 to 67 per cent among those ages 65 and over).
Awareness also tends to increase with educational attainment (from 44 per cent among high school educated to 60 per cent among university graduates).
When asked to elaborate on their response, the majority of respondents who say they are familiar with these programs (64 per cent) were unable to name a specific program. Among those able to provide a response, Export Development Canada (11 per cent) and the Business Development Bank of Canada (seven per cent) were mentioned most often.
Chart 48: Awareness of GoC programs
Chart 48: Awareness of GoC programs - Text Version
This chart shows two horizontal stacked bars with results for February 2021 and February 2020, based the scale DK/NR, no, and yes.
Respondents were asked: "Are you aware that the Government of Canada has programs available to help companies do business abroad?"
Respondents selected:
February 2021: DK/NR (6 per cent); no (40 per cent); and yes (54 per cent);
Base: Canadians; February 8-28, 2021, n=2,043, MOE +/- 2.2%, 19 times out of 20
February 2020: DK/NR (6 per cent); no (33 per cent); and yes (61 per cent);
Base: Canadians; February 6-19, 2020, n=2,089, MOE +/- 2.1%, 19 times out of 20
Chart 49: Specific programs recalled
Chart 49: Specific programs recalled - Text Version
This chart shows six single bars.
Respondents were asked: "[If yes] If yes, which programs are you aware of?"
Respondents selected:
Export development Canada (11 per cent);
Business Development Bank of Canada (7 per cent);
Canadian International Development Agency (2 per cent);
Financing/Funding/Grants (general mention) (2 per cent);
Other (4 per cent);
Don't know/No response (64 per cent).
Note: Only those responses selected by at least 2% displayed above
Base: Familiar with GoC programs; February 8-28, 2021, n=1,143, MOE +/- 2.9%, 19 times out of 20
8. Direct Impact on Canadians
8.1 Impacts of International Trade
Consistent with 2020 results, Canadians express generally positive impressions of the impacts of international trade. Notably, seven in ten (71 per cent) believe Canada's international trade has had a positive impact on the development of Canadian technology and innovation. Roughly six in ten say it has had a positive impact on the number of jobs in Canada (58 per cent) and that their quality of life has improved as a result of international trade (57 per cent). About half (47 per cent) feel the same about environmental standards in Canada and abroad. Four in ten (37 per cent) believe Canada's international trade has had a positive impact on improving working conditions abroad. No more than one in five respondents say international trade has had a negative impact in any of these areas.
Tracking reveals impressions about the impacts of international trade have remained largely stable over the past year.
Men are more likely to say their quality of life has improved as a result of international trade (62 per cent, compared to 52 per cent of women).
University graduates are more apt to say international trade has led to more jobs (62 per cent, compared to 54 per cent of college graduates and 50 per cent of high school educated) and better quality of life (62 per cent versus 50 per cent and 51 per cent).
Residents of Quebec are more likely to say international trade has helped spur innovation (81 per cent, compared to 71 per cent nationally) and create jobs (66 per cent, compared to 58 per cent nationally).
Chart 50: Impacts of international trade
Chart 50: Impacts of international trade - Text Version
This chart shows five horizontal stacked bars based on a seven-point scale where 1-3 means negative, 4 means neither, and 5-7 means positive, with an additional point for DK/NR.
Respondents were asked: "What impact do you think Canada's international trade has had on each of the following?"
Respondents selected:
Development of Canadian technology and innovation: DK/NR (6 per cent); negative (10 per cent); neither (14 per cent); and positive (71 per cent);
The number of jobs in Canada: DK/NR (6 per cent); negative (20 per cent); neither (16 per cent); and positive (58 per cent);
Your quality of life: DK/NR (5 per cent); negative (9 per cent); neither (29 per cent); and positive (57 per cent);
Environmental standards in Canada and abroad: DK/NR (7 per cent); negative (17 per cent); neither (29 per cent); and positive (47 per cent);
Improving working conditions abroad: DK/NR (8 per cent); negative (21 per cent); neither (34 per cent); and positive (37 per cent);
Base: Canadians; February 8-28, 2021, n=2,043, MOE +/- 2.2%, 19 times out of 20
Chart 51: Impacts of international trade: Dev. of Canadian technology & innovation
Chart 51: Impacts of international trade: Dev. of Canadian technology & innovation - Text Version
This chart shows a line graph for results for the period between 2000 and 2021 (blue line: negative (1-3), grey line: neither (4), and: green line: positive (5-7)), and a horizontal stacked bar based on the same scale: negative, neither, and positive.
Respondents were asked: "What impact do you think Canada's international trade has had on each of the following? Development of Canadian technology and innovation"
Respondents selected:
Negative: 2000 (10 per cent); 2001 (7 per cent); 2020 (7 per cent); and 2021 (10 per cent);
Neither: 2000 (17 per cent); 2001 (17 per cent); 2020 (13 per cent); and 2021 (14 per cent);
Positive: 2000 (70 per cent); 2001 (72 per cent); 2020 (75 per cent); and 2021 (71 per cent).
Stacked bar: DK/NR (6 per cent); negative (10 per cent); neither (14 per cent); and positive (71 per cent).
Base: Canadians; February 8-28, 2021, n=2,043, MOE +/- 2.2%, 19 times out of 20
Chart 52: Impacts of international trade: The number of jobs in Canada
Chart 52: Impacts of international trade: The number of jobs in Canada - Text Version
This chart shows a line graph for results for the period between 2000 and 2021 (blue line: negative (1-3), grey line: neither (4), and: green line: positive (5-7)), and a horizontal stacked bar based on the same scale: negative, neither, and positive.
Respondents were asked: "What impact do you think Canada's international trade has had on each of the following? The number of jobs in Canada"
Respondents selected:
Negative: 2000 (25 per cent); 2001 (20 per cent); 2020 (17 per cent); and 2021 (20 per cent);
Neither: 2000 (23 per cent); 2001 (21 per cent); 2020 (17 per cent); and 2021 (16 per cent);
Positive: 2000 (48 per cent); 2001 (57 per cent); 2020 (60 per cent); and 2021 (58 per cent).
Stacked bar: DK/NR (6 per cent); negative (20 per cent); neither (16 per cent); and positive (58 per cent).
Base: Canadians; February 8-28, 2021, n=2,043, MOE +/- 2.2%, 19 times out of 20
Chart 53: Impacts of international trade: Personal quality of life
Chart 53: Impacts of international trade: Personal quality of life - Text Version
This chart shows a line graph for results for February 2000 and 2021 (blue line: negative (1-3), grey line: neither (4), and: green line: positive (5-7)), and a horizontal stacked bar based on the same scale: negative, neither, and positive.
Respondents were asked: "What impact do you think Canada's international trade has had on each of the following? Your quality of life"
Respondents selected:
Negative: February 2000 (11 per cent) and February 2021 (9 per cent);
Neither: February 2000 (30 per cent) and February 2021 (29 per cent);
Positive: February 2000 (54 per cent) and February 2021 (57 per cent).
Stacked bar: DK/NR (5 per cent); negative (9 per cent); neither (29 per cent); and positive (57 per cent).
Base: Canadians; February 8-28, 2021, n=2,043, MOE +/- 2.2%, 19 times out of 20
Chart 54: Impacts of international trade: Environmental standards
Chart 54: Impacts of international trade: Environmental standards - Text Version
This chart shows a line graph for results for February 2000 and 2021 (blue line: negative (1-3), grey line: neither (4), and: green line: positive (5-7)), and a horizontal stacked bar based on the same scale: negative, neither, and positive.
Respondents were asked: "What impact do you think Canada's international trade has had on each of the following? Environmental standards in Canada and abroad"
Respondents selected:
Negative: February 2000 (18 per cent) and February 2021 (17 per cent);
Neither: February 2000 (30 per cent) and February 2021 (29 per cent);
Positive: February 2000 (46 per cent) and February 2021 (47 per cent).
Stacked bar: DK/NR (7 per cent); negative (17 per cent); neither (29 per cent); and positive (47 per cent).
Base: Canadians; February 8-28, 2021, n=2,043, MOE +/- 2.2%, 19 times out of 20
Chart 55: Impacts of international trade: Working conditions
Chart 55: Impacts of international trade: Working conditions - Text Version
This chart shows a line graph for results for February 2000 and 2021 (blue line: negative (1-3), grey line: neither (4), and: green line: positive (5-7)), and a horizontal stacked bar based on the same scale: negative, neither, and positive.
Respondents were asked: "What impact do you think Canada's international trade has had on each of the following? Improving working conditions abroad"
Respondents selected:
Negative: February 2000 (19 per cent) and February 2021 (21 per cent);
Neither: February 2000 (33 per cent) and February 2021 (34 per cent);
Positive: February 2000 (40 per cent) and February 2021 (37 per cent).
Stacked bar: DK/NR (8 per cent); negative (21 per cent); neither (34 per cent); and positive (37 per cent).
Base: Canadians; February 8-28, 2021, n=2,043, MOE +/- 2.2%, 19 times out of 20
8.2 Personal Benefits of International Trade
Results also reveal Canadians believe that international trade personally benefits them. When asked whether they feel they currently benefit from trade, about two-thirds of respondents (65 per cent) say yes, while only one-quarter (23 per cent) say no. These results are largely unchanged from 2020.
University graduates and those under 35 are more likely to say they have benefitted from trade (72 per cent and 73 per cent, respectively, compared to 65 per cent on average).
Among those who feel they are benefitting from trade, about eight in ten (83 per cent) say they enjoy a broader selection of goods and services, and more than half cite job creation (57 per cent), economic benefits (54 per cent), and lower prices (53 per cent) as personal benefits from international trade. One in six (17 per cent) say their job depends on international trade, while one in ten (10 per cent) believe the quality of imported products is generally superior to those produced domestically. These findings are similar to those from 2020.
Compared to women, men are nearly twice as likely to say their job depends on international trade (22 per cent, compared to 12 per cent of women).
Propensity to cite job creation rises progressively with age (from 47 per cent among those under 35 to 74 per cent among those 65 and over), as does likelihood of mentioning economic benefits (from 49 per cent to 69 per cent). Those under 35 are more likely to select the lower prices of imported products (61 per cent, compared to 47 per cent of those 65 and over).
Among those who do not feel they have benefited from international trade, just under half (46 per cent) cite the inferior quality of foreign-made products, while slightly fewer (41 per cent) attribute their disapproval to fears of job losses in Canada. One-third expressed concerns over impacts on the Canadian economy (35 per cent), impacts on the environment (35 per cent), and comparatively higher prices for imported products (33 per cent). Tracking reveals a seven-point increase in the proportion of respondents who say international trade is bad for the economy in general.
Chart 56: Personal benefits of international trade
Chart 56: Personal benefits of international trade - Text Version
This chart shows two horizontal stacked bars with results for February 2021 and February 2020, based on the scale DK/NR, no, and yes.
Respondents were asked: "Do you feel that you are currently benefitting from international trade?"
Respondents selected:
February 2021: DK/NR (12 per cent); no (23 per cent); and yes (66 per cent);
Base: Canadians; February 8-28, 2021, n=2,043, MOE +/- 2.2%, 19 times out of 20
February 2021: DK/NR (11 per cent); no (26 per cent); and yes (63 per cent);
Base: Canadians; February 6-19, 2020, n=2,089, MOE +/- 2.1%, 19 times out of 20
Chart 57: Reasons for seeing benefits to trade
Chart 57: Reasons for seeing benefits to trade - Text Version
This chart shows seven single bars with a column on the side for the 2020 results.
Respondents were asked: "[If yes] Why do you think you are benefitting from international trade? [Multiple responses accepted]"
Respondents selected:
There is a wider choice for consumers (83 per cent); 2020 (81 per cent);
Trade with countries outside Canada can create jobs (57 per cent); 2020 (58 per cent);
It is good for the Canadian economy (54 per cent); 2020 (56 per cent);
Imported products are cheaper (53 per cent); 2020 (51 per cent);
Your job depends on international trade (17 per cent); 2020 (14 per cent);
Imported products are better quality (10 per cent); 2020 (10 per cent);
Don't know/No response (1 per cent); 2020 (6 per cent).
Note: Only those responses selected by at least 5% displayed above
Base: Sees benefits to trade; February 8-28, 2021, n=1,309, MOE +/- 2.2%, 19 times out of 20
Chart 58: Reasons for not seeing benefits to trade
Chart 58: Reasons for not seeing benefits to trade - Text Version
This chart shows seven single bars with a column on the side for the 2020 results.
Respondents were asked: "[If very/somewhat familiar] Why do you think you are not benefitting from international trade? [Multiple responses accepted]?"
Respondents selected:
The quality of imported products is poor (46 per cent); 2020 (41 per cent);
As a result of increased international trade unemployment is higher (41 per cent); 2020 (36 per cent);
It is bad for the Canadian economy (35 per cent); 2020 (28 per cent);
It harms the environment (35 per cent); 2020 (37 per cent);
Prices for certain imported goods are higher (33 per cent); 2020 (39 per cent);
Loss of sovereignty (5 per cent); 2020 (2 per cent);
Don't know/No response (6 per cent); 2020 (8 per cent).
Note: Only those responses selected by at least 5% displayed above
9. Conclusions and Implications
The COVID-19 pandemic appears to have done little to dampen Canadians' enthusiasm for international trade. Consistent with results from 2020, respondents see trade as beneficial to Canada on most of the indicators tested, particularly when it comes to fostering innovation and stimulating job growth. Furthermore, the vast majority of Canadians believe that trade has become more important in recent years, and are open to further expanding trade. Most Canadians feel they personally benefit from trade, with the perceived benefits centred on improved choice, lower prices, and better job opportunities.
One potential problem area, however, is the continuing perception that the benefits of international trade are enjoyed to a much greater degree by large corporations. Respondents express serious doubts as to whether Canada's more marginalized communities – particularly racialized, Indigenous, and LGBTQ2 Canadians – are benefitting from trade. Nevertheless, most Canadians see trade as an avenue to promote trade opportunities for these groups, as well as other social goals.
When it comes to considering Canada's approach to trade, respondents put forward a number of important considerations, particularly economic issues such job creation, support for Canadian businesses, and innovation. However, improving standards of living, protections for health and environmental standards, protecting intellectual property, diversifying Canada's markets, and ensuring a more equitable division of the benefits of trade are also top-tier priorities. The vast majority of Canadians also say pandemic preparedness should be a key consideration in future trade policies.
Self-rated familiarity with CUSMA is moderately high and Canadians are generally enthusiastic regarding its benefits. Familiarity with Canada's other recently signed trade agreements – CETA, and CPTPP – is relatively low; however, among those who are familiar with the agreements, clear majorities are optimistic about their impacts.
Key regional and demographic differences
Across the country, Canadians hold broadly positive impressions of international trade and there is no region where trade is viewed in a negative light. The relatively few significant regional differences suggest Quebec residents are more optimistic regarding the economic benefits of international trade, but they are also more skeptical that these benefits extend beyond large businesses. Quebec residents are also consistently less likely to say they are familiar with current trade issues.
Throughout the survey, men consistently score higher than women on self-rated knowledge of issues related to international trade. For instance, 62 per cent say they are familiar with CUSMA, compared to just 42 per cent women. Nevertheless, men and women express generally comparable attitudes on trade. Where there are differences, it is consistently men who convey a moderately more positive view of the benefits of trade. For instance, 62 per cent per cent say their quality of life has improved as a result of international trade, compared to 52 per cent of women. Women are more likely to perceive trade as a means of advancing human rights and are more apt to rank support for farmers, environmental standards, and gender equality as important goals for future trade negotiations.
In general, older Canadians – particularly those ages 65 and over – hold somewhat more positive views of international trade, most notably when it comes to its impacts on jobs and the economy. Older Canadians are also more likely to see trade as an avenue for promoting an array of social and economic goals and they are more likely to view the rise of protectionism as a bad thing. Self-rated familiarity with trade issues consistently rises with age.
Self-rated familiarity with trade issues also rises with educational attainment, with university graduates consistently saying they are more familiar with Canada's various trade agreements. Canadians of all academic standings hold similar views on trade, though university educated are more likely to say they personally benefit from trade, and are more apt to say protectionism is a bad thing. High school graduates are significantly more likely to see lowering prices and broadening consumer choice as a key priority.
Implications
Canadians remain optimistic about international trade, and the COVID-19 pandemic has done little to lessen their enthusiasm. There is remarkable stability in positive attitudes to trade and globalization.
Canadians like international trade mainly because of the economic benefits it brings. They also recognize other benefits, and there are a number of goals that they would like to see linked to trade, such as the environment, labour, and women's issues. However, these objectives are ultimately subordinate to economic issues.
As was found last year, fluency on international trade is mixed. Canadians recognize the role of the United States, but seem to overestimate the demand for Canadian exports in China relative to markets such as Europe and the United Kingdom.
Consistent with 2020 results, Canadians see trade as primarily benefitting big business (indeed, when respondents were asked about the benefits of trade, there was a huge drop-off when the scope of the question shifted to small businesses). However, Canadians do not appear too bothered by this apparent lack of equity; they seem to acknowledge that economic growth in this country is inextricably linked to the performance of our larger companies, although they do express some concerns that the benefits of international trade are not being shared by all Canadians.
Appendix A: Questionnaire
Web Intro
We are conducting a study on behalf of the Government of Canada to obtain the views of Canadians on a range of important issues. Please be assured that we are not selling or soliciting anything. The survey is voluntary and your responses will be kept entirely confidential and anonymous. The survey should take about 15 minutes to complete.
A few reminders before beginning:
On each screen, after selecting your answer, click on the "Continue" button at the bottom of the screen to move forward in the questionnaire.
If you leave the survey before completing it, you can return to the survey URL later, and you will be returned to the page where you left off. Your answers up to that point in the survey will be saved.
If you have any questions about how to complete the survey, please call Probit at 866.211.8881 or send an email to online@ekos.com.
Thank you in advance for your participation.
Phone Intro
Good afternoon/evening. My name is [name of interviewer] and I am calling from Ekos, a public opinion research company. [Panel]May I speak with [name of respondent]?
Confirm whether respondent prefers English or French
We are conducting a study on behalf of the Government of Canada to obtain the views of Canadians on a range of important issues. Please be assured that we are not selling or soliciting anything. The survey is voluntary and your responses will be kept entirely confidential and anonymous. The survey should take about 15 minutes to complete.
May we begin with the survey?
Privacy
If... Phone
This call may be recorded for quality control or training purposes.
Q1A
Do you recall any news in recent months on issues related to international trade?
Yes: 1
No: 2
Don't know/No response: 99
Q1B [1,3]
If... Q1A = 1
If yes, what was the topic of the report?
Please specify: 77
Don't know/No response: 99 X
PQ2
In your opinion, how important are the following goals when considering Canada's approach to international trade? Please use a 7-point scale where 1 is not at all important, 7 is very important and the mid-point 4 is somewhat important.
Q2A
Creating jobs in Canada
Not at all important: 1
2
3
Somewhat important: 4
5
6
Very important: 7
Don't know/ No response: 99 S
Q2B
Promoting gender equality
Not at all important: 1
2
3
Somewhat important: 4
5
6
Very important: 7
Don't know/ No response: 99 S
Q2C
Ensuring Canadian environmental and health standards are respected
Not at all important: 1
2
3
Somewhat important: 4
5
6
Very important: 7
Don't know/ No response: 99 S
Q2D
Ensuring that trade benefits everyone
Not at all important: 1
2
3
Somewhat important: 4
5
6
Very important: 7
Don't know/ No response: 99 S
Q2E
Offering consumers the widest choice of products and services at the lowest prices
Not at all important: 1
2
3
Somewhat important: 4
5
6
Very important: 7
Don't know/ No response: 99 S
Q2F
Supporting Canadian businesses
Not at all important: 1
2
3
Somewhat important: 4
5
6
Very important: 7
Don't know/ No response: 99 S
Q2G
Encouraging innovation in Canada
Not at all important: 1
2
3
Somewhat important: 4
5
6
Very important: 7
Don't know/ No response: 99 S
Q2H
Protecting Canadian Intellectual property
Not at all important: 1
2
3
Somewhat important: 4
5
6
Very important: 7
Don't know/ No response: 99 S
Q2I
Diversifying Canada's export markets
Not at all important: 1
2
3
Somewhat important: 4
5
6
Very important: 7
Don't know/ No response: 99 S
Q2J
Supporting farmers/agricultural sector
Not at all important: 1
2
3
Somewhat important: 4
5
6
Very important: 7
Don't know/ No response: 99 S
Q2K
Increasing foreign direct investment in Canada
Not at all important: 1
2
3
Somewhat important: 4
5
6
Very important: 7
Don't know/ No response: 99 S
Q2L
Improving Canadians' standard of living
Not at all important: 1
2
3
Somewhat important: 4
5
6
Very important: 7
Don't know/ No response: 99 S
Q2M
Lowering costs of domestic production
Not at all important: 1
2
3
Somewhat important: 4
5
6
Very important: 7
Don't know/ No response: 99 S
PQ3
Please tell me the top five most important markets/countries for Canadian exports over the last few years?
Q3
First
United States: 1 I
United Kingdom: 2 I
China: 3 I
Japan: 4 I
Mexico: 5 I
India: 6 I
Germany: 7 I
France: 8 I
Specify: 77
Don't know/ No response: 99 X
Q3A [0,1]
Second
United States: 1 I
United Kingdom: 2 I
China: 3 I
Japan: 4 I
Mexico: 5 I
India: 6 I
Germany: 7 I
France: 8 I
Specify: 77
Don't know/ No response: 99 X
Q3B [0,1]
Third
United States: 1 I
United Kingdom: 2 I
China: 3 I
Japan: 4 I
Mexico: 5 I
India: 6 I
Germany: 7 I
France: 8 I
Specify: 77
Don't know/ No response: 99 X
Q3C [0,1]
Fourth
United States: 1 I
United Kingdom: 2 I
China: 3 I
Japan: 4 I
Mexico: 5 I
India: 6 I
Germany: 7 I
France: 8 I
Specify: 77
Don't know/ No response: 99 X
Q3D [0,1]
Fifth
United States: 1 I
United Kingdom: 2 I
China: 3 I
Japan: 4 I
Mexico: 5 I
India: 6 I
Germany: 7 I
France: 8 I
Specify: 77
Don't know/ No response: 99 X
PQ4
Which sectors do you think make up the largest part of Canada's exports?
Q4
Largest
Natural Resources/Energy: 1 I
Manufacturing: 2 I
Agricultural Products: 3 I
Automobiles and car parts: 4 I
Hi-tech: 5 I
Education: 6 I
Clean/environmental technology: 7 I
Specify: 77
Don't know/ No response: 99 X
Q4A [0,1]
Second largest
Natural Resources/Energy: 1 I
Manufacturing: 2 I
Agricultural Products: 3 I
Automobiles and car parts: 4 I
Hi-tech: 5 I
Education: 6 I
Clean/environmental technology: 7 I
Specify: 77
Don't know/ No response: 99 X
Q5
Compared to our export of products (such natural resources and manufactured goods) how much do you think services (such as financial services) contribute to Canada's overall exports? Please use a 7-point scale where 1 is services much less than products, 7 is services much more than products and the mid-point 4 is about the same.
Services much less than products: 1
2
3
About the same 4 4
5
6
Services much more than products: 7
Don't know/ No response: 99
PREQ6
To what extent do you think our international trade and investment policies should ensure Canada is globally competitive in each of the following areas? Please use a 7-point scale where 1 is to no extent whatsoever, 7 is to a great extent and the mid-point 4 is to a moderate extent.
Q6A
Clean/green technologies
No extent whatsoever: 1
2
3
Moderate extent: 4
5
6
To a great extent: 7
Don't know/ No response: 99 S
Q6B
Health technologies
No extent whatsoever: 1
2
3
Moderate extent: 4
5
6
To a great extent: 7
Don't know/ No response: 99 S
Q6C
Artificial Intelligence
No extent whatsoever: 1
2
3
Moderate extent: 4
5
6
To a great extent: 7
Don't know/ No response: 99 S
Q7
To what extent do you think our international trade and investment policies should ensure Canada is prepared for future pandemics and other global challenges? Please use a 7-point scale where 1 is to no extent whatsoever, 7 is to a great extent and the mid-point 4 is to a moderate extent.
No extent whatsoever: 1
2
3
Moderate extent: 4
5
6
To a great extent: 7
Don't know/ No response: 99
Q8
Over the past 10 years, do you think international trade has become less important or more important in terms of its contribution to the Canadian economy? Please use a 7-point scale where 1 is much less important, 7 is much more important and the mid-point 4 is neither.
Much less important: 1
2
3
Neither: 4
5
6
Much more important: 7
Don't know/ No response: 99
Q9 [1,3]
Why do you feel this way?
Please specify: 77
Don't know/No response: 99 X
PQ10
To what extent would you say that international trade benefits each of the following within Canada? Please use a 7-point scale where 1 is to no extent whatsoever, 7 is to a great extent and the mid-point 4 is to a moderate extent.
Q10A
Large businesses
No extent whatsoever: 1
2
3
Moderate extent: 4
5
6
Great extent: 7
Don't know/ No response: 99 S
Q10B
Businesses in your community
No extent whatsoever: 1
2
3
Moderate extent: 4
5
6
Great extent: 7
Don't know/ No response: 99 S
Q10C
Small and medium-sized enterprises (SMEs)
No extent whatsoever: 1
2
3
Moderate extent: 4
5
6
Great extent: 7
Don't know/ No response: 99 S
Q10D
You and your family
No extent whatsoever: 1
2
3
Moderate extent: 4
5
6
Great extent: 7
Don't know/ No response: 99 S
Q10E
Women
No extent whatsoever: 1
2
3
Moderate extent: 4
5
6
Great extent: 7
Don't know/ No response: 99 S
Q10F
Indigenous people
No extent whatsoever: 1
2
3
Moderate extent: 4
5
6
Great extent: 7
Don't know/ No response: 99 S
Q10G
LGBTQ2 communities
No extent whatsoever: 1
2
3
Moderate extent: 4
5
6
Great extent: 7
Don't know/ No response: 99 S
Q10H
Youth
No extent whatsoever: 1
2
3
Moderate extent: 4
5
6
Great extent: 7
Don't know/ No response: 99 S
Q10I
Immigrants
No extent whatsoever: 1
2
3
Moderate extent: 4
5
6
Great extent: 7
Don't know/ No response: 99 S
Q10J
Racialized groups
No extent whatsoever: 1
2
3
Moderate extent: 4
5
6
Great extent: 7
Don't know/ No response: 99 S
Q11
To what extent do you think Canadian businesses investing in other countries benefits Canada? Please use a 7-point scale where 1 is to no extent whatsoever, 7 is to a great extent and the mid-point 4 is to a moderate extent.
No extent whatsoever: 1
2
3
Moderate extent: 4
5
6
Great extent: 7
Don't know/ No response: 99
Q12
Using the same scale to what extent do you think international businesses investing in Canada benefits the Canadian economy?
No extent whatsoever: 1
2
3
Moderate extent: 4
5
6
Great extent: 7
Don't know/ No response: 99
Q13 [1,5]
In your opinion, what are Canadian products best known for internationally?
Select all that apply
High quality: 1
Adhering to environmental standards: 2
Treating workers fairly during production: 3
Low price: 4
Other (Please specify): 77
Don't know/No response: 99 X
Q14
Many people talk about the rise of protectionism in the United States and Europe which, among other things, includes growing opposition to trade and globalization. Overall, do you think this rise of protectionism is a good thing or a bad thing for Canada?
Bad thing: 1
Neither good nor bad: 2
Good thing: 3
Don't know/No response: 99
PQ15
Please tell me the extent to which you agree or disagree with each of the following statements using a 7-point scale where 7 means strongly agree, 1 means strongly disagree and the mid-point 4 means neither.
Q15A
I worry increased international trade is likely to result in countries lowering their environmental standards to be more competitive
Strongly disagree: 1
2
3
Neither: 4
5
6
Strongly agree: 7
Don't know/ No response: 99 S
Q15B
International trade is a good way for Canada to promote trade opportunities for all (notably women, indigenous, Small and medium-sized enterprises (SMEs))
Strongly disagree: 1
2
3
Neither: 4
5
6
Strongly agree: 7
Don't know/ No response: 99 S
Q15C
International trade is a good way for Canada to promote environmental responsibility
Strongly disagree: 1
2
3
Neither: 4
5
6
Strongly agree: 7
Don't know/ No response: 99 S
Q15D
International trade is a good way for Canada to promote respect for labour rights
Strongly disagree: 1
2
3
Neither: 4
5
6
Strongly agree: 7
Don't know/ No response: 99 S
Q15E
International trade is a good way for Canada to promote respect for human rights
Strongly disagree: 1
2
3
Neither: 4
5
6
Strongly agree: 7
Don't know/ No response: 99 S
Q16
Is more international trade a good thing or a bad thing for Canada?
Bad thing: 1
Neither good nor bad: 2
Good thing: 3
Don't know/No response: 99
PQ17
Over the last few decades, Canada has been opening up trade with many countries. Which countries do you believe Canada should be trying to tie itself to more?
Q17
First selection:
United States: 1 I
United Kingdom: 2 I
China: 3 I
Japan: 4 I
Mexico: 5 I
India: 6 I
Germany: 7 I
Specify: 77
Don't know/ No response: 99 X
Q17A [0,1]
Second selection:
United States: 1 I
United Kingdom: 2 I
China: 3 I
Japan: 4 I
Mexico: 5 I
India: 6 I
Germany: 7 I
Specify: 77
Don't know/ No response: 99 X
Q18
As you may know, Canada, the United States, and Mexico recently signed the Canada-US-Mexico agreement on free trade, (also known as CUSMA), which is intended to replace NAFTA. How familiar are you with this agreement?
Very familiar: 1
Somewhat familiar: 2
Not very familiar: 3
Not at all familiar: 4
Don't know / No response: 99
Q19
If... Q18 = 1,2
Based on what you know, would you say CUSMA's impact on Canada is positive or negative? Is that very or somewhat?
Very positive: 1
Somewhat positive: 2
Somewhat negative: 3
Very negative 4
Don't know / No response: 99
Q20
As you may know, Canada recently signed the Comprehensive and Progressive Agreement for Trans-Pacific Partnership (CPTPP), a free trade agreement between Canada and 10 other countries in the Asia-Pacific region. How familiar are you with this agreement?
Very familiar: 1
Somewhat familiar: 2
Not very familiar: 3
Not at all familiar: 4
Don't know/No response: 99
Q21
If... Q20 = 1,2
Based on what you know, would you say the CPTPP's impact on Canada is positive or negative? Is that very or somewhat?
Very positive: 1
Somewhat positive: 2
Somewhat negative: 3
Very negative 4
Don't know/No response: 99
Q22
As you may know, Canada recently signed the Comprehensive Economic and Trade Agreement (CETA), a free trade agreement between Canada, the European Union and its members states. How familiar are you with this agreement?
Very familiar: 1
Somewhat familiar: 2
Not very familiar: 3
Not at all familiar: 4
Don't know/No response: 99
Q23
If... Q22 = 1,2
Based on what you know, would you say CETA's impact on Canada is positive or negative? Is that very or somewhat?
Very positive: 1
Somewhat positive: 2
Somewhat negative: 3
Very negative 4
Don't know/No response: 99
Q24A
Are you aware that the Government of Canada has programs available to help companies do business abroad?
Yes: 1
No: 2
Don't know/No response: 99
Q24B [1,3]
If... Q24A = 1
If yes, which programs are you aware of?
Please specify: 77
Don't know/No response: 99 X
PQ25
What impact do you think Canada's international trade has had on each of the following? Please use a 7-point scale where 1 is an extremely negative impact, 7 is an extremely positive impact and the mid-point 4 means neither.
Q25A
Development of Canadian technology and innovation
Extremely negative impact: 1
2
3
Neither: 4
5
6
Extremely positive impact: 7
Don't know/ No response: 99 S
Q25B
The number of jobs in Canada
Extremely negative impact: 1
2
3
Neither: 4
5
6
Extremely positive impact: 7
Don't know/ No response: 99 S
Q25C
Environmental standards in Canada and abroad
Extremely negative impact: 1
2
3
Neither: 4
5
6
Extremely positive impact: 7
Don't know/ No response: 99 S
Q25D
Improving working conditions abroad
Extremely negative impact: 1
2
3
Neither: 4
5
6
Extremely positive impact: 7
Don't know/ No response: 99 S
Q25E
Your quality of life
Extremely negative impact: 1
2
3
Neither: 4
5
6
Extremely positive impact: 7
Don't know/ No response: 99 S
Q26A
Do you feel that you are currently benefitting from international trade?
Yes: 1
No: 2
Don't know/No response: 99
Q26B [1,7]
If... Q26A = 1
If yes, why do you think you are benefitting from international trade?
Select all that apply
There is a wider choice for consumers 1
Imported products are cheaper 2
It is good for the Canadian economy 3
Trade with countries outside Canada can create jobs 4
Imported products are better quality 5
Your job depends on international trade 6
Other (Please specify): 77
Don't know/No response: 99 X
Q26C [1,6]
If... Q26A = 2
If no, why do you think you are not benefitting from international trade?
Select all that apply
The quality of imported products is poor: 1
Prices for certain imported goods are higher: 2
As a result of increased international trade unemployment is higher: 3
It harms the environment: 4
It is bad for the Canadian economy: 5
Other (Please specify): 77
Don't know/No response: 99 X
DEMIN
These last few questions will be used for statistical purposes only.
QPROV
What province or territory do you live in?
British Columbia: 1
Alberta: 2
Saskatchewan: 3
Manitoba: 4
Ontario: 5
Quebec: 6
New Brunswick: 7
Nova Scotia: 8
Prince Edward Island: 9
Newfoundland: 10
Yukon: 11
Northwest Territories: 12
Nunavut: 13
Prefer not to say: 99
QGENDR
Are you...?
Male: 1
Female: 2
Gender Diverse: 3
Prefer not to say: 99
QEDUC
What is the highest level of schooling that you have completed?
Less than High School diploma or equivalent: 1
High School diploma or equivalent: 2
Registered Apprenticeship or other trades certificate or diploma: 3
College, CEGEP or other non-university certificate or diploma: 4
University certificate or diploma below bachelor's level: 5
Bachelor's degree: 6
Post graduate degree above bachelor's level: 7
Prefer not to answer: 99
Q26
To the best of your knowledge, does anyone in your household work for a company that is involved in international trade?
Yes: 1
No: 2
Don't know/No response: 99
QAGE
In which of the following age categories do you belong?
18-34 years: 1
35-49 years: 2
50-64 years: 3
65 years or older: 4
Prefer not to answer: 99
QINC
What is your annual household income from all sources before taxes?
Under $20,000: 1
Between $20,000 and $39,999: 2
Between $40,000 and $59,999: 3
Between $60,000 and $79,999: 4
Between $80,000 and $99,999: 5
Between $100,000 and $149,999: 6
$150,000 or above: 7
Prefer not to answer: 99
Q27 [1,4]
Do you consider yourself to be any of the following?
Select all that apply
A person with a disability: 1
A member of a visible minority group: 2
An Indigenous person: 3
A member of the LGBTQ2 community: 4
None of the above: 5 X
Don't know / Prefer not to answer: 99 X
QBORN
In what country were you born?
Canada: 1
Outside Canada, please specify : 77
Refused: 98
Don't know: 99
Thank You
Those are all the questions we have for you. Thank you very much for taking the time to complete this survey, it is greatly appreciated. Your answers have been saved and you may now close your browser window.