
Understanding Americans’ views on key issues of interest to Canadians
Report
Prepared for Global Affairs Canada
Supplier: Leger Marketing Inc.
Contract Number: CW2248833
Contract Value: $144,065.96 (including HST)
Award Date: 2022-11-25
Delivery Date: 2023-05-09
Registration Number: POR 083-22
For more information on this report, please contact Global Affairs Canada at POR-ROP@international.gc.ca
Ce rapport est aussi disponible en français

Understanding Americans’ views on key issues of interest to Canadians
Final Report
Prepared for Global Affairs Canada
Supplier: Leger Marketing Inc.
Registration Number: POR 083-22
This public opinion research report presents the results of an online survey conducted by Léger Marketing Inc. on behalf of Global Affairs Canada. The quantitative research study was conducted with 3,183 Americans who can speak English or Spanish residing in different regions of the United States between March 2 to March 27, 2023.
Cette publication est aussi disponible en français sous le titre : La compréhension de points de vue des Américains sur des questions présentant un intérêt majeur pour les Canadiens
This publication may be reproduced for non-commercial purposes only. Prior written permission must be obtained from Global Affairs Canada. For more information on this report, please contact Global Affairs Canada at: POR-ROP@international.gc.ca
Catalogue Number: FR5-218/2023E-PDF
International Standard Book Number (ISBN): 978-0-660-48737-3
© His Majesty the King in Right of
Canada, as represented by the Ministers of Global Affairs Canada, 2023
Table of contents
Understanding Americans’ views on key issues of interest to Canadians.
Understanding Americans’ views on key issues of interest to Canadians.
Notes on Interpretation of the Research Findings
Political Neutrality Statement and Contact Information
Understanding the U.S.’ relationship with other countries
Understanding the U.S.’ position in North America
Understanding Americans’ attitudes towards Buy America
Understanding Americans’ attitudes towards Canada
Understanding Americans’ attitudes towards Canada-U.S. collaboration
MaxDiff analysis – Argument evaluation
MaxDiff analysis – Message evaluation
Executive Summary
Leger is pleased to present Global Affairs Canada with this report on findings from the quantitative survey designed to learn about Americans’ views on key issues of interest to Canadians. This report was prepared by Léger Marketing Inc. who was contracted by Global Affairs Canada (contract number CW2248833 awarded November 25, 2022).
Background and Objectives
A literature review of Public Opinion Research (POR) on Canada-U.S. relations reveals a substantial number of studies that focus on comparing Canadians’ and Americans’ views on specific policies/events/issues and broad values. While some studies have regional and demographic disaggregates available, others do not. Conversely, there is limited research of Americans’ attitudes towards Canada or Canadian policies/events/issues beyond broad trends (i.e., overall favourable/unfavourable impression) or very high-profile issues (e.g., trucker convoy, NAFTA/CUSMA). What’s more, much of this POR is freely available via public sources. However, POR on communications, advocacy language and techniques (such as resonance of certain terminology and the effectiveness of advocacy campaigns) is lacking. Hence, POR on these gaps will be most useful in helping Canada achieve its proactive and reactive advocacy objectives in its relationship with the United States.
The purpose of this research is to provide evidence-based data and key insights to guide the ongoing development and deployment of advocacy messaging and other advocacy tools for use by Canada’s diplomatic network in the United States.
While this is the main purpose, the study is also aimed at generating ideas to support Canadian advocacy objectives in the U.S and possible initiatives leading to a better understanding of Americans’ views on priority Canadian policy positions such as trade, security, energy and the environment. Key objectives include:
· Measuring the effectiveness of Canada’s U.S.-facing advocacy messaging on priority themes in different wording/terminology formulations. This would involve testing existing messaging on issues related to themes like energy, trade, security, the environment, and diversity and inclusion to discover what resonates with the target audience, including whether messages are:
o clear, credible and relevant to the target audiences;
o appealing to, and appropriate for, the cultural and emotional sensitivities of the audience;
o memorable in the minds of the audience; and,
o able to motivate the audience to action.
· Exploring the perceptions, knowledge, and understanding of Americans on various bilateral issues, such as energy, trade, security and the environment to develop effective communication strategies.
· Creating a demographic and geographic segmentation of the respondents.
Methodology
This public opinion research was conducted via online surveys, using Computer Aided Web Interviewing (CAWI) technology. Because the study was conducted with Americans in the United States, Léger partnered with National Opinion Research Centre (NORC), an American market research company, to conduct data collection. Fieldwork for the survey was carried out from March 2 to March 27, 2023. A total of 3,183 Americans aged 18 and over with demographic characteristics reflective of the American population were surveyed. The sample was drawn randomly from NORC’s AmeriSpeak® panel and the overall response rate for the survey was 22.7%.
In order to comply with the best market research practices in the United Stated, AmeriSpeak® was responsible for data weighting. Using data from the most recent American census, results were weighted within each region by gender, age, race/ethnicity, and education status to ensure the best possible representativeness of the sample within each region and overall. The weight of each region was adjusted to be equivalent to its actual weight in relation to the distribution of the American population. The weighting factors are presented in detail in the appendix of this report.
A pre-test of 44 interviews was completed before launching data collection to validate the programming of the questionnaire in both English and Spanish.
Leger adheres to the most stringent guidelines for quantitative research. This survey was conducted in accordance with the Standards for the Conduct of Government of Canada Public Opinion Research for online surveys.
A complete methodological description is provided in the Appendices section of this document (please see Appendix A).
Overview of the Findings
Understanding the U.S.’ relationship with other countries
· Canada came out at the top of the list of countries that are considered friends to the U.S. (96%), along with Australia (92%), the U.K (92%) and France (91%). Respondents also consider it as the most trusted country when it comes to the U.S. working with other countries on a variety of issues (86%).
· The majority of respondents (91%) were more likely to support the United States having a closer trading relationship with another country, if its goods came from closer to the U.S. instead of from far away or overseas, (89%) prefer trading with another country that have the most competitively priced goods followed by 88% who support trading with another country with better environmental standards.
· A vast majority of respondents were more likely to respect another country’s different position on an issue if that country shares the same values with the U.S. (87%).
Understanding the U.S.’ position in North America
· When collaborating with its neighbors, nearly two-thirds of respondents preferred a North American or a U.S.-Canada-Mexico approach (34% and 30%, respectively).
· A vast majority of respondents agreed that Canada is an essential partner for the U.S. (86%), ahead of Mexico (70%). Almost three-quarters of respondents also agreed that Canada is the U.S.' best friend and ally (72%).
· Around one in five Americans were familiar with the Canada-U.S.-Mexico Agreement (CUSMA).
· Gun violence (33%) and health care (32%) are considered today’s top priority issues , followed by crime (27%) and climate change (27%).
Understanding Americans’ attitudes towards Buy America
· A vast majority of respondents support Buy America (87%), but most were also supportive of expanding Buy America to include Canada (81%).
· Respondents are more likely to support Buy America even if it were opposed by large businesses or industry groups (63%), foreign government (61%). Similarly, support for Buy America is high if it contributed to local job growth but caused job losses in other U.S. regions (54%). On the other hand, it would suffer from low support if it slowed down state government services (28%), cost the state government a lot more money (28%), and if it caused job losses in the local community (17%).
Understanding Americans’ attitudes towards Canada
· A considerable proportion of Americans were not able to say whether things in Canada were headed in the right or wrong direction (42%). However, the same proportion indicated that things were on the right track (41%). Over half (53%) said their opinion of Canada has not changed in the past 5 years, while less than one in five said it has gotten worse (18%), and a little over one in ten said it has improved (13%).
· A relative majority of respondents (42%) preferred to refer to the relationship between Canada and the U.S. as “good neighbors”.
· A majority of respondents agreed that Canada is the U.S.’ closest global partner on the environment, trade, and border measures (73% agreed with each field), energy (72%), advancing global values (71%), and security and defense (70%).
· Almost three in four respondents agreed that it is appropriate for U.S. lawmakers to consider potential negative impacts on other countries (73%) and Canada (71%) when making decisions.
· Around three in four also agreed that it is appropriate for Canada to prioritize its own needs (76%), but that the two countries should still make special allowances for each other (73%).
· At least eight in ten Americans agreed with every statement regarding the need for collaboration between Canada and the U.S. in various fields.
Understanding Americans’ attitudes towards Canada-U.S. collaboration
· A majority of respondents would support periodical tariffs on imports from Canada if they supported local jobs (79%), but less than half would support them if they resulted in tariffs on exported American goods (41%), and only one in five people would support them if they resulted in local job losses (20%) or caused a trade war with Canada (18%).
· The majority of respondents are opposed to imposing tariffs on imports of certain kinds of Canadian lumber, if they contribute to higher housing costs for American homebuyers (77%) and if they add a tax on American businesses and consumers (74%). Similarly, just over half of respondents are opposed to imposing tariffs on certain kinds of Canadian lumber, if the US cannot produce enough lumber at home to meet its own demand (56%).
· Collaboration between the U.S. and Canada is seen as important in all areas of defense: maintaining continental (86%) and border (85%) security, defending North America (85%), promoting world peace and stability (84%), and maintaining U.S. national security (83%).
· A majority of respondents also agreed that the two countries need to closely coordinate their responses to global challenges presented by countries such as China, Russia, and Iran (85%), that Canada contributes sufficiently in the NORAD (80%), and in defending the Arctic (78%).
· Regarding the management of their shared border, both Canada and the U.S. got similar ratings: around seven in ten considered that Canada's (72%) and the U.S.' (69%) management of the border contributes to the U.S. economy, and between a fifth and a third of respondents had a negative perception of the countries' management of the border.
· A vast majority of respondents agreed that Canada develops its natural resources more responsibly than other countries (84%).
· As far as energy is concerned, a majority of respondents would support importing more energy from Canada, if it supported new jobs (87%), increased U.S. national security (85%), meant reducing imports from other countries like Saudi Arabia or Russia (82%), and even if it required new infrastructure (75%). A little less than half would support more energy imports from Canada, if it produced more greenhouse gas emissions (48%).
· Terminology-wise, terms like "energy infrastructure" and "energy imports" were preferred to "pipelines" and "oil and gas imports" as they had less of a negative connotation. 84% and 83% of respondents stated they would support building more energy infrastructure between the two countries and increasing energy imports from Canada.
· Seven in ten agreed that the U.S. could learn from Canada with respect to working with racialized communities (70%).
MaxDiff analyses – argument and message evaluation
· Two MaxDiff analyses were conducted to respond to different objectives. The first one was aimed at determining the key arguments that resonate with U.S. citizens regarding collaboration between the United States and Canada. Four out of the six arguments obtained fairly similar scores: defence cooperation (23), jobs (21), climate change (20), and energy (19). Diversity and inclusion were twice (11) less important than defence, and unique product supplies (6) scored the lowest.
· The second MaxDiff analysis helped determine the importance of several messages pertaining to U.S.-Canada collaboration and conflict resolution. The top argument was “Canada firmly believes that a mutually acceptable agreement - one that brings stability and predictability to the sector - is in the best interests of both countries and remains the best outcome to the dispute” with an importance score of 37, four times more important than the last argument “If we continue down this road, Canada will have no choice but to retaliate against the United States” with a score of 9.
Notes on Interpretation of the Research Findings
The views and observations expressed in this document do not reflect those of Global Affairs Canada. This report was compiled by Leger based on the research conducted specifically for this project.
Funded and operated by NORC at the University of Chicago, AmeriSpeak® is a probability-based panel designed to be representative of the U.S. household population. Randomly selected U.S. households are sampled using area probability and address-based sampling, with a known, non-zero probability of selection from the NORC National Sample Frame. While the AmeriSpeak® panel is meant to be representative of the U.S. population, it is not probabilistic; the results cannot be inferred to the general population of the United States.
Respondents were randomly selected from the NORC probability panel ensuring that the sample closely resembles the actual population of the United States. The margins of sampling error cannot be calculated for surveys using internet panel. Respondents for this survey were selected from among those who have volunteered to participate/registered to participate in online surveys. The data have been weighted to reflect the demographic composition of the target population. Detailed information about the weighting process is presented in annex A.1.
In this report, all results are expressed as percentages unless otherwise noted. Percentages may not always add up to 100% due to rounding or multiple mentions. The mention “Skipped” in graphs refers to the proportion of respondents who skipped the question on the survey.
Subgroup differences are reported when they are statistically significant at the 95% confidence level. When a subgroup is reported as being more or less to likely to have given a particular response, this means the result for the subgroup was significantly different compared with the combined result for all other subgroups combined. For example, if respondents aged 18 to 24 were more likely to give a particular response, it is in comparison to the result for all other respondents aged 25 and older. These significant differences are presented in bullet points under the global results. States were grouped into four categories (Midwest, West, Northeast and South) according to the U.S. Census Bureau. Further details are provided in the appendix.
Contract value
The contract value for this study was $144,065.96 (including HST)
Political Neutrality Statement and Contact Information
Leger certifies that the final deliverables fully comply with the Government of Canada’s political neutrality requirements outlined in the Policy on Communications and Federal Identity and the Directive on the Management of Communications.
Specifically, the deliverables do not include information on electoral voting intentions, political party preferences, standings with the electorate, or ratings of the performance of a political party or its leaders.
Signed:
Christian Bourque, Senior Researcher
Léger
Detailed Results
Understanding the U.S.’ relationship with other countries
Countries considered as U.S’ friend and enemy
Among the fifteen countries tested, ten were considered friends of the U.S. by a majority of the respondents, and the remaining five were considered enemies (see figure 1). Canada came out at the top of the list, with a quasi-majority of Americans considering it U.S.’ friend (96%). Canada was closely followed by Australia (92%), the United Kingdom (92%), and France (91%). Germany (84%), Japan (81%), Ukraine (80%), India (80%) and Israel (80%) were considered U.S.’ friend by over eight in ten Americans, and three in four considered Mexico as U.S.’ friend as well (75%).
Saudi Arabia was considered an enemy by over half of Americans (55%), while Syria and China were considered enemies by three quarters of Americans (72% and 77%, respectively). Iran (88%) and Russia (91%) close the list with around nine in ten Americans considering them enemy countries.
Figure 1: Countries
considered as U.S.’ friend and enemy 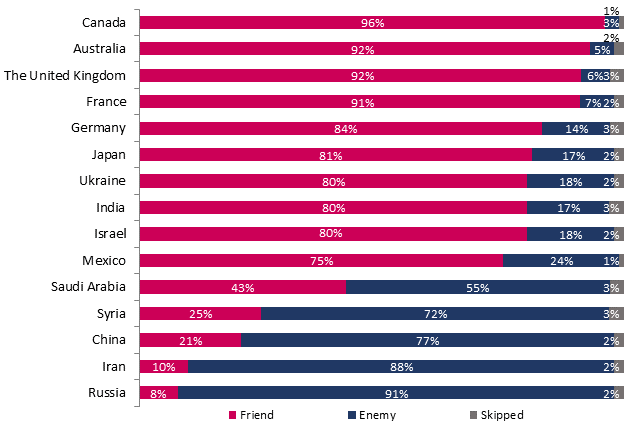
Q26A. Do you consider the countries listed below to be a friend or enemy of U.S? Base: All respondents (n=3,183)
Respondents over 55 years old (98%), those who earn $100,000 or more (98%), and those who identify as white non-Hispanic (97%) were more likely to consider Canada as a friend of the U.S.
Level of trust towards different countries
When asked about their level of trust towards the same countries, Canada topped the list again, with 82% of respondents trusting it a lot (53%) or some (29%) (see figure 2). It was closely followed by the U.K. and Australia, as they were trusted a lot by 48% and 41% of respondents, and some by 29% and 32%, respectively. Around two thirds of respondents trust Germany, France and Japan (a lot: 36%, 32%, 35%; some: 33%, 37% and 31%, respectively). Ukraine and Israel benefited from similar levels of trust (23% and 24% trusted them a lot, and 36% and 33% trusted them some), while India and Mexico were trusted by around half of Americans (12% and 10% trusted them a lot and 40% and 38% trusted them some). Saudi Arabia is trusted by one in four Americans, with a very small proportion trusting it a lot (4%), the rest trusting it some (20%), while Iran and Russia benefit from marginal levels of trust as less than one in ten Americans stated they trusted them either a lot or some.
Figure 2: Level
of trust towards different countries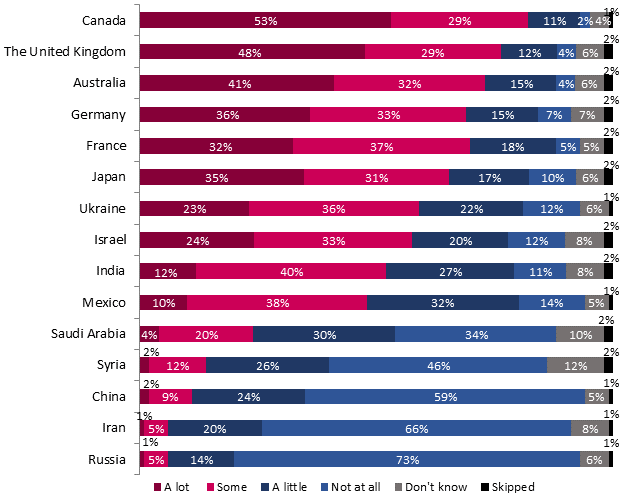
Q26B. For each of these countries, we are interested in learning about your level of trust when it comes to the U.S. working with these countries on a variety of issues. Do you trust them…
Base: All respondents (n=3,183)
The following subgroups were significantly more likely to trust Canada:
· Men (85%)
· Respondents aged 55 and over (89%)
· Respondents from the West (88%) and the Northeast (88%)
· Respondents born outside of the U.S. (89%)
· Respondents who identify as white non-Hispanic (86%)
· Respondents who earn $100,000 or more (92%)
Level of support for closer trading relationships with other countries in different situations
In order to measure the effectiveness of Global Affairs Canada’s communications directed to the U.S., respondents were asked about the elements (see figure 3) that would make them support a closer trading relationship with other countries. A vast majority of respondents were more likely to support the U.S. having a closer trading relationship with another country in all four situations presented. Around nine in ten considered it more likely to support the U.S. if the imported goods were better in some way than other trading partners (i.e., shorter transport distance, competitive price, and more environmentally friendly), and over three in four people were more likely to support the U.S. developing closer trade relationship with another country, if the country’s workers were part of the same labor unions as American unions.
Around a third or more of respondents were much more likely to support the U.S. if the goods came from closer (38%) to the U.S., if they were the most competitively priced on the global market (33%), and if they were better for the environment than another trading partner (38%), while around half of respondents considered it somewhat likely (53%, 55%, and 49%, respectively).
Around one in four said they would be much more likely to support the U.S. having a closer trading relationship with another country if its workers were part of the same labor unions as American workers (26%), and half were somewhat more likely (53%).
Figure 3: Level of support of closer trading relationships with other countries in different situations
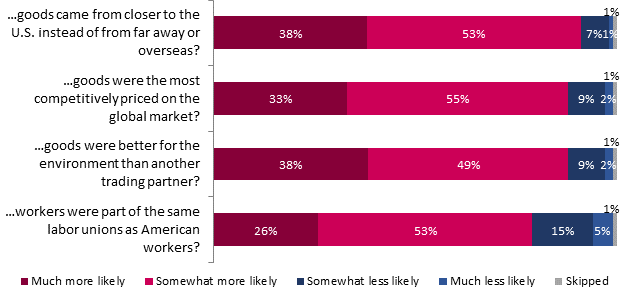
Q4. How likely would you support the United States having a closer trading relationship with another country if its…? Base: All respondents (n=3,183)
Significant differences regarding preferred messages include:
· Respondents from the Midwest were more likely to support a closer trading relationship between the U.S. and another country, if the goods came from closer (94%) to the U.S., and if they were the most competitively priced (92%).
· Respondents over 55 years old also showed the same preferences: they were more likely to show support, if the goods came from closer (93%) to the U.S. and if they were the most competitively priced (91%).
· Goods that are better for the environment (94%) and workers that are part of the same labor unions as American workers (86%) resonate more with respondents from a visible minority group.
Respect for another country’s position on an issue based on shared values with the U.S.
A vast majority of respondents were more likely to respect another country’s different position on an issue if that country shares the same values with the U.S. (87%), with one fourth who are much more likely (23%), and two thirds somewhat more likely (64%). A little over one in ten respondents stated they were less likely, either somewhat (10%), or much less (2%) to respect another country’s position if it did not share the same values with the U.S.
Figure 4: Influence of shared values on
respect for another country’s position on an issue
Q9. Are you more or less likely to respect another country’s different position on an issue if that country shares the same values with the U.S.? Base: All respondents (n=3,183)
The following subgroups were significantly much more likely or somewhat more likely to respect another country’s different position on an issue if that country shares the same values with the U.S.:
· Respondents from the West (90%)
· Respondents aged 55 and over (91%)
· Male respondents (90%)
· Non-Hispanic white-identifying respondents (89%)
· Respondents whose household income is over $100,000 (92%)
Understanding the U.S.’ position in North America
Understanding of the “North America” phrase
Respondents were asked about their understanding of what the expression “North America” encompasses. Over a third considered that the phrase includes the U.S., Canada and Mexico (39%), and around one-fourth thought it meant the U.S., Canada, Mexico, and some other countries in Latin America and the Caribbean (24%), and just the U.S. and Canada (22%). Less than one respondent in five considered the phrase to only refer to the United States (15%).
Figure 5: Understanding of the “North America” phrase
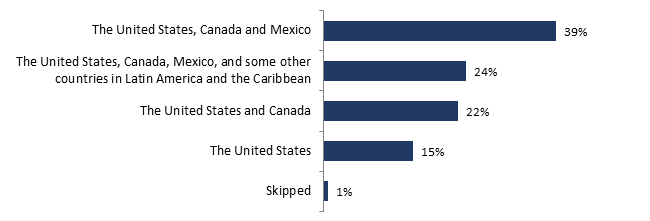
Q1. Thinking about the phrase ‘North America,’ which of the following best describes what you understand that to mean? Base: All respondents (n=3,183)
The following subgroups were significantly more likely to understand the “North America” phrase as “The United States, Canada and Mexico”:
· Men (44%)
· Non-Hispanic white-identifying individuals (42%)
· Respondents with an income of $100,000 or more (50%)
· Respondents who prefer a North American (42%) or Hemispheric (48%) approach when the U.S. collaborates on shared interests.
The following subgroups were significantly more likely to understand the “North America” phrase as “The United States, Canada, Mexico, and some other countries in Latin America and the Caribbean”:
· Respondents from the Midwest (28%)
· 18-34 year-olds (29%)
· U.S.-born respondents (25%)
· Non-Hispanic white-identifying individuals (25%)
· Respondents who prefer a Hemispheric approach (31%) when the U.S. collaborates on shared interests.
Preferred approach when collaborating on shared interests
Overall, around a third of respondents think the United Stated should prioritize a North American (34%) or a U.S.-Canada-Mexico approach (30%) when working with neighbors on shared interests like trade, the environment, energy and defense. Around one in ten thought that a continental (13%), hemispheric (9%), or U.S.-Canada approach should be privileged. A small proportion of respondents stated that a U.S.-Mexico approach should be favored.
Figure 6: Preferred approach when collaborating on shared interests
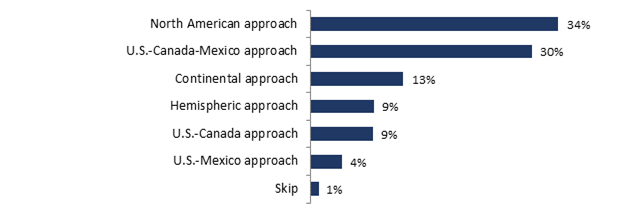
Q3. When collaborating with its neighbors, Canada and Mexico, on shared interests like trade, the environment, energy and defense, which of the following approaches should the United States prioritize when working on these issues? Base: All respondents (n=3,183)
Significant differences regarding approach preferences include:
· Respondents from the West were more likely to prefer a U.S.-Canada-Mexico approach (35%), while those from the Northeast were more likely to prefer a U.S.-Canada approach (14%).
· Those over 55 years old were more likely to prefer a U.S.-Canada-Mexico approach (37%) while those 18-34 were more likely to prefer a continental approach (19%).
· Respondents born in the U.S. were more likely to prefer a North American approach (36%), while those who are born outside the U.S. (39%) and those who identify as part of a visible minority (37%) prefer a U.S.-Canada-Mexico approach.
U.S. relations with neighboring countries
A vast majority of respondents agreed that Canada is an essential partner for the U.S. (86%). Over seven respondents out of ten agreed that Canada and Mexico are essential partners for the U.S. (79%), 72% agreed that Canada is the U.S.’ best friend and ally , and 70% agreed that Mexico is an essential partner to the U.S. Around half agreed that Canada and Mexico are the U.S.’ best friends (47%), and a third agreed that Mexico is the U.S.’ best friend and ally (34%). Overall, agreement levels increase whenever Canada is included in a statement.
Figure 7: US
relations with neighbouring countries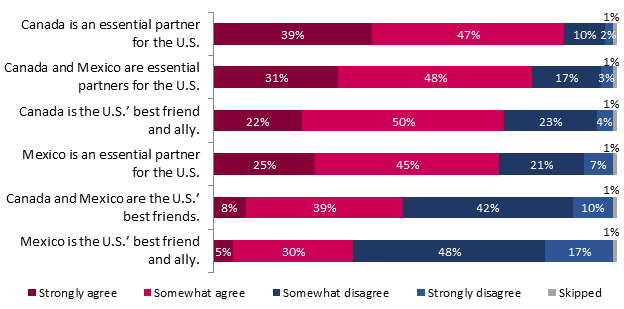
Q2. To what extent do you agree or disagree with the following statements? Base: All respondents (n=3,183)
Note: For analysis purposes, a Total Agree (Strongly + Somewhat Agree) has been calculated. Significant differences are presented on the basis of the Total Agree. Significantly lower differences are marked with a “- “sign while significantly superior ones are marked with a “+” sign.
Significant differences in term of agreement levels with each statement include:
· Respondents from the West were more likely to agree with four out of the six statements: “Canada and Mexico are essential partners for the U.S.” (84%), “Mexico is an essential partner for the U.S.” (78%), “Canada and Mexico are the U.S.’ best friends” (52%), and “Mexico is the U.S.’ best friend and ally” (40%).
· Respondents from the Midwest were more likely to agree with the statement “Canada and Mexico are essential partners for the U.S.” (82%).
· Male respondents were more likely to agree that “Canada is an essential partner for the U.S” (89%), “Canada and Mexico are essential partners for the U.S” (83%), and that “Mexico is an essential partner for the U.S” (75%).
· Respondents aged 18-34 were more likely to agree that “Mexico is an essential partner for the U.S. (75%)” and that it “is the U.S.’ best friend and ally” (39%), while those over 55 years old were more likely to agree that “Canada is an essential partner for the U.S.” (89%) and “the U.S.’ best friend and ally” (79%). They were also more likely to agree that “Canada and Mexico are the U.S.’ best friends” (50%).
· Those who were supportive of including Canada, Mexico, allies, and other countries into the Buy America program were more likely to agree with all statements.
Familiarity with CUSMA
Less than one in five respondents (19%) said they were familiar with the CUSMA, with only 3% considering they are very familiar with it, and 16% considering they are familiar. On the other hand, half of the respondents said they were not too familiar (50%), and three in ten were not at all familiar (30%).
Figure 8: Familiarity with CUSMA
Q14C. How familiar are you with the U.S.-Mexico-Canada Agreement? Base: All respondents (n=3,183)
The following subgroups were significantly more likely to be familiar with the CUSMA:
· Men (26%)
· 35-54 year-olds (22%)
· Respondents living in a metropolitan area (20%)
· Respondents who were born outside of the U.S. (26%)
· Respondents who identify as Asian (42%)
· Respondents who earn more than $100,000 (26%)
· Respondents in the workforce (21%)
Current priority issues
Gun violence (33%) and healthcare (32%) were considered the top two current issues, closely followed by crime and climate change, tied for third place (27%) (see figure 9) Disinformation in the news (24%), and lack of affordable housing (23%) were mentioned by one fourth of respondents, while racism (20%), budget deficit (19%), misinformation in the news (19%), and homelessness (18%) were mentioned by around a fifth. Terrorism (11%) and lack of good jobs (9%) were mentioned by one tenth of respondents. Other issues were mentioned to a lesser extent.
Figure 9: Current
priority issues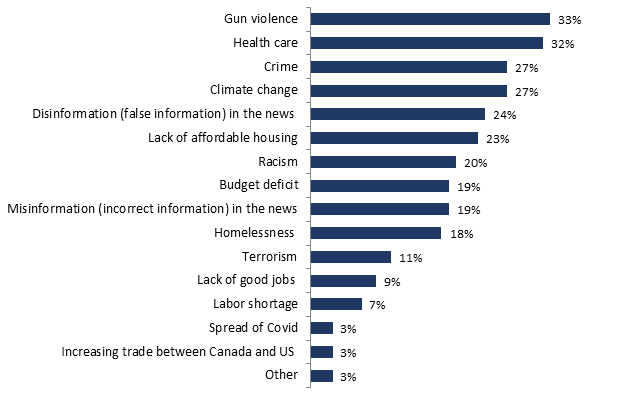
Q16A1. Which do you think is a priority issue for you today? Base: All respondents (n=3,183)
Note: Up to 3 mentions allowed, total may exceed 100%.
Significant differences in terms of priority issues include:
· Respondents from the West were significantly more likely to mention climate change (34%), lack of affordable housing (31%), and homelessness (22%) as key issues. Those from the Northeast were more likely to mention climate change (32%) while those from the South were more likely to mention budget deficit (22%).
· Men were significantly more likely to consider disinformation (29%), misinformation (22%), and budget deficit (22%) as priority issues, while women were more likely to mention gun violence (38%), health care (34%), lack of affordable housing (26%), and homelessness (21%).
· Respondents aged 18-34 years old were more likely to consider that lack of affordable housing (35%), climate change (31%), racism (23%), and lack of good jobs (12%) were top priority issues, while those aged 55 and over were more likely to mention gun violence (36%), crime (32%), disinformation (29%), misinformation (22%), budget deficit (23%) and terrorism (14%).
· Respondents who identify as a visible minority were more likely to mention gun violence (39%), racism (31%) and lack of affordable housing (28%) as priority issues while those who did not identify as a visible minority were more likely to mention disinformation (27%) and homelessness (20%).
Sources of disinformation and misinformation
For both disinformation and misinformation, special interest groups came out as the main source (64% and 56%, respectively), followed by local governments (8% and 14%). Media/news outlets were considered a primary source of both by 6% of respondents, and citizens were considered a source of misinformation by 7%. Other sources were mentioned by 5% or the respondents or less.
Figure 10: Sources of disinformation and misinformation
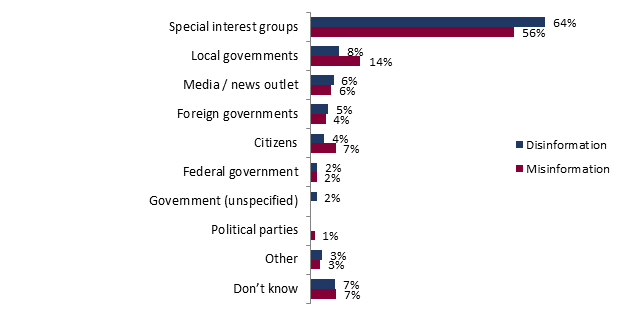
Q16B/C. Where do you think disinformation/misinformation primarily comes from? Base: Respondents who considered disinformation (n=818) and misinformation (n=615) to be priority issues
Significant differences regarding the sources of disinformation include:
· Respondents over 55 years old were more likely to mention special interest groups (69%) while those aged 18-34 were more likely to mention local governments (15%) and citizens (10%) as sources of disinformation.
Significant differences regarding the sources of misinformation include:
· Respondents over 55 years old were more likely to mention special interest groups (65%) while those aged 18-34 were more likely to mention citizens (13%) as sources of misinformation.
· Women were more likely to mention local governments (18%).
Understanding Americans’ attitudes towards Buy America
Level of support for Buy America
Respondents were asked about their support or opposition for Buy America after being presented with a short definition (see Q.5) . A vast majority of respondents support Buy America (87%), with four in ten strongly supporting it and almost half somewhat supporting it (47%). Around one in ten somewhat opposed it (11%), and a meager 1% strongly opposed it.
Figure 11: Level
of support for Buy America
Q5. Many U.S. state governments only give contracts to companies that make their products in that government’s home state. These are often termed Buy America. Do you support or oppose Buy America? Base: All respondents (n=3,183)
Significant differences include:
Respondents 55 years old and over (93%) and those who identify as white (90%) were significantly more likely to support Buy America.
Level of support for expanding Buy America to other countries
Canada is the top country Americans support expanding Buy America to (81%), followed by ally countries (74%), and Mexico (71%). However, all three were somewhat supported by the same proportion of respondents (51%), making strong support the only differentiator. Around half of respondents support integrating other countries into Buy America in their state (54%).
Figure 12: Level of support for including other countries in Buy America
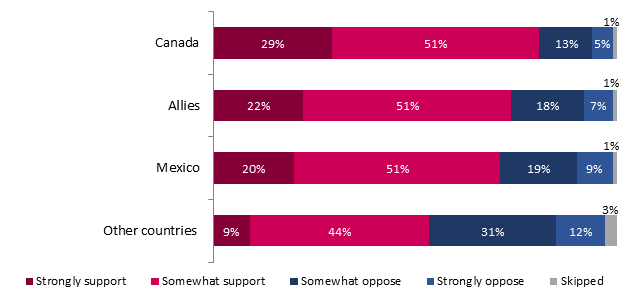
Q6. Thinking about expanding Buy America to include other countries, to what extent do you support or oppose the following in your state? Base: All respondents (n=3,183)
Significant differences with respect to expanding Buy America to include other countries are as follows:
· Respondents from the West of the U.S. were significantly more likely to support expanding Buy America to Canada (85%), allies (79%), and Mexico (79%).
· Respondents who identify as a visible minority were more likely to support expanding Buy America to all countries.
· Respondents who are 55 and over were more likely to support including Canada in Buy America (83%).
· Respondents who considered Canada and Mexico to be best friends and essential partners to the U.S. (i.e., those who agreed with the statements of Q2) were more likely to include other countries in Buy America.
· Respondents who described the relationship between Canada and the U.S. as allies were more likely to support including other ally countries (77%).
Support for Buy America under different conditions
As illustrated in figure 10, around six in ten respondents would still support Buy America if it was opposed by large businesses or industry groups (strongly: 17%, somewhat: 45%), by a foreign government (strongly: 18%, somewhat: 43%), or by organized labor or union groups (strongly: 11%, somewhat: 35%). Around half said they would still support it, if it contributed to job growth in their local community but caused job losses in other parts of the U.S. (strongly: 13%, somewhat: 41%). Around four in ten would still support it, if it caused foreign governments to retaliate by not buying American goods (strongly: 10%, somewhat: 27%), or if it contributed to climate change (strongly: 14%, somewhat: 27%). One in four would still support Buy America, if it costs their state government a lot more money (strongly: 4%, somewhat: 23%), or if it slowed down state government services (strongly: 5%, somewhat: 22%). Finally, less than one in five would still support the Buy America program, if it causes job losses in their local community (strongly: 3%, somewhat: 13%).
Figure 13:
Support for Buy America under different conditions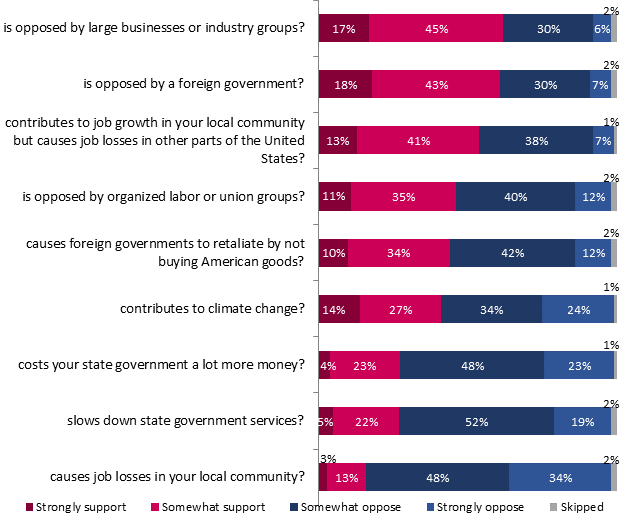
Q8. To what extent do you support Buy America if it… Base: All respondents (n=3,183)
Significant differences include:
· Respondents from the Northeast were significantly more likely to support Buy America if it contributes to job growth in their local community but causes job losses in other parts of the United States (61%).
· Men were significantly more likely to support Buy America if it were opposed by either large businesses or industry groups (66%), by a foreign government (66%), or by organized labor or union groups (52%). They were also more likely to support it even if it contributes to job growth in their local community but causes job losses in others (60%) and if it caused foreign governments to retaliate (51%).
· 35-54 year-old respondents were more likely to support Buy America, if it contributes to job growth in their local community but causes job losses in others (58%), while those 55 and over were more likely to support it, if it were opposed by a foreign government (68%) or by organized labor or union groups (52%), or if it caused foreign governments to retaliate (49%).
· Those who support Buy America were significantly more likely to support it under all conditions, except if it caused job losses in their local community.
Understanding Americans’ attitudes towards Canada
Perception of the current situation in Canada
Respondents were divided regarding the situation in Canada. While four in ten said that things were generally headed in the right direction (41%), the same proportion was unsure (42%). Less than one in five considered that things in Canada are off on the wrong track (16%).
Figure 14: Perception
of the current situation in Canada
Q7A. Would you say things in Canada today are… Base: All respondents (n=3,183)
The following subgroups were significantly more likely to consider that the situation in Canada is off on the wrong track:
· Respondents identifying as a visible minority were significantly more likely to think that things in Canada are generally headed in the right direction (48%).
· Respondents living in a metropolitan area were more likely to consider that things in Canada are generally headed in the right direction (43%), while those living in non-metropolitan areas were more likely to consider they were off on the wrong track (24%).
Evolution of opinion towards Canada
Around half of respondents said their opinion of Canada has stayed the same compared to 5 years ago (53%). Around one in five said it has gotten worse (18%), and over one in ten considered it has improved (13%). Over one in ten respondents did not provide an answer (15%).
Figure 15:
Perception of the current situation in Canada
Q7B. Compared to 5 years ago has your opinion of Canada… Base: All respondents (n=3,183)
Respondents over 55 years old (58%) were significantly more likely to state their opinion stayed the same, while those aged 18-34 (18%) and those who identify as a visible minority (17%) were more likely to state their opinion improved.
Relationship between the United States and Canada
Over four out of ten respondents consider the U.S. and Canada to be good neighbors (42%), and three in ten consider them to be allies (30%). Less than one in ten described the relationship between the two countries as friends (8%), partners (7%), and each other’s customers (6%). A smaller proportion of respondents considered them as equals on the world stage (3%) or as competitors (2%).
Figure 16:
Influence of shared values on respect for another country’s position on an
issue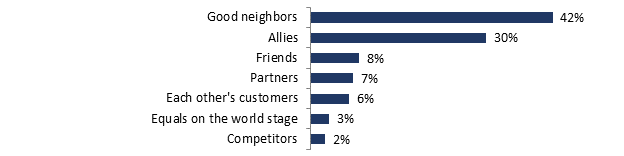
Q10. Which of the following best describes the relationship between the United States and Canada? They are... Base: All respondents (n=3,183)
Significant differences regarding the description of the U.S.-Canada relationship include:
· Respondents from the Northeast were more likely to call the two countries good neighbours (47%) while those from the West were more likely to call them allies (35%)
· Women were significantly more likely to call the two countries good neighbours (45%), while men were more likely to call them allies (33%)
· Respondents aged 55 and over were more likely to use the term allies (33%) while those aged 18-34 were more likely to use the term partners (10%).
· Respondents who were born outside of the U.S. were more likely to use the term good neighbours (51%)
Canada’s status as the U.S.’ closest global partner
A majority of respondents agreed that Canada is the U.S.’ closest global partner on all of the aspects surveyed, and differences between the aspects were minimal. That being said, the environment and trade were considered to be the most important (73%), and security and defense were considered to be the least important (70%).
Figure 17: Canada’s
status as the U.S.’ closest global partner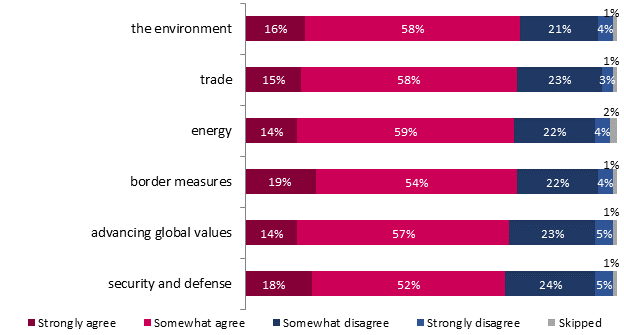
Q11A. Do you agree or disagree that Canada is the United States’ closest global partner on…? Base: All respondents (n=3,183)
Significant differences include:
· Respondents from the West were more likely to agree that Canada is the U.S.’ closest global partner when it comes to the environment (77%) and advancing global values (76%). Women were also more likely to agree with both of those statements (76% and 74%, respectively).
· Respondents aged 55 and over, as well as those who were born outside of the U.S., were significantly more likely to agree with all statements, compared to those aged 18-34 and those born in the U.S.
Consideration of negative externalities on other countries when making decisions
Respondents were divided into two equal split samples and were asked to rate their agreement level with one of the two statements illustrated in Figure 18. Agreement levels were fairly similar across both statements, with a maximum difference of 3 points. Overall agreement levels were not significantly different. Around one fifth of respondents strongly agreed that it is appropriate for U.S. lawmakers to consider potential negative impacts on other countries (21%) and on Canada (23%) when making decisions, and around half somewhat agreed (51% and 48%, respectively). Around three in ten disagreed with the statements, with one-fifth somewhat disagreeing (19% and 18%, respectively) and one-tenth strongly disagreeing (8% and 10%, respectively).
Figure 18: Consideration of negative externalities on other countries
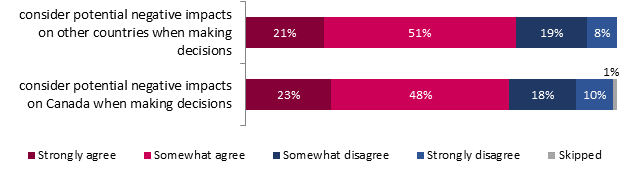
Q15. To what extent do you think it is appropriate for U.S. lawmakers to… Base: All respondents (n=3,183)
Note: approximately half of the sample (n=1,614) was exposed to the first statement and the other half (n=1,569) was exposed to the second statement.
Significant differences include:
· Respondents living in metropolitan areas (74%) were significantly more likely to agree with the first statement.
· Respondents who identify as a visible minority (77%) and those who are retired (80%) were more likely to agree with the second statement.
· Respondents who earn over $100,000 were more likely to agree with both statements (79% and 78%, respectively).
Link between Canada and the U.S.’ prosperity and security
Respondents were divided into two equal split samples in order to gain an understanding of their perception of the interconnectedness of Canada and the U.S.’ prosperity and security through their agreement level with one of two similar statements (see Figure 19). Almost three quarters of respondents (72%) agreed that North American prosperity and security are directly related to Canadian prosperity and security, and around two thirds (66%) agreed that American prosperity and security are directly related to Canadian prosperity and security.
Figure 19: Link
between Canada and the U.S.’ prosperity and security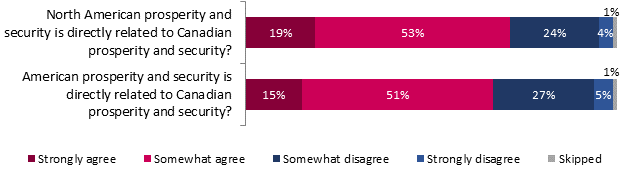
Q14. Do you agree or disagree that…? Base: All respondents (n=3,183)
Note: approximately half of the sample (n=1,583) was exposed to the first statement and the other half (n=1,600) was exposed to the second statement.
The following subgroups were significantly more likely to agree with the statement “North American prosperity and security is directly related to Canadian prosperity and security”:
· Respondents from the West (80%)
· Respondents who identify as male (77%)
· Respondents over 55 years old (78%)
· Respondents who live in a metropolitan area (73%)
· Respondents who are born outside of the U.S. (84%)
· Respondents who identify as Asian (90%)
· Respondents who earn $100,000 or more (79%)
The following subgroups were significantly more likely to agree with the statement “American prosperity and security is directly related to Canadian prosperity and security”:
· Respondents from the West (73%)
· Respondents between 35 and 54 years of age (74%)
· Non-Hispanic white-identifying respondents (69%)
· Respondents who identify as Asian (83%)
· Respondents who earn $100,000 or more (71%)
Canada-U.S. interests and relationship
A similar proportion of respondents agreed with both statements shown in Figure 20 (76% and 73%, respectively). Around one fifth of respondents strongly agreed with the statements that it is normal for Canada to prioritize its own needs (19%) and that the U.S. and Canada should make special allowances for each other (18%), while over half somewhat agreed with both statements (56% and 55%, respectively). On the other hand, 19% somewhat disagreed that Canada should prioritize its own country’s needs, while 22% disagreed that the two countries should make special allowances for each other, and 4% strongly disagreed with both.
Figure 20: Canada-U.S. interests and relationship
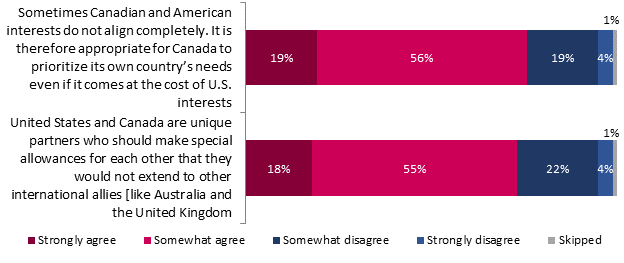
Q16. Do you agree or disagree with the following statements? Base: All respondents (n=3,183)
Significant differences include:
· Respondents who identify as white and non-Hispanic (79%) were significantly more likely to think it is appropriate for Canada to prioritize its own country’s needs, even if it comes at the cost of U.S. interests.
Respondents between 35 and 54 years of age (77%), were significantly more likely to agree that the U.S. and Canada should make special allowances for each other that they would not extend to other international allies. Those who earn over $100,000 (84% and 81%), and those who are in the workforce (79% and 75%) were significantly more likely to agree with both statements.
Understanding Americans’ attitudes towards Canada-U.S. collaboration
Canada-U.S. collaboration areas
At least eight in ten Americans agreed with every statement regarding the need for collaboration between Canada and the U.S. in various areas. Managing environmental resources (89%), preventing terrorist threats (89%), and increasing trade (89%) were tied as the top three issues that require collaboration between the two countries, as almost nine in ten agreed (either strongly or somewhat) with these statements. They were closely followed by air and water management (87%), border management (86%), cyber threat defense, (86%) and the fight against climate change (79%).
Figure 21: Canada-U.S.
collaboration areas 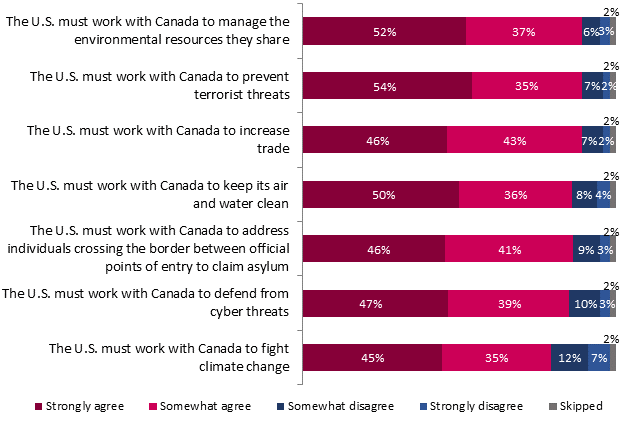 Q27. To what extent do you agree or disagree with the following
statement? Base: All respondents (n=3,183)
Q27. To what extent do you agree or disagree with the following
statement? Base: All respondents (n=3,183)
Significant differences in terms of collaboration needs between the two countries include:
· Respondents from the West were significantly more likely to agree that the U.S. and Canada must work together to increase trade (91%) and to fight climate change (83%).
· Respondents aged 55 and over were more likely to agree with all statements but the last one.
· Respondents born outside of the U.S. were more likely to agree that the U.S. and Canada must work together to keep air and water clean (91%), to address individuals crossing the border to claim asylum (92%), and to fight climate change (86%).
· Respondents who identify as visible minorities were more likely to agree that the countries should work together to keep air and water clean (90%) and to fight climate change (87%), while those who identify as white were more likely to agree that the two countries must work together to prevent terrorist attacks (91%) and to increase trade (91%).
· Respondents who earn $100,000 or more were more likely to agree with all the statements.
Canada-U.S. trade
A vast majority of respondents (80%) consider Canada to be America’s most secure and reliable trading partner, with one fifth strongly agreeing (21%), and six in ten somewhat agreeing (59%), while one in five disagreed (19%; somewhat disagree: 16%, strongly disagree: 3%).
Over half of respondents agreed that the US periodically needs to impose tariffs on imports from Canada to protect US national security (52%), with less than one in ten strongly agreeing (8%) while the rest somewhat agreed (45%). Over a third (38%) somewhat disagreed with the statement, and less than one in ten strongly disagreed (8%).
Figure 22:
Canada-U.S. trade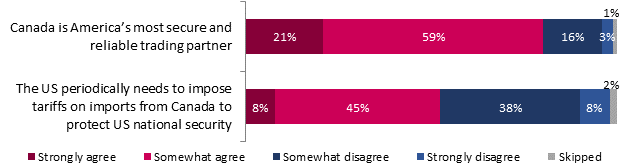
Q17. Do you agree or disagree with the following statements? Base: All respondents (n=3,183)
The following subgroups were significantly more likely to agree that Canada is America’s most secure and reliable trading partner:
· Respondents over 55 years of age (87%)
· Respondents from the West of the U.S. (84%)
· Respondents who identify as white, non-Hispanic (82%) or Asian (90%)
· Respondents who earn $100,000 or more (85%)
The following subgroups were significantly more likely to agree that the U.S. periodically needs to impose tariffs on imports from Canada to protect U.S. national security:
· Hispanic-identifying respondents (63%)
· Retired respondents (59%)
· Respondents who earn less than $30,000 (58%)
Support for imposing tariffs on imports from Canada
Support for tariffs on imports from Canada varied widely depending on their impact on various factors as illustrated in figure 23 The highest proportion of respondents said they would strongly (21%) or somewhat (58%) support import tariffs if they supported jobs in their local community, while one fifth would either somewhat (16%) or strongly (4%) oppose them.
Around four in ten respondents would support imposing tariffs, if they resulted in tariffs on American goods being exported to Canada (strongly: 4%, somewhat: 37%). On the other hand, just over half would oppose them (somewhat oppose: 46%, strongly oppose: 11%).
Around one fifth of respondents said they would strongly (3%) or somewhat (18%) support imposing these tariffs, if they resulted in job losses in their local community, while half would somewhat oppose them (51%) and over one-fourth would strongly (28%) oppose them.
Less than a fifth of respondents would support tariffs, if they caused a trade war with Canada (strongly: 3%; somewhat: 15%), with a majority of respondents somewhat (41%) or strongly (40%) opposing them.
Figure 23: Support
for tariffs on imports from Canada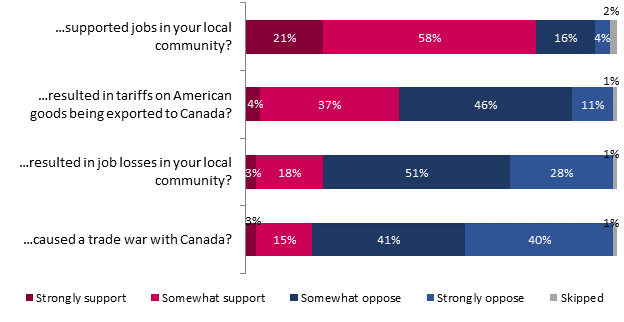
Q18. The United States periodically imposes tariffs on imports from Canada for a variety of reasons. Would you support or oppose these tariffs if they…? Base: All respondents (n=3,183)
Significant differences include:
· Respondents over 55 years old (83%) and those who identify as white non-Hispanic (81%) were significantly more likely to support the tariffs, if they supported jobs in their local community, while respondents aged 18-34 were more likely to oppose the tariffs even if they supported jobs in their local community (24% would strongly or somewhat oppose).
· Women were significantly more likely to oppose them, if they resulted in job losses in their local community (81%) or if they caused a trade war with Canada (83%).
Support of lumber import tariffs on Canada
Overall, import tariffs on certain kinds of lumber are mostly opposed by American respondents. Around four in ten would support them either strongly (6%) or somewhat (36%) even if the U.S. cannot produce enough lumber at home to meet its own demand, while over half would oppose them either somewhat (39%) or strongly (17%).
One fifth of respondents would support lumber import tariffs either strongly (3%) or somewhat (21%) if they add a tax on American businesses and consumers, while half would somewhat oppose them (52%) and almost a fourth would oppose them strongly (23%).
Less than a fourth of respondents would support lumber import tariffs, if they contribute to higher housing costs for American homebuyers (either strongly: 3% or somewhat: 18%), while half would somewhat oppose (48%) and almost three in ten would strongly oppose (29%), which is the highest level of opposition among the three statements.
Figure 24:
Support of lumber import tariffs on Canada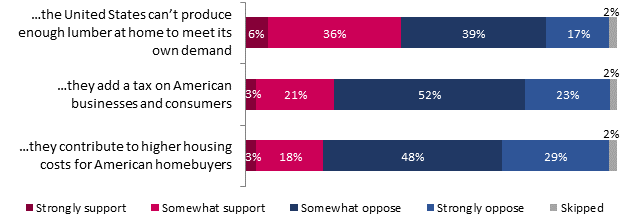
Q19: The United States currently imposes tariffs on imports of certain kinds of Canadian lumber. Would you support or oppose continuing these tariffs if…? Base: All respondents (n=3,183)
Significant differences include:
· Women (45%), those over 55 years old (46%), and those who do not identify as a visible minority (45%), were more likely to support continuing the tariffs, even if the U.S. cannot produce enough lumber at home to meet its own demand.
· Respondents aged 35-54 (28%), those living in a metropolitan area (25%), and those who identify as Hispanic (31%) were more likely to support continuing the tariffs, if they add a tax on American businesses and consumers.
· Those living in a metropolitan area (22%) and those who identify as Black (31%) or Hispanic (28%) were more likely to support continuing the tariffs, if they contribute to higher housing costs for American homebuyers.
· Respondents who earn less than $35,000 were more likely to support lumber import tariffs in all situations.
Importance of Canada’s partnership with the U.S. in various security areas
Agreement levels with Canada’s importance as a partner with the U.S. varied little across fields, as agreement levels were all between 86% and 83%. Respondents considered that Canada is an important partner for the U.S. in maintaining continental security (86%), maintaining border security (85%), defending North America (85%), promoting world peace and stability (84%), and maintaining U.S. national security (83%).
Figure 25:
Importance of Canada’s partnership for the U.S. in various areas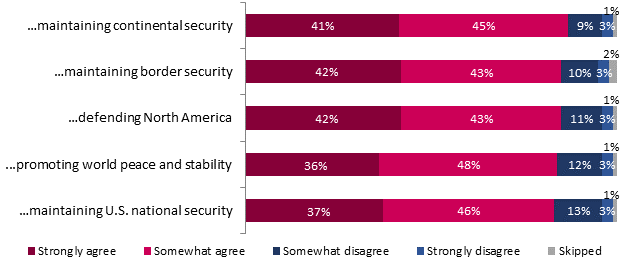
Q20. To what extent do you agree or disagree that Canada is an important partner for the United States in…? Base: All respondents (n=3,183)
Significant differences include:
· Respondents from the Northeast were significantly more likely to agree that Canada is an important partner for the U.S. in maintaining continental security (90%) and border security (90%).
· Respondents who identify as a visible minority were more likely to agree that Canada is an important partner for the U.S. in maintaining continental (88%) and border (87%) security, while those who identify as non-Hispanic white were more likely to agree that Canada is an important partner in maintaining continental security (88%), border security (88%), promoting world peace and stability (86%), and maintaining U.S. national security (85%).
· Respondents aged 55 and over and those who earn over $100,000 were significantly more likely to agree that Canada is an important partner for the U.S. in all areas.
Attitudes towards Canada’s involvement in terms of defense
The first three statements shown in Figure 26 had similar levels of overall agreement, with around eight in ten respondents agreeing either strongly or somewhat. The last statement had agreement from six in ten respondents.
Around four in ten respondents strongly agreed that the U.S and Canada need to closely coordinate their responses to global challenges presented by countries like China, Russia, and India (41%), making up the highest proportion of “strongly agree” among the four statements, while a similar proportion somewhat agreed (43%). Conversely, one in ten somewhat disagreed (11%) and a small proportion strongly disagreed (3%).
Around one fourth of respondents strongly agreed that Canada contributes sufficiently in the NORAD to defend North America (24%), and over half somewhat agreed (56%), with less than one in five disagreeing (somewhat: 15%; strongly: 2%).
One fifth of respondents agreed that Canada contributes sufficiently in defending the Arctic (20%), and six in ten somewhat agreed (58%). Around one in five disagreed (somewhat: 18%; strongly: 2%).
One fifth of respondents agreed that the northern border between the U.S. and Canada should be treated differently than the U.S.-Mexico border (21%), and four in ten (40%) somewhat agreed. Over one fourth somewhat disagreed with the statement (27%), and one in ten strongly disagreed (10%).
Figure 26: Attitudes
towards Canada’s involvement in terms of defense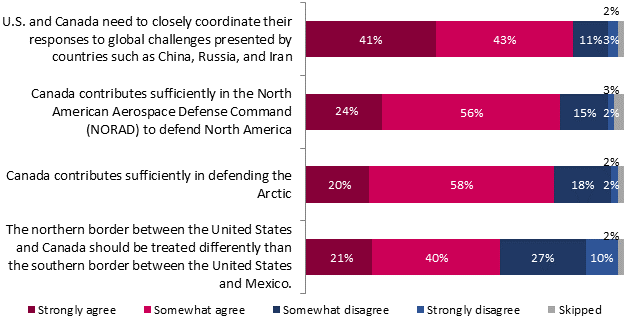
Q21. To what extent do you agree or disagree with the following statements? Base: All respondents (n=3,183)
Significant differences include:
· Respondents from the Northeast (85%) and those who were born outside of the U.S. (88%) were significantly more likely to agree that Canada contributes sufficiently in the NORAD to defend North America.
· Respondents aged 55 or older and those who earn over $100,000 were significantly more likely to agree with all statements but the last one.
· Respondents who identify as white were significantly more likely to agree that the U.S. and Canada need to closely coordinate their responses to global challenges presented by countries such as China, Russia, and Iran (88%), and also tend to agree that Canada contributes sufficiently in defending the Arctic (80%).
· Men were significantly more likely to agree that the Canada-U.S. border should be treated differently than the U.S.-Mexico border (64%).
Attitudes towards the management of the U.S.-Canada border
Respondents were asked to rate both Canada’s and the U.S.’ management of their shared border on various criteria. This section presents a comparison of the topline results between the two countries before presenting the detailed results for each country.
Ratings for each statement were very similar, as agreement levels did not differ by more than three points. Around seven in ten respondents agreed that Canada and the U.S.’ management of the border contributes to the U.S. economy (72% for Canada’s management and 69% for the U.S.’ management). Around a third agreed that Canada’s (32%) and the U.S.’ (35%) management of the border make daily travel and trade too difficult, and over one-fifth found that Canada and the U.S.’ management of the border encourage illegal immigration into the U.S. (Canada: 29%, the U.S.: 32%), contributes to crime (Canada: 28%, the U.S.: 30%), and that it poses a threat to national security (Canada: 26%, the U.S.: 28%).
Figure 27:
Attitudes towards the management of the U.S.-Canada border – Net Agree Comparison*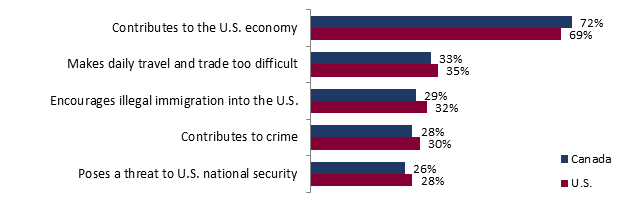
Q22A/Q22B. Thinking about the northern border between the United States and Canada, to what extent do you agree or disagree that the way the border is currently managed by Canada/the U.S.…? Base: All respondents (n=3,183)
Note: For analysis purposes, a Net Agree (Strongly + Somewhat Agree) was calculated.
Figure 28: Attitudes towards Canada’s
management of the U.S.-Canada border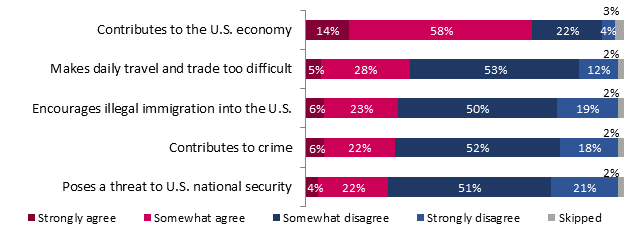 Q22A. Thinking about the northern border between the United States
and Canada, to what extent do you agree or disagree that the way the border is
currently managed by Canada…? Base: All respondents (n=3,183)
Q22A. Thinking about the northern border between the United States
and Canada, to what extent do you agree or disagree that the way the border is
currently managed by Canada…? Base: All respondents (n=3,183)
Significant differences in terms of the management of the U.S.-Canada border by Canada include:
· Respondents over 55 years old (76%), those living in the Northeast (78%), those who were born outside of the U.S. (78%) and those who earn more than $100,000 (79%) were significantly more likely to agree that the way the border is managed by Canada contributes to the U.S. economy.
· Residents from the South were significantly more likely to agree that the way the border is managed by Canada encourages illegal immigration into the U.S. (34%), contributes to crime (30%), and poses a threat to U.S. national security (29%).
Figure 29: Attitudes towards the U.S.’
management of the U.S.-Canada border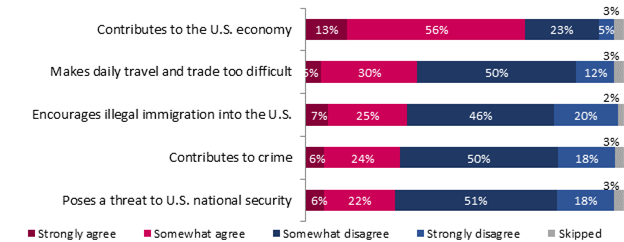
Q22B. Thinking about the northern border between the United States and Canada, to what extent do you agree or disagree that the way the border is currently managed by the U.S.…? Base: All respondents (n=3,183)
Significant differences in terms of the management of the U.S.-Canada border by the U.S. include:
· Residents from the South were significantly more likely to agree that the way the border is managed by the U.S. encourages illegal immigration into the U.S. (36%) and poses a threat to U.S. national security (32%).
· Respondents born outside of the U.S. (77%) and those who earn more than $100,000 (74%) were significantly more likely to agree that the way the border is managed by the U.S. contributes to the U.S. economy.
Perception of Canada’s natural resources development
A vast majority of respondents agreed that Canada develops its natural resources more responsibly than other countries. One in five strongly agreed (19%), and around two thirds somewhat agreed (65%). On the other hand, a little over one in ten Americans somewhat disagreed (13%), and a negligible proportion strongly disagreed (1%).
Figure 30:
Perception of Canada’s natural resources development
Q25. Canada is a major supplier of natural resources to the United States, including critical minerals, energy products, and forest products. Do you agree or disagree that Canada develops its natural resources more responsibly than other countries? Base: All respondents (n=3,183)
Significant differences include:
· Respondents 55 and over (89%) and those who earn $100,000 or more (87%) were significantly more likely to agree that Canada develops its natural resources more responsibly than other countries.
Attitudes towards importing energy from Canada
A majority of Americans support importing more energy from Canada in most situations illustrated in figure 31.
Almost nine people out of ten would support more energy imports if they supported new jobs in their area, with a third strongly supporting it (36%) and half somewhat supporting it (51%). Proportion who would support it, if it increased U.S. national security were as follows: (strongly: 40%; somewhat: 46%).
Around eight in ten would support more energy imports from Canada if it meant reducing imports from other countries like Russia or Saudi Arabia, with an equal split between strong (42%) and moderate (41%) support. The same proportion would support more energy imports from Canada, if it helped the U.S. reach its climate goals quicker (strongly: 38%; somewhat: 43%). Around three out of four would support more energy imports from Canada, if it required new infrastructure built in the U.S., with one fourth strongly supporting it (26%) and around half somewhat supporting it (48%).
However, less than half of respondents would support these imports, if they produced more greenhouse gas emissions than importing from other countries like Russia or Saudi Arabia, with a little over one in ten strongly supporting them (14%), and a third somewhat supporting them (34%).
Figure 31:
Attitudes towards importing energy from Canada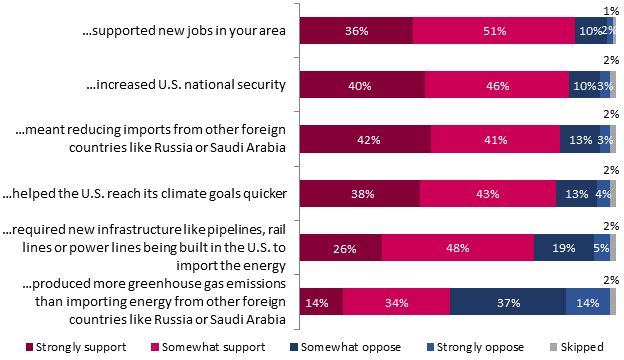 Q23. To what extent would you support or oppose importing more
energy from Canada if it…? Base: All respondents (n=3,183)
Q23. To what extent would you support or oppose importing more
energy from Canada if it…? Base: All respondents (n=3,183)
Significant differences regarding support levels of increased energy imports from Canada include:
· Respondents from the West of the U.S. were significantly more likely to support importing more energy from Canada, if it supported new jobs in their area (91%) and if it helped the U.S. reach its climate goals quicker (85%).
· Respondents from the Northeast, along with those who earn over $100,000 were significantly more likely to support more energy imports from Canada in all situations except in the last two situations (if it required new infrastructure or if it produced more greenhouse gas emissions).
· Men were significantly more likely to support more imports: if they support new jobs in their area (90%), if they meant reducing imports from other foreign countries (86%), if they required new infrastructure (78%), and if they produced more greenhouse gas emissions (48%).
· Respondents aged 55 and over were significantly more likely to support more energy imports from Canada in all situations except in the last situation (if it produced more greenhouse gas emissions).
· Respondents who identify as a visible minority were more likely to support more energy imports from Canada if it helped the U.S. reach its climate goals quicker (86%).
· Respondents who identify as white were significantly more likely to support more Canadian energy imports: if it supported new jobs in their area (89%), if it increased U.S. national security (89%), and if it meant reducing imports from countries like Russia or Saudi Arabia (86%).
· Those who support building more energy infrastructure between Canada and the U.S. in response to the U.S.’ increasing energy needs were more likely to support importing more energy from Canada, if it required new infrastructure (83%). Those who support building more pipelines between the U.S. and Canada were also more likely to support more imports, if they required new infrastructure (90%).
Solutions to the U.S.’ increasing energy demand
When exploring solutions for the U.S.’ increasing energy demand, the majority of Americans supported all four solutions indicated in figure 32. But overall, vague terms like “energy infrastructure” and “energy imports” are preferred to “pipelines” and “oil and gas”. Over eight in ten supported building more energy infrastructure between the two countries, with a third strongly agreeing (32%) and half somewhat agreeing (52%). Support for increasing energy imports from Canada were as follows: (strongly support: 27%; somewhat support: 56%). Over three out of four supported increasing oil and gas imports from Canada (26% strongly agreed and 52% somewhat agreed), and over seven in ten supported building more pipelines between the U.S. and Canada (27% strongly agreed and 45% somewhat agreed).
Figure 32: Solutions
to the U.S.’ increasing energy demand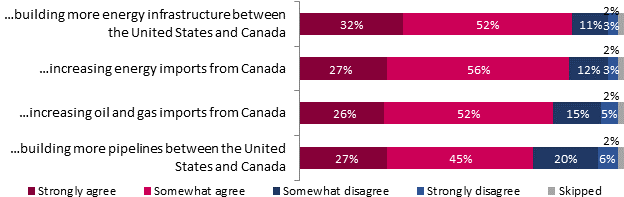
Q24. As the demand for energy in the U.S. is increasing every year, do you support or oppose…? Base: All respondents (n=3,183)
Significant differences regarding solutions to the U.S.’ increasing energy demand include:
· Respondents from the Northeast were significantly more likely to support building more energy infrastructure (88%) and increasing energy imports from Canada (87%).
· Men were more likely to support building more energy infrastructure (87%).
· Respondents who identify as visible minority and white non-Hispanic were more likely to support increasing energy imports from Canada (88% and 84%, respectively). However, those who identified as white non-Hispanic also supported building more infrastructure (86%).
· Respondents aged 55 and older were more likely to support all solutions and phrasings.
· Respondents who earn $100,000 or more were significantly more likely to support all solutions/phrasings except for the last one (building more pipelines).
Racialized communities
A majority of Americans, around seven in ten, agreed that the U.S. could learn from Canada about working with racialized communities: one in five strongly agreed with the statement (19%), and half somewhat agreed (51%). Less than one in five somewhat disagreed (17%), and one in ten strongly disagreed (10%).
Figure 33: Racialized communities Q28. To what extent do you agree or disagree that the United States
could learn from Canada about working with racialized communities? Base: All
respondents (n=3,183)
Q28. To what extent do you agree or disagree that the United States
could learn from Canada about working with racialized communities? Base: All
respondents (n=3,183)
The following subgroups were significantly more likely to agree that the U.S. could learn from Canada about working with racialized communities:
· Respondents who identify as female (74%)
· Respondents aged 35 to 54 (73%)
· Respondents living in metropolitan areas (71%)
· Respondents born outside of the U.S. (84%)
· Respondents who identify as a visible minority (83%)
MaxDiff analysis – Argument evaluation
The results of the Max Diff analysis method are presented in the form of scores, whose values can range from 0 to 100. Each score actually represents the relative weight (importance) given by respondents to each item.
The higher an item's score, the more important it is to the citizens. In addition, a score twice as high for an element means that it is considered twice as important as the other by the participants (e.g., an item that obtains a score of 20 is twice as important to the citizens of the city as an item that obtains a score of 10).
The first one aimed at determining the key arguments that resonate with U.S. citizens regarding collaboration between the United States and Canada. Respondents had to choose the most and least convincing arguments among a list of 5 statements that were randomly selected from a pool of 6 arguments. This step was repeated 6 times to obtain the importance weights of each argument.
Two MaxDiff analyses were conducted as part of the survey. The first one aimed at determining the key arguments that resonate with U.S. citizens regarding collaboration between the U.S. and Canada.
The figure below presents the overall results of the first MaxDiff analysis. Four out of the six arguments had similar scores: defence cooperation, jobs, climate change, and energy. Diversity and inclusion ranked fourth and was considered about half as important as the first three arguments. Unique product supplies scored the lowest, almost half as important as diversity and inclusion.
Figure 34: Argument evaluation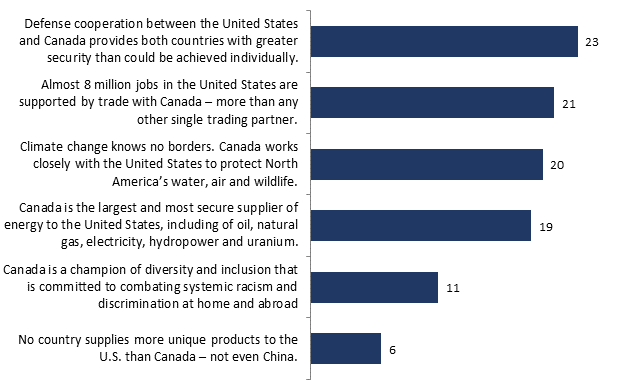
Q12. There are 6 questions total in this section. While these questions may seem repetitive, please review each one carefully as there are important differences in the statements. For each of the questions in the next section you will see 5 statements. In each question, select the statements that are the most and the least convincing to you. Below, you will see several arguments. Please indicate which one convinces you the most that the United States and Canada should have a closer relationship. Select one issue in each column. Base: All respondents (n=3,183)
The figures below present the MaxDiff results by gender and age. Because there were no relevant differences between U.S. regions, regional breakdown is not presented.
Note: Results marked with a “-“ or a “+” are significantly lower or higher than their complement. Arguments are ranked by decreasing overall importance.
Figure 35: Argument evaluation – Detailed
results by gender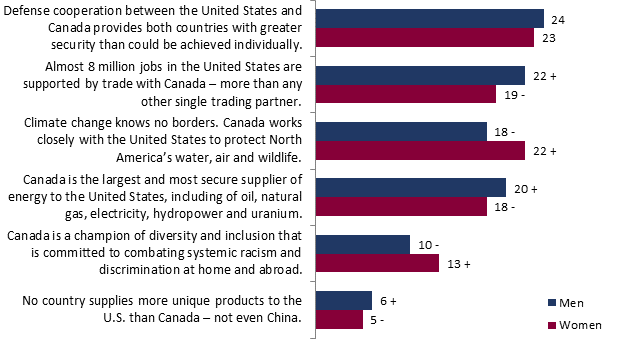
Women gave more importance to the climate change and diversity and inclusion arguments, while men gave more importance to the jobs, energy and product supply arguments.
Among respondents who identify as female, defence cooperation was almost twice as important as diversity and inclusion. Climate change ranked second and was more important than jobs. Unique products ranked last, with an importance score equal to a fifth of that of defense cooperation. On the other hand, men gave more importance to jobs than climate change, and diversity and inclusion was half as important as energy, while unique products ranked last with an importance score equal to a fourth of that of defence cooperation.
Figure 36: Argument evaluation – Detailed
results by age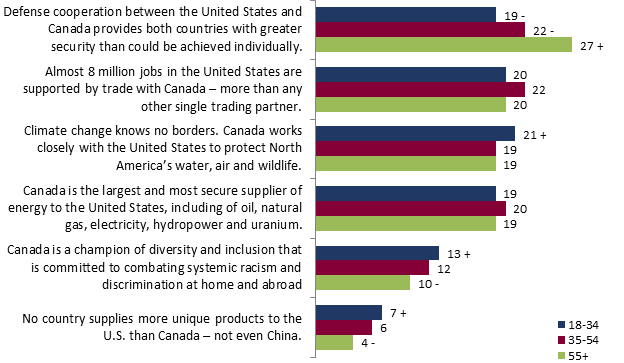
Regarding age differences, respondents aged 55 and over gave more importance to defence cooperation than younger respondents. Conversely, those aged between 18 and 34 gave more importance to climate change and to diversity and inclusion.
Among respondents aged 18 to 34, climate change obtained the highest importance score, jobs came in second, and defence cooperation and energy were tied with a score of 19. Climate change was three times as important as unique products. Those aged 35 to 54 gave the highest importance to defence cooperation and jobs, followed by energy. Diversity and inclusion was almost half as important as defence and jobs but double the importance of unique products.
MaxDiff analysis – Message evaluation
A second MaxDiff was conducted to determine the importance of several messages pertaining to U.S.-Canada collaboration and conflict resolution. Respondents had to choose the most and least convincing arguments among a list of 4 statements that were randomly selected from a pool of 5 messages. This step was repeated 5 times to obtain the importance weights of each argument.
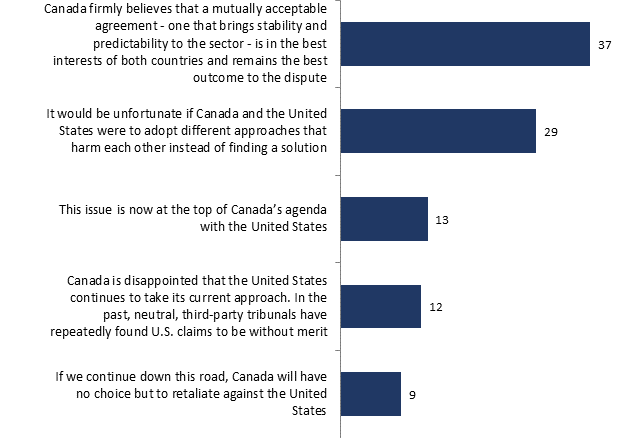
Figure 37 below presents the overall importance rates of each tested message. Messages that were more positive in nature ranked far higher than those that mentioned negative emotions or consequences.
The argument for a mutually acceptable agreement was almost three times as important as “The issue is now at the top of Canada’s agenda with the United States” and “Canada is disappointed that the United States continues to take its current approach. In the past, neutral, third-party tribunals have repeatedly found U.S. claims to be without merit”, and four times as important as “If we continue down this road, Canada will have no choice but to retaliate against the United States”. The argument mentioning it would be unfortunate if the countries adopt harmful approaches was three times as important as the last one (retaliation).
Figure 37: Message evaluation
 Q13. For each of the questions in the next
section you will see 4 arguments. In each question, select the arguments that
are the most and the least convincing to you. There are 5 questions total in this
section. While these questions may seem repetitive, please review each one
carefully as there are important differences in the statements. Sometimes the United States and Canada disagree about a course of
action and must put pressure on one another to find a solution.Below, you will
see several arguments displayed. Please indicate which one is most likely to
spark your interest in reaching a solution between Canada and the United
States. Select one issue in each column. Base: All
respondents (n=3,183)
Q13. For each of the questions in the next
section you will see 4 arguments. In each question, select the arguments that
are the most and the least convincing to you. There are 5 questions total in this
section. While these questions may seem repetitive, please review each one
carefully as there are important differences in the statements. Sometimes the United States and Canada disagree about a course of
action and must put pressure on one another to find a solution.Below, you will
see several arguments displayed. Please indicate which one is most likely to
spark your interest in reaching a solution between Canada and the United
States. Select one issue in each column. Base: All
respondents (n=3,183)
The figure below presents the results by age. Because there were no relevant differences between U.S. regions, regional breakdown is not presented.
Note: Results marked with a “- “or a “+” are significantly lower or higher than their complement. Messages are ranked by decreasing overall importance.
Figure 38: Message evaluation – Results by
age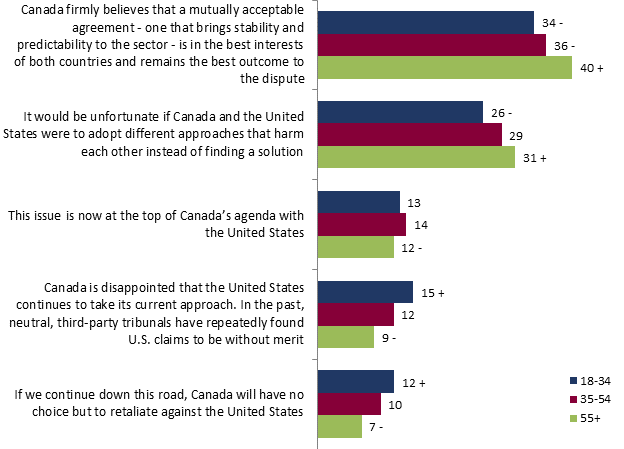
Respondents aged 55 and over gave more importance to the first and second message, while those aged between 18 and 34 gave more importance to the last and second last messages. Importance score ranking was mostly similar across all age groups despite these differences.
Respondents between the ages of 18 and 34 gave the bilateral agreement argument over 2.5 as much importance as for the issue being on Canada’s agenda. The latter was also half as important as the argument for harmful approaches.
Among those aged between 35 and 54, the mutual agreement argument was three times as important as that of Canada being disappointed in the U.S.’ approach. The argument mentioning mutually harmful approaches was three times as important as that of retaliation.
Those aged 55 and over gave four times as much importance to the mutually acceptable agreement argument than that of Canada being disappointed in the U.S.’ approach. The argument of mutually harmful approaches was almost three times as important as that of the issue being on Canada’s agenda.
Conclusion
In light of the conducted research, it appears that Canada benefits from a positive reputation among U.S. respondents, as it is considered a friend by a quasi-majority, and a vast majority considered it an essential partner for the country. They also had a great deal of trust in Canada when it comes to collaborating with the U.S. on various issues. The respondents considered the U.S. and Canada to be good neighbours and allies, more than just friends or partners.
Although many respondents believe that things in Canada are headed in the right direction, a large number of respondents are unable to tell how things are going in Canada. Nevertheless, their opinion has remained stable in the past 5 years . Respondents had a positive view of Canada's approach on various issues, as most agreed that Canada develops its natural resources more responsibly than other countries. Most respondents also agreed that their country could learn from Canada in terms of working with racialized communities.
Respondents were also widely in favor of Buy America. Most of them supported it even if it were opposed by large businesses, industry groups or foreign governments. It should be noted, however, that support for Buy America dropped drastically, if it results in local job losses, slows the delivery of government services, or if there is a substantial additional cost to be borne by the state government. Interestingly, the majority of respondents would support the inclusion of Canada and allied countries in Buy America.
However, U.S. interests trump collaboration efforts between the two countries, as respondents are in favor of periodical tariffs on imports from Canada, if they supported local jobs. Only a minority would support them, if they caused tariffs on exported American goods. Respondents were more divided about the need for the US to impose tariffs on imports from Canada to protect US national security.
The majority of respondents considered that Canada is the U.S.' closest global partner on the environment, trade, border measures, energy, advancing global values, and security and defence. They also agreed that the two countries must work with each other on many collaboration areas: environmental resources management, terrorist threat prevention, trade, border issues, cyber threats, and the fight on climate change. While respondents overwhelmingly agreed that Canada is the United States' most secure and reliable partner, few saw increasing trade between the two countries as a priority. Gun violence, health care, crime, climate change, and misinformation in the news were seen as more pressing priorities.
In terms of defence specifically, support levels for U.S.-Canada collaboration were also high : a vast majority support collaboration to maintain continental and border security, and similar proportions agreed that the two countries need to closely coordinate their responses to global challenges presented by countries such as China, Russia, and Iran.
In the energy sector, a majority of. U.S. residents supported more energy imports from Canada in most cases, and even if it required new infrastructure. On the other hand, less than half would support energy imports, if they resulted in more greenhouse gas emissions.
Arguments with respect to U.S.-Canadian cooperation in defence and security, jobs supported by trade between the two countries, and protecting water, air and wildlife were the most likely to persuade Americans to strengthen relations with Canada. Conversely, arguments to the effect that Canada is a champion of diversity and inclusion, and that Canada is the principal supplier of products to the United States, were much less likely to encourage Americans to strengthen relations between the two countries.
When Canada and the U.S. disagree on a course of action on various issues, the messages that had a more diplomatic tone were more likely to spark the interest of the respondents to find a solution. Messages that had a threat of retaliation or that indicated recourse to third-party tribunals were the least effective in eliciting a response from respondents.
Appendix
A.1 Quantitative Methodology
Quantitative research was conducted through online surveys, using Computer Aided Web Interviewing (CAWI) technology.
As a CRIC Member, Leger adheres to the most stringent guidelines for quantitative research. The survey was conducted in accordance with Government of Canada requirements for quantitative research, including the Standards of the Conduct of Government of Canada Public Opinion Research—Series D—Quantitative Research.
Respondents were assured of the voluntary, confidential and anonymous nature of this research. As with all research conducted by Leger, all information that could allow for the identification of participants was removed from the data, in accordance with the Privacy Act.
The questionnaire is available in Appendix A2.
A.1.1 Sampling Procedure
Computer Aided Web Interviewing (CAWI)
Leger contracted NORC to conduct a panel-based Internet survey with a sample of adult Americans. A total of 3,183 respondents participated in the survey. The exact distribution is presented in the following section. Participant selection was done randomly from NORC’s AmeriSpeak® online panel.
Funded and operated by NORC at the University of Chicago, AmeriSpeak® is a probability-based panel designed to be representative of the US household population. Randomly selected US households are sampled using area probability and address-based sampling, with a known, non-zero probability of selection from the NORC National Sample Frame. These sampled households are then contacted by US mail, telephone, and field interviewers (face to face). The panel provides sample coverage of approximately 97% of the U.S. household population. Those excluded from the sample include people with P.O. Box only addresses, some addresses not listed in the USPS Delivery Sequence File, and some newly constructed dwellings. While most AmeriSpeak® households participate in surveys by web, non-internet households can participate in AmeriSpeak® surveys by telephone. Households without conventional internet access but having web access via smartphones are allowed to participate in AmeriSpeak® surveys by web. AmeriSpeak® panelists participate in NORC studies or studies conducted by NORC on behalf of governmental agencies, academic researchers, and media and commercial organizations.
A.1.2 Data Collection
A first pretest of 44 interviews was completed on February 3rd. After a round of changes to the questionnaire, fieldwork for the survey was conducted from March 2 to March 27, 2023. A second pretest of 36 interviews was completed on March 2, 2023. The participation rate for the survey was 22.7%.
To achieve data reliability in all subgroups, a total sample of 3,183 Americans 18 and older who can speak English or Spanish were surveyed, in all regions of the country.
Respondents were selected randomly from the NORC probability panel. The margin of error cannot be calculated when using a panel. Respondents for this survey were selected from among those who have volunteered to participate/registered to participate in online surveys with NORC. The data have been weighted to reflect the demographic composition of the target population. NORC weighted the results of this survey by age, gender, race/ethnicity, and education status within each region of the country.
The following table details the regional distribution of respondents. The sample attempted to replicate as closely as possible the actual distribution of the American population.
Table A.1 Regional Distribution of Respondents
|
Region |
Number of respondents |
|
Northeast |
435 |
|
Midwest |
894 |
|
South |
1,108 |
|
West |
746 |
|
Total |
3,183 |
A.1.3 Participation Rate
The survey completion rate for this study is 22.7%.
The survey completion rate is the percent of sample members who completed the survey interview. 13,999 panelists were invited to the survey, and 3,183 completed the survey. Survey completes exclude any cases removed due to data quality concerns.
A.1.4 Unweighted and Weighted Samples
A basic comparison of the unweighted and weighted sample sizes was conducted to identify any potential non-response bias that could be introduced by lower response rates among specific demographic subgroups (see tables below).
The table below presents the geographic distribution of respondents, before and after weighting. Weighting slightly increased the proportion of the Northeast and the South and slightly decreased that of the Midwest.
Table A.2 Unweighted and Weighted Sample Distribution by Region
|
Region |
Unweighted |
Weighted |
|
435 |
556 |
|
|
Midwest |
894 |
658 |
|
South |
1,108 |
1,217 |
|
West |
746 |
752 |
|
Total |
3,183 |
3,183 |
The following tables present the demographic distribution of respondents, according to gender and age.
First, regarding gender, we can see that weighting has adjusted slightly the proportion of male and female. The adjustments made by weighting are minor, and in no way can we believe that the small differences observed in the effective samples could have introduced a non-response bias for any of these sample subgroups.
Table A.3 Unweighted and Weighted Sample Distribution by Gender
|
Gender |
Unweighted |
Weighted |
|
Male |
1,539 |
1,501 |
|
Female |
1,599 |
1,623 |
|
Non-binary |
42 |
56 |
|
Total |
3,183 |
3,183 |
* The complement corresponds to "other" and "refusal".
Regarding age distribution, the weighting process has corrected some minor discrepancies. The actual distribution of the sample generally follows the distribution of age groups in the actual population. In this case, it is unlikely that the observed distributions introduce a non-response bias for a particular age group. Because the differences were so small, weighting allowed the weights to be corrected without further manipulation.
Table A.4 Unweighted and Weighted Sample Distribution by Age Group
|
Age group |
Unweighted |
Weighted |
|
Between 18 and 29 |
430 |
629 |
|
Between 30 and 44 |
908 |
830 |
|
Between 45 and 59 |
731 |
760 |
|
60 and over |
1,114 |
964 |
|
Total |
3,183 |
3,183 |
There is no evidence from the data that having achieved a different age or gender distribution prior to weighting would have significantly changed the results for this study. The relatively small weight factors (see section below) and differences in responses between various subgroups suggest that data quality was not affected. The weight that was applied corrected the initial imbalance for data analysis purposes and no further manipulations were necessary.
The following table presents the unweighted and weighted distribution of respondents according to their education status. Again, some minor discrepancies were corrected through the weighting process. Namely, the weights of those with some college/associate degree or a bachelor’s degree were reduced in favour of those with an education level lower than high school or high school graduate or equivalent.
Table A.5 Unweighted and Weighted Sample Distribution by Education Status
|
Education status |
Unweighted |
Weighted |
|
Less than high school |
163 |
301 |
|
High school graduate or equivalent |
551 |
927 |
|
Some college/associate degree |
1,249 |
844 |
|
Bachelor’s degree |
724 |
668 |
|
Post grad study/professional degree |
496 |
443 |
|
Total |
3,183 |
3,183 |
The following table shows the weighted and unweighted estimates for key demographics and compares them to population benchmarks.
Table A6. Weight Factors by Profile
|
Demographic category |
Subcategory |
Unweighted (%) |
Weighted (%) |
Benchmark (%) |
|
Age |
18 - 34 |
24.0 |
28.7 |
28.8 |
|
35 - 49 |
25.8 |
24.6 |
24.5 |
|
|
50 - 64 |
26.0 |
24.7 |
24.6 |
|
|
65 Plus |
24.2 |
22.0 |
22.0 |
|
|
Race/Ethnicity |
Non-Hispanic White |
67.5 |
62.2 |
62.1 |
|
Non-Hispanic Black |
10.7 |
11.9 |
12.0 |
|
|
Hispanic |
15.0 |
17.2 |
17.2 |
|
|
Non-Hispanic Asian/Pacific Islander |
2.9 |
5.5 |
6.6 |
|
|
Non-Hispanic Others |
3.7 |
3.2 |
2.2 |
|
|
Education status |
High School |
5.1 |
9.4 |
9.6 |
|
High School Equivalent |
17.3 |
29.1 |
29.2 |
|
|
Some College/Associate Degree |
39.2 |
26.5 |
26.4 |
|
|
Bachelor's Degree |
22.7 |
21.0 |
22.1 |
|
|
Graduate Degree |
15.6 |
13.9 |
12.7 |
|
|
Gender |
Male |
50.0 |
48.8 |
48.8 |
|
Female |
50.0 |
51.2 |
51.2 |
A.1.5 Regional grouping
For analysis purposed, states were grouped into four categories according to the U.S. Census Bureau: Midwest, West, South, and Northeast. The following table details the distribution of the states among the four regions.
Table A7. U.S. Regions
|
Northeast |
|
|
Connecticut (09) Maine (23) Massachusetts (25) New Hampshire (33) Rhode Island (44) |
Vermont (50) New Jersey (34) New York (36) Pennsylvania (42) |
|
Midwest |
|
|
Indiana (18) Illinois (17) Michigan (26) Ohio ( 39) Wisconsin (55) Iowa (19) |
Nebraska (31) Kansas (20) North Dakota (38) Minnesota (27) South Dakota (46) Missouri (29) |
|
South |
|
|
Delaware (10) District of Columbia (11) Florida (12) Georgia (13) Maryland (24) North Carolina (37) South Carolina (45) Virginia (51) West Virginia (54) |
Alabama (01) Kentucky (21) Mississippi (28) Tennessee (47) Arkansas (05) Louisiana (22) Oklahoma (40) Texas (48) |
|
West |
|
|
Arizona ( 04) Colorado (08) Idaho (16) New Mexico (35) Montana (30) Utah (49) Nevada (32) |
Wyoming (56) Alaska (02) California (06) Hawaii (15) Oregon (41) Washington (53) |
A.2 Survey Questionnaire
Thank you for agreeing to participate in our new AmeriSpeak survey!
This survey is about social issues.
Esta encuesta trata de asuntos sociales.
[DISPLAY_INTRODUCTION]
AmeriSpeak has been hired to administer this survey on a public opinion matter. The survey takes about 15 minutes to complete, and your participation is voluntary and confidential. Please note to further protect the privacy of participants in this study, NORC has obtained a Certificate of Confidentiality. This information is available to AmeriSpeak panelists at: https://www.amerispeak.org/privacy.
AmeriSpeak ha sido contratada para administrar esta encuesta sobre un tema de opinión pública. La encuesta dura unos 15 minutos y su participación es voluntaria y confidencial. Para proteger aún más la privacidad de los participantes en este estudio, NORC ha obtenido un Certificado de Confidencialidad. Esta información está a disposición de los panelistas de AmeriSpeak en: https://www.amerispeak.org/privacy.
[SP]
Q1.
Thinking about the phrase <u>‘North America,’<u> which of the following best describes what you understand that to mean?
Cuando piensa en la palabra <u>‘Norteamérica’,<u> ¿cuál de las siguientes opciones describe mejor lo que usted entiende que significa?
RESPONSE OPTIONS, RANDOMIZE:
1. The United States
2. The United States and Canada
3. The United States, Canada and Mexico
4. The United States, Canada, Mexico, and some other countries in Latin America and the Caribbean
- Estados Unidos
- Estados Unidos y Canadá
- Estados Unidos, Canadá y México
- Estados Unidos, Canadá, México y algunos otros países de América Latina y el Caribe
[GRID;SP]
Q2.
To what extent do you agree or disagree with the following statements?
¿En qué medida está usted de acuerdo o en desacuerdo con las siguientes afirmaciones?
GRID ITEMS, RANDOMIZE:
- Canada is the U.S.’ best friend and ally.
- Mexico is the U.S.’ best friend and ally.
- Canada and Mexico are the U.S.’ best friends.
- Canada is an essential partner for the U.S.
- Mexico is an essential partner for the U.S.
- Canada and Mexico are essential partners for the U.S.
- Canadá es el mejor amigo y aliado de Estados Unidos.
- México es el mejor amigo y aliado de Estados Unidos.
- Canadá y México son los mejores amigos de Estados Unidos.
- Canadá es un socio esencial para Estados Unidos.
- México es un socio esencial para Estados Unidos.
- Canadá y México son socios esenciales para Estados Unidos.
RESPONSE OPTIONS:
- Strongly agree
- Somewhat agree
- Somewhat disagree
- Strongly disagree
- Estoy totalmente de acuerdo
- Estoy algo de acuerdo
- Estoy algo en desacuerdo
- Estoy totalmente en desacuerdo
Q3.
When collaborating with its neighbors, Canada and Mexico, on shared interests like trade, the environment, energy and defense, which of the following approaches should the United States prioritize when working on these issues?
Cuando se trata de colaborar con sus vecinos, Canadá y México, en intereses compartidos como el comercio, el medio ambiente, la energía y la defensa, ¿cuál de los siguientes enfoques debería priorizar Estados Unidos al trabajar en estos asuntos?
RESPONSE OPTIONS, RANDOMIZE:
1. U.S.-Canada approach.
2. U.S.-Mexico approach.
3. North American approach.
4. Continental approach.
5. Hemispheric approach.
6. U.S.-Canada-Mexico approach.
- Enfoque Estados Unidos y Canadá.
- Enfoque Estados Unidos y México.
- Enfoque norteamericano.
- Enfoque continental.
- Enfoque hemisférico.
- Enfoque Estados Unidos-Canadá-México.
Q4.
How likely would you support the United States having a closer trading relationship with another country if its…
¿Qué tan probable sería que usted apoye el que Estados Unidos tuviera una relación comercial más estrecha con otro país si…
GRID ITEMS, RANDOMIZE:
- …workers were part of the same labor unions as American workers?
- …goods came from closer to the U.S. instead of from far away or overseas?
- …goods were better for the environment than another trading partner?
- …goods were the most competitively priced on the global market?
- ...los trabajadores estuvieran afiliados a los mismos sindicatos que los estadounidenses?
- ...los productos vinieran de más cerca de EE. UU. en vez de venir de lejos o del extranjero?
- ...los productos fueran mejores para el medio ambiente que los de otros socios comerciales?
- ...los productos tuvieran los precios más competitivos del mercado mundial?
RESPONSE OPTIONS:
- Much more likely
- Somewhat more likely
- Somewhat less likely
- Much less likely
- Mucho más probable
- Algo más probable
- Algo menos probable
- Mucho menos probable
[SP]
Q5.
Many U.S. state governments only give contracts to companies that make their products in that government’s home state. These are often termed <u>Buy America</u>. Do you support or oppose Buy America?
Muchos gobiernos estatales de EE. UU. solo conceden contratos a empresas que fabrican sus productos en el estado de origen de dicho gobierno. A menudo a esto se le conoce como <u>Buy America</u> (Cómprele a Estados Unidos). ¿Usted apoya o se opone a Buy America?
RESPONSE OPTIONS:
- Strongly support
- Somewhat support
- Somewhat oppose
- Strongly oppose
- Apoyo totalmente
- Algo en apoyo
- Me opongo algo
- Me opongo totalmente
Q6.
Thinking about expanding Buy America to include other countries, to what extent do you support or oppose the following in your state:
Pensando en la ampliación de la política de Cómprele a Estados Unidos para incluir a otros países, ¿en qué medida apoya o se opone usted en su estado a lo siguiente:
GRID ITEMS, RANDOMIZE:
- Canada
- Mexico
- Allies
- Other countries[ANCHOR]
- Canadá
- Mexico
- Aliados
- Otros países[ANCHOR]
RESPONSE OPTIONS:
- Strongly support
- Somewhat support
- Somewhat oppose
- Strongly oppose
- Apoyo totalmente
- Algo en apoyo
- Me opongo algo
- Me opongo totalmente
Q7A.
Would you say things in Canada today are:
¿Diría usted que las cosas en Canadá hoy van
RESPONSE OPTIONS:
- Generally headed in the right direction
- Off on the wrong track
- Not sure
- Por buen camino generalmente
- Por mal camino
- No estoy seguro/a
[SP]
Q7B.
Compared to 5 years ago has your opinion of Canada:
En comparación con hace 5 años, ¿su opinión de Canadá ha:
RESPONSE OPTIONS:
- Improved
- Stayed the same
- Gotten worse
- Don’t know
- Mejorado
- No ha cambiado
- Empeorado
- No estoy seguro/a
[GRID 5,4; SP]
Q8.
To what extent do you support Buy America if it:
En qué medida apoya Cómprele a Estados Unidos si:
GRID ITEMS, RANDOMIZE:
- costs your state government a lot more money?
- slows down state government services?
- contributes to climate change?
- causes job losses in your local community?
- contributes to job growth in your local community but causes job losses in other parts of the United States?
- is opposed by large businesses or industry groups?
- is opposed by organized labor or union groups?
- is opposed by a foreign government?
- causes foreign governments to retaliate by not buying American goods?
- le cueste mucho más dinero a su gobierno estatal?
- desacelere la prestación de servicios del gobierno estatal?
- contribuya al cambio climático?
- provoque la pérdida de puestos de trabajo en su comunidad?
- contribuya al crecimiento del empleo en su comunidad local, pero cause pérdidas de puestos de trabajo en otras partes de Estados Unidos?
- se enfrente a la oposición de grandes empresas o grupos industriales?
- se enfrente a la oposición de organizaciones sindicales?
- se enfrente a la oposición de un gobierno extranjero?
- provoque que los gobiernos extranjeros tomen represalias y no compren productos estadounidenses?
RESPONSE OPTIONS:
- Strongly support
- Somewhat support
- Somewhat oppose
- Strongly oppose
- Apoyo totalmente
- Algo de apoyo
- Me opongo algo
- Me opongo totalmente
Q9.
Are you more or less likely to respect another country’s different position on an issue if that country shares the same values with the U.S.?
¿Es más o menos probable que usted respete la postura diferente de otro país sobre un tema si ese país comparte los mismos valores con EE. UU.?
RESPONSE OPTIONS:
- Much more likely
- Somewhat more likely
- Somewhat less likely
- Much less likely
- Mucho más probable
- Algo más probable
- Algo menos probable
- Mucho menos probable
Q10.
Which of the following <u>best</u> describes the relationship between the United States and Canada?
¿Cuál de las siguientes opciones describe <u>mejor</u> la relación entre Estados Unidos y Canadá?
[SPACE]
They are…
Son...
RESPONSE OPTIONS:
1. …friends
2. …good neighbors
3. …allies
4. …partners
5. ...each other's customers
6. …competitors
7. …equals on the world stage
- …amigos
- ...buenos vecinos
- ...aliados
- ...socios
- ...clientes mutuos
- ...competidores
- ...iguales en el escenario mundial
[GRID; SP]
Q11.
Do you agree or disagree that Canada is the United States’ closest global partner on…
¿Está usted de acuerdo o en desacuerdo con que Canadá sea el socio mundial más cercano de Estados Unidos en…
GRID ITEMS, RANDOMIZE:
- …trade?
- …energy?
- …security and defense?
- …the environment?
- …advancing global values?
- …border measures?
- ...comercio?
- ...energía?
- ...seguridad y defensa?
- ...medio ambiente?
- ...promoción de valores globales?
- ...medidas fronterizas?
RESPONSE OPTIONS:
- Strongly agree
- Somewhat agree
- Somewhat disagree
- Strongly disagree
- Totalmente de acuerdo
- Algo de acuerdo
- Algo en desacuerdo
- Totalmente en desacuerdo
[DISPLAY – IntroMaxdiff_Q12]
There are 6 questions total in this section. While these questions may seem repetitive, please review each one carefully as there are important differences in the statements.
Hay 6 preguntas en total en esta sección. Aunque estas preguntas puedan parecer repetitivas, le pedimos que revise cada una de ellas cuidadosamente ya que hay diferencias importantes en las afirmaciones.
[SPACE]
For each of the questions in the next section you will see 5 statements. In each question, select the statements that are the <u>most </u> and the <u>least<u>convincing to you.
En cada una de las preguntas de la siguiente sección verá 5 afirmaciones. En cada pregunta, seleccione las afirmaciones que le resulten la <u>más </u> y la <u>menos<u>convincente.
MAX-DIFF
MAXDIFF DESIGN – use 12968-011_2022 Canada-U.S. POR_MaxDiff Design_Q12.xlsx
6 components in maxdiff
50 VERSIONS – Stats will preload P_MAXDIFFQ12; however, CS team needs to have a testing-only page
Each version has 6sets (questions Q12A-Q12F)
Each of the 6 sets will insert 5 of the 6 components below.
NOTE: THE BELOW IS AN EXAMPLE OF HOW THE MAXDIFF QUESTION SHOULD LOOK ON SCREEN
[GRID, SP VERTICAL; prompt twice for each Q12_Most/Q12_Least]
[custom prompt if “most convincing” column is left blank:
“We would really like your answer for the <u>most</u> convincing issue argument.”]
“Nos gustaría conocer su respuesta sobre el argumento <u>más</u> convincente.”]
[custom prompt if “least convincing” column is left blank:
“We would really like your answer for the <u>least</u> convincing issue argument.”]
“Nos gustaría conocer su respuesta sobre el argumento <u>menos</u> convincente.”]
[custom prompt if both columns are left blank: “:
“We would really like your answer to this question.”]
“Nos gustaría que respondiera esta pregunta.”]
[custom prompt if R select same statement for most and least:
“Please select different statements for Most and Least.
“Seleccione diferentes afirmaciones para las opciones de más y menos.”
FULL LIST OF 6 COMPONENTS FOR MAXDIFF:
- Almost 8 million jobs in the United States are supported by trade with Canada – more than any other single trading partner.
- No country supplies more unique products to the U.S. than Canada – not even China.
- Canada is the largest and most secure supplier of energy to the United States, including of oil, natural gas, electricity, hydropower and uranium.
- Defense cooperation between the United States and Canada provides both countries with greater security than could be achieved individually.
- Climate change knows no borders. Canada works closely with the United States to protect North America’s water, air and wildlife.
- Canada is a champion of diversity and inclusion that is committed to combating systemic racism and discrimination at home and abroad.
- Casi 8 millones de empleos en Estados Unidos se sustentan en el comercio con Canadá, más que con cualquier otro socio comercial.
- Ningún país suministra más productos exclusivos a Estados Unidos que Canadá, ni siquiera China.
- Canadá es el mayor y más seguro proveedor de energía a Estados Unidos, incluido petróleo, gas natural, electricidad, energía hidroeléctrica y uranio.
- La cooperación en materia de defensa entre Estados Unidos y Canadá proporciona a ambos países una seguridad mayor de la que podrían alcanzar por separado.
- El cambio climático no conoce fronteras. Canadá colabora estrechamente con Estados Unidos para proteger el agua, el aire y la fauna de Norteamérica.
- Canadá es un campeón de la diversidad y la inclusión que tiene el compromiso de combatir el racismo sistémico y la discriminación en su país y en el extranjero.
Q12A.
Below, you will see several arguments.
A continuación, verá varios argumentos.
[SPACE]
Please indicate which one convinces you the most that the United States and Canada should have a closer relationship.
Indique cuál es el más convincente para usted en cuanto a que Estados Unidos y Canadá deberían tener una relación más estrecha.
[SPACE]
[CAWI – remove bold]
<i>Screen [PIPE IN NUMBER OF THE CURRENT SET ITERATION] of 6
<i>Pantalla [PIPE IN NUMBER OF THE CURRENT SET ITERATION] de 6
[SPACE]
Select one issue in <u>each</u> column. </i>
Seleccione una opción en <u>cada</u> columna. </i>
|
Q12A_Most Most convincing |
NUMBER OF ITEMS 5 Which argument is <u>most</u> convincing and which statement is <u>least</u> convincing? |
Q12A_Least Least convincing |
|
o |
Item 1 |
O |
|
o |
Item 2 |
O |
|
o |
Item 3 |
O |
|
o |
Item 4 |
O |
|
o |
Item 5 |
O |
|
Más convincente |
NUMBER OF ITEMS 5 ¿Qué argumento es el <u>más</u> convincente y qué afirmación es la <u>menos</u> convincente? |
Q12A_Least Menos convincente |
|
o |
Elemento 1 |
O |
|
o |
Elemento 2 |
O |
|
o |
Elemento 3 |
O |
|
o |
Elemento 4 |
O |
|
Elemento 5 |
O |
[DISPLAY – IntroMaxdiff_Q13]
For each of the questions in the next section you will see 4 arguments. In each question, select the arguments that are the <u>most </u> and the <u>least<u>convincing to you.
En cada una de las preguntas de la siguiente sección verá 4 argumentos. En cada pregunta, seleccione los argumentos que le resulten el <u>más</u> y el <u>menos<u> convincente.
[SPACE]
There are 5 questions total in this section. While these questions may seem repetitive, please review each one carefully as there are important differences in the statements.
Hay 5 preguntas en total en esta sección. Aunque estas preguntas puedan parecer repetitivas, le pedimos que revise cada una de ellas cuidadosamente ya que hay diferencias importantes en las afirmaciones.
MAX-DIFF
MAXDIFF DESIGN – use 12968-011_2022 Canada-U.S. POR_MaxDiff Design_Q13.xlsx
5 components in maxdiff
50 VERSIONS – Stats will preload P_MAXDIFFQ13; however, CS team needs to have a testing-only page
Each version has 5sets (questions Q13A-Q13E)
Each of the 5 sets will insert 4 of the 5 components below.
NOTE: THE BELOW IS AN EXAMPLE OF HOW THE MAXDIFF QUESTION SHOULD LOOK ON SCREEN
[GRID, SP VERTICAL; prompt twice for each Q13_Most/Q13_Least]
[custom prompt if “most convincing” column is left blank:
“We would really like your answer for the <u>most</u> convincing issue argument.”]
“Nos gustaría conocer su respuesta sobre el argumento <u>más</u> convincente.”]
[custom prompt if “least convincing” column is left blank:
“We would really like your answer for the <u>least</u> convincing issue argument.”]
“Nos gustaría conocer su respuesta sobre el argumento <u>menos</u> convincente.”]
[custom prompt if both columns are left blank:
“We would really like your answer to this question.”] “Nos gustaría que respondiera esta pregunta.”]
[custom prompt if R select same statement for most and least:
“Please select different statements for Most and Least.”
“Seleccione diferentes afirmaciones para las opciones de más y menos.”
FULL LIST OF 5 COMPONENTS FOR MAXDIFF:
1. This issue is now at the top of Canada’s agenda with the United States.
2. If we continue down this road, Canada will have no choice but to retaliate against the United States.
3. It would be unfortunate if Canada and the United States were to adopt different approaches that harm each other instead of finding a solution.
4. Canada is disappointed that the United States continues to take its current approach. In the past, neutral, third-party tribunals have repeatedly found U.S. claims to be without merit.
5. Canada firmly believes that a mutually acceptable agreement - one that brings stability and predictability to the sector - is in the best interests of both countries and remains the best outcome to the dispute.
- Este asunto ocupa ahora el primer lugar en la agenda de Canadá con Estados Unidos.
- Si seguimos por este camino, Canadá no tendrá más remedio que tomar represalias contra Estados Unidos.
- Sería lamentable que Canadá y Estados Unidos adoptaran enfoques diferentes que se perjudiquen mutuamente en lugar de encontrar una solución.
- A Canadá le decepciona que Estados Unidos siga adoptando su enfoque actual. En el pasado, los tribunales neutrales independientes han considerado en repetidas ocasiones que las reclamaciones de Estados Unidos carecían de fundamento.
- Canadá cree firmemente que un acuerdo mutuamente aceptable (que aporte estabilidad y previsibilidad al sector) es en beneficio de ambos países y sigue siendo el mejor resultado para la disputa.
[SP]
[DOUBLE PROMPTS]
Q13A.
Sometimes the United States and Canada disagree about a course of action and must put pressure on one another to find a solution.
A veces, Estados Unidos y Canadá discrepan sobre una línea de actuación y deben presionarse mutuamente para encontrar una solución.
[SPACE]
Below, you will see several arguments displayed.
A continuación, se le mostrarán varios argumentos.
[SPACE]
Please indicate which one is most likely to spark your interest in reaching a solution between Canada and the United States.
Indique cuál de ellos es más probable que despierte su interés por la posibilidad de que Canadá y Estados Unidos lleguen a una solución.
[SPACE]
[CAWI – remove bold]
<i>Screen [PIPE IN NUMBER OF THE CURRENT SET ITERATION] of 5
<i>Pantalla [PIPE IN NUMBER OF THE CURRENT SET ITERATION] de 5
[SPACE]
Select one issue in <u>each</u> column. </i>
Seleccione una opción en <u>cada</u> columna. </i>
|
Q13A_Most Most convincing |
NUMBER OF ITEMS 4 Which argument is <u>most</u> convincing and which statement is <u>least</u> convincing? |
Q13A_Least Least convincing |
|
o |
Item 1 |
O |
|
o |
Item 2 |
O |
|
o |
Item 3 |
O |
|
o |
Item 4 |
O |
|
Q13A_Most Más convincente |
NUMBER OF ITEMS 4 ¿Qué argumento es el <u>más</u> convincente y qué afirmación es la <u>menos</u> convincente? |
Q13A_Least Menos convincente |
|
o |
Elemento 1 |
O |
|
o |
Elemento 2 |
O |
|
o |
Elemento 3 |
O |
|
o |
Elemento 4 |
O |
PROGRAMMING NOTE: IF RND_01=0 DISPLAY Q14A
PROGRAMMING NOTE: IF RND_01=1 DISPLAY Q14B
[SHOW IF RND_01=0]
[SP]
Q14A.
Do you agree or disagree that American prosperity and security is directly related to Canadian prosperity and security?
¿Está usted de acuerdo o en desacuerdo en que la prosperidad y la seguridad estadounidenses están directamente relacionadas con la prosperidad y la seguridad canadienses?
RESPONSE OPTIONS:
- Strongly agree
- Somewhat agree
- Somewhat disagree
- Strongly disagree
- Totalmente de acuerdo
- Algo de acuerdo
- Algo en desacuerdo
- Totalmente en desacuerdo
[SHOW IF RND_01=1]
[SP]
Q14B.
Do you agree or disagree that North American prosperity and security is directly related to Canadian prosperity and security?
¿Está usted de acuerdo o en desacuerdo en que la prosperidad y la seguridad norteamericanas están directamente relacionadas con la prosperidad y la seguridad canadienses?
RESPONSE OPTIONS:
- Strongly agree
- Somewhat agree
- Somewhat disagree
- Strongly disagree
- Totalmente de acuerdo
- Algo de acuerdo
- Algo en desacuerdo
- Totalmente en desacuerdo
[SP]
Q14C.
How familiar are you with the U.S-Mexico-Canada Agreement?
¿Qué tan familiarizado/a está con el Acuerdo Estados Unidos-México-Canadá?
RESPONSE OPTIONS:
- Very familiar
- Familiar
- Not too familiar
- Not at all familiar
- Muy familiarizado/a
- Familiarizado/a
- No tan familiarizado/a
- Nada familiarizado/a
PROGRAMMING NOTE:
IF RND_02=0 DISPLAY Q15A
IF RND_02=1 DISPLAY Q15B
[SHOW IF RND_02=0]
Q15A.
Members of Congress, state representatives and governors often work with foreign elected representatives on proposed laws in the United States that might affect their countries. To what extent do you think it’s appropriate for U.S. lawmakers to consider potential negative impacts on other countries when making decisions?
Los miembros del Congreso, los representantes estatales y los gobernadores colaboran a menudo con representantes electos extranjeros en propuestas de ley en Estados Unidos que podrían afectar a sus países. ¿Hasta qué punto cree usted que es adecuado que los legisladores estadounidenses tomen en cuenta las posibles repercusiones negativas en otros países al tomar decisiones?
RESPONSE OPTIONS:
- To a large extent
- To some extent
- A little
- Not at all
- En gran medida
- Hasta cierto punto
- Un poco
- Nada
[SHOW IF RND_02=1]
[SP]
Q15B.
Members of Congress, state representatives and governors often work with elected representatives from Canada on proposed laws in the United States that might affect Canada. To what extent do you think it’s appropriate for U.S. lawmakers to consider potential negative impacts on Canada when making decisions?
Los miembros del Congreso, los representantes estatales y los gobernadores trabajan a menudo con representantes electos de Canadá en propuestas de ley en Estados Unidos que podrían afectar a Canadá. ¿Hasta qué punto cree usted que es apropiado que los legisladores estadounidenses tomen en cuenta las posibles repercusiones negativas en Canadá al tomar decisiones?
RESPONSE OPTIONS:
- To a large extent
- To some extent
- A little
- Not at all
- En gran medida
- Hasta cierto punto
- Un poco
- Nada
Q16.
Do you agree or disagree with the following statements?
¿Está usted de acuerdo o en desacuerdo con las siguientes afirmaciones?
GRID ITEMS, RANDOMIZE:
- United States and Canada are unique partners who should make special allowances for each other that they would not extend to other international allies [like Australia and the United Kingdom].
- Sometimes Canadian and American interests do not align completely. It is therefore appropriate for Canada to prioritize its own country’s needs even if it comes at the cost of U.S. interests.
- Estados Unidos y Canadá son socios singulares que deben hacer concesiones mutuas que no harían con otros aliados internacionales (como Australia y el Reino Unido).
- A veces los intereses canadienses y estadounidenses no coinciden del todo. Por lo tanto, es conveniente que Canadá dé prioridad a las necesidades de su propio país, aunque sea a costa de los intereses de Estados Unidos.
RESPONSE OPTIONS:
- Strongly agree
- Somewhat agree
- Somewhat disagree
- Strongly disagree
- Totalmente de acuerdo
- Algo de acuerdo
- Algo en desacuerdo
- Totalmente en desacuerdo
[MP, ALLOW RESPONDENTS TO PICK UP TO 3 OPTIONS]
Q16A1.
Which do you think is a priority issue for you today?
¿Cuál cree que es un asunto prioritario para usted hoy?
Pick your top three.
Elija sus tres prioridades principales
RESPONSE OPTIONS, RANDOMIZE:
- Health care
- Lack of affordable housing
- Gun violence
- Racism
- Crime
- Labor shortage
- Spread of Covid
- Climate change
- Budget deficit
- Terrorism
- Disinformation (false information) in the news
- Misinformation (incorrect information) in the news
- Homelessness
- Lack of good jobs
- Increasing trade between Canada and US
- Other: please specify [TEXTBOX][ANCHOR]
- La asistencia médica
- Falta de vivienda asequible
- Violencia armada
- Racismo
- Crimen
- Escasez de trabajadores
- Propagación del Covid
- Cambio climático
- Déficit presupuestario
- Terrorismo
- Desinformación (información falsa) en las noticias
- Desinformación (información incorrecta) en las noticias
- Personas sin hogar
- Falta de buenos empleos
- Aumento del comercio entre Canadá y EE.UU.
- Otro: especifique [TEXTBOX][ANCHOR]
[SHOW IF Q16A1_11=1]
[SP]
Q16B1.
Where do you believe disinformation primarily comes from?
¿De dónde cree que procede principalmente la desinformación?
RESPONSE OPTIONS:
- Special interest groups
- Citizens
- Foreign governments
- Local governments
- Other. Please specify [TEXTBOX]
- Don’t know
- Grupos de interés especial
- Ciudadanos
- Gobiernos extranjeros
- Gobiernos locales
- Otro. Especifique [TEXTBOX]
77. No sabe
[SHOW IF Q16A1_12=1]
Q16C.
Where do you believe misinformation primarily comes from?
¿De dónde cree que procede principalmente la mala información?
RESPONSE OPTIONS:
- Special interest groups
- Citizens
- Foreign governments
- Local governments
- Other. Please specify [TEXTBOX]
- Don’t know
- Grupos de interés especial
- Ciudadanos
- Gobiernos extranjeros
- Gobiernos locales
- Otro. Especifique [TEXTBOX]
[GRID; SP]
Q17.
Do you agree or disagree with the following statements?
¿Está usted de acuerdo o en desacuerdo con las siguientes afirmaciones?
GRID ITEMS, RANDOMIZE:
- Canada is America’s most secure and reliable trading partner
- The US periodically needs to impose tariffs on imports from Canada to protect US national security
- Canadá es el socio comercial más seguro y confiable de Estados Unidos
- EE. UU. necesita imponer periódicamente aranceles a las importaciones procedentes de Canadá para proteger la seguridad nacional de EE. UU.
RESPONSE OPTIONS:
- Strongly agree
- Somewhat agree
- Somewhat disagree
- Strongly disagree
- Totalmente de acuerdo
- Algo de acuerdo
- Algo en desacuerdo
- Totalmente en desacuerdo
Q18.
The United States periodically imposes tariffs on imports from Canada for a variety of reasons. Would you support or oppose these tariffs if they…
Estados Unidos impone periódicamente aranceles a las importaciones procedentes de Canadá por diversas razones. ¿Apoyaría o se opondría usted a estos aranceles si...
GRID ITEMS, RANDOMIZE:
- …resulted in tariffs on American goods being exported to Canada?
- …resulted in tariffs on Canadian goods being imported to the U.S.?
- …resulted in job losses in your local community?
- …caused a trade war with Canada?
- …supported jobs in your local community?
- ...dieran lugar a aranceles sobre los productos estadounidenses exportados a Canadá?
- ...dieran lugar a aranceles sobre los productos canadienses que se importaban a EE.UU.?
- ...provocaran la pérdida de puestos de trabajo en su comunidad?
- ...provocaran una guerra comercial con Canadá?
- ...crearan empleo en su comunidad?
RESPONSE OPTIONS:
- Strongly support
- Somewhat support
- Somewhat oppose
- Strongly oppose
- Apoyaría totalmente
- Apoyaría algo
- Me opondría algo
- Me opondría totalmente
Q19.
The United States currently imposes tariffs on imports of certain kinds of Canadian lumber. Would you support or oppose continuing these tariffs if…
Estados Unidos impone actualmente aranceles a las importaciones de determinados tipos de madera canadiense. ¿Apoyaría o se opondría usted a mantener estos aranceles si...
GRID ITEMS, RANDOMIZE:
- … they contribute to higher housing costs for American homebuyers?
- … they add a tax on American businesses and consumers?
- … the United States can’t produce enough lumber at home to meet its own demand?
- ... contribuyeran a aumentar el costo de la vivienda para los compradores estadounidenses?
- ... agregaran un impuesto para las empresas y consumidores estadounidenses?
- ... los Estados Unidos no pudieran producir suficiente madera en casa para satisfacer su propia demanda?
RESPONSE OPTIONS:
- Strongly support
- Somewhat support
- Somewhat oppose
- Strongly oppose
- Apoyaría totalmente
- Apoyaría algo
- Me opondría algo
- Me opondría totalmente
Q20.
To what extent do you agree or disagree that Canada is an important partner for the United States in…
¿En qué medida está usted de acuerdo o en desacuerdo con que Canadá es un socio importante para Estados Unidos en...
GRID ITEMS, RANDOMIZE:
- …maintaining U.S. national security?
- …maintaining border security?
- …maintaining continental security?
- …defending North America?
- ...promoting world peace and stability?
- ...el mantenimiento de la seguridad nacional estadounidense?
- ...el mantenimiento de la seguridad fronteriza?
- ...el mantenimiento de la seguridad continental?
- ...la defensa de Norteamérica?
- ...la promoción de la paz y la estabilidad mundiales?
RESPONSE OPTIONS:
- Strongly agree
- Somewhat agree
- Somewhat disagree
- Strongly disagree
- Totalmente de acuerdo
- Algo de acuerdo
- Algo en desacuerdo
- Totalmente en desacuerdo
[GRID; SP]
Q21.
To what extent do you agree or disagree with the following statements?
¿En qué medida está usted de acuerdo o en desacuerdo con las siguientes afirmaciones?
GRID ITEMS, RANDOMIZE:
- U.S. and Canada need to closely coordinate their responses to global challenges presented by countries such as China, Russia, and Iran.
- Canada contributes sufficiently in the North America Aerospace Defence Command (NORAD) to defend North America (NORAD is a U.S. and Canadian binational military command responsible for aerospace warning, aerospace control, and maritime warning in defense of North America).
- Canada contributes sufficiently in defending the Arctic.
- The northern border between the United States and Canada should be treated differently than the southern border between the United States and Mexico in terms of ease of trade and travel.
- Estados Unidos y Canadá deben coordinar estrechamente sus respuestas a los desafíos globales que plantean países como China, Rusia e Irán.
- Canadá contribuye suficientemente al Mando Norteamericano de Defensa Aeroespacial (NORAD, por sus siglas en inglés) para defender Norteamérica (NORAD es un mando militar binacional estadounidense y canadiense responsable de la alerta aeroespacial, el control aeroespacial y la alerta marítima en defensa de Norteamérica).
- Canadá contribuye suficientemente a la defensa del Ártico.
- La frontera norte entre Estados Unidos y Canadá debería recibir un trato diferente al de la frontera sur entre Estados Unidos y México en términos de facilidad para el comercio y los viajes.
RESPONSE OPTIONS:
- Strongly agree
- Somewhat agree
- Somewhat disagree
- Strongly disagree
- Totalmente de acuerdo
- Algo de acuerdo
- Algo en desacuerdo
- Totalmente en desacuerdo
[GRID; SP]
Q22A.
Thinking about the northern border between the United States and Canada, to what extent do you agree or disagree that the way the border is currently managed by Canada…
Si considera la frontera norte entre Estados Unidos y Canadá, ¿en qué medida está usted de acuerdo o en desacuerdo en que la forma en que Canadá administra actualmente la frontera...
GRID ITEMS, RANDOMIZE:
A. … poses a threat to U.S. national security?
B. … contributes to the U.S. economy?
C. ... encourages illegal immigration into the U.S.?
D. … makes daily travel and trade too difficult?
E. … contributes to crime?
- ... representa una amenaza para la seguridad nacional de EE. UU.?
- ... contribuye a la economía estadounidense?
- ... fomenta la inmigración ilegal en Estados Unidos?
- ... dificulta los viajes y el comercio diarios?
- ... contribuye a la delincuencia?
RESPONSE OPTIONS:
- Strongly agree
- Somewhat agree
- Somewhat disagree
- Strongly disagree
- Totalmente de acuerdo
- Algo de acuerdo
- Algo en desacuerdo
- Totalmente en desacuerdo
[GRID, SP]
Q22B.
Thinking about the northern border between the United States and Canada, to what extent do you agree or disagree that the way the border is currently managed by the U.S.…
Pensando en la frontera norte entre Estados Unidos y Canadá, ¿en qué medida está de acuerdo o en desacuerdo en que la forma en que se gestiona actualmente la frontera por parte de EE.UU.....
GRID ITEMS, RANDOMIZE:
A. … poses a threat to U.S. national security?
B. … contributes to the U.S. economy?
C. ... encourages illegal immigration into the U.S.?
D. … makes daily travel and trade too difficult?
E. … contributes to crime?
- ... representa una amenaza para la seguridad nacional de EE. UU.?
- ... contribuye a la economía estadounidense?
- ... fomenta la inmigración ilegal en Estados Unidos?
- ... dificulta los viajes y el comercio diarios?
- ... contribuye a la delincuencia?
RESPONSE OPTIONS:
- Strongly agree
- Somewhat agree
- Somewhat disagree
- Strongly disagree
- Totalmente de acuerdo
- Algo de acuerdo
- Algo en desacuerdo
- Totalmente en desacuerdo
[GRID; SP]
Q23.
To what extent would you support or oppose importing more energy from Canada if it…
¿En qué medida apoyaría o se opondría usted a importar más energía de Canadá si ello...
GRID ITEMS, RANDOMIZE:
- …meant reducing imports from other foreign countries like Russia or Saudi Arabia?
- …increased U.S. national security?
- …produced more greenhouse gas emissions than importing energy from other foreign countries like Russia or Saudi Arabia?
- …helped the U.S. reach its climate goals quicker?
- …required new infrastructure like pipelines, rail lines or power lines being built in the U.S. to import the energy?
- …increased imports supported new jobs in your area?
- ...significara reducir las importaciones de otros países extranjeros como Rusia o Arabia Saudita?
- ...aumentara la seguridad nacional de Estados Unidos?
- ...produjera más emisiones de gases de efecto invernadero que la importación de energía de otros países extranjeros como Rusia o Arabia Saudita?
- ...ayudara a Estados Unidos a alcanzar más rápidamente sus objetivos climáticos?
- ...requiriera la construcción de nuevas infraestructuras como oleoductos, líneas ferroviarias o tendidos eléctricos en Estados Unidos para importar la energía?
- ...aumentara las importaciones creando nuevos puestos de trabajo en su región?
RESPONSE OPTIONS:
- Strongly support
- Somewhat support
- Somewhat oppose
- Strongly oppose
- Apoyaría totalmente
- Apoyaría algo
- Me opondría algo
- Me opondría totalmente
[GRID; SP]
Q24.
As the demand for energy in the U.S. is increasing every year, do you support or oppose…
Ya que la demanda de energía en Estados Unidos aumenta cada año, ¿usted apoya o se opone...
GRID ITEMS, RANDOMIZE:
A. …increasing energy imports from Canada?
B. …increasing oil and gas imports from Canada?
C. …building more energy infrastructure between the United States and Canada?
D. …building more pipelines between the United States and Canada?
A. ...a aumentar las importaciones de energía de Canadá?
B. ...aumentar las importaciones de petróleo y gas de Canadá?
C. ...construir más infraestructuras energéticas entre Estados Unidos y Canadá?
D. ...construir más oleoductos entre Estados Unidos y Canadá?
RESPONSE OPTIONS:
1. Strongly support
2. Somewhat support
3. Somewhat oppose
4. Strongly oppose
1. Apoyo totalmente
2. Apoyo algo
3. Me opongo algo
4. Me opongo totalmente
Q25.
Canada is a major supplier of natural resources to the United States, including critical minerals, energy products, and forest products. Do you agree or disagree that Canada develops its natural resources more responsibly than other countries?
Canadá es uno de los principales proveedores de recursos naturales de Estados Unidos, incluidos minerales esenciales, productos energéticos y productos forestales. ¿Está usted de acuerdo o en desacuerdo en que Canadá explota sus recursos naturales de forma más responsable que otros países?
RESPONSE OPTIONS:
- Strongly agree
- Somewhat agree
- Somewhat disagree
- Strongly disagree
- Totalmente de acuerdo
- Algo de acuerdo
- Algo en desacuerdo
- Totalmente en desacuerdo
Q26A.
Do you consider the countries listed below to be a friend or enemy of U.S?
¿Considera que los países enumerados a continuación son amigos o enemigos de Estados Unidos?
GRID ITEMS:
A. Canada
B. China
C. Iran
D. Mexico
E. Russia
F. Ukraine
G. Syria
H. Australia
I. Germany
J. The United Kingdom
K. Japan
L. India
M. France
N. Israel
O. Saudi Arabia
- Canadá
- China
- Irán
- México
- Rusia
- Ucrania
- Siria
- Australia
- Alemania
- Reino Unido
- Japón
- India
- Francia
- Israel
- Arabia Saudí
RESPONSE OPTIONS:
- Friend
- Enemy
- Amigo
- Enemigo
[GRID 5,5,5; SP]
Q26B.
For each of these countries, we are interested in learning about your level of trust when it comes to the U.S. working with these countries on a variety of issues. Do you trust them:
Para cada uno de estos países, nos interesa conocer su nivel de confianza cuando se trata de que EE.UU. trabaje con estos países en una variedad de asuntos. ¿Confía en ellos:
GRID ITEMS:
A. Canada
B. China
C. Iran
D. Mexico
E. Russia
F. Ukraine
G. Syria
H. Australia
I. Germany
J. The United Kingdom
K. Japan
L. India
M. France
N. Israel
O. Saudi Arabia
- Canadá
- China
- Irán
- México
- Rusia
- Ucrania
- Siria
- Australia
- Alemania
- Reino Unido
- Japón
- India
- Francia
- Israel
- Arabia Saudí
RESPONSE OPTIONS:
1. A lot
2. Some
3. A little
4. Not at all
- Don’t know
- Mucho
- Algo
- Un poco
- No confío en ellos en absoluto
- No sabe
[GRID, SP]
Q27.
To what extent do you agree or disagree with the following statement?
¿En qué medida está usted de acuerdo o en desacuerdo con la siguiente afirmación?
GRID ITEMS:
- U.S. must work with Canada to fight climate change
- The U.S. must work with Canada to keep its air and water clean
- The U.S. must work with Canada to manage the environmental resources they share
- The U.S. must work with Canada to defend from cyber threats
- The U.S. must work with Canada to prevent terrorist threats
- The U.S. must work with Canada to increase trade
- The U.S. must work with Canada to address individuals crossing the border between official points of entry to claim asylum
- Estados Unidos debe colaborar con Canadá en la lucha contra el cambio climático
- Estados Unidos debe colaborar con Canadá para mantener limpios el aire y el agua
- Estados Unidos debe trabajar con Canadá para gestionar los recursos medioambientales que comparten
- Estados Unidos debe trabajar con Canadá para defenderse de las ciberamenazas
- Estados Unidos debe trabajar con Canadá para prevenir las amenazas terroristas
- Estados Unidos debe trabajar con Canadá para aumentar el comercio
- Estados Unidos debe trabajar con Canadá para abordar la cuestión de las personas que cruzan la frontera entre puntos de entrada oficiales para solicitar asilo
RESPONSE OPTIONS:
- Strongly agree
- Somewhat agree
- Somewhat disagree
- Strongly disagree
- Totalmente de acuerdo
- Algo de acuerdo
- Algo en desacuerdo
- Totalmente en desacuerdo
[SP]
Q28.
Some people believe that the United States and Canada have taken different domestic approaches to reducing systemic racism and to rectifying historical wrongs committed against racialized communities. To what extent do you agree or disagree that the <u>United States could learn from Canada</u> about working with racialized communities?
Algunas personas creen que Estados Unidos y Canadá han adoptado enfoques nacionales diferentes para reducir el racismo sistémico y rectificar los errores históricos cometidos contra las comunidades racializadas. ¿En qué medida está usted de acuerdo o en desacuerdo con que <u>Estados Unidos podría aprender de Canadá</u> sobre cómo trabajar con las comunidades racializadas?
RESPONSE OPTIONS:
- Strongly agree
- Somewhat agree
- Somewhat disagree
- Strongly disagree
- Totalmente de acuerdo
- Algo de acuerdo
- Algo en desacuerdo
- Totalmente en desacuerdo
[SP]
SEX.
You are…?
Indique su género.
RESPONSE OPTIONS:
- A man
- A woman
- A non-binary person
- Hombre
- Mujer
- Persona no binaria
[DOUBLE PROMPT]
[SP]
HOH.
Are you the head of your household?
¿Es usted cabeza de familia?
RESPONSE OPTIONS:
- Yes (including if you are one of multiple heads of your household)
- No
- Sí (incluso si es uno/a de varios/as cabezas de familia)
- No
[SHOW IF MISSING P_RELIG OR (IF P_RELIG=14 AND P_RELIG_OE IS MISSING)]
[SP]
RELIG.
What is your present religion, if any?
¿Cuál es su religión actual, si la tiene?
RESPONSE OPTIONS:
2 Roman Catholic (Catholic)
3 Mormon (Church of Jesus Christ of Latter-day Saints/LDS)
4 Orthodox (Greek, Russian, or some other orthodox church)
5 Jewish (Judaism)
6 Muslim (Islam)
7 Buddhist
8 Hindu
9 Atheist (do not believe in God)
10 Agnostic (not sure if there is a God)
11 Nothing in particular
12 Just Christian
13 Unitarian (Universalist)
14 Something else – please specify: [TEXTBOX]
2 Católica romana (católica)
3 Mormona (Iglesia de Jesucristo de los Santos de los Últimos Días)
4 Ortodoxa (Iglesia griega, rusa u otra iglesia ortodoxa)
5 Judía (judaísmo)
6 Musulmana (Islam)
7 Budista
8 Hinduista
9 Ateo/a (no cree en Dios)
10 Agnóstico/a (no está seguro/a de que exista Dios)
11 Ninguna en particular
12 Solo cristiano/a
13 Unitario/a (Universalista)
14 Otra opción (especifique): [TEXTBOX]
[SHOW IF MISSING P_C1 OR (P_C1=2 AND MISSING P_C1_OE)]
[DOUBLE PROMPT]
[SP]
C1.
Where were you born?
¿Dónde nació usted?
1. In the United States
2. Outside the United States – Please specify country where you were born: [TEXTBOX]
1. En Estados Unidos
2. Fuera de los Estados Unidos. Especifique el país donde nació: [TEXTBOX]
[SHOW IF P_C1=2 OR C1=2]
[DOUBLE PROMPT]
[SP]
C1_2
How long have you been in the U.S.?
¿Desde hace cuánto tiempo vive usted en EE. UU.?
RESPONE OPTIONS:
- Less than 1 year
- 1 year to 4 years
- 5 years to 10 years
- 11 years to 20 years
- 21 years or more
- I don't know
- I prefer not to answer
- Menos de 1 año
- Entre 1 y 4 años
- Entre 5 y 10 años
- Entre 11 y 20 años
- 21 años o más
- No lo sé
- Prefiero no responder
[SP]
[DOUBLE PROMPT]
BORN2.
Were either of your parents born in the U.S.?
¿Alguno de sus padres nació en EE. UU.?
RESPONSE OPTIONS:
1. Yes, both parents were born in the U.S.
2. Yes, one parent was born in the U.S.
3. No
- Sí, ambos nacieron en EE. UU.
- Sí, uno de mis padres nació en EE. UU.
- No
[DOUBLE PROMPT]
[SP]
BORN3:
Are you a member of a visible minority group?
¿Pertenece usted a un grupo minoritario visible?
RESPONSE OPTIONS:
1. Yes
2. No
- I don't know
- I prefer not to answer
- Sí
- No
- No lo sé
- Prefiero no responder
[SHOW IF MISSING P_VOTENEW]
[SP]
VOTENEW
Are you currently registered to vote at your current address, registered at a different address or not currently registered?
¿Está registrado/a usted para votar en su domicilio actual, está registrado/a en otro domicilio o no está registrado/a?
RESPONSE OPTIONS:
- Registered at current address
- Registered at a different address
- Not currently registered
- I am not eligible to vote
- Not Sure
- Registrado/a en mi domicilio actual
- Registrado/a en otra dirección
- No estoy registrado/a
- No puedo votar
[DISPLAY_CONCLUSION]
Thank you for taking the time to answer this survey. The survey was done on behalf of the Government of Canada. Your answers will remain anonymous and the information you provide will be administered according to the requirements of the Privacy Act, the Access to Information Act, and any other pertinent legislation.
Gracias por tomarse el tiempo de responder esta encuesta. La encuesta se ha realizado en nombre del Gobierno de Canadá. Sus respuestas permanecerán anónimas y la información que proporcione se administrará de acuerdo con los requisitos de la Ley de Privacidad, la Ley de Acceso a la Información y cualquier otra legislación pertinente.
[SPACE]
Should you have any questions about the survey please contact the Government of Canada at POR-ROP@international.gc.ca.
Si usted tiene alguna pregunta sobre la encuesta, póngase en contacto con el Gobierno de Canadá en el correo electrónico POR-ROP@international.gc.ca.
RE-COMPUTE QUAL=1 “COMPLETE”
SET CO_DATE, CO_TIME, CO_TIMER VALUES HERE
CREATE MODE_END
1=CATI
2=CAWI
SCRIPTING NOTES: PUT QFINAL1, QFINAL2, QFINAL3 in the same screen.
[SINGLE CHOICE]
QFINAL1.
Thank you for your time today. To help us improve the experience of AmeriSpeak members like yourself, please give us feedback on this survey.
Muchas gracias por su tiempo. Para ayudarnos a mejorar la experiencia de los miembros de AmeriSpeak como usted, envíenos sus comentarios sobre esta encuesta.
[RED TEXT – CAWI ONLY]
If you do not have any feedback for us today, please click “Continue” through to the end of the survey so we can make sure your opinions are counted and for you to receive your AmeriPoints reward.
Si usted no tiene ningún comentario para nosotros hoy, haga clic en "Continuar" hasta el final de la encuesta para que podamos contar sus opiniones y para que usted pueda recibir su premio de AmeriPoints.
Please rate this survey overall from 1 to 7 where 1 is Poor and 7 is Excellent.
Califique esta encuesta en términos generales del 1 al 7, siendo 1 Pésima y 7 Excelente.
|
Poor |
|
|
|
|
|
Excellent |
|
1 |
2 |
3 |
4 |
5 |
6 |
7 |
|
Pésima |
|
|
|
|
|
Excelente |
|
1 |
2 |
3 |
4 |
5 |
6 |
7 |
[SINGLE CHOICE – CAWI ONLY]
QFINAL2.
Did you experience any technical issues in completing this survey?
¿Tuvo usted algún inconveniente técnico al completar esta encuesta?
- Yes – please tell us more in the next question
- No
- Sí. Por favor, cuéntenos más en la próxima pregunta
- No
[TEXT BOX] [CATI version needs “no” option]
QFINAL3.
Do you have any general comments or feedback on this survey you would like to share? If you would like a response from us, please email support@AmeriSpeak.org or call (888) 326-9424.
¿Tiene usted algún comentario u observación sobre esta encuesta que le gustaría compartir con nosotros? Si usted desea recibir una respuesta de nosotros, por favor envíe un correo electrónico a support@AmeriSpeak.org o llame al (888) 326-9424.
[DISPLAY]
END.
[CATI version]
Those are all the questions we have. We will add [INCENTWCOMMA] AmeriPoints to your AmeriPoints balance for completing the survey. If you have any questions at all for us, you can email us at support@AmeriSpeak.org or call us toll-free at 888-326-9424. Let me repeat that again: email us at support@AmeriSpeak.org or call us at 888-326-9424. Thank you for participating in our new AmeriSpeak survey!
Esas fueron todas las preguntas. Agregaremos [INCENTWCOMMA] AmeriPoints a su saldo de AmeriPoints por completar la encuesta. Si usted tiene alguna pregunta, puede enviarnos un correo electrónico a support@AmeriSpeak.org o llamarnos al número gratuito 888-326-9424. Permítame repetirlo nuevamente: envíenos un correo electrónico a support@AmeriSpeak.org o llámenos al 888-326-9424. ¡Gracias por participar en nuestra nueva encuesta AmeriSpeak!
[CAWI version]
Those are all the questions we have. We will add [INCENTWCOMMA] AmeriPoints to your AmeriPoints balance for completing the survey. If you have any questions at all for us, you can email us at support@AmeriSpeak.org or call us toll-free at 888-326-9424. Thank you for participating in our new AmeriSpeak survey!
Esas fueron todas las preguntas. Agregaremos [INCENTWCOMMA] AmeriPoints a su saldo de AmeriPoints por completar la encuesta. Si usted tiene alguna pregunta, puede enviarnos un correo electrónico a support@AmeriSpeak.org o llamarnos al número gratuito 888-326-9424. ¡Gracias por participar en nuestra nueva encuesta AmeriSpeak!
You can close your browser window now if you wish or click Continue below to be redirected to the AmeriSpeak member website.
Ya puede cerrar la ventana de su explorador si lo desea o puede hacer clic en Continuar para dirigirse al sitio de usuario de AmeriSpeak.
Demographic Profile:
Additional questions asked of panelists prior to this survey
and are included with the survey data
|
Variable |
Values |
|
Gender |
1 = Male |
|
2 = Female |
|
|
Age |
Age in years |
|
Age (7 categories) |
1 = 18-24; 2 = 25-34; 3 = 35-44; 4 = 45-54; 5 = 55-64; 6 = 65-74; 7 = 75+ |
|
Age (4 categories) |
1 = 18-29; 2 = 30-44; 3 = 45-59; 4 = 60+ |
|
Education (5 categories) |
1 = Less than HS |
|
2 = HS graduate |
|
|
3 = Vocational/tech school/some college/associates |
|
|
4 = Bachelor’s degree |
|
|
5 = Post grad study/professional degree |
|
|
Race/Ethnicity |
1 = White, Non-Hispanic |
|
2 = Black, Non-Hispanic |
|
|
3 = Other, Non-Hispanic |
|
|
4 = Hispanic |
|
|
5 = 2+ races, Non-Hispanic |
|
|
6 = Asian/Pacific Islander, Non-Hispanic |
|
|
Housing Type |
1 = A one-family house detached from any other house |
|
2 = A one-family house attached to one or more houses |
|
|
3 = A building with 2 or more apartments |
|
|
4 = A mobile home or trailer |
|
|
5 = Boat, RV, van, etc. |
|
|
Household Income (18 categories) |
1 = Less than $5,000 2 = $5,000 to $9,999 |
|
3 = $10,000 to $14,999 4 = $15,000 to $19,999 |
|
|
5 = $20,000 to $24,999 6 = $25,000 to $29,999 |
|
|
7 = $30,000 to $34,999 8 = $35,000 to $39,999 |
|
|
9 = $40,000 to $49,999 10 = $50,000 to $59,999 |
|
|
11 = $60,000 to $74,999 12 = $75,000 to $84,999 |
|
|
13 = $85,000 to $99,999 14 = $100,000 to $124,999 |
|
|
15 = $125,000 to $149,999 16 = $150,000 to $174,999 |
|
|
17 = $175,000 to $199,999 18 = $200,000 or more |
|
|
Household Income (9 categories) |
1 = Less than $10,000 |
|
2 = $10,000 to $19,999 |
|
|
3 = $20,000 to $29,999 |
|
|
4 = $30,000 to $39,999 |
|
|
5 = $40,000 to $49,999 |
|
|
6 = $50,000 to $74,999 |
|
|
7 = $75,000 to $99,999 |
|
|
8 = $100,000 to $149,999 |
|
|
9 = $150,000 or more |
|
|
Household Income (4 categories) |
1 = Less than $30,000 |
|
2 = $30,000 to $59,999 |
|
|
3 = $60,000 to $99,999 |
|
|
4 = $100,000 or more |
|
|
Marital Status |
1 = Married |
|
2 = Widowed |
|
|
3 = Divorced |
|
|
4 = Separated |
|
|
5 = Never married |
|
|
6 = Living with partner |
|
|
Metropolitan Statistical Area Status |
0 = Non-Metro |
|
1 = Metro (as defined US OMB Core-Based Statistical Area) |
|
|
Home Internet Access |
0 = No |
|
1 = Yes |
|
|
Telephone Service |
1 = Landline telephone only |
|
2 = Have a landline, but mostly use cellphone |
|
|
3 = Have cellphone, but mostly use landline |
|
|
4 = Cellphone only |
|
|
5 = No telephone service |
|
|
Ownership of Living Quarters |
1 = Owned or being bought by you or someone in your household |
|
2 = Rented for cash |
|
|
3 = Occupied without payment of cash rent |
|
|
Region 4 (US Census) |
1 = Northeast |
|
2 = Midwest |
|
|
3 = South |
|
|
4 = West |
|
|
Region 9 (US Census) |
1 = New England |
|
2 = Mid-Atlantic |
|
|
3 = East-North Central |
|
|
4 = West-North Central |
|
|
5 = South Atlantic |
|
|
6 = East-South Central |
|
|
7 = West-South Central |
|
|
8 = Mountain |
|
|
9 = Pacific |
|
|
State |
State of residence |
|
Household Size |
Total number of members in household |
|
HH members, age 0-1 |
Number of household members in age group |
|
HH members, age 2-5 |
Number of household members in age group |
|
HH members, age 6-12 |
Number of household members in age group |
|
HH members, age 13-17 |
Number of household members in age group |
|
HH members, age 18+ |
Number of household members in age group |
|
Current Employment Status |
1 = Working - as a paid employee |
|
2 = Working - self-employed |
|
|
3 = Not working - on temporary layoff from a job |
|
|
4 = Not working - looking for work |
|
|
5 = Not working – retired |
|
|
6 = Not working – disabled |
|
|
7 = Not working – other |
|
|
1 = Protestant (Baptist, Methodist, Non-denominational, Lutheran, Presbyterian, Pentecostal, Episcopalian, Reformed, Church of Christ, Jehovah’s Witness, etc.) |
|
|
2 = Roman Catholic (Catholic) |
|
|
3 = Mormon (Church of Jesus Christ of Latter-day Saints/LDS) |
|
|
4 = Orthodox (Greek, Russian, or some other orthodox church) |
|
|
5 = Jewish (Judaism) |
|
|
6 = Muslim (Islam) |
|
|
7 = Buddhist |
|
|
8 = Hindu |
|
|
9 = Atheist (do not believe in God) |
|
|
10 = Agnostic (not sure if there is a God) |
|
|
11 = Nothing in particular |
|
|
12 = Just Christian |
|
|
13 = Unitarian (Universalist) |
|
|
14 = Other, please specify |
|
|
Country of Birth |
1 = In the United States |
|
2 = Outside the United States – Please specify country where you were born |
|
|
Voter Registration Status |
1 = Registered at current address |
|
2 = Registered at a different address |
|
|
3 = Not currently registered |
|
|
4 = I am not eligible to vote |
|
|
5 = Not sure |
|
|
Urban Area Status |
1 = Urban |
|
2 = Suburban |
|
|
3 = Rural |