This report presents the results of an online survey conducted by Ekos Research Associates Inc. on behalf of Global Affairs Canada. The research involved an online survey of 3,059 Canadians. The survey was conducted across Canada in both official languages. Data collection for the survey took place from January 16 to February 5, 2023.
Cette publication est aussi disponible en français sous le titre : Opinions canadiennes sur l'aide internationale : étude de suivi.
This publication may be reproduced for non-commercial purposes only. Prior written permission must be obtained from Global Affairs Canada.
International assistance is a key component of Canada’s foreign policy, but the work that Canada does to support developing countries can seem disconnected from the everyday lives of Canadians at home. To effectively bridge the gap between Canadians’ experiences and issues happening thousands of kilometres away, Global Affairs Canada requires a solid understanding of how the Canadian public views international assistance and global issues. This will enable Global Affairs Canada to make evidence-based decisions about how they frame communications messages, announcements, programs and policies.
Global Affairs Canada had undertaken its own public opinion research in February 2020 and February 2021 to learn more about Canadian attitudes toward international assistance. These surveys revealed that while most Canadians remain unaware of assistance efforts, awareness has increased modestly. Canadians said they were proud of Canada’s international assistance activities and believed them to be important. However, the public perception is that the Government of Canada performs poorly when communicating about international assistance and there is a lack of confidence in Government of Canada information.
In February 2022, Global Affairs Canada collaborated with the Development Engagement Lab (DEL), comprising researchers based out of University College London. DEL has conducted online public opinion panels since 2013 with populations from the United Kingdom, the United States, France and Germany. With DEL’s permission, the February 2022 study employed a similar methodology and questionnaire, which allowed for in-depth analysis of what the public thinks about international aid and global issues, as well as how those attitudes changed when confronted with changing circumstances, such as the pandemic. It also provided valuable insight into how Canadians’ views compared to those of citizens of other countries and what types of messages resonated best with different populations on various international development topics.
This fiscal year, Global Affairs Canada sought to conduct this study again to continue tracking and comparing Canadian attitudes toward international assistance. Global Affairs Canada commissioned Ekos Research Associates to conduct a follow-up online survey in Canada that mirrors the questions and methodology of the DEL tracking panel.
The study again aims to measure and better understand what the general public thinks about international assistance issues and why (and how) they decide to become involved. This information will be used to inform Global Affairs Canada’s approach when communicating with the public about why international assistance matters, about the relevance and impact of individual projects, and about funding announcements related to these themes.
B. Methodology
The research involved an online survey of 3,059 adult Canadians. The results can be considered representative of the Canadian general public and are valid within a margin of error of +/- 1.8 percentage points, 19 times out of 20. The survey was conducted across Canada in both official languages. The field dates for the survey were January 16 to February 5, 2023.
Appendix A contains a detailed description of the methodology used in this study.
Appendix B contains the full survey questionnaire.
Appendix C contains the data tables.
C. Key Findings
Outlined below are key findings from the study. The remainder of this report describes survey results in more detail. Results reveal that Canadian attitudes toward international assistance issues have remained largely stable over the past year.
Results are organized around 6 main themes:
Canadian world views
concern about global poverty
views on international aid
interest in global poverty and development
involvement with development charity groups
views on international development NGOs and charities
Canadian world views
Results reveal that Canadians continue to have a strong sense of global citizenship. Three-quarters (77%) say they enjoy visiting other countries and learning about other cultures, and roughly the same proportion (75%) feel they have a duty to ensure their actions do not harm people living in other countries. About half (52%) believe that what happens to people in other countries makes a difference to their own lives, and only 11% feel they have very little in common with the people living in other countries. These results are largely the same as those found last year.
Findings also reveal that Canadians continue to hold strong views on global equality and compassion. More than 8 in 10 (85%) agree that helping people in need is the right thing to do, and three-quarters (75%) agree that all people in the world should be treated equally. Half (50%) say they would feel very guilty if they ignored the needs of poor people in poor countries, and 4 in 10 (44%, down from 48% in 2022) feel that countries like Canada should give more money to international aid because it is the morally right thing to do.
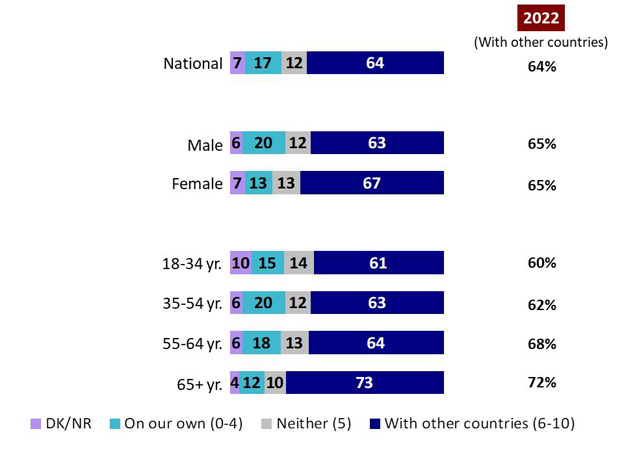
When asked how to secure a prosperous and safe country, most Canadians (64% - identical to last year) believe we are best placed to do this in cooperation with other countries. Very few (17%) think we are best positioned to secure a prosperous and safe country on our own.
Concern about global poverty
Narrowing the focus to views on global poverty, two-thirds of Canadians (65%) disagree that what happens in developing countries rarely affects them; only 1 in 6 (17%) agree with this idea. These results are virtually identical to those found last year.
And, consistent with 2022, the majority of Canadians (62%) express concern about levels of poverty in poor countries; only 12% say they are not concerned about poverty in poor countries.
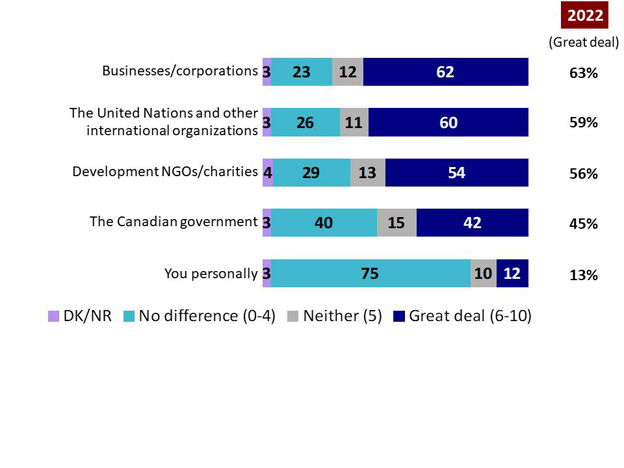
When asked to what extent they think various organizations are able to make a difference in reducing poverty in poor countries, findings reveal that Canadians feel many of these organizations can make a difference in reducing world poverty, but are less confident in the Government of Canada’s capacity and their own ability to make an impact in this area. The majority of Canadians (62%) believe that businesses can make a difference in reducing poverty in poor countries, followed closely by the United Nations and other international organizations (60%), and development NGOs/charities (54%). Interestingly, fewer than half of Canadians (42%, down 3 percentage points since last year) believe the Canadian government can make a difference in reducing world poverty, and only 12% believe that they personally can make a difference in reducing poverty in poor countries.
Views on international aid
Turning to views on international aid, results suggest fairly strong levels of support for providing international aid to poor countries. Just over half of Canadians (54%) think the Government of Canada should give international aid to poor countries; only 3 in 10 (28%) believe the government should not provide this type of aid. These findings are virtually identical to those found last year.
Results further reveal that 70% agree that international aid improves people’s lives by providing access to education, health care, clean water, and sanitation.
Results reveal more mixed views on whether the Government of Canada should increase or decrease the amount of money that it spends on international aid to poor countries. One in three (33%, down from 37% in 2022) say the government should increase the amount of money spent on international aid, and about 1 in 4 (25%) say the government should decrease its spending on international aid. One in three (33%) feel the amount should stay the same.
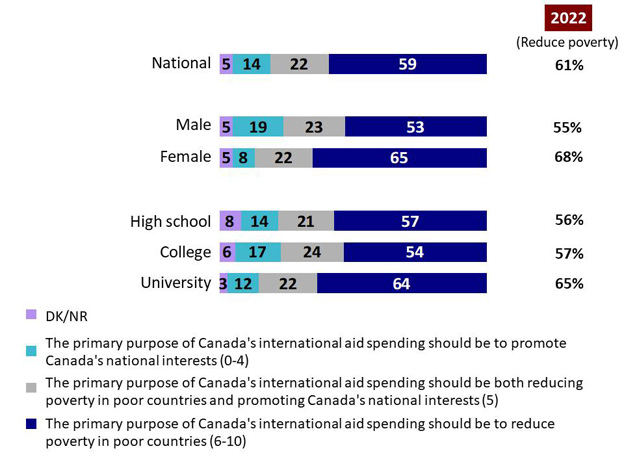
When asked what they think the main purpose of international aid to poor countries should be, results reveal that a majority of Canadians (59%) feel the primary purpose of international aid spending should be to reduce poverty in poor countries; only 14% believe the primary purpose of international aid spending should be to promote Canada’s national interests. These results are largely unchanged since 2022.
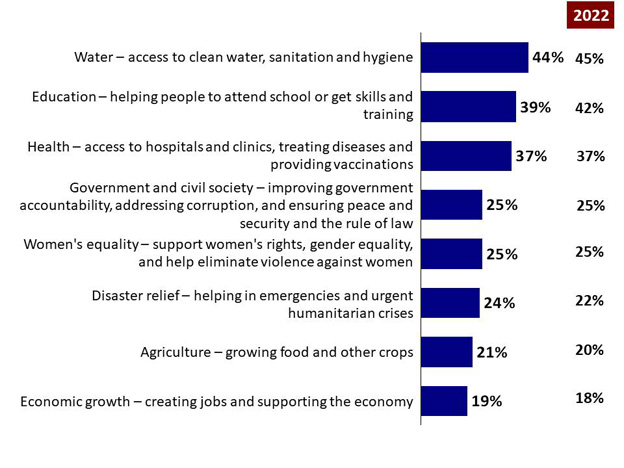
When asked to rank the most important priorities for government spending on international aid to poor countries, access to clean water was seen as most important (44%), followed by education (39%), and access to health care (37%). These results are largely the same as those found last year.
Despite generally positive views on international aid, Canadians also continue to express some fairly negative views about certain aspects of international aid. More than half feel that a lot of international aid from Canada ends up in the pockets of corrupt politicians in the developing world (56%) and that most international aid does not get to the intended recipients (54%).
Results also reveal that about 3 in 10 Canadians (29%, up 3 percentage points since 2022) believe that government spending on international aid is effective, while the plurality (42%) continue to think that government spending is ineffective.
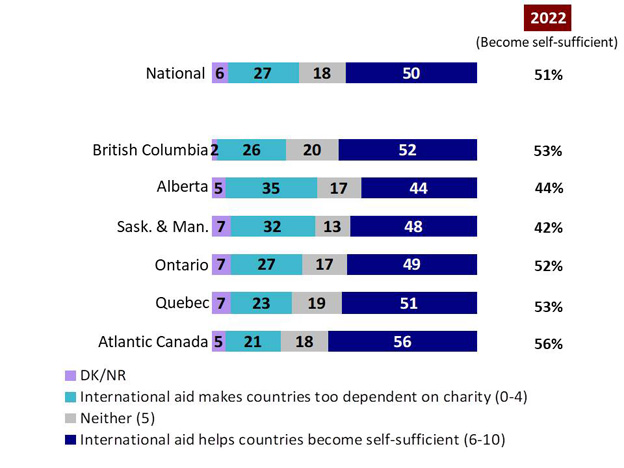
Despite mixed views on the effectiveness of international aid, half of Canadians (50%) think that international aid helps countries become self-sufficient; 27% think it makes countries too dependent on charity, and only 1 in 4 (23%) feels Canada cannot afford to provide international aid.
Interest in global poverty and development
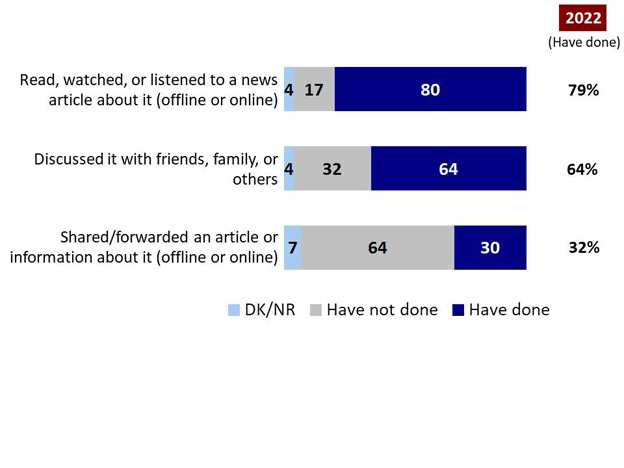
Results suggest that Canadians are fairly interested in global poverty and development issues. Fully 80% say they have read, watched, or listened to a news article about global poverty and development in the last year, and two-thirds (64%) say they have discussed global poverty with friends, family, or others over this time frame. A sizable minority (30%) say they have shared/forwarded information about this issue over the past year. These findings are virtually identical to those found last year.
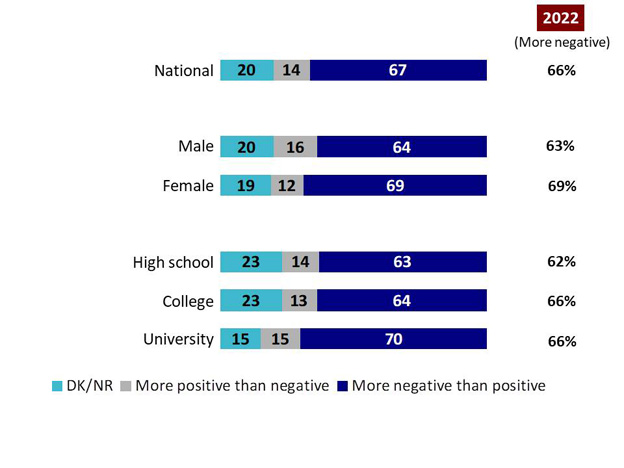
When asked if the news they have read/heard/seen/shared about global poverty was generally more positive than negative, only 14% say the news they saw about global poverty was more positive than negative while two-thirds (67%) say the news they have been exposed to was more negative than positive.
Involvement with development charity groups
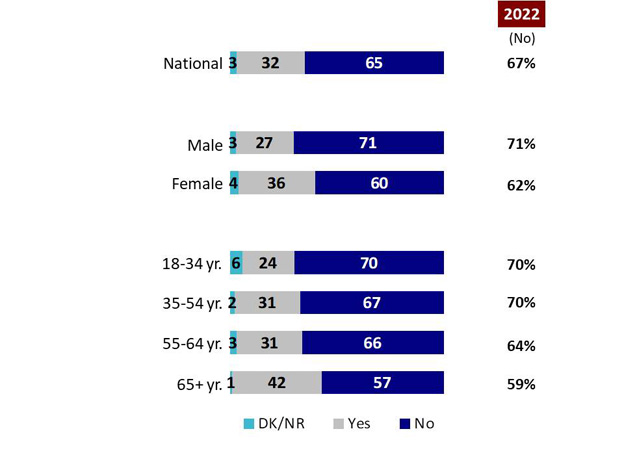
Turning to Canadians’ involvement with development charity groups, respondents were asked whether they have donated money to an international NGO or charity working on global poverty and development in the past 12 months. One in three (32%) say they have donated money to an international NGO or charity; however, the majority of Canadians (65%) have not.
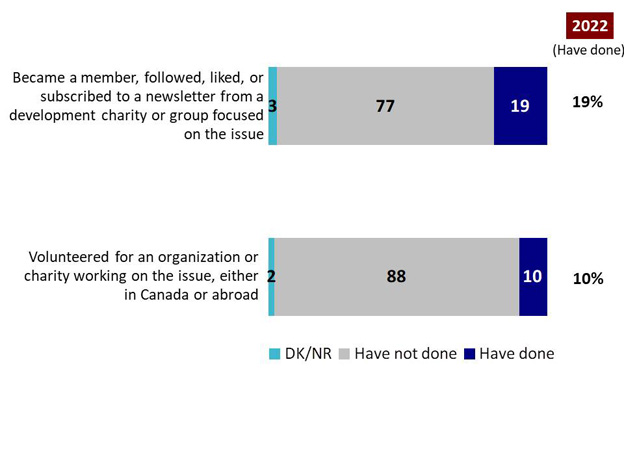
Respondents were also asked if they have been involved with a development charity or group in the past year. Results reveal limited involvement with these groups. Only 1 in 5 Canadians (19%) say they became a member of or subscribed to a newsletter from a development charity or group in the past year; even fewer (10%) say they have volunteered for an organization or charity working on global poverty over this time frame. These results are virtually identical to those found last year.
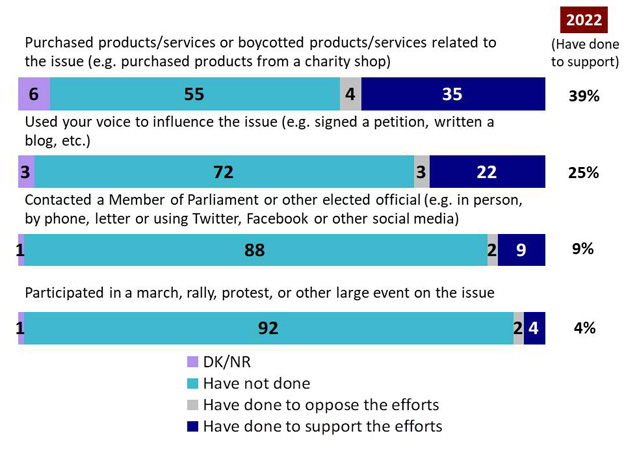
Canadians were also asked about their actions in support of or opposition to efforts to address global poverty. Most say they have not taken any of the actions presented in the survey. About 1 in 3 (35%, down from 39% in 2022) say they have purchased products/services or boycotted products/services to support efforts aimed at reducing global poverty. About 1 in 5 (22%, down 3 percentage points since 2022) say they have taken action such as signing a petition or writing a blog to support efforts aimed at addressing global poverty. Very few say they have contacted a Member of Parliament or other elected official (9%) or participated in a march, rally, protest, or other large event (4%) to support the efforts of addressing global poverty. Virtually no one has undertaken any of these actions to oppose efforts to address global poverty.
Views on international development NGOs and charities
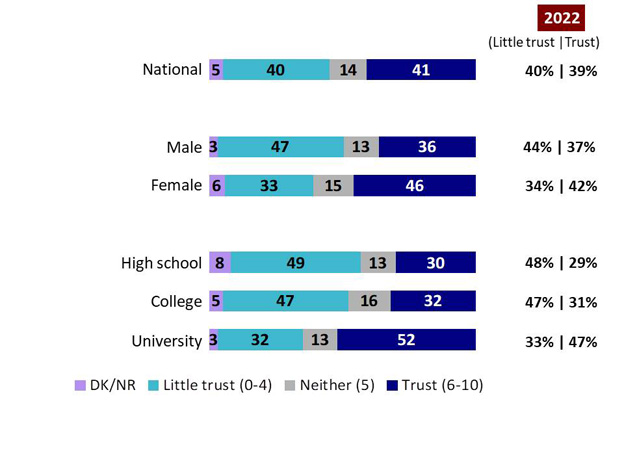
Canadians were also asked to rate the level of trust they have in international development NGOs and charities. Results reveal very mixed views on this issue. About 4 in 10 (41%) say they trust these types of organizations; however, roughly the same proportion (40%) express little trust in them. These results are largely the same as those found last year.
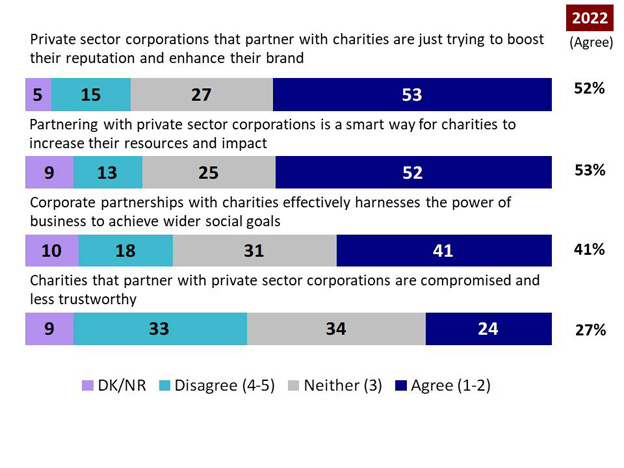
When asked for their views on corporate partnerships between private sector business and charities, results again reveal mixed views. Just over half of Canadians (53%) agree that partnering with private sector corporations is a smart way for charities to increase their resources and impact. However, roughly the same proportion (52%) agree that private sector corporations that partner with charities are just trying to boost their reputation and enhance their brand. About 4 in 10 (41%) feel that corporate partnerships with charities effectively harness the power of business to achieve wider social goals, and 1 in 4 (24%) agree that charities that partner with private sector corporations are compromised and less trustworthy. Again, results are largely unchanged since 2022.
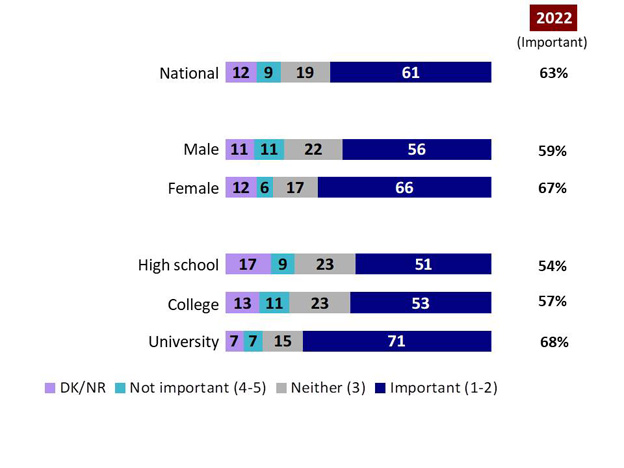
Results also reveal that the majority of Canadians (61%) feel it is important that large international development NGOs partner with local NGOs to deliver aid programs and funding; only 9% feel this is not important.
Conclusions and implications
Survey results reveal Canadians generally have positive and stable attitudes about international aid and its role in fighting global poverty. They support federal government aid to poor countries, and most think that international aid should at least stay at the current levels. Canadians understand that international aid helps other countries become self-sufficient and should be driven by altruistic reasons to reduce poverty, not for realist purposes such as promoting Canada’s national interest abroad.
Canadians think that there are many advantages to international aid. Specifically, they feel that international aid can improve people’s lives by providing access to education, health care, and clean water. Moreover, Canadians continue to think that the federal government can afford to continue providing international aid.
There are caveats to this overall positive picture. Many Canadians think that international aid is ineffective and that corporations, the United Nations, and international NGOs can do more to reduce poverty than can the Canadian government. Many Canadians also think that Canadian foreign aid does not always get to its intended recipients and often ends up in the pockets of corrupt politicians.
Overall, however, Canadians continue to see global poverty as a serious problem and are widely supportive of providing international aid to poor countries. Furthermore, Canadians generally think that there is an interconnectedness between themselves and the rest of the world. They believe in global cooperation and reject isolationism. Canadians see themselves as part of a global community in which prosperity is achieved by working with other countries, and that poverty in other countries also affects Canadians themselves negatively.
Key demographic and regional differences
Throughout the survey, women are more likely than men to express positive views about international aid and its intended purpose to combat global poverty. Women are also more likely to express views consistent with international cooperation and multilateralism. They are not as pessimistic about foreign aid likely ending up in the hands of corrupt politicians and they are more likely to engage in global poverty activism, such as signing a petition or boycotting products/services.
Findings also reveal significant differences between university-educated Canadians and those with lower education levels. As was the case with the responses by women, Canadians with a university degree have more positive views about international aid and are less cynical about its intended purposes. They are more likely to think that it is important that Canada continue to provide foreign assistance and that the goal should be to reduce global poverty, not advance Canada’s national interest. Moreover, those with university education are more likely to participate and engage in global poverty activism than Canadians without a university degree.
There are also key differences among the age groups, most notably between younger Canadians (aged 18 to 34) and older Canadians (aged 65 and over). Older Canadians hold a somewhat more positive view of international aid and are more likely to think that matters taking place outside Canada affect them. They are consistently more likely to express support for boosting international aid. Notably, younger Canadians are significantly less likely to believe that the primary purpose of aid is to reduce poverty in poorer countries; rather, they are more likely to see international aid as a means of bolstering Canada’s political influence and national security.
The survey also revealed some regional differences. Canadians in Quebec express the most positive views about international aid and its aims and express the most altruistic and internationalist views. Conversely, Canadians in the Prairie provinces, that is, Alberta, Saskatchewan, and Manitoba, are the most likely to be negative about the aims, purposes and results of international aid and more likely to express isolationist views.
D. Contract Value
The contract value for the POR project is $76, 670.50 (including HST).
This certification is to be submitted with the final report submitted to the Project Authority.
I hereby certify as Senior Officer of Ekos Research Associates Inc. that the deliverables fully comply with the Government of Canada political neutrality requirements outlined in the Communications Policy of the Government of Canada and Procedures for Planning and Contracting Public Opinion Research.
Specifically, the deliverables do not include information on electoral voting intentions, political party preferences, standings with the electorate, or ratings of the performance of a political party or its leaders.
Signed by Derek Jansen (Vice President)
Detailed Findings
A. Canadian World Views
Top 3 issues
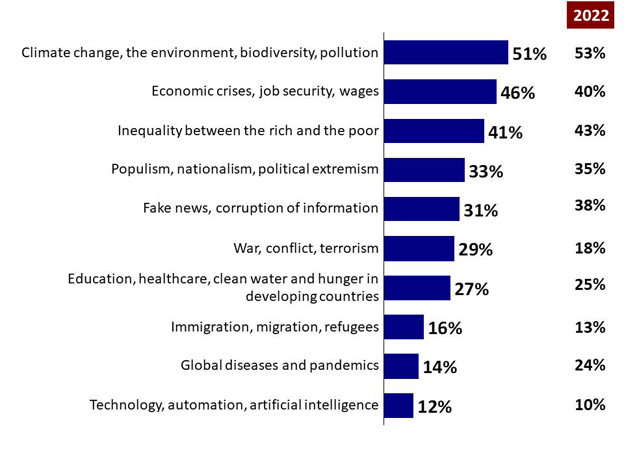
Canadians were first asked to choose from a list the top 3 global issues they care about personally. Results reveal that climate change/the environment are mentioned most often (51%), followed by economic crises, job security, wages (46%) and inequality between the rich and the poor (41%). Populism (33%), fake news (31%), war (29%), and social issues such as education, health care, and clean water and hunger in developing countries (27%) are seen as second-tier issues of importance to Canadians. Immigration/refugees (16%), pandemics (14%) and technology/artificial intelligence (12%) rank as the least important concerns among the issues examined.
Tracking from 2022 suggests that Canadians are growing comparatively more concerned about the economy (46%, up from 40% in 2022) and the threat of war, conflict, and terrorism (29%, up from 18%). In contrast, pandemics (14%, down from 24%) and fake news (31%, down from 38%) have declined in importance.
Chart 1: Top 3 issues
Chart 1: Top 3 issues. Text version below. - Text Version
This chart of single bars shows the percentage of results for responses to ten statements. One column on the side shows the percentage of results for 2022.
Respondents were asked: "Of the list below, which are the top three issues that you personally care about?"
Respondents selected:
Climate change, the environment, biodiversity, pollution: 51%; 2022: 53%
Q1A. Of the list below, which are the top 3 issues that you personally care about?
Base: Canadians; n=3,059
University graduates (59%), those living in Quebec (57%) and Atlantic Canada (57%), and women (57%) are more likely to select climate change/the environment as a top issue of concern.
Residents of Alberta (56%), those aged 18 to 34 (54%), and those aged 35 to 54 (52%) are more likely to say that economic crises/job security/wages is a top global concern.
Those aged 18 to 34 (47%) are more likely to list inequality between the rich and the poor as a top global issue.
Attitudes toward other countries
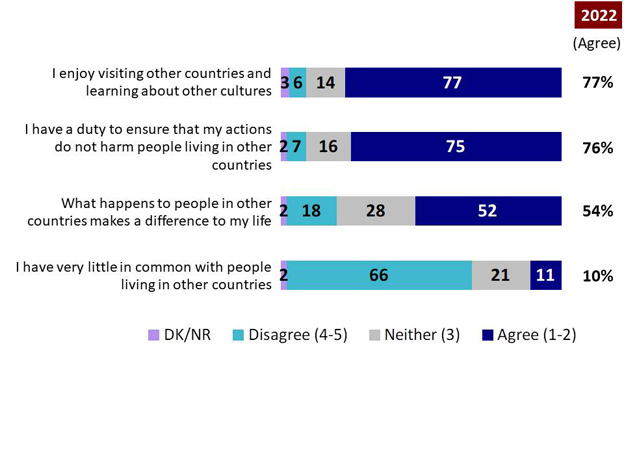
Respondents were also asked a number of questions about their views on other countries. Results reveal that Canadians have a strong sense of global citizenship. About three-quarters (77%) say they enjoy visiting other countries and learning about other cultures, and roughly the same proportion (75%) feel they have a duty to ensure their actions do not harm people living in other countries. About half of Canadians (52%) believe that what happens to people in other countries makes a difference to their own lives; only 11% feel they have very little in common with the people living in other countries. Tracking data from 2022 suggests Canadian attitudes toward other countries have remained stable over the past year.
Chart 2: Attitudes toward other countries
Chart 2: Attitudes toward other countries - Text Version
This stacked bar chart shows the percentage of results for responses to four statements across four categories: DK/NR, disagree, neither, and agree. One column on the side shows the percentage of results (agree) for 2022.
Respondents were asked: "Please say whether you agree or disagree with the following groups."
Respondents selected:
I enjoy visiting other countries and learning about other cultures
Category "DK/NR": 3%
Category "Disagree (4-5)": 6%
Category "Neither (3)": 14%
Category "Agree (1-2)": 77%; 2022: 77%
I have a duty to ensure that my actions do not harm people living in other countries
Category "DK/NR": 2%
Category "Disagree (4-5)": 7%
Category "Neither (3)": 16%
Category "Agree (1-2)": 75%; 2022: 76%
What happens to people in other countries makes a difference to my life
Category "DK/NR": 2%
Category "Disagree (4-5)": 18%
Category "Neither (3)": 28%
Category "Agree (1-2)": 52%; 2022: 54%
I have very little in common with people living in other countries
Category "DK/NR": 2%
Category "Disagree (4-5)": 66%
Category "Neither (3)": 21%
Category "Agree (1-2)": 11%; 2022: 10%
Base: Canadians; n=3,059
Q30a-d. Please say whether you agree or disagree with the following statements.
Base: Canadians; n=3,059
The likelihood of saying that they enjoy visiting other countries and learning about other cultures rises progressively with educational attainment (from 65% among high school graduates to 85% among university graduates), and income (from 63% among those earning less than $40,000 in household income to 88% among those earning $150,000 or more).
Agreement with the idea that they have a duty to ensure their actions do not harm people living in other countries is higher among those aged 65 and over (84%), women (81%), and university graduates (80%).
University graduates (61%) and Canadians aged 65 and over (61%) are particularly likely to agree that what happens to people in other countries makes a difference to their own lives.
Residents of Alberta (16%), high school graduates (16%), and men (14%) are more likely to agree that they have very little in common with people living in other countries.
Views on equality and compassion
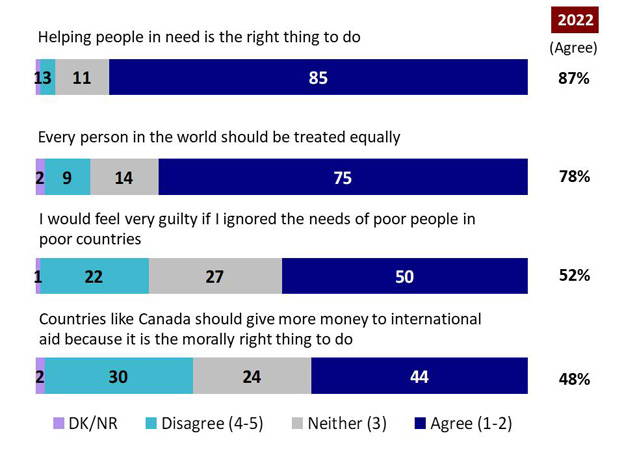
Canadians were asked a number of questions about global equality and compassion. Findings reveal that more than 8 in 10 (85%) agree that helping people in need is the right thing to do, and three-quarters (75%) agree that all people in the world should be treated equally. Half (50%) say they would feel very guilty if they ignored the needs of poor people in poor countries, and 4 in 10 (44%) believe countries like Canada should give more money to international aid because it is the morally right thing to do.
Tracking reveals a 4-point decline in the proportion of Canadians who believe Canada should be giving more money to international aid.
Chart 3: Views on equality and compassion
Chart 3: Views on equality and compassion - Text Version
This stacked bar chart shows the percentage of results for responses to four statements across four categories: DK/NR, disagree, neither, and agree. One column on the side shows the percentage of results (agree) for 2022.
Respondents were asked: "To what extent do you agree or disagree with the following groups?"
Respondents selected:
Helping people in need is the right thing to do
Category "DK/NR": 1%
Category "Disagree (4-5)": 3%
Category "Neither (3)": 11%
Category "Agree (1-2)": 85%; 2022: 87%
Every person in the world should be treated equally
Category "DK/NR": 2%
Category "Disagree (4-5)": 9%
Category "Neither (3)": 14%
Category "Agree (1-2)": 75%; 2022: 78%
I would feel very guilty if I ignored the needs of poor people in poor countries
Category "DK/NR": 1%
Category "Disagree (4-5)": 22%
Category "Neither (3)": 27%
Category "Agree (1-2)": 50%; 2022: 52%
Countries like Canada should give more money to international aid because it is the morally right thing to do
Category "DK/NR": 2%
Category "Disagree (4-5)": 30%
Category "Neither (3)": 24%
Category "Agree (1-2)": 44%; 2022: 48%
Base: Canadians; n=3,059
Q21a-d. To what extent do you agree or disagree with the following statements?
Base: Canadians; n=3,059
University graduates (89%) and women (88%) are more likely to agree that helping people in need is the right thing to do.
The likelihood of agreeing that all people in the world should be treated equally is higher among residents of Quebec (83%).
The likelihood of feeling guilty if they ignored the needs of poor people is higher among those aged 65 and over (58%), women (57%), and university graduates (57%).
Residents of Quebec (57%), those aged 65 and over (54%), university graduates (54%), and women (48%) are more likely to feel that countries like Canada should give more money to international aid, while Alberta residents (40%), college graduates (37%), men (36%), and those aged 35 to 54 (35%) are more apt to disagree that Canada should give more money to international aid.
Views on securing a prosperous and safe country
When asked how to secure a prosperous and safe country, most Canadians (64%, identical to last year) believe we are best placed to do this in cooperation with other countries. Very few (17%) think we are best placed to secure a prosperous and safe country on our own.
Chart 4: Views on securing a prosperous and safe country
Chart 4: Views on securing a prosperous and safe country - Text Version
This stacked bar chart shows the percentage of results for responses to seven groups across four categories: DK/NR, on our own, neither, and with other countries. One column on the side shows the percentage of results (with other countries) for 2022.
Respondents were asked: "Which of the following best reflects your view on how to secure a prosperous and safe country? Using the 0 – 10 scale, where 0 means 'We are best placed to do it on our own' and 10 means 'We are best placed to do it in cooperation with other countries', please indicate how you feel."
Respondents selected:
National
Category "DK/NR": 7%
Category "On our own (0-4)": 17%
Category "Neither (5)": 12%
Category "With other countries (6-10)": 64%; 2022: 64%
Male
Category "DK/NR": 6%
Category "On our own (0-4)": 20%
Category "Neither (5)": 12%
Category "With other countries (6-10)": 63%; 2022: 65%
Female
Category "DK/NR": 7%
Category "On our own (0-4)": 13%
Category "Neither (5)": 13%
Category "With other countries (6-10)": 67%; 2022: 65%
18-34 years
Category "DK/NR": 10%
Category "On our own (0-4)": 15%
Category "Neither (5)": 14%
Category "With other countries (6-10)": 61%; 2022: 60%
35-54 years
Category "DK/NR": 6%
Category "On our own (0-4)": 20%
Category "Neither (5)": 12%
Category "With other countries (6-10)": 63%; 2022: 62%
55-64 years
Category "DK/NR": 6%
Category "On our own (0-4)": 18%
Category "Neither (5)": 13%
Category "With other countries (6-10)": 64%; 2022: 68%
65+-years
Category "DK/NR": 4%
Category "On our own (0-4)": 12%
Category "Neither (5)": 10%
Category "With other countries (6-10)":73 %; 2022: 72%
Base: Canadians; n=3,059
Q23. Which of the following best reflects your view on how to secure a prosperous and safe country? Using the 0 to 10 scale, where 0 means 'We are best placed to do it on our own' and 10 means 'We are best placed to do it in cooperation with other countries', please indicate how you feel.
Base: Canadians; n=3,059
Those aged 65 and over (73%), university graduates (72%), and those earning $150,000 or more in household income (70%) are more likely to agree that we are best placed to secure a prosperous and safe country in cooperation with other countries.
Conversely, men (20%) are more likely to believe that we are best placed to secure a prosperous and safe country on our own.
Views on coexistence
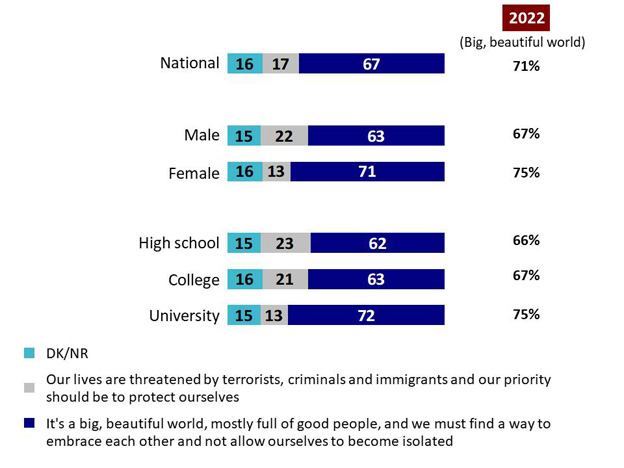
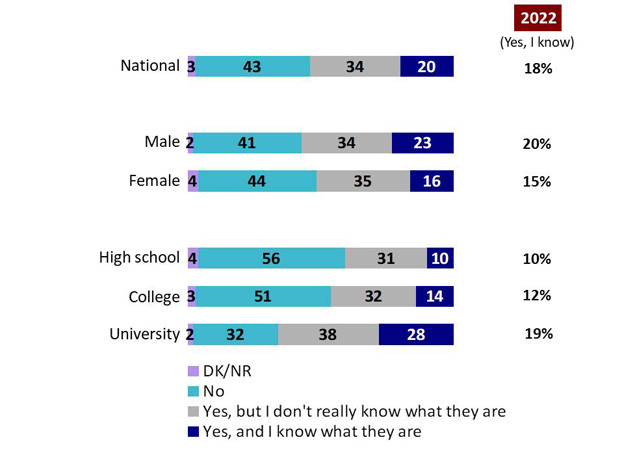
In terms of views on coexistence with others in the world, two-thirds of Canadians (67%) agree that it’s a big, beautiful world, mostly full of good people, and we should not allow ourselves to become isolated, although this is down 4 percentage points since 2022. Only 16% believe that our lives are threatened by terrorists, criminals and immigrants and our priority should be to protect ourselves.
Chart 5: Views on coexistence
Chart 5: Views on coexistence - Text Version
This stacked bar chart shows the percentage of results for responses to six groups across four categories: DK/NR, our lives are threatened by terrorists, criminals and immigrants and our priority should be to protect ourselves, and it's a big, beautiful world, mostly full of good people, and we must find a way to embrace each other and not allow ourselves to become isolated. One column on the side shows the percentage of results (big, beautiful world) for 2022.
Respondents were asked: "Which of the following two groups comes closest to your view?"
Respondents selected:
National
Category "DK/NR": 16%
Category "Our lives are threatened by terrorists, criminals and immigrants and our priority should be to protect ourselves": 17%
Category "It's a big, beautiful world, mostly full of good people, and we must find a way to embrace each other and not allow ourselves to become isolated": 67%; 2022: 71%
Male
Category "DK/NR": 15%
Category "Our lives are threatened by terrorists, criminals and immigrants and our priority should be to protect ourselves": 22%
Category "It's a big, beautiful world, mostly full of good people, and we must find a way to embrace each other and not allow ourselves to become isolated": 63%; 2022: 67%
Female
Category "DK/NR": 16%
Category "Our lives are threatened by terrorists, criminals and immigrants and our priority should be to protect ourselves": 13%
Category "It's a big, beautiful world, mostly full of good people, and we must find a way to embrace each other and not allow ourselves to become isolated": 71%; 2022: 75%
High school
Category "DK/NR": 15%
Category "Our lives are threatened by terrorists, criminals and immigrants and our priority should be to protect ourselves": 23%
Category "It's a big, beautiful world, mostly full of good people, and we must find a way to embrace each other and not allow ourselves to become isolated": 62%; 2022: 66%
College
Category "DK/NR": 16%
Category "Our lives are threatened by terrorists, criminals and immigrants and our priority should be to protect ourselves": 21%
Category "It's a big, beautiful world, mostly full of good people, and we must find a way to embrace each other and not allow ourselves to become isolated": 63%; 2022: 67%
University
Category "DK/NR": 15%
Category "Our lives are threatened by terrorists, criminals and immigrants and our priority should be to protect ourselves": 13%
Category "It's a big, beautiful world, mostly full of good people, and we must find a way to embrace each other and not allow ourselves to become isolated": 72%; 2022: 75%
Base: Canadians; n=3,059
Q25. Which of the following two statements comes closest to your view?
Base: Canadians; n=3,059
University graduates (72%) and women (71%) are more likely to agree that it’s a big, beautiful world and we must find a way to embrace each other.
World outlook
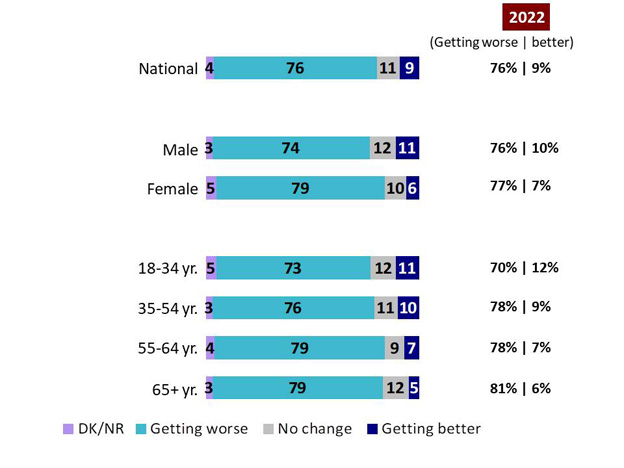
Despite a generally positive world outlook when asked whether they think the world is getting better, worse, or if there has been no change, results reveal a fair bit of pessimism among Canadians: fully 76% agree that the world is getting worse; only 9% feel it is getting better. These findings are unchanged from 2022.
Chart 6: World outlook
Chart 6: World outlook - Text Version
This stacked bar chart shows the percentage of results for responses to seven groups across four categories: DK/NR, getting worse, no change, and getting better. Two columns on the side show the percentage of results (getting worse and better) for 2022.
Respondents were asked: "All things considered, do you think the world is getting better, getting worse, or has there been no change?"
Respondents selected:
National
Category "DK/NR": 4%
Category "Getting worse": 76%; 2022: 76%
Category "No change": 11%
Category "Getting better": 9%; 2022: 9%
Male
Category "DK/NR": 3%
Category "Getting worse": 74%; 2022: 76%
Category "No change": 12%
Category "Getting better": 11%; 2022: 10%
Female
Category "DK/NR": 5%
Category "Getting worse": 79%; 2022: 77%
Category "No change": 10%
Category "Getting better": 6%; 2022: 7%
18-34 years
Category "DK/NR": 5%
Category "Getting worse": 73%; 2022: 70%
Category "No change": 12%
Category "Getting better": 11%; 2022: 12%
35-54 years
Category "DK/NR": 3%
Category "Getting worse": 76%; 2022: 78%
Category "No change": 11%
Category "Getting better": 10%; 2022: 9%
55-64 years
Category "DK/NR": 4%
Category "Getting worse": 79%; 2022: 78%
Category "No change": 9%
Category "Getting better": 7%; 2022: 7%
65+-years
Category "DK/NR": 3%
Category "Getting worse": 79%; 2022: 81%
Category "No change": 12%
Category "Getting better": 5%; 2022: 6%
Base: Canadians; n=3,059
Q2. All things considered, do you think the world is getting better, getting worse, or has there been no change?
Base: Canadians; n=3,059
Those earning $150,000 or more in household income (14%) and men (11%) are more likely to feel the world is getting better.
Views on prioritizing basic needs versus the environment
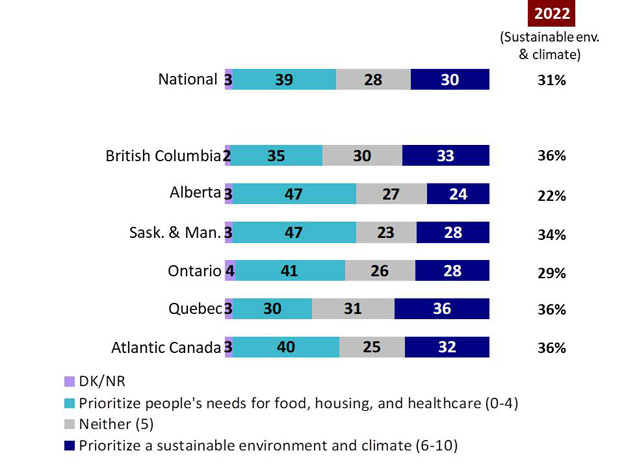
Canadians were asked about prioritizing a sustainable environment and climate versus people’s basic needs for food, housing, and health care. Results are split, although a plurality prioritizes food, housing, and health care (39%). Fewer prioritize a sustainable environment and climate (30%). Interestingly, a fairly large proportion of Canadians (28%) indicate neither, suggesting they think both of these issues should be prioritized. These findings are largely unchanged from 2022.
Chart 7: Views on prioritizing basic needs versus the environment
Chart 7: Views on prioritizing basic needs versus the environment - Text Version
This stacked bar chart shows the percentage of results for responses to seven groups across four categories: DK/NR, prioritize people's needs for food, housing, and healthcare, neither, and prioritize a sustainable environment and climate. One column on the side shows the percentage of results (sustainable environment and climate) for 2022.
Respondents were asked: "For the following question, please think about the world as a whole and not individual countries. Some people say that there is a trade-off between prioritizing economic growth to meet people's needs for food, housing, and healthcare versus prioritizing a sustainable environment, climate, and fertile soils. Using a 0 to 10 scale, where 0 means 'Prioritize people's needs for food, housing, and healthcare' and 10 means 'Prioritize a sustainable environment and climate', please indicate which statement comes closer to your view."
Respondents selected:
National
Category "DK/NR": 3%
Category "Prioritize people's needs for food, housing, and healthcare (0-4)": 39%
Category "Neither (5)": 28%
Category "Prioritize a sustainable environment and climate (6-10)": 30%; 2022: 31%
British Columbia
Category "DK/NR": 2%
Category "Prioritize people's needs for food, housing, and healthcare (0-4)": 35%
Category "Neither (5)": 30%
Category "Prioritize a sustainable environment and climate (6-10)": 33%; 2022: 36%
Alberta
Category "DK/NR": 3%
Category "Prioritize people's needs for food, housing, and healthcare (0-4)": 47%
Category "Neither (5)": 27%
Category "Prioritize a sustainable environment and climate (6-10)": 24%; 2022: 22%
Saskatchewan and Manitoba
Category "DK/NR": 3%
Category "Prioritize people's needs for food, housing, and healthcare (0-4)": 47%
Category "Neither (5)": 23%
Category "Prioritize a sustainable environment and climate (6-10)": 28%; 2022: 34%
Ontario
Category "DK/NR": 4%
Category "Prioritize people's needs for food, housing, and healthcare (0-4)": 41%
Category "Neither (5)": 26%
Category "Prioritize a sustainable environment and climate (6-10)": 28%; 2022: 29%
Quebec
Category "DK/NR": 3%
Category "Prioritize people's needs for food, housing, and healthcare (0-4)": 30%
Category "Neither (5)": 31%
Category "Prioritize a sustainable environment and climate (6-10)": 36%; 2022: 36%
Atlantic Canada
Category "DK/NR": 3%
Category "Prioritize people's needs for food, housing, and healthcare (0-4)": 40%
Category "Neither (5)": 25%
Category "Prioritize a sustainable environment and climate (6-10)": 32%; 2022: 36%
Base: Canadians; n=3,059
Q27. Using a 0 to 10 scale, where 0 means 'Prioritize people’s needs for food, housing, and health care' and 10 means 'Prioritize a sustainable environment and climate', please indicate the statement that comes closer to your view.
Base: Canadians; n=3,059
Agreement with the idea that we should prioritize people’s needs for food, housing, and health care is higher among college graduates (44%) and men (43%).
Residents of Quebec (36%) and university graduates (35%) are more likely to respond that we should prioritize a sustainable environment and climate.
Influence on politics and public affairs
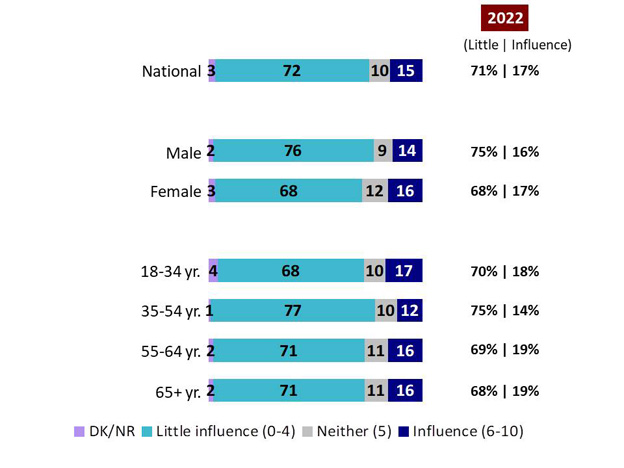
When asked how much influence they feel they have on politics and public affairs, most Canadians continue to feel they exert little influence on public policy. Only 15% think they have some influence in public affairs, while fully 7 in 10 (72%) think they have little influence in this area. Tracking suggests that Canadians’ outlook on their influence on politics and public affairs has remained stable over the past year.
Chart 8: Perceived influence on politics and public affairs
Chart 8: Perceived influence on politics and public affairs - Text Version
This stacked bar chart shows the percentage of results for responses to seven groups across four categories: DK/NR, little influence, neither, and influence. Two columns on the side show the percentage of results (little influence and influence) for 2022.
Respondents were asked: "On a scale from 0 to 10, where 0 means 'have no influence' and 10 means 'have a great deal of influence', how much influence, if any, do you have on politics and public affairs?"
Respondents selected:
National
Category "DK/NR": 3%
Category "Little influence (0-4)": 72%; 2022: 71%
Category "Neither (5)": 10%
Category "Influence (6-10)": 15%; 2022: 17%
Male
Category "DK/NR": 2%
Category "Little influence (0-4)": 76%; 2022: 75%
Category "Neither (5)": 9%
Category "Influence (6-10)": 14%; 2022: 16%
Female
Category "DK/NR": 3%
Category "Little influence (0-4)": 68%; 2022: 68%
Category "Neither (5)": 12%
Category "Influence (6-10)": 16%; 2022: 17%
18-34 years
Category "DK/NR": 4%
Category "Little influence (0-4)": 68%; 2022: 70%
Category "Neither (5)": 10%
Category "Influence (6-10)": 17%; 2022: 18%
35-54 years
Category "DK/NR": 1%
Category "Little influence (0-4)": 77%; 2022: 75%
Category "Neither (5)": 10%
Category "Influence (6-10)": 12%; 2022: 14%
55-64 years
Category "DK/NR": 2%
Category "Little influence (0-4)": 71%; 2022: 69%
Category "Neither (5)": 11%
Category "Influence (6-10)": 16%; 2022: 19%
65+-years
Category "DK/NR": 2%
Category "Little influence (0-4)": 71%; 2022: 68%
Category "Neither (5)": 11%
Category "Influence (6-10)": 16%; 2022: 19%
Base: Canadians; n=3,059
Q22. On a scale from 0 to 10, where 0 means 'have no influence' and 10 means 'have a great deal of influence', how much influence, if any, do you have on politics and public affairs?
Base: Canadians; n=3,059
Those aged 35 to 54 (77%) and men (76%) are more likely to say they have little influence on politics and public affairs.
Views on democracy
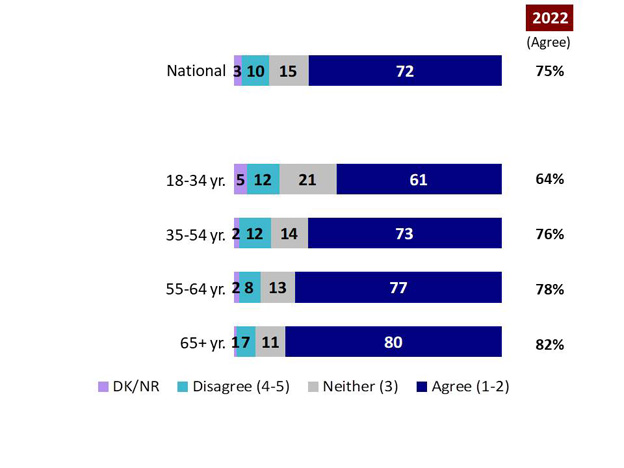
Survey results indicate that Canadians strongly believe democracy is about achieving compromise among differing viewpoints. Fully 72% of Canadians agree with this idea; only 10% disagree. These results are largely consistent with those found in 2022.
Chart 9: Views on democracy
Chart 9: Views on democracy - Text Version
This stacked bar chart shows the percentage of results for responses to five groups across four categories: DK/NR, disagree, neither, and agree. One column on the side shows the percentage of results (agree) for 2022.
Respondents were asked: "To what extent do you agree or disagree with the following statement: Democracy is about achieving compromise among differing viewpoints?"
Respondents selected:
National
Category "DK/NR": 3%
Category "Disagree (4-5)": 10%
Category "Neither (3)": 15%
Category "Agree (1-2)": 72%; 2022: 75%
18-34 years
Category "DK/NR": 5%
Category "Disagree (4-5)": 12%
Category "Neither (3)": 21%
Category "Agree (1-2)": 61%; 2022: 64%
35-54 years
Category "DK/NR": 2%
Category "Disagree (4-5)": 12%
Category "Neither (3)": 14%
Category "Agree (1-2)": 73%; 2022: 76%
55-64 years
Category "DK/NR": 2%
Category "Disagree (4-5)": 8%
Category "Neither (3)": 13%
Category "Agree (1-2)": 77%; 2022: 78%
65+ years
Category "DK/NR": 1%
Category "Disagree (4-5)": 7%
Category "Neither (3)": 11%
Category "Agree (1-2)": 80%; 2022: 82%
Base: Canadians; n=3,059
Q24. To what extent do you agree or disagree with the following statement: Democracy is about achieving compromise among differing viewpoints.
Base: Canadians; n=3,059
Agreement with the idea that democracy is about achieving compromise among differing viewpoints rises progressively with age (from 61% among those aged 18 to 34 to 80% among those aged 65 and over).
Agreement that democracy is about achieving compromise also rises progressively with household income (from 67% among those with an annual household income of less than $40,000 to 77% among those earning $150,000 or more).
Opinion on whether people get what they deserve
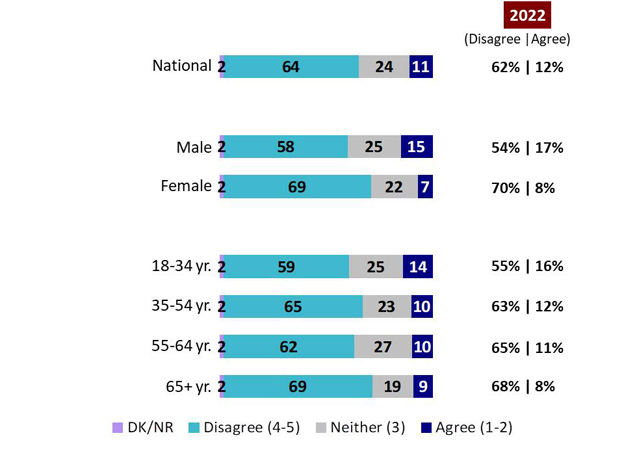
Results also reveal that most Canadians (64%) disagree that people get what they deserve generally speaking. Just 1 in 10 (11%) agree. Opinions on whether people get what they deserve have remained stable over the past year.
Chart 10: Opinion on whether people get what they deserve
Chart 10: Opinion on whether people get what they deserve - Text Version
This stacked bar chart shows the percentage of results for responses to seven groups across four categories: DK/NR, disagree, neither, and agree. Two columns on the side show the percentage of results (disagree and agree) for 2022.
Respondents were asked: "Please say whether you agree or disagree with the following statements: Generally speaking, people get what they deserve?"
Respondents selected:
National
Category "DK/NR": 2%
Category "Disagree (4-5)": 64%; 2022: 62%
Category "Neither (3)": 24%
Category "Agree (1-2)": 11%; 2022: 12%
Male
Category "DK/NR": 2%
Category "Disagree (4-5)": 58%; 2022: 54%
Category "Neither (3)": 25%
Category "Agree (1-2)": 15%; 2022: 17%
Female
Category "DK/NR": 2%
Category "Disagree (4-5)": 69%; 2022: 70%
Category "Neither (3)": 22%
Category "Agree (1-2)": 7%; 2022: 8%
18-34 years
Category "DK/NR": 2%
Category "Disagree (4-5)": 59%; 2022: 55%
Category "Neither (3)": 25%
Category "Agree (1-2)": 14%; 2022: 16%
35-54 years
Category "DK/NR": 2%
Category "Disagree (4-5)": 65%; 2022: 63%
Category "Neither (3)": 23%
Category "Agree (1-2)": 10%; 2022: 12%
55-64 years
Category "DK/NR": 2%
Category "Disagree (4-5)": 62%; 2022: 65%
Category "Neither (3)": 27%
Category "Agree (1-2)": 10%; 2022: 11%
65+ years
Category "DK/NR": 2%
Category "Disagree (4-5)": 69%; 2022: 68%
Category "Neither (3)": 19%
Category "Agree (1-2)": 9%; 2022: 8%
Base: Canadians; n=3,059
Q29. Please say whether you agree or disagree with the following statements: Generally speaking, people get what they deserve.
Base: Canadians; n=3,059
Disagreement with the idea that, generally speaking, people get what they deserve is higher among university graduates (71%), women (69%), and those aged 65 and over (69%).
B. Concern About Global Poverty
Views on developing countries
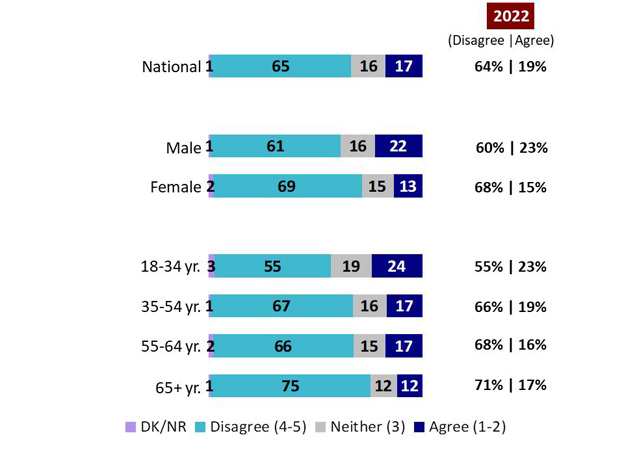
Survey results reveal strong disagreement with the statement that what happens in developing countries rarely affects people living in Canada. Only 1 in 6 Canadians (17%) agree with this statement, and two-thirds (65%) disagree with it. These results are consistent with those found in 2022.
Chart 11: Views on developing countries
Chart 11: Views on developing countries - Text Version
This stacked bar chart shows the percentage of results for responses to seven groups across four categories: DK/NR, disagree, neither, and agree. Two columns on the side show the percentage of results (disagree and agree) for 2022.
Respondents were asked: "To what extent do you agree or disagree with the following statement: What happens in developing countries rarely affects people like me living in Canada?"
Respondents selected:
National
Category "DK/NR": 1%
Category "Disagree (4-5)": 65%; 2022: 64%
Category "Neither (3)": 16%
Category "Agree (1-2)": 17%; 2022: 19%
Male
Category "DK/NR": 1%
Category "Disagree (4-5)": 61%; 2022: 60%
Category "Neither (3)": 16%
Category "Agree (1-2)": 22%; 2022: 23%
Female
Category "DK/NR": 2%
Category "Disagree (4-5)": 69%; 2022: 68%
Category "Neither (3)": 15%
Category "Agree (1-2)": 13%; 2022: 15%
18-34 years
Category "DK/NR": 3%
Category "Disagree (4-5)": 55%; 2022: 55%
Category "Neither (3)": 19%
Category "Agree (1-2)": 24%; 2022: 23%
35-54 years
Category "DK/NR": 1%
Category "Disagree (4-5)": 67%; 2022: 66%
Category "Neither (3)": 16%
Category "Agree (1-2)": 17%; 2022: 19%
55-64 years
Category "DK/NR": 2%
Category "Disagree (4-5)": 66%; 2022: 68%
Category "Neither (3)": 15%
Category "Agree (1-2)": 17%; 2022: 16%
65+ years
Category "DK/NR": 1%
Category "Disagree (4-5)": 75%; 2022: 71%
Category "Neither (3)": 12%
Category "Agree (1-2)": 12%; 2022: 17 %
Base: Canadians; n=3,059
Q3. To what extent do you agree or disagree with the following statement: What happens in developing countries rarely affects people like me living in Canada.
Base: Canadians; n=3,059
Disagreement with the idea that what happens in developing countries rarely affects people living in Canada is higher among those aged 65 and over (75%), university graduates (71%), and women (69%).
Views on poverty in poor countries
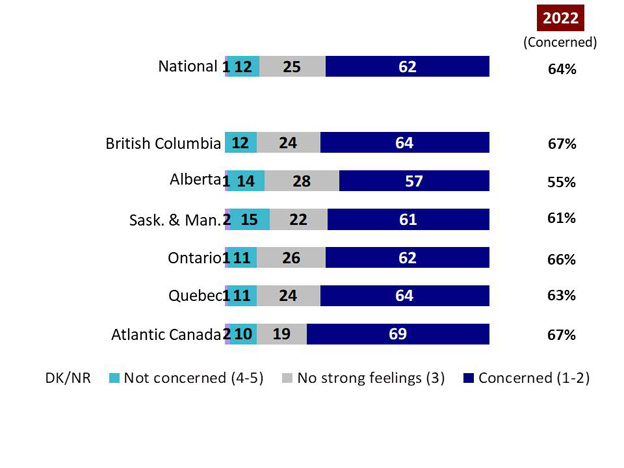
When asked how concerned they are about levels of poverty in poor countries, the majority of Canadians (62%) express concern about this issue; only 12% say they are not concerned about poverty in poor countries. These results have remained stable since 2022.
Chart 12: Views on poverty in poor countries
Chart 12: Views on poverty in poor countries - Text Version
This stacked bar chart shows the percentage of results for responses to seven groups across four categories: DK/NR, not concerned, no strong feelings, and concerned. One column on the side shows the percentage of results (concerned) for 2022.
Respondents were asked: "Which best describes how you feel about levels of poverty in poor countries?"
Respondents selected:
National
Category "DK/NR": 1%
Category "Not concerned (4-5)": 12%
Category "No strong feelings (3)": 25%
Category "Concerned (1-2)": 62%; 2022: 64%
British Columbia
Category "DK/NR": 0%
Category "Not concerned (4-5)": 12%
Category "No strong feelings (3)": 24%
Category "Concerned (1-2)": 64%; 2022: 67%
Alberta
Category "DK/NR": 1%
Category "Not concerned (4-5)": 14%
Category "No strong feelings (3)": 28%
Category "Concerned (1-2)": 57%; 2022: 55%
Saskatchewan and Manitoba
Category "DK/NR": 2%
Category "Not concerned (4-5)": 15%
Category "No strong feelings (3)": 22%
Category "Concerned (1-2)": 61%; 2022: 61%
Ontario
Category "DK/NR": 1%
Category "Not concerned (4-5)": 11%
Category "No strong feelings (3)": 26%
Category "Concerned (1-2)": 62%; 2022: 66%
Quebec
Category "DK/NR": 1%
Category "Not concerned (4-5)": 11%
Category "No strong feelings (3)": 24%
Category "Concerned (1-2)": 64%; 2022: 63%
Atlantic Canada
Category "DK/NR": 2%
Category "Not concerned (4-5)": 10%
Category "No strong feelings (3)": 19%
Category "Concerned (1-2)": 69%; 2022: 67%
Base: Canadians; n=3,059
Q5. Which best describes how you feel about levels of poverty in poor countries?
Base: Canadians; n=3,059
Those aged 65 and over (71%), women (70%), and university graduates (69%) are more likely to be concerned about levels of poverty in poor countries.
Organizations that could make a difference in reducing poverty
When asked to what extent they think various organizations are able to make a difference in reducing poverty in poor countries, Canadians feel that many of these organizations can make a difference in reducing world poverty, but are less confident in the Government of Canada’s capacity and their own ability to make an impact in this area. The majority of Canadians (62%) believe that businesses can make a difference in reducing poverty in poor countries, followed closely by the United Nations and other international organizations (60%), and development NGOs/charities (54%). About 4 in 10 Canadians (42%, down 3 percentage points since last year) believe the Canadian government can make a difference in reducing world poverty; only 12% believe that they personally can make a difference in reducing poverty in poor countries.
Chart 13: Organizations that could make a difference in reducing poverty
Chart 13: Organizations that could make a difference in reducing poverty - Text Version
This stacked bar chart shows the percentage of results for responses to five statements across four categories: DK/NR, no difference, neither, and great deal. One column on the side shows the percentage of results (great deal) for 2022.
Respondents were asked: "How much of a difference, if any, do you think each of the following can make to reducing poverty in poor countries?"
Respondents selected:
Businesses/corporations
Category "DK/NR": 3%
Category "No difference (0-4)": 23%
Category "Neither (5)": 12%
Category "Great deal (6-10)": 62%; 2022: 63%
The United Nations and other international organizations
Category "DK/NR": 3%
Category "No difference (0-4)": 26%
Category "Neither (5)": 11%
Category "Great deal (6-10)": 60%; 2022: 59%
Development NGOs/charities
Category "DK/NR": 4%
Category "No difference (0-4)": 29%
Category "Neither (5)": 13%
Category "Great deal (6-10)": 54%; 2022: 56%
The Canadian government
Category "DK/NR": 3%
Category "No difference (0-4)": 40%
Category "Neither (5)": 15%
Category "Great deal (6-10)": 42%; 2022: 45%
You personally
Category "DK/NR": 3%
Category "No difference (0-4)": 75%
Category "Neither (5)": 10%
Category "Great deal (6-10)": 12%; 2022: 13%
Base: Canadians; n=3,059
Q8a-e. How much of a difference, if any, do you think each of the following can make to reducing poverty in poor countries?
Base: Canadians; n=3,059
Residents of Quebec (68%), women (68%) and university graduates (67%) are more likely to say that businesses/corporations can make a great deal of difference in reducing poverty in poor countries, while residents of Alberta are more likely to say businesses have little to no ability to effect change in this area (31%).
Residents of Quebec (69%), women (68%), university graduates (67%), and those aged 18 to 34 (65%) are more likely to believe that the United Nations and other international organizations can make a difference in reducing poverty in poor countries.
University graduates (62%), residents of Quebec (60%), and women (60%) are more likely to say that development NGOs/charities can make a difference.
Those aged 65 and over (50%), residents of Quebec (50%), women (48%), and university graduates (48%) are more likely to say the Canadian government can make a difference in reducing poverty in poor countries, while residents of Alberta are more likely to disagree with this idea (49%).
Residents of Quebec (18%) and women (15%) are more likely to believe that they personally can make a difference in reducing poverty in poor countries.
Outlook on extreme poverty
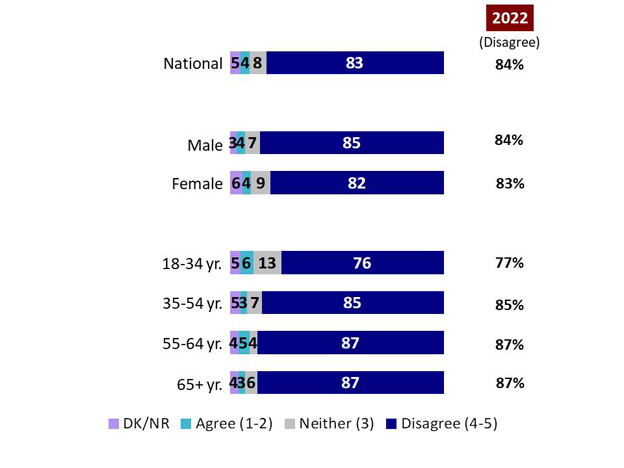
Despite a belief that many organizations can make a difference in reducing poverty in poor countries, results reveal pessimism about actually ending global poverty in the near future. When asked whether they think extreme poverty will be eradicated by the year 2030, a clear majority of Canadians (83%) disagree with this idea; only 4% agree. This sense of pessimism has remained largely stable over the past year.
Chart 14: Outlook on extreme poverty
Chart 14: Outlook on extreme poverty - Text Version
This stacked bar chart shows the percentage of results for responses to seven groups across four categories: DK/NR, agree, neither, and disagree. One column on the side shows the percentage of results (disagree) for 2022.
Respondents were asked: "Please say whether you agree or disagree with the following statements."
Respondents selected:
National
Category "DK/NR": 5%
Category "Agree (1-2)": 4%
Category "Neither (3)": 8%
Category "Disagree (4-5)": 83%; 2022: 84%
Male
Category "DK/NR": 3%
Category "Agree (1-2)": 4%
Category "Neither (3)": 7%
Category "Disagree (4-5)": 85%; 2022: 84%
Female
Category "DK/NR": 6%
Category "Agree (1-2)": 4%
Category "Neither (3)": 9%
Category "Disagree (4-5)": 82%; 2022: 83%
18-34 years
Category "DK/NR": 5%
Category "Agree (1-2)": 6%
Category "Neither (3)": 13%
Category "Disagree (4-5)": 76%; 2022: 77%
35-54 years
Category "DK/NR": 5%
Category "Agree (1-2)": 3%
Category "Neither (3)": 7%
Category "Disagree (4-5)": 85%; 2022: 85%
55-64 years
Category "DK/NR": 4%
Category "Agree (1-2)": 5%
Category "Neither (3)": 4%
Category "Disagree (4-5)": 87%; 2022: 87%
65+ years
Category "DK/NR": 4%
Category "Agree (1-2)": 3%
Category "Neither (3)": 6%
Category "Disagree (4-5)": 87%; 2022: 87%
Base: Canadians; n=3,059
Q28. Please say whether you agree or disagree with the following statements: Extreme poverty will be eradicated for all people everywhere by the year 2030.
Base: Canadians; n=3,059
Disagreement with the idea that extreme poverty will be eradicated by the year 2030 rises progressively with age (from 76% among those aged 18 to 34, to 87% among those aged 55 and over).
C. Views on International Aid
Views on Government of Canada international aid
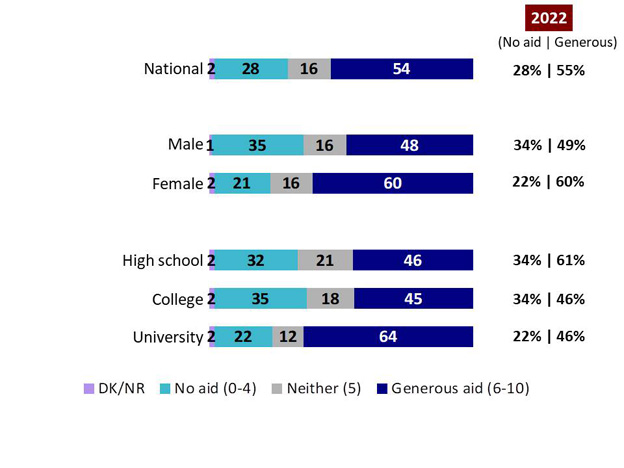
Results suggest fairly strong levels of support for providing international aid to poor countries. Just over half of Canadians (54%) think that the Government of Canada should give international aid to poor countries; only about 3 in 10 (28%) believe the government should not provide this type of aid. These results are consistent with those found in 2022.
Chart 15: Views on Government of Canada international aid
Chart 15: Views on Government of Canada international aid - Text Version
This stacked bar chart shows the percentage of results for responses to six groups across four categories: DK/NR, no aid, neither, and generous aid. Two columns on the side show the percentage of results (no aid and generous aid) for 2022.
Respondents were asked: "Thinking about international aid to poor countries - please indicate the extent to which you think that the Government of Canada should give international aid, where a score of 0 means that it 'should not give aid at all' and a score of 10 means that it 'should give aid very generously'."
Respondents selected:
National
Category "DK/NR": 2%
Category "No aid (0-4)": 28%; 2022: 28%
Category "Neither (5)": 16%
Category "Generous aid (6-10)": 54%; 2022: 55%
Male
Category "DK/NR": 1%
Category "No aid (0-4)": 35%; 2022: 34%
Category "Neither (5)": 16%
Category "Generous aid (6-10)": 48%; 2022: 49%
Female
Category "DK/NR": 2%
Category "No aid (0-4)": 21%; 2022: 22%
Category "Neither (5)": 16%
Category "Generous aid (6-10)": 60%; 2022: 60%
High school
Category "DK/NR": 2%
Category "No aid (0-4)": 32%; 2022: 34%
Category "Neither (5)": 21%
Category "Generous aid (6-10)": 46%; 2022: 61%
College
Category "DK/NR": 2%
Category "No aid (0-4)": 35%; 2022: 34%
Category "Neither (5)": 18%
Category "Generous aid (6-10)": 45%; 2022: 46%
University
Category "DK/NR": 2%
Category "No aid (0-4)": 22%; 2022: 22%
Category "Neither (5)": 12%
Category "Generous aid (6-10)": 64%; 2022: 46%
Base: Canadians; n=3,059
Q6. Thinking about international aid to poor countries, please indicate the extent to which you think that the Government of Canada should give international aid, where a score of 0 means that it 'should not give aid at all' and a score of 10 means that it 'should give aid very generously'.
Base: Canadians; n=3,059
Residents of Quebec (65%), university graduates (64%), those aged 65 and over (64%), and women (60%) are more likely to feel the government should provide aid to poor countries.
Conversely, residents of Alberta (39%) are most likely to feel the government should not provide international aid to poor countries.
Views on spending on international aid
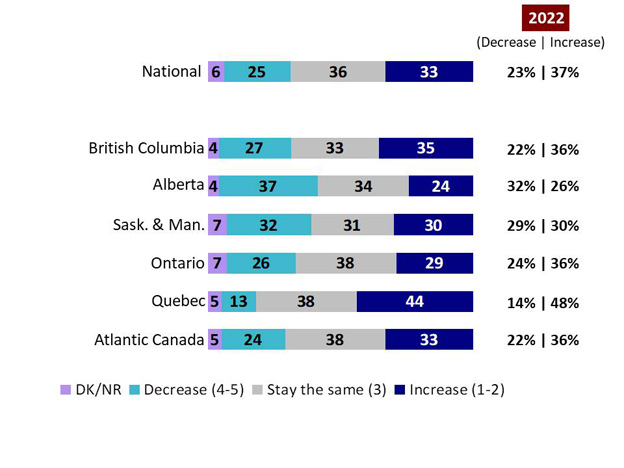
Canadians were asked whether they think that the Government of Canada should increase or decrease the amount of money that it spends on international aid to poor countries. Results reveal mixed views on this issue. A plurality (33%) say the government should increase the amount of money spent on international aid; however, 1 in 4 (25%) say the government should decrease its spending on international aid. About 1 in 3 Canadians (33%) feel the amount should stay the same. Tracking reveals that the proportion of Canadians who believe Canada should increase its spending on international aid has decreased 4 percentage points since 2022.
Chart 16: Views on spending on international aid
Chart 16: Views on spending on international aid - Text Version
This stacked bar chart shows the percentage of results for responses to seven groups across four categories: DK/NR, decrease, stay the same, and increase. Two columns on the side show the percentage of results (decrease and increase) for 2022.
Respondents were asked: "Of its total budget of CA$628.9 billion for the 2020-2021 fiscal year, the Government of Canada has allocated approximately 1.3 percent, or CA$8.2 billion, in federal international aid to poor countries. Do you think that the government should increase or decrease the amount of money that it spends on international aid to poor countries??"
Respondents selected:
National
Category "DK/NR": 6%
Category "Decrease (4-5)": 25%; 2022: 23%
Category "Stay the same (3)": 36%
Category "Increase (1-2)": 33%; 2022: 37%
British Columbia
Category "DK/NR": 4%
Category "Decrease (4-5)": 27%; 2022: 22%
Category "Stay the same (3)": 33%
Category "Increase (1-2)": 35%; 2022: 36%
Alberta
Category "DK/NR": 4%
Category "Decrease (4-5)": 37%; 2022: 32%
Category "Stay the same(3)": 34%
Category "Increase (1-2)": 24%; 2022: 26%
Saskatchewan and Manitoba
Category "DK/NR": 7%
Category "Decrease (4-5)": 32%; 2022: 29%
Category "Stay the same (3)": 31%
Category "Increase (1-2)": 30%; 2022: 30%
Ontario
Category "DK/NR": 7%
Category "Decrease (4-5)": 26%; 2022: 24%
Category "Stay the same (3)": 38%
Category "Increase (1-2)": 29%; 2022: 36%
Quebec
Category "DK/NR": 5%
Category "Decrease (4-5)": 13%; 2022: 14%
Category "Stay the same (3)": 38%
Category "Increase (1-2)": 44%; 2022: 48%
Atlantic Canada
Category "DK/NR": 5%
Category "Decrease (4-5)": 24%; 2022: 22%
Category "Stay the same (3)": 38%
Category "Increase (1-2)": 33%; 2022: 36%
Base: Canadians; n=3,059
Q7. Of its total budget of $362.9 billion, the Government of Canada currently allocates approximately 1.8%, or $6.6 billion, to international aid to poor countries. Do you think that the government should increase or decrease the amount of money that it spends on international aid to poor countries?
Base: Canadians; n=3,059
Those aged 65 and over (46%), residents of Quebec (44%), university graduates (42%), and women (36%) are more likely to say the Government of Canada should increase its spending on international aid to poor countries.
In contrast, residents of Alberta (37%) are more apt to say the federal government should decrease its spending on international aid to poor countries.
Primary purpose of international aid
Canadians were asked what they think the main purpose of international aid to poor countries should be: reducing poverty or promoting Canada’s national interest. A clear majority (59%) said that the primary purpose of Canada’s international aid spending should be to reduce poverty in poor countries; only 14% said the primary purpose of Canada’s international aid spending should be to promote Canada’s national interests. These figures have remained largely stable since 2022.
Chart 17: Primary purpose of international aid
Chart 17: Primary purpose of international aid - Text Version
This stacked bar chart shows the percentage of results for responses to six groups across four categories: DK/NR, the primary purpose of Canada's international aid spending should be to promote Canada's national interests, the primary purpose of Canada's international aid spending should be both reducing poverty in poor countries and promoting Canada's national interests, and the primary purpose of Canada's international aid spending should be to reduce poverty in poor countries. One column on the side shows the percentage of results (reduce poverty) for 2022.
Respondents were asked: "The Government of Canada gives international aid to poor countries. Looking at the scale below, what do you think the primary purpose of international aid should be?"
Respondents selected:
National
Category "DK/NR": 5%
Category "The primary purpose of Canada's international aid spending should be to promote Canada's national interests (0-4)": 14%
Category "The primary purpose of Canada's international aid spending should be both reducing poverty in poor countries and promoting Canada's national interests (5)": 22%
Category "The primary purpose of Canada's international aid spending should be to reduce poverty in poor countries (6-10)": 59%; 2022: 61%
Male
Category "DK/NR": 5%
Category "The primary purpose of Canada's international aid spending should be to promote Canada's national interests (0-4)": 19%
Category "The primary purpose of Canada's international aid spending should be both reducing poverty in poor countries and promoting Canada's national interests (5)": 23%
Category "The primary purpose of Canada's international aid spending should be to reduce poverty in poor countries (6-10)": 53%; 2022: 55%
Female
Category "DK/NR": 5%
Category "The primary purpose of Canada's international aid spending should be to promote Canada's national interests (0-4)": 8%
Category "The primary purpose of Canada's international aid spending should be both reducing poverty in poor countries and promoting Canada's national interests (5)": 22%
Category "The primary purpose of Canada's international aid spending should be to reduce poverty in poor countries (6-10)": 65%; 2022: 68%
High school
Category "DK/NR": 8%
Category "The primary purpose of Canada's international aid spending should be to promote Canada's national interests (0-4)": 14%
Category "The primary purpose of Canada's international aid spending should be both reducing poverty in poor countries and promoting Canada's national interests (5)": 21%
Category "The primary purpose of Canada's international aid spending should be to reduce poverty in poor countries (6-10)": 57%; 2022: 56%
College
Category "DK/NR": 6%
Category "The primary purpose of Canada's international aid spending should be to promote Canada's national interests (0-4)": 17%
Category "The primary purpose of Canada's international aid spending should be both reducing poverty in poor countries and promoting Canada's national interests (5)": 24%
Category "The primary purpose of Canada's international aid spending should be to reduce poverty in poor countries (6-10)": 54%; 2022: 57%
University
Category "DK/NR": 3%
Category "The primary purpose of Canada's international aid spending should be to promote Canada's national interests (0-4)": 12%
Category "The primary purpose of Canada's international aid spending should be both reducing poverty in poor countries and promoting Canada's national interests (5)": 22%
Category "The primary purpose of Canada's international aid spending should be to reduce poverty in poor countries (6-10)": 64%; 2022: 65%
Base: Canadians; n=3,059
Q16. The Government of Canada gives international aid to poor countries. Looking at the scale below, what do you think the primary purpose of international aid should be?
Base: Canadians; n=3,059
The likelihood of saying the primary purpose of international aid should be to reduce poverty in poor countries is higher among women (65%) and university graduates (64%), and rises progressively with age (from 47% among those aged 18 to 34, to 72% among those aged 65 and over).
Views on international aid
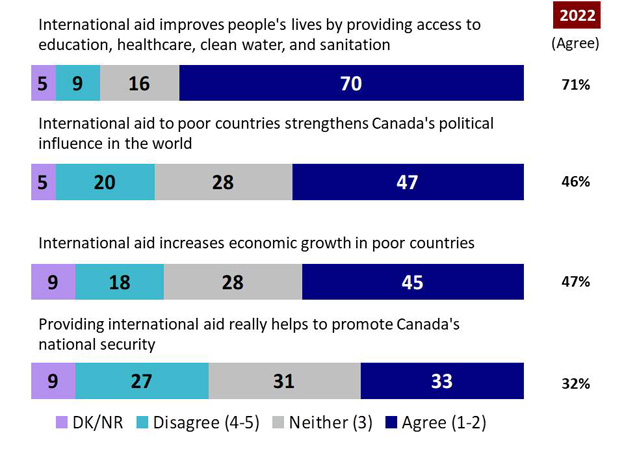
Respondents were asked a number of questions concerning their attitudes about international aid. Results reveal that fully 70% agree that international aid improves people’s lives by providing access to education, health care, clean water, and sanitation. However, fewer than half agree that international aid to poor countries strengthens Canada’s political influence in the world (47%) or that international aid increases economic growth in poor countries (45%). Only 1 in 3 (33%) believes that providing international aid helps to promote Canada’s national security. These results are consistent with those found in 2022.
Chart 18: Views on international aid (i)
Chart 18: Views on international aid (i) - Text Version
This stacked bar chart shows the percentage of results for responses to four statements across four categories: DK/NR, disagree, neither, and agree. One column on the side shows the percentage of results (agree) for 2022.
Respondents were asked: "To what extent do you agree or disagree with the following statements about aid from the Canadian government?"
Respondents selected:
International aid improves people's lives by providing access to education, healthcare, clean water, and sanitation
Category "DK/NR": 5%
Category "Disagree (4-5)": 9%
Category "Neither (3)": 16%
Category "Agree (1-2)": 70%; 2022: 71%
International aid to poor countries strengthens Canada's political influence in the world
Category "DK/NR": 5%
Category "Disagree (4-5)": 20%
Category "Neither (3)": 28%
Category "Agree (1-2)": 47%; 2022: 46%
International aid increases economic growth in poor countries
Category "DK/NR": 9%
Category "Disagree (4-5)": 18%
Category "Neither (3)": 28%
Category "Agree (1-2)": 45%; 2022: 47%
Providing international aid really helps to promote Canada's national security
Category "DK/NR": 9%
Category "Disagree (4-5)": 27%
Category "Neither (3)": 31%
Category "Agree (1-2)": 33%; 2022: 32%
Base: Canadians; n=3,059
Q18a-d. To what extent do you agree or disagree with the following statements about aid from the Canadian government?
Base: Canadians; n=3,059
The likelihood of agreeing that international aid improves people’s lives by providing access to education, health care, clean water, and sanitation is higher among those aged 65 and over (79%), university graduates (75%), and women (74%).
University graduates (55%), residents of Quebec (54%), those earning $150,000 or more in annual household income (54%), and those aged 18 to 34 (53%) are more likely to say that international aid to poor countries strengthens Canada’s political influence in the world, while men (24%) are more likely to disagree with this assessment.
Those aged 65 and over (52%) are more likely to say that international aid increases economic growth in poor countries, while residents of Alberta (25%) and men (22%) are more likely to reject this view.
Those earning $150,000 or more in household income (41%), those aged 18 to 34 (39%), and university graduates (38%) are more likely to agree that providing international aid helps to promote Canada’s national security.
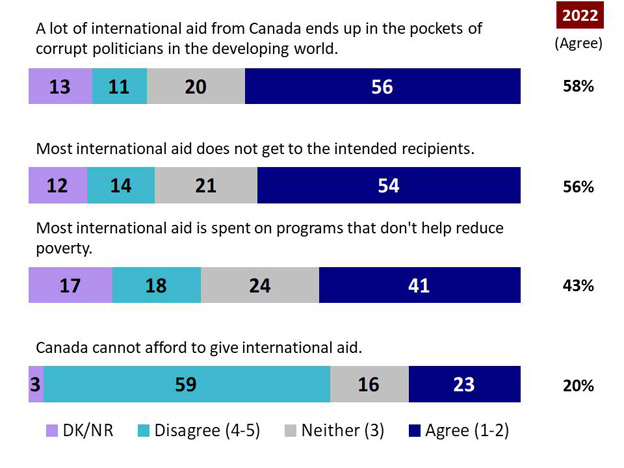
Survey results reveal some fairly negative views about certain aspects of international aid. More than half of Canadians say that a lot of international aid from Canada ends up in the pockets of corrupt politicians in the developing world (56%) and that most international aid does not get to the intended recipients (54%). Moreover,4 in 10 (41%) agree that most international aid is spent on programs that don’t help reduce poverty. However, despite mixed views on international aid, only about 1 in 4 (23%) say that Canada cannot afford to give international aid. These results are largely unchanged from 2022.
Chart 19: Views on international aid (ii)
Chart 19: Views on international aid (ii) - Text Version
This stacked bar chart shows the percentage of results for responses to four statements across four categories: DK/NR, disagree, neither, and agree. One column on the side shows the percentage of results (agree) for 2022.
Respondents were asked: "To what extent do you agree or disagree with the following statements about aid from the Canadian government?"
Respondents selected:
A lot of international aid from Canada ends up in the pockets of corrupt politicians in the developing world
Category "DK/NR": 13%
Category "Disagree (4-5)": 11%
Category "Neither (3)": 20%
Category "Agree (1-2)": 56%; 2022: 58%
Most international aid does not get to the intended recipients
Category "DK/NR": 12%
Category "Disagree (4-5)": 14%
Category "Neither (3)": 21%
Category "Agree (1-2)": 54%; 2022: 56%
Most international aid is spent on programs that don't help reduce poverty
Category "DK/NR": 17%
Category "Disagree (4-5)": 18%
Category "Neither (3)": 24%
Category "Agree (1-2)": 41%; 2022: 43%
Canada cannot afford to give international aid
Category "DK/NR": 3%
Category "Disagree (4-5)": 58%
Category "Neither (3)": 16%
Category "Agree (1-2)": 23%; 2022: 20%
Base: Canadians; n=3,059
Q19a-d. To what extent do you agree or disagree with the following statements about aid from the Canadian government?
Base: Canadians; n=3,059
The likelihood of saying that a lot of international aid from Canada ends up in the pockets of corrupt politicians in the developing world is higher among residents of Alberta (64%), high school graduates (64%), college graduates (61%), and men (61%).
Residents of Alberta (64%), high school graduates (61%), college graduates (58%), and men (57%) are more likely to say that most international aid does not get to the intended recipients.
The likelihood of agreeing that most international aid is spent on programs that don’t help reduce poverty is higher among residents of Alberta (51%), high school graduates (49%), and men (45%).
Residents of Alberta (35%), Saskatchewan/Manitoba (33%), high school graduates (29%), college graduates (28%), and men (26%) are more likely to say that Canada cannot afford to give international aid.
Views on effectiveness of government spending on international aid
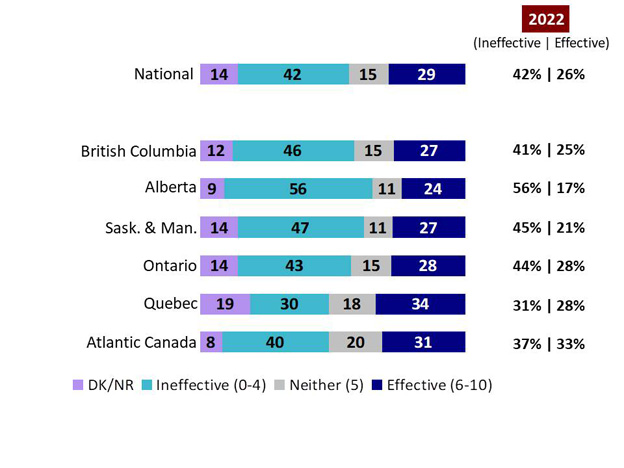
Canadians were asked about the effectiveness of government spending on international aid. About 3 in 10 Canadians (29%, up 3 percentage points since 2022) say that government spending on international aid is effective, while the plurality (42%) continue to say that government spending is ineffective.
Chart 20: Views on effectiveness of government spending on international aid
Chart 20: Views on effectiveness of government spending on international aid - Text Version
This stacked bar chart shows the percentage of results for responses to seven groups across four categories: DK/NR, ineffective, neither, and effective. Two columns on the side show the percentage of results (ineffective and effective) for 2022.
Respondents were asked: "Overall, on a scale from 0 to 10, where 0 means 'Very ineffective' and 10 means 'Very effective,' how effective do you think government spending on international aid is?"
Respondents selected:
National
Category "DK/NR": 14%
Category "Ineffective (0-4)": 42%; 2022: 42%
Category "Neither (5)": 15%
Category "Effective (6-10)": 29%; 2022: 26%
British Columbia
Category "DK/NR": 12%
Category "Ineffective (0-4)": 46%; 2022: 41%
Category "Neither (5)": 15%
Category "Effective (6-10)": 27%; 2022: 25%
Alberta
Category "DK/NR": 9%
Category "Ineffective (0-4)": 56%; 2022: 56%
Category "Neither (5)": 11%
Category "Effective (6-10)": 24%; 2022: 17%
Saskatchewan and Manitoba
Category "DK/NR": 14%
Category "Ineffective (0-4)": 47%; 2022: 45%
Category "Neither (5)": 11%
Category "Effective (6-10)": 27%; 2022: 21%
Ontario
Category "DK/NR": 14%
Category "Ineffective (0-4)": 43%; 2022: 44%
Category "Neither (5)": 15%
Category "Effective (6-10)": 28%; 2022: 28%
Quebec
Category "DK/NR": 19%
Category "Ineffective (0-4)": 30%; 2022: 31%
Category "Neither (5)": 18%
Category "Effective (6-10)": 34%; 2022: 28%
Atlantic Canada
Category "DK/NR": 8%
Category "Ineffective (0-4)": 40%; 2022: 37%
Category "Neither (5)": 20%
Category "Effective (6-10)": 31%; 2022: 33%
Base: Canadians; n=3,059
Q9. Overall, on a scale from 0 to 10, where 0 means 'Very ineffective' and 10 means 'Very effective,' how effective do you think government spending on international aid is?
Base: Canadians; n=3,059
Those aged 18 to 34 (34%), those aged 65 and over (34%), residents of Quebec (34%), and women (32%) are more likely to say that government spending on international aid is effective, while residents of Alberta (56%) are more likely to say that government spending on international aid is ineffective.
Government spending priorities
Respondents were asked to rank the most important priorities for government spending on international aid to poor countries. Access to clean water was seen as most important (44%), followed by education (39%) and access to health care (37%). These results have remained largely stable over the past year.
Chart 21: Government aid priorities (i)
Chart 21: Government aid priorities (i) - Text Version
This chart of single bars shows the percentage of results for responses to eight statements. One column on the side shows the percentage of results for 2022.
Respondents were asked: "Thinking again about government spending on international aid in poor countries, please indicate what you think are the first, second, and third most important priorities."
Respondents selected:
Water – access to clean water, sanitation and hygiene: 44%; 2022: 45%
Education – helping people to attend school or get skills and training: 39%; 2022: 42%
Health – access to hospitals and clinics, treating diseases and providing vaccinations: 37%; 2022: 37%
Government and civil society – improving government accountability, addressing corruption, and ensuring peace and security and the rule of law: 25%; 2022: 25%
Women's equality – support women's rights, gender equality, and help eliminate violence against women: 25%; 2022: 25%
Disaster relief – helping in emergencies and urgent humanitarian crises: 24%; 2022: 22%
Agriculture – growing food and other crops: 21%; 2022: 20%
Economic growth – creating jobs and supporting the economy: 19%; 2022: 18%
Base: Canadians; n=3,059
Q17. Thinking again about government spending on international aid in poor countries, please indicate what you think are the first, second, and third most important priorities.
Base: Canadians; n=3,059
Chart 22: Government aid priorities (ii)
Chart 22: Government aid priorities (ii) - Text Version
This chart of single bars shows the percentage of results for responses to seven statements. One column on the side shows the percentage of results for 2022.
Respondents were asked: ""Thinking again about government spending on international aid in poor countries, please indicate what you think are the first, second, and third most important priorities.""
Respondents selected:
Environmental protection – addressing climate change, air pollution, and protecting animals and their habitats: 18%; 2022: 18%
Welfare – address poverty through providing housing and benefits to people unable to work due to sickness, injury, old age, or children: 11%; 2022: 10%
Family planning – access to contraception and other family services: 10%; 2022: 11%
Infrastructure – providing roads and telecommunications: 7%; 2022: 8%
Migration and refugee flows – protection of refugees and support for safe and responsible migration: 6%; 2022: 7%
Energy – providing electricity and other energy services: 6%; 2022: 6%
Q17. Thinking again about government spending on international aid in poor countries, please indicate what you think are the first, second, and third most important priorities.
Base: Canadians; n=3,059
Those aged 55 to 64 (54%) and women (47%) are more likely to say access to clean water, sanitation and hygiene is the top priority for international aid.
Women are also particularly likely to say access to health care (42%) is a top priority for international aid.
Feelings about spending on aid to poor countries
Canadians were asked to describe their feelings about the Government of Canada’s spending on aid to help people in poor countries. Results reveal mixed feelings, with no one dominant feeling expressed. About 1 in 4 say they feel hopeful, enthusiastic, optimistic (24%), while a similar proportion feel indifferent, quiet, still (23%). A sizeable proportion report feeling fed up, sluggish and tired (19%), or anxious, unhappy, and dissatisfied (16%) when thinking about the Government of Canada’s aid to poor countries. However, a similar proportion expressed more positive feelings about this issue: proud, encouraged, activated (16%), and content, satisfied, pleased (16%). These findings are largely unchanged from 2022.
Chart 23: Feelings about spending on aid to poor countries
Chart 23: Feelings about spending on aid to poor countries - Text Version
This chart of single bars shows the percentage of results for responses to fourteen statements. One column on the side shows the percentage of results for 2022.
Respondents were asked: "Which, if any, of the following words generally describe your feelings about the Government of Canada spending on aid to help poor people in poor countries? [Tick up to four]"
Respondents selected:
Hopeful, enthusiastic, optimistic: 24%; 2022: 22%
Indifferent, quiet, still: 23%; 2022: 23%
Fed up, sluggish, tired: 19%; 2022: 18%
Proud, encouraged, activated: 16%; 2022: 17%
Anxious, unhappy, dissatisfied: 16%; 2022: 16%
Content, satisfied, pleased: 16%; 2022: 15%
Angry, distressed, upset: 14%; 2022: 13%
Sad, gloomy, depressed: 12%; 2022: 12%
Placid, tranquil, chilled: 6%; 2022: 6%
Relaxed, serene, peaceful: 6%; 2022: 5%
Provoked, frenzied, jittery: 5%; 2022: 5%
Happy, energetic, excited: 4%; 2022: 4%
None of the above: 12%; 2022: 12%
Don’t know/No response: 7%; 2022: 8%
Base: Canadians; n=3,059
Q15. Which, if any, of the following words generally describe your feelings about the Government of Canada spending on aid to help poor people in poor countries? [TICK UP TO FOUR]
Base: Canadians; n=3,059
Those aged 18 to 34 (30%), those earning $150,000 or more in household income (30%), and men (27%) are more likely to feel indifferent, quiet and/or still.
Women (27%) are more likely to say they feel hopeful, enthusiastic and/or optimistic.
Men (22%) are more likely to say they feel fed up, sluggish and/or tired.
Residents of Alberta are more likely to report feeling fed up, sluggish, tired (25%), anxious, unhappy, dissatisfied (23%), or angry, distressed, upset (20%).
Attitudes toward international aid
Despite mixed feelings about international aid, half of Canadians (50%) think that international aid helps countries become self-sufficient rather than making countries too dependent on charity (27%). These findings have remained consistent over the past year.
Chart 24: Attitudes toward international aid
Chart 24: Attitudes toward international aid - Text Version
This stacked bar chart shows the percentage of results for responses to seven groups across four categories: DK/NR, international aid makes countries too dependent on charity, neither, and international aid helps countries become self-sufficient. One column on the side shows the percentage of results (become self-sufficient) for 2022.
Respondents were asked: "Using a scale where 0 means 'International aid makes countries too dependent on charity' and 10 means 'International aid helps countries become self-sufficient', please indicate which comes closest to your view."
Respondents selected:
National
Category "DK/NR": 6%
Category "International aid makes countries too dependent on charity (0-4)": 27%
Category "Neither (5)": 18%
Category "International aid helps countries become self-sufficient (6-10)": 50%; 2022: 51%
British Columbia
Category "DK/NR": 2%
Category "International aid makes countries too dependent on charity (0-4)": 26%
Category "Neither (5)": 20%
Category "International aid helps countries become self-sufficient (6-10)": 52%; 2022: 53%
Alberta
Category "DK/NR": 5%
Category "International aid makes countries too dependent on charity (0-4)": 35%
Category "Neither (5)": 17%
Category "International aid helps countries become self-sufficient (6-10)": 44%; 2022: 44%
Saskatchewan and Manitoba
Category "DK/NR": 7%
Category "International aid makes countries too dependent on charity (0-4)": 32%
Category "Neither (5)": 13%
Category "International aid helps countries become self-sufficient (6-10)": 48%; 2022: 42%
Ontario
Category "DK/NR": 7%
Category "International aid makes countries too dependent on charity (0-4)": 27%
Category "Neither (5)": 17%
Category "International aid helps countries become self-sufficient (6-10)": 49%; 2022: 52%
Quebec
Category "DK/NR": 7%
Category "International aid makes countries too dependent on charity (0-4)": 23%
Category "Neither (5)": 19%
Category "International aid helps countries become self-sufficient (6-10)": 51%; 2022: 53%
Atlantic Canada
Category "DK/NR": 5%
Category "International aid makes countries too dependent on charity (0-4)": 21%
Category "Neither (5)": 18%
Category "International aid helps countries become self-sufficient (6-10)": 56%; 2022: 56%
Base: Canadians; n=3,059
Q20. Using a scale where 0 means 'International aid makes countries too dependent on charity' and 10 means 'International aid helps countries become self-sufficient', please indicate which comes closest to your view.
Base: Canadians; n=3,059
Those aged 65 and over (58%), university graduates (57%), and women (56%) are more likely to say that international aid helps countries become self-sufficient.
Conversely, residents of Alberta (35%) and men (35%) are more likely to feel that international aid makes countries too dependent on charity.
D. Interest in Global Poverty and Development
Interest in global poverty and development
Canadians were asked a number of questions about their interest in global poverty and development issues. Results suggest that Canadians are fairly interested in this area. Fully 80% say they have read, watched, or listened to a news article about global poverty and development in the last year; two-thirds (64%) say they have discussed global poverty with friends, family, or others over this time frame. A sizable minority (30%) say they have shared/forwarded an article or information about this issue over the past year. These results are largely consistent with those found in 2022.
Chart 25: Interest in global poverty and development
Chart 25: Interest in global poverty and development - Text Version
This stacked bar chart shows the percentage of results for responses to three statements across four categories: DK/NR, have not done, and have done. One column on the side shows the percentage of results (have done) for 2022.
Respondents were asked: "Thinking about global poverty and development, which of the following have you done, if any, in the past 12 months?"
Respondents selected:
Read, watched, or listened to a news article about it (offline or online)
Category "DK/NR": 4%
Category "Have not done": 17%
Category "Have done": 80%; 2022: 79%
Discussed it with friends, family, or others
Category "DK/NR": 4%
Category "Have not done": 32%
Category "Have done": 64%; 2022: 64%
Shared/forwarded an article or information about it (offline or online)
Category "DK/NR": 7%
Category "Have not done": 64%
Category "Have done": 30%; 2022: 32%
Base: Canadians; n=3,059
Q11a-c. Thinking about global poverty and development, which of the following have you done, if any, in the past 12 months?
Base: Canadians; n=3,059
Those aged 65 and over (88%) and university graduates (86%) are more likely to say they have read, watched or listened to news about global poverty and development in the past year.
University graduates (71%) and women (68%) are more likely to say they have discussed global poverty issues with friends, family, or others.
University graduates (35%) are more likely to have shared/forwarded an article or information about global poverty and development.
Views on content about poverty
When asked if the news they have read/heard/seen/shared about global poverty was generally more positive than negative, most indicate a more negative content. Two-thirds (67%) say the news they have been exposed to was more negative than positive; only 14% say the news they saw about global poverty was more positive than negative. These results are largely unchanged from 2022.
Chart 26: Views on content about poverty
Chart 26: Views on content about poverty - Text Version
This stacked bar chart shows the percentage of results for responses to six groups across four categories: DK/NR, more negative than positive, and more positive than negative. One column on the side shows the percentage of results (more negative) for 2022.
Respondents were asked: "Thinking about the news you've read/heard/seen/shared or the discussions you've had about global poverty, would you say the content was more positive or more negative? On balance, it was...?"
Respondents selected:
National
Category "DK/NR": 20%
Category "More positive than negative": 14%
Category "More negative than positive": 67%; 2022: 66%
Male
Category "DK/NR": 20%
Category "More positive than negative": 16%
Category "More negative than positive": 64%; 2022: 63%
Female
Category "DK/NR": 19%
Category "More positive than negative": 12%
Category "More negative than positive": 69%; 2022: 69%
High school
Category "DK/NR": 23%
Category "More positive than negative": 14%
Category "More negative than positive": 63%; 2022: 62%
College
Category "DK/NR": 23%
Category "More positive than negative": 13%
Category "More negative than positive": 64%; 2022: 66%
University
Category "DK/NR": 15%
Category "More positive than negative": 15%
Category "More negative than positive": 70%; 2022: 66%
Base: Canadians; n=3,059
Q12. Thinking about the news you've read/heard/seen/shared or the discussions you’ve had about global poverty, would you say the content was more positive or more negative? On balance, it was...
Base: Canadians; n=3,059
Men (16%) are more likely to say the news they had read/heard/seen/shared was more positive than negative, while university graduates (70%) are more likely to say the news was primarily negative.
E. Involvement With Development Charity Groups
Donations to international NGOs
Canadians were asked whether they have donated money to an international NGO or charity working on global poverty and development in the past 12 months. About 1 in 3 (32%) say they have donated money to an international NGO or charity; however, the majority of Canadians (65%) have not. Tracking suggests that donation levels have remained largely stable since 2022.
Chart 27: Donations to international NGOs
Chart 27: Donations to international NGOs - Text Version
This stacked bar chart shows the percentage of results for responses to seven groups across four categories: DK/NR, no, and yes. One column on the side shows the percentage of results (no) for 2022.
Respondents were asked: "Thinking about global poverty and development, have you donated money to an international NGO or charity working on the issue in the past 12 months?"
Respondents selected:
National
Category "DK/NR": 3%
Category "Yes": 32%
Category "No": 65%; 2022: 67%
Male
Category "DK/NR": 3%
Category "Yes": 27%
Category "No": 71%; 2022: 71%
Female
Category "DK/NR": 4%
Category "Yes": 36%
Category "No": 60%; 2022: 62%
18-34 years
Category "DK/NR": 6%
Category "Yes": 24%
Category "No": 70%; 2022: 70%
35-54 years
Category "DK/NR": 2%
Category "Yes": 31%
Category "No": 67%; 2022: 70%
55-64 years
Category "DK/NR": 3%
Category "Yes": 31%
Category "No": 66%; 2022: 64%
65+-years
Category "DK/NR": 1%
Category "Yes": 42%
Category "No": 57%; 2022: 59%
Base: Canadians; n=3,059
Q4. Thinking about global poverty and development, have you donated money to an international NGO or charity working on the issue in the past 12 months?
Base: Canadians; n=3,059
Those aged 65 and over (42%), university graduates (40%), and women (36%) are more likely to say they have donated money to an international NGO or charity.
Actions taken to address global poverty
Respondents were asked if they have been involved with a development charity or group in the past year. Results reveal limited involvement with these groups. Only 1 in 5 Canadians (19%) say they became a member of or subscribed to a newsletter from a development charity or group in the past year; 1 in 10 (10%) say they have volunteered for an organization or charity working on global poverty over this time frame. These results are unchanged from 2022.
Chart 28: Actions taken to address global poverty
Chart 28: Actions taken to address global poverty - Text Version
This stacked bar chart shows the percentage of results for responses to two statements across four categories: DK/NR, have not done, and have done. One column on the side shows the percentage of results (have done) for 2022.
Respondents were asked: "Thinking about global poverty and development, which of the following have you done, if any, in the past 12 months?"
Respondents selected:
Became a member, followed, liked, or subscribed to a newsletter from a development charity or group focused on the issue
Category "DK/NR": 3%
Category "Have not done": 77%
Category "Have done": 19%; 2022: 19%
Volunteered for an organization or charity working on the issue, either in Canada or abroad
Category "DK/NR": 2%
Category "Have not done": 88%
Category "Have done": 10%; 2022: 10%
Base: Canadians; n=3,059
Q13a-b. Thinking about global poverty and development, which of the following have you done, if any, in the past 12 months?
Base: Canadians; n=3,059
Those aged 65 and older (27%), women (24%), and university graduates (24%) are more likely to say they became a member of or subscribed to a newsletter from a development charity group.
The likelihood of having volunteered for an organization or charity working on global poverty in the past year declines with household income (from 15% among those earning less than $40,000 in household income to 8% among those earning $150,000 or more).
Actions taken to address global poverty
Canadians were asked about their actions in support of or opposition to efforts to address global poverty. Most say they have not taken any of the actions suggested in the survey. About 1 in 3 (35%, down from 39% in 2022) say they have purchased products/services or boycotted products/services to support efforts to address global poverty. About 1 in 5 (22%, down 3 percentage points over the past year) say they have taken action such as signing a petition or writing a blog to support efforts aimed at addressing global poverty. Very few say they have contacted a Member of Parliament or other elected official (9%), or participated in a march, rally, protest, or other large event (4%) to support efforts to address global poverty. Very few have undertaken actions to oppose efforts to address global poverty.
Chart 29: Actions taken to address global poverty
Chart 29: Actions taken to address global poverty - Text Version
This stacked bar chart shows the percentage of results for responses to four statements across four categories: DK/NR, have not done, have done to oppose the efforts, and have done to support the efforts. One column on the side shows the percentage of results (have done to support) for 2022.
Respondents were asked: "Which of the following have you done in the past 12 months, if any, in support of or in opposition to the efforts to address global poverty?"
Respondents selected:
Purchased products/services or boycotted products/services related to the issue (e.g. purchased products from a charity shop)
Category "DK/NR": 6%
Category "Have not done": 55%
Category "Have done to oppose the efforts": 4%
Category "Have done to support the efforts": 35%; 2022: 39%
Used your voice to influence the issue (e.g. signed a petition, written a blog, etc.)
Category "DK/NR": 3%
Category "Have not done": 72%
Category "Have done to oppose the efforts": 3%
Category "Have done to support the efforts": 22%; 2022: 25%
Contacted a Member of Parliament or other elected official (e.g. in person, by phone, letter or using Twitter, Facebook or other social media)
Category "DK/NR": 1%
Category "Have not done":88%
Category "Have done to oppose the efforts": 2%
Category "Have done to support the efforts": 9%; 2022: 9%
Participated in a march, rally, protest, or other large event on the issue
Category "DK/NR": 1%
Category "Have not done": 92%
Category "Have done to oppose the efforts": 2%
Category "Have done to support the efforts": 4%; 2022: 4%
Base: Canadians; n=3,059
Q14a-d. Which of the following have you done in the past 12 months, if any, in support of or in opposition to the efforts to address global poverty?
Base: Canadians; n=3,059
University graduates (43%) and women (41%) are more likely to say they have purchased or boycotted products/services to support efforts to address global poverty. Those aged 18 to 34 (7%) are somewhat more likely to have participated in a boycott to oppose these efforts.
Women (27%) and university graduates (27%) are more likely to say they have spoken out to support efforts to address global poverty. The likelihood of having spoken out in support of these efforts declines with household income (from 27% among those earning less than $40,000 in household income to 17% among those earning $150,000 or more).
Those aged 65 and over (12%) are more likely to say they have contacted a Member of Parliament or other elected official to support efforts to address global poverty, while those aged 18 to 34 (6%) are somewhat more likely to say they have contacted a Member of Parliament to oppose these efforts.
Those earning $40,000 to $80,000 in annual household income (7%) and residents of Quebec (6%) are more likely to say they have participated in a march, rally, protest or other large event to support efforts to address global poverty. Those aged 18 to 34 are more likely to have participated in a march, rally, protest, or other event both in support of (8%) and in opposition to (6%) efforts to address global poverty.
F. Views on International Development NGOs and Charities
Trust in international development NGOs and charities
Respondents were asked to rate the level of trust they have in international development NGOs and charities. Results reveal mixed views on this issue. About 4 in 10 (41%) say they trust these types of organizations; however, roughly the same proportion (40%) express little trust in them. Tracking reveals that trust in international development NGOs and charities has remained stable over the past year.
Chart 30: Trust in international development NGOs and charities
Chart 30: Trust in international development NGOs and charities - Text Version
This stacked bar chart shows the percentage of results for responses to six groups across four categories: DK/NR, little trust, neither, and trust. Two columns on the side show the percentage of results (little trust and trust) for 2022.
Respondents were asked: "Generally speaking, how much, if at all, do you trust international development NGOs and charities?"
Respondents selected:
National
Category "DK/NR": 5%
Category "Little trust (0-4)": 40%; 2022: 40%
Category "Neither (5)": 14%
Category "Trust (6-10)": 41%; 2022: 39%
Male
Category "DK/NR": 3%
Category "Little trust (0-4)": 47%; 2022: 44%
Category "Neither (5)": 13%
Category "Trust (6-10)": 36%; 2022: 37%
Female
Category "DK/NR": 6%
Category "Little trust (0-4)": 33%; 2022: 34%
Category "Neither (5)": 15%
Category "Trust (6-10)": 46%; 2022: 42%
High school
Category "DK/NR": 8%
Category "Little trust (0-4)": 49%; 2022: 48%
Category "Neither (5)": 13%
Category "Trust (6-10)": 30%; 2022: 29%
College
Category "DK/NR": 5%
Category "Little trust (0-4)": 47%; 2022: 47%
Category "Neither (5)": 16%
Category "Trust (6-10)": 32%; 2022: 31%
University
Category "DK/NR": 3%
Category "Little trust (0-4)": 32%; 2022: 33%
Category "Neither (5)": 13%
Category "Trust (6-10)": 52%; 2022: 47%
Base: Canadians; n=3,059
Q10. Generally speaking, how much, if at all, do you trust international development NGOs and charities?
Base: Canadians; n=3,059
Trust in international development NGOs and charities is higher among university graduates (52%), residents of Quebec (51%), and women (46%).
Residents of Alberta (51%), those with a high school or college education (49% and 47%, respectively), and men (47%) are more likely to express little trust in international development NGOs and charities.
Views on corporate partnerships
When asked for their views on corporate partnerships between private sector business and charities, results again reveal mixed views. Just over half of Canadians (53%) agree that private sector corporations that partner with charities are just trying to boost their reputation and enhance their brand. However, roughly the same proportion (52%) agree that partnering with private sector corporations is a smart way for charities to increase their resources and impact. About 4 in 10 (41%) feel that corporate partnerships with charities effectively harness the power of business to achieve wider social goals, and 1 in 4 (24%) agree that charities that partner with private sector corporations are compromised and less trustworthy. These results are largely unchanged from those found in 2022.
Chart 31: Views on corporate partnerships
Chart 31: Views on corporate partnerships - Text Version
This stacked bar chart shows the percentage of results for responses to four statements across four categories: DK/NR, disagree, neither, and agree. One column on the side shows the percentage of results (agree) for 2022.
Respondents were asked: "Below are statements about corporate partnerships between private sector businesses and charities. Please indicate the extent to which you agree or disagree with the following statements?"
Respondents selected:
Private sector corporations that partner with charities are just trying to boost their reputation and enhance their brand
Category "DK/NR": 5%
Category "Disagree (4-5)": 15%
Category "Neither (3)": 27%
Category "Agree (1-2)": 53%; 2022: 52%
Partnering with private sector corporations is a smart way for charities to increase their resources and impact
Category "DK/NR": 9%
Category "Disagree (4-5)": 13%
Category "Neither (3)": 25%
Category "Agree (1-2)": 52%; 2022: 53%
Corporate partnerships with charities effectively harnesses the power of business to achieve wider social goals
Category "DK/NR": 10%
Category "Disagree (4-5)": 18%
Category "Neither (3)": 31%
Category "Agree (1-2)": 41%; 2022: 41%
Charities that partner with private sector corporations are compromised and less trustworthy
Category "DK/NR": 9%
Category "Disagree (4-5)": 33%
Category "Neither (3)": 34%
Category "Agree (1-2)": 24%; 2022: 27%
Base: Canadians; n=3,059
Q31a-d. Below are statements about corporate partnerships between private sector businesses and charities. Please indicate the extent to which you agree or disagree with the following statements.
Base: Canadians; n=3,059
Men (60%), those aged 18 to 34 (60%), and those aged 35 to 54 (59%) are more likely to agree that private sector corporations that partner with charities are just trying to boost their reputation and enhance their brand.
Those aged 55 to 64 (59%) and those earning $150,000 or more in household income (59%) are more likely to feel that partnering with private sector corporations is a smart way for charities to increase their resources and impact.
Those aged 55 to 64 (50%) and those aged 65 and over (48%) are more likely to respond that corporate partnerships with charities effectively harness the power of business to achieve wider social goals.
Agreement with the idea that charities that partner with private sector corporations are compromised and less trustworthy is higher among those earning less than $40,000 in annual household income (31%), those aged 18 to 34 (30%), and men (29%).
Views on international development NGOs
Results reveal that the majority of Canadians (61%) feel it is important that large international development NGOs partner with local NGOs to deliver aid programs and funding; only 9% feel this is not important. These findings are consistent with those found in 2022.
Chart 32: Views on international development NGOs
Chart 32: Views on international development NGOs - Text Version
This stacked bar chart shows the percentage of results for responses to six groups across four categories: DK/NR, not important, neither, and important. One column on the side shows the percentage of results (important) for 2022.
Respondents were asked: "How important is it to you personally that large international development NGOs partner with NGOs that work in the local community to deliver aid programs and funding?"
Respondents selected:
National
Category "DK/NR": 12%
Category "Not important (4-5)": 9%
Category "Neither (3)": 19%
Category "Important (1-2)": 61%; 2022: 63%
Male
Category "DK/NR": 11%
Category "Not important (4-5)": 11%
Category "Neither (3)": 22%
Category "Important (1-2)": 56%; 2022: 59%
Female
Category "DK/NR": 12%
Category "Not important (4-5)": 6%
Category "Neither (3)": 17%
Category "Important (1-2)": 66%; 2022: 67%
High school
Category "DK/NR": 17%
Category "Not important (4-5)": 9%
Category "Neither (3)": 23%
Category "Important (1-2)": 51%; 2022: 54%
College
Category "DK/NR": 13%
Category "Not important (4-5)": 11%
Category "Neither (3)": 23%
Category "Important (1-2)": 53%; 2022: 57%
University
Category "DK/NR": 7%
Category "Not important (4-5)": 7%
Category "Neither (3)": 15%
Category "Important (1-2)": 71%; 2022: 68%
Base: Canadians; n=3,059
Q34. How important is it to you personally that large international development NGOs partner with NGOs that work in the local community to deliver aid programs and funding?
Base: Canadians; n=3,059
Residents of Quebec (71%), university graduates (71%), those 65 years old and older (69%), and women (66%), are more likely to feel it is important that large international development NGOs partner with local NGOs to deliver aid programs and funding.
Awareness of United Nations Sustainable Development Goals
When respondents were asked if they have ever heard of or read about the United Nations Sustainable Development Goals, results suggest limited awareness of these goals. About 1 in 5 (20%) say they know what the SDGs are, while 1 in 3 (34%) say they have heard/read about them, but don’t really know what they are. The plurality of Canadians (43%) say they have not heard of these goals. Tracking reveals that awareness of the United Nations Sustainable Development Goals has remained largely stable over the past year.
Chart 33: Awareness of United Nations Sustainable Development Goals
Chart 33: Awareness of United Nations Sustainable Development Goals - Text Version
This stacked bar chart shows the percentage of results for responses to six groups across four categories: DK/NR, no, yes but I don’t really know what they are, and yes and I know what they are. One column on the side shows the percentage of results (yes, I know) for 2022.
Respondents were asked: "Have you ever heard or read about the United Nations' Sustainable Development Goals?"
Respondents selected:
National
Category "DK/NR": 3%
Category "No": 43%
Category "Yes, but I don’t really know what they are": 34%
Category "Yes, and I know what they are": 20%; 2022: 18%
Male
Category "DK/NR": 2%
Category "No": 41%
Category "Yes, but I don’t really know what they are": 34%
Category "Yes, and I know what they are": 23%; 2022: 20%
Female
Category "DK/NR": 4%
Category "No": 44%
Category "Yes, but I don’t really know what they are": 35%
Category "Yes, and I know what they are": 16%; 2022: 15%
High school
Category "DK/NR": 4%
Category "No": 56%
Category "Yes, but I don’t really know what they are": 31%
Category "Yes, and I know what they are": 10%; 2022: 10%
College
Category "DK/NR": 3%
Category "No": 51%
Category "Yes, but I don’t really know what they are": 32%
Category "Yes, and I know what they are": 14%; 2022: 12%
University
Category "DK/NR": 2%
Category "No": 32%
Category "Yes, but I don’t really know what they are": 38%
Category "Yes, and I know what they are": 28%; 2022: 19%
Base: Canadians; n=3,059
Q26. Have you ever heard or read about the United Nations' Sustainable Development Goals?
Base: Canadians; n=3,059
University graduates (28%), those aged 18 to 34 (25%), and men (23%) are more likely to say they are aware of the United Nations Sustainable Development Goals.
Appendices
A. Methodological Details
Methodology
The research involved an online survey of 3,059 Canadians. The results are valid within a margin of error of +/- 1.8 percentage points, 19 times out of 20. The survey was conducted across Canada in both official languages. The field dates for the survey were January 16 to February 5, 2023.
Please note that the symbols in the data tables (Appendix C) represent levels of significance. Our crosstab software package conducts significance tests between each column and the other columns in the sample group. If our software detects a significant difference between a column and the rest of the sample, it displays pluses and minuses according to the following legend.
Table 1
Significance level
Character(s) displayed
0.999
++++
0.99
+++
0.95
++
0.9
+
-0.999
----
-0.99
---
-0.95
--
-0.9
-
Below we provide more details on the methodology associated with this research.
Sample
We used our probability-based online panel, Probit, in undertaking this survey. Probit is an online research panel that has been designed by Ekos to provide statistically representative data. Our panel offers complete coverage of the Canadian population (Internet, telephone, cell phone), random recruitment (participants are recruited randomly; they do not opt themselves into our panel), and equal probability sampling. All respondents to our panel are recruited by telephone using random digit dialling; their demographic information is confirmed by live interviewers.
The distribution of the recruitment process for our panel mirrors the actual population in Canada (as defined by Statistics Canada). As such, our panel can be considered representative of the general public (survey results from our online panel support confidence intervals and margin of error estimates). The overall panel size is roughly 100,000 Canadian households. Random stratified samples are drawn from the panel database for individual research assignments.
Fieldwork
The survey was conducted by Ekos using a secure web-based survey. The average interview length was 20.2 minutes.
All respondents were offered the opportunity to complete the surveys in their official language of choice. All research work was conducted in accordance with the Standards for the Conduct of Government of Canada Public Opinion Research - Online Surveys and recognized industry standards, as well as applicable federal legislation (Privacy Act, Personal Information Protection and Electronic Documents Act, and Access to Information Act).
Following data collection, the data from this survey were statistically weighted by age, gender, and region to ensure the sample is representative of the Canadian population according to 2016 Census data.
Response rate
The response rate for this survey was 16.9%. The response rate is calculated as follows: a total of 18,079 email invitations were sent out, and 18 bounced back, for a total of 18,061 valid emails. A total of 3,059 cases were completed: dividing 3,059 by 18,061 results in a response rate of 16.9%. This response rate is in line with other online surveys we have conducted with a similar length of questionnaire.
Non-response bias analysis
The table below presents a profile of the final sample, compared to the actual population of Canada (2021 Census information). As is the case with most surveys, the final sample under-represents those with high school or less education, which is a typical pattern for public opinion surveys in Canada, that is, those with more education are more likely to respond to surveys.
Non-response bias analysis
Sample type
Sample*
Canada (2021 Census)
Gender (18+)
Male
49%
49%
Female
51%
51%
Age
18-34
22%
27%
35-54
37%
32%
55+
41%
41%
Education level
High school diploma or less
20%
35%
Trades/college/post-secondary no degree
36%
36%
University degree
44%
29%
Data are unweighted and percentaged on those giving a response to each demographic question
B. Survey Questionnaire
Introduction
Thank-you for participating in this survey. Ekos Research Associates, a Canadian public opinion research company is conducting the survey on behalf of the Government of Canada.
Si vous préférez répondre au sondage en français, veuillez cliquer sur français.
Your participation is optional and your responses will be kept entirely confidential and anonymous. The survey takes 15 minutes to complete. It is being directed by Ekos Research, and is being administered according to the requirements of the Privacy Act. To view our privacy policy, click here.
If you require any technical assistance, please contact online@ekos.com.
Q1A
Of the list of issues below, which are the top three issues that you personally care about? (choose only three from the list)
1st
Climate change, the environment, biodiversity, pollution: 1
Education, healthcare, clean water and hunger in developing countries: 7
Economic crises, job security, wages: 8
Fake news, corruption of information: 9
Global diseases and pandemics: 10
Q2
All things considered, do you think the world is getting better, getting worse, or has there been no change?
Getting better: 1
Getting worse: 2
No change: 3
Don't know: 99
Q3
To what extent do you agree or disagree with the following statement? What happens in developing countries rarely affects people like me living in Canada.
Strongly agree: 1
Agree: 2
Neither agree nor disagree: 3
Disagree: 4
Strongly disagree: 5
Don't know: 99
Q4
Thinking about global poverty and development, have you donated money to an international NGO or charity working on the issue in the past 12 months?
Yes: 1
No: 2
Don't know: 9
Q5
Which best describes how you feel about levels of poverty in poor countries?
Very concerned: 1
Fairly concerned: 2
No strong feelings either one way or the other: 3
Not very concerned: 4
Not at all concerned: 5
Don't know: 99
Q6
Thinking about international aid to poor countries - please indicate the extent to which you think that the Government of Canada should give international aid, where a score of 0 means that it 'should not give aid at all' and a score of 10 means that it 'should give aid very generously'.
0 – Should not give aid at all: 1
1: 2
2: 3
3: 4
4: 5
5: 6
6: 7
7: 8
8: 9
9: 10
10 – Should give aid very generously: 11
Don't know: 99
Q7
Of its total budget of CA$628.9 billion for the 2020-2021 fiscal year, the Government of Canada has allocated approximately 1.3 percent, or CA$8.2 billion, in federal international aid to poor countries. Do you think that the government should increase or decrease the amount of money that it spends on international aid to poor countries?
Increase a great deal: 1
Increase somewhat: 2
Stay the same: 3
Decrease somewhat: 4
Decrease a great deal: 5
Don't know: 99
Q8A
How much of a difference, if any, do you think each of the following can make to reducing poverty in poor countries?
You personally
Can't make any difference at all 0: 1
1: 2
2: 3
3: 4
4: 5
5: 6
6: 7
7: 8
8: 9
9: 10
Can make a great deal of difference 10: 11
Don't know: 99 S
Q8B
How much of a difference, if any, do you think each of the following can make to reducing poverty in poor countries?
The Canadian government
Can't make any difference at all 0: 1
1: 2
2: 3
3: 4
4: 5
5: 6
6: 7
7: 8
8: 9
9: 10
Can make a great deal of difference 10: 11
Don't know: 99 S
Q8C
How much of a difference, if any, do you think each of the following can make to reducing poverty in poor countries?
Development NGOs/charities
Can't make any difference at all 0: 1
1: 2
2: 3
3: 4
4: 5
5: 6
6: 7
7: 8
8: 9
9: 10
Can make a great deal of difference 10: 11
Don't know: 99 S
Q8D
How much of a difference, if any, do you think each of the following can make to reducing poverty in poor countries?
Businesses/corporations
Can't make any difference at all 0: 1
1: 2
2: 3
3: 4
4: 5
5: 6
6: 7
7: 8
8: 9
9: 10
Can make a great deal of difference 10: 11
Don't know: 99 S
Q8E
How much of a difference, if any, do you think each of the following can make to reducing poverty in poor countries?
The United Nations and other international organizations
Can't make any difference at all 0: 1
1: 2
2: 3
3: 4
4: 5
5: 6
6: 7
7: 8
8: 9
9: 10
Can make a great deal of difference 10: 11
Don't know: 99 S
Q9
Overall, on a scale from 0 to 10, where 0 means 'Very ineffective' and 10 means 'Very effective,' how effective do you think government spending on international aid is?
0 – Very ineffective: 1
1: 2
2: 3
3: 4
4: 5
5: 6
6: 7
7: 8
8: 9
9: 10
10 – Very effective: 11
Don't know: 99
Q10
Generally speaking, how much, if at all, do you trust international development NGOs and charities?
0 – Do not trust at all: 1
1: 2
2: 3
3: 4
4: 5
5: 6
6: 7
7: 8
8: 9
9: 10
10 – Trust a great deal: 11
Don't know: 99
PREQ11
The next set of questions ask you to think about your actions in relation to global poverty and development.
Q11A
Thinking about global poverty and development, which of the following have you done, if any, in the past 12 months?
Read, watched, or listened to a news article about it (offline or online)
Have done: 1
Have not done: 2
Don't know: 99 S
Q11B
Thinking about global poverty and development, which of the following have you done, if any, in the past 12 months?
Discussed it with friends, family, or others
Have done: 1
Have not done: 2
Don't know: 99 S
Q11C
Thinking about global poverty and development, which of the following have you done, if any, in the past 12 months?
Shared/forwarded an article or information about it (offline or online)
Have done: 1
Have not done: 2
Don't know: 99 S
Q12
Thinking about the news you've read/heard/seen/shared or the discussions you've had about global poverty, would you say the content was more positive or more negative?
On balance, it was...
More positive than negative: 1
More negative than positive: 2
Don't know: 99
Q13A
Thinking about global poverty and development, which of the following have you done, if any, in the past 12 months?
Volunteered for an organization or charity working on the issue, either in Canada or abroad
Have done: 1
Have not done: 2
Don't know: 99 S
Q13B
Thinking about global poverty and development, which of the following have you done, if any, in the past 12 months?
Became a member, followed, liked, or subscribed to a newsletter from a development charity or group focused on the issue
Have done: 1
Have not done: 2
Don't know: 99 S
Q14A
Which of the following have you done in the past 12 months, if any, in support of or in opposition to the efforts to address global poverty?
Used your voice to influence the issue (e.g. signed a petition, written a blog, etc.)
Have done to support the efforts to address global poverty: 1
Have done to oppose the efforts to address global poverty: 2
Have not done: 3
Don't know: 99 S
Q14B
Which of the following have you done in the past 12 months, if any, in support of or in opposition to the efforts to address global poverty?
Contacted a Member of Parliament or other elected official (e.g. in person, by phone, letter or using Twitter, Facebook or other social media)
Have done to support the efforts to address global poverty: 1
Have done to oppose the efforts to address global poverty: 2
Have not done: 3
Don't know: 99 S
Q14C
Which of the following have you done in the past 12 months, if any, in support of or in opposition to the efforts to address global poverty?
Participated in a march, rally, protest, or other large event on the issue
Have done to support the efforts to address global poverty: 1
Have done to oppose the efforts to address global poverty: 2
Have not done: 3
Don't know: 99 S
Q14D
Which of the following have you done in the past 12 months, if any, in support of or in opposition to the efforts to address global poverty?
Purchased products/services or boycotted products/services related to the issue (e.g. purchased products from a charity shop)
Have done to support the efforts to address global poverty: 1
Have done to oppose the efforts to address global poverty: 2
Have not done: 3
Don't know: 99 S
Q15 [1,4]
Which, if any, of the following words generally describe your feelings about the Government of Canada spending on aid to help poor people in poor countries?
Please tick up to four options
Happy, energetic, excited: 1
Hopeful, enthusiastic, optimistic: 2
Content, satisfied, pleased: 3
Relaxed, serene, peaceful: 4
Placid, tranquil, chilled: 5
Indifferent, quiet, still: 6
Fed up, sluggish, tired: 7
Sad, gloomy, depressed: 8
Anxious, unhappy, dissatisfied: 9
Angry, distressed, upset: 10
Provoked, frenzied, jittery: 11
Proud, encouraged, activated: 12
None of the above: 98 BX
Don't know: 99 BX
Q16
The Government of Canada gives international aid to poor countries. Looking at the scale below, what do you think the primary purpose of international aid should be?
0 – The primary purpose of Canada's international aid spending should be to promote Canada's national interests.: 1
1: 2
2: 3
3: 4
4: 5
5 – The primary purpose of Canada's international aid spending should be both reducing poverty in poor countries and promoting Canada's national interests.: 6
6: 7
7: 8
8: 9
9: 10
10 – The primary purpose of Canada's international aid spending should be to reduce poverty in poor countries.: 11
Don't know: 99
Q17A
Thinking again about government spending on international aid in poor countries, please indicate what you think are the first, second, and third most important priorities. (choose only three from the list)
1st
Education – helping people to attend school or get skills and training: 1
Health – access to hospitals and clinics, treating diseases and providing vaccinations: 2
Family planning – access to contraception and other family services: 3
Water – access to clean water, sanitation and hygiene: 4
Government and civil society – improving government accountability, addressing corruption, and ensuring peace and security and the rule of law: 5
Welfare – address poverty through providing housing and benefits to people unable to work due to sickness, injury, old age, or children: 6
Infrastructure – providing roads and telecommunications: 7
Energy – providing electricity and other energy services: 8
Agriculture – growing food and other crops: 9
Economic growth – creating jobs and supporting the economy: 10
Environmental protection – addressing climate change, air pollution, and protecting animals and their habitats: 11
Debt relief – reducing debts owed by poor countries: 12
Disaster relief – helping in emergencies and urgent humanitarian crises: 13
Migration and refugee flows – protection of refugees and support for safe and responsible migration 14
Women's equality – support women's rights, gender equality, and help eliminate violence against women 15
Q17B
Thinking again about government spending on international aid in poor countries, please indicate what you think are the first, second, and third most important priorities. (choose only three from the list)
2nd
Education – helping people to attend school or get skills and training: 1
Health – access to hospitals and clinics, treating diseases and providing vaccinations: 2
Family planning – access to contraception and other family services: 3
Water – access to clean water, sanitation and hygiene: 4
Government and civil society – improving government accountability, addressing corruption, and ensuring peace and security and the rule of law: 5
Welfare – address poverty through providing housing and benefits to people unable to work due to sickness, injury, old age, or children: 6
Infrastructure – providing roads and telecommunications: 7
Energy – providing electricity and other energy services: 8
Agriculture – growing food and other crops: 9
Economic growth – creating jobs and supporting the economy: 10
Environmental protection – addressing climate change, air pollution, and protecting animals and their habitats: 11
Debt relief – reducing debts owed by poor countries: 12
Disaster relief – helping in emergencies and urgent humanitarian crises: 13
Migration and refugee flows – protection of refugees and support for safe and responsible migration 14
Women's equality – support women's rights, gender equality, and help eliminate violence against women 15
Q17C
Thinking again about government spending on international aid in poor countries, please indicate what you think are the first, second, and third most important priorities. (choose only three from the list)
3rd
Education – helping people to attend school or get skills and training: 1
Health – access to hospitals and clinics, treating diseases and providing vaccinations: 2
Family planning – access to contraception and other family services: 3
Water – access to clean water, sanitation and hygiene: 4
Government and civil society – improving government accountability, addressing corruption, and ensuring peace and security and the rule of law: 5
Welfare – address poverty through providing housing and benefits to people unable to work due to sickness, injury, old age, or children: 6
Infrastructure – providing roads and telecommunications: 7
Energy – providing electricity and other energy services: 8
Agriculture – growing food and other crops: 9
Economic growth – creating jobs and supporting the economy: 10
Environmental protection – addressing climate change, air pollution, and protecting animals and their habitats: 11
Debt relief – reducing debts owed by poor countries: 12
Disaster relief – helping in emergencies and urgent humanitarian crises: 13
Migration and refugee flows – protection of refugees and support for safe and responsible migration 14
Women's equality – support women's rights, gender equality, and help eliminate violence against women 15
Q18A
To what extent do you agree or disagree with the following statements about aid from the Canadian government?
International aid to poor countries strengthens Canada's political influence in the world.
Strongly agree: 1
Agree: 2
Neither agree nor disagree: 3
Disagree: 4
Strongly disagree: 5
Don't know: 99 S
Q18B
To what extent do you agree or disagree with the following statements about aid from the Canadian government?
Providing international aid really helps to promote Canada's national security.
Strongly agree: 1
Agree: 2
Neither agree nor disagree: 3
Disagree: 4
Strongly disagree: 5
Don't know: 99 S
Q18C
To what extent do you agree or disagree with the following statements about aid from the Canadian government?
International aid improves people's lives by providing access to education, healthcare, clean water, and sanitation.
Strongly agree: 1
Agree: 2
Neither agree nor disagree: 3
Disagree: 4
Strongly disagree: 5
Don't know: 99 S
Q18D
To what extent do you agree or disagree with the following statements about aid from the Canadian government?
International aid increases economic growth in poor countries.
Strongly agree: 1
Agree: 2
Neither agree nor disagree: 3
Disagree: 4
Strongly disagree: 5
Don't know: 99 S
Q19A
To what extent do you agree or disagree with the following statements about aid from the Government of Canada?
Most international aid does not get to the intended recipients.
Strongly agree: 1
Agree: 2
Neither agree nor disagree: 3
Disagree: 4
Strongly disagree: 5
Don't know: 99 S
Q19B
To what extent do you agree or disagree with the following statements about aid from the Government of Canada?
A lot of international aid from Canada ends up in the pockets of corrupt politicians in the developing world.
Strongly agree: 1
Agree: 2
Neither agree nor disagree: 3
Disagree: 4
Strongly disagree: 5
Don't know: 99 S
Q19C
To what extent do you agree or disagree with the following statements about aid from the Government of Canada?
Most international aid is spent on programs that don't help reduce poverty.
Strongly agree: 1
Agree: 2
Neither agree nor disagree: 3
Disagree: 4
Strongly disagree: 5
Don't know: 99 S
Q19D
To what extent do you agree or disagree with the following statements about aid from the Government of Canada?
Canada cannot afford to give international aid.
Strongly agree: 1
Agree: 2
Neither agree nor disagree: 3
Disagree: 4
Strongly disagree: 5
Don't know: 99 S
Q20
Using a scale where 0 means 'International aid makes countries too dependent on charity' and 10 means 'International aid helps countries become self-sufficient', please indicate which comes closest to your view.
0 – International aid makes countries too dependent on charity: 1
1: 2
2: 3
3: 4
4: 5
5: 6
6: 7
7: 8
8: 9
9: 10
10 – International aid helps countries become self-sufficient: 11
Don't know: 99
Q21A
To what extent do you agree or disagree with the following statements?
Countries like Canada should give more money to international aid because it is the morally right thing to do.
Strongly agree: 1
Agree: 2
Neither agree nor disagree: 3
Disagree: 4
Strongly disagree: 5
Don't know: 99 S
Q21B
To what extent do you agree or disagree with the following statements?
I would feel very guilty if I ignored the needs of poor people in poor countries.
Strongly agree: 1
Agree: 2
Neither agree nor disagree: 3
Disagree: 4
Strongly disagree: 5
Don't know: 99 S
Q21C
To what extent do you agree or disagree with the following statements?
Helping people in need is the right thing to do.
Strongly agree: 1
Agree: 2
Neither agree nor disagree: 3
Disagree: 4
Strongly disagree: 5
Don't know: 99 S
Q21D
To what extent do you agree or disagree with the following statements?
Every person in the world should be treated equally.
Strongly agree: 1
Agree: 2
Neither agree nor disagree: 3
Disagree: 4
Strongly disagree: 5
Don't know: 99 S
Q22
On a scale from 0 to 10, where 0 means 'have no influence' and 10 means 'have a great deal of influence', how much influence, if any, do you have on politics and public affairs?
0 Have no influence at all on politics and public affairs: 1
1: 2
2: 3
3: 4
4: 5
5: 6
6: 7
7: 8
8: 9
9: 10
10 Have a great deal of influence on politics and public affairs: 11
Don't know: 99
Q23
Which of the following best reflects your view on how to secure a prosperous and safe country? Using the 0 – 10 scale, where 0 means 'We are best placed to do it on our own' and 10 means 'We are best placed to do it in cooperation with other countries', please indicate how you feel.
0 – We are best placed to secure a prosperous and safe country on our own: 1
1: 2
2: 3
3: 4
4: 5
5: 6
6: 7
7: 8
8: 9
9: 10
10 – We are best placed to secure a prosperous and safe country in cooperation with other countries: 11
Don't know: 99
Q24
To what extent do you agree or disagree with the following statement? Democracy is about achieving compromise among differing viewpoints.
Strongly agree: 1
Agree: 2
Neither agree nor disagree: 3
Disagree: 4
Strongly disagree: 5
Don't know: 99
Q25
Which of the following two statements comes closest to your view?
Our lives are threatened by terrorists, criminals and immigrants and our priority should be to protect ourselves.: 1
It's a big, beautiful world, mostly full of good people, and we must find a way to embrace each other and not allow ourselves to become isolated.: 2
Don't know: 99 B
Q26
Have you ever heard or read about the United Nations' Sustainable Development Goals?
Yes, and I know what they are: 1
Yes, but I don't really know what they are: 2
No: 3
Don't know: 99
Q27
For the following question, please think about the world as a whole and not individual countries. Some people say that there is a trade-off between prioritizing economic growth to meet people's needs for food, housing, and healthcare versus prioritizing a sustainable environment, climate, and fertile soils. Using a 0 to 10 scale, where 0 means 'Prioritize people's needs for food, housing, and healthcare' and 10 means 'Prioritize a sustainable environment and climate', please indicate which statement comes closer to your view.
0 – Prioritize people's needs for food, housing, and healthcare: 1
1: 2
2: 3
3: 4
4: 5
5: 6
6: 7
7: 8
8: 9
9: 10
10 – Prioritize a sustainable environment and climate: 11
Don't know: 99
Q28
Please say whether you agree or disagree with the following statement.
Extreme poverty will be eradicated for all people everywhere by the year 2030.
Strongly agree: 1
Agree: 2
Neither agree nor disagree: 3
Disagree: 4
Strongly disagree: 5
Don't know: 99 S
Q29
To what extent do you agree or disagree with the following statement?
Generally speaking, people get what they deserve.
Strongly agree: 1
Agree: 2
Neither agree nor disagree: 3
Disagree: 4
Strongly disagree: 5
Don't know: 99 S
Q30A
Please say whether you agree or disagree with the following statements.
What happens to people in other countries makes a difference to my life.
Strongly agree: 1
Agree: 2
Neither agree nor disagree: 3
Disagree: 4
Strongly disagree: 5
Don't know: 99 S
Q30B
Please say whether you agree or disagree with the following statements.
I have a duty to ensure that my actions do not harm people living in other countries.
Strongly agree: 1
Agree: 2
Neither agree nor disagree: 3
Disagree: 4
Strongly disagree: 5
Don't know: 99 S
Q30C
Please say whether you agree or disagree with the following statements.
I enjoy visiting other countries and learning about other cultures.
Strongly agree: 1
Agree: 2
Neither agree nor disagree: 3
Disagree: 4
Strongly disagree: 5
Don't know: 99 S
Q30D
Please say whether you agree or disagree with the following statements.
I have very little in common with people living in other countries.
Strongly agree: 1
Agree: 2
Neither agree nor disagree: 3
Disagree: 4
Strongly disagree: 5
Don't know: 99 S
Q31A
Below are statements about corporate partnerships between private sector businesses and charities. Please indicate the extent to which you agree or disagree with the following statements.
Charities that partner with private sector corporations are compromised and less trustworthy.
Strongly agree: 1
Agree: 2
Neither agree nor disagree: 3
Disagree: 4
Strongly disagree: 5
Don't know: 99 S
Q31B
Below are statements about corporate partnerships between private sector businesses and charities. Please indicate the extent to which you agree or disagree with the following statements.
Private sector corporations that partner with charities are just trying to boost their reputation and enhance their brand.
Strongly agree: 1
Agree: 2
Neither agree nor disagree: 3
Disagree: 4
Strongly disagree: 5
Don't know: 99 S
Q31C
Below are statements about corporate partnerships between private sector businesses and charities. Please indicate the extent to which you agree or disagree with the following statements.
Partnering with private sector corporations is a smart way for charities to increase their resources and impact.
Strongly agree: 1
Agree: 2
Neither agree nor disagree: 3
Disagree: 4
Strongly disagree: 5
Don't know: 99 S
Q31D
Below are statements about corporate partnerships between private sector businesses and charities. Please indicate the extent to which you agree or disagree with the following statements.
Corporate partnerships with charities effectively harnesses the power of business to achieve wider social goals.
Strongly agree: 1
Agree: 2
Neither agree nor disagree: 3
Disagree: 4
Strongly disagree: 5
Don't know: 99 S
Q34
How important is it to you personally that large international development NGOs partner with NGOs that work in the local community to deliver aid programs and funding?
Very important: 1
Important: 2
Neither important or unimportant: 3
Unimportant: 4
Not at all important: 5
Don't know: 99
ROTQ35
Calculation, group selection
Group 1: 1
Group 2 (Q35A, Q35B): 2
Group 3 (Q35A, Q35B, Q35C, Q35D): 3
Group 4 (Q35A, Q35B, Q35E, Q35F): 4
Q35A
If... ROTQ35 = 2,3,4
Across the globe, people have very different levels of wealth: some people are richer, and some people are poorer.
The scale below shows people's relative economic position in the world as whole, with the poorest people of the world at 1 and the richest people of the world at 100.
Thinking back to 2019, in your opinion, where do you think you were on the scale in 2019?
Looking at the scale below, please enter any number from 1 to 100 below.
1 > :1
Q35B
If... ROTQ35 = 2,3,4
Now, in your opinion, where do you think you are on the scale today?
Looking at the scale below, please enter any number from 1 to 100 below.
1 < :1
Q35BX
You said that in 2019 you were at Q35A
Q35C
If... ROTQ35 = 3
Next, imagine an average person in your local community. Thinking back to 2019, in your opinion, where do you think they were on the scale in 2019?
Looking at the scale below, please enter any number from 1 to 100 below.
1 < :1
Q35CX
You said that in 2019 you were at Q35A
Q35D
If... ROTQ35 = 3
Now, in your opinion, where do you think they are on the scale today?
Looking at the scale below, please enter any number from 1 to 100 below.
1 < :1
Q35DX
You said that in 2019 you were at Q35A.
You said that in 2022 you are at Q35B.
You said that in 2019 the average person in your community was at Q35C.
Q35E
If... ROTQ35 = 4
Next, imagine an average person in a poor country. Thinking back to 2019, in your opinion, where do you think they were on the scale in 2019?
Looking at the scale below, please enter any number from 1 to 100 below.
1 < :1
Q35EX
You said that in 2019 you were at Q35A
Q35F
If... ROTQ35 = 4
Now, in your opinion, where do you think they are on the scale today?
Looking at the scale below, please enter any number from 1 to 100 below.
1 < :1
Q35FX
You said that in 2019 you were at Q35A.
You said that in 2022 you are at Q35B.
You said that in 2019 the average person in a poor country was at Q35E.
Q35G
Imagine you have been unexpectedly given CA$1000. You can divide the money in any way between yourself, people in your local community, and people in a poor country.
Unfortunately, the money is not real, but please make your choices as if it were real.
Please indicate how much you would allocate to ... (Please ensure the total adds up to CA$1000)
Q35G1BOX
You and your household: 1
Q35G2BOX
People in your local community: 2
Q35G3BOX
People in a poor country: 3
QAGEX
The following questions will be used for statistical purposes only. What is your age?
Please specify: 77
Prefer not to answer: 999 S
QAGEY
Hesitant, QAGEX
If... QAGEX = 999
May we place your age into one of the following general age categories?
18-24 years: 1
25-34 years: 2
35-44 years: 3
45-54 years: 4
55-64 years: 5
65 years or older: 6
Prefer not to answer: 99 S
QSEX
Are you...?
Male: 1
Female: 2
Prefer to self-identify: 77
Prefer not to answer: 99 S
QPROV
In which province or territory do you live?
British Columbia: 1
Alberta: 2
Saskatchewan: 3
Manitoba: 4
Ontario: 5
Quebec: 6
New Brunswick: 7
Nova Scotia: 8
Prince Edward Island: 9
Newfoundland and Labrador: 10
Yukon: 11
Northwest Territories: 12
Nunavut: 13
Prefer not to answer: 99 S
QEDUC
What is the highest level of schooling you have completed?
Less than High School diploma or equivalent: 1
High School diploma or equivalent: 2
Registered Apprenticeship or other trades certificate or diploma: 3
College, CEGEP or other non-university certificate or diploma: 4
University certificate or diploma below bachelor's level: 5
Bachelor's degree: 6
Post graduate degree above bachelor's level: 7
Prefer not to answer: 99
QHINCOME
What is your gross [hover="Gross household income is the combined income of all those earners in a household from all sources, including wages, salaries, or rents and before tax deductions.">household] income?
Under CA$20,000: 1
CA$20,000 to just under CA$40,000: 2
CA$40,000 to just under CA$60,000: 3
CA$60,000 to just under CA$80,000: 4
CA$80,000 to just under CA$100,000: 5
CA$100,000 to just under CA$150,000: 6
CA$150,000 and above: 7
Prefer not to answer: 99
QETHN [1,14]
People living in Canada come from many different ethno-cultural backgrounds or countries. Do you consider yourself to be:
Arab: 1
Latin American: 2
White: 3
Black: 4
Southeast Asian (e.g. Vietnamese, Cambodian, Laotian, Thai): 5
West Asian (e.g., Iranian, Afghan): 6
South Asian (e.g. East Indian, Pakistani, Sri Lankan).: 7