Prepared for: Health Canada
POR 095-16
Contract # HT372/16433/001/CY
Produced by Environics Research Group
Contract Award Date: 2017-01-20
Report Date: March 2017
Fieldwork dates: February 15 – March 10, 2017
PA 9321
Ce rapport est aussi disponible en français sur demande.
For more information on this report:
info@hc-sc.gc.ca
Health Canada, in collaboration with Environment and Climate Change Canada, the Public Health Agency of Canada, Natural Resources Canada, and the National Research Council identified the need for public opinion research to understand public perceptions of climate change and its effects on their health, and more generally on climate change adaptation. Specific research objectives were to understand:
To address the research objectives, a mixed-mode telephone and online survey was conducted with a total of 1,833 Canadians (aged 18 and over) from February 15 – March 10, 2017.
The results described below are based on the telephone data only, with the exception of the section that summarizes the impact of survey mode.
Where possible, results have been compared to a 2008 Health Canada survey about climate change and health.
The cost of this research was $119,928.60 (HST included).
I hereby certify as a Senior Officer of Environics Research that the deliverables fully comply with the Government of Canada political neutrality requirements outlined in the Communications Policy of the Government of Canada and Procedures for Planning and Contracting Public Opinion Research. Specifically, the deliverables do not contain any reference to electoral voting intentions, political party preferences, standings with the electorate, or ratings of the performance of a political party or its leader.
Megan Tam
Vice President, Public Affairs, Environics Research Group
megan.tam@environics.ca
613-699-8905
Supplier name: Environics Research Group
PWGSC contract number: HT372/16433/001/CY
Original contract date: 2017-01-20
For more information, contact info@hc-sc.gc.ca
Given the imperative associated with climate change and the development of a Pan Canadian Framework on Clean Growth and Climate Change (released in December 2016), it is important to have a solid grasp of the perceptions of Canadians with respect to climate change and of the risks that they believe are associated with their health. Public communications have been identified by the First Ministers as a key area of work. Health Canada has also been supporting public and professional education activities related to "heat health", which refers to the impacts extreme heat has on human health. Health Canada has also been supporting First Nations peoples and Inuit to conduct research, collect data and develop adaptation plans to address climate change.
Health Canada conducted research in this area in 2008 ('Assessing perceived health risks of climate change: Canadian Public Opinion 2008'); however, the context and perspectives of Canadians are expected to have changed significantly. Further, as climate change adaptation is a cross-departmental priority, Health Canada has partnered with Environment and Climate Change Canada (ECCC), the Public Health Agency of Canada (PHAC), Natural Resources Canada (NRCan) , and the National Research Council (NRC) to get a bigger picture of Canadian perspectives on this multi-sectoral issue.
With this research, Health Canada and its partner organizations (ECCC, NRCan, NRC and PHAC) will be able to compare against the baseline climate change and health research conducted in 2008. This will provide useful information to determine effectiveness of heat campaign work carried out by Health Canada and will also help the department create a more effective communications campaign surrounding climate change and health and related climate change issues from other participating government departments (OGDs). The research will also provide useful baseline information for evaluation programs established under the Pan Canadian Framework. Through this collaborative research effort, the Government of Canada will be able to collectively obtain results on climate change, which is a cross-government priority, in an efficient and cost-effective way.
The purpose of this research is to understand public perceptions of climate change and its effects on the health of Canadians, First Nations and Inuit, and more generally on climate change adaptation. Specific research objectives include the following but are not limited to understanding:
This report begins with an executive summary outlining key findings and conclusions, followed by a detailed analysis of the survey data. The results (including discussion of subgroup differences) are based on the telephone data only, with the exception of the table columns that present the combined telephone and online results.
Provided under a separate cover is a detailed set of "banner tables" presenting the results for all questions by population segments as defined by region and demographics. These tables are referenced by the survey question in the detailed analysis. A detailed description of the methodology used to conduct this research is presented in Appendix A.
In this report, results are expressed as percentages unless otherwise noted. Results may not add to 100% due to rounding or multiple responses. Net results cited in the text may not exactly match individual results shown in the charts due to rounding. Subgroup differences are only reported if they are statistically significant at the 95% confidence level.
Over the past decade, climate change has been a high profile topic and the subject of much debate. The first section of the survey explored the Canadian public's attitudes towards and perceptions of the reality of climate change, including its potential impacts. NOTE: Several questions in this section are asked only of a subgroup who initially responded that they believe in climate change (either definitely or maybe).
The large majority of Canadians remain convinced that climate change is happening.
To understand the issue of climate change and health risk, it is important to know whether or not people believe that climate change is a real phenomenon. Eight in ten (79%) say that climate change is definitely happening, while 16 percent say it is not yet proven, and only five percent deny that climate change exists. Since 2008, the proportion who are convinced about climate change has increased (up 10 points).
| Phone only | Phone and Online | ||
|---|---|---|---|
| 2008 (n=1600) |
2017 (n=1425) |
2017 (n=1833) |
|
|
* This response category was not offered in 2008 Q1. There has been a lot of discussion lately about the issue of climate change. Do you believe that climate change is something that is definitely happening, or something which may be happening but is not yet proven, or climate change is not happening at all? |
|||
| Climate change is definitely happening | 69% | 79% | 79% |
| Climate change may be happening but is not yet proven | 27% | 16% | 15% |
| Climate change is not happening at all* | n/a | 5% | 5% |
The proportion who believe climate change is definitely happening is higher among:
Three in ten climate change believers have definitely noticed changes in their community that they attribute to climate change; a slightly higher proportion of four in ten have noticed changes in other parts of the country. The most noticed changes are warmer temperatures and more unpredictable weather, both at higher levels than in 2008.
Three in ten of those who believe in climate change (31%) say they have noticed a local change that they would definitely attribute to climate change, while an additional third have noticed changes they feel are either likely (19%) or possibly (16%) the result.
A greater proportion have noticed climate change-related changes in other parts of the country. Four in ten (42%) say they have noticed changes elsewhere that are definitely the result of climate change, while another three in ten (29%) have noticed changes they would at least possibly attribute to this cause.
| Phone only (n=1378) | Phone & online (n=1751) | |||
|---|---|---|---|---|
| In your community |
In other parts of Canada |
In your community |
In other parts of Canada |
|
Q2. Have you noticed any changes in your community which you think are definitely, likely, or possibly the result of climate change or you have not noticed any changes? Q3. And are you aware of any changes in other parts of Canada which you think are definitely, likely, or possibly the result of climate change or you have not noticed any changes? |
||||
| Definitely the result of climate change | 31% | 42% | 31% | 40% |
| Likely the result of climate change | 19% | 15% | 21% | 18% |
| Possibly the result of climate change | 16% | 14% | 17% | 15% |
| No changes noticed | 32% | 25% | 28% | 21% |
The same population segments are most likely to have noticed changes both in their community and in other parts of Canada that are definitely the result of climate change. They include:
Types of changes noticed. Canadians who have noticed a change, either locally or elsewhere in Canada, were asked what kinds of changes they have noticed (unprompted). The most commonly mentioned change is warmer temperatures (43%, up 10 points), followed by more unpredictable weather (31%, up 18 points), both of which have increased since 2008. Other common changes noticed include more (11%) or less (25%) ice or snow, colder temperatures (15%), more extreme weather events (12%), and more (8%) or less (10%) rain.
| Phone only | Phone and Online |
||
|---|---|---|---|
| 2008* (n=1291) |
2017 (n=1152) |
2017 (n=1475) |
|
|
* The 2008 survey was conducted during a very snowy winter which threatened to break snowfall records in some regions of the country. Q4. What kinds of changes have you noticed? |
|||
| Warmer temperatures/weather | 33% | 43% | 42% |
| Weather more unpredictable | 13% | 31% | 31% |
| Less ice/snow | 26% | 25% | 24% |
| Colder temperatures/weather | 11% | 15% | 13% |
| Weather events more extreme | 13% | 12% | 11% |
| More ice/snow | 6% | 11% | 10% |
| Less rain | 6% | 10% | 8% |
| More rain | 4% | 8% | 8% |
| More storms | 7% | 7% | 7% |
| Changes in migration patterns | - | 7% | 7% |
| More air pollution/lower air quality | 8% | 2% | 2% |
| Changes/harm to wildlife and plants | 10% | - | - |
The noticed changes are largely similar across regions and segments of the population, with a few exceptions:
Climate change believers are most convinced that climate change causes melting permafrost, followed by flooding, extreme heat events and more frequent storms.
Canadians who believe in climate change were presented with a series of potential impacts in Canada and asked whether they think climate change causes or does not cause each (definitely or likely).2
While the degree of belief ranges considerably (from a high of 89% "definitely" or "likely" to a low of 31%), in most cases, the majority believe that climate change is at least a likely cause; the exceptions (where fewer than half believe they are caused by climate change) include mental health conditions (40%), impact to health care availability (35%), increased isolation (31%) and a weaker connection to one's culture (31%).
| Definitely cause | Definitely or likely cause | |||
|---|---|---|---|---|
| Phone only (n=1379) |
Phone & online (n=1751) |
Phone only (n=1379) |
Phone & online (n=1751) |
|
Q5. Would you say that climate change definitely causes, likely causes, likely does not cause or definitely does not cause each of the following types of impacts in Canada? |
||||
| Melting permafrost in the Arctic regions | 58% | 56% | 89% | 88% |
| Flooding of rivers and in coastal areas | 47% | 43% | 83% | 82% |
| Loss of wildlife habitat | 45% | 42% | 79% | 78% |
| More frequent storms | 42% | 41% | 82% | 82% |
| Impact to food supply | 40% | 36% | 79% | 76% |
| Extreme heat events or heat waves | 39% | 39% | 83% | 83% |
| Drought conditions | 39% | 38% | 80% | 81% |
| Coastal erosion | 36% | 35% | 76% | 75% |
| Forest fires | 36% | 34% | 75% | 72% |
| Air pollution/lower air quality | 35% | 33% | 71% | 70% |
| Extreme cold weather | 28% | 28% | 65% | 66% |
| More severe forest pest infestation | 27% | 25% | 70% | 68% |
| Increased allergies | 25% | 22% | 62% | 58% |
| Physical health conditions of Canadians | 20% | 17% | 52% | 49% |
| Negative impacts on the economy/jobs | 18% | 16% | 56% | 51% |
| Mental health conditions of Canadians | 11% | 10% | 40% | 36% |
| Impact to health care availability | 10% | 10% | 35% | 32% |
| Increases isolation /reduces belonging | 10% | 10% | 31% | 29% |
| Weaker connection to one's culture | 9% | 9% | 31% | 30% |
Generally speaking, but not in all cases, the following groups tend to be more likely to say that climate change definitely or likely causes these impacts:
On the other hand, belief that several of these impacts are caused by climate change tends to be lower among residents of the Prairie provinces, older Canadians (55+) and those with household incomes under $100,000.
A majority of climate change believers can cite at least one health impact of climate change, the most common of which is air quality impacts.
Unprompted awareness. Seven in ten climate change believers (69%) were able to identify (without prompting) at least one way in which climate change potentially affects health. Awareness of any one specific effect is relatively low, with various mentions of air quality impacts (21%), fluctuation in the weather (14%), water quality impacts (11%) and infectious diseases (10%), among others. Three in ten either cannot think of any (11%) or maintain that there are none (20%).
| Phone only (n=1379) |
Phone & Online (n=1751) |
|
|---|---|---|
Q6. In what ways, if any, do you think climate change poses a risk to the health of Canadians? |
||
| Any impacts | 69% | 70% |
| Net: Air Quality Impacts | 21% | 19% |
| Poor air quality | 11% | 10% |
| Increased air pollution | 11% | 9% |
| Net: Water Quality Impacts | 11% | 9% |
| Decreased water quality | 7% | 6% |
| Decreased drinking water supply | 4% | 3% |
| Net: Infectious Diseases | 10% | 10% |
| Other infectious diseases | 6% | 6% |
| Flu/influenza virus | 4% | 4% |
| Weather fluctuation/warmer/colder | 14% | 13% |
| Respiratory/breathing problems | 9% | 8% |
| Drought/affects food supply/agriculture | 8% | 8% |
| Allergies (related to pollen/mould) | 7% | 7% |
The proportion able to identify at least one potential health impact of climate change is higher among:
Majorities of six in ten or more climate change believers say that each of these issues poses at least a moderate health risk.
Those who believe climate change is happening were asked the extent to which different factors are a health risk for Canadians (Indigenous peoples were asked specifically about the risk to First Nations peoples, Inuit and Metis). There is fairly limited differentiation between the risk factors, with six in ten or more who say that each of these issues poses at least a moderate risk to health. The highest risk is attributed to changes in air quality (79% major or moderate health risk), forest fires (79%), changes in water quality (78%), forest fire smoke (77%) and extreme heat events (77%).
| Major risk | Major or moderate risk | |||
|---|---|---|---|---|
| Phone only (n=1379) |
Phone & Online (n=1751) |
Phone only (n=1379) |
Phone & Online (n=1751) |
|
Q7. How much of a risk to the health of [Canadians]/ [IF INDIGENOUS: First Nations peoples/Inuit/Métis] is there from each of the following? |
||||
| Changes in water quality | 49% | 48% | 78% | 78% |
| Changes in air quality | 48% | 47% | 79% | 79% |
| Forest fires | 47% | 46% | 79% | 79% |
| Forest fire smoke | 45% | 44% | 77% | 77% |
| Rising sea levels/coastal erosion | 44% | 42% | 73% | 73% |
| Flooding | 43% | 42% | 75% | 76% |
| Extreme heat events | 43% | 42% | 77% | 77% |
| Loss of permafrost | 40% | 38% | 66% | 66% |
| Spread of infectious diseases | 38% | 37% | 71% | 70% |
| Food security | 36% | 34% | 69% | 68% |
| Food safety | 34% | 33% | 67% | 66% |
| Allergies (pollen/mould) | 32% | 30% | 68% | 67% |
| Food-borne illness | 27% | 27% | 61% | 60% |
| Indirect impacts (mass migration, loss of jobs/income) | 27% | 26% | 63% | 60% |
Generally speaking, but not in all cases, the following groups are more likely to say that these factors cause a major or moderate health risk for Canadians:
On the other hand, the perceived health risk from these factors tends to be lower among residents of the Prairie provinces.
Finally, the perceived health risk from forest fires or forest fire smoke is consistent both within and outside higher risk forest fire areas.
Majorities of Indigenous people believe climate change is having at least a moderate impact on their connection to the land and their ability to eat healthy foods.
Indigenous people who believe in climate change were asked about the extent to which they believe their health and culture is being affected by it. They are most likely to say climate change has had at least a moderate impact on Indigenous peoples' connection to the land (64%) and on their ability to eat healthy foods (56%). Fewer than half believe that climate change is affecting transmission of knowledge and beliefs (48%) or their ability to cope with the impact on their mental health (44%).
| Major risk | Major or moderate risk | |||
|---|---|---|---|---|
| Phone only (n=248) |
Phone & Online (n=288) |
Phone only (n=248) |
Phone & Online (n=288) |
|
Q8. The next question is about how you feel climate change is affecting your health and your culture. Is climate change having a major, moderate, minor impact or no impact at all on each of the following? |
||||
| Indigenous peoples' connection to the land | 39% | 35% | 64% | 59% |
| Your ability to eat healthy foods | 29% | 28% | 56% | 62% |
| Passing down knowledge/beliefs from elders to youth | 23% | 18% | 48% | 48% |
| Your ability to cope with impact on your mental health | 16% | 16% | 44% | 46% |
Half of climate change believers say it poses a health risk to Canadians today, compared to four in ten who say the risk will happen in the future.
Canadians who believe in climate change were asked if they think that it already poses a health risk today, or if this is something that will happen in the future. Half (53%) believe that climate change poses a current health risk, while four in ten (40%) say it will pose such a risk in the future. Only five percent insist there are no health risks from climate change, either now or in the future.
| Phone only (n=1379) |
Phone & Online (n=1751) |
|
|---|---|---|
Q9. Do you think that climate change already poses a risk to Canadians today, or do you think this is something that will happen in the future or it poses no risk now or in the future? |
||
| Poses a risk today | 53% | 52% |
| Will pose a risk in the future | 40% | 39% |
| No risks now or in the future | 5% | 5% |
| Depends | 2% | 4% |
Belief that climate change poses a risk today is significantly higher among:
This belief is also linked to perceived vulnerability to climate change. Individuals who feel more personally vulnerable to climate change, or who have someone in their household who they consider vulnerable, are more likely to say climate change poses a health risk today (69% and 71%, respectively).
Over half feel personally vulnerable to climate change health impacts; almost four in ten have someone in their household who is vulnerable.
Personal vulnerability. A majority (55%) believe they are either definitely (18%) or likely (37%) vulnerable to the potential health impacts of climate change.
| Phone only (n=1379) |
Phone & Online (n=1751) |
|
|---|---|---|
Q11. What about your own health? Do you believe that you personally are definitely, likely, likely not, or definitely not vulnerable to the potential health impacts of climate change? |
||
| Definitely vulnerable | 18% | 18% |
| Likely vulnerable | 37% | 38% |
| Top 2 box (net) | 55% | 56% |
| Likely not vulnerable | 28% | 27% |
| Definitely not vulnerable | 15% | 14% |
Belief in one's own personal vulnerability (definitely or likely) is significantly higher among:
Household vulnerability. Close to four in ten (37%) say there is someone in their household who would be particularly impacted by climate change.
| Phone only (n=1379) |
Phone & Online (n=1751) |
|
|---|---|---|
Q12. Is there anyone else in your immediate household who you think would be especially vulnerable to the potential health impacts of climate change? |
||
| Yes, have vulnerable household member | 37% | 37% |
The proportion with an especially vulnerable household member is significantly higher among:
A minority of climate change believers have taken action to protect themselves and their families from the health impacts of climate change.
Close to four in ten (38%) who believe in climate change say they have taken steps in the past year to protect themselves and their families from the potential health risks and/or impacts of climate change, although no single action stands out as more widespread than others. A few of these actions are more in line with mitigation (reducing the impacts of climate change), such as recycling and increasing their home's energy efficiency, rather than protective or adaptive measures.
| Phone only (n=1379) |
Phone & Online (n=1751) |
|
|---|---|---|
Q14. Have you personally taken any steps in the past year to protect yourself or family members from the potential health risks and/or impacts of climate change? |
||
| Any protective steps | 38% | 37% |
| Better eating habits/gardening | 8% | 8% |
| Use more sunscreen | 7% | 6% |
| Recycling | 7% | 6% |
| Increase home's energy efficiency | 6% | 5% |
| Watch weather more closely | 5% | 5% |
| Drive less | 3% | 3% |
| Flu shot/immunization | 2% | 2% |
| Installed air conditioning | 2% | 2% |
| Have an emergency plan/kit | 1% | 1% |
| Prepare for storms | 1% | 1% |
| Vigilant for ticks on person/pets | 1% | 1% |
| Other mentions | 10% | 11% |
| None | 62% | 63% |
The proportion who have taken any protective actions is significantly higher among:
One potential health impact of climate change is an increase in the number and type of vector-borne diseases. This section explores the extent to which Canadians see these diseases as a health risk, and the steps they have taken to protect themselves and their families.
Of diseases caused by an insect bite, Lyme disease is perceived to be the biggest health risk, followed by West nile virus.
Seven in ten (69%) Canadians believe Lyme disease poses at least a moderate health risk, while six in ten (59%) say the same about West nile virus. Fewer perceive the same degree of risk from Zika (40%), malaria (32%) or yellow fever (27%); in those three cases, half or more say the risk is minor or there is no risk at all.
| Major risk | Major or moderate risk | |||
|---|---|---|---|---|
| Phone Only (n=1425) |
Phone & Online (n=1833) |
Phone Only (n=1425) |
Phone & Online (n=1833) |
|
Q17. I will now read you a list of diseases caused by a mosquito / tick bite. Please tell me whether you think each of the following poses a major risk, moderate risk, a minor risk or no risk at all to the health of Canadians. |
||||
| Lyme disease | 31% | 30% | 69% | 68% |
| West Nile Virus | 22% | 22% | 59% | 58% |
| Zika | 17% | 17% | 40% | 40% |
| Malaria | 15% | 15% | 32% | 32% |
| Yellow Fever | 11% | 11% | 27% | 28% |
A minority of Canadians have taken protective action against being infected by a vector-borne illness.
Over four in ten Canadians (43%) say they have taken steps in the past year to protect themselves and family members against the bite of an infected mosquito or tick. The step most commonly taken (mentioned without prompting) is to always use insect repellent (23%), followed by wearing long pants and long sleeves (11%). A number of other steps are mentioned, such as avoiding outdoor areas where mosquitos or ticks are known to be bad (6%), updating their immunizations (6%), using insect repellent in marshy or treed areas (5%) and checking for ticks (5%).
| Phone Only (n=1425) |
Phone & Online (n=1833) |
|
|---|---|---|
Q18. Have you personally taken any steps in the past year to protect yourself or family members to prevent against diseases caused by the bite from an infected mosquito or tick? Q19. What steps have you taken? |
||
| Yes, taken steps | 43% | 41% |
| Using insect repellent / spray always | 23% | 22% |
| Wearing long pants and long sleeves | 11% | 11% |
| Avoid outdoor areas known for higher volume of mosquitos/ticks | 6% | 7% |
| Vaccinations/immunizations/shots | 6% | 6% |
| Using insect repellent / spray only when going into marshy / treed areas | 5% | 5% |
| Checking for ticks on skin after being outdoors | 5% | 5% |
| Check pets after being outdoors | 3% | 2% |
| Reducing time outdoors during peak mosquito periods | 3% | 2% |
| Avoid standing water | 2% | 2% |
| Wearing light coloured clothing when outdoors | 1% | 1% |
| Other | 4% | 4% |
The proportion who have taken any protective actions is significantly higher among:
The Internet is by far the source most likely to be used for information about vector-borne disease; doctors are a distant second.
By a wide margin, Canadians are most likely to do an Internet search (75%) if they wanted to find out more about vector-borne diseases; one in five also mention specific federal government websites (19%). A doctor or specialist (19%) is the next most likely source. A variety of other sources are mentioned by four percent of Canadians or fewer.
| Phone Only (n=1425) |
Phone & Online (n=1833) |
|
|---|---|---|
Q20. If you wanted more information about these types of diseases, where would you look or what sources would you use? |
||
| Web/Internet/Google search | 75% | 74% |
| Federal Government website such as HC and PHAC | 19% | 18% |
| Doctor / Specialist | 19% | 18% |
| Books/library/journals | 4% | 3% |
| Newspaper/Magazine ad | 3% | 3% |
| Your provincial government | 3% | 3% |
| TV | 3% | 2% |
| US Centre for Disease Prevention and Control (CDC) | 2% | 2% |
| Your municipal government / local government (e.g. city) | 2% | 1% |
| Hospital/health clinic/center/unit | 2% | 2% |
| Other | 8% | 9% |
Online sources are by far the preferred source for this type of information in all regions and segments of the Canadian population.
While many of the efforts to adapt to climate change will require action by communities and varying levels of government, there are also many adaptive actions can take. As such, it is important to assess what Canadians know about the risks of extreme weather events and what, if any, preventive steps they may be prepared to undertake. The survey asked opinions about extreme weather events as a health risk; about perceptions of the likelihood of extreme weather events; and about whether the household has taken emergency preparedness steps.
Four in ten Canadians believe extreme weather events pose at least a moderate health risk to them and their family. Most Canadians can identify at least one extreme weather event that could pose a health risk, the most common being winter storms and extreme heat events.
A minority of Canadians believe the risk to their health and that of their family from extreme weather events is either major (12%) or moderate (30%); more than half (57%) say the risk is minor, or there is no risk at all.
| Phone Only (n=1425) |
Phone & Online (n=1833) |
|
|---|---|---|
Q21. How much of a health risk do you believe extreme weather events present to you and your family? Do they present: |
||
| A major health risk | 12% | 13% |
| A moderate health risk | 30% | 31% |
| Top 2 box (net) | 42% | 44% |
| A minor health risk | 40% | 39% |
| No health risk at all | 17% | 15% |
Belief that extreme weather events pose at least a moderate health risk is significantly higher among:
The large majority of Canadians (92%) can identify (without prompting) at least one extreme weather event that poses a health risk. These are most likely to include winter storms (22%) and extreme heat events (17%), followed by floods (11%), hurricanes (10%) and wind storms (9%).
| Phone Only (n=1425) |
Phone & Online (n=1833) |
|
|---|---|---|
Q22. Which extreme weather events do you feel pose the greatest risk to your health and the health of your family? |
||
| Winter storms/blizzards | 22% | 20% |
| Extreme heat/heat waves | 17% | 17% |
| Floods | 11% | 10% |
| Hurricanes | 10% | 9% |
| Wind storms | 9% | 7% |
| Forest fires | 5% | 4% |
| Tornadoes | 4% | 5% |
| Earthquake | 3% | 3% |
| Drought | 2% | 3% |
| Extreme cold | 2% | 3% |
| Other | 7% | 9% |
| None/dk/na | 8% | 10% |
The types of extreme weather events identified as health risks vary primarily by region:
Indigenous peoples believe changing weather patterns are having an impact in a variety of ways, but particularly on animal migration patterns or fish populations.
To what extent are Indigenous people seeing the impact of changing weather patterns on their ways of life? Majorities are seeing at least a moderate impact on animal migration patterns (71%), the location of berries and foods (67%), ice roads (66%), traditional fishing or hunting grounds (64%) and housing conditions (53%). Half say climate change is impacting their ability to get out on the land (50%), while four in ten (43%) say the same about their ability to store traditional foods.
| Major impact | Major or moderate impact | |||
|---|---|---|---|---|
| Phone only (n=262) |
Phone & Online (n=288) |
Phone only (n=262) |
Phone & Online (n=288) |
|
Q23. The next question is about weather conditions and climate change. Do you feel that changing weather patterns are having a major, moderate, minor impact or no impact at all on…? |
||||
| Animal migration patterns or fish populations | 52% | 47% | 71% | 69% |
| Traditional fishing, hunting or trapping grounds | 42% | 36% | 64% | 65% |
| The location of berries, foods or traditional medicines | 42% | 34% | 67% | 65% |
| Ice roads | 41% | 42% | 66% | 66% |
| Your ability to get out on the land | 23% | 25% | 50% | 55% |
| Housing conditions | 22% | 23% | 53% | 54% |
| Your ability to store traditional foods | 22% | 20% | 43% | 44% |
Similar to 2008, four in ten Canadian households report having an emergency plan.
It is recommended that Canadians households prepare and discuss an emergency plan so that family members can locate and protect each other more effectively in the event of a natural disaster or emergency. Four in ten (40%) Canadians say they have such a plan; this proportion is essentially unchanged since 2008.
However, this proportion appears to be overstated, which is to be expected given the high level of social desirability associated with a having such a plan in the context of this survey: only one-quarter (26%) of online respondents reported that their household has an emergency plan.
| Phone only | Phone and Online |
||
|---|---|---|---|
| 2008 (n=1600) |
2017 (n=1425) |
2017 (n=1833) |
|
Q24. Does your household currently have a plan for what to do to protect yourself and your family in the event of a natural disaster or emergency? Such a plan might include how you would evacuate your home, or how to stay in contact with other family members. |
|||
| Yes, have emergency plan | 42% | 40% | 37% |
The proportion reporting that they have an emergency household plan is significantly higher among:
Notably, having a household emergency plan is also highest among the small group of climate change deniers (65%, vs. 38% who say climate change definitely exists and 45% who say it may).
Contrary to what might be expected, the likelihood of having an emergency plan is not any higher among those who believe extreme weather events present a health risk.
Four in ten Canadians believe their community will very likely experience a weather-related disaster within their lifetime.
Relatively few Canadians believe a weather-related disaster is very likely to occur in their community. Less than one in ten (8%) think it will happen in the next two years, and this increases to four in ten (39%) who think it will happen in their lifetime; however, a majority (60%) don't believe any of the scenarios are very likely to happen.
| Very likely | Very or somewhat likely | |||
|---|---|---|---|---|
| Phone Only (n=1425) |
Phone & Online (n=1833) |
Phone Only (n=1425) |
Phone & Online (n=1833) |
|
Q25. Do you think it is very, somewhat, not very or not at all likely that a disaster caused by extreme weather will occur and affect you or your community: |
||||
| Within your lifetime | 39% | 38% | 74% | 72% |
| Within the next 10 years | 24% | 23% | 64% | 62% |
| Within the next two years | 8% | 7% | 36% | 35% |
| None of the above | 60% | 60% | 22% | 24% |
Strong belief (i.e., very likely) in an extreme-weather disaster during any timeframe is significantly higher among:
The sources that Canadians would turn to for extreme weather information about their community are fragmented, but are most likely to include TV and the Internet.
There are a wide variety of sources that Canadians would consult if they needed information about extreme weather in their community, with no single source that is top-of-mind. Canadians are most likely to look for this information on TV (26%), or on the Weather Network – either on TV (21%) or on the website (20%). By comparison, relatively few mention Environment Canada specifically (8%).
| Phone Only (n=1425) |
Phone & Online (n=1833) |
|
|---|---|---|
Q26. Where are you most likely to look for information about extreme weather that might affect your community? |
||
| TV | 26% | 36% |
| Weather Network (TV) | 21% | 28% |
| Weather Network (website) | 20% | 27% |
| Google/Google search | 17% | 16% |
| Radio | 14% | 21% |
| Internet/online/website (unspecified) | 12% | 11% |
| Newspaper | 8% | 12% |
| Environment Canada | 8% | 7% |
| Weather apps | 8% | 12% |
| MétéoMédia | 6% | 5% |
| Weather network/channel | 6% | 5% |
Sources for information about extreme weather vary across the population as follows:
Over half of Canadians regularly check for extreme weather events, although this level has declined since 2008.
An indicator of proactive responsibility for the health effects of climate change is being aware of the weather, so that precautions can be taken if needed. Over half of Canadians (54%) say household members check regularly for such weather information; this proportion has declined since 2008 (down 7 points). A further two in ten (23%) check at least occasionally, while the remaining two in ten indicate that they rarely (16%) or never (7%) check for extreme weather news.
| Phone only | Phone and Online |
||
|---|---|---|---|
| 2008 (n=1600) |
2017 (n=1425) |
2017 (n=1833) |
|
Q27. How often do you or others in your household listen or check for extreme weather alerts in your local area? Is this done? |
|||
| Regularly | 61% | 54% | 51% |
| Occasionally | 20% | 23% | 26% |
| Rarely | 12% | 16% | 17% |
| Never | 6% | 7% | 7% |
The proportion who regularly check for extreme weather alerts is significantly higher among:
More than half of Canadians say they regularly or occasionally change their daily routines as result of extreme weather alerts; a similar proportion have taken action or changed plans specifically as a result of a heat warning.
Extreme weather alert. To what extent do Canadians take action to reduce their health risk from extreme weather by changing their daily routines? More than half (55%) say they do so regularly (23%) or occasionally (32%). Four in ten (43%) say they rarely or never change their routines as a result of an extreme weather alert.
| Phone Only (n=1425) |
Phone & Online (n=1833) |
|
|---|---|---|
Q28. How often do you take steps or make changes in your daily routine as a result of an extreme weather alert? |
||
| Regularly | 23% | 21% |
| Occasionally | 32% | 32% |
| Top 2 box (net) | 55% | 53% |
| Rarely | 27% | 29% |
| Never | 16% | 15% |
The proportion who regularly or occasionally change their daily routine in response to extreme weather alerts is significantly higher among:
Heat warnings. Specifically in response to an extreme heat warning or heat wave, half of Canadians (51%) say they have taken action or changed their plans.
| Phone Only (n=1425) |
Phone & Online (n=1833) |
|
|---|---|---|
Q29. When thinking specifically about extreme heat or heat waves, have you ever taken action or changed your plans as a result of hearing a heat warning? |
||
| Yes, ever taken action | 51% | 51% |
The proportion that has taken action as a result of a heat warning/heat wave is significantly higher among:
Canadians are most likely to mention dizziness, excessive thirst and nausea as symptoms of heat illness.
Most Canadians can identify (without prompting) at least one symptom of heat illness, the most common being dizziness (35%), followed by excessive thirst (29%) and nausea (25%).
| Phone Only (n=1425) |
Phone & Online (n=1833) |
|
|---|---|---|
Q30. To the best of your knowledge, what are the symptoms of heat illness? |
||
| Dizziness | 35% | 33% |
| Excessive thirst / dry mouth | 29% | 29% |
| Nausea | 25% | 24% |
| Headache | 19% | 18% |
| Fainting | 19% | 18% |
| Weakness | 16% | 14% |
| Confusion / disorientation / staggering | 14% | 13% |
| Difficulty breathing | 10% | 10% |
| Lack of sweating (despite heat) | 7% | 7% |
| Heat rash | 7% | 6% |
| Rapid heartbeat | 3% | 3% |
| Swelling of hands, feed, ankles | 2% | 2% |
| Muscle cramps | 2% | 2% |
| Decreased urination/unusually dark yellow urine | 1% | 1% |
| Other (not specified) | 44% | 47% |
| dk/na | 6% | 6% |
Broadly speaking, these results are similar across the population. However, Canadians aged 35-54 and those with higher socioeconomic status (as represented by education and household income) are more likely than others to identify multiple symptoms of heat illness.
Canadians are most likely to stay inside and drink liquids to protect against heat illness.
Almost all Canadians can identify at least one way to protect themselves and their families from heat illness. More than half each say (unprompted) that they would stay inside when it's too hot (58%) or would drink lots of liquids (57%). About half that proportion would use air conditioning (27%), while others mention finding outdoor shade (18%) or wearing a hat (11%).
| Phone Only (n=1425) |
Phone & Online (n=1833) |
|
|---|---|---|
Q31. What kinds of things would you do to protect yourself and your family from heat illnesses? |
||
| Stay inside when it's too hot | 58% | 51% |
| Drink liquids/water | 57% | 57% |
| Turn on air conditioning | 27% | 25% |
| Find an outdoor shaded location (e.g. under a tree) | 18% | 19% |
| Wear a hat | 11% | 10% |
| Go to air conditioned public location (e.g. mall, community centre, library) | 7% | 7% |
| Go to a swimming pool/beach | 7% | 6% |
| Wear loose fitting clothing | 6% | 6% |
| Turn on fan | 4% | 4% |
| Take a shower | 2% | 2% |
| Close curtains/blinds | 2% | 1% |
| Other (not specified) | 25% | 26% |
| dk/na | 4% | 4% |
Broadly speaking, these results are similar across the population, with one notable exceptions:
Canadians are most likely to turn to the Internet, ahead of their doctor, for information about heat illness.
When asked who they would turn to get more information on heat illness, half of Canadians (51%) mention (without prompting) the Internet, while three in ten (30%) mention their doctor. Fewer would turn to Health Canada (8%), another health professional (8%) or friends or family (7%) for this purpose.
| Phone Only (n=1425) |
Phone & Online (n=1833) |
|
|---|---|---|
Q32. Who would you turn to in order to obtain more information on heat illness? |
||
| Internet | 51% | 50% |
| Doctor | 30% | 30% |
| Health Canada | 11% | 10% |
| Other health professional | 8% | 7% |
| Friends/Family | 7% | 6% |
| Other government website | 4% | 5% |
| TV | 4% | 4% |
| Hospital/health clinic/center/unit | 3% | 3% |
| Local weather forecasters/Meteorologists | 3% | 3% |
| Nurse | 2% | 2% |
| Pharmacist | 2% | 2% |
| Other | 7% | 9% |
| dk/na | 3% | 3% |
Adaptation involves making adjustments in our decisions, activities, and thinking because of observed or expected changes in climate, in order to reduce harm or take advantage of new opportunities.3 While these terms are widely used and understood by professionals working in the field of climate change, from a communications perspective, it is useful to know the baseline familiarity with and understanding of this terminology among the general public.
Just one-quarter of Canadians who believe in climate change are familiar with the terms climate change adaptation or climate resilience. This group is most likely to associate these terms with the idea of "being prepared for what's to come".
Familiarity. There is limited familiarity with these terms. One-quarter (26%) are very familiar or familiar with them. The large majority say they are either not very familiar (27%), know the words by name only (16%) or have never heard of them before (31%).
| Phone Only (n=1425) |
Phone & Online (n=1833) |
|
|---|---|---|
Q33. How familiar are you with the terms "climate change adaptation" or "climate resilience"? |
||
| Very familiar | 6% | 5% |
| Familiar | 20% | 19% |
| Top 2 box (net) | 26% | 24% |
| Not very familiar | 27% | 31% |
| Know them by name only | 16% | 15% |
| Have never heard of them before | 31% | 30% |
Familiarity (i.e., very familiar or familiar) with these terms is significantly higher among:
Meaning. When presented with potential definitions, Canadians with some familiarity with the terms are most likely to link them to the idea of being prepared for what's to come (40%). (It should be noted that the popularity of this choice may have been influenced by the context of the questionnaire, much of which focused on being prepared and taking preventive actions).
| Phone only (n=962) |
Phone & Online (n=1236) |
|
|---|---|---|
Q34. What do they mean to you? |
||
| Being prepared for what's to come | 40% | 32% |
| Change/adjustment | 22% | 20% |
| Becoming more flexible with change | 15% | 14% |
| Changing government rules/policies | 9% | 7% |
| Adapting to the changing climate | 3% | 8% |
| All of the above | 2% | 1% |
| Other | 2% | 3% |
| dk/na | 2% | 16% |
These results are consistent across regions and population segments, with no meaningful differences of note.
The purpose of incorporating online interviews into the survey was to allow for comparisons across modes should Health Canada wish to move this study to a fully online methodology in the future. This section summarizes the similarities and differences between the telephone and online results.
Note that both the phone and online samples are weighted identically by region, age and gender to ensure they are representative of the Canadian population; thus, we can be more comfortable that differences are the result of modal differences rather than differences in their sample composition.
Overall, the phone and online results are largely consistent, meaning that they are within the margin of error and that any differences would not change the conclusions drawn based on the findings.
The primary differences occur where social desirability bias is a factor. The research literature has consistently demonstrated that interview-based surveys (e.g., telephone, in-person) have a tendency to elicit somewhat more socially-desirable responses (i.e., responses that will be viewed favourably by others), in comparison to surveys involving self-administration (paper and pencil questionnaires or online surveys) since the latter does not involve direct contact with another individual.
This is evident in the current study, in two ways:
| Phone only (n=1425) |
Online only (n=384) |
Difference | |
|---|---|---|---|
| Taken steps to protect against infectious diseases caused by insect bite (Q18) | 43% | 32% | -11 |
| Have a household emergency plan (Q24) | 40% | 26% | -14 |
| Regularly check for extreme weather alerts (Q27) | 54% | 37% | -17 |
| Regularly change daily routine as a result of an extreme weather alert (Q28) | 23% | 15% | -8 |
This pattern is not always the case. For instance, the proportion who report ever taking action as a result of an extreme heat warning is similar by phone (51%) and online (48%). It may be that the infrequent and unique nature of such an event (at least up to now) allows respondents to recall their behaviour more accurately (without the influence of bias).
| Phone only (n=1425) |
Online only (n=384) |
Difference | |
|---|---|---|---|
| Q5 – Climate change definitely or likely causes: | |||
| Physical health conditions of Canadians | 52% | 41% | -11 |
| Negative impacts on the economy/jobs | 56% | 38% | -18 |
| Mental health conditions of Canadians | 40% | 27% | -13 |
| Impact to health care availability | 35% | 25% | -10 |
| Increases isolation/reduces belonging | 31% | 25% | -6 |
| Q7 – Major or moderate risk to health | |||
| Indirect impacts (mass migration, loss of jobs/income) | 63% | 50% | -13 |
| Q25 – Extreme weather related disaster is very or somewhat likely... | |||
| Within your lifetime | 74% | 64% | -10 |
| Within the next 10 years | 64% | 53% | -11 |
| Within the next two years | 36% | 30% | -6 |
| None of the above | 22% | 33% | +11 |
Summary. We believe that the online results would serve as a valid and reliable new baseline against which to compare future survey results, if Health Canada chooses a fully online methodology going forward. This is based on the fact that, in most cases, the online data is similar to the telephone data, and that, where there are differences, the online data may actually more accurately represent the public's true opinions and behaviours.
The research reveals that most Canadians have accepted the reality of climate change, confirming other public opinion research on this topic. Moreover, the public has a reasonably good understanding of the environmental impacts of the phenomenon (e.g., melting permafrost, flooding, more frequent storms). In contrast, it is still relatively early days for public understanding of the broader implications of climate change, such as impacts to the economy, mental health, health care availability and on belonging and culture.
When pressed, most Canadians acknowledge that climate change is causing health impacts, or will do so in the future. However, consistent with other research, a key challenge is that relatively few see the threat as immediate, local and/or personal. Minorities of Canadians believe a weather-related disaster is likely in their lifetime, have seen clear evidence of local climate change impacts, and feel personally vulnerable or have a household member who is. As a result, there is limited urgency to take protective action, if they are unlikely to feel direct effects or to anticipate such effects in the near term. In addition to building the case for protective action, there is also room for improvement in terms of what that looks like – that is, what steps the public should be taking that will be effective at protecting themselves and their families.
There is not yet widespread recognition of and understanding of what is meant by "climate change adaption" or "climate resilience". Thus, either the terms should be avoided (replaced with clearer terminology) or effort is required to increase familiarity with the terms, before they can be used as shorthand in communications to the public. The Internet is now a primary source for information on health-related topics, whether it be about climate change generally, infectious diseases, extreme weather events or heat illness. Nonetheless, this should continue to be complemented by more traditional information sources (e.g., health professionals, traditional media) – particularly to reach older Canadians and those with lower socioeconomic status who are more likely to search out information in these ways.
Health Canada identified the need for public opinion research to understand public perceptions of climate change and its effects on their health, and more generally on climate change adaptation. Specific research objectives were to understand:
To address the research objectives, a mixed-mode telephone and online survey was conducted with a total of 1,425 Canadians (aged 18 and over) from February 15 – March 10, 2017.
Telephone. The telephone sampling method was designed to complete 1400 interviews with the target audience of Canadians aged 18 and older.
The base sample of 825 was stratified across five designated regions to ensure meaningful data analysis at the regional level. An additional 375 oversample interviews were conducted with Canadians living in higher risk forest fire areas, based on a list of Forward Sortation Areas (FSA) provided by Health Canada. A further 200 oversample interviews with conducted Indigenous people (with quotas set to ensure the final sample was representative by on- and off-reserve).
Environics employed industry-standard random-digit-dialling (RDD) methods as a basis for drawing a national sampling frame for this survey and used an industry-standard "most recent birthday" selection technique to randomly select a respondent within each selected household. Cell phone only (CPO) sample was also included.
The sample was stratified by region to allow for meaningful coverage of lower population areas:
| Region (% of population) | Telephone unweighted sample size |
Margin of error (Phone sample only)* |
Online unweighted sample size |
|---|---|---|---|
|
* In percentage points, at the 95% confidence level |
|||
| Atlantic Canada (7%) | 202 | +/-6.9 | 49 |
| Quebec (24%) | 341 | +/-5.7 | 95 |
| Ontario (38%) | 346 | +/-5.3 | 133 |
| Prairies/NWT/Nunavut (17%) | 413 | +/-4.7 | 58 |
| B.C./Yukon (13%) | 147 | +/-8.1 | 49 |
| CANADA (100%) | 1,449 | +/-2.6 | 384 |
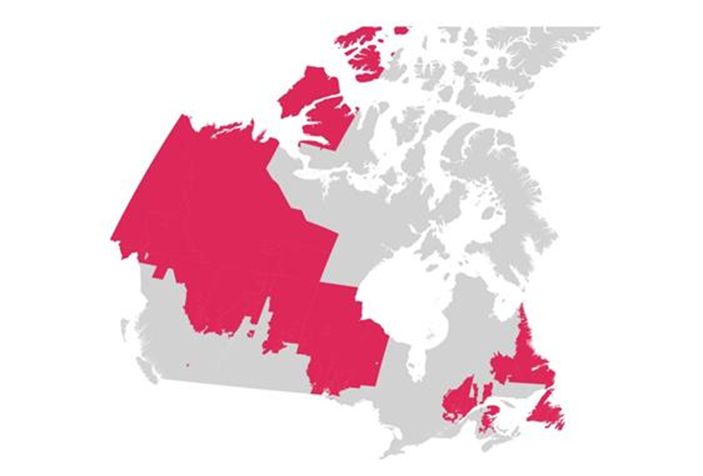
The adjacent map of the forest fire FSAs demonstrates that the majority fall in the territories and in the northern parts of the western provinces, most of which represent rural areas.
FSAs with a higher risk of forest fires
Online. The online sample was designed to achieve completed surveys with 375 adult Canadians. Survey participants were recruited via an online panel, and quotas were set to ensure the sample were generally representative of the Canadian population by age and gender. As with the telephone sample, the online sample was stratified by region to allow for meaningful coverage of lower population areas (see table above).
Weighting. At the analysis stage, the telephone and online survey data were each weighted separately to the national adult population (by region, age and gender, plus for the telephone sample, by forest fire areas and the Indigenous population), and then combined.
The questionnaire was designed by Environics in consultation with representatives from Health Canada and the collaborative partners. Where relevant, the questionnaire incorporated tracking questions from a 2008 survey on climate change and health. The questionnaire was initially developed as a telephone survey; upon client approval of the content, Environics then adapted the survey for online administration. The final study questionnaire is included in Appendix B.
Pre-test. An initial pretest of 10 interviews in each of English and French was conducted on February 10, 2015 and audited using recordings by Environics and Government of Canada staff. These interviews included standard GC pretest probing questions. The survey came in significantly longer than budgeted. As a result, the survey was reviewed, edits, as well as adjustments to the sample size were made to the survey to fall within the budget. The English and French surveys proceeded February 20, 2017.
Telephone. Telephone interviewing was conducted by Elemental Data Collection (EDCI) using Computer Aided Telephone Interviewing (CATI) technology. Field supervisors were present at all times to ensure accurate interviewing and recording of responses. A minimum of ten percent of each interviewer's work was unobtrusively monitored for quality control in accordance with the standards set out by the Marketing Research and Intelligence Association (MRIA). The telephone survey averaged 19 minutes to deliver.
Data analysts programmed the questionnaire in CATI then performed thorough testing to ensure accuracy in set-up and data collection. This validation ensured that the data entry process conformed to the survey's basic logic. The CATI system handles sampling dialling, quotas and questionnaire completion (skip patterns, branching, and valid ranges). The system also ensures that callbacks are conducted in a timely manner. No number is called twice in a two-hour period. Callbacks are conducted on different days of the week and at different times of the day (i.e. morning, afternoon). This system ensures all scheduled appointments are kept, maximizing the response rate and sample representativeness. Up to eight callbacks were made to reach each household selected in the sample.
Online. The surveys were conducted by Environics using a secure, fully featured web-based survey environment. The average length of time to complete the online survey was 19 minutes.
Environics' data analysts programmed the questionnaires then performed thorough testing to ensure accuracy in set-up and data collection. This validation ensured that the data entry process conformed to the surveys' basic logic. The data collection system handles sampling invitations, quotas and questionnaire completion (skip patterns, branching, and valid ranges).
All respondents were offered the opportunity to complete the survey in their official language of choice. All research work was conducted in accordance with the standards established by federal government Public Opinion Research (POR) requirements, as well as applicable federal legislation (Personal Information Protection and Electronic Documents Act, or PIPEDA). The survey was registered with the MRIA's research registration system, which permits the public to verify a survey call, inform themselves about the industry and/or register a complaint.
Telephone. The telephone sample for this survey consisted of 1,449 interviews with adult Canadians. The effective response rate for the survey is nine percent.4 This is calculated as the number of responding participants (completed interviews plus those disqualified because of survey requirements and quotas being filled), divided by unresolved numbers (e.g., busy, no answer) plus non-responding households or individuals (e.g., refusals, language barrier, missed callbacks) plus responding participants [R/(U+IS+R)]. The disposition of all contacts is presented in the following table:
| TOTAL | Landline | Cell | |
|---|---|---|---|
| Total Numbers Attempted | 55263 | 31088 | 25444 |
| Out-of-scope – Invalid | 24163 | 8111 | 16052 |
| Unresolved (U) | 15161 | 9872 | 5289 |
| No answer/Answering machine | 15161 | 9872 | 5289 |
| In-scope – Non-responding (IS) | 3649 | 2268 | 1381 |
| Language barrier | 301 | 217 | 84 |
| Incapable of completing (ill/deceased) | 229 | 209 | 20 |
| Callback (Respondent not available) | 3119 | 1842 | 1277 |
| Total Asked | 12290 | 10837 | 2722 |
| Refusal | 10293 | 8136 | 2157 |
| Termination | 356 | 254 | 102 |
| In-scope – Responding units (R) | 2910 | 2447 | 463 |
| Completed Interview | 1449 | 1034 | 415 |
| NQ – Quota Full | 136 | 94 | 42 |
| NQ – Age | 17 | 11 | 6 |
| NQ – Out of Area (Forest Fire Risk) | 39 | 39 | 0 |
| NQ – Non-Aboriginal (Aboriginal oversample) | 1269 | 1269 | 0 |
| Response Rate | 9.36 | 10.65 | 4.93 |
| Incidence | 49.79 | 42.26 | 89.63 |
| Survey Length (in minutes) | 19.3 | 19.9 | 18.1 |
Online. The online completion results are presented in the following table.
| Total | |
|---|---|
| Total invitations (c) | 1724 |
| Total completes (d) | 384 |
| Qualified break-offs (e) | 55 |
| Disqualified (f) | 87 |
| Not responded (g) | 1039 |
| Quota filled (h) | 159 |
| Contact rate = (d+e+f+h)/c | 40% |
| Participation rate = (d+f+h)/c | 37% |
The table below presents a profile of the final telephone sample, compared to the actual population of Canada (2011 Census information). As is typically the case for general population telephone surveys, older individuals are easier to reach, so the survey overrepresented those age 55+ (this was corrected with age weighting). The final sample also somewhat under-represents those with high school or less education, which is a typical pattern for telephone surveys in Canada (e.g., individuals with more education are more likely to respond to telephone surveys).
| Phone Sample* | Canada | |
|---|---|---|
|
* Data are unweighted and percentaged on those giving a response to each demographic question α Actual Census categories differ from those used in this survey and have been recalculated to correspond. Statistics Canada figures for education are for Canadians aged 25 to 64 years. |
||
| Gender (18+) | ||
| Male | 50 | 48 |
| Female | 50 | 52 |
| Age | ||
| 18-34 | 18 | 28 |
| 35-54 | 33 | 37 |
| 55+ | 49 | 36 |
| Education level α | ||
| High school diploma or less | 32 | 40 |
| Trades/college/post sec no degree | 35 | 32 |
| University degree | 33 | 28 |
Info Node
Good afternoon/evening. My name is Insert Name and I am calling from Environics, a public opinion research company.
Confirm Whether Respondent Prefers English or French
We are conducting a study on behalf of the Government of Canada to find out what people think about issues facing Canada today. Please be assured that we are not selling or soliciting anything. The survey is voluntary and your responses will be kept entirely confidential and anonymous. This survey is registered with the national survey registration system.
The survey should take about 15 minutes to complete]
[If Asked: The survey is sponsored by the Government of Canada]
[If Asked: This survey is registered with the national survey registration system. The registration system has been created by the Canadian survey research industry to allow the public to verify that a survey is legitimate, get information about the survey industry or register a complaint. The registration system's toll-free telephone number is 1-888-602-6742, extension 8728].
If Landline Sample
We choose telephone numbers at random and then select one person from each household to be interviewed. To do this, we would like to speak to the person in your household, 18 years of age or older, who has had the most recent birthday. Would that be you?
If Cell Phone Sample Ask A and B
SC
A. Are you in a safe place to talk – for example not operating a motor vehicle?
SC
B. At home, do you have a traditional telephone line other than a cell phone?
OE Num [1900-2016] Terminate If > 1998
C. In what year were you born?
Record Response
SC
D. Which of the following age groups do you fall into?
OE NUM CHA
E. To ensure we include people from all parts of Canada, what are the six digits of your postal code?
Record Response
If Refused at E: Can I please have the first 3 characters of your postal code?
sc
F. Which of the following best identifies you? Are you…?
sc
If F=01, 02 OR 03:
F2. Do you participate in any traditional First Nation/Inuit/Metis activities, such as hunting, fishing, trapping, crafts, harvesting of traditional berries, foods and/or medicines, or other activities?
2008 – Q4a
sc
1. There has been a lot of discussion lately about the issue of climate change. Do you believe that climate change is something that is definitely happening, or something which may be happening but is not yet proven, or climate change is not happening at all?
2008 – Q5
Ask if Q1=1, 2 or 99
SC
2. Have you noticed any changes in your community which you think are definitely, likely, or possibly the result of climate change or you have not noticed any changes?
2008 – Q6
Ask if Q1=1, 2 OR 99
SC
3. And are you aware of any changes in other parts of Canada which you think are definitely, likely, or possibly the result of climate change or you have not noticed any changes?
2008 – Q7
ASK IF Q1=1, 2 OR 99
MC
4. (If Definitely/Likely/Possibly in Q2 OR Q3) What kinds of changes have you noticed?
Do Not Read List - Code All That Apply - Limit Probing
2008 – Q8 with new items
Grid SC per row
Ask if Q1=1, 2 or 99
5. Would you say that climate change definitely causes, likely causes, likely does not cause or definitely does not cause each of the following types of impacts in Canada?
Randomize
Split sample all so half of list is asked to each respondent except high rish forest fire respondents. they will receive all these items.
Rows
Columns
2008 – Q9
MC
Ask if Q1=1, 2 or 99
6. In what ways, if any, do you think climate change poses a risk to the health of Canadians? Please be as specific as possible.
Do Not Read List - Code All That Apply - Limit Probing
New
Grid, SC per row
Ask if Q1=1, 2 or 99
7. How much of a risk to the health of [Canadians]/ [INSERT CODES 01, 02 OR 03 AT QF: First Nations peoples/Inuit/Métis] is there from each of the following?
Randomize
Grid, SC per row
Ask if Q1=1, 2 or 99
8. If F=01, 02 or 03: The next question is about how you feel climate change is affecting your health and your culture. Is climate change having a major, moderate, minor impact or no impact at all on each of the following?
Randomize
2008 – Q11
SC
Ask if Q1=1, 2 or 99
9. Do you think that climate change already poses a risk to Canadians today, or do you think this is something that will happen in the future or it poses no risk now or in the future?
2008 – Q14
SC
Ask if Q1=1, 2 or 99
11. What about your own health? Do you believe that you personally are definitely, likely, likely not, or definitely not vulnerable to the potential health impacts of climate change?
2008 – Q15
SC
Ask if Q1=1, 2 or 99
12. Is there anyone else in your immediate household who you think would be especially vulnerable to the potential health impacts of climate change?
2008 – Q17
MC up to 3
Ask if Q1=1, 2 or 99
14. Have you personally taken any steps in the past year to protect yourself or family members from the potential health risks and/or impacts of climate change?
Do Not Read - Code up to 3 Responses - Limit Probing
Info Node
Now, I would like to talk to you about Infectious diseases that are caused by the bite of an infected mosquito or tick.
NEW
Grid, SC per row
17. I will now read you a list of diseases caused by a mosquito / tick bite. Please tell me whether you think each of the following poses a major risk, moderate risk, a minor risk or no risk at all to the health of Canadians:
Randomize
Rows
Columns
New
SC
18. Have you personally taken any steps in the past year to protect yourself or family members to prevent against diseases caused by the bite from an infected mosquitoe or tick?:
New
MC
19. If yes at Q18: What steps have you taken?
Do Not Read the List
New
MC
20. If you wanted more information about these types of diseases, where would you look or what sources would you use?
Do Not Read List
Info Node
I would now like to ask you about extreme weather events, such as hurricanes, violent wind storms, heat waves, floods and major blizzards...
2008 – Q18
SC
21. How much of a health risk do you believe extreme weather events present to you and your family? Do they present:
New
SC
22. Which extreme weather events do you feel poses the greatest risk to your health and the health of your family?
Do Not Read List - Code One Only
Grid SC per row
23. IF F=01, 02 OR 03: The next question is about weather conditions and climate change. Do you feel that changing weather patterns are having a major, moderate, minor impact or no impact at all on:
Randomize
ROWS
Columns
2008 – Q21
SC
24. Does your household currently have a plan for what to do to protect yourself and your family in the event of a natural disaster or emergency? Such a plan might include how you would evacuate your home, or how to stay in contact with other family members.
2008 – Q24
Grid SC per row
25. Do you think it is very, somewhat, not very or not at all likely that a disaster caused by extreme weather will occur and affect you or your community:
Rows
Columns
2008 – Q25
MC
26. Where are you most likely to look for information about extreme weather that might affect your community?
2008 – Q23 revised wording
SC
27. How often do you or others in your household listen or check for extreme weather alerts in your local area? Is this done:
SC
28. How often do you take steps or make changes in your daily routine as a result of an extreme weather alert?
New
SC
29. When thinking specifically about extreme heat or heat waves, have you ever taken action or changed your plans as a result of hearing a heat warning?
New
MC
30. To the best of your knowledge, what are the symptoms of heat illness?
Do Not Read the List
New
31. What kinds of things would you do to protect yourself and your family from heat illnesses?
Do Not Read the List
New
MC
32. Who would you turn to in order to obtain more information on heat illness?
Do Not Read the List
If Q1 Climate change is not happening, Skip to section D
New
Ask
SC
Ask if Q1=1,2 or 99
33. How familiar are you with the terms "climate change adaptation" or "climate resilience"
New
34. If codes 01 - 04 at q33
SC
What do they mean to you?:
Info Node
Now I'd like to ask you a few questions about your health...
2008 – Q26
SC
D1. Compared to other people your age, would you say your health is generally:
2008 – Q28
Info Node
Finally, I'd like to ask you a few questions about yourself and your household that will help us analyze the results of this survey...
2008 – Q33
SC
D4. What is the highest level of formal education that you have completed?
(Read list)
2008 – Q35
OE NUM [0-99]
D5. How many people, including yourself, currently live in your household?
If Landline Record Region from Sample
If Cell Phone Sample Ask C
SC
D8. In which province or territory do you live?
SC
D9. Gender [Do Not Ask: record based on interviewer observation]
SC
I. What language do you speak most often at home? [Read List -- Accept All That Apply]
SC
J. Which of the following categories best describes your current employment status? Are you [Read List - Accept One Answer Only]
2008 – Q39
SC
D10. Which of the following categories best describes your total household income? That is, the total income of all persons in your household combined, before taxes [Read List]?
Info Node
This completes the survey. In case my supervisor would like to verify that I conducted this interview, may I have your first name?
First Name: [Insert Name] OE CHA
This survey was conducted on behalf of the Government of Canada, and is registered under the Federal Access to Information Act. Thank you very much for your participation.
Bonjour/bonsoir. Je m'appelle [Insert Name] et j'appelle d'Environics, une compagnie de recherche sur l'opinion publique.
Confirmer si le(la) Répondant(e) préfère l'Anglais ou le Français
Nous effectuons une étude pour le Gouvernement du Canada sur ce que pense le public des questions que le Canada affronte aujourd'hui. Soyez assuré(e) que nous ne vendons ni ne sollicitons rien. Le sondage est volontaire et vos réponses resteront confidentielles et anonymes. Ce sondage est enregistré auprès du système national d'enregistrement des sondages.
Le sondage devrait prendre environ 15 minutes à compléter.
[Si demandé : Le sondage est commandité par le Gouvernement du Canada]
[Si demandé : Ce sondage est enregistré auprès du système national d'enregistrement des sondages. Le système d'enregistrement a été mis sur pied par l'industrie canadienne de la recherche par sondage afin de permettre au public de vérifier la légitimité d'un sondage, d'obtenir de l'information à propos du secteur des sondages ou de déposer une plainte. Le numéro de téléphone sans frais du système d'enregistrement est le suivant : 1-888-602-6742, poste 8728].
Si téléphone filaire
Nous choisissons des numéros de téléphone au hasard, puis nous choisissons d'interviewer une personne du foyer. Nous aimerions parler à la personne de votre foyer de 18 ans ou plus dont l'anniversaire de naissance est le plus récent. Est-ce vous ?
Si téléphone cellulaire, demander A et B
A. Êtes-vous en lieu sûr pour parler – par exemple, pas au volant d'une voiture ?
B. À la maison, avez-vous une ligne de téléphone traditionnelle autre qu'un cellulaire ?
F. En quelle année êtes-vous né(e) ?
G. De quel groupe d'âge êtes-vous ?
H. Pour nous assurer d'inclure des gens de toutes les parties du Canada, quels sont les six chiffres de votre code postal ?
F. Lequel des qualificatifs suivants vous identifie le mieux ? Êtes-vous…?
SI F=01, 02 OU 03 : Participez-vous à l'une des activités traditionnelles des Premières Nations, des Inuits ou des Métis, comme la pêche, la chasse, le trappage, l'artisanat, la récolte de baies, d'aliments et/ou de médicaments traditionnels ou d'autres activités ?
2008 – Q4a
1. Il a beaucoup été question de changement climatique ces derniers temps. Croyez-vous que le changement climatique est un phénomène qui se produit vraiment ou qui pourrait se produire, mais n'est pas encore prouvé ?
2008 – Q5
2. Avez-vous observé des changements dans votre milieu qui, selon vous, sont nettement, probablement ou possiblement le résultat du changement climatique ?
2008 – Q6
3. Êtes-vous au courant de changements ailleurs au Canada qui, selon vous, sont nettement, probablement ou possiblement le résultat du changement climatique ?
2008 – Q7
4. (Si nettement/probablement/possiblement à la Q2 ou à la Q3) Quelle sorte de changements avez-vous observés ?
- coder tout ce qui s'applique - limiter le sondage
2008 – Q8 avec de nouveaux objets
5. Diriez-vous que le changement climatique cause nettement, probablement, probablement pas ou nettement pas les effets suivants au Canada ?
–Split Sample]
2008 – Q9
6. De quelle façon le changement climatique présente-t-il un risque pour la santé des Canadiens, selon vous ? Veuillez être aussi précis que possible.
- Coder tout ce qui s'applique - Limiter le sondage]
Nouveau
7. Quelle sorte de risque les phénomènes suivants présentent-ils pour la santé des [Canadiens]/ [Insérer les codes 01, 02 OU 03 À LA QF : Membres des Premières Nations /Inuks/Métis] ?
Randomiser
8. Si F=01, 02 ou 03 : La prochaine question porte sur ce que vous estimez être l'effet du changement climatique sur votre santé et votre culture. Le changement climatique a-t-il un effet majeur, modéré, mineur ou nul sur ce qui suit ?
2008 – Q11
9. Croyez-vous que le changement climatique présente déjà un risque pour les Canadiens ou présentera un risque dans l'avenir ?
2008 – Q14
11. Et votre santé ? Vous croyez-vous nettement, probablement, probablement pas ou nettement pas vulnérable aux effets possibles du changement climatique sur votre santé ?
2008 – Q15
12. Y en a-t-il d'autres chez vous que vous croyez particulièrement vulnérables aux effets possibles du changement climatique sur leur santé ?
2008 – Q17
14. Avez-vous personnellement pris des mesures au cours de la dernière année pour vous protéger ou protéger les membres de votre famille des risques possibles pour la santé et/ou des effets du changement climatique ?
[Ne pas lire – Coder jusqu'à trois réponses - Limiter le sondage]
J'aimerais maintenant vous parler des maladies contagieuses causées par les piqures de maringouins ou de tiques.
Nouveau
17. Je vous lirai maintenant une liste de maladies causées par les piqures de maringouins et de tiques. Dites-moi si vous croyez que les maladies suivants présentent un risque majeur, modéré, mineur ou nul pour la santé des Canadiens :
Nouveau
18. Avez-vous personnellement pris des mesures au cours de la dernière année pour vous protéger ou protéger les membres de votre famille contre les maladies causées par les piqures de maringouins ou de tiques ?
Nouveau
19. Si oui à la Q18 : Quelles mesures avez-vous prises ?
Nouveau
20. Si vous vouliez vous renseigner davantage sur ces types de maladies, où chercheriez-vous ou quelles sources utiliseriez-vous ?
J'aimerais maintenant vous demander à propos des évènements météorologiques extrêmes comme les ouragans, les tempêtes de vent violent, les vagues de chaleur, les inondations et les grands blizzards...
2008 – Q18
21. Quelle sorte de risque pour votre santé et celle de votre famille présentent les évènements météorologiques extrêmes, selon vous ? Présentent-ils :
Nouveau
22. Quels évènements météorologiques extrêmes présentent le plus grand risque pour votre santé et celle de votre famille, selon vous ?
[Ne pas lire la liste –N'en codez qu'un seul]
23. Si F=01, 02 or 03 : La prochaine question porte sur les conditions météorologiques et le changement climatique. Croyez-vous que la situation météorologique changeante a un effet majeur, modéré, mineur ou nul sur :
2008 – Q21
24. Y a-t-il chez vous un plan pour vous protéger, vous et votre famille, en cas de désastre naturel ou de situation d'urgence ? Tel plan pourrait inclure la façon d'évacuer votre maison ou de rester en contact avec les autres membres de la famille.
2008 – Q24
25. Croyez-vous qu'il est très, assez, pas très ou pas du tout probable qu'un désastre causé par une situation météorologique extrême survienne et vous affecte, vous et votre communauté :
2008 – Q25
26. Où êtes-vous le plus enclin à vous renseigner sur une situation météorologique extrême qui pourrait affecter votre communauté ?
2008 – Q23 formulation révisée
27. À quelle fréquence vous ou d'autres personnes de votre foyer écoutez ou vérifiez les alertes de situation météorologique extrême dans votre région ? Est-ce :
28. Vous arrive-t-il souvent de prendre des mesures ou de modifier votre routine à la suite d'une alerte de situation météorologique extrême ?
Nouveau
29. À propos de chaleur extrême ou de vagues de chaleur, avez-vous déjà pris des mesures ou changé vos plans à la suite d'un avertissement de chaleur extrême ?
Nouveau
30. Autant que vous sachiez, quels sont les symptômes de maladie causée par la chaleur ?
Nouveau
31. Que feriez-vous pour vous protéger, vous et votre famille, contre les maladies causées par la chaleur ?
Nouveau
32. Vers qui vous tourneriez-vous pour vous renseigner davantage sur les maladies causées par la chaleur ?
Nouveau
33. Connaissez-vous les expressions « adaptation au changement climatique » ou « résilience climatique » ?
Nouveau
34. Si codes 01 – 04, que signifient-elles pour vous ?
J'aimerais maintenant vous poser quelques questions sur votre santé...
2008 – Q26
D1. Comparativement aux autres de votre âge, diriez-vous que votre santé en général est :
2008 – Q28
Finalement, j'aimerais vous poser quelques questions à votre sujet et au sujet de votre foyer qui nous aideront à analyser les résultats de ce sondage...
2008 – Q33
D4. Quel est le plus haut niveau d'éducation formelle que vous avez complété ?
2008 – Q35
D5. Combien de personnes, vous y compris, habitent chez vous actuellement ?
Si échantillon de région de téléphone filaire
Si échantillons de téléphone cellulaire, demander C
D8. Dans quelle province ou quel territoire habitez-vous ?
D9. Sexe [Ne pas demander : réponse fondée sur l'observation de l'intervieweur]
I. Quelle langue parlez-vous le plus souvent à la maison ? [Lire la liste -- Accepter tout ce qui s'applique]
J. Laquelle des catégories suivantes décrit le mieux votre statut actuel d'emploi ? Êtes-vous [Lire la liste - N'accepter qu'une réponse]
2008 – Q39
D10. Laquelle des catégories suivantes décrit le mieux l'ensemble des revenus de votre foyer ? C'est-à-dire l'ensemble des revenus des personnes de votre foyer avant impôt [Lire la liste] ?
Ceci complète le sondage. Au cas où mon superviseur voudrait vérifier que j'ai fait cette interview, puis-je demander votre prénom ?
Prénom :
Ce sondage a été effectué pour le Gouvernement du Canada et est enregistré conformément à la Loi fédérale d'accès à l'information. Merci de votre participation.