PWGSC Contract Number: HT372-173694/001/CY
POR Registration Number: 052-17
HC POR: POR-17-03
Contract Award Date: 29/11/2017
Prepared for:
First Nations and Inuit Health Branch/FNIHB at Health Canada (HC), now Department of Indigenous Services Canada (DISC)
Ce rapport est aussi disponible en français
For more information on this report, please email:
Hc.cpab.por.rop.dgcap.sc@canada.ca
EKOS RESEARCH ASSOCIATES
Contact: Susan Galley
Ottawa Office
359 Kent Street, Suite 300
Ottawa, Ontario
K2P 0R6
Tel: (613) 235 7215
Fax: (613) 235 8498
E-mail: pobox@ekos.com
www.ekos.com
First Nations and Inuit Health Branch/FNIHB at health Canada (HC), now Department of Indigenous Service Canada (DISC) assists First Nations in ensuring safe drinking water in their communities. Part of the challenge facing DISC is the role of perception of the members of First Nations communities with regards to the safety of their drinking water. Water treatment, monitoring and testing are ineffective if people do not believe that their water is safe to drink and are using alternative sources, such as bottled water, instead of that provided by the community. The purpose of this research is to gain insight into the views of the First Nations community population on the quality of the water to which they have access First Nations community. This will help to assess the effect of current First Nations community water quality programs and allow us to compare perceptions of water quality to those living in other small communities. The major objective is to find out how people feel about the safety of their water, and whether there has been a change in this perception since the implementation of the First Nations Water and Wastewater Action Plan (FNWWAP) in order to measure how effective programs are (whether through increased communication, education or actual improvement of facilities, treatment and monitoring) in increasing people’s confidence in and use of the water provided by the community.
The study involved the collection of a brief (seventeen minute) interview with roughly 710 residents of First Nations communities and (fifteen minute interview) with 721 residents of other small communities (not in a First Nations community) with populations of less than 5,000, which are not bordering a large urban area. In addition to the randomly selected cases with First Nations residents, an additional 118 cases were completed were residents of communities that had experienced a Drinking Water Advisory (DWA) in the previous 12 months. Common questions were used to assess perceptions of water quality, safety, changes over time and uses of tap versus bottled water, as well as incidence and frequency of DWA and, in the case of First Nations residents, recall of public service announcements addressing DWAs on the radio. Results are national in scope and were collected by telephone from January 8 to February 15, 2018.
Results highlight the difference in confidence levels between First Nations and other residents when it comes to the quality of their water. Just half of First Nations residents rated the quality of their drinking water as good, compared to 74 per cent among residents of other small communities (i.e., the general public). In fact, one-fifth of First Nations residents consider their drinking water quality to be bad compared to only eight per cent among residents of other small communities. Long-term tracking suggests, however, that the perceptions around water quality have improved steadily over time for First Nations (21 per cent rate the quality as bad, compared with 33 per cent in 2007).
In terms of safety, results are more positive; one-third of First Nations residents view their tap water as very safe and four in ten think it somewhat safe. Nonetheless, one in five feel that their water is either somewhat or very unsafe. Considerably higher proportions of residents of other small communities perceive their tap water supply to be safe (93 per cent, compared with 74 per cent of residents in First Nation communities). Long-term tracking points to a gradual improvement for First Nations communities (74 per cent say their water is safe, compared to 62 per cent in 2007). Those using piped in water report considerably greater confidence than households using wells as the main source of water.
Nearly half of First Nations residents believe that their water quality has remained the same over the past five years. One-third believe that the water is now safer than it was; however, one in six judge the water to be less safe to drink than it was five years ago. The general public, on the other hand, are less apt to point to a deterioration in their water quality over the last five years. Tracking shows that more First Nations communities are saying that there has been no change (46 per cent, compared with 32 per cent in 2007).
When prompted specifically about the types of information that would help to reassure them about their tap water quality, three-quarters of First Nations community residents said that more information about water quality testing procedures and information about the quality of tap water on their community would make them feel safer. Two-thirds also wish to know more about what to do in case of a DWA/BWA, as well as being provided with a telephone number or website they could access to check on the current quality of their community’s tap water. Compared to residents of other small communities, there is a significantly higher demand among First Nations residents for this type of information.
First Nations residents are less likely to use tap water for various household applications compared with residents of other small communities. Still, over four in five First Nations residents use tap water for brushing teeth, washing food, or cooking. By comparison, almost all (95 to 97 per cent) residents of other small communities use tap water for these applications. A drinking water advisory within the past 12 months strongly influences the disuse of tap water for all applications, along with region (those in Alberta and Saskatchewan least likely to use tap water) and the size of the household (with larger households more likely to use tap water).
First Nations community residents are more likely than residents of other small communities in the general public to have used bottled water in their household; most predominantly for drinking water (nine in ten). Half or less have used bottled water for making coffee or tea, in food preparation, or cooking. Residents of First Nations communities use bottled instead of tap water for a plethora of reasons, with nearly three in ten indicating that they don’t trust their tap water (a stronger reason among First Nations residents). One in five First Nations residents (19 per cent) said they prefer the taste or smell of bottled water, also indicated by 26 per cent of residents of other small communities. Similarly, 19 per cent of First Nations community residents said it is more convenient (also more often stated among the general population; 32 per cent).
Four in ten people living in First Nations communities report a past or current Drinking or Boil Water Advisory (DWA/BWA). This is compared with just one in seven residents in other small communities. Among First Nations residents reporting that they were currently under a DWA/BWA or had been under an advisory in the previous 12 months, about four in ten depend exclusively on bottle water over the course of the advisory. One-quarter use only boiled water and one in six use some combination of the two.
The most frequent sources of information among First Nations people who have been under a DWA/BWA include local councils, the radio, and the Internet. Eight in ten feel they had sufficient information to make informed decisions during their most recent DWA/BWA, although one in five respondents indicated that they would like more information as to the reasons behind the advisory.
Six in ten people living in First Nations communities who have been under an advisory also reported that they recall seeing a notification in the form of a poster. Just under half, meanwhile, recall seeing a door hanger notification (19 per cent) or hearing a public service announcement on the radio (46 per cent). In all three cases, more than eight in ten found these notifications useful.
Nearly two-thirds of residents of First Nations communities are aware that chlorine is present in their drinking water, significantly higher than found among residents of other small communities. After being informed that chlorine is added to drinking water to reduce or eliminate bacteria and viruses, just less than half of First Nations residents confirmed that they are supportive of chlorine being added to the water they drink, similar to the general population. For those who are opposed to the idea of chlorine in their drinking water, roughly one-quarter say it is because they don’t like the taste or are concerned about the effect of chlorine on personal health.
The majority of people living in First Nations communities say they notice a difference in the taste or smell of water that has chlorine added. Over one-third say they have looked for a different source of water because of the taste or smell. Six in ten have used bottled water as an alternate source, with other mentions of a natural source (such as a lake or river), a filtration system, or a well.
After being briefly informed of fluoride sources and the reason for including it in drinking water, respondents were asked about their level of support or opposition to this treatment of drinking water. Four in ten (39 per cent) residents of First Nations communities do not hold a strong opinion on fluoride, neither supporting nor opposing its inclusion. Among those that do hold an opinion results are fairly evenly split, with roughly one-quarter supportive (24 per cent) or opposed (27 per cent). Of the 27 per cent who are opposed, roughly half are concerned about the effects of fluoride on the human body (47 per cent) and one-quarter do not believe in adding anything to water (27 per cent).
The contract value for the POR project is $142,990.20 (including HST).
Supplier Name: EKOS Research Associates
PWGSC Contract Number: HT372-173694/001/CY
Contract Award Date: 29/11/2017
To obtain more information on this study, please e-mail por-rop@hc-sc.gc.ca
This certification is to be submitted with the final report submitted to the Project Authority.
I hereby certify as Senior Officer of EKOS Research Associates Inc. that the deliverables fully comply with the Government of Canada political neutrality requirements outlined in the Communications Policy of the Government of Canada and Procedures for Planning and Contracting Public Opinion Research.
Specifically, the deliverables do not include information on electoral voting intentions, political party preferences, standings with the electorate, or ratings of the performance of a political party or its leaders.
Signed by: Susan Galley (Vice President)
First Nations and Inuit Health Branch/FNIHB at health Canada (HC), now Department of Indigenous Service Canada (DISC) works to assist First Nations communities south of 60 degrees parallel (excluding British Columbia) in assuring safe drinking water. DISC also works with First Nations communities to identify potential drinking water quality problems through activities that include verification monitoring of the overall quality of drinking water at tap, providing advice, guidance and recommendations, and reviewing water and wastewater infrastructure project proposals from a public health perspective.
Perceptions about quality and safety of water one has access to have a strong impact on decisions about how to use tap water in the household. Decisions about use of water to brush teeth, wash and prepare foods, and for drinking are shaped by these perceptions, and those who perceive water quality to be unsafe may consume bottled water without the need to do so.
The purpose of the survey is to gather information on the perceptions and experiences of First Nations communities regarding safety and quality of water they have access to, and compare these perceptions with those of previous years and those of the general population living in non-First Nations communities of similar size. This information will help to assess the effectiveness of activities under First Nations Water and Wastewater Action Plan (FNWWAP), and help to shape strategies to address concerns of First Nations communities.
Specific objectives of the survey include:
During the data collection, the survey team collected 710 cases among residents of First Nations communities across the country as well as 721 interviews with residents of small communities in the general public. In the small communities where members of the general public were interviewed, the community size was capped at 5,000 residents. All First Nations communities were included in the First Nations sample, including 19 per cent that have more than 5000 residents. From the two sample frames built (i.e., all communities that are not classified as a First Nations community and are not located near a large city, with no more than 5,000 residents, and all First Nations communities), a randomly selected number of households were drawn for the telephone survey samples. All participants were asked if they consider themselves an Indigenous person or a First Nation and if they live in a First Nation community for at least six months a year. Each of the two samples yields a level of precision of up to +/-3.7 per cent for the sample overall at a 0.05 confidence level (i.e., 19 times out of 20) and +/-8 to 10 per cent for most sub-groups that could be isolated in the analysis (including regions).
In addition to the core 710 cases of First Nations residents randomly sampled, an additional 118 cases were completed with residents of First Nations communities that had experienced a DWA in the previous 12 months. These oversample cases were not included in the main analysis of overall findings for First Nations or in the sub-group analysis of differences among First Nations segments of the core sample. They were included with the 710 core cases, however, in an examination of differences of results in First Nations communities that had experienced a DWA (Chapter 6).
The survey data were collected over roughly one month from January 8 to February 15, 2018. Data collection relied on standard monitoring and call-back techniques (i.e., rotation of sample to different times and days of the week and multiple call-backs). The average length of the interview was 16 minutes for the general public and 18 for residents of First Nations communities (including a few additional questions targeted for only these residents). The survey collection obtained a response rate of 12 per cent for the general public and 13 per cent for residents of First Nations communities. Appendix B presents details of these calculations.
Prior to conducting the general population survey, the survey instrument was tested with 24 participants, with changes to the survey questionnaire being made after the first 5 to 10 and then again after 10 interviews, to ensure that any changes were addressing particular issues experienced in the interviews. These related to small wording changes and skip logic. Test cases were included in the final data set and analysis. The final survey instrument can be found in Appendices A.
Survey data were weighted regionally to reflect population figures for residents of First Nations communities. Survey data were also coded for open ended responses and tabular results were generated to test for differences between residents of First Nations and residents of other small communities in the general public. Results for First Nations community residents were also generated in tables by key segments of the sample, including demographic characteristics (e.g., gender age, education, presence of children), characteristics of the community (e.g., size, proximity to a large centre, frequency of Drinking or Boil Water Advisories) and perceptions about the water (e.g., quality, safety, change over time).
Most questions are repeated measures from a survey conducted with First Nations residents in 2011, and many were also collected in 2009. A few were originally collected in 20071. Where applicable, survey results from 2011, 2009 and 2007 are featured in the charts and discussed in the report.
The following is a comparison of the core sample for First Nations community residents (excluding the DWA oversample), as well as the sample of residents of other small communities under 5,000 (in the general public). Weighted percentage distributions are shown for both samples, with the exception of region (used in the weight for First Nations and the General Public results).
Table 1: Characteristics of the Samples
| Province/Region | FN 2018 | GP 2018 |
|---|---|---|
| British Columbia | 13% | 16% |
| Alberta | 6% | 8% |
| Saskatchewan | 5% | 5% |
| Manitoba | 12% | 6% |
| Ontario | 29% | 18% |
| Quebec | 26% | 37% |
| Atlantic Region | 8% | 10% |
| Distance | FN 2018 | GP 2018 |
|---|---|---|
| 1-50 km | 37% | 51% |
| 51-100 km | 17% | 24% |
| Over 100 km | 40% | 21% |
| Gender | FN 2018 | GP 2018 |
|---|---|---|
| Male | 45% | 44% |
| Female | 55% | 56% |
| Age (in years) | FN 2018 | GP 2018 |
|---|---|---|
| <25 | 4% | 1% |
| 25-34 | 10% | 3% |
| 35-44 | 11% | 10% |
| 45-54 | 23% | 15% |
| 54-64 | 22% | 30% |
| 65+ | 23% | 40% |
| Education level | FN 2018 | GP 2018 |
|---|---|---|
| Grade school | 23% | 8% |
| High school | 28% | 31% |
| College | 29% | 37% |
| University | 17% | 22% |
| Number of People | FN 2018 | GP 2018 |
|---|---|---|
| 1 | 13% | 23% |
| 2 | 25% | 48% |
| 3-4 | 29% | 21% |
| 5+ | 30% | 6% |
| Number of Children | FN 2018 | GP 2018 |
|---|---|---|
| None | 48% | 73% |
| 1-2 | 30% | 20% |
| 3+ | 20% | 6% |
| Age of Children | FN 2018 | GP 2018 |
|---|---|---|
| Under 2 | 28% | 5% |
| 2-5 years old | 37% | 30% |
| 6-11 years or older | 54% | 48% |
| 12 years or older | 49% | 60% |
| Number of Seniors | FN 2018 | GP 2018 |
|---|---|---|
| 1+ | 39% | 46% |
| Vulnerable Household Member | FN 2018 | GP 2018 |
|---|---|---|
| Yes | 26% | 10% |
| Used for Daycare | FN 2018 | GP 2018 |
|---|---|---|
| Yes | 1% | 1% |
As shown in the table of sample characteristics, there is a greater concentration geographically in Ontario and Manitoba for First Nations communities, which are also more often located large distances from major urban centres. The gender split is similar between the two samples. The First Nations community sample is considerably younger than the one collected in other small communities in the general public. The level of education is higher in the general public. The number of people in the household is often higher in First Nations communities, with three in ten (30 per cent) reporting five or more household members. Twice as many households report children in them in First Nations communities relative to other rural communities, and children are younger (with five times more households with children reporting at least one child under than age of two). More First Nations households include someone who is vulnerable household (beyond a young child or senior). Survey results show that perceptions of water quality vary based not only on the characteristics of the community and incidence of Drinking or Boil Water Advisories, but also on the characteristics of the household, including whether or not they have young children, vulnerable household members.
Study findings explore the perceptions of First Nations residents and compare them to the results of residents in other small communities (i.e., with populations under 5,000) in the general public. First Nations results are also compared over time to results collected in 2011 and, where applicable, 2009 and 2007. Sub-group findings within the First Nations community sample are also provided. Survey findings examine overall perceptions of residents regarding the quality and safety of their water supply, as well as perceptions about the change in the quality and safety over time. Some elements of communications are also explored, including the type of information that would enhance confidence in the water.
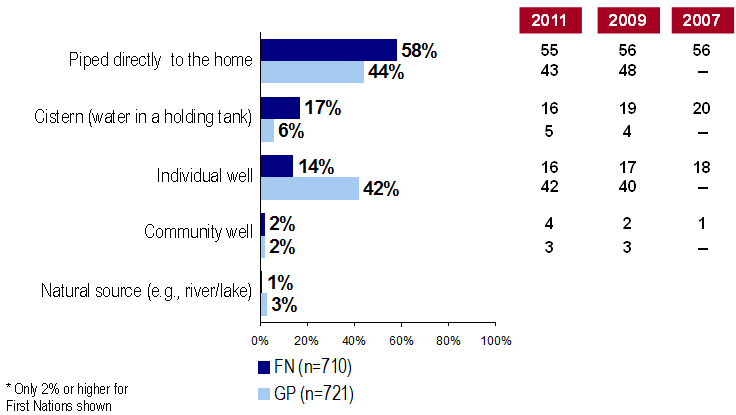
Six in ten First Nations community residents (58 per cent) indicate that their main source of household tap water is piped directly to the home. Other sources of tap water reported by First Nations respondents include a cistern (17 per cent) or an individual well (14 per cent). This is similar to results from previous years.
Compared to residents of other small communities in the general public, those who reside in First Nations communities are more likely to rely on water piped directed into their home (58 per cent, compared to 44 per cent among the general public) and a cistern (17 per cent versus six per cent). Members of the general public, in turn, are more likely to depend on an individual well (42 per cent, compared to 14 per cent of First Nations residents).
Chart 1: Source of Household Tap Water
“What is the main source of your household tap water? Is it...?”
Text description: Chart 1
| Sources of water | 2018 FN (n=710) |
2018 GP (n=721) |
2011 FN | 2011 GP | 2009 FN | 2009 GP | 2007 FN | 2007 GP |
|---|---|---|---|---|---|---|---|---|
| Note: Only 2% or higher for First Nations shownEKOS FN Syndicated - Wave 1, 2007 First Nations Water Quality, Apr. 2009, Feb. 2011, Jan. 2018 |
||||||||
| Piped directly to the home | 58% | 44% | 55% | 43% | 56% | 48% | 56% | nil |
| Cistern (water in a holding tank) | 17% | 6% | 16% | 5% | 19% | 4% | 20% | nil |
| Individual well | 14% | 42% | 16% | 42% | 17% | 40% | 18% | nil |
| Community well | 2% | 2% | 4% | 3% | 2% | 3% | 1% | nil |
| Natural source (e.g., river/lake) | 1% | 3% | nil | nil | nil | nil | nil | nil |
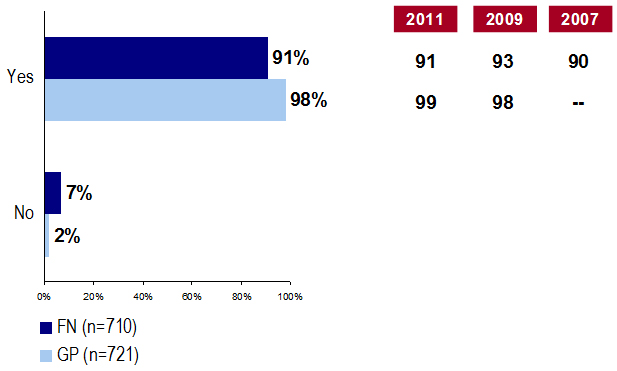
Nine in ten First Nations residents (91 per cent) feel they have enough water for all their domestic needs, compared to seven per cent who say they do not. By comparison, nearly all of the general population (98 per cent) indicate they receive enough household tap water. These results are consistent with those found in 2011.
Chart 2: Quantity of Household Tap Water
"Do you receive enough household tap water for all your domestic needs?"
Text description: Chart 2
| 2018 FN (n=710) |
2018 GP (n=721) |
2011 FN | 2011 GP | 2009 FN | 2009 GP | 2007 FN | 2007 GP | |
|---|---|---|---|---|---|---|---|---|
| EKOS FN Syndicated - Wave 1, 2007 First Nations Water Quality, Apr. 2009, Feb. 2011, Jan. 2018 |
||||||||
| Yes | 91% | 98% | 91% | 99% | 93% | 98% | 90% | nil |
| No | 7% | 2% | nil | nil | nil | nil | nil | nil |
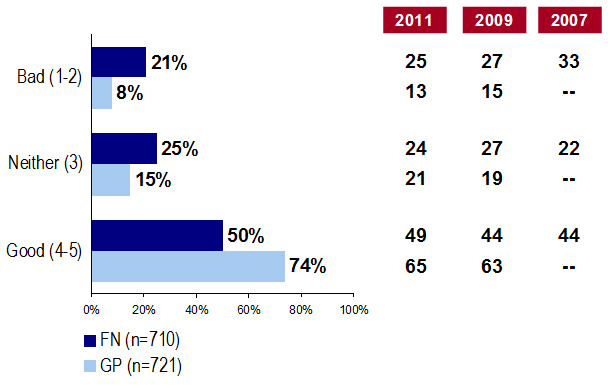
Survey respondents were asked to rate the quality of drinking water in their communities. Results highlight the difference in confidence levels between First Nations community residents and the general public when it comes to the quality of their water. First Nations residents are less positive about the quality of the water they receive than are residents of other small communities. Half of First Nations residents (50 per cent) rated the quality of their drinking water as good, which is considerably lower than the 74 per cent of residents of other small communities (i.e., the general public) who provided the same positive rating about their water. In fact, one in five First Nations residents (21 per cent) consider their drinking water quality to be poor, and roughly the same proportion (25 per cent) provided a more neutral (neither good nor bad) rating of the quality of their drinking water in First Nations communities. Much smaller proportions of residents of other general public small communities provided the same type of negative or neutral rating of their water.
These results are similar to results obtained among First Nations residents in 2011. Longer-term tracking, however, suggests that the perceptions around water quality have been improving marginally over time, given that fewer residents of First Nations communities today say that the quality is poor (21 per cent, compared to 33 per cent in 2007).
Chart 3: Water Quality
"How would you rate the quality of drinking water in your community?"
Text description: Chart 3:
| 2018 FN (n=710) |
2018 GP (n=721) |
2011 FN | 2011 GP | 2009 FN | 2009 GP | 2007 FN | 2007 GP | |
|---|---|---|---|---|---|---|---|---|
| EKOS FN Syndicated - Wave 1, 2007 First Nations Water Quality, Apr. 2009, Feb. 2011, Jan. 2018 |
||||||||
| Bad (1-2) | 21% | 8% | 25% | 13% | 27% | 15% | 33% | nil |
| Neither (3) | 25% | 15% | 24% | 21% | 27% | 19% | 22% | nil |
| Good (4-5) | 50% | 74% | 49% | 65% | 44% | 63% | 44% | nil |
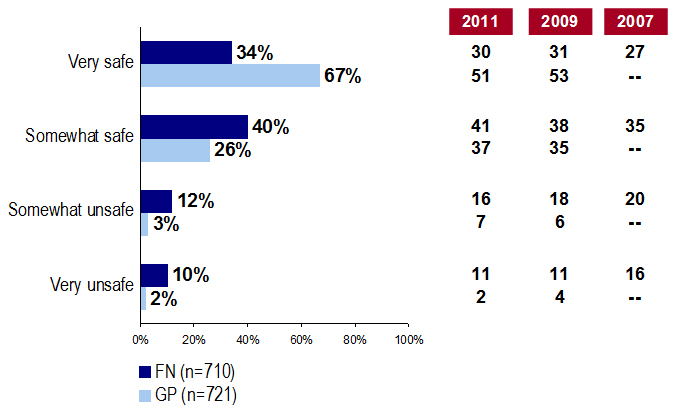
In terms of safety, results were somewhat more positive, whereby one-third of First Nations residents view the safety of their tap water supply as very safe (34 per cent) and four in ten (40 per cent) think it is somewhat safe. One-quarter of First Nations residents, however, feel that their water is either somewhat unsafe (12 per cent) or very unsafe (10 per cent). By comparison, considerably higher proportions of residents of other small communities in the general public perceive their tap water supply to be safe (93 per cent saying somewhat or very safe, compared with 74 per cent of residents in First Nations communities). Results are similar to 2011.
Again, while a comparison to the general public highlights a much greater problem in First Nations communities, results over time suggest some modest improvement over time, given that, in 2007 62 per cent said that their water was somewhat or very safe (contrasted against 74 per cent today) and 36 per cent said that it was unsafe (versus 22 per cent today).
Chart 4: Safety of Water
"How safe or unsafe do you think your tap water supply is? Is it...?"
Text description: Chart 4:
| 2018 FN (n=710) |
2018 GP (n=721) |
2011 FN | 2011 GP | 2009 FN | 2009 GP | 2007 FN | 2007 GP | |
|---|---|---|---|---|---|---|---|---|
| EKOS FN Syndicated - Wave 1, 2007 First Nations Water Quality, Apr. 2009, Feb. 2011, Jan. 2018 |
||||||||
| Very safe | 34% | 67% | 30% | 51% | 31% | 53% | 27% | nil |
| Somewhat safe | 40% | 26% | 41% | 37% | 38% | 35% | 35% | nil |
| Somewhat unsafe | 12% | 3% | 16% | 7% | 18% | 6% | 20% | nil |
| Very unsafe | 10% | 2% | 11% | 2% | 11% | 4% | 16% | nil |
Among First Nations residents, the region they are located in, their proximity to other communities, and the population size, along with whether they have had any Drinking Water Advisories (DWAs) (currently or in the past 12 months), each have linkages to perceptions of the quality and safety of water in their First Nations community.
First Nations community residents who feel their tap water supply is unsafe (somewhat or very) were asked why they believe this to be the case. The most commonly cited reason was the presence of pollutants (28 per cent). Other reasons include perceivable aspects of the water itself, such as appearance (17 per cent), the odour from the water (14 per cent), that their community has been under a DWA/BWA in the previous 12 months (14 per cent) and the taste of the water (12 per cent), as well as outdated/unsafe treatment procedures and facilities (11 per cent) and the presence of chemicals (10 per cent).
Results are similar to 2011, although outdated or unsafe treatment procedures or facilities were more prominent in 2011. A comparison against the responses of residents of other small communities reveals no statistically significant differences in terms of their reasons for perceiving tap water as unsafe, although the sample for other communities in the general public is very small for this question limiting the likelihood of differences.
Table 2: Reasons for Perceptions of Limited Safety
| Reasons | FN 2018 |
GP 2018 |
FN 2011 |
GP 2011 |
FN 2009 |
GP 2009 |
|---|---|---|---|---|---|---|
| Note: Results shown for 2% or higher in First Nation sample | ||||||
| n= | 151 | 40 | 189 | 69 | nil | nil |
| Presence of pollutants, mineral content | 28% | 22% | 31% | 26% | 25% | 16% |
| Appearance | 17% | 21% | 14% | 11% | 11% | 13% |
| Odour | 14% | 7% | 10% | 16% | 10% | 9% |
| My community is/has been under a drinking/boil water advisory | 14% | 9% | 12% | 9% | 12% | 23% |
| Taste | 12% | 14% | 12% | 10% | 14% | 6% |
| Outdated/unsafe treatment procedures/facilities, utilities | 11% | 10% | 21% | 7% | 13% | 17% |
| Presence of chemicals | 10% | 15% | 9% | 12% | 10% | 7% |
| I don't have any confidence in the people responsible for the water supply in my community | 6% | 4% | 5% | 3% | 5% | 3% |
| Illnesses, connected to/blamed on water | 5% | 0% | 7% | 3% | 8% | 0% |
| I have heard water in my community is unsafe2 | 4% | 8% | 2% | 4% | 5% | 6% |
| Unsafe/do not trust source of water | 4% | 10% | 18% | 22% | 11% | 19% |
| There is always talk of bad water quality these days in small communities | 4% | 3% | 2% | 0% | 2% | 8% |
| Other | 13% | 9% | 1% | 0% | 2% | 3% |
| Don’t know | 2% | 3% | 1% | 4% | 7% | 2% |
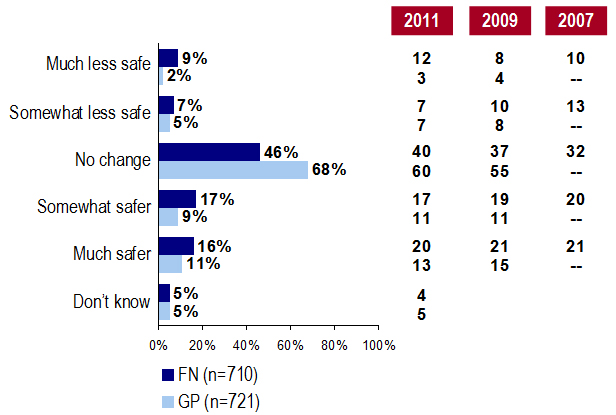
Respondents were also asked about their perception of any changes in water quality in the last five years and their perceived reasoning behind this decline/improvement. Just under half of First Nations residents believe that their water quality has remained the same over the past five years (46 per cent). One-third believes that their water is now safer than it was (17 per cent say somewhat safer, 16 per cent much safer). That said, one in six (16 per cent) judge their water to be less safe to drink than it was five years ago (seven per cent somewhat less safe, nine per cent much less safe). The general public, on the other hand, are more apt to say there has been no change in their water quality over the last five years (reported by 68 per cent), although seven per cent believe that their water has deteriorated over time. Results for First Nations communities have generally held since 2011, when results showed 19 per cent perceived their water supply to be less safe. Over the long term, more are saying that there has been no change one way or the other (46 per cent, compared with 32 per cent in 2007).
Chart 5: Perceived Change in Water Quality
"Would you consider your tap water to be more or less safe to drink than five years ago? Is it...?"
Text description: Chart 5
| 2018 FN (n=710) |
2018 GP (n=721) |
2011 FN | 2011 GP | 2009 FN | 2009 GP | 2007 FN | 2007 GP | |
|---|---|---|---|---|---|---|---|---|
| EKOS FN Syndicated - Wave 1, 2007 First Nations Water Quality, Apr. 2009, Feb. 2011, Jan. 2018 |
||||||||
| Much less safe | 9% | 2% | 12% | 3% | 8% | 4% | 10% | nil |
| Somewhat less safe | 7% | 5% | 7% | 7% | 10% | 8% | 13% | nil |
| No change | 46% | 68% | 40% | 60% | 37% | 55% | 32% | nil |
| Somewhat safer | 17% | 9% | 17% | 11% | 19% | 11% | 20% | nil |
| Much safer | 16% | 11% | 20% | 13% | 21% | 15% | 21% | nil |
| Don’t know | 5% | 5% | 4% | 5% | nil | nil | nil | nil |
First Nations respondents who reported their tap water quality to be less safe to drink than five years ago were asked about their reasons for this. The most commonly cited reasons include increased contamination (24 per cent), the deterioration of water treatment infrastructure (20 per cent), declining trust in drinking water treatment (12 per cent), and perceivable changes in the water itself such as appearance, smell, and taste (13 per cent). Increased contamination is the only result that is considerably higher in the general public.
Table 3: Reasons for Perceptions of Safety
| Reasons | FN 2018 |
GP 2018 |
FN 2011 |
GP 2011 |
FN 2009 |
GP 2009 |
|---|---|---|---|---|---|---|
| n= | 104 | 49 | 133 | 77 | nil | nil |
| Increased contamination | 24% | 46% | 37% | 46% | 37% | 53% |
| Water treatment/utilities infrastructure has worsened | 20% | 19% | 18% | 4% | 11% | 11% |
| Appearance, smell, taste has worsened | 13% | 15% | 16% | 23% | 14% | 9% |
| My trust in drinking water treatment has gone down | 12% | 9% | 8% | 6% | 10% | 5% |
| Distrust water source | 9% | 7% | 9% | 0% | 6% | 12% |
| Increase in boil water advisories | 7% | 3% | nil | nil | nil | nil |
| I have more information now about how water quality is tested/taken care of in my community | 6% | 3% | 4% | 1% | 4% | 2% |
| Population increase, general | 5% | 3% | 6% | 9% | 6% | 3% |
| I do not feel well enough informed on water testing procedures in my community | 3% | 3% | 2% | 0% | 4% | 1% |
| More/too much chlorine/chemicals in it | 3% | 1% | nil | nil | nil | nil |
| Illness connected to/blamed on water | 3% | 0% | 3% | 2% | 4% | nil |
| There is more talk/less talk in the media these days about poor water quality | 2% | 0% | 3% | 1% | nil | nil |
| I get less information about drinking water quality in my community than I used to | 2% | 0% | 2% | 0% | 4% | 1% |
| Water has changed/water quality worsened, general | 2% | 0% | 8% | 7% | 5% | nil |
| Someone told me that the tap water in the community is poor3 | 1% | 2% | 1% | 2% | 5% | 8% |
| Other | 1% | 0% | 1% | 3% | 3% | 4% |
| Don’t know | 5% | 0% | 3% | 3% | 4% | 3% |
First Nations respondents who felt their tap water quality to be safer to drink than five years ago were asked about their reasons for this perceived increase in water quality. Roughly half (47 per cent) said that there is more focus these days on the need for good water quality. Slightly fewer said that their trust level in drinking water treatment has increased (43 per cent), and that they feel better informed about water testing procedures (43 per cent). One-third noted that they have received more information about drinking water quality (32 per cent) or that someone had told them that the tap water (in their First Nation community) is good (31 per cent). One in five (19 per cent) pointed to improvements in filtration, treatment procedures, and infrastructure. A handful of residents of First Nations communities cited a change in primary water source; increased testing, monitoring, regulation; and improved appearance, taste, and odour as reasons behind their perceived increase in water quality.
There are several significant differences between the reasons provided for increasing water quality among the First Nations residents and those of the general public (living in a similarly small community). First Nations respondents were more apt to report that there is more of a focus these days on the need for good water, that they feel better informed about water testing procedures, that their trust in drinking water treatment has increased, and that someone told them it is good. On the other hand, compared with 2011 most of these are less often reported today than they were seven years ago.
Table 4: Reasons for Perception of Increasing Safety
| Reasons | FN 2018 |
GP 2018 |
FN 2011 |
GP 2011 |
FN 2009 |
GP 2009 |
|---|---|---|---|---|---|---|
| Note: Results shown for 2% or higher in First Nation sample | ||||||
| n= | 246 | 142 | 265 | 172 | nil | nil |
| There is more focus these days on the need for good water quality | 47% | 38% | 60% | 50% | 34% | 30% |
| My trust level in drinking water treatment has increased | 43% | 36% | 52% | 37% | 32% | 28% |
| I feel better informed about water testing procedures | 43% | 29% | 49% | 32% | 29% | 23% |
| I receive more information about drinking water quality in my community than I used to | 32% | 27% | 34% | 30% | 22% | 21% |
| Someone told me that the tap water in my community is good | 31% | 17% | 35% | 27% | 28% | 17% |
| Improved/updated filtration/treatment procedures/infrastructures | 19% | 26% | 25% | 33% | 30% | 44% |
| Increased testing, monitoring, regulation | 5% | 2% | 8% | 10% | 6% | 10% |
| Changes to water source | 3% | 10% | 5% | 5% | 5% | 11% |
| Improved appearance, taste, odour | 3% | 3% | 2% | 8% | 3% | 4% |
| Fewer boil water advisories | 2% | 1% | nil | nil | nil | nil |
| Other | 9% | 3% | 0% | 2% | 4% | 4% |
Respondents were asked what would make them feel safer about their tap water quality. At the top of the list among First Nations respondents was water filtration/ treatment and/or utilities infrastructure, cited by one in five (19 per cent), followed by more frequent water quality testing (11 per cent) and better procedures for water quality testing (8 per cent). A handful of others mentioned fewer chemicals in the water, providing more information on water quality, improving the smell and appearance of the water, and reducing the amount of contaminants. It should be noted that one in five First Nations respondents (22 per cent) said that nothing was required as they already feel that their water is safe. In comparison, half of other small community residents (51 per cent) also said that no further reassurance was required.
The general public place somewhat less emphasis on water filtration and infrastructure. Compared with 19 per cent of First Nations indicating improved water filtration as a source of comfort, only 11 per cent of the general public said the same.
Table 5: Additional Actions Needed
| Factors | FN 2018 |
GP 2018 |
FN 2011 |
GP 2011 |
FN 2009 |
GP 2009 |
|---|---|---|---|---|---|---|
| Note: Results shown for 2% or higher in First Nation sample | ||||||
| n= | 710 | 721 | 696 | 702 | nil | nil |
| Water filtration/treatment, utilities infrastructure (e.g., new, improved/updated) | 19% | 11% | 23% | 12% | 23% | 13% |
| More frequent water quality testing | 11% | 7% | 15% | 14% | 15% | 11% |
| Better procedures for water quality testing | 8% | 3% | 6% | 5% | 7% | 3% |
| Fewer chemicals in the water | 6% | 4% | 8% | 4% | 5% | 6% |
| Better smell/appearance of the water | 4% | 3% | 5% | 5% | 5% | 2% |
| More information available on water quality | 4% | 3% | 5% | 2% | 4% | 3% |
| Fewer contaminants/minerals in water | 4% | 4% | 6% | 6% | 4% | 5% |
| Better information available on water quality | 3% | 1% | 4% | 3% | 2% | 1% |
| Different water source (e.g., relocated) | 3% | 3% | 4% | 5% | 4% | 2% |
| Fewer/no boil water advisories | 3% | 2% | nil | nil | nil | nil |
| Transparency/information on testing/treatment | 2% | 1% | 4% | 2% | 2% | 3% |
| Other | 7% | 1% | nil | nil | nil | nil |
| Nothing/already feel water is safe, don't need anything else | 22% | 49% | 17% | 36% | 33% | 48% |
| Don’t know/no response | 21% | 13% | 17% | 14% | 8% | 4% |
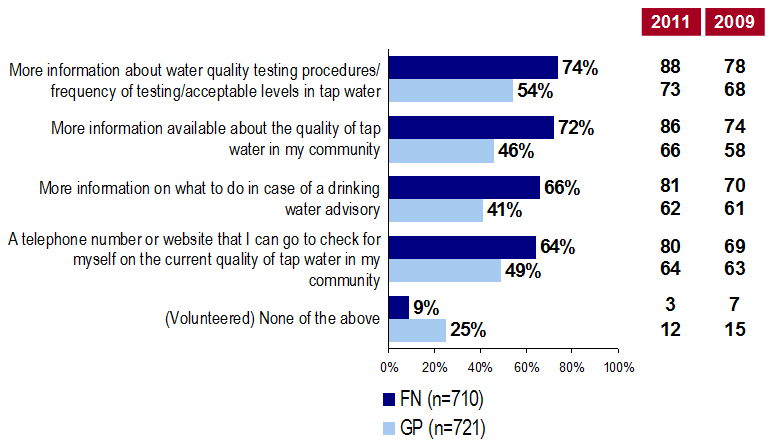
Respondents were then asked about the types of information that would help to reassure them about their tap water quality. Seven in ten First Nations residents feel that more information about water quality testing procedures/frequency of testing or the acceptable levels in tap water (74 per cent), or more information about the quality of tap water in their community (72 per cent) would make them feel safer. Two-thirds of First Nations community residents also wish to know more about what to do in case of a DWA (66 per cent), as well as be provided with a telephone number or website they could access to check on the current quality of their community’s tap water (64 per cent). Compared to residents of other small communities in the general public, there is a higher demand among First Nations communities residents for more information in all areas surveyed.
Tracking data, however, reveals that demand for each of these options has fallen somewhat in First Nations communities since 2011 and is now on par with or slightly below 2009 levels.
Chart 6: Perceived Requirements for Reassurance (Prompted)
"Which of the following would make you feel safer about your tap water qualtiy?" [Prompted list]
Text description: Chart 6
| 2018 FN (n=710) |
2018 GP (n=721) |
2011 FN |
2011 GP |
2009 FN |
2009 GP |
|
|---|---|---|---|---|---|---|
| First Nations Water Quality, Apr. 2009, Feb. 2011, Jan. 2018 | ||||||
| More information about water quality testing procedures/ frequency of testing/acceptable levels in tap water | 74% | 54% | 88% | 73% | 78% | 68% |
| More information available about the quality of tap water in my community | 72% | 46% | 86% | 66% | 74% | 58% |
| More information on what to do in case of a drinking water advisory | 66% | 41% | 81% | 62% | 70% | 61% |
| A telephone number or website that I can go to check for myself on the current quality of tap water in my community | 64% | 49% | 80% | 64% | 69% | 63% |
| (Volunteered) None of the above | 9% | 25% | 3% | 12% | 7% | 15% |
Respondents were also asked if there was any additional actions that they feel would increase their perception of the safety of tap water. Half of First Nations respondents (49 per cent) could not identify any specific actions that would make them feel safer, which is even more the case with other respondents in the general public (72 per cent). Among those who could, the top responses were water filtration and treatment, more frequent water quality testing, and more information on water quality. These results are consistent with those found in other small communities.
Table 6: Specific Actions Requested
| FN | GP | |
|---|---|---|
| n= | 710 | 721 |
| Water filtration/treatment, utilities infrastructure | 7% | 2% |
| More frequent water quality testing | 6% | 3% |
| More information available on water quality | 4% | 2% |
| Transparency/information on testing/treatment | 3% | 1% |
| Less contaminants/minerals in water | 2% | 1% |
| Different water source | 2% | 1% |
| Personal testing resources available, affordable testing procedures, cost covered | 2% | 2% |
| Stricter/more enforcement of industrial waste and development, government funding and intervention to develop better water access to all more legislation around fracking and development zones | 2% | 1% |
| Other | 6% | 0% |
| Nothing would increase perception of safety | 49% | 72% |
| Don't know | 12% | 9% |
The current chapter explores uses of tap water and frequency of using bottled or filtered water are also captured. Patterns of use are also profiled as well as a comparison to 2011 findings.
The most common uses of tap water, for over four in five First Nations residents, are for brushing teeth (87 per cent), washing food (86 per cent), and cooking (84 per cent). All results are slightly lower than reported in 2011 which found that 90, 89, and 87 per cent of respondents used tap water for these applications, respectively. Roughly seven in ten use tap water in coffee or tea (77 per cent) or food preparation (71 per cent). Just under seven in ten use tap water for drinking (69 per cent, up slightly from 66 reported in 2011).
First Nations residents are less likely to use tap water across all applications compared with residents of other small communities. Nearly all general population residents use tap water for brushing teeth (97 per cent)], washing food (97 per cent), or cooking (95 per cent). About nine in ten use tap water for coffee or tea (89 per cent) or food preparation (87 per cent). Eighty-two per cent of the general population in small communities use tap water for drinking.
Chart 7: Usage of Tap Water
Do you use your tap water for any of the following...?
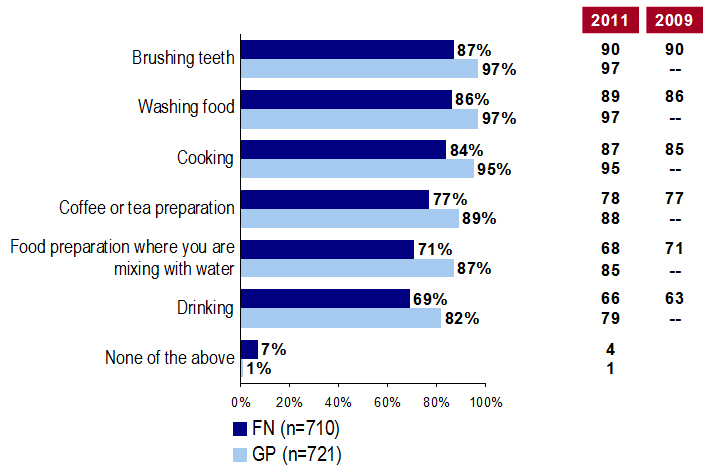
Text description: Chart 7
| 2018 FN (n=710) |
2018 GP (n=721) |
2011 FN |
2011 GP |
2009 FN |
2009 GP |
|
|---|---|---|---|---|---|---|
| First Nations Water Quality, Apr. 2009, Feb. 2011, Jan. 2018 | ||||||
| Brushing teeth | 87% | 97% | 90% | 97% | 90% | nil |
| Washing food | 86% | 97% | 89% | 97% | 86% | nil |
| Cooking | 84% | 95% | 87% | 95% | 85% | nil |
| Coffee or tea preparation | 77% | 89% | 78% | 88% | 77% | nil |
| Food preparation where you are mixing with water | 71% | 87% | 68% | 85% | 71% | nil |
| Drinking | 69% | 82% | 66% | 79% | 63% | nil |
| None of the above | 7% | 1% | 4% | 1% | nil | nil |
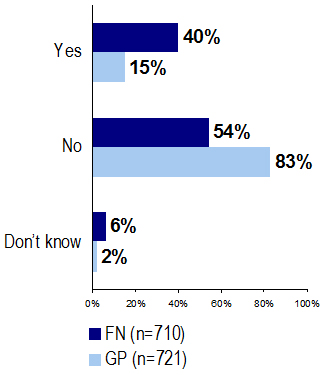
When asked whether they ever used bottled water for anything in their household, First Nations community residents (68 per cent) are more likely than residents of other small communities in the general public (40 per cent) to respond that they do.
Chart 8: Use of Bottled Water
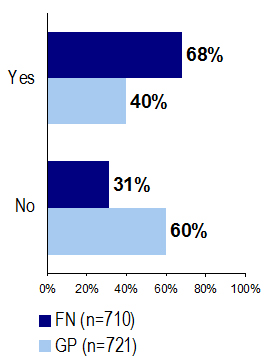
Text description: Chart 8
| 2018 FN (n=710) |
2018 GP (n=721) |
|
|---|---|---|
| First Nations Water Quality, Jan. 2018 | ||
| Yes | 68% | 40% |
| No | 31% | 60% |
First Nations residents are more likely than other residents of small communities to use bottled water for all applications. Most First Nations residents use bottled water for drinking (90 per cent). After this application, usage drops dramatically with half or less using bottled water for making coffee or tea (50 per cent), food preparation (45 per cent, or cooking 44 per cent). Just less than one-third use bottled water for washing food (32 per cent) or brushing teeth (31 per cent). Although results are comparatively similar in terms of bottled water use for drinking, it is considerably higher in First Nations communities than it is in other communities in the general public for all other applications.
Chart 9: Uses for Bottled Water
Do you use your bottled water for any of the following...?
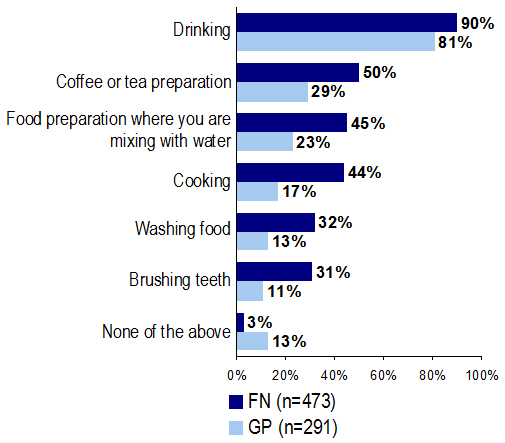
Text description: Chart 9
| Purpose | 2018 FN (n=473) | 2018 GP (n=291) |
|---|---|---|
| First Nations Water Quality, Jan. 2018 | ||
| Drinking | 90% | 81% |
| Coffee or tea preparation | 50% | 29% |
| Food preparation where you are mixing with water | 45% | 23% |
| Cooking | 44% | 17% |
| Washing food | 32% | 13% |
| Brushing teeth | 31% | 11% |
| None of the above | 3% | 13% |
First Nations community residents provide a variety of reasons for using bottled instead of tap water. Nearly three in ten said that they do not trust their tap water (30 per cent, up from 18 per cent in 2011). One in five indicated they prefer the taste or smell of bottled water (19 per cent, similar to 2011 results of 20 per cent) or because it is more convenient (19 per cent, up from 10 per cent in 2011). One in ten perceive that bottled water is supposed to be better for them (13 per cent, compared to 7 per cent in 2011), choose bottled water because of the lack of contaminants and mineral content (10 per cent compared to 13 per cent in 2011), or because of DWAs (9 per cent compared to 8 per cent in 2011). A scattering of other reasons for using bottled water were also provided by residents of First Nations communities, including the appearance of tap water, the safety of children, preference, medical reasons, a greater supply of bottled water, or it’s a better image to drink bottled water.
Compared with others in small communities, First Nations residents were more likely to say that they do not trust their tap water. The general public in small communities are more apt to use bottle water because of convenience or that they prefer the taste or smell of bottled water.
Table 7: Reasons for Use of Bottle Water
| Reasons | FN 2018 |
GP 2018 |
FN 2011 |
GP 2011 |
FN 2009 |
GP 2009 |
|---|---|---|---|---|---|---|
| Note: Results shown for 2% or higher in First Nation sample | ||||||
| n= | 452 | 258 | 463 | 266 | nil | nil |
| Don't trust my tap water | 30% | 17% | 18% | 15% | 22% | 15% |
| I prefer the taste/smell of bottled water | 19% | 26% | 20% | 33% | 20% | 26% |
| Because it is more convenient/easier | 19% | 32% | 10% | 21% | 19% | 31% |
| Bottled water is supposed to be better for you | 13% | 6% | 7% | 4% | 23% | 13% |
| Presence of contaminants, mineral content, better filtration | 10% | 10% | 13% | 11% | 8% | 4% |
| My community is currently/has been under Drinking Water Advisories in the past | 9% | 3% | 8% | 6% | 6% | 7% |
| Only use bottled water when advisory is in effect | 5% | 4% | nil | nil | nil | nil |
| Appearance | 4% | 3% | 5% | 1% | 5% | 3% |
| For children/baby formula | 3% | 1% | nil | nil | nil | nil |
| Prefer it generally, habit | 4% | 3% | 2% | 2% | 3% | 2% |
| Experienced illness/symptoms, medical reasons/purposes | 2% | 1% | 3% | 3% | nil | nil |
| I have a greater supply with bottled water than tap water | 2% | 1% | nil | nil | nil | nil |
| Other | 3% | 3% | 3% | 4% | nil | nil |
| Don’t know | 5% | 3% | 6% | 3% | 7% | 2% |
The following chapter explores the incidence and frequency of DWAs in respondent communities, as well as conditions of the advisories.
Four in ten First Nations community residents (40 per cent) indicated that they have been or are currently under a Drinking or Boil Water Advisory within the previous 12 months. This is compared with 15 per cent of residents in other small communities in the general public. One in ten First Nations community residents reported that they are currently under a DWA (8 per cent) or that they experienced one within the past few weeks (10 per cent). Four in ten (42 per cent) experienced their most recent advisory months ago, and one in five (20 per cent) recall that the last DWA took place roughly a year ago. In comparison, in terms of when the last DWA/BWA was experienced by the general public, this is rather similar to that which was experienced by those living in First Nations communities, although those within the general public were more likely to have experienced a DWA/BWA within the last several months.
Chart 10: Drinking Water Advisories
Has your community been or are you currently under a Drinking or Boil Water Advisory, in the last 12 months as far as you know?
Text Description: Chart 10
| 2018 FN (n=710) |
2018 GP (n=721) |
|
|---|---|---|
| First Nations Water Quality, Jan. 2018 | ||
| Yes | 40% | 15% |
| No | 54% | 83% |
| Don’t know | 6% | 2% |
Chart 11: Last Drinking Water Advisories
When was the last Drinking or Boil Water Advisory issued in your community?
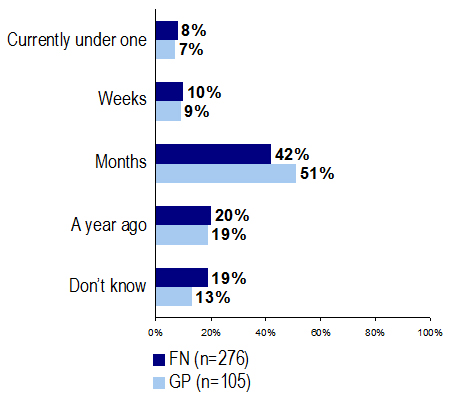
Text Description: Chart 11
| 2018 FN (n=276) |
2018 GP (n=105) |
|
|---|---|---|
| First Nations Water Quality, Jan. 2018 | ||
| Currently under one | 8% | 7% |
| Weeks | 10% | 9% |
| Months | 42% | 51% |
| A year ago | 20% | 19% |
| Don’t know | 19% | 13% |
First Nations community residents who have not experienced a DWA/BWA within the last past few years provide a more positive rating of the quality and safety of their tap water supply compared to First Nations people who have been under a drinking water advisory within this timeframe. While about six in ten of those who have not experienced a DWA/BWA (61 per cent) rate their drinking water quality as good, just one-third of First Nations community residents who have experienced a DWA/BWA (33 per cent) feel the same. Similarly, about eight in ten First Nations community residents who have not experienced a DWA/BWA (83 per cent) perceive their tap water supply as somewhat or very safe, while only six in ten First Nations community residents (60 per cent) who have experienced an advisory within the last twelve months view their tap water supply this way.
Chart 12: Water Quality: Replicated
How would you rate the quality of drinking water in your community?
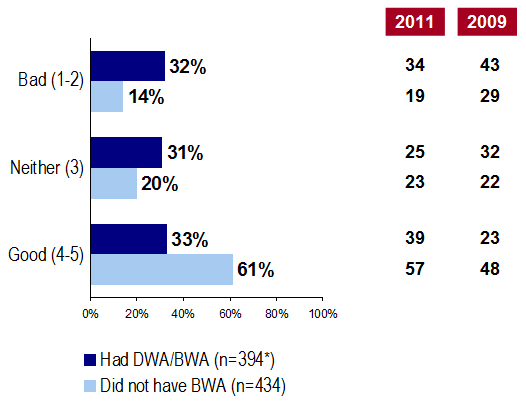
Text description: Chart 12
| Had DWA/BWA (n=394*) |
Did not have BWA (n=434) |
2011 FN |
2011 GP |
2009 FN |
2009 GP |
|
|---|---|---|---|---|---|---|
| * Includes 276 from core sample plus 118 oversampleFirst Nations Water Quality, Apr. 2009, Feb. 2011, Jan. 2018 | ||||||
| Bad (1-2) | 32% | 14% | 34% | 19% | 43% | 29% |
| Neither (3) | 31% | 20% | 25% | 23% | 32% | 22% |
| Good (4-5) | 33% | 61% | 39% | 57% | 23% | 48% |
Chart 13: Safety of Water: Replicated
How safe or unsafe do you think your tap water supply is? Is it…?
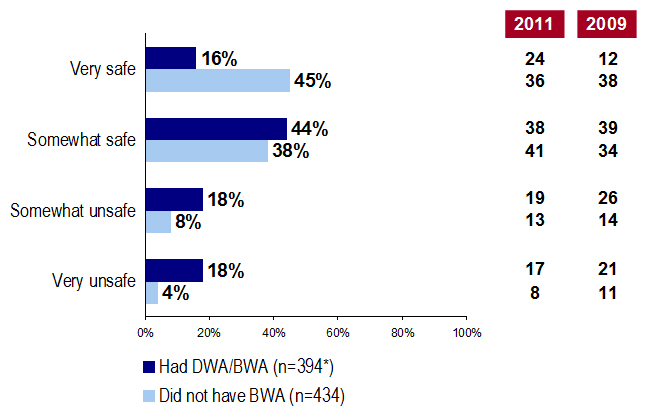
Text description: Chart 13
| Had DWA/BWA (n=394*) |
Did not have BWA (n=434) |
2011 FN |
2011 GP |
2009 FN |
2009 GP |
|
|---|---|---|---|---|---|---|
| * Includes 276 from core sample plus 118 oversampleFirst Nations Water Quality, Apr. 2009, Feb. 2011, Jan. 2018 | ||||||
| Very safe | 16% | 45% | 24% | 36% | 12% | 38% |
| Somewhat safe | 44% | 38% | 38% | 41% | 39% | 34% |
| Somewhat unsafe | 18% | 8% | 19% | 13% | 26% | 14% |
| Very unsafe | 18% | 4% | 17% | 8% | 21% | 11% |
First Nations residents were asked to estimate, to the best of their ability, the length of time that their last DWA/BWA lasted. The majority of these advisories were less than two weeks in duration (two weeks or less). Six in ten First Nations community residents indicated that their most recent DWA/BWA lasted either less than one week (36 per cent) or one to two weeks (23 per cent) in total. One-third (33 per cent) said that their DWA/BWA lasted longer than two weeks.
Drinking or Boil Water Advisories were shorter in duration among general population Canadians in small communities. Three-quarters (74 per cent) indicated that their most recent DWA/BWA lasted two weeks or less (compared with 59 per cent in the First Nations). Notably, more than four in ten (44 per cent) indicated that their Advisory lasted less than one week (compared to 36 per cent in First Nations communities). First Nations residents are also more likely to have experienced protracted DWA/BWAs that lasted four months or more (16 per cent of First Nations, compared to six per cent of the general public).
Chart 14: Length of Drinking or Boil Water Advisory
Thinking about the last time your community was under a Drinking or Boil Water Advisory, how long did it last (from what you remember)? Did it last…?
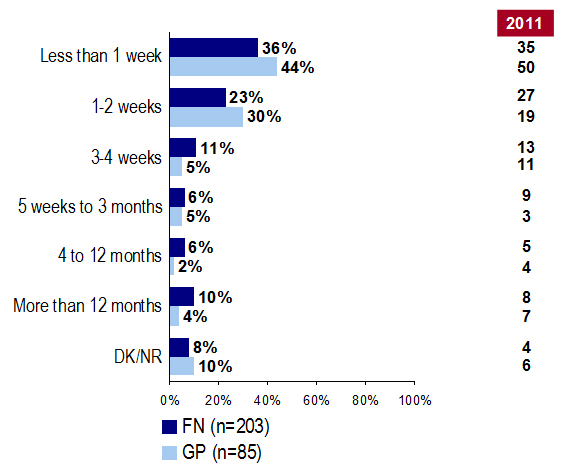
Text Description: Chart 14
| 2018 FN (n=203) |
2018 GP (n=85) |
2011 FN |
2011 GP |
|
|---|---|---|---|---|
| First Nations Water Quality, Feb. 2011, Jan. 2018 | ||||
| Less than 1 week | 36% | 44% | 35% | 50% |
| 1-2 weeks | 23% | 30% | 27% | 19% |
| 3-4 weeks | 11% | 5% | 13% | 11% |
| 5 weeks to 3 months | 6% | 5% | 9% | 3% |
| 4 to 12 months | 6% | 2% | 5% | 4% |
| More than 12 months | 10% | 4% | 8% | 7% |
| DK/NR | 8% | 10% | 4% | 6% |
Among First Nations residents who have been under a DWA/BWA, most have experienced multiple advisories in the past five years. Just one in ten (11 per cent) report that their community has been under a single advisory, while one-third (33 per cent) have seen between two and five advisories. Approximately one in ten have been under six to ten advisories (10 per cent) or 11 advisories or more (seven per cent). These figures are comparable to those seen in other small communities.
Chart 15: Frequency of Drinking or Boil Water Advisory
How many times in the last five years has your community been under a Drinking Water Advisory?
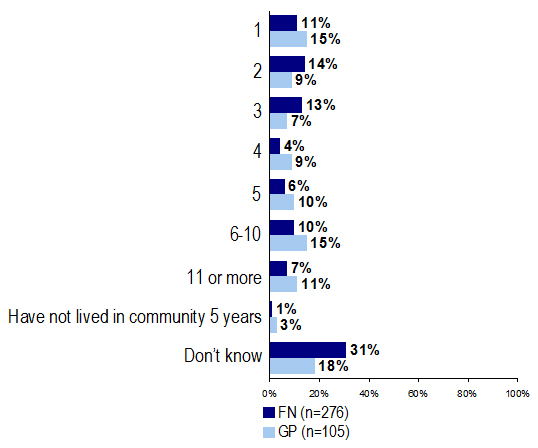
Text Description: Chart 15
| 2018 FN (n=276) |
2018 GP (n=105) |
|
|---|---|---|
| First Nations Water Quality, Jan. 2018 | ||
| 1 | 11% | 15% |
| 2 | 14% | 9% |
| 3 | 13% | 7% |
| 4 | 4% | 9% |
| 5 | 6% | 10% |
| 6-10 | 10% | 15% |
| 11 or more | 7% | 11% |
| Have not lived in community 5 years | 1% | 3% |
| Don’t know | 31% | 18% |
First Nations community residents were asked where they turned for water when under a DWA. About four in ten (43 per cent) said they would use bottled water for all purposes, while one in six (16 per cent) would use a combination of bottled and boiled water. One-quarter (24 per cent) relied exclusively on boiled water. Residents of other small communities are less likely to rely entirely on bottle water (27 per cent) and more likely to use only boiled water (35 per cent) or some combination of the two (23 per cent).
Chart 16: Alternate Sources Under DWA
What are you doing/did you do differently in your household while you are under the Drinking or Boil Water Advisory?
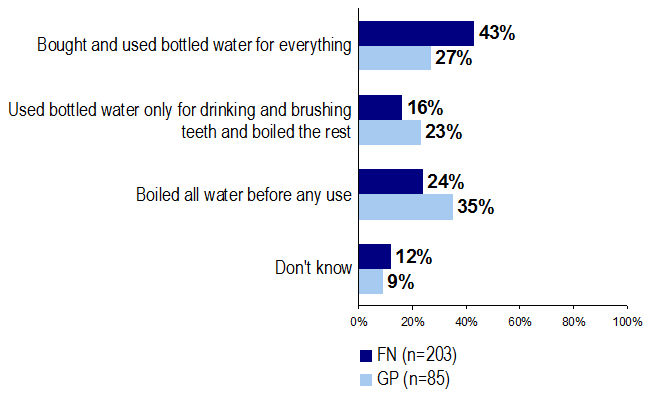
Text Description: Chart 16
| 2018 FN (n=203) |
2018 GP (n=85) |
|
|---|---|---|
| First Nations Water Quality, Jan. 2018 | ||
| Bought and used bottled water for everything | 43% | 27% |
| Used bottled water only for drinking and brushing teeth and boiled the rest | 16% | 23% |
| Boiled all water before any use | 24% | 35% |
| Don't know | 12% | 9% |
Among First Nations residents who have experienced a DWA/BWA, the most often used sources of information about what to do while under an advisory include local councils (29 per cent), the radio (24 per cent), and the Internet (17 per cent). Roughly one in ten turn to Health Canada (14 per cent), word of mouth (10 per cent), and local signage (10 per cent). Other recurring sources include local newspapers (five per cent), television (five per cent), flyers and pamphlets (four per cent), medical clinics (four per cent), and social media (three per cent). Resident of other small communities are comparatively more likely to seek information from their local council (50 per cent) or flyers and pamphlets (20 per cent), while they are less likely to rely on the radio (13 per cent).
Table 8: Communications of Drinking Water Advisories
| Sources | FN | GP |
|---|---|---|
| n= | 203 | 85 |
| Community/Band/Township council | 29% | 50% |
| Radio | 24% | 13% |
| Internet | 17% | 23% |
| Word of Mouth (family or friends) | 10% | 9% |
| Health Canada (specifically) | 14% | 2% |
| Posters/signs around the area, in different places around town | 10% | 7% |
| Local newspaper | 5% | 5% |
| Television | 5% | 3% |
| In the mail, pamphlet/flyer through the mail | 4% | 20% |
| Nurses station/clinic | 4% | 1% |
| Government of Canada | 1% | 3% |
| Social media | 3% | 0% |
| Other | 13% | 2% |
| Do not recall/don’t know/no response | 10% | 10% |
First Nations residents were also asked if there was any additional information they would like to receive during a DWA/BWA to which respondents offered a broad array of suggestions. One in five (18 per cent) would like more information as to the reasons behind the advisory. About one in ten would like to be notified when the advisory ends (13 per cent) and would like to know more about the specific measures taken to fix the problem (10 per cent). Other common responses include lab test results (7 per cent), more frequent updates (seven per cent), and details on how to deal with the advisory (five per cent). These figures are generally consistent with those seen in other small communities.
Table 9: Topics of Interest Regarding DWAs
| Topics | FN | GP |
|---|---|---|
| n= | 203 | 85 |
| Reasons why/what happened for there to be a warning | 18% | 15% |
| End dates, informed/provided notice when it finishes | 13% | 16% |
| Measures taken to fix the problem, risk of reoccurrence addressed, how they plan to fix the issue/improve the system to avoid further concerns | 10% | 2% |
| Test results, specifics on bacteria/details on contamination and quantities | 7% | 2% |
| More frequent notices/updates, more sources of notice for more people reached, follow up/telephone number to call for information | 7% | 5% |
| Details on what/how to deal with advisory | 5% | 1% |
| General health/safety of the water, quality of drinking water | 3% | 1% |
| More timely notices, sooner/ASAP | 2% | 5% |
| Effects on health, long term/short term, effects on those more susceptible/ vulnerable | 3% | 1% |
| Don't know/no response | 31% | 51% |
Among those who are or have been under a DWA in the previous 12 months, nearly half of First Nations residents (46 per cent) reported that they recall hearing a public service announcement about a DWA/BWA on the radio, a 12-point increase over 2011 (34 per cent). Of those who had heard this announcement, four in ten (38 per cent) recalled being told to boil water before consuming it, 13 per cent recalled a water advisory generally, and one in ten recalled that the cause of the water problem/advisory was reported (11 per cent). Of those who heard the radio announcement, the vast majority (86 per cent) found the announcement useful and a similar proportion (90 per cent) said they used the information from the announcement in making decisions about what to do under the advisory. Residents of other small communities who are currently or have been under a DWA in the previous 12 months were less likely to recall a radio announcement (24 per cent, compared to 46 per cent of First Nations).
Chart 17: Awareness of Public Service Announcement on DWA
Have you heard a public service announcement on the radio regarding Drinking Water Advisories in your community?
Text Description: Chart 17
| 2018 FN (n=203) | 2018 GP (n=85) | 2011 FN |
2011 GP |
2009 FN |
2009 GP |
|
|---|---|---|---|---|---|---|
| First Nations Water Quality, Apr. 2009, Feb. 2011, Jan. 2018 | ||||||
| Yes | 46% | 24% | 34% | nil | 45% | nil |
| No | 52% | 73% | 66% | nil | 55% | nil |
| Don’t know | 2% | 3% | nil | nil | nil | nil |
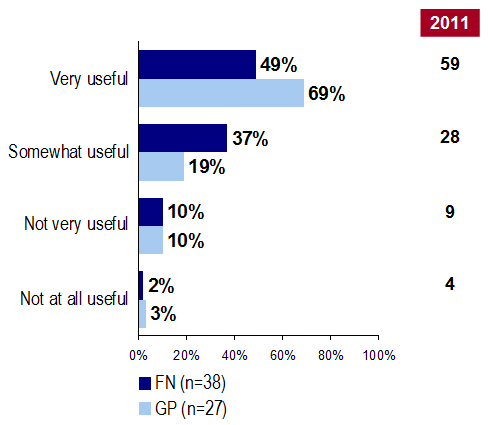
Chart 18: Usefulness of Announcement on DWA
[IF YES] Did you find this announcement useful?
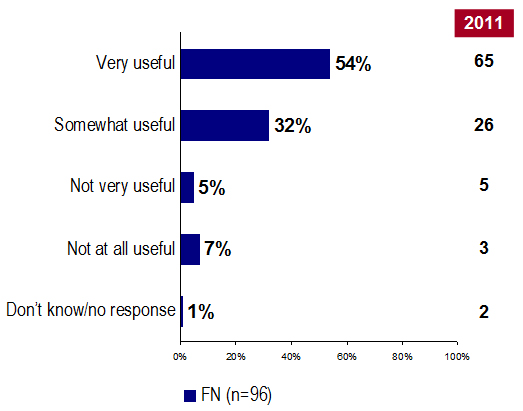
Text description: Chart 18
| 2018 FN (n=96) | 2011 FN |
|
|---|---|---|
| First Nations Water Quality, Feb. 2011, Jan. 2018 | ||
| Very useful | 54% | 65% |
| Somewhat useful | 32% | 26% |
| Not very useful | 5% | 5% |
| Not at all useful | 7% | 3% |
| Don’t know/no response | 1% | 2% |
Chart 19: Usefulness of Information Under DWA
Did you use the information from this announcement in making decisions about what to do while under the Drinking or Boil Water Advisory in your household?
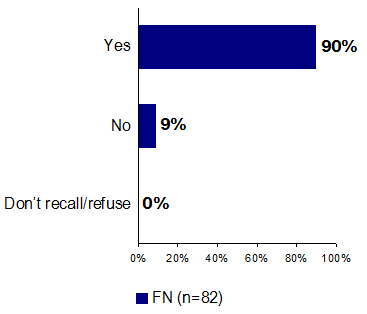
Text Description: Chart 19
| 2018 FN (n=82) |
|
| First Nations Water Quality, Jan. 2018 | |
| Yes | 90% |
| No | 9% |
| Don’t recall/refuse | 0% |
Table 10: Specific Details Recalled
| Details | FN | GP |
|---|---|---|
| n= | 96 | 18 |
| Cannot provide details | 23% | 23% |
| Boil water before consumption | 38% | 54% |
| Water advisory, generally | 13% | 17% |
| Cause of water problem/advisory | 11% | 10% |
| Exercise caution with water consumption | 3% | 3% |
| Response to problem/measures taken | 3% | 3% |
| Other | 16% | 0% |
| Don't know | 4% | 0% |
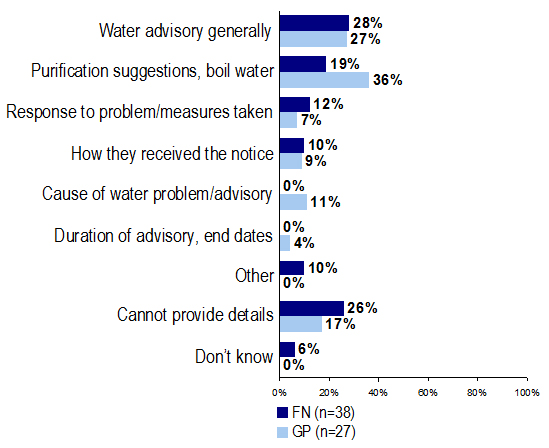
One in five First Nations respondents who are or have been under a DWA in the previous 12 months (19 per cent) reported that they have seen a door hanger addressing DWA/BWAs in their First Nations community, a 10-point decrease from 2011. The vast majority of those who recall the door hanger (86 per cent) found the information on the door hanger to be useful in the advisory. The most commonly recalled elements of the door hanger notifications include general mentions of the water advisory (28 per cent) and specific purification suggestions (19 per cent).
Residents of other small communities who are or have been under a DWA in the previous 12 months are somewhat more likely to recall a door hanger notification (28 per cent, compared to 19 per cent of First Nations respondents). Because of the small number of respondents who recall a door hanger notification, no meaningful comparison can be made between general population and First Nations respondents in terms of perceived usefulness and recalled details.
Chart 20: Awareness of a Door Hanger on DWA
Have you seen a door hanger addressing Drinking Water Advisories in your community?
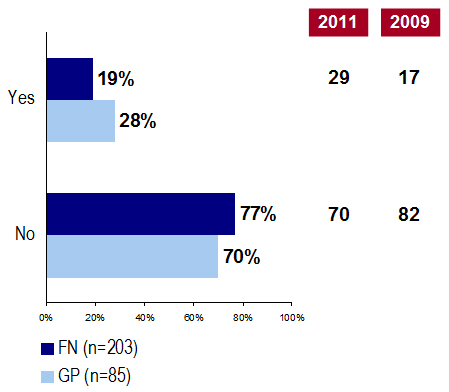
Text description: Chart 20
| 2018 FN (n=203) | 2018 GP (n=85) | 2011 FN | 2009 FN | |
|---|---|---|---|---|
| First Nations Water Quality, Apr. 2009, Feb. 2011, Jan. 2018 | ||||
| Yes | 19% | 28% | 29% | 17% |
| No | 77% | 70% | 70% | 82% |
Chart 21: Usefulness of A Door Hanger on DWA
[IF YES] Did you find this useful?
Text Description: Chart 21
| 2018 FN (n=38) | 2018 GP (n=27) | 2011 FN |
|
|---|---|---|---|
| First Nations Water Quality, Feb. 2011, Jan. 2018 | |||
| Very useful | 49% | 69% | 59% |
| Somewhat useful | 37% | 19% | 28% |
| Not very useful | 10% | 10% | 9% |
| Not at all useful | 2% | 3% | 4% |
Chart 22: Recalled Details of PSA
Can you provide additional details about what you might have seen (in PSA)?
Text description: Chart 22
| 2018 FN (n=38) |
2018 GP (n=27) |
|
|---|---|---|
| First Nations Water Quality, Jan. 2018 | ||
| Water advisory generally | 28% | 27% |
| Purification suggestions, boil water | 19% | 36% |
| Response to problem/measures taken | 12% | 7% |
| How they received the notice | 10% | 9% |
| Cause of water problem/advisory | 0% | 11% |
| Duration of advisory, end dates | 0% | 4% |
| Other | 10% | 0% |
| Cannot provide details | 26% | 17% |
| Don’t know | 6% | 0% |
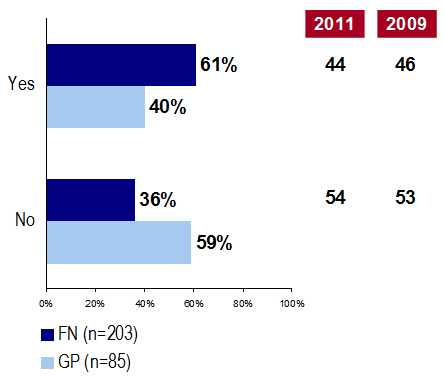
Six in ten First Nations residents who are or have been under a DWA in the previous 12 months (61 per cent) indicated that they have seen a poster discussing DWA/BWAs, a 17-point increase over 2011. Of those First Nations respondents who have seen the poster, just over eight in ten (84 per cent) found it to be useful. Details recalled from the poster include exercising caution by boiling water (26 per cent), the water advisory generally (13 per cent), dates and times associated with the advisory (8 per cent), and causes of the problem (six per cent).
Residents of other small communities who are or have been under a DWA in the previous 12 months are less likely to recall a poster (40 per cent, compared to 61 per cent of First Nations respondents). Again, due to the small sample sizes, no meaningful comparisons can be made between these two groups in terms of perceived usefulness and specific details recalled.
Chart 23: Awareness of a Poster Discussing DWA
Have you seen a poster discussing Drinking Water Advisories in your community?
Text description: Chart 23
| 2018 FN (n=203) | 2018 GP (n=85) | 2011 FN | 2009 FN | |
|---|---|---|---|---|
| First Nations Water Quality, Apr. 2009, Feb. 2011, Jan. 2018 | ||||
| Yes | 61% | 40% | 44% | 46% |
| No | 36% | 59% | 54% | 53% |
Chart 24: Usefulness of a Poster Discussing DWA
[IF YES] Did you find this poster useful?
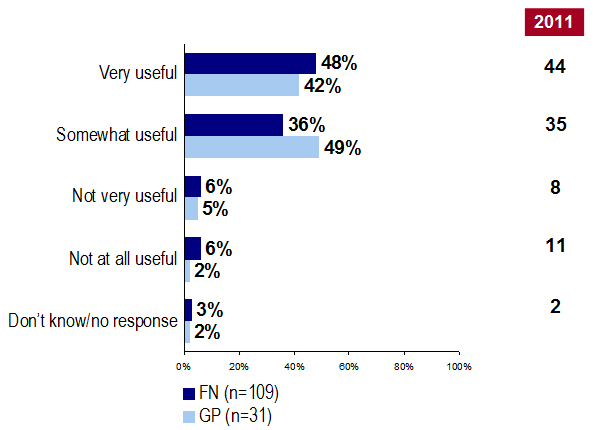
Text description: Chart 24
| 2018 FN (n=109) | 2018 GP (n=31) | 2011 FN | |
|---|---|---|---|
| First Nations Water Quality, Feb. 211, Jan. 2018 | |||
| Very useful | 48% | 42% | 44% |
| Somewhat useful | 36% | 49% | 35% |
| Not very useful | 6% | 5% | 8% |
| Not at all useful | 6% | 2% | 11% |
| Don’t know/no response | 3% | 2% | 2% |
Table 11: Specific Details Recalled
| What have been seen | FN | GP |
|---|---|---|
| n= | 109 | 31 |
| Cannot provide details | 20% | 17% |
| Exercise caution with water consumption, boil water | 26% | 42% |
| Water advisory generally | 13% | 24% |
| Dates/times associated with advisory | 8% | 2% |
| Cause of water problem/advisory | 6% | 7% |
| Other | 37% | 16% |
| Don't know | 6% | 0% |
Eight in ten First Nations residents who are or have been under a DWA in the previous 12 months (78 per cent) are confident that they had sufficient information to make informed decisions under their most recent DWA/BWA. This is compared with 88 per cent of residents of other communities who are or have been under a DWA in the previous 12 months in other small communities in the general public.
Chart 25: Adequacy of Information Under DWA
Do/did you feel like you have enough information to make informed decisions about what to do while you are under this Drinking or Boil Water Advisory?
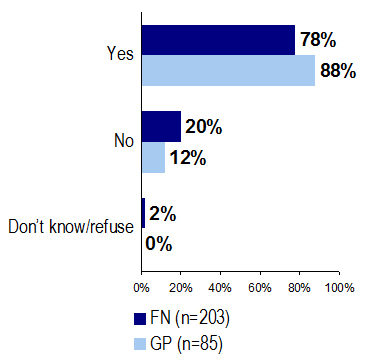
Text description: Chart 25
| 2018 FN (n=203) | 2018 GP (n=85) | |
|---|---|---|
| First Nations Water Quality, Jan. 2018First Nations Water Quality, Jan. 2018 | ||
| Yes | 78% | 88% |
| No | 20% | 12% |
| Don’t know/refuse | 2% | 0% |
Results suggest broad adherence to the steps recommended while under a DWA/BWA among First Nations, although a sizeable minority (28 per cent) indicate that they or someone in their household sometimes forgot to follow these practices. This compares to 20 per cent among other small communities.
Chart 26: Extent of Forgetting about DWA
Did you ever find that you or others in your household forgot to follow the recommended steps while under the Drinking Water Advisory affecting your household?
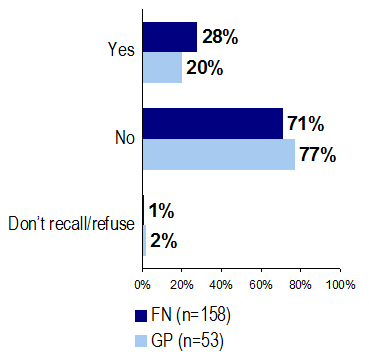
Text description: Chart 26
| 2018 FN n=158) |
2018 GP n=53) |
|
|---|---|---|
| First Nations Water Quality, Jan. 2018 | ||
| Yes | 28% | 20% |
| No | 71% | 77% |
| Don’t recall/refuse | 1% | 2% |
The following chapter described results regarding awareness and views about chlorine in drinking water, as well as behaviours regarding consumption as a result. Awareness and support for fluoridation is also examined.
Nearly two-thirds (65 per cent) of First Nations residents believe that chlorine is present in their drinking water significantly higher than found among residents of other small communities in the general public (41 per cent). These results are similar to 2011 when 67 per cent of First Nations and 43 per cent of the general public perceived that chlorine was added to their drinking water. The notable difference between communities may simply be a result of the incidence of different water systems in First Nations communities versus other small communities in the general public.
Among First Nations communities residents served by piped water systems 77 per cent (identical to 2011 results) believe that chlorine is added to their drinking water. Slightly fewer believe this to be the case among those accessing water from cisterns (69 per cent, which is the same as the 70 per cent measured in 2011). Among First Nations communities residents who are on well-water 12 per cent believe that there is chlorine in their water supply (notably lower than the 30 per cent reported in 2011).Chart 27: Awareness of Chlorine in Drinking Water
As far as you know, is chlorine added to your drinking water?
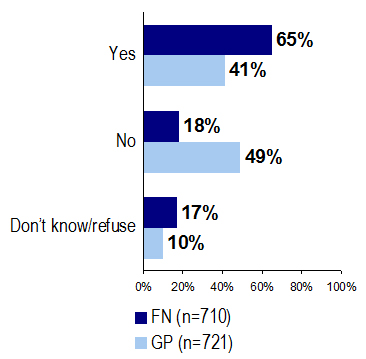
Text description: Chart 27
| 2018 FN (n=710) |
2018 GP (n=721) |
|
|---|---|---|
| First Nations Water Quality, Jan. 2018 | ||
| Yes | 65% | 41% |
| No | 18% | 49% |
| Don’t recall/refuse | 17% | 10% |
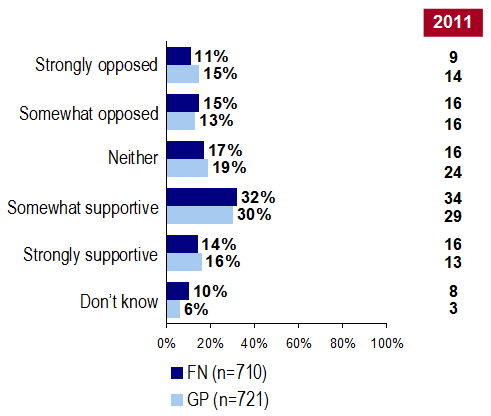
After being informed that chlorine is added to drinking water to reduce or eliminate bacteria and viruses that may be found in water, First Nations respondents were asked to rate their level of support or opposition to chlorine in the water. Nearly half (46 per cent, down from 50 per cent in 2011) said that they support chlorine being added to the drinking water, with 14 per cent saying they are strongly supportive after learning this information. Support among First Nations residents is similar to that of the general population where 46 per cent said they are either somewhat (30 per cent) or strongly (16 per cent) supportive of chlorine being added to drinking water.
Chart 28: Support/Opposition Re: Chlorine
In fact, chlorine is added to drinking water to reduce or eliminate bacteria and viruses that may be found in water. Knowing this, how do you feel about chlorine being added to the water you drink? Would you say that you are ... to chlorine being added to the water you drink?
Text description: Chart 28
| 2018 FN (n=710) | 2018 GP (n=721) | 2011 FN | 2011 GP | |
|---|---|---|---|---|
| First Nations Water Quality, Feb. 2011, Jan. 2018 | ||||
| Strongly opposed | 11% | 15% | 9% | 14% |
| Somewhat opposed | 15% | 13% | 16% | 16% |
| Neither | 17% | 19% | 16% | 24% |
| Somewhat supportive | 32% | 30% | 34% | 29% |
| Strongly supportive | 14% | 16% | 16% | 13% |
| Don’t know | 10% | 6% | 8% | 3% |
Those who indicated that they are opposed to the inclusion of chlorine in their drinking water were asked why they feel this way. Issues related to health concerns are most prominent among First Nations residents, including 37 per cent who said they are opposed because they do not know the effects on the health or the body (on par with the 36 per cent in 2011). A dislike of the taste of chlorine is also a primary reason for opposition among those who oppose chlorine (28 per cent, up from 19 per cent in 2011). Other reasons stated by roughly one in ten are that they do not like the smell (13 per cent), or that there is no need to add anything and natural is best (11 per cent).
Respondents in smaller communities within the general population said they are opposed because they feel nothing needs to be added to drinking water (33 per cent, much higher than those in First Nations communities), that they do not like the taste (25 per cent), or that they do not know the health effects of chlorine on health (21 per cent).
Table 12: Reasons for Opposition to the Additional of Chlorine
| Reasons | FN 2018 | GP 2018 | FN 2011 | GP 2011 |
|---|---|---|---|---|
| n= | 176 | 207 | 174 | 214 |
| Don’t know effects on health/the body from long term exposure/use/Detrimental to health | 37% | 21% | 36% | 20% |
| Don’t like the taste | 28% | 27% | 19% | 32% |
| Don’t like the smell | 13% | 11% | 5% | 12% |
| No need to add anything – natural is best | 11% | 33% | 15% | 33% |
| Chlorine is poisonous, it is a chemical/toxic | 4% | 11% | 17% | 14% |
| Distrust of it being monitored/managed effectively | 4% | 2% | nil | nil |
| Safer/better/more effective ways to purity or clean water | 3% | 4% | nil | nil |
| Generally unsafe/disagree with it | nil | nil | 8% | 6% |
| Question amount of chlorine used, seems to high | nil | nil | 6% | 3% |
| Other | 2% | 3% | 4% | 1% |
| Don’t know | 11% | 1% | 7% | 4% |
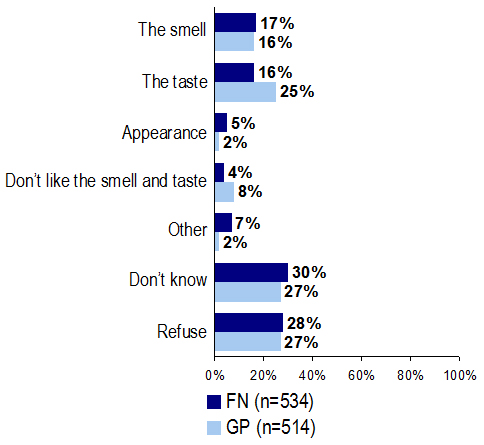
First Nations residents were asked if they noticed anything about tap water with chlorine that they did not like. One-third indicated that they do not know that they noticed anything (30 per cent, similar to the 32 per cent in 2011). Those who did notice something tended to notice the smell (17 per cent, same as 2011) or the taste (16 per cent, slightly down from 22 per cent in 2011).
Those in the general population were more likely than their First Nations counterparts to note a dislike for the water’s taste with one-quarter (25 per cent) saying they have noticed the taste of chlorine in tap water. A similar proportion of general population (16 per cent), compared to First Nations respondents, find they dislike the smell of chlorine in tap water.
Chart 29: Nature of Dislike for Chlorine (Unprompted)
Would you say that you have noticed anything that you don't like about tap water that has chlorine in it? Anything else?
Text description: Chart 29
| 2018 FN (n=534) |
2018 GP (n=514) |
|
|---|---|---|
| First Nations Water Quality, Jan. 2018 | ||
| The smell | 17% | 16% |
| The taste | 16% | 25% |
| Appearance | 5% | 2% |
| Don’t like the smell and taste | 4% | 8% |
| Other | 7% | 2% |
| Don’t know | 30% | 27% |
| Refuse | 28% | 27% |
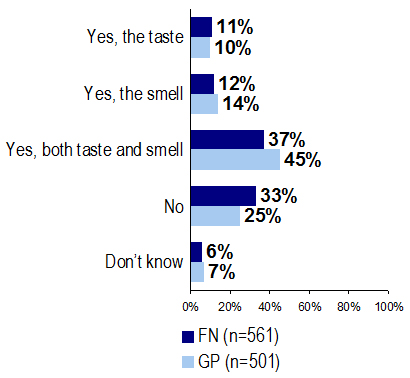
The majority of First Nations residents did say they notice a difference in the taste or smell of water that has chlorine in it compared to water without the chemical. Nearly two in five (37 per cent) notice both the smell and taste, while roughly one in ten notice either the smell (12 per cent) or the taste (11 per cent). One-third (33 per cent) said they do not notice a difference in taste or smell.
Slightly more in the general population said they notice a difference in both the taste and smell (45 per cent), and fewer, 25 per cent, said they do not notice a difference in water that has chlorine added.
Chart 30: Notice Taste and Smell of Chlorine (Prompted)
Do you find that you notice a difference in the taste/smell of water that has chlorine in it compared with water that does not?
Text description: Chart 30
| 2018 FN (n=561) |
2018 GP (n=501) |
|
|---|---|---|
| First Nations Water Quality, Jan. 2018 | ||
| Yes, the taste | 11% | 10% |
| Yes, the smell | 12% | 14% |
| Yes, both taste and smell | 37% | 45% |
| No | 33% | 25% |
| Don’t know | 6% | 7% |
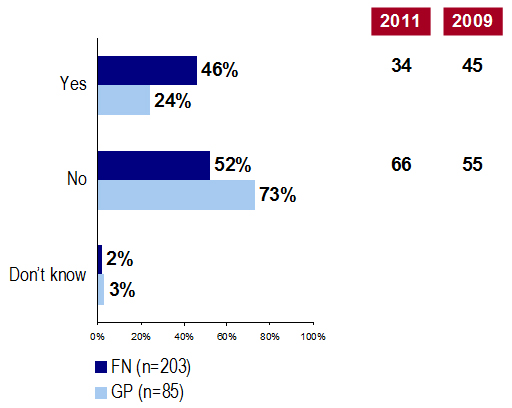
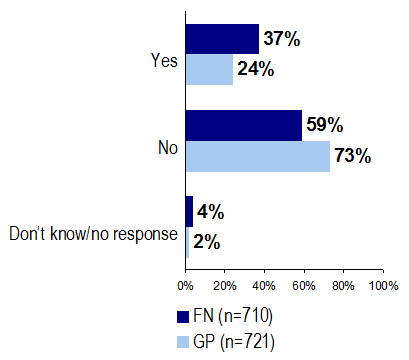
First Nations residents were asked to indicate whether they had ever looked for a different source of water that did not have chlorine in it due to their dislike of the smell or taste. Over one-third (37 per cent) have looked into alternate sources of water. Residents in the broader population of small communities are less likely to have sought out alternate sources of water. One-quarter (24 per cent) said they have looked into other sources while nearly three-quarters (73 per cent) have not.
Chart 31: Looked for Different Source
Have you ever looked for a different source of water that did not have chlorine in it because you don't like the taste/smell of water with chlorine in it?
Text description: Chart 31
| 2018 FN (n=710) |
2018 GP (n=721) |
|
|---|---|---|
| First Nations Water Quality, Jan. 2018 | ||
| Yes | 37% | 24% |
| No | 59% | 73% |
| Don’t know/no response | 4% | 2% |
Bottled water is the prevalent alternate source of water among First Nations residents who have looked for a different source of water, cited by 59 per cent (down from 61 to 66 per cent in 2011). Natural sources (such as rivers and lakes) were mentioned by one in five (19 per cent, down from 26 to 30 per cent in 2011). Other sources include household filtration systems (eight per cent) or individual wells (six per cent).
While over half (54 per cent) of general population residents also use bottled water as an alternate source, they are much more likely than First Nation residents to use an individual well (22 per cent).
Chart 32: Alternative Sources: Taste and Smell
What was the alternative source you used for this water that did not have chlorine in it?
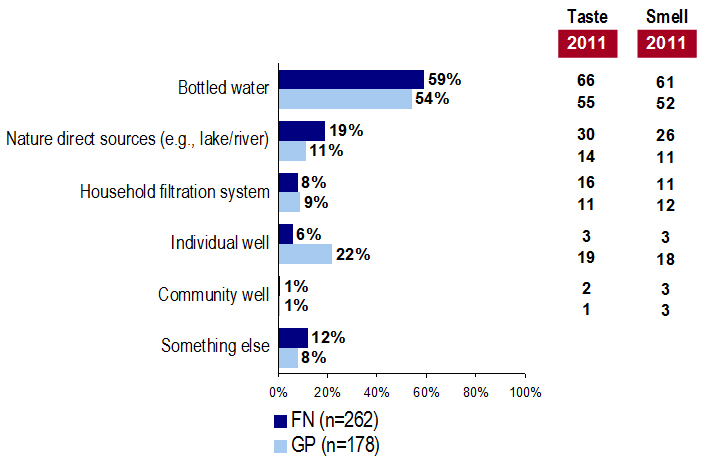
Text description: Chart 32
| 2018 FN (n=262) | 2018 GP (n=178) | 2011 FN Taste |
2011 GP Taste |
2011 FN Smell |
2011 GP Smell |
|
|---|---|---|---|---|---|---|
| First Nations Water Quality, Feb. 2011, Jan. 2018 | ||||||
| Bottled water | 59% | 54% | 66% | 55% | 61% | 52% |
| Nature direct sources (e.g., lake/river) | 19% | 11% | 30% | 14% | 26% | 11% |
| Household filtration system | 8% | 9% | 16% | 11% | 11% | 12% |
| Individual well | 6% | 22% | 3% | 19% | 3% | 18% |
| Community well | 1% | 1% | 2% | 1% | 3% | 3% |
| Something else | 12% | 8% | nil | nil | nil | nil |
After a brief explanation of fluoride and the reason for including it in drinking water, First Nations residents were asked about their level of support or opposition to this treatment of drinking water. As with 2011, four in ten residents of First Nations communities (39 per cent, compared to 41 per cent in 2011) neither supports nor opposes its inclusion. Among those who do hold an opinion results are fairly evenly split, with roughly one-quarter supportive (26 per cent) or opposed (24 per cent). In 2011, the support leaned more positively with just over one-third (34 per cent) supportive and under two in ten (19 per cent) opposing.
The views of general population Canadians in small communities are similar to First Nations in that a plurality (37 per cent) does not hold a strong opinion on the matter. That said, the general public is slightly more supportive with 34 per cent supportive and 24 per cent opposed.
Chart 33: Support/Opposition re: Fluoride
Fluoride is found naturally in soil, fresh and salt water and in a variety of foods. The amount of fluoride found naturally in water is sometimes increased in drinking water to increase the protection of teeth from decay. How supportive or opposed would you say you are to the idea of adding fluoride to drinking water?
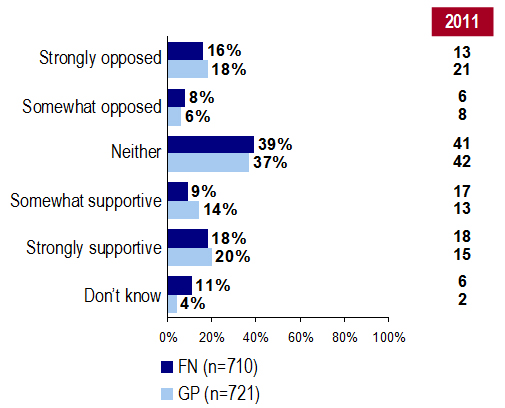
Text description: Chart 33
| 2018 FN (n=710) | 2018 GP (n=721) | 2011 FN |
2011 GP |
|
|---|---|---|---|---|
| First Nations Water Quality, Feb. 2011, Jan. 2018 | ||||
| Strongly opposed | 16% | 18% | 13% | 21% |
| Somewhat opposed | 8% | 6% | 6% | 8% |
| Neither | 39% | 37% | 41% | 42% |
| Somewhat supportive | 9% | 14% | 17% | 13% |
| Strongly supportive | 18% | 20% | 18% | 15% |
| Don’t know | 11% | 4% | 6% | 2% |
Of First Nations residents who are opposed to the idea of adding fluoride to drinking water, over one-quarter (27 per cent) said it is because they do not believe in adding anything to water (down from 38 per cent in 2011 when over a third believed that no addition of fluoride was necessary). Other reasons cited by over one in ten include health concerns such as that fluoride is a toxic or poisonous substance (16 per cent), that fluoride causes diseases (11 per cent) or that health effects are generally unknown (8 per cent). Collectively, almost half (47 per cent) expressed a health concern. General population respondents who opposed fluoride are much more likely than their First Nations counterparts to state that they do not believe anything should be added to water (50 per cent).
Table 13: Reasons for Opposition to Fluoride in Drinking Water
| Reasons | FN 2018 | GP 2018 | FN 2011 | GP 2011 |
|---|---|---|---|---|
| n= | 162 | 193 | 132 | 203 |
| I don’t believe in adding anything to water/Fluoride is found in other things (unnecessary to add) | 27% | 50% | 38% | 62% |
| Fluoride is a toxic substance/a poison | 16% | 17% | 12% | 13% |
| Fluoride causes diseases | 11% | 5% | 6% | 7% |
| Unhealthy, unknown effects on human body | 8% | 6% | 21% | 17% |
| It causes fluorosis | 7% | 3% | 1% | 1% |
| It takes away my freedom to choose what I want | 6% | 3% | 2% | 8% |
| Negative effects on health (general) | 5% | 12% | nil | nil |
| Dislike taste/smell | 4% | 3% | 4% | 0% |
| Do not feel like it is effective | 3% | 4% | 12% | 8% |
| Distrust of adding too much | 2% | 3% | nil | nil |
| Other | 11% | 4% | 1% | 4% |
| Don’t know/no response | 8% | 4% | 14% | 2% |
Flluoride’s ability to protect teeth from decay is the primary reason for support, cited by over half (52 per cent) of First Nations residents. This reason, however, is cited less often than in 2011 when nearly two-thirds (65 per cent) of First Nations respondents mentioned that fluoride prevents teeth from decay, likely because more respondents indicated this year that they do not know (12 per cent, compared to five per cent in 2011). Other reasons cited by First Nations respondents include that fluoride is proven to be safe and effective (16 per cent), increases the health of children (12 per cent) or increases the health of adults (nine per cent).
Other residents in the general public are more likely than their First Nations counterparts to be supportive because fluoride protects teeth from decay (67 per cent).
Table 14: Reasons for Support of Fluoride in Drinking Water
| Reasons | FN 2018 | GP 2018 | FN 2011 | GP 2011 |
|---|---|---|---|---|
| n= | 195 | 233 | 245 | 212 |
| It protects teeth from decay | 52% | 67% | 65% | 74% |
| It is proven to be safe and effective | 16% | 11% | 15% | 8% |
| It increases the health of children | 12% | 18% | 14% | 16% |
| Makes water cleaner, safer | 6% | 5% | 8% | 4% |
| It increases the health of adults/It is needed | 9% | 7% | 12% | 9% |
| It decreases the money that needs to be spent on dental treatments | 0% | 5% | 3% | 6% |
| More natural, healthier option | 2% | 2% | nil | nil |
| Other | 5% | 1% | nil | nil |
| Don’t know/no response | 12% | 6% | 5% | 4% |
Following is a brief snapshot of the First Nations community residents who recently experienced a DWA or BWA.
Table 15: Profile of Reserve Residents According to Last Drinking or Boil Water Advisory Issued
| Region | 1-2 DWAs | 3+ DWAs | Current-Recent | Last few months | Up to 8 mo ago |
Longer | Lasted under 1 wk |
Lasted 1-2 wk |
Lasted 3-4 wk |
Lasted 1+ Mo |
|---|---|---|---|---|---|---|---|---|---|---|
| Unweighted Total | 93 | 177 | 74 | 65 | 95 | 89 | 113 | 64 | 28 | 72 |
| BC | 15% | 8% | 2% | 5% | 12% | 11% | 6% | 11% | 13% | 9% |
| Alberta | 8% | 10% | 7% | 22% | 9% | 6% | 9% | 17% | 0% | 10% |
| Saskatchewan | 16% | 15% | 9% | 20% | 16% | 10% | 20% | 14% | 15% | 7% |
| Manitoba | 17% | 11% | 15% | 10% | 21% | 19% | 8% | 14% | 25% | 24% |
| Ontario | 21% | 24% | 30% | 16% | 20% | 24% | 11% | 13% | 35% | 39% |
| Quebec | 14% | 24% | 23% | 21% | 16% | 22% | 37% | 22% | 7% | 5% |
| Atlantic | 10% | 5% | 14% | 5% | 5% | 9% | 6% | 9% | 6% | 6% |
| -Number of people | 1-2 DWAs | 3+ DWAs | Current-Recent | Last few months | Up to 8 mo ago |
Longer | Lasted under 1 wk |
Lasted 1-2 wk |
Lasted 3-4 wk |
Lasted 1+ Mo |
|---|---|---|---|---|---|---|---|---|---|---|
| Unweighted Total | 93 | 177 | 74 | 65 | 95 | 89 | 113 | 64 | 28 | 72 |
| Less than 500 | 17% | 16% | 10% | 15% | 15% | 14% | 7% | 11% | 28% | 18% |
| 501 to 1000 | 15% | 25% | 21% | 16% | 27% | 15% | 13% | 32% | 32% | 21% |
| 1001 to 5000 | 51% | 41% | 60% | 44% | 39% | 51% | 58% | 48% | 38% | 42% |
| -Quality of Drinking Water | 1-2 DWAs | 3+ DWAs | Current-Recent | Last few months | Up to 8 mo ago |
Longer | Lasted under 1 wk |
Lasted 1-2 wk |
Lasted 3-4 wk |
Lasted 1+ Mo |
|---|---|---|---|---|---|---|---|---|---|---|
| Unweighted Total | 93 | 177 | 74 | 65 | 95 | 89 | 113 | 64 | 28 | 72 |
| Bad (1-2) | 27% | 35% | 49% | 25% | 23% | 34% | 9% | 31% | 33% | 61% |
| Neither (3) | 28% | 34% | 28% | 27% | 41% | 32% | 41% | 27% | 49% | 23% |
| Good (4-5) | 43% | 29% | 17% | 41% | 34% | 32% | 47% | 33% | 18% | 13% |
| -Safe or Unsafe | 1-2 DWAs | 3+ DWAs | Current-Recent | Last few months | Up to 8 mo ago |
Longer | Lasted under 1 wk |
Lasted 1-2 wk |
Lasted 3-4 wk |
Lasted 1+ Mo |
|---|---|---|---|---|---|---|---|---|---|---|
| Unweighted Total | 93 | 177 | 74 | 65 | 95 | 89 | 113 | 64 | 28 | 72 |
| Safe (1-2) | 68% | 63% | 40% | 71% | 69% | 68% | 86% | 61% | 67% | 35% |
| Unsafe (3-4) | 30% | 36% | 55% | 28% | 27% | 29% | 11% | 32% | 33% | 61% |
| -Reasons | 1-2 DWAs | 3+ DWAs | Current-Recent | Last few months | Up to 8 mo ago |
Longer | Lasted under 1 wk |
Lasted 1-2 wk |
Lasted 3-4 wk |
Lasted 1+ Mo |
|---|---|---|---|---|---|---|---|---|---|---|
| Unweighted Total: | 24 | 68 | 39 | 21 | 26 | 24 | 16 | 23 | 10 | 42 |
| Appearance | 18% | 23% | 26% | 27% | 19% | 13% | 29% | 29% | 6% | 14% |
| Taste | 3% | 8% | 15% | 10% | 2% | 6% | 6% | 12% | 0% | 8% |
| Odour | 3% | 13% | 9% | 34% | 14% | 2% | 14% | 39% | 6% | 5% |
| Presence of pollutants, mineral content | 33% | 22% | 27% | 10% | 17% | 31% | 21% | 11% | 28% | 27% |
| Safer | 1-2 DWAs | 3+ DWAs | Current-Recent | Last few months | Up to 8 mo ago |
Longer | Lasted under 1 wk |
Lasted 1-2 wk |
Lasted 3-4 wk |
Lasted 1+ Mo |
|---|---|---|---|---|---|---|---|---|---|---|
| Unweighted Total: | 93 | 177 | 74 | 65 | 95 | 89 | 113 | 64 | 28 | 72 |
| Water filtration/ treatment, utilities infrastructure | 26% | 32% | 35% | 23% | 25% | 31% | 15% | 41% | 40% | 33% |
| -Is it… | 1-2 DWAs | 3+ DWAs | Current-Recent | Last few months | Up to 8 mo ago |
Longer | Lasted under 1 wk |
Lasted 1-2 wk |
Lasted 3-4 wk |
Lasted 1+ Mo |
|---|---|---|---|---|---|---|---|---|---|---|
| Unweighted Total: | 93 | 177 | 74 | 65 | 95 | 89 | 113 | 64 | 28 | 72 |
| Less safe (1-2) | 16% | 30% | 24% | 29% | 25% | 13% | 14% | 30% | 25% | 27% |
| No change (3) | 50% | 33% | 47% | 31% | 34% | 48% | 45% | 37% | 18% | 41% |
| -Reasons | 1-2 DWAs | 3+ DWAs | Current-Recent | Last few months | Up to 8 mo ago |
Longer | Lasted under 1 wk |
Lasted 1-2 wk |
Lasted 3-4 wk |
Lasted 1+ Mo |
|---|---|---|---|---|---|---|---|---|---|---|
| Unweighted Total: | 13 | 52 | 18 | 21 | 22 | 12 | 15 | 18 | 8 | 21 |
| Increased contamination | 23% | 21% | 22% | 11% | 30% | 11% | 6% | 17% | 72% | 17% |
| Water treatment/ utilities infrastructure has worsened | 20% | 20% | 18% | 27% | 10% | 37% | 4% | 39% | 0% | 14% |
| -Reasons | 1-2 DWAs | 3+ DWAs | Current-Recent | Last few months | Up to 8 mo ago |
Longer | Lasted under 1 wk |
Lasted 1-2 wk |
Lasted 3-4 wk |
Lasted 1+ Mo |
|---|---|---|---|---|---|---|---|---|---|---|
| Unweighted Total: | 33 | 66 | 17 | 25 | 40 | 32 | 47 | 20 | 15 | 17 |
| There is more of a focus these days on the need for good water quality | 51% | 57% | 45% | 42% | 54% | 49% | 39% | 52% | 55% | 44% |
| -Use of Tap Water | 1-2 DWAs | 3+ DWAs | Current-Recent | Last few months | Up to 8 mo ago |
Longer | Lasted under 1 wk |
Lasted 1-2 wk |
Lasted 3-4 wk |
Lasted 1+ Mo |
|---|---|---|---|---|---|---|---|---|---|---|
| Unweighted Total: | 93 | 177 | 74 | 65 | 95 | 89 | 113 | 64 | 28 | 72 |
| Drinking | 65% | 62% | 45% | 70% | 69% | 59% | 79% | 54% | 69% | 44% |
| Cooking | 78% | 85% | 66% | 92% | 89% | 78% | 95% | 87% | 85% | 66% |
| Brushing teeth | 84% | 88% | 69% | 87% | 91% | 87% | 97% | 85% | 90% | 67% |
| Washing food | 80% | 84% | 68% | 94% | 87% | 83% | 96% | 83% | 87% | 66% |
| Food preparation where you are mixing with water | 68% | 65% | 41% | 76% | 75% | 67% | 84% | 68% | 77% | 42% |
| Coffee or tea preparation | 72% | 74% | 54% | 80% | 82% | 73% | 88% | 73% | 79% | 59% |
| -Bottled Water | 1-2 DWAs | 3+ DWAs | Current-Recent | Last few months | Up to 8 mo ago |
Longer | Lasted under 1 wk |
Lasted 1-2 wk |
Lasted 3-4 wk |
Lasted 1+ Mo |
|---|---|---|---|---|---|---|---|---|---|---|
| Unweighted Total: | 93 | 177 | 74 | 65 | 95 | 89 | 113 | 64 | 28 | 72 |
| Yes | 65% | 81% | 84% | 75% | 74% | 79% | 76% | 88% | 62% | 80% |
| -Use of Bottled Water | 1-2 DWAs | 3+ DWAs | Current-Recent | Last few months | Up to 8 mo ago |
Longer | Lasted under 1 wk |
Lasted 1-2 wk |
Lasted 3-4 wk |
Lasted 1+ Mo |
|---|---|---|---|---|---|---|---|---|---|---|
| Unweighted Total: | 63 | 140 | 61 | 48 | 67 | 73 | 83 | 56 | 18 | 58 |
| Drinking | 85% | 92% | 96% | 91% | 91% | 87% | 89% | 94% | 79% | 93% |
| Cooking | 51% | 50% | 62% | 49% | 35% | 49% | 31% | 53% | 53% | 62% |
| Brushing teeth | 30% | 37% | 54% | 38% | 26% | 27% | 21% | 40% | 35% | 47% |
| Washing food | 27% | 41% | 58% | 37% | 30% | 24% | 23% | 47% | 27% | 53% |
| Food preparation where you are mixing with water | 52% | 56% | 70% | 39% | 49% | 49% | 36% | 55% | 58% | 66% |
| Coffee or tea preparation | 56% | 56% | 70% | 50% | 52% | 45% | 37% | 61% | 48% | 73% |
| -Reasons | 1-2 DWAs | 3+ DWAs | Current-Recent | Last few months | Up to 8 mo ago |
Longer | Lasted under 1 wk |
Lasted 1-2 wk |
Lasted 3-4 wk |
Lasted 1+ Mo |
|---|---|---|---|---|---|---|---|---|---|---|
| Unweighted Total: | 58 | 137 | 59 | 47 | 65 | 68 | 80 | 54 | 18 | 55 |
| Don't trust my tap water | 33% | 39% | 33% | 41% | 30% | 35% | 22% | 42% | 42% | 43% |
| -Main Source | 1-2 DWAs | 3+ DWAs | Current-Recent | Last few months | Up to 8 mo ago |
Longer | Lasted under 1 wk |
Lasted 1-2 wk |
Lasted 3-4 wk |
Lasted 1+ Mo |
|---|---|---|---|---|---|---|---|---|---|---|
| Unweighted Total: | 93 | 177 | 74 | 65 | 95 | 89 | 113 | 64 | 28 | 72 |
| Piped directly to the home | 50% | 62% | 53% | 70% | 63% | 50% | 69% | 68% | 46% | 52% |
| Individual well | 18% | 14% | 17% | 6% | 9% | 15% | 7% | 9% | 9% | 17% |
| Cistern (water in a holding tank) | 22% | 15% | 16% | 17% | 21% | 21% | 15% | 16% | 26% | 21% |
| -Enough Tap Water | 1-2 DWAs | 3+ DWAs | Current-Recent | Last few months | Up to 8 mo ago |
Longer | Lasted under 1 wk |
Lasted 1-2 wk |
Lasted 3-4 wk |
Lasted 1+ Mo |
|---|---|---|---|---|---|---|---|---|---|---|
| Unweighted Total: | 93 | 177 | 74 | 65 | 95 | 89 | 113 | 64 | 28 | 72 |
| Yes | 91% | 88% | 82% | 93% | 88% | 94% | 92% | 86% | 89% | 84% |
| -Actions | 1-2 DWAs | 3+ DWAs | Current-Recent | Last few months | Up to 8 mo ago |
Longer | Lasted under 1 wk |
Lasted 1-2 wk |
Lasted 3-4 wk |
Lasted 1+ Mo |
|---|---|---|---|---|---|---|---|---|---|---|
| Unweighted Total: | 67 | 157 | 74 | 65 | 95 | 64 | 113 | 64 | 28 | 72 |
| Bought and used bottled water for everything | 39% | 48% | 42% | 36% | 49% | 41% | 26% | 60% | 52% | 48% |
| Used bottled water only for drinking and brushing teeth and | 15% | 16% | 23% | 17% | 15% | 18% | 25% | 9% | 22% | 16% |
| Boiled all water before any use | 17% | 26% | 18% | 29% | 23% | 19% | 33% | 23% | 17% | 15% |
| -Source of Info | 1-2 DWAs | 3+ DWAs | Current-Recent | Last few months | Up to 8 mo ago |
Longer | Lasted under 1 wk |
Lasted 1-2 wk |
Lasted 3-4 wk |
Lasted 1+ Mo |
|---|---|---|---|---|---|---|---|---|---|---|
| Unweighted Total: | 67 | 157 | 74 | 65 | 95 | 64 | 113 | 64 | 28 | 72 |
| Radio | 29% | 28% | 31% | 29% | 25% | 33% | 40% | 34% | 24% | 13% |
| Community/Band/Township council | 35% | 34% | 35% | 25% | 33% | 36% | 28% | 31% | 35% | 37% |
| -Enough Info | 1-2 DWAs | 3+ DWAs | Current-Recent | Last few months | Up to 8 mo ago |
Longer | Lasted under 1 wk |
Lasted 1-2 wk |
Lasted 3-4 wk |
Lasted 1+ Mo |
|---|---|---|---|---|---|---|---|---|---|---|
| Unweighted Total: | 67 | 157 | 74 | 65 | 95 | 64 | 113 | 64 | 28 | 72 |
| Yes | 79% | 80% | 72% | 77% | 76% | 83% | 85% | 73% | 72% | 73% |
| -Heard a Public Announcement Radio | 1-2 DWAs | 3+ DWAs | Current-Recent | Last few months | Up to 8 mo ago |
Longer | Lasted under 1 wk |
Lasted 1-2 wk |
Lasted 3-4 wk |
Lasted 1+ Mo |
|---|---|---|---|---|---|---|---|---|---|---|
| Unweighted Total: | 67 | 157 | 74 | 65 | 95 | 64 | 113 | 64 | 28 | 72 |
| Yes | 56% | 47% | 44% | 45% | 52% | 45% | 52% | 45% | 54% | 45% |
| -Door Hanger | 1-2 DWAs | 3+ DWAs | Current-Recent | Last few months | Up to 8 mo ago |
Longer | Lasted under 1 wk |
Lasted 1-2 wk |
Lasted 3-4 wk |
Lasted 1+ Mo |
|---|---|---|---|---|---|---|---|---|---|---|
| Unweighted Total: | 67 | 157 | 74 | 65 | 95 | 64 | 113 | 64 | 28 | 72 |
| Yes | 21% | 19% | 12% | 31% | 13% | 21% | 20% | 20% | 18% | 19% |
| Poster | 1-2 DWAs | 3+ DWAs | Current-Recent | Last few months | Up to 8 mo ago |
Longer | Lasted under 1 wk |
Lasted 1-2 wk |
Lasted 3-4 wk |
Lasted 1+ Mo |
|---|---|---|---|---|---|---|---|---|---|---|
| Unweighted Total: | 67 | 157 | 74 | 65 | 95 | 64 | 113 | 64 | 28 | 72 |
| Yes | 58% | 57% | 59% | 72% | 52% | 59% | 58% | 61% | 56% | 69% |
Hello, my name is [name] and I work for EKOS Research Associates. We are conducting a survey for the Government of Canada to obtain the views of Canadians living in smaller, rural communities on important health related issues. The survey will take about 15 minutes, and does not involve sales of any kind. Your participation is voluntary and will not affect any services you might receive from the Government of Canada, but it is appreciated as it helps the government to design and deliver better services for all Canadians. The survey is registered with the National Survey Registration System and all of your answers will remain completely confidential and no individual will be associated with the survey's results, which are rolled up into large categories to protect the confidentiality of each respondent. The personal information you provide to Health Canada is collected in accordance with the Privacy Act. We only collect the information we need to conduct the research project. If you would like more information about this I can give you details.
Can I ask if you are at least 18 years old and a regular resident of this household?
If asked (Privacy Act):
The personal information you provide to Health Canada is collected under the authority of section 4 of the Department of Health Act, and in accordance with the Treasury Board Directive on Privacy Practices. In addition to protecting your personal information, the Privacy Act gives you the right to request access to and correction of your personal information. For more information about these rights, or about our privacy practices, please contact Health Canada's Privacy Coordinator at 613-948-1219 or privacy-vie.privee@hc-sc.gc.ca. You also have the right to file a complaint with the Privacy Commissioner of Canada if you think your personal information has been handled improperly.
INTRO2
Is there someone at home now that I could speak to who is 18 years of age or older and a regular resident of this household?
PRIV
This call may be recorded for quality control or training purposes.
SEX
Record gender of respondent
Do not ask
LANGI
Record language of correspondence
Do not ask
Q30
Do you consider yourself to be an Indigenous person or member of a First Nation?
Q31
Do you live in an Indigenous or First Nation community for at least 6 months of the year?
CONF1
Before I start the interview, I'd like to confirm your postal code to help us determine the province and size of community that you live in. What I have listed for your postal code is [postal code].
CONF2
<[postal code is empty]Before I start the interview, can you provide me with your postal code to help us determine the province and size of community that you live in?[ELSE]Can you provide me with your postal code?>
SCR1
As far as you know, how many people live on your community?
Q18ALT
Is your household affected by a drinking water advisory or boil water advisory (DWA) in your community or has it been affected by a drinking water advisory or boil water advisory in the past 12 months, as far as you know?
<[SCR1 = 4]Note to interviewers: If they live in a larger community (e.g., 5,000 or more residents) you may need to ask if they have been under one in their own area of the community>
Q1
On a scale from 1, very bad to 5, very good with 3 meaning neither good nor bad, how would you rate the quality of drinking water in your community?
Q2
How safe or unsafe do you think your tap water supply is? Is it...
Q3 [1,15]
Why do you consider your tap water supply to be unsafe?
Do not read list; Check all that apply; prompt for more than one answer if there is one
Q4 [1,10]
Where did you hear that the water supply in your community is unsafe?
Do not read; Prompt for as many answers as apply
Q5 [1,10]
What would make you feel <[Q2=1,2]even> safer about your tap water quality?
Do not read
Q8 [1,4]
Please indicate which of the following would make you feel safer about your tap water quality.
Read list and select all that apply
Interviewer note: read full list as 'yes'/'no'. You must get a 'yes'/'no' response to each choice option
Q8B
Is there anything else that would make you feel safer about your tap water? What would that be?
Q9
Would you consider your tap water to be more or less safe to drink than five years ago? Is it...
Read list
Q10 [1,10]
Why do you consider your tap water to be less safe to drink than 5 years ago?
Do not read; take as many as apply; prompt for multiple answers
Q11 [1,10]
Where did you hear that the tap water is poor?
Do not read; prompt for as many answers as apply
Q12 [1,10]
Why do you consider your current tap water to be safer to drink than 5 years ago?
Read list; take all that apply and prompt for more multiple answers
Q131 [1,6]
Do you use your tap water for any of the following...
Read list
Q14A
Do you ever use bottled water for anything in your household?
Note to interviewer: This refers to use inside the household. It does not include buying bottled water when outside the home. So, if they buy bottled water when away, but not at home - code answer as "NO")
Q14 [1,6]
Do you use your bottled water for any of the following...
Read list
Q15 [1,10]
Why is it that you use bottled water instead of tap water?
Do not read; select all that apply; prompt for multiple answers
Q16
What is the main source of your household tap water? Is it...
Read list
Q17
Do you receive enough household tap water for all your domestic needs?
NQ20
As far as you know, is chlorine added to your drinking water?
NQ22
In fact, chlorine is added to drinking water to reduce or eliminate bacteria and viruses that may be found in water. Knowing this, how do you feel about chlorine being added to the water you drink? Would you say that you are ... to chlorine being added to the water you drink?
Read list
NQ23 [1,10]
Why are you opposed to the idea of chlorine being added to your drinking water?
Anything else?
Do not read; Note to interviewer: please be sure to use the codes provided if smell or taste is mentioned
NQ24 [1,10]
Would you say that you have noticed anything that you don't like about tap water that has chlorine in it?
Anything else?
Do not read; Note to interviewer: please be sure to use the codes provided if smell or taste is mentioned
NQ25
Do you find that you notice a difference in the taste or smell of water that has chlorine in it compared with water that does not?
NQ27
Have you ever looked for a different source of water that did not have chlorine in it because you don't like the smell or taste of water with chlorine in it?
NQ28 [1,10]
What was the alternative source you used for this water that did not have chlorine in it?
Do not read; prompt if necessary
NQ34
Fluoride is found naturally in soil, fresh and salt water and in a variety of foods. The amount of fluoride found naturally in water is sometimes increased in drinking water to increase the protection of teeth from decay. How supportive or opposed would you say you are to the idea of adding fluoride to drinking water? Please rate your answer on a scale where 1 means strongly opposed, 5 means strongly supportive and the midpoint 3 means neither.
NQ37 [1,10]
Why are you opposed to the idea of adding fluoride to drinking water?
Do not read or prompt
NQ38 [1,10]
Why are you supportive of the idea of adding fluoride to drinking water?
Do not read or prompt
Q20
AFFECTED BY DWA
How many times in the last five years has your community been under a Drinking Water Advisory?
Q19A
AFFECTED BY DWA
When was the last Drinking or Boil Water Advisory issued in your community?
NQ43
Have been under a drinking water advisory within the last 24 months
<[Q19A = 990]How long has the advisory lasted so far?[ELSE]Thinking about the last time your community was under a Drinking or Boil Water Advisory, how long did it last (from what you remember)? Did it last ... ?>
Read categories
Note to interviewers: Please round up to nearest next category as needed
NQ4B
Have been under a drinking water advisory within the last 24 months
<[Q19A = 990]What are you doing differently in your household while you are under the Drinking or Boil Water Advisory?[ELSE]What did you do differently in your household while you were under the last Drinking or Boil Water Advisory?>
Do not read categories
Note to interviewers: Accept answers and look for best category fit or use other
NQ43C [1,9]
Have been under a drinking water advisory within the last 24 months
<[Q19A = 990]Where did you get the information you are using in order to make decisions about what you would do differently while under this Drinking or Boil Water Advisory?[ELSE]Where did you get the information you used in order to make decisions about what you would do differently while under the last Drinking or Boil Water Advisory?>
Prompt for as many answers as apply
NQ43D
Have been under a drinking water advisory within the last 24 months
<[Q19A = 990]Do you feel like you have enough information to make informed decisions about what to do while you are under this Drinking or Boil Water Advisory?[ELSE]Did you feel like you had enough information to make informed decisions about what to do while you were under the last Drinking or Boil Water Advisory?>
NQ43E
Have been under a drinking water advisory within the last 24 months
<[Q19A = 990]What do you want to know about this Drinking or Boil Water Advisory[ELSE]What would you have wanted to know when you were under the last Drinking or Boil Water Advisory?>
Q32
Have been under a drinking water advisory within the last 24 months
Have you heard a public service announcement on the radio regarding Drinking Water Advisories in your community?
Q33A [1,3]
Can you provide additional details about what you might have heard?
NQ33B
How useful did you find this announcement? Would you say ...
Read list
NQ33C
USEFUL
Did you use the information from this announcement in making decisions about what to do while under the Drinking or Boil Water Advisory in your household?
Q34
Have been under a drinking water advisory within the last 24 months
Have you seen a door hanger addressing Drinking Water Advisories in your community?
Q35A [1,3]
Can you provide additional details about what you might have seen?
NQ35B2
How useful did you find this door hanger? Would you say ...
Read list
NQ35C
USEFUL
Did you use the information from this door hanger in making decisions about what to do while under the Drinking or Boil Water Advisory in your household?
Q36
Have been under a drinking water advisory within the last 24 months
Have you seen a poster discussing Drinking Water Advisories in your community?
Refuse 9
Q37A [1,3]
Can you provide additional details about what you might have seen?
NQ37B
How useful did you find this poster? Would you say ...
Read list
NQ37C
USEFUL
Did you use the information from this poster in making decisions about what to do while under the Drinking or Boil Water Advisory in your household?
NQ37D
Did you ever find that you or others in your household forgot to follow the recommended steps while under the Drinking Water Advisory affecting your household?
Q21
As far as you know, how far is your community from the closest major city (in kilometres)?
interviewer: If respondent say don't know, ask if they have a general sense of whether it is more like 20-50 km, or closer to 100km, or 200km, etc. (Larger guess than a specific number). If still not sure, ask whether it's a 20-30 minute drive, or a 2 hour drive, etc.
Q22
In what year were you born?
Note: answer the full year, i.e. 1977 as "1977"
Q23
What is the highest level of education that you have completed?
Q24
How many people typically live in your household?
Q25
How many of those who typically live in your household are children?
Q26A
How many are under 2
Q26B
How many are 2-5
Q26C
How many are 6-11
Q26D
How many are 12 or older
Q27
Is your house used as a daycare for children who do not live in your household?
Q28
How many people over the age of 64 live in your household?
Q29
Excluding any young children or seniors over the age of 64, is there anyone living in your household who is vulnerable to illness?
QTHNK
That is all the questions that I have. Thank you for your time.
THNK2
Screened out
Thank you for your time! Those are all my questions.
The response rate described in the report for the telephone sample relies on the empirical method which uses the total numbers called (23,877) minus those found invalid (7,743) as the base, and the total number completed (710) plus those ineligible to complete the study (1,439) as the numerator (i.e., 2,149 divided by 16,134 or 13.3%), using the method outlined by the Market Research and Intelligence Association.
The response rate described in the report for the telephone sample relies on the empirical method which uses the total numbers called (7,363) minus those found invalid (913) as the base, and the total number completed (721) plus those ineligible to complete the study (24) as the numerator (i.e., 745 divided by 6,450 or 11.6%), using the method outlined by the Market Research and Intelligence Association.
The response rate described in the report for the telephone sample relies on the empirical method which uses the total numbers called (10,532) minus those found invalid (3,583) as the base, and the total number completed (118) plus those ineligible to complete the study (603) as the numerator (i.e., 721 divided by 6,949 or 10.4%), using the method outlined by the Market Research and Intelligence Association.
Although the original target was to complete 200 cases in the DWA oversample, all telephone numbers associated with the communities listed as having a DWA in the previous 12 months were attempted. While the ratio of eligible to ineligible cases was similar in 2018 to 2011, the incidence of invalid telephone numbers had more than doubled since 2011. This may be a result of an increase in cell phone only households, and landlines that are no longer in serve/use.
(under separate cover)